THE EFFECT OF GRAMMAR TRANSLATION METHOD TOWARDS …
116
THE EFFECT OF GRAMMAR TRANSLATION METHOD TOWARDS STUDENTS’ READING COMPREHENSION AND READING MOTIVATION AT SMAN 4 PALANGKA RAYA THESIS BY RIZKY KURNIAWAN NIM 1501121044 STATE ISLAMIC INSTITUTE OF PALANGKARAYA FACULTY OF TEACHER TRAINING AND EDUCATION DEPARTMENT OF LANGUAGE EDUCATION STUDY PROGRAM OF ENGLISH EDUCATION 2020 M / 1442 H
Transcript of THE EFFECT OF GRAMMAR TRANSLATION METHOD TOWARDS …

THE EFFECT OF GRAMMAR TRANSLATION METHOD
TOWARDS STUDENTS’ READING COMPREHENSION AND
READING MOTIVATION AT SMAN 4 PALANGKA RAYA
THESIS
BY
RIZKY KURNIAWAN
NIM 1501121044
STATE ISLAMIC INSTITUTE OF PALANGKARAYA
FACULTY OF TEACHER TRAINING AND EDUCATION
DEPARTMENT OF LANGUAGE EDUCATION
STUDY PROGRAM OF ENGLISH EDUCATION
2020 M / 1442 H

ii
THE EFFECT OF GRAMMAR TRANSLATION METHOD TOWARDS
STUDENTS’ READING COMPREHENSION AND READING
MOTIVATION AT SMAN 4 PALANGKA RAYA
THESIS
Presented to
State Islamic Institute of Palangka Raya
in partial fulfillment of the requirements
for the degree of Sarjana in English Language Education
BY
RIZKY KURNIAWAN
NIM 1501121044
STATE ISLAMIC INSTITUTE OF PALANGKARAYA
FACULTY OF TEACHER TRAINING AND EDUCATION
DEPARTMENT OF LANGUAGE EDUCATION
STUDY PROGRAM OF ENGLISH EDUCATION
2020 M / 1442 H


iii

iv

v
MOTTO AND DEDICATION
Dream as if you will live foreve Live as if you will die today
(Quote by LeBRON james)
This Thesis is dedicated to:
MY Step Father Vriatno
My Mom Mrs.Rusmiati
My Little brother Gilang Yoga P
All of my family.
All students and teacher of SMAN 4
Palangka Raya

vi
vii
ABSTRACT
Rizky Kurniawan. 2020. The Effect of Grammar Translation Method Towards
Students’ Reading Comprehension and Reading Motivation at SMAN 4
Palangka Raya. Thesis, Department of Language Education, Faculty of
Teacher Training and Education, State Islamic Institute of Palangka
Raya. Advisors: (I) M. Zaini Miftah, M.Pd, (II) Zaitun Qamariah, S,Pd,I
M,Pd
Key words : effect, grammar translation method, reading comprehension, reading
motivation.
English classes has own method or technique it‟s depend on in what
level are you if in the university levels the use it is depend on what skill that
lecturer teach for example in speaking skills lecturer usually used role play
method and for the listening skills lecturer usually used audio lingual method. In
the other hands it‟s would be deferent if it is on senior high school or junior high
school the used of method or technique will be depend on what materials that will
be teach for example the materials is about narrative text or something else the
teacher usually use two share-two stay method but the teacher commonly used
jigsaw learning technique.
That‟s why in this research the researcher take the effect of grammar
translation method toward students reading comprehension and their reading
motivation as the topic for discussion of this research.
This research aimed to find out the effect of grammar translation method
towards students reading comprehension and reading motivation at SMAN 4
Palangka Raya. This research focus on the effect of the method toward students at
SMAN 4 Palangka Raya espacialy at first grade which is become my Scope and
limitation.
The research design was quantitave approachand the Data collection
method used test and questioneir to find out the students reading comprehension
and their reading motivation. The researcher conducted experimental and control
group for collected the data. The populaton of this research were students of
SMAN 4 Palangka Raya and for the population of this research were the first
grade students especially Biology class and social class to choose the sample
researcher used cluster sampling.
The result of this show that grammar translation method has significant
effect toward students reading comprehension and reading motivation it found
that Degree of Freedom between group (DFb) = 2 and Degree of Freedom within

group (DFw) = 87 (Ttable = 1.99), and also Fvalue was 37.019. It showed that Fvalue
was higher than Ttable (37.019 > 1.99). which mean Ha hyphothesis was accepted
and Ho was rejected. It means that grammar translation method have effect on
students‟ reading comprehension and reading motivation

viii
ABSTRAK
Rizky Kurniawan. 2020. Pengaruh Grammar Translation Method Terhadap
Pemahaman Menbaca dan Motivasi Membaca Siswa di SMAN 4
Palangka Raya. Skripsi, Jurusan Pendidikan Bahasa, Fakultas Tarbiyah
dan Ilmu Keguruan, Institut Agama Islam Negeri Palangka Raya.
Pembimbing: (I) . Zaini Miftah, M.Pd, (II) Zaitun Qamariah, S,Pd,I M,Pd
Key words: pengaruh, grammar translation method, pemahaman membaca,
motivasi membaca.
Kelas bahasa Inggris memiliki metode atau tekniknya sendiri-sendiri
tergantung pada jenjang mana anda jika di tingkat universitas penggunaannya
tergantung pada keahlian apa yang diajarkan dosen misalnya pada skill berbicara
dosen biasanya menggunakan metode role play dan untuk skill listening yang
biasa digunakan dosen metode bahasa audio.
Di sisi lain akan berbeda jika di sekolah menengah atas atau sekolah
menengah pertama penggunaan metode atau teknik akan tergantung pada materi
apa yang akan diajarkan misalnya materi tentang teks naratif atau hal lain yang
biasa digunakan guru metode two share-two stay tetapi guru umumnya
menggunakan teknik pembelajaran jigsaw.
Oleh karena itu dalam penelitian ini peneliti mengangkat pengaruh
metode grammar translation terhadap kemampuan membaca siswa dan motivasi
membaca sebagai topik bahasan dalam penelitian ini.
Penelitian ini bertujuan untuk mengetahui pengaruh dari metode
Grammar Translation method terhadap pemahaman membaca dan motivasi siswa
di SMAN 4 Palangka Raya. Fokus penelitian ini adalah untuk mengetahui
pengaruh dari methode ini terhadap pemahaman membaca dan motivasi membaca
siswa SMAN 4 Palangka Raya khususnya siswa yang berada pada tahun pertama
yang mana menjadi scope and limitation saya.
Desain dari penelitian ini adalah pendekatan kuantitatif. Methode yang di
gunakan dalam pengumpulan data adalah soal dan angket untuk mengetahui
pengaruh metode ini terhadap pemahan dan motivasi membaca. Peneliti
menggunakan eksperiment dan control group untuk mengumpulkan data. Populasi
dari penelitian ini adalah siswa dari SMAN 4 Palangka Raya dan untuk sample
dari penelitian ini adalah siswa tahun pertama khususnya kelas IPA dan kelas IPS
untuk menentukan sampel peneliti menggunakan cluster sampling.

Hasil dari penelitian ini menunjukan bahwa grammar translation method
memiliki pengaruh terhadap pemahaman membaca dan motivasi membaca siswa
hasil dari SPSS Degree of freedom antar grup (DFb) = 2 dan Degree of freedom
dalam grup (DFw) = 87 (Ttable = 1.99), dan juga Fvalue 37.019 (37.019 > 1.99) hal
ini menunjukan bahwa Ha diterima dan Ho ditolak. Artinya, grammar translation
method berpengaruh terhadap pemahaman membaca siswa dan motivasi membaca

ix
ACKNOWLEDGEMENTS
Alhamdulillah and praise to Allah, because of His Blessing and Mercy, the
researcher is able to accomplish this thesis entitled: The Effect of Grammar
Translation Method towards Students’ Reading Comprehension and
Reading Motivation at SMAN 4 Palangka Raya. In this right chance, the writer
would like to give her greatest thanks to:
1. Dr. H. Khairil Anwar, M.Ag., as a Rector of State Islamic Institute of
Palangka Raya for his direction and permission of conducting this thesis.
2. Dr. Hj. Rodhatul Jennah, M.Pd. the Dean of the Faculty of Teacher
Training and Education of the State Islamic Institute of 4Palangka Raya,
for her invaluable assistance both in academic and administrative matters.
3. Dr. Nurul Wahdah, M.Pd the Vice Dean in Academic Affairs, for her
invaluable assistance both in academic and administrative matters.
4. Akhmad Ali Mirza, M.Pd., as the secretary of Department of Language
Education, for his agreement so that the writer can complete the
requirements of writing this thesis.
5. Zaitun Qamariah, S.Pd.I., M.Pd.,, the Chair of Study Program of English
Education, for his invaluable assistance both in academic and
administrative matters.
6. M, Zaini Miftah, M.Pd the first advisors and Zaitun Qamariah, S.Pd.I.,
M.Pd.,, the second advisors, for their generous advice, valuable guidance
and elaborated correction during their busy time to the completion of this
thesis.

x
7. All members of the board of examiners, for their comments and
suggestions which are profitable to the accomplishing of this thesis.
8. All lecturers of Study Program of English Education, so that the researcher
got in-depth knowledge of English and English teaching.
9. Yeni Hayati S. Pd, M. Pd .as the head master of SMAN 4 Palangka Raya,
for his permission of conducting this research.
10. Mira Devita M. Pd as the English teacher of SMAN 4 Palangka Raya so
that the researcher can complete for writing this thesis.
11. Special thanks are addressed to the students of the Class IPA, and Class
IPS of SMAN 4 Palangka Raya for their helps.
The researcher realizes that this thesis is still far from the perfect, therefore
some constructive critical and suggestion are warmly welcome. May Allah keep
us on the straight path and rewards us for what we have done and this can be
useful for all of us.
Palangka Raya, 14 June Raya,
2020
The Researcher,
Rizky Kurniawan
NIM 1501121044

xi
TABLE OF CONTENTS
Page
COVER ............................................................................................................ i
COVER (Second Page) ................................................................................... ii
ADVISOR APPROVAL ................................................................................. iii
THESIS APPROVAL ..................................................................................... iv
MOTTO AND DEDICATION ....................................................................... v
DECLARATION OF AUTHORSHIP ............................................................ vi
ABSTRACT .................................................................................................... vii
ABSTRAK (Indonesian) ................................................................................. viii
ACKNOWLEDGEMENT .............................................................................. ix
TABLE OF CONTENTS ................................................................................. xi
LIST OF TABLES .......................................................................................... xiii
LIST OF FIGURES ........................................................................................ xvi
LIST OF APPENDICES ................................................................................. xvii
LIST OF ABBREVIATIONS ......................................................................... xviii
CHAPTER I INTRODUCTION
A. Background of the Study .............................................. 1
B. Research Problem ........................................................ 3
C. Objective of the Study ................................................. 3
D. Hypothesis of the Study ............................................... 3
E. Scope and Limitation ................................................... 4
F. Significance of the Study ............................................. 5
G. Definition of Key Terms .............................................. 5
CHAPTER II REVIEW OF RELATED LITERATUR
A. Related Studies ............................................................ 8
B. TEFL ............................................................................. 10
C. Reading ......................................................................... 12
1. Definition of Reading ............................................ 12
2. Type of Reading .................................................... 14
3. Level of Reading ................................................... 16
4. Reading Assessment .............................................. 17
5. Reading Motivation ............................................... 18
D. Grammar Translation Method ..................................... 20
1. GTM History ......................................................... 20
2. The Definition of GTM ......................................... 21

xii
3. The Implementation of GTM ................................ 21
4. The Advantages and Disadvantages of GTM ....... 22
CHAPTER III RESEARCH METHOD
A. Research Design .......................................................... 24
B. Population and Sample ................................................ 25
1. Population ............................................................. 25
2. Sample .................................................................. 26
C. Research Instrument .................................................... 26
1. Research Instrument Development ....................... 26
2. Research Instrument Validity ............................... 28
3. Research Instrument Reliability ........................... 29
D. Data Collection Procedure ........................................... 30
E. Data Analysis Procedure............................................... 30
CHAPTER IV RESEARCH FINDINGS AND DISCUSSION
A. Data Presentation ......................................................... 32
1. The Result of Pre-test and Post-test Score
ofStudents‟ Reading Comprehension of
theExperiment and Control Class .......................... 32
2. The Questionnaire Result of Students‟
ReadingMotivation of the Experiment and
Control Class ......................................................... 43
B. Research Findings ........................................................ 81
1. Testing Normality and Homoginity ...................... 81
2. Testing Hypothesis ............................................... 85
3. Interpretation of the Result ................................... 89
C. Discussion ................................................................... 90
CHAPTER V CONCLUSION AND SUGGESTION
A. Conclusion ................................................................... 91
B. Suggestion ................................................................... 91
REFERENCES
APPENDIX

xiii
LIST OF TABLES
Table Page
3.1. Population and Sample ............................................................................. 25
3.2. Specification of Test Item ......................................................................... 26
3.3. Score of Questionnaire ............................................................................. 26
3.4. Score Interpretation .................................................................................. 27
4.1. The Result of Pre-test and Post-test Score of Students‟ Reading
Comprehension in Experiment Class ........................................................ 31
4.2. The Calculation of Mean, Median, Standard Error of Mean and
Standard Deviation ................................................................................... 34
4.3. The Calculation of Mean, Median, Standard Error of Mean and
Standard Deviation ................................................................................... 35
4.4. The Result of Pre-test and Post-test Score of Students‟ Reading
Comprehension in Control Class .............................................................. 36
4.5. The Calculation of Mean, Median, Standard Error of Mean and
Standard Deviation ................................................................................... 39
4.6. The Calculation of Mean, Median, Standard Error of Mean and
Standard Deviation ................................................................................... 41
4.7. The Questionnaire Result of Experiment Class ........................................ 42
4.8. The Questionnaire Result of Item 1 .......................................................... 43
4.9. Total Score of Item 1 ................................................................................ 43
4.10. The Questionnaire Result of Item 2 .......................................................... 44
4.11. Total Score of Item 2 ................................................................................ 45
4.12. The Questionnaire Result of Item 3 .......................................................... 45
4.13. Total Score of Item 3 ................................................................................ 46
4.14. The Questionnaire Result of Item 4 .......................................................... 46
4.15. Total Score of Item 4 ................................................................................ 47
4.16. The Questionnaire Result of Item 5 .......................................................... 48
4.17. Total Score of Item 5 ................................................................................ 48
4.18. The Questionnaire Result of Item 6 .......................................................... 49
4.19. Total Score of Item 6 ................................................................................ 50
xiv
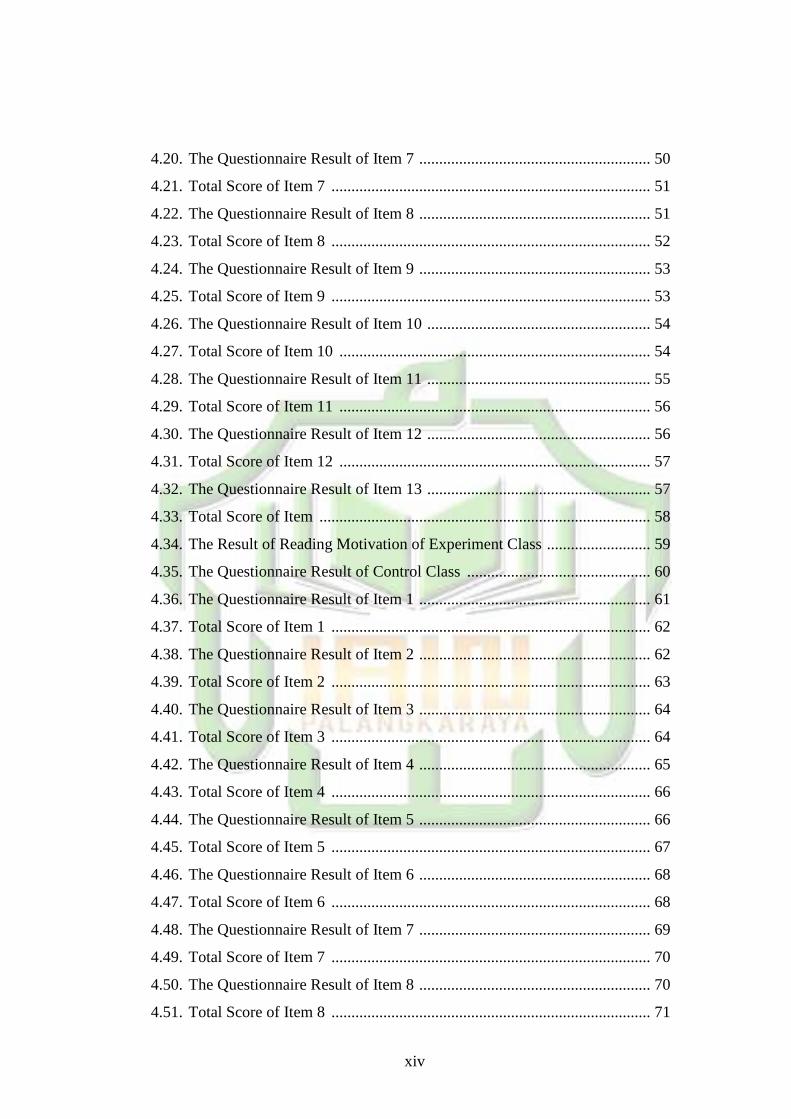
4.20. The Questionnaire Result of Item 7 .......................................................... 50
4.21. Total Score of Item 7 ................................................................................ 51
4.22. The Questionnaire Result of Item 8 .......................................................... 51
4.23. Total Score of Item 8 ................................................................................ 52
4.24. The Questionnaire Result of Item 9 .......................................................... 53
4.25. Total Score of Item 9 ................................................................................ 53
4.26. The Questionnaire Result of Item 10 ........................................................ 54
4.27. Total Score of Item 10 .............................................................................. 54
4.28. The Questionnaire Result of Item 11 ........................................................ 55
4.29. Total Score of Item 11 .............................................................................. 56
4.30. The Questionnaire Result of Item 12 ........................................................ 56
4.31. Total Score of Item 12 .............................................................................. 57
4.32. The Questionnaire Result of Item 13 ........................................................ 57
4.33. Total Score of Item ................................................................................... 58
4.34. The Result of Reading Motivation of Experiment Class .......................... 59
4.35. The Questionnaire Result of Control Class .............................................. 60
4.36. The Questionnaire Result of Item 1 .......................................................... 61
4.37. Total Score of Item 1 ................................................................................ 62
4.38. The Questionnaire Result of Item 2 .......................................................... 62
4.39. Total Score of Item 2 ................................................................................ 63
4.40. The Questionnaire Result of Item 3 .......................................................... 64
4.41. Total Score of Item 3 ................................................................................ 64
4.42. The Questionnaire Result of Item 4 .......................................................... 65
4.43. Total Score of Item 4 ................................................................................ 66
4.44. The Questionnaire Result of Item 5 .......................................................... 66
4.45. Total Score of Item 5 ................................................................................ 67
4.46. The Questionnaire Result of Item 6 .......................................................... 68
4.47. Total Score of Item 6 ................................................................................ 68
4.48. The Questionnaire Result of Item 7 .......................................................... 69
4.49. Total Score of Item 7 ................................................................................ 70
4.50. The Questionnaire Result of Item 8 .......................................................... 70
4.51. Total Score of Item 8 ................................................................................ 71

xv
4.52. The Questionnaire Result of Item 9 .......................................................... 72
4.53. Total Score of Item 9 ................................................................................ 72
4.54. The Questionnaire Result of Item 10 ........................................................ 73
4.55. Total Score of Item 10 .............................................................................. 74
4.56. The Questionnaire Result of Item 11 ........................................................ 74
4.57. Total Score of Item 11 .............................................................................. 75
4.58. The Questionnaire Result of Item 12 ........................................................ 76
4.59. Total Score of Item 12 .............................................................................. 76
4.60. The Questionnaire Result of Item 13 ........................................................ 77
4.61. Total Score of Item ................................................................................... 78
4.62. The Result of Reading Motivation of Control Class ................................ 79
4.63. Normality Distribution Test on the Pre-test Score of the Experiment
Class and Control Class Using SPSS 20 ................................................... 80
4.64. Normality Distribution Test on the Post-test Score of the Experiment
Class and Control Class Using SPSS 20 ................................................... 81
4.65. Normality Distribution Test on the Students‟ Reading Motivation
Questionnaire Test Using SPSS 20 ........................................................... 82
4.66. Homogeneity Test on the Pre-test Score of the Experiment Class and
Control Class Using SPSS 20 ................................................................... 82
4.67. Homogeneity Test on the Post-test Score of the Experiment Class and
Control Class Using SPSS 20 ................................................................... 83
4.68. Homogeneity Test on the Students‟ Reading Motivation Questionnaire
Test Using SPSS 20 .................................................................................. 83
4.69. Result of Post-test Experiment and Control Class, and Result of
Reading Motivation of Experiment Class Using SPSS 20 ....................... 84
4.70. The Result of Post-test Experiment and Control Class, and Result of
Reading Motivation of Experiment Class with One-Way ANOVA
Using SPSS 20 .......................................................................................... 85
4.71. The Calculation of Post Hoc Tests Using SPSS 20 .................................. 86

xvi
LIST OF FIGURES
Figure Page
4.1. The Frequency Distribution of Students‟ Pre-test Score of Experiment
Class ..........................................................................................................33
4.2. The Frequency Distribution of Students‟ Post-test Score of
Experiment Class ...................................................................................... 35
4.3. The Frequency Distribution of Students‟ Pre-test Score of Control
Class ..........................................................................................................39
4.4. The Frequency Distribution of Students‟ Post-test Score of Control
Class ..........................................................................................................40

xvii
LIST OF APPENDICES
Appendix Page
1. Result of Students‟ Pre-test Score of Experiment Class .......................
2. Result of Students‟ Pre-test Score of Control Class .............................
3. Result of Students‟ Post-test Score of Experiment Class .....................
4. Result of Students‟ Post-test Score of Control Class ............................
5. Questionnaire Result of Experiment Class ..........................................
6. Questionnaire Result of Control Class ..................................................

xviii
LIST OF ABBREVIATIONS
GTM : Grammar Translation Method
Df : Degree of Freedom
SD : Standart Deviation
SE : Standart Error
Ha : Alternative Hypothesis
Ho : Null Hypothesis
N : The Total of Students
SPSS : Statistical Package for the Social Science
SMAN : Sekolah Menengah Atas Negeri

1
CHAPTER I
INTRODUCTION
In this chapter, the researcher discusses introduction of study that consists of
background of the study, research problem, and objective of the study, hypothesis
of the study, scope and limitation, significance of the study and definition of key
terms.
A. Background of Study
Learning is the first thing that we do when we are come to this world
since we are a child. When we as a baby we learn how to sit, stand, and even
learn how to talk or speak. But, when we are as a students be it junior high
school, senior high school, or even college students sometimes when we are
learning about something as especially about our course materials we need a
method to make we moreeasily to understand the materials. So, how about if
we are as a lecturer or a teacher of course we also need a method or technique
for teaching the materials in our classroom.
In teaching world there are many method and technique that usually used
by the teacher or lecturer let sat GTM, TWO SHARE-TWO STAY, ROLE
METHOD, AUDIO LINGUAL METHOD, JIGSAW technique. For
example, in biology classes they have their own method or technique that
teacher or lecturer used. In the same condition English classes also has own
method or technique it‟s depend on in what level are you if in the university
levels the use it is depend on what skill that lecturer teach for example in
speaking skills lecturer usually used role play method and for the listening

2
skills lecturer usually used audio lingual method. In the other hands it‟s
would be deferent if it is on senior high school or junior high school the used
of method or technique will be depend on what materials that will be teach
for example the materials is about narrative text or something else the teacher
usually use two share-two stay method but the teacher commonly used jigsaw
learning technique.
That‟s why in this research the researcher take the effect of grammar
translation method toward students reading comprehension and their reading
motivation as the topic for discussion of this research. This also become the
reason why this experiment is important which is to give information about
grammar translation method included how to use this method in high school
education which will help teacher to implementation this method while
teaching in their class and this experiment also help teacher decided is it right
or good to use grammar translation method in narrative text.
The researcher use grammar translation method as learning method to
know is this method more effective in teaching reading skill. and also the
reason why researcher choose this methods because this method commonly
used by the teacher in teaching reading and help teacher get information
about the effect of the implementation of this experiment toward students
understanding the materials especially materials that conclude text on it such
as narrative text etc.

3
B. Research Problems
This research has three research problems, it is:
1. Is there any effect of GTM towards students‟ reading comprehension?
2. Is there any effect of GTM towards students‟ reading motivation?
3. Is there any effect of GTM towards students‟ reading comprehension and
reading motivation?
C. Objective of the Study
According to the research problems the objective of the study is:
1. The effect of GTM towards students‟ reading comprehension.
2. The effect of GTM towards students‟ reading motivation.
3. The effect of GTM towards students‟ reading comprehension and reading
motivation.
D. Hypothesis of the Study
The hypothesis of this study is divided into two categories. They are
alternative hypothesis and null hypothesis.
1. Alternative Hypothesis (Ha)
a. Researcher consideredgrammar translation method has significant
effect in students‟ comprehension on reading at the first grade of
SMAN 4 Palangka Raya.

4
b. Researcher considered grammar translation method has significant
effect in students‟ reading motivation on reading at the firstgrade of
SMAN 4 Palangka Raya.
c. Researcher consideredgrammar translation method has significant
effect in students‟ comprehension and their motivation on reading at
the firstgrade of SMAN 4 Palangka Raya.
2. Null Hypothesis (Ho)
a. Grammar translation method has no effect toward students‟
comprehension on reading due the process take too long at the
firstgrade of SMAN 4 Palangka Raya.
b. Grammar translation method has no effect toward students‟
motivation on reading due the process take too long at the firstgrade
of SMAN 4 Palangka Raya.
c. Grammar translation method has no effect toward students‟
comprehension and their motivation on reading due the process take
too long at the firstgrade of SMAN 4 Palangka Raya.
E. Scope and Limitation
To simplify the study, the researcher limits the research on the effect of
using grammar translation method toward students reading comprehension
and reading motivation more specific the materials is narrative text. The
population of this research will be firstGrade of senior high school at SMAN4

5
Palangka Raya students. The population choose by using cluster sampling
and it will specify the population into two class.Thereare several reason why
the researcher choose firstgrade of senior high school at SMAN 4 Palangka
Raya.(1) Theresearcher had ever study in SMAN 4 Palangka Raya so it will
made the collecting the data process more easily.(2) First grade choose
because the researcher assume they already have enough base knowledge or
have knownEnglish materials.(3) Theresearcher doesn‟t choose third grade
because the condition doesn‟t allow to choose them as population.
F. The Significance of the Study
The result of this study is expected to be useful for the teachers to give
more information about grammar translation method in teaching reading
materials. For teachers, the result of this study can be used to help students
improve their comprehension and motivation about reading materials. So, the
students can be easier to understand it. Hopefully, this research can be a
medium to improve students‟ comprehend the reading materials. And the
result of this study can be used as one of reference in teaching method. For
the next researchers, who interest in this study to get information about
grammar translation method toward reading comprehension and motivation.
G. Definition of Key Terms
1. In this study, grammartranslation method of foreign language teaching is
one of the most traditional methods.

6
2. In this study Reading is an activity to understand what the text contains.
3. Jeniffer Serravallo stated that comprehension is at the heart of what it
means to really read by thinking and understanding and getting at the
meaning behind a text. Comprehension instruction begins before children
can even conventionally read. As children are read to during read-aloud,
they are asked to think about characters, make predictions about what
will come next, question and wonder what‟s happening, and consider
what lesson they can learn from the book.

7
CHAPTER II
REVIEW OF RELATED LITERATURE
In this chapter, the researcher discusses review of related literature that
consists of related studies, definition of reading, the history, definition, advantages
and disadvantages, and implementationgrammar translation method.
A. Related Studies
The researcher found some related studies has done by the previous
researchers, the first is from (Megawati, 2017: 2-2) Based on the research
result of improving students‟ reading comprehension through grammar
translation method to the tenth grade students of SMK Private TaposDepok,
the researcher gives conclusion that ability of students‟ reading
comprehension through grammar translation method improve significantly
with average in cycle I average score is 6,76 or 60%, cycle II average score is
7,35 or 78%, cycle III average score is 7,8 or 100%. This is revealed when the
students could answer the question and it can read the text fluently. Through
grammar translation method is proved to be effective in improving students‟
reading comprehension. Students can easily understand reading a text.
Students should be active to practice reading from the kind of material given
by teacher and some information from mass media. In order to make students
can get better result in learning English.
Second, EkaFatmalathis research based on Larsen – Freeman Grammar
Translation Method was used for the purpose of helping students read and
appreciate foreign language literature. It was also hoped that, through the

8
study of the grammar of the target language, students would become more
familiar with the grammar of their native language and that this familiarity
would help them speak and write their native language and better. The kinds
of this research is quantitative research. The population of MTsWathoniyahis
278 students, the researcher take 15% from the population so, the sample of
this research in 40 students. The instruments of collecting data are
observation, interview, and test. The instrument of the research have been
tested for the validity and reliability. The data collected are analyzed by
quantitative research it means by using t-test. The result of the test shows that
average score of the students understanding in reading comprehension. The
researcher given pre-test and post-test. The average score of pre-test is 7.01
and the score average of post-test is 8.03. Meanwhile, based on the
calculation above, the value t = 3.417 and t table =2.02. T values greater than
T table that found positive significant influence. Based on the value “t” it can
be stated that there is significant influence of the application of grammar
translation method on the students‟ understanding in reading comprehension.
The grammar translation method one of method that can be increase students‟
reading skill. The researcher hopes that this suggestion can give some
advantages and motivations to the English teacher concerning with the
learning progress, the students to be motivated in learning English and the
next research to complete this research.
Third, Ishraq M. Aqel entitled The result of this study is Grammar-
Translation method is an important kind of teaching methodology that the

9
teachers should adapt it to teach English as a second language and the
researchers should highlight the advantage or disadvantage of this method.
Many reasons are behind that, first, because it is an applicable method and
easy to conduct. Second, the first intellectual act the learner can use when feel
unable to express by the target language is interpreting by native language
and that exactly the core of this method. Third, the great benefit of join the
knowledge of both languages which free the learner from the ambiguity of the
target language. After all, the researcher recommend that after the exhibiting
of the language skills and the grammatical rules, the usefulness of translation
is decreasing. Therefore, the applying of grammatical structure or the
practicing of the language skills in general should be in the target language to
confirm the needed forms that the learners must develop to achieve the best
results they are looking for.
In addition, the differences between the previous studies with this study
are related to the approach of the study that is use grammar translation
method (GTM) that contain quantitative research. Meanwhile, this study is
Experimental Research. The purpose of the study was to measure the effect
by using GTM towards the comprehensionof students reading materials.
B. TEFL
Based on Collin dictionary TEFL isthe teaching of English to people
whose first language is not English, especially people from a country where
10
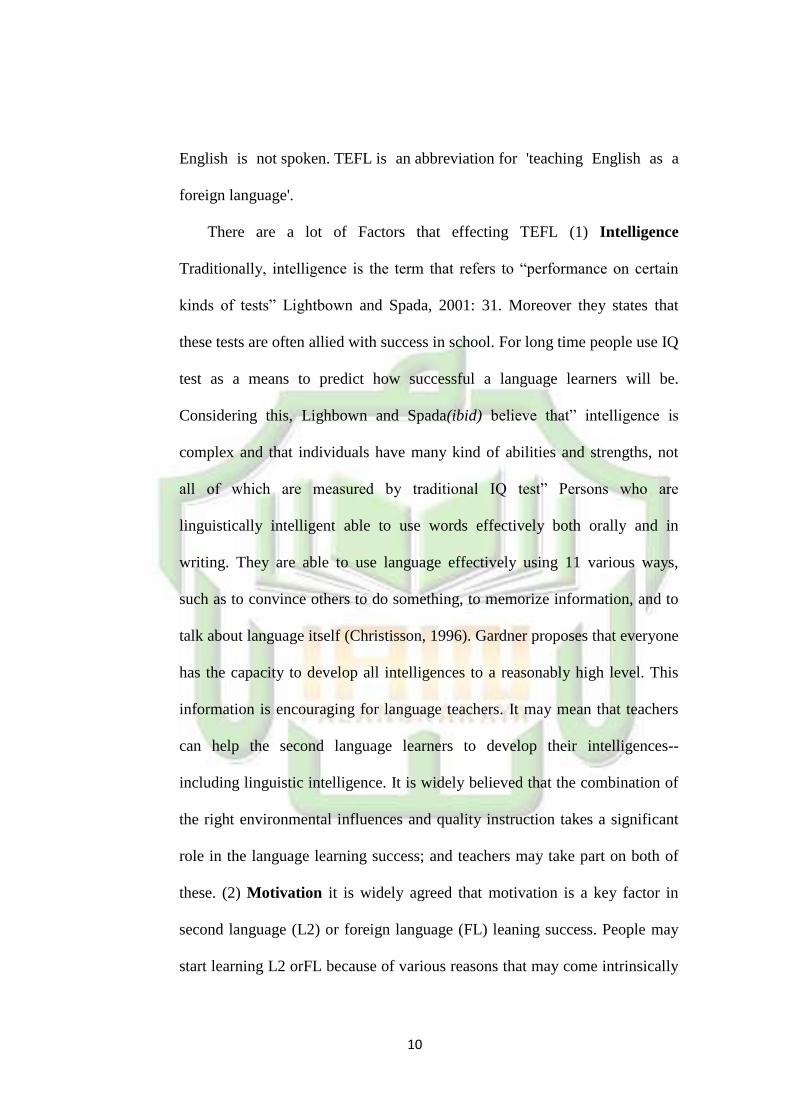
English is not spoken. TEFL is an abbreviation for 'teaching English as a
foreign language'.
There are a lot of Factors that effecting TEFL (1) Intelligence
Traditionally, intelligence is the term that refers to “performance on certain
kinds of tests” Lightbown and Spada, 2001: 31. Moreover they states that
these tests are often allied with success in school. For long time people use IQ
test as a means to predict how successful a language learners will be.
Considering this, Lighbown and Spada(ibid) believe that” intelligence is
complex and that individuals have many kind of abilities and strengths, not
all of which are measured by traditional IQ test” Persons who are
linguistically intelligent able to use words effectively both orally and in
writing. They are able to use language effectively using 11 various ways,
such as to convince others to do something, to memorize information, and to
talk about language itself (Christisson, 1996). Gardner proposes that everyone
has the capacity to develop all intelligences to a reasonably high level. This
information is encouraging for language teachers. It may mean that teachers
can help the second language learners to develop their intelligences--
including linguistic intelligence. It is widely believed that the combination of
the right environmental influences and quality instruction takes a significant
role in the language learning success; and teachers may take part on both of
these. (2) Motivation it is widely agreed that motivation is a key factor in
second language (L2) or foreign language (FL) leaning success. People may
start learning L2 orFL because of various reasons that may come intrinsically

11
or extrinsically. Many people nowadays enjoy learning L2/FL and try hard to
get high levelproficiency. Some others learn these not because they want it
but merelybecause they should do it that way, for example some students
inESL/EFL context learn L2/FL because the educational policies in
theircountries ask them to do so. It seems that for some people,
learningsecond or foreign languages, to some extent, may be just a matter
ofchoice rather than a necessity, but for some others it becomes anessential
action, as there are a lot of benefits that go with that. As theresponse of
people toward language learning is varied, it is interesting tofind out the
reasons behind that, which then bring to the discussion
aboutmotivation.Motivation, in broad-spectrum, refers to the effort in which
learners putlearning into practice as a result of their need or desire to do it.
C. Reading
1. Definition of Reading
Definition of Reading Comprehension. Reading comprehension is
very important because it may be tested by a passage which is to be
translated into good English, or by question based on the content of a
passage. In this case the passage is not translated, the questions being
asked in the foreign language and the student answering in English.
Definition of Reading Comprehension. As detail definition, Peter
Westwood stated that reading comprehension is often conceptualized as
functioning at different levels of sophistication and referred to, for

12
example, as literal, inferential and critical. The most basic level (literal)
is where the reader is able to understand the factual information
presented in a passage of text – for example, he or she can tell you the
name of the main character and what he does for a living, because that
information is stated explicitly in the text. The next level is referred to as
the inferential level.
At this level the reader is able to go beyond the words on the page
and infer other details for example, to realize that the main character is
angry from what he says and what he does. Being able to operate at the
inferential level means that the reader is using information effectively to
deduce cause and effect, and to anticipate what may come next. At a
more demanding level (critical reading), the reader is able to appraise
what he or she is reading for example, detecting good writing style from
the author, recognizing when some statements in the text are biased or
incorrect, appreciating the researcher‟s viewpoint, comparing and
contrasting information with other facts they have read elsewhere, and
reflecting upon the importance or otherwise of the opinions presented.
Weak readers who are still struggling with word recognition have
enormous difficulty progressing beyond a literal level of comprehension
because most of their cognitive effort is taken up in unlocking the print.
Besides all the definitions from the dictionary there are also
definitions made by several people. According to Spears (2006: 2), “the
reading process begins with decoding words that is, deciphering the

13
letters that make up individual words. But reading is more than merely
processing letters and sounds. According to Harmer (2007: 99) reading is
useful for language acquisition. Provided that students more or less
understand what they read, the more they read, the better they get at it.
According to Grellet (2004:7) reading is a constant process of
guessing, and what one brings to the next is often more important than
what one finds in it. In reading, the students should be taught to use what
they know to understand unknown elements, whether these are ideas or
simple words.
Other definition by Collins English Learner's Dictionary is that
reading is an act of looking at and understanding point. This is very true
because reading entails the use of vision to understand several words in a
sentence and make them meaningful. Same goes to each sentence in
order to understand the entire text.
2. Type of Reading
There are several types and methods of reading, with differing rates
that can be attained for each, for different kinds of material and purposes:
a. Subvocalized reading combines sight reading with internal sounding
of the words as if spoken. Advocates of speed reading claim it can be
a bad habit that slows reading and comprehension, but other studies
indicate the reverse, particularly with difficult texts.

14
b. Speed reading is a collection of methods for increasing reading
speed without an unacceptable reduction in comprehension or
retention. Methods include skimming or the chunking of words in a
body of text to increase the rate of reading. It is closely connected
to speed learning.
c. Incremental reading is a software-assisted reading method designed
for long-term memorization. "Incremental reading" means "reading
in portions": in each session, parts of several electronic articles are
read inside a prioritized reading list. In the course of reading,
important pieces of information are extracted and converted
into flashcards, which are then reviewed by a spaced
repetition algorithm.
d. Proofreading is a kind of reading for the purpose of
detecting typographical errors. One can learn to do it rapidly, and
professional proofreaders typically acquire the ability to do so at
high rates, faster for some kinds of material than for others, while
they may largely suspend comprehension while doing so, except
when needed to select among several possible words that a suspected
typographic error allows. A good proofreader needs to have a strong
vocabulary and should be meticulous in his/her approach.
e. Rereading is reading a book more than once. "One cannot read a
book: one can only reread it," Vladimir Nabokov once said. A paper
published in the Journal of Consumer Research (Antonia (2012))

15
found re-reading offers mental health benefits because it allows for a
more profound emotional connection and self-reflection, versus the
first reading, which is more focused on the events and plot.
f. Rapid serial visual presentation (RSVP) reading involves presenting
the words in a sentence one word at a time at the same location on
the display screen, at a specified eccentricity. RSVP eliminates inter-
word saccades, limits intra-word saccades, and prevents reader
control of fixation times (Legge, Mansfield, & Chung, 2001). RSVP
controls for differences in reader eye movement, and consequently is
often used to measure reading speed in experiments.
3. Level of Reading
According to Mortimer and Doren reading has four level there are:
a. Elementary Reading
It‟s also called initial reading, rudimentary reading, or basic
reading. Once this level is mastered, readers go from nonliterary to at
least beginning literacy. In mastering this level, one learns the
rudiments of the art of reading, receives basic training in reading,
and acquires initial reading skills.
b. Inspectional Reading
This is also called pre-reading or skimming. This level is
characterized by its emphasis on time…its aim is to get the most out
of a book within a given time‟. This is usually done through an

16
examination of the surface of the book checking things such as the
title of the book, its preface, and table of contents, index, and
publisher‟s blurb if available. Etc. Upon finishing reading at this
level.
c. Analytical Reading
This is a more demanding level for readers. It‟s more complex
than the preceding levels and represents a thorough and complete
form of reading. Analytic reading is „hardly ever necessary if your
goal in reading is simply information of entertainment.
d. SyntopicalReading
It‟s also called comparative reading. This is the most complex
and systematic level of reading. A syntopical reader reads different
texts on the same subject and compares them to each other to arrive
at a holistic and more nuanced understanding of the subject.
4. Reading Assessment
Readingis a visual process-vision is a symbolic process of seeing an
item or symbol and translating it into an idea or image. Images are
processed into concepts and whole dimensions of thought. The visual
process of taking in information visually and translating that into
dimensions of thought is very rapid. It moves at the speed of thought and
this process exceeds the speed of light. Whole-brain, intuitive, symbolic
reading is meant to be a conceptual metaphor for life. It is blueprinted

17
into human right-left brained and holistic mind. It is simply connecting
one person‟s intuition to another‟s. The author is imagining something
(even when the author is writing about facts), the reader can interpret
those writings and glean the author‟s imaginings.
Lidz, 2003: assessment is the process of gathering information to
obtain a profile a child psychology that includes symptoms and intensity,
the constraints experienced by the strengths and weaknesses well as the
important role they need.
5. Reading Motivation
Reading motivation is the motivational drive to read, an area of
interest in the field of education. Studying and implementing the
conditions under which students are motivated to read is important in the
process of teaching and fostering learning. Reading and writing
motivation are the processes to put more effort on reading and writing
activities.
Different strategies can be followed to develop a student's
motivation to read.
Integrating sensory organs with text materials. For example, when
reading the word "apple", read it loudly, visualize, feel the texture,
taste, and odor.
Pronounce each word properly. Differentiate pronunciation for the
purpose of spelling and for the purpose of communicating ideas.

18
In pronunciation, give emphasis on phonic discrimination, such as,
C-A-T, C-A-N.
Change from extrinsic to intrinsic reading motivation. Although
incentives are a good motivator, further interest in reading will come
from intrinsic wants and needs. Instead of rewarding reading with a
gift, relate reading completion to increased reading competency and
accomplishment.
Organize reading material in an attractive way.
For students who know how to read, but need extra encouragement,
giving a book talk is a way to inspire reading. It is an especially effective
tool with reluctant readers who need a hook before they will invest the
energy into reading a book. Reading motivation for children can be
enhanced when it is read with songs or music playing. Motivation
divided into two which is intrinsic and extrinsic.
Intrinsic motivation is when one does something because of personal
interest in that particular thing. Extrinsic motivation has to do with
avoiding the consequences of not doing something.
The motivation to read is one of the major factors that determine
student success or failure in elementary school. Therefore, it is crucial to
come up with ways to motivate and include all students to read. Reading
is a task requiring interest and effort; as such, the reading skill of students
has been associated with reading motivation. Students who are extremely
motivated to read choose to find the time to read, which in turn will
19
develop into a lifelong reading habit. Hence, motivation plays a crucial
role in elementary schools to foster reading.
D. Grammar Translation Method
1. GTM History
The grammar–translation method originated from the practice of
teaching Latin. In the early 1500s, Latin was the most widely studied
foreign language due to its prominence in government, academia, and
business. However, during the course of the century the use of Latin
dwindled, and it was gradually replaced by English, French, and Italian.
After the decline of Latin, the purpose of learning it in schools changed.
Whereas previously students had learned Latin for the purpose of
communication, it came to be learned as a purely academic subject.
Throughout Europe in the 18th and 19th centuries, the education
system was formed primarily around a concept called faculty
psychology. This theory dictated that the body and mind were separate
and the mind consisted of three parts: the will, emotion, and intellect. It
was believed that the intellect could be sharpened enough to eventually
control the will and emotions. The way to do this was through learning
classical literature of the Greeks and Romans, as well as
mathematics. Additionally, an adult with such an education was
considered mentally prepared for the world and its challenges.

20
At first it was believed that teaching modern languages was not
useful for the development of mental discipline and thus they were left
out of the curriculum. When modern languages did begin to appear in
school curricula in the 19th century, teachers taught them with the same
grammar–translation method as was used for classical Latin and
Greek. As a result, textbooks were essentially copied for the modern
language classroom. In the United States of America, the basic
foundations of this method were used in most high school and college
foreign language classrooms.
2. The Definition of Grammar Translation Method
Grammar Translation Method The grammar-translation method of
foreign language teaching is one of the most traditional methods. It was
originally used to teach 'dead' languages (and literatures) such as Latin
and Greek, involving little or no spoken communication or listening
comprehension.
3. The Implementation of Grammar Translation Method
There are some techniques those are used in implementing GTM,
every technique is related with the others, according to Larsen Freeman
(2006: 19-20), the techniques are: 1. Translation of a literary passage the
students translate a reading passage from the target language into the
native language. The translation may be written or spoken both. 2.

21
Reading comprehension questions the students answer questions in the
target language based on their understanding of the passage they are read.
3. Antonyms/synonyms the students ordered to find out the antonym of
some words in the passage. 4. Cognates the teacher teaches the students
to recognize cognates by learning the sound patterns or spelling that
correspond between the languages. 5. Deductive application of rule
Grammar rules are presented with examples. Exception to each rules are
also noted. Once the students understand a rule, they are ordered to apply
it to some different examples. 6. Fill in the blanks the students are given
a series of sentences with word missing and they fill in the blanks with
new vocabulary items or with items of particular grammar type. 7.
Memorization Students are given lists of target language vocabulary
words and their native language equivalents and are asked to memorize
them. Students are also required to memorize grammatical rules and
grammatical paradigms such as verb conjugation. 8. Use words in
sentences In order to show that students understand the meaning and use
of a new vocabulary item, they make up sentences in which they use the
new words. 9. Composition The teacher gives the students a topic to
write about in the target language. The topic is based upon some aspect
of the reading passage of the lesson. Those techniques can be used
separately or united in an implementation of teaching learning activity.

22
4. The Advantages and Disadvantages of Grammar Translation
Method
a. Advantages
(1) This method is useful in the class in which there are a large
no of students. (2) It is beneficial to use in the class where there are
students of various levels-very intelligent and not-so-very intelligent.
(3) It helps the teacher to clear the meaning of a word and sentence
easily by translating it in to the mother tongue. (4) The students
understand the things very easily if taught using this method. (5) It
doesn't consume the time in finishing the syllabus. (6) Precise
pictures of the words and the things are made in to the minds of the
learners through this method. (7) This Translation Method is very
useful for the average and below-average students.
b. Disadvantages
(1) No oral work takes place in the class room due to this
method. (2) The main focus remains only on the mother-tongue and
the target language remains ignored. (3) No Speaking in the target
language is possible. The only thrust remains on the reading. (4) The
students don't develop the power of thinking in the target language.
(5) It doesn't help the students to learn correct pronunciation of
English Language or the target language. (6) Main emphasis is given
on the Rules of Grammar. (7) Students try to do everything by

23
translating. (8) This method doesn't involve the students mentally
and just like story telling method.

24
CHAPTER III
RESEARCH METHOD
One of the important things in a research is the Research Method of the study.
In this chapter the researcher presented the research design, population and
sample, research instrument, data collection procedure, and data analysis
procedure of the study that have collected from the research in the field.
A. Research Design
In this research, the researcher will conduct a Quasi-experimental design.
More specific the researcher will conduct true experimental research. The
researcher assesses this by providing a specific treatment to one group and
withholding it from another and then determining how both groups scored on
an outcome. Experiments include true experiments, with the random
assignment of subjects to treatment conditions, and quasi-experiments that
use nonrandomized assignments (Keppel, 1991). Included within quasi-
experiments are single subjectdesigns.
The experiment will conduct in two groups. They are experimental and
control group. The experimental group is the group who will receive the
treatment that is the use of peer group study as an approach on comprehend
reading materials, while the control group is a group who will not be exposed
to the experimental treatment. In this most basic of experimental designs, the
group receiving the treatment is called the experimental group and the other
group the control group (Bordens& Abbott, 2011).

25
Two groups are employed in this design; one group, the experimental
group, receives a treatment while the second group, the control group, does
not. Both groups were given a pretest and a posttest. Firstly, the test was done
in both groups, experimental and control group. Secondly, the result of the
test was scored by using analytic scale. Thirdly, the means score of the two
groups were determined. Finally, the two means were compared by applying
one way ANOVA was used to determine if the students‟ result of the test
which was taught by using the software and without using the software was
significant or not.
B. Population and Sample
1. Population
According to (Schreiber &Asber-self, 2011), “the population in
social science research refers to all of your potential participants; think of
it as the whole group of people in which you are interested”. The
researcher will take the first gradestudents of SMAN 4 Palangka Raya as
the population of the study.
2. Sample
Bordens& Abbott, (2011), a sample is a small subgroup chosen from
the larger population. Schreiber &Asber-self (2011), the sample of
participants for your study is part of the population, and all possess some
characteristic or characteristics that make them members of the sample

26
group. For the sample of this research, the researcher will take two
classes in order to get the data. The total number of the sample will be 60
students.
Table 3.1 Population and Sample
Population Sample Explanation
IPA
200 Students
IPA
30 Students EXPERIMENT GROUP
IPS
200 Students
IPS
30 Students CONTROL GROUP
BHS
40 Students
Total 60 Students
C. Research Instrument
1. Research Instrument Development
The instrument of collecting data is used by the researcher to get the
data observation was multiple choices narrative reading test and
questionnaire test. “A test is a set of stimuli presented to an individual in
order to clicit responses on the basis of which a numerical score can be
assigned (Ary, et al, 2010, p. 201).
a. Narrative Reading Test
The researcher take the data of this research by using a test. The
test was used to know result of the effectiveness using Grammar
Translation Method of the first grade of SMAN 4 Palangka Raya. To
get information about student‟s score in multiple choices, the
researcher used narrative text multiple choices test. The reason

27
researcher choose multiple choices is because multiple choices
commonly used by the teacher which means students are used to it.
For the text that researcher used is narrative text where it is on
literal reading level because the researcher considered it is on high
school students
The following table is presented for the specification of test
items.
Table 3.2 Specification of Test Items
No Part Quantity Numb of item
1 Text 1
Multiple Choices 5 1 – 5
2 Text 2
Multiple Choices 5 6 – 10
3 Text 3
Multiple Choices 5 11 – 15
b. Questionnaire Test
A questionnaire is a research instrument consisting of a series of
questions for the purpose of gathering information from respondents.
The researcher adapted a questionnaire developed by Cassandra S.
Coddington and John T. Guthrie to get information about students‟
reading motivation. The questionnaire used to collect data on the
point of view of students about their reading motivation. Total of the
questionnaire are 13 item. And for item 1). It ask students how
students handle with hard word when reading. 2). It ask students how
good students remembering what they read. 3.) It ask students
confidenity on reading. 4). It ask students confidenity on hard word

28
comprehension. 5). It ask students confidenity on hard word
comprehension. 6). It ask students feeling when read text. 7). It ask
students feeling when read text. 8). It ask students feeling when read
text in some place. 9).It ask students feeling when read text in some
place. 10). It ask students feeling when read text in some place. 11).
It ask students problems when read text. 12). It ask students
problems when read text. 13). It ask students problems when read
text,
Based on Cassandra S. Coddington and John T. Guthrie, they
make a score in questionnaire as:
Table 3.3Score of Questionnaire
Strongly
Disagree Disagree Neutral Agree
Strongly
Agree
1 2 3 4 5
A Higher score indicated higher motivation and lower score
indicated lower motivation of the students which based on the
criteria of score interpretation below.
Table 3.4 Score Interpretation
No Score Categorized
1 0% - 20% Very Low
2 21% - 40% Low
3 41% - 60% Moderately
4 61% - 80% Strong
5 81% - 100% Very Strong

29
2. Research Instrument Validity
“Validity is the most important consideration in developing and
evaluating measuring instruments. Validity was defined as the extent to
which an instruments measured what it claimed to measure. The focus of
recent views of validity is not on the instrument itself but on the
interpretation and meaning of the scores derived from the instrument”
(Ary, et al. 2010, p. 225).
a. Face Validity
“Face validity referred to the extent to which examinees believe
the instrument is measuring what it is supposed to measure” (Ary, et
al. 2010, p. 228). So questionnaire is used to measure student‟s
comprehension in reading and the multiple choices test is used to
measure student‟s score.
b. Content Validity
According to Creswell (2014, p.618) Content validity is the
extent to which the questions on the instrument and the scores from
the questions are representative of all the possible question that
could be asked about the content or skills. The researcher used a
questionnaire adapted from by Cassandra S. Coddington and John T.
Guthrie, the questionnaire used to find out the first grade students‟
comprehension in reading. And for the multiple choice used to find
students‟ score to know the significant.

30
The score of the test is automatically score by the researcher is,
“the students‟ correct choice” divided by “the question” times “100”.
c. Construct Validity
Construct validity is a determination of the significance,
meaning, purpose, and use of scores from an instrument (Creswell,
2014, p.618). To measure the questionnaireresearcher used
SPSSsoftware and for the multiple choice researcher used manual
formula and then used SPSSsoftware.
3. Research Instrument Reliability
“Reliability is the extent to which the test measures what it claim to
measure” (Ary, et al. 2010, p. 201). The questionnaire are taking from
Cassandra S. Coddington and John T. Guthrie that the guide is supported
by University of Maryland. For the multiples choices test used the
reliability formulas in SPSS software.
D. Data Collection Procedure
To get the data, the researcher used some procedures as follows:
1. The researcherchose the population of the study.
2. The researcher determined two groups, the first group was experiment
group and the second group was control group.
3. The researcher gave pretest to both classes (experiment group and control
group).

31
4. The researcher checked the result of pretest.
5. The researcher gave treatment (teaching) to the experiment group using
grammar translation method and the researcher taught the control group
using original method.
6. The researcher gave posttest to both classes.
7. The researcher checked the result of posttest.
8. The researcher gave score to students' answer (pretest and posttest).
E. Data Analysis Procedure
To analyze the data that has been collected, the researcher used some
procedure in this study:
1. After the researcher gave test to the students of the first grade students at
SMAN 4 Palangka Raya.
2. The researcher collected the data of the students' test result.
3. The researcher gave score the students‟ test result by using the formula
(AnasSudijono as cited in UswatunHasanah, 2016, p. 76):
Score =
x 100
Where:
B : Frequency of the correct answer
N : Number of test items
4. The researcher calculated the data by using one-way ANOVA in SPSS.
5. The researcher interpreted the result of one-way ANOVA.
6. The researcher discussed and concluded the result of data analysis.

32
CHAPTER IV
RESEARCH FINDINGS AND DISCUSSION
In this chapter, the researcher presents the data which had been collected from
the researcher in the field of study which consists of data presentation, research
findings, and discussion.
A. Data Presentation
1. The Result of Pre-test and Post-test Score of Students’ Reading
Comprehension of the Experiment and Control Class
a. The Result of Pre-test and Post-test Score of Students’ Reading
Comprehension in Experiment Class
The pre-test had been conducted in class IPA with the number of
30 students on October, 13th 2019. Meanwhile the post-test had been
conducted on Thursday, December, 3th 2019.
The scores of students' reading comprehension in experiment
class were presented in table 4.1 bellow.
Table 4.1the Result of Pre-test and Post-test Score of Students’
Reading Comprehension in Experiment Class
No.
Students’
Initial
Name
Pre-test
Score
Post-
test
Score
Improvement Percent
(%)
1. D.H 40 60 20 33%
2. F.A 27 60 33 55%
3. M.A 33 53 20 38%
4. R 53 60 7 12%
5. A.F 13 53 40 75%
6. A.D 53 53 0 0%
7. W 40 53 13 25%
8. A.A 53 53 0 0%
9. A.S 20 53 33 62%

33
10. P.S 33 80 47 59%
11. R.D 53 53 0 0%
12. M.M 66 87 21 24%
13. L.A 53 73 20 27%
14. D.P 60 66 6 9%
15. G.O 60 60 0 0%
16. M.A.P 53 66 13 20%
17. A.M.V 66 73 7 10%
18. R.W 66 80 14 18%
19. A.D 66 80 14 18%
20. I.P 53 53 0 0%
21. D.W 53 73 20 27%
22. S 53 53 0 0%
23. V.D.D 53 87 34 39%
24. D.W 53 80 27 34%
25. R.S 66 87 21 24%
26. N.S 33 73 40 55%
27. U.H 47 66 19 29%
28. W 53 53 0 0%
29. D 53 73 20 27%
30. P.F 53 73 20 27%
Sum 1.478 1.987
Highest Score 66 87
Lowest Score 13 53
Mean 49.27 66.23
It can be seen in the table 4.1 above, based on the result of
research in class IPA as experiment class before giving treatment,
the highest pre-test score was 66 and the lowest score was 13 with
sum of the score was 1.478 and mean was 49.27. Then, the result of
research after taught using Grammar Translation Method, the highest
post-test score was 87 and the lowest score was 53 with sum of the
score was 1.987 and mean was 66.23. In conclusion, mean of pre-test
score was 49.27 and in the post-test was 66.23.

34
In the pre-test, there were a student who got score 13, a student
got 20, a student got 27, three students got score 33, two students got
score 40 and a student got score 47. Besides that, there were fourteen
students who got score 53, two students got score 60, and the highest
score was 66 got by five students. Then in the post-test, there were
ten students who got score 53, four students who got score 60, three
students got score 66, six students got score 73, four students got
score 80, and the highest score was 87 got by three students. It could
be concluded that, the students' reading comprehension score of
experiment class was increased from pre-test to post-test with total
score 1.478 to 1.987.
Then, the following figure was the frequency distribution of
students‟ pre-test scores of experiment class.
Figure 4.1 the Frequency Distribution of Students’ Pre-test
Score of Experiment Class

35
The bar chart depicts the students‟ pre-test score of experiment
class. There were a student who got score 13, a student who got
score 20, and a student who got score 27.Three students who got
score 33, two students who got score 40 and a student who got score
47. Then, there were fourteen students who got score 53, two
students who got score 60 and the higher score were 66 that got by
the five students.
Besides that, the researcher also calculated the score of mean,
median, standard error of mean and standard deviation that can also
be seen in the following table.
Table 4.2 the Calculation of Mean, Median, Standard Error of
Mean and Standard Deviation
Statistics
Pre-test Score of Experiment Class
N Valid 30
Missing 0
Mean 49.2667
Std. Error of Mean 2.50605
Median 53.0000
Std. Deviation 13.72622
Minimum 13.00
Maximum 66.00
Sum 1478.00
Based on the data above, it was known the lowest score was
13.00 and the highest score was 66.00. For the result of calculation
using SPSS 20, it was found that the mean of pre-test score was
49.2667, median was 53.0000, the standard deviation 13.72622 and
the standard error of mean was 2.50605.

36
Meanwhile, the frequency distribution of students‟ post-test
score of experiment class can be seen in the following figure.
Figure 4.2 the Frequency Distribution of Students’ Post-test
Score of Experiment Class
The bar chart depicts the students‟ post-test score of experiment
class. There were ten students who got score 53, four students who
got score 60, and three students who got score 66. Then, there were
six students who got score 73 and four students who got score 80.
The last, three students who got a higher score there were 87.
Besides that, the researcher also calculated the score of mean,
median, standard error of mean and standard deviation that can also
be seen in the following table.
Table 4.3 the Calculation of Mean, Median, Standard Error of
Mean and Standard Deviation
Statistics
Post-test Score of Experiment Class
N Valid 30
Missing 0

37
Mean 66.2333
Std. Error of Mean 2.20589
Median 66.0000
Std. Deviation 12.08214
Minimum 53.00
Maximum 87.00
Sum 1987.00
Based on the data above, it was known the lowest score was
53.00 and the highest score was 87.00. For the result of calculation
using SPSS 20, it was found that the mean of pre-test score was
66.2333, median was 66.0000, the standard deviation 12.08214 and
the standard error of mean was 2.20589.
b. The Result of Pre-test and Post-test Score of Students’ Reading
Comprehension in Control Class
The pre-test had been conducted in class IPS with the number of
30 students on October, 13th 2019. Meanwhile the post-test had been
conducted on Thursday, December, 3th 2019.
The scores of students' reading comprehension in control class
were presented in table 4.4 bellow.
Table 4.4the Result of Pre-test and Post-test Score of Students’
Reading Comprehension in Control Class
No.
Students’
Initial
Name
Pre-test
Score
Post-
test
Score
Improvement Percent
(%)
1. K.F 27 40 13 33%
2. A.M 27 27 0 0%
3. Y 27 33 6 18%
4. M 7 53 46 87%
5. D 13 13 0 0%
6. P.R.W 53 53 0 0%

38
7. P.S 7 40 33 83%
8. B.K 53 53 0 0%
9. T 66 20 -46 -230%
10. P 20 33 13 39%
11. B 20 53 33 62%
12. A.W 20 66 46 70%
13. K.F 13 53 40 75%
14. Y 13 60 47 78%
15. S 40 60 20 33%
16. D.O 20 60 40 67%
17. J 40 60 20 33%
18. L 40 53 13 25%
19. Y.G 40 60 20 33%
20. R 27 53 26 49%
21. K 47 53 6 11%
22. S.M.S.S 73 53 -20 -38%
23. M.F 73 53 -20 -38%
24. E 40 53 13 25%
25. L.E.F 53 53 0 0%
26. A.P 73 80 7 9%
27. T.P.A 73 87 14 16%
28. P.J 47 73 26 36%
29. T.A 40 66 26 39%
30. N 40 60 20 33%
SUM 1.132 1.574
Highest Score 73 87
Lowest Score 7 13
Mean 37.73 52.47
It can be seen in the table 4.4 above, based on the result of
research in class IPS as control class, the highest pre-test score was
73 and the lowest score was 7 with sum of the score was 1.132 and
mean was 37.73. Then, the result of research after taught without
using Grammar Translation Method, the highest post-test score was
87 and the lowest score was 13 with sum of the score was 1.574 and

39
mean was 52.47. In conclusion, mean of pre-test score was 37.73 and
in the post-test was 52.47.
In the pre-test, there were two students who got score 7, three
students got score 13, four students got score 20, four students got
score 27, seven students got score 40, and two students got score 47.
Besides that, there were three students who got score 53, a student
got score 66, and the highest score was 73 got by four students. Then
in the post-test, there were a student who got score 13, a student got
score 20, a student got score 27, two students got score 33, and two
students got score 40. On the other hand, there were twelve students
who got score 53, six students got score 60, two students got score
66, a students got score 73, a students got score 80, and the highest
score was 87 got by a student. It could be concluded that, the
students' reading comprehension score of control class was increased
from pre-test to post-test with total score 1.132 to 1.574.
Then, the following figure was the frequency distribution of
students‟ pre-test scores of control class.

40
Figure 4.3 the Frequency Distribution of Students’ Pre-test
Score of Control Class
Based on the figure above, it can be seen that the students‟ pre-
test score of control group. There were two students who got score 7,
three students who got score 13, four students who got score 20 and
four students who got score 27. Then, there were seven students who
got score 40 and two students who got score 47. On the other hand,
there were three students who got score 53 and a student who got
score 66. The last, four students got a higher score there were 73.
Besides that, the researcher also calculated the score of mean,
median, standard error of mean and standard deviation that can also
be seen in the following table.
Table 4.5the Calculation of Mean, Median, Standard Error of
Mean and Standard Deviation
Statistics
Pre-test Score of Control Class
N Valid 30
Missing 0

41
Mean 37.7333
Std. Error of Mean 3.73303
Median 40.0000
Std. Deviation 20.44662
Minimum 7.00
Maximum 73.00
Sum 1132.00
Based on the data above, it was known the lowest score was
7.00 and the highest score was 73.00. For the result of calculation
using SPSS 20, it was found that the mean of pre-test score was
37.7333, median was 40.0000, the standard deviation 20.44662 and
the standard error of mean was 3.73303.
Meanwhile, the frequency distribution of students‟ post-test
score of control class can be seen in the following figure.
Figure 4.4 the Frequency Distribution of Students’ Post-test
Score of Control Class
The bar chart depicts the students‟ post-test score of control
class. There were a student who got score 13, a student who got

42
score 20, and a student who got score 27. Two students who got
score 33, two students who got score 40 and twelve students who got
score 53. Then, there were six students who got score 60, two
students who got score 66, a student who got score 73, a students
who got score 80 and a student got the higher score there were 87.
Besides that, the researcher also calculated the score of mean,
median, standard error of mean and standard deviation that can also
be seen in the following table.
Table 4.6 the Calculation of Mean, Median, Standard Error of
Mean and Standard Deviation
Statistics
Post-test Score of Control Class
N Valid 30
Missing 0
Mean 52.4667
Std. Error of Mean 2.91872
Median 53.0000
Std. Deviation 15.98649
Minimum 13.00
Maximum 87.00
Sum 1574.00
Based on the data above, it was known the lowest score was
13.00 and the highest score was 87.00. For the result of calculation
using SPSS 20, it was found that the mean of pre-test score was
52.4667, median was 53.0000, the standard deviation 15.98649 and
the standard error of mean was 2.91872.

43
2. The Questionnaire Result of Students’ Reading Motivation of the
Experiment and Control Class
a. The Questionnaire Result of Experiment Class
The questionnaire result of students' reading motivation were
presented in table 4.7 below.
Table 4.7 the Questionnaire Result of Experiment Class
No
Students'
Initial
Name
Item Total
1 2 3 4 5 6 7 8 9 10 11 12 13
1 D.H 3 2 4 5 4 3 2 2 3 3 4 3 2 40
2 F.A 3 3 3 3 4 2 3 2 4 4 4 2 3 40
3 M.A 3 3 4 2 3 3 3 2 4 3 3 3 3 39
4 R 3 3 3 3 4 2 3 2 3 4 3 2 3 38
5 A.F 3 3 4 2 3 3 3 2 4 3 3 3 3 39
6 A.D 3 3 3 3 3 3 3 2 3 3 3 3 3 38
7 W 3 3 3 3 3 5 3 3 3 3 3 3 3 41
8 A.A 3 3 4 3 3 4 2 3 3 3 4 4 3 42
9 A.S 3 3 4 3 3 4 2 3 3 3 4 4 3 42
10 P.S 3 3 4 3 3 4 2 3 3 3 4 4 3 42
11 R.D 3 3 2 4 3 3 3 4 2 3 3 3 3 39
12 M.M 4 4 4 4 2 4 4 4 2 2 2 2 2 40
13 L.A 3 3 3 2 5 4 3 3 3 3 2 2 3 39
14 D.P 3 3 2 4 3 3 3 4 2 3 3 3 3 39
15 G.O 4 4 4 3 2 4 4 3 3 3 2 2 3 41
16 M.A.P 4 3 3 4 2 4 4 5 2 2 2 2 2 39
17 A.M.V 3 3 2 4 3 3 3 4 2 3 3 3 3 39
18 R.W 4 4 4 4 2 4 4 4 4 4 3 4 4 49
19 A.D 4 4 4 4 1 4 4 4 4 4 3 4 4 48
20 I.P 4 3 4 3 2 4 4 3 3 3 3 4 4 44
21 D.W 3 3 2 4 3 3 3 4 2 3 3 3 3 39
22 S 4 4 4 4 2 4 4 3 3 3 2 2 3 42
23 V.D.D 4 4 4 4 2 4 4 3 3 3 2 2 3 42
24 D.W 3 3 3 3 2 3 3 3 3 3 3 2 3 37
25 R.S 3 3 3 3 3 3 3 3 3 3 3 3 3 39
26 N.S 3 3 3 4 4 3 3 3 3 3 3 2 3 40
27 U.H 3 3 2 4 3 3 3 4 2 3 3 3 3 39
28 W 3 3 3 4 3 2 4 3 3 3 2 2 2 37

44
29 D 3 3 3 3 3 4 3 2 2 3 3 3 3 38
30 P.F 3 3 3 3 3 4 3 2 2 3 3 3 3 38
Sum 98 95 98 102 86 103 95 92 86 92 88 85 89
Highest Score 4 4 4 5 5 5 4 5 4 4 4 4 4
Lowest Score 3 2 2 2 1 2 2 2 2 2 2 2 2
Mean 3.27 3.17 3.27 3.40 2.87 3.43 3.17 3.07 2.87 3.07 2.93 2.83 2.97
The questionnaire data was taken on December, 3th 2019 at the
first grade ofSMAN 4 Palangka Raya. The sample used in this
research was30 students of class IPA as an experiment class. The
students were gave 13 simple questions which the result is
summarized as follows.
Table 4.8 the Questionnaire Result of Item 1
Frequency Percent Valid
Percent
Cumulative
Percent
Valid
Netral 22 73.3 73.3 73.3
Agree 8 26.7 26.7 100.0
Total 30 100.0 100.0
Based on the table 4.8 above, there were 22 students who
answer Netral (3) and 4 students answer Agree (4). So, to calculate
the total score of item 1 was used the following formula:
Total Score = students answer scale x score of questionnaire
Based on the formula above, the researcher find the following
results.
Table 4.9 Total Score of Item 1
Answer Scale Students Answer Scale x
Score of Questionnaire Result
Netral 22 x 3 66
Agree 4 x 4 16
Total Score 82

45
Furthermore, it was determined in the form of a presentation
with the following calculation:
Score = (Total Score : (5 x N)) x 100
= (82 : (5 x 30)) x 100
= (82 : 150) x 100
= 0.55 x 100
Score = 55%
So, it can be concluded that from the calculation results obtained
percentage score 55%. So if it is included in the percentage category,
item 1 was included in the moderatelycategory.
Table 4.10 the Questionnaire Result of Item 2
Frequency Percent Valid
Percent
Cumulative
Percent
Valid
Disagree 1 3.3 3.3 3.3
Netral 23 76.7 76.7 80.0
Agree 6 20.0 20.0 100.0
Total 30 100.0 100.0
Based on the table 4.10 above, there were a student who answer
Disagree (2), 23 students answer Netral (3), and 6 students answer
Agree (4). So, to calculate the total score of item 2 was used the
following formula:
Total Score = students answer scale x score of questionnaire
Based on the formula above, the researcher find the following
results.

46
Table 4.11 Total Score of Item 2
Answer Scale Students Answer Scale x
Score of Questionnaire Result
Disagree 1 x 2 2
Netral 23 x 3 69
Agree 6x 4 24
Total Score 95
Furthermore, it was determined in the form of a presentation
with the following calculation:
Score = (Total Score : (5 x N)) x 100
= (95 : (5 x 30)) x 100
= (95 : 150) x 100
= 0.63 x 100
Score = 63%
So, it can be concluded that from the calculation results obtained
percentage score 63%. So if it is included in the percentage category,
item 2 was included in the strong category.
Table 4.12 the Questionnaire Result of Item 3
Frequency Percent Valid
Percent
Cumulative
Percent
Valid
Disagree 5 16.7 16.7 16.7
Netral 12 40.0 40.0 56.7
Agree 13 43.3 43.3 100.0
Total 30 100.0 100.0
Based on the table 4.12 above, there were 5 students who
answer Disagree (2), 12 students answer Netral (3), and 13 students
answer Agree (4). So, to calculate the total score of item 3 was used
the following formula:

47
Total Score = students answer scale x score of questionnaire
Based on the formula above, the researcher find the following
results.
Table 4.13 Total Score of Item 3
Answer Scale Students Answer Scale x
Score of Questionnaire Result
Disagree 5 x 2 10
Netral 12 x 3 36
Agree 13 x 4 52
Total Score 98
Furthermore, it was determined in the form of a presentation
with the following calculation:
Score = (Total Score : (5 x N)) x 100
= (98 : (5 x 30)) x 100
= (98 : 150) x 100
= 0.65 x 100
Score = 65%
So, it can be concluded that from the calculation results obtained
percentage score 65%. So if it is included in the percentage category,
item 3 was included in the strong category.
Table 4.14 the Questionnaire Result of Item 4
Frequency Percent Valid
Percent
Cumulative
Percent
Valid
Disagree 3 10.0 10.0 10.0
Netral 13 43.3 43.3 53.3
Agree 13 43.3 43.3 96.7
Strongly Agree 1 3.4 3.4 100.0
Total 30 100.0 100.0
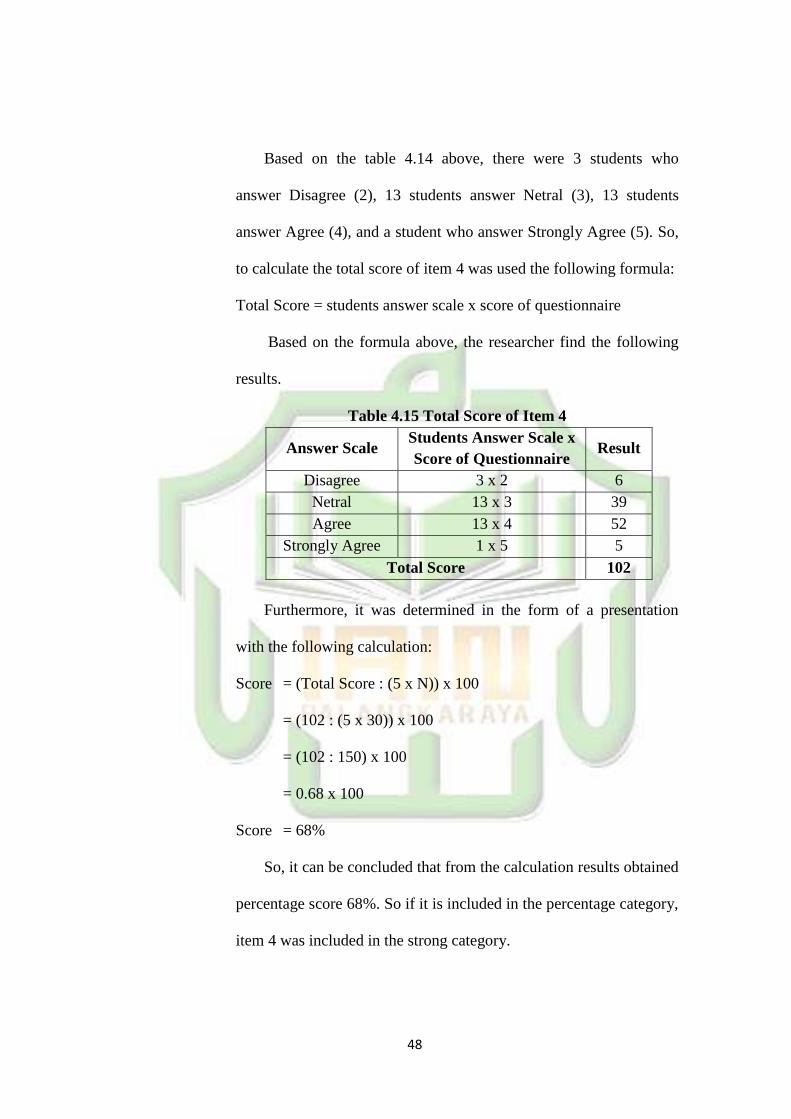
48
Based on the table 4.14 above, there were 3 students who
answer Disagree (2), 13 students answer Netral (3), 13 students
answer Agree (4), and a student who answer Strongly Agree (5). So,
to calculate the total score of item 4 was used the following formula:
Total Score = students answer scale x score of questionnaire
Based on the formula above, the researcher find the following
results.
Table 4.15 Total Score of Item 4
Answer Scale Students Answer Scale x
Score of Questionnaire Result
Disagree 3 x 2 6
Netral 13 x 3 39
Agree 13 x 4 52
Strongly Agree 1 x 5 5
Total Score 102
Furthermore, it was determined in the form of a presentation
with the following calculation:
Score = (Total Score : (5 x N)) x 100
= (102 : (5 x 30)) x 100
= (102 : 150) x 100
= 0.68 x 100
Score = 68%
So, it can be concluded that from the calculation results obtained
percentage score 68%. So if it is included in the percentage category,
item 4 was included in the strong category.

49
Table 4.16 the Questionnaire Result of Item 5
Frequency Percent Valid
Percent
Cumulative
Percent
Valid
Strongly Disagree 1 3.3 3.3 3.3
Disagree 8 26.7 26.7 30.0
Netral 16 53.3 53.3 83.3
Agree 4 13.3 13.3 96.7
Strongly Agree 1 3.3 3.3 100.0
Total 30 100.0 100.0
Based on the table 4.16 above, there were a student who answer
Strongly Disagree (1), 8 students answer Disagree (2), 16 students
answer Netral (3), 4 students answer Agree (4), and a student who
answer Strongly Agree (5). So, to calculate the total score of item 5
was used the following formula:
Total Score = students answer scale x score of questionnaire
Based on the formula above, the researcher find the following
results.
Table 4.17 Total Score of Item 5
Answer Scale Students Answer Scale x
Score of Questionnaire Result
Strongly Disagree 1 x 1 1
Disagree 8 x 2 16
Netral 16 x 3 48
Agree 4 x 4 16
Strongly Agree 1 x 5 5
Total Score 86
Furthermore, it was determined in the form of a presentation
with the following calculation:

50
Score = (Total Score : (5 x N)) x 100
= (86 : (5 x 30)) x 100
= (86 : 150) x 100
= 0.57 x 100
Score = 57%
So, it can be concluded that from the calculation results obtained
percentage score 57%. So if it is included in the percentage category,
item 5 was included in the moderately category.
Table 4.18 the Questionnaire Result of Item 6
Frequency Percent Valid
Percent
Cumulative
Percent
Valid
Disagree 3 10.0 10.0 10.0
Netral 12 40.0 40.0 50.0
Agree 14 46.7 46.7 96.7
Strongly Agree 1 3.3 3.3 100.0
Total 30 100.0 100.0
Based on the table 4.18 above, there were 3 students who
answer Disagree (2), 12 students answer Netral (3), 14 students
answer Agree (4), and a student who answer Strongly Agree (5). So,
to calculate the total score of item 6 was used the following formula:
Total Score = students answer scale x score of questionnaire
Based on the formula above, the researcher find the following
results.

51
Table 4.19 Total Score of Item 6
Answer Scale Students Answer Scale x
Score of Questionnaire Result
Disagree 3 x 2 6
Netral 12 x 3 36
Agree 14 x 4 56
Strongly Agree 1 x 5 5
Total Score 103
Furthermore, it was determined in the form of a presentation
with the following calculation:
Score = (Total Score : (5 x N)) x 100
= (103 : (5 x 30)) x 100
= (103 : 150) x 100
Score = 0.69 x 100 = 69%
So, it can be concluded that from the calculation results obtained
percentage score 69%. So if it is included in the percentage category,
item 6 was included in the strong category.
Table 4.20 the Questionnaire Result of Item 7
Frequency Percent Valid
Percent
Cumulative
Percent
Valid
Disagree 4 13.3 13.3 13.3
Netral 17 56.7 56.7 70.0
Agree 9 30.0 30.0 100.0
Total 30 100.0 100.0
Based on the table 4.20 above, there were 4 students who
answer Disagree (2), 17 students answer Netral (3), and 9 students
answer Agree (4). So, to calculate the total score of item 7 was used
the following formula:

52
Total Score = students answer scale x score of questionnaire
Based on the formula above, the researcher find the following
results.
Table 4.21 Total Score of Item 7
Answer Scale Students Answer Scale x
Score of Questionnaire Result
Disagree 4 x 2 8
Netral 17 x 3 51
Agree 9 x 4 36
Total Score 95
Furthermore, it was determined in the form of a presentation
with the following calculation:
Score = (Total Score : (5 x N)) x 100
= (95 : (5 x 30)) x 100
= (95 : 150) x 100
= 0.63 x 100
Score = 63%
So, it can be concluded that from the calculation results obtained
percentage score 63%. So if it is included in the percentage category,
item 7 was included in the strong category.
Table 4.22 the Questionnaire Result of Item 8
Frequency Percent Valid
Percent
Cumulative
Percent
Valid
Disagree 8 26.7 26.7 26.7
Netral 13 43.3 43.3 70.0
Agree 8 26.7 26.7 96.7
Strongly Agree 1 3.3 3.3 100.0
Total 30 100.0 100.0

53
Based on the table 4.22 above, there were 8 students who
answer Disagree (2), 13 students answer Netral (3), 8 students
answer Agree (4), and a student who answer Strongly Agree (5). So,
to calculate the total score of item 8 was used the following formula:
Total Score = students answer scale x score of questionnaire
Based on the formula above, the researcher find the following
results.
Table 4.23 Total Score of Item 8
Answer Scale Students Answer Scale x
Score of Questionnaire Result
Disagree 8 x 2 16
Netral 13 x 3 39
Agree 8 x 4 32
Strongly Agree 1 x 5 5
Total Score 92
Furthermore, it was determined in the form of a presentation
with the following calculation:
Score = (Total Score : (5 x N)) x 100
= (92 : (5 x 30)) x 100
= (92 : 150) x 100
= 0.61 x 100
Score = 61%
So, it can be concluded that from the calculation results obtained
percentage score 61%. So if it is included in the percentage category,
item 8 was included in the strong category.

54
Table 4.24 the Questionnaire Result of Item 9
Frequency Percent Valid
Percent
Cumulative
Percent
Valid
Disagree 9 30.0 30.0 30.0
Netral 16 53.3 53.3 83.3
Agree 5 16.7 16.7 100.0
Total 30 100.0 100.0
Based on the table 4.24 above, there were 9 students who
answer Disagree (2), 16 students answer Netral (3), and 5 students
answer Agree (4). So, to calculate the total score of item 9 was used
the following formula:
Total Score = students answer scale x score of questionnaire
Based on the formula above, the researcher find the following
results.
Table 4.25 Total Score of Item 9
Answer Scale Students Answer Scale x
Score of Questionnaire Result
Disagree 9 x 2 18
Netral 16 x 3 48
Agree 5 x 4 20
Total Score 86
Furthermore, it was determined in the form of a presentation
with the following calculation:
Score = (Total Score : (5 x N)) x 100
= (86 : (5 x 30)) x 100
= (86 : 150) x 100
= 0.57 x 100
Score = 57%

55
So, it can be concluded that from the calculation results obtained
percentage score 57%. So if it is included in the percentage category,
item 9 was included in the moderately category.
Table 4.26 the Questionnaire Result of Item 10
Frequency Percent Valid
Percent
Cumulative
Percent
Valid
Disagree 2 6.7 6.7 6.7
Netral 24 80.0 80.0 86.7
Agree 4 13.3 13.3 100.0
Total 30 100.0 100.0
Based on the table 4.26 above, there were 2 students who
answer Disagree (2), 24 students answer Netral (3), and 4 students
answer Agree (4). So, to calculate the total score of item 10 was used
the following formula:
Total Score = students answer scale x score of questionnaire
Based on the formula above, the researcher find the following
results.
Table 4.27 Total Score of Item 10
Answer Scale Students Answer Scale x
Score of Questionnaire Result
Disagree 2 x 2 4
Netral 24 x 3 72
Agree 4 x 4 16
Total Score 92
Furthermore, it was determined in the form of a presentation
with the following calculation:

56
Score = (Total Score : (5 x N)) x 100
= (92 : (5 x 30)) x 100
= (92 : 150) x 100
= 0.61 x 100
Score = 61%
So, it can be concluded that from the calculation results obtained
percentage score 61%. So if it is included in the percentage category,
item 10 was included in the strong category.
Table 4.28 the Questionnaire Result of Item 11
Frequency Percent Valid
Percent
Cumulative
Percent
Valid
Disagree 7 23.3 23.3 23.3
Netral 18 60.0 60.0 83.3
Agree 5 16.7 16.7 100.0
Total 30 100.0 100.0
Based on the table 4.28 above, there were 7 students who
answer Disagree (2), 18 students answer Netral (3), and 5 students
answer Agree (4). So, to calculate the total score of item 11 was used
the following formula:
Total Score = students answer scale x score of questionnaire
Based on the formula above, the researcher find the following
results.

57
Table 4.29 Total Score of Item 11
Answer Scale Students Answer Scale x
Score of Questionnaire Result
Disagree 7 x 2 14
Netral 18 x 3 54
Agree 5 x 4 20
Total Score 88
Furthermore, it was determined in the form of a presentation
with the following calculation:
Score = (Total Score : (5 x N)) x 100
= (88 : (5 x 30)) x 100
= (88 : 150) x 100
= 0.59 x 100
Score = 59%
So, it can be concluded that from the calculation results obtained
percentage score 59%. So if it is included in the percentage category,
item 11 was included in the moderately category.
Table 4.30 the Questionnaire Result of Item 12
Frequency Percent Valid
Percent
Cumulative
Percent
Valid
Disagree 11 36.7 36.7 36.7
Netral 13 43.3 43.3 80.0
Agree 6 20.0 20.0 100.0
Total 30 100.0 100.0
Based on the table 4.30 above, there were 11 students who
answer Disagree (2), 13 students answer Netral (3), and6 students
answer Agree (4). So, to calculate the total score of item 12 was used
the following formula:

58
Total Score = students answer scale x score of questionnaire
Based on the formula above, the researcher find the following
results.
Table 4.31 Total Score of Item 12
Answer Scale Students Answer Scale x
Score of Questionnaire Result
Disagree 11 x 2 22
Netral 13 x 3 39
Agree 6 x 4 24
Total Score 85
Furthermore, it was determined in the form of a presentation
with the following calculation:
Score = (Total Score : (5 x N)) x 100
= (85 : (5 x 30)) x 100
= (85 : 150) x 100
= 0.57 x 100
Score = 57%
So, it can be concluded that from the calculation results obtained
percentage score 57%. So if it is included in the percentage category,
item 12 was included in the moderately category.
Table 4.32 the Questionnaire Result of Item 13
Frequency Percent Valid
Percent
Cumulative
Percent
Valid
Disagree 4 13.3 13.3 13.3
Netral 23 76.7 76.7 90.0
Agree 3 10.0 10.0 100.0
Total 30 100.0 100.0

59
Based on the table 4.32 above, there were 4 students who
answer Disagree (2), 23 students answer Netral (3), and 3 students
answer Agree (4). So, to calculate the total score of item13 was used
the following formula:
Total Score = students answer scale x score of questionnaire
Based on the formula above, the researcher find the following
results.
Table 4.33 Total Score of Item 13
Answer Scale Students Answer Scale x
Score of Questionnaire Result
Disagree 4 x 2 8
Netral 23 x 3 69
Agree 3 x 4 12
Total Score 89
Furthermore, it was determined in the form of a presentation
with the following calculation:
Score = (Total Score : (5 x N)) x 100
= (89 : (5 x 30)) x 100
= (89 : 150) x 100
= 0.59 x 100
Score = 59%
So, it can be concluded that from the calculation results obtained
percentage score 59%. So if it is included in the percentage category,
item 13 was included in the moderately category.
Furthermore, the result of reading motivation of experiment
class were presented in the following table:

60
Table 4.34 the Result of Reading Motivation of Experiment
Class
No Code Score of
Item Percent Category
1 Item 1 82 55% Moderately
2 Item 2 95 63% Strong
3 Item 3 98 65% Strong
4 Item 4 102 68% Strong
5 Item 5 86 57% Moderately
6 Item 6 103 69% Strong
7 Item 7 95 63% Strong
8 Item 8 92 61% Strong
9 Item 9 86 57% Moderately
10 Item 10 92 61% Strong
11 Item 11 88 59% Moderately
12 Item 12 85 57% Moderately
13 Item 13 89 59% Moderately
Sum 1.193 794%
Highest 103 69%
Lowest 82 55%
Mean 91.77 61%
Based on the data above, it can be seen that the total of students‟
reading motivation score was 1.193, the highest score was 103 and
the lowest score was 82, while mean was 91.77.
Then, it was revealed that from the five category of reading
motivation were not all perceived by the students, but moderately
category and strong category only.
b. The Questionnaire Result of Control Class
The questionnaire result of students' reading motivation were
presented in table 4.35 below.

61
Table 4.35 the Questionnaire Result of Control Class
No
Students'
Initial
Name
Item Total
1 2 3 4 5 6 7 8 9 10 11 12 13
1 K.F 3 4 4 4 2 4 4 5 3 4 5 5 2 49
2 A.M 5 4 4 4 2 4 5 5 4 3 1 2 4 47
3 Y 5 4 4 4 2 4 5 5 3 1 2 4 4 47
4 M 2 4 4 4 4 4 4 4 4 4 4 4 4 50
5 D 2 2 4 2 5 3 4 2 5 2 5 5 5 46
6 P.R.W 3 4 5 2 2 4 3 3 1 2 2 2 2 35
7 P.S 1 4 3 3 4 4 4 4 5 5 5 3 1 46
8 B.K 3 4 4 2 4 3 3 2 5 2 3 2 3 40
9 T 3 4 4 3 4 3 3 3 5 1 3 1 3 40
10 P 1 4 3 3 4 4 4 4 5 5 5 3 1 46
11 B 1 3 5 2 1 4 4 3 1 1 2 3 1 31
12 A.W 5 5 4 4 3 5 4 3 2 2 2 2 2 43
13 K.F 3 4 4 4 2 4 4 5 1 3 4 5 4 47
14 Y 5 5 4 4 3 3 3 4 3 3 2 2 2 43
15 S 2 4 3 3 1 2 4 2 5 3 1 3 2 35
16 D.O 5 4 4 3 4 5 3 4 4 4 3 3 4 50
17 J 4 2 3 2 4 4 4 3 3 2 4 4 5 44
18 L 4 2 3 2 4 2 2 3 3 2 4 4 5 40
19 Y.G 4 4 4 2 4 4 2 4 2 3 3 3 3 42
20 R 3 3 4 3 3 4 3 3 3 2 3 4 3 41
21 K 4 3 4 2 3 4 5 1 1 5 3 1 4 40
22 S.M.S.S 3 4 3 4 3 4 3 3 5 1 3 2 3 41
23 M.F 5 4 2 4 5 3 4 2 3 4 1 2 2 41
24 E 5 4 3 3 2 4 4 4 2 3 2 4 5 45
25 L.E.F 3 3 4 3 2 3 2 3 4 4 3 2 3 39
26 A.P 2 1 5 5 2 1 4 1 3 4 1 3 5 37
27 T.P.A 3 4 3 4 2 4 2 4 3 2 4 2 4 41
28 P.J 2 2 2 1 4 2 2 3 1 2 1 2 1 25
29 T.A 2 1 5 5 2 1 2 1 3 4 1 3 5 35
30 N 2 1 5 5 4 1 4 2 3 3 1 1 1 33
Sum 95 101 113 96 91 101 104 95 95 86 83 86 93
Highest Score 5 5 5 5 5 5 5 5 5 5 5 5 5
Lowest Score 1 1 2 1 1 1 2 1 1 1 1 1 1
Mean 3.17 3.37 3.77 3.20 3.03 3.37 3.47 3.17 3.17 2.87 2.77 2.87 3.10

62
The questionnaire data was taken on December, 3th 2019 at the
first grade of SMAN 4 Palangka Raya. The sample used in this
research was 30 students of class IPS as control class. The students
were gave 13 simple questions which the result is summarized as
follows.
Table 4.36 the Questionnaire Result of Item 1
Frequency Percent Valid
Percent
Cumulative
Percent
Valid
Strongly Disagree 3 10.0 10.0 10.0
Disagree 7 23.3 23.3 33.3
Netral 9 30.0 30.0 63.3
Agree 4 13.3 13.3 76.7
Strongly Agree 7 23.3 23.3 100.0
Total 30 100.0 100.0
Based on the table 4.36 above, there were 3 students who
answer Strongly Disagree (1), 7 students answer Disagree (2), 9
students answer Netral (3), 4 students answer Agree (4), and 7
students who answer Strongly Agree (5). So, to calculate the total
score of item 1 was used the following formula:
Total Score = students answer scale x score of questionnaire
Based on the formula above, the researcher find the following
results.

63
Table 4.37 Total Score of Item 1
Answer Scale Students Answer Scale x
Score of Questionnaire Result
Strongly Disagree 3 x 1 3
Disagree 7 x 2 14
Netral 9 x 3 27
Agree 4 x 4 16
Strongly Agree 7 x 5 35
Total Score 95
Furthermore, it was determined in the form of a presentation
with the following calculation:
Score = (Total Score : (5 x N)) x 100
= (95 : (5 x 30)) x 100
= (95 : 150) x 100
= 0.63 x 100
Score = 63%
So, it can be concluded that from the calculation results obtained
percentage score 63%. So if it is included in the percentage category,
item 1 was included in the strong category.
Table 4.38 the Questionnaire Result of Item 2
Frequency Percent Valid
Percent
Cumulative
Percent
Valid
Strongly Disagree 3 10.0 10.0 10.0
Disagree 4 13.3 13.3 23.3
Netral 4 13.3 13.3 36.7
Agree 17 56.7 56.7 93.3
Strongly Agree 2 6.7 6.7 100.0
Total 30 100.0 100.0

64
Based on the table 4.38 above, there were 3 students who
answer Strongly Disagree (1), 4 students answer Disagree (2), 4
students answer Netral (3), 17 students answer Agree (4), and 2
students who answer Strongly Agree (5). So, to calculate the total
score of item 2 was used the following formula:
Total Score = students answer scale x score of questionnaire
Based on the formula above, the researcher find the following
results.
Table 4.39 Total Score of Item 2
Answer Scale Students Answer Scale x
Score of Questionnaire Result
Strongly Disagree 3 x 1 3
Disagree 4 x 2 8
Netral 4 x 3 12
Agree 17 x 4 68
Strongly Agree 2 x 5 10
Total Score 101
Furthermore, it was determined in the form of a presentation
with the following calculation:
Score = (Total Score : (5 x N)) x 100
= (101 : (5 x 30)) x 100
= (101 : 150) x 100
= 0.67 x 100
Score = 67%

65
So, it can be concluded that from the calculation results obtained
percentage score 67%. So if it is included in the percentage category,
item 2 was included in the strong category.
Table 4.40 the Questionnaire Result of Item 3
Frequency Percent Valid
Percent
Cumulative
Percent
Valid
Disagree 2 6.7 6.7 6.7
Netral 8 26.7 26.7 33.3
Agree 15 50.0 50.0 83.3
Strongly Agree 5 16.7 16.7 100.0
Total 30 100.0 100.0
Based on the table 4.40 above, there were 2 students who
answer Disagree (2), 8 students answer Netral (3), 15 students
answer Agree (4), and 5 students who answer Strongly Agree (5).
So, to calculate the total score of item 3 was used the following
formula:
Total Score = students answer scale x score of questionnaire
Based on the formula above, the researcher find the following
results.
Table 4.41 Total Score of Item 3
Answer Scale Students Answer Scale x
Score of Questionnaire Result
Disagree 2 x 2 4
Netral 8 x 3 24
Agree 15 x 4 60
Strongly Agree 5 x 5 25
Total Score 113
Furthermore, it was determined in the form of a presentation
with the following calculation:

66
Score = (Total Score : (5 x N)) x 100
= (113 : (5 x 30)) x 100
= (113 : 150) x 100
= 0.75 x 100
Score = 75%
So, it can be concluded that from the calculation results obtained
percentage score 75%. So if it is included in the percentage category,
item 3 was included in the strong category.
Table 4.42 the Questionnaire Result of Item 4
Frequency Percent Valid
Percent
Cumulative
Percent
Valid
Strongly Disagree 1 3.3 3.3 3.3
Disagree 8 26.7 26.7 30.0
Netral 8 26.7 26.7 56.7
Agree 10 33.3 33.3 90.0
Strongly Agree 3 10.0 10.0 100.0
Total 30 100.0 100.0
Based on the table 4.42 above, there were a student who answer
Strongly Disagree (1), 8 students answer Disagree (2), 8 students
answer Netral (3), 10 students answer Agree (4), and 3 students who
answer Strongly Agree (5). So, to calculate the total score of item 4
was used the following formula:
Total Score = students answer scale x score of questionnaire
Based on the formula above, the researcher find the following
results.

67
Table 4.43 Total Score of Item 4
Answer Scale Students Answer Scale x
Score of Questionnaire Result
Strongly Disagree 1 x 1 1
Disagree 8 x 2 16
Netral 8 x 3 24
Agree 10 x 4 40
Strongly Agree 3 x 5 15
Total Score 96
Furthermore, it was determined in the form of a presentation
with the following calculation:
Score = (Total Score : (5 x N)) x 100
= (96 : (5 x 30)) x 100
= (96 : 150) x 100
= 0.64 x 100
Score = 64%
So, it can be concluded that from the calculation results obtained
percentage score 64%. So if it is included in the percentage category,
item 4 was included in the strong category.
Table 4.44 the Questionnaire Result of Item 5
Frequency Percent Valid
Percent
Cumulative
Percent
Valid
Strongly Disagree 2 6.7 6.7 6.7
Disagree 10 33.3 33.3 40.0
Netral 5 16.7 16.7 56.7
Agree 11 36.7 36.7 93.3
Strongly Agree 2 6.7 6.7 100.0
Total 30 100.0 100.0

68
Based on the table 4.44 above, there were 2 students who
answer Strongly Disagree (1), 10 students answer Disagree (2), 5
students answer Netral (3), 11 students answer Agree (4), and 2
students who answer Strongly Agree (5). So, to calculate the total
score of item 5 was used the following formula:
Total Score = students answer scale x score of questionnaire
Based on the formula above, the researcher find the following
results.
Table 4.45 Total Score of Item 5
Answer Scale Students Answer Scale x
Score of Questionnaire Result
Strongly Disagree 2 x 1 2
Disagree 10 x 2 20
Netral 5 x 3 15
Agree 11 x 4 44
Strongly Agree 2 x 5 10
Total Score 91
Furthermore, it was determined in the form of a presentation
with the following calculation:
Score = (Total Score : (5 x N)) x 100
= (91 : (5 x 30)) x 100
= (91 : 150) x 100
= 0.61 x 100
Score = 61%

69
So, it can be concluded that from the calculation results obtained
percentage score 61%. So if it is included in the percentage category,
item 5 was included in the strong category.
Table 4.46 the Questionnaire Result of Item 6
Frequency Percent Valid
Percent
Cumulative
Percent
Valid
Strongly Disagree 3 10.0 10.0 10.0
Disagree 3 10.0 10.0 20.0
Netral 6 20.0 20.0 40.0
Agree 16 53.3 53.3 93.3
Strongly Agree 2 6.7 6.7 100.0
Total 30 100.0 100.0
Based on the table 4.46 above, there were 3 students who
answer Strongly Disagree (1), 3 students answer Disagree (2), 6
students answer Netral (3), 16 students answer Agree (4), and 2
students who answer Strongly Agree (5). So, to calculate the total
score of item 6 was used the following formula:
Total Score = students answer scale x score of questionnaire
Based on the formula above, the researcher find the following
results.
Table 4.47 Total Score of Item 6
Answer Scale Students Answer Scale x
Score of Questionnaire Result
Strongly Disagree 3 x 1 3
Disagree 3 x 2 6
Netral 6 x 3 18
Agree 16 x 4 64
Strongly Agree 2 x 5 10
Total Score 101

70
Furthermore, it was determined in the form of a presentation
with the following calculation:
Score = (Total Score : (5 x N)) x 100
= (101 : (5 x 30)) x 100
= (101 : 150) x 100
= 0.67 x 100
Score = 67%
So, it can be concluded that from the calculation results obtained
percentage score 67%. So if it is included in the percentage category,
item 6 was included in the strong category.
Table 4.48 the Questionnaire Result of Item 7
Frequency Percent Valid
Percent
Cumulative
Percent
Valid
Disagree 6 20.0 20.0 20.0
Netral 7 23.3 23.3 43.3
Agree 14 46.7 46.7 90.0
Strongly Agree 3 10.0 10.0 100.0
Total 30 100.0 100.0
Based on the table 4.48 above, there were 6 students who
answer Disagree (2), 7 students answer Netral (3), 14 students
answer Agree (4), and 3 students who answer Strongly Agree (5).
So, to calculate the total score of item 7 was used the following
formula:
Total Score = students answer scale x score of questionnaire
Based on the formula above, the researcher find the following
results.

71
Table 4.49 Total Score of Item 7
Answer Scale Students Answer Scale x
Score of Questionnaire Result
Disagree 6 x 2 12
Netral 7 x 3 21
Agree 14 x 4 56
Strongly Agree 3 x 5 15
Total Score 104
Furthermore, it was determined in the form of a presentation
with the following calculation:
Score = (Total Score : (5 x N)) x 100
= (104 : (5 x 30)) x 100
= (104 : 150) x 100
= 0.69 x 100
Score = 69%
So, it can be concluded that from the calculation results obtained
percentage score 69%. So if it is included in the percentage category,
item 7 was included in the strong category.
Table 4.50 the Questionnaire Result of Item 8
Frequency Percent Valid
Percent
Cumulative
Percent
Valid
Strongly Disagree 3 10.0 10.0 10.0
Disagree 5 16.7 16.7 26.7
Netral 10 33.3 33.3 60.0
Agree 8 26.7 26.7 86.7
Strongly Agree 4 13.3 13.3 100.0
Total 30 100.0 100.0

72
Based on the table 4.50 above, there were 3 students who
answer Strongly Disagree (1), 5 students answer Disagree (2), 10
students answer Netral (3), 8 students answer Agree (4), and 4
students who answer Strongly Agree (5). So, to calculate the total
score of item 8 was used the following formula:
Total Score = students answer scale x score of questionnaire
Based on the formula above, the researcher find the following
results.
Table 4.51 Total Score of Item 8
Answer Scale Students Answer Scale x
Score of Questionnaire Result
Strongly Disagree 3 x 1 3
Disagree 5 x 2 10
Netral 10 x 3 30
Agree 8 x 4 32
Strongly Agree 4 x 5 20
Total Score 95
Furthermore, it was determined in the form of a presentation
with the following calculation:
Score = (Total Score : (5 x N)) x 100
= (95 : (5 x 30)) x 100
= (95 : 150) x 100
= 0.63 x 100
Score = 63%

73
So, it can be concluded that from the calculation results obtained
percentage score 63%. So if it is included in the percentage category,
item 8 was included in the strong category.
Table 4.52 the Questionnaire Result of Item 9
Frequency Percent Valid
Percent
Cumulative
Percent
Valid
Strongly Disagree 5 16.7 16.7 16.7
Disagree 3 10.0 10.0 26.7
Netral 11 36.7 36.7 63.3
Agree 4 13.3 13.3 76.7
Strongly Agree 7 23.3 23.3 100.0
Total 30 100.0 100.0
Based on the table 4.52 above, there were 5 students who
answer Strongly Disagree (1), 3 students answer Disagree (2), 11
students answer Netral (3), 4 students answer Agree (4), and 7
students who answer Strongly Agree (5). So, to calculate the total
score of item 9 was used the following formula:
Total Score = students answer scale x score of questionnaire
Based on the formula above, the researcher find the following
results.
Table 4.53 Total Score of Item 9
Answer Scale Students Answer Scale x
Score of Questionnaire Result
Strongly Disagree 5 x 1 5
Disagree 3 x 2 6
Netral 11 x 3 33
Agree 4 x 4 16
Strongly Agree 7 x 5 35
Total Score 95

74
Furthermore, it was determined in the form of a presentation
with the following calculation:
Score = (Total Score : (5 x N)) x 100
= (95 : (5 x 30)) x 100
= (95 : 150) x 100
= 0.63 x 100
Score = 63%
So, it can be concluded that from the calculation results obtained
percentage score 63%. So if it is included in the percentage category,
item 9 was included in the strong category.
Table 4.54 the Questionnaire Result of Item 10
Frequency Percent Valid
Percent
Cumulative
Percent
Valid
Strongly Disagree 4 13.3 13.3 13.3
Disagree 9 30.0 30.0 43.3
Netral 7 23.3 23.3 66.7
Agree 7 23.3 23.3 90.0
Strongly Agree 3 10.0 10.0 100.0
Total 30 100.0 100.0
Based on the table 4.54 above, there were 4 students who
answer Strongly Disagree (1), 9 students answer Disagree (2), 7
students answer Netral (3), 7 students answer Agree (4), and 3
students who answer Strongly Agree (5). So, to calculate the total
score of item 10 was used the following formula:
Total Score = students answer scale x score of questionnaire

75
Based on the formula above, the researcher find the following
results.
Table 4.55 Total Score of Item 10
Answer Scale Students Answer Scale x
Score of Questionnaire Result
Strongly Disagree 4 x 1 4
Disagree 9 x 2 18
Netral 7 x 3 21
Agree 7 x 4 28
Strongly Agree 3 x 5 15
Total Score 86
Furthermore, it was determined in the form of a presentation
with the following calculation:
Score = (Total Score : (5 x N)) x 100
= (86 : (5 x 30)) x 100
= (86 : 150) x 100
= 0.57 x 100
Score = 57%
So, it can be concluded that from the calculation results obtained
percentage score 57%. So if it is included in the percentage category,
item 10 was included in the moderately category.
Table 4.56 the Questionnaire Result of Item 11
Frequency Percent Valid
Percent
Cumulative
Percent
Valid
Strongly Disagree 7 23.3 23.3 23.3
Disagree 6 20.0 20.0 43.3
Netral 8 26.7 26.7 70.0
Agree 5 16.7 16.7 86.7
Strongly Agree 4 13.3 13.3 100.0
Total 30 100.0 100.0

76
Based on the table 4.56 above, there were 7 students who
answer Strongly Disagree (1), 6 students answer Disagree (2), 8
students answer Netral (3), 54 students answer Agree (4), and 4
students who answer Strongly Agree (5). So, to calculate the total
score of item 11 was used the following formula:
Total Score = students answer scale x score of questionnaire
Based on the formula above, the researcher find the following
results.
Table 4.57 Total Score of Item 11
Answer Scale Students Answer Scale x
Score of Questionnaire Result
Strongly Disagree 7 x 1 7
Disagree 6 x 2 12
Netral 8 x 3 24
Agree 5 x 4 20
Strongly Agree 4 x 5 20
Total Score 83
Furthermore, it was determined in the form of a presentation
with the following calculation:
Score = (Total Score : (5 x N)) x 100
= (83 : (5 x 30)) x 100
= (863 : 150) x 100
= 0.55 x 100
Score = 55%

77
So, it can be concluded that from the calculation results obtained
percentage score 55%. So if it is included in the percentage category,
item 11 was included in the moderately category.
Table 4.58 the Questionnaire Result of Item 12
Frequency Percent Valid
Percent
Cumulative
Percent
Valid
Strongly Disagree 3 10.0 10.0 10.0
Disagree 10 33.3 33.3 43.3
Netral 8 26.7 26.7 70.0
Agree 6 20.0 20.0 90.0
Strongly Agree 3 10.0 10.0 100.0
Total 30 100.0 100.0
Based on the table 4.58 above, there were 3 students who
answer Strongly Disagree (1), 10 students answer Disagree (2), 8
students answer Netral (3), 6 students answer Agree (4), and 3
students who answer Strongly Agree (5). So, to calculate the total
score of item 12 was used the following formula:
Total Score = students answer scale x score of questionnaire
Based on the formula above, the researcher find the following
results.
Table 4.59 Total Score of Item 12
Answer Scale Students Answer Scale x
Score of Questionnaire Result
Strongly Disagree 3 x 1 3
Disagree 10 x 2 20
Netral 8 x 3 24
Agree 6 x 4 24
Strongly Agree 3 x 5 15
Total Score 86

78
Furthermore, it was determined in the form of a presentation
with the following calculation:
Score = (Total Score : (5 x N)) x 100
= (86 : (5 x 30)) x 100
= (86 : 150) x 100
= 0.57 x 100
Score = 57%
So, it can be concluded that from the calculation results obtained
percentage score 57%. So if it is included in the percentage category,
item 12 was included in the moderately category.
Table 4.60 the Questionnaire Result of Item 13
Frequency Percent Valid
Percent
Cumulative
Percent
Valid
Strongly Disagree 5 16.7 16.7 16.7
Disagree 6 20.0 20.0 36.7
Netral 6 20.0 20.0 56.7
Agree 7 23.3 23.3 80.0
Strongly Agree 6 20.0 20.0 100.0
Total 30 100.0 100.0
Based on the table 4.60 above, there were 5 students who
answer Strongly Disagree (1), 6 students answer Disagree (2), 6
students answer Netral (3), 7 students answer Agree (4), and 6
students who answer Strongly Agree (5). So, to calculate the total
score of item 13 was used the following formula:
Total Score = students answer scale x score of questionnaire

79
Based on the formula above, the researcher find the following
results.
Table 4.61 Total Score of Item 13
Answer Scale Students Answer Scale x
Score of Questionnaire Result
Strongly Disagree 5 x 1 5
Disagree 6 x 2 12
Netral 6 x 3 18
Agree 7 x 4 28
Strongly Agree 6 x 5 30
Total Score 93
Furthermore, it was determined in the form of a presentation
with the following calculation:
Score = (Total Score : (5 x N)) x 100
= (93 : (5 x 30)) x 100
= (93 : 150) x 100
= 0.62 x 100
Score = 62%
So, it can be concluded that from the calculation results obtained
percentage score 62%. So if it is included in the percentage category,
item 13 was included in the strong category.
Furthermore, the result of reading motivation of control class
were presented in the following table:

80
Table 4.62 the Result of Reading Motivation of Control Class
No Code Score of
Item Percent Category
1 Item 1 95 63% Strong
2 Item 2 101 67% Strong
3 Item 3 113 75% Strong
4 Item 4 96 64% Strong
5 Item 5 92 61% Strong
6 Item 6 101 67% Strong
7 Item 7 104 69% Strong
8 Item 8 95 63% Strong
9 Item 9 95 63% Strong
10 Item 10 86 57% Moderately
11 Item 11 83 55% Moderately
12 Item 12 86 57% Moderately
13 Item 13 93 62% Strong
Sum 1.240 823%
Highest 113 75%
Lowest 83 55%
Mean 95.38 63%
Based on the data above, it can be seen that the total of students‟
reading motivation score was 1.240, the highest score was 113 and
the lowest score was 83, while mean was 95.38.
Then, it was revealed that from the five category of reading
motivation were not all perceived by the students, but moderately
category and strong category only.

81
B. Research Findings
1. Testing Normality and Homogeneity
a. Testing of Data Normality
The normality test was used to know the data that was going to
analyze whether both groups have normal distribution or not. The
normality test used SPSS 20 to measure the normality of the data.
To know the normality of data, the formula can be seen as
follows:
If the number of sample > 50 = Kolmogorov-Smirnov
If the number of sample < 50 = Shapiro –Wilk
The researcher's number of the data was 60> 50, so to analyzed
normality data the researcher used Kolmogorov-Smirnov. The next
step, the researcher analyzed normality of data by using formula as
follows:
If significance > 0.05 = data is normal distribution
If significance < 0.05 = data is not normal significance
Table 4.63Normality Distribution Test on the Pre-test Score of
the Experiment Class and Control Class Using SPSS 20
Tests of Normality
Experiment Class and
Control Class
Kolmogorov-
Smirnova
Shapiro-Wilk
Statistic df Sig. Statistic df Sig.
Pre-test
Score
Experiment
Class .307 30 .000 .860 30 .001
Control Class .134 30 .182 .931 30 .051
a. Lilliefors Significance Correction

82
Based on the Test of Normality output, the significance value
for experiment class was 0.000, while the significance value for
control class was 0.182. It can concluded the data for experiment
class was not normal significance because the significance value was
lower than 0.05.while, the control class was normally distributed,
because the significance value was greater than 0.05.
Table 4.64Normality Distribution Test on the Post-test Score of
the Experiment Class and Control Class Using SPSS 20
Tests of Normality
Experiment Class and
Control Class
Kolmogorov-
Smirnova
Shapiro-Wilk
Statistic df Sig. Statistic df Sig.
Post-test
Score
Experiment
Class .197 30 .005 .870 30 .002
Control Class .280 30 .000 .920 30 .027
a. Lilliefors Significance Correction
Based on the Test of Normality output, the significance value
for experiment class was 0.005, while the significance value for
control class was 0.000. It can concluded the data for experiment
class and control class was not normally distributed, because the
significance value was lower than 0.05.
In addition, the researcher also calculated the normality test
from the students‟ reading motivation questionnaire with the
following results.

83
Table 4.65 Normality Distribution Test on the Students’ Reading
Motivation Questionnaire Test Using SPSS 20
Tests of Normality
Experiment Class and
Control Class
Kolmogorov-
Smirnova
Shapiro-Wilk
Statistic df Sig. Statistic df Sig.
Question
naire
Experiment
Class .213 30 .001 .807 30 .000
Control Class .145 30 .106 .951 30 .178
a. Lilliefors Significance Correction
Based on the Test of Normality output, the significance value
for experiment class was 0.001, while the significance value for
control class was 0.106.It can concluded the data for experiment
class was not normal significance because the significance value was
lower than 0.05.while, the control class was normally distributed,
because the significance value was greater than 0.05.
b. Testing of Data Homogeneity
The criteria of the homogeneity test, if the value of (probability
value/critical value) was higher than or equal to the level
significance alpha defined (r > a), meaning the distribution was
homogeneity.
Table 4.66Homogeneity Test on the Pre-test Score of the
Experiment Class and Control Class Using SPSS 20
Test of Homogeneity of Variances
Pre-test Score
Levene Statistic df1 df2 Sig.
5.487 1 58 .023

84
Based on the SPSS 20 program output above, the value of
(probably value/critical value) from pre-test of experiment and
control class on homogeneity of variance in sig column was 0.023. It
means that experiment class and control class has not the same
variant or not homogeneous, because the value was lower or r =
0.023< 0.05.
Table 4.67Homogeneity Test on the Post-test Score of the
Experiment Class and Control Class Using SPSS 20
Test of Homogeneity of Variances
Post-test Score
Levene Statistic df1 df2 Sig.
.009 1 58 .926
Based on the SPSS 20 program output above, the value of
(probably value/ critical value) from post-test of experiment and
control class on homogeneity of variance in sig column was 0.926. It
means that experiment class and control class has the same variant or
homogeneous, because the value was higher or r = 0.926> 0.05.
In addition, the researcher also calculated the homogeneity test
from the students‟ reading motivation questionnaire with the
following results.
Table 4.68 Homogeneity Test on the Students’ Reading
Motivation Questionnaire Test Using SPSS 20
Test of Homogeneity of Variances
Questionnaire
Levene Statistic df1 df2 Sig.
19.439 1 58 .002

85
Based on the SPSS 20 program output above, the value of
(probably value/ critical value) from students‟ reading motivation
questionnaire test on homogeneity of variance in sig column was
0.002. It means that experiment class and control class has not the
same variant or not homogeneous, because the value was lower or r
= 0.002< 0.05.
2. Testing Hypothesis
The researcher used One-Way ANOVA to test the hypothesis with
significance level 0.05. The researcher used SPSS 20 program to test the
hypothesis using One-Way ANOVA.
The result of post-test experiment and control class, and result of
reading motivation of experiment class were presented in the following
descriptive table:
Table 4.69Resultof Post-test Experiment and Control Class, and
Result of Reading Motivation of Experiment Class Using SPSS 20
Descriptives
Score of Reading Test and Questionnaire Test
N Mean Std.
Deviation
Std.
Error
95% Confidence
Interval for
Mean Mini
mum
Maxi
mum Lower
Bound
Upper
Bound
Post-test
Exp. 30 66.23 12.082 2.206 61.72 70.74 53 87
Post-test
Con. 30 52.47 15.986 2.919 46.50 58.44 13 87
Reading
Motivation
of Exp.
30 40.30 2.781 0.508 39.26 41.34 37 49
Total 90 53.00 15.712 1.656 49.71 56.29 13 87

86
The table showed the result ofstandard deviation calculation of
experiment class on reading comprehension test was12.082, the result of
standard error of mean calculation was 2.206, and the result of mean was
66.23. Then, the result of standard deviation calculation of control class
on reading comprehension testwas 15.986, the result of standard error of
mean was 2.919, and the result of mean was 52.47.On the other hand, the
result of standard deviation of experiment class on reading motivation
test was 2.781, the result of standard error of mean was 0.508, and the
result of mean was 40.30.
In addition, the following table was the result of one-way ANOVA
calculations.
Table 4.70the Resultof Post-test Experiment and Control Class, and
Result of Reading Motivation of Experiment Class with One-Way
ANOVA Using SPSS 20
ANOVA
Post-test Score
Sum of
Squares df
Mean
Square F Sig.
Between
Groups 10100.867 2 5050.433 37.019 .000
Within Groups 11869.133 87 136.427
Total 21970.000 89
The criteria of Ho is accepted when Fvalue, <Ftable, and Ho is rejected
when Fvalue, >Ftable. Then, the criteria of Ha is accepted when Fvalue, >Ftable,
and Ha is rejected when Fvalue, <Ftable.
The table showed the result of one-way ANOVA calculation using
SPSS 20. The table is the main table from the analysis of One-Way

87
ANOVA. It found that Degree of Freedom between group (DFb) = 2 and
Degree of Freedom within group (DFw) = 87 (Ftable = 3.10), and also
Fvalue was 37.019. It showed that Fvalue was higher than Ftable
(37.019>3.10). So, Ho was rejected and Ha was accepted. There was
significant differences among groups after doing treatment, with Fvalue =
37.019 and the significant level was lower than alpha (0.000 < 0.05). It's
mean that grammar translation method has significant effect in students‟
reading comprehension and reading motivation.
Knowing that there was a significant difference among groups after
doing treatment, the researcher needed to test the hypotheses. Because
One-Way ANOVA was only to know that there was significant
differences among groups, not for know where the differences among
groups. To answer problems of the study and hypotheses test, the
researcher applied Post Hoc Tests.
Hypothesis test using SPSS 20 program by applying Post Hoc Tests
from the result of post-test experiment and control class, and the result of
reading motivation of experimental class were presented in the following
table:
Table 4.71 the Calculation of Post Hoc Tests Using SPSS 20
Multiple Comparisons
Dependent Variable: Score of Reading Test and Questionnaire Test
(I) Class (J) Class
Mean
Difference
(I-J)
Std.
Error Sig.
95% Confidence
Interval
Lower
Bound
Upper
Bound
Post-test Exp. Post-test Con. 13.767
* 3.659 .001 4.95 22.58
Reading Motivation of Exp. 25.933* 2.264 .000 20.37 31.50

88
Post-test Con. Post-test Exp. -13.767
* 3.659 .001 -22.58 -4.95
Reading Motivation of Exp. 12.167* 2.963 .001 4.87 19.46
Reading Motivation
of Exp.
Post-test Exp. -25.933* 2.264 .000 -31.50 -20.37
Post-test Con. -12.167* 2.963 .001 -19.46 -4.87
*. The mean difference is significant at the 0.05 level.
The criteria of Ho is accepted when the significant value is higher
than alpha (α) (0.05), and Ho is refused when the significant value is
lower than alpha(α) (0.05).So, based on the calculation of Post Hoc Tests
above used SPSS 20 program, it can concluded that:
First, the experiment class of reading comprehension show the
significant value was lower than alpha (0.001 < 0.05). It meant that, there
was a significant effect of Grammar Translation Method (GTM) toward
students‟ reading comprehension. Thus, Ha state that grammar translation
method has effect in students‟ comprehension on reading at the first
grade of SMAN 4 Palangka Raya was accepted and Ho state that
grammar translation method has no effect toward students‟
comprehension on reading due the process take too long at the first grade
of SMAN 4 Palangka Raya was rejected.
Second, reading motivation of experiment class showed the
significant value was lower than alpha (0.000 < 0.05). It meant that, there
was a significant effect of Grammar Translation Method (GTM) toward
students‟ reading motivation. Therefore, Ha state thatgrammar translation
method has significant effect in students‟ reading motivation on reading
at the firstgrade of SMAN 4 Palangka Raya was accepted and Ho state
thatgrammar translation method has no effect toward students‟

89
motivation on reading due the process take too long at the first grade of
SMAN 4 Palangka Raya was rejected.
Third, the significant effect of experiment class by using Grammar
Translation Method (GTM) toward reading comprehension and reading
motivation of students showed the significant value was lower than alpha
(0.000 < 0.05). It meant that, there were significant effect of Grammar
Translation Method (GTM) towards reading comprehension and reading
motivation. While, Ha state that grammar translation method has
significant effect in students‟ comprehension and their motivation on
reading at the first grade of SMAN 4 Palangka Raya was accepted and Ho
state that grammar translation method has no effect toward students‟
comprehension and their motivation on reading due the process take too
long at the first grade of SMAN 4 Palangka Raya.
3. Interpretation of the Results
Based on the result of calculation with One-Way ANOVA using
SPSS 20 program, the researcher interpreted that:
Teaching using Grammar Translation Method (GTM) was more
effective toward students‟ reading comprehension than teaching without
using Grammar Translation Method (GTM). It was showed in the result
of significant value that was lower than alpha (0.001 < 0.05).
Teaching using Grammar Translation Method (GTM) was more
effective toward students‟ reading motivation than teaching without

90
using Grammar Translation Method (GTM). It was showed in the result
of significant value that was lower than alpha (0.000 < 0.05).
Teaching using Grammar Translation Method (GTM) was more
effective toward students‟ reading comprehension and reading motivation
than teaching without using Grammar Translation Method (GTM). It was
showed in the result of significant value that was lower than alpha
(0.000< 0.05).
C. Discussion
The difference between this research with last research are on field of
study where the last research mostly take junior high school when this
research take senior high school and also the research instrument where the
last research on focusing on effect of GTM toward students reading
comprehension only meanwhile this research focus on two subject which is
students reading comprehension and reading motivation.

91
CHAPTER V
CONCLUSION AND SUGGESTION
This chapter discusses the conclusion and suggestion of the study. The
researcher explains the conclusion of the study and some suggestion for the future
researcher.
A. Conclusion
Based on the calculation using SPSS 20 program with One-Way
ANOVA, the result of this research showed that it found that Degree of
Freedom between group (DFb) = 2 and Degree of Freedom within group
(DFw) = 87 (Ftable = 3.10), and also Fvalue was 37.019. It showed that Fvalue
was higher than Ftable (37.019 >3.10). So, Ho was rejected and Ha was
accepted. It meant that, Grammar Translation Method (GTM) has significant
effect in students‟ reading comprehension and reading motivation.
B. Suggestion
For a better understanding of this research, it is highly suggested that:
1. For Students
The researcher suggested to all of students of SMAN 4 Palangka
Raya to keep and more doing the reading outside the class, because
reading is very important and based on this research the better students‟
reading it will increase their reading comprehension. Try to do the
reading every day even just a little time. The researcher also suggested to
students keep practice using this method.

92
2. For Teacher
The researcher suggested to teacher in SMAN 4 Palangka Raya
English Program could guide and encourage the students to do the
reading and keep practicing the reading fluency.
3. For Researcher
The researcher are suggested to analyze not only the effect of GTM
toward students understandingand reading motivation, but also the
factors that could affect both variable. If the future researcher want to
conduct the same research it could be better if the future research have a
larger sample.

93
REFERENCES
Applegate, A. J., & Applegate, M. D. (2010). A study of thoughtful literacy and the
motivation to read. Reading Teacher, 64(4), 226-234. doi:10.1598/RT.64.4.1
Bennette, Joseph, ACourse in Light Speed Reading,(Fifth Edition, USA, 2001), p. 23
Bordens, K. S., & Abbott, B. B. (2011). Research Design and Methods: A Process
Approach, Eighth Edition. New York: The McGraw-Hill Companies, Inc.
Chand Sharma, Tara, Modern Methods of Universtity and College Teaching, (First
Edition, New Delhi, Sarup & Sons, 2001), p. 247
Coddington, C. S., & Guthrie, J. T. (2009). Teacher and student perceptions of boys’
and girls’reading motivation. Reading Psychology, 30, 225-249.
Creswell, John W (2014), Reasearch Design Qualitative, Quantitative, and Mixed
Methods Approaches, Pustaka Pelajar, ISBN-13: 978-1-4522-2610-1
Creswell, John W (2014). Research design : qualitative, quantitative, and mixed
methods approaches. Singapore: SAGE Publications Asia-Pacific Pte. Ltd.
Fatmala, Eka, 2012, “The Influence Of The Application Of Grammar Translation
Method (GTM) On The Students’ Understanding In Reading Comprehension
At The First Year Students Of Mts Wathoniyah Gintung Lor – Cirebon”,
Thesis FTIK, English Education Department, Syekh Nurjati State Institute,
Cirebon
Freeman, Diane Larsen and Marti Anderson (2011), Techniques & Principles in
Language Teaching, (Third Edition, Oxford University Press, 2011)

94
Ftik iain Palangka Raya, Pedoman Penulisan Skripsi, IAIN Palangka Raya, February,
2017
Gambrell, L. B. (2011). Motivation in the school reading curriculum. Journal of
Reading Education, 37(1), 5-14.
Legge GE, Mansfield JS, Chung ST (2001). "Psychophysics of reading. XX. Linking
letter recognition to reading speed in central and peripheral vision". Vision
Research. 41 (6): 725–43.
Mcdaniel, R. (1970, June 10). Motivating Students. Retrieved April 21, 2017,
McGeown, S., Goodwin, H., Henderson, N., & Wright, P. (2012). Gender differences in
reading motivation: Does sex or gender identity provide a better account?
Journal of Research in Reading, 35(3), 328-336. doi:10.111/j.1467-
9817.2010.01481.x
Megawati, 2017, “The Improving Students’ Reading Comprehension Through Grammar
Translation Method”, Thesis, STKIP, English Education Department,
Kusumanegara, Jakarta
Mortimer, J,A and Charles van doran How to read a book: the classic to inteligent
reading(revised edition)
Patricia, Meyer Spacks (2011). On Rereading, Harvard University Press. ISBN 978-0-
674-06222-1
Serravallo, Jennifer, Teaching Reading in Small Group, (USA, Heinemann, 2010), p. 43
Teacher Practices that Impact Reading Motivation. (2017, April 13).
Retrieved April 21, 2017,

95
Westwood, Peter, What Teachers Need to Know about Reading and writing Difficulties,
(FirstEdition, Australia, Acer Press, 2008), p. 32