THE EFFECT OF ENFORCEMENT MEASURES ON VALUE ADDED …
69
THE EFFECT OF ENFORCEMENT MEASURES ON VALUE ADDED TAX REVENUE FOR FIRMS IN THE LARGE CORPORATE TAXPAYER CATEGORY IN KENYA SAMUEL KAMIRI NDUMIA D63/64403/2013 A RESEARCH PROJECT SUBMITTED IN PARTIAL FULFILLMENT OF THE REQUIREMENTS FOR THE AWARD OF THE DEGREE OF MASTER OF SCIENCE IN FINANCE, SCHOOL OF BUSINESS, UNIVERSITY OF NAIROBI OCTOBER 2015
Transcript of THE EFFECT OF ENFORCEMENT MEASURES ON VALUE ADDED …

THE EFFECT OF ENFORCEMENT MEASURES ON
VALUE ADDED TAX REVENUE FOR FIRMS IN
THE LARGE CORPORATE TAXPAYER
CATEGORY IN KENYA
SAMUEL KAMIRI NDUMIA
D63/64403/2013
A RESEARCH PROJECT SUBMITTED IN PARTIAL
FULFILLMENT OF THE REQUIREMENTS FOR THE AWARD
OF THE DEGREE OF MASTER OF SCIENCE IN FINANCE,
SCHOOL OF BUSINESS, UNIVERSITY OF NAIROBI
OCTOBER 2015

ii
DECLARATION
This research project is my original work and has not been submitted for a degree in
any other university
Sign: …………………………….. Date: ……………………………
Samuel Kamiri Ndumia
D63/64403/2013
This research project has been submitted for examination with my approval as a
university supervisor.
Sign:……………………………………. Date:………………………………….
Dr. Mirie Mwangi
Senior Lecturer, Department of Finance and Accounting
School of Business
University of Nairobi

iii
ACKNOWLEDGEMENT
I would like to thank the people who gave me continuous support, encouragement
and guidance throughout the period of writing this research project. First, I thank my
project supervisor, Dr Mirie Mwangi for his valuable guidance and advice. His
motivation and guidance contributed tremendously to my project. Deepest gratitude
also goes to the moderator, Dr. Kennedy Okiro for his valuable direction during the
research period.
I am also indebted to Kenya Revenue Authority through the Commissioner, Domestic
Taxes Department for allowing me access and use data for this research work. Special
thanks go to my friends, colleagues and my family for their encouragement and
understanding throughout my study period. Finally and most importantly, I thank God
for granting me the strength and good health that has enabled me to complete this
project.

iv
DEDICATION
This project is dedicated to my dear mother Lillian Ndumia for her encouragement
during my entire study period. My brothers Edward and Stanley and sister Anne
Ndumia for their continued support and encouragement throughout the process.

v
TABLE OF CONTENTS
DECLARATION......................................................................................................... ii
ACKNOWLEDGEMENT ......................................................................................... iii
DEDICATION............................................................................................................ iv
LIST OF TABLES .................................................................................................... vii
LIST OF ABBREVIATIONS ................................................................................. viii
ABSTRACT ................................................................................................................ ix
CHAPTER ONE: INTRODUCTION ........................................................................1
1.1 Background of the Study .........................................................................................1
1.1.1 Enforcement Measures..............................................................................3
1.1.2 Value Added Tax Revenue .......................................................................5
1.1.4 Enforcement Measures and Value Added Tax Revenue ..........................7
1.1.4 Firms in the Large Corporate Taxpayer Category in Kenya.....................9
1.2 Research Problem ..................................................................................................11
1.3 Research Objectives ...............................................................................................14
1.4 Value of the Study .................................................................................................15
CHAPTER TWO: LITERATURE REVIEW .........................................................16
2.1 Introduction ............................................................................................................16
2.2 Theoretical Review ................................................................................................16
2.2.1 Economic Utility/Deterrence Theory ......................................................16
2.2.2 Prospect Theory of Tax Evasion .............................................................18
2.3 Determinants of Value Added Tax Revenue .........................................................19
2.3.1 Value Added Tax Rate ............................................................................19
2.3.2 Value Added Tax Base ...........................................................................21
2.3.3 Contribution of Imports to VAT revenue ...............................................22
2.4 Empirical Studies ...................................................................................................22
2.5 Summary of Literature Review ..............................................................................27
CHAPTER THREE: RESEARCH METHODOLOGY ........................................29
3.1 Introduction ............................................................................................................29
3.2 Research Design.....................................................................................................29
3.3 Population ..............................................................................................................29

vi
3.4 Sample....................................................................................................................30
3.4.1 Sample Frame ........................................................................................30
3.4.2 Sampling Technique ...............................................................................30
3.5 Data Collection ......................................................................................................30
3.6 Validity and Reliability ..........................................................................................31
3.7 Data Analysis .........................................................................................................31
3.7.1 Analytical Model ....................................................................................31
CHAPTER FOUR: DATA ANALYSIS AND DISCUSSION ................................35
4.1 Introduction ............................................................................................................35
4.2 Descriptive Statistics ..............................................................................................35
4.3 Correlation Analysis ..............................................................................................36
4.4 Regression Analysis ...............................................................................................37
4.5 Discussion of Findings ...........................................................................................39
CHAPTER FIVE: SUMMARY, CONCLUSION AND RECOMMENDATIONS42
5.1 Introduction ............................................................................................................42
5.2 Summary ................................................................................................................42
5.3 Conclusions ............................................................................................................44
5.4 Limitation of the Study ..........................................................................................45
5.5 Recommendations ..................................................................................................45
5.6 Suggestions for further research ............................................................................46
REFERENCES ...........................................................................................................47
APPENDICES ............................................................................................................54
APPENDIX I: VAT rates in Kenya 1989-2004 .........................................................55
APPENDIX II: VAT Revenue from Enfrocement Measures ....................................56
APPENDIX III: Summary of GDP & VAT in billions of Kenya Shillings...............59
APPENDIX IV: VAT contribution to GDP; contribution of VAT from audit, penaties,
criminal santions & imports to VAT revenue ..................................................………60
APPENDIX V: Letter of Introduction to collect Data…………………………...…61
APPENDIX VI: Data Collection Form………………………………………….......62

vii
LIST OF TABLES
Table 4.1 Descriptive Statistics of Variables. ..............................................................35
Table 4.2 Correlation Analysis ....................................................................................36
Table 4.3 Model Summary ..........................................................................................37
Table 4.4 ANOVAb ......................................................................................................37
Table 4.5 Regression Coefficients ..............................................................................38

viii
LIST OF ABBREVIATIONS
ATO - Australian Taxation Office
CBK - Central Bank of Kenya
DTD – Domestic Taxes Department
EU - Expected Utility
GDP – Gross Domestic Product
HMRC - Her Majesty’s Revenue and Custom
IRS - Internal Revenue Service
KIPPRA - Kenya Institute of Public Policy Research and Analysis
KNBS - Kenya National Bureau of Statistics
KRA – Kenya Revenue Authority
LTO - Large Taxpayer Office
MST – Medium and Small Taxpayers
MTO – Medium Taxpayers’ Office
OECD – Organization for Economic Co-operation and Development
PAYE – Pay As You Earn
RTD – Road Transport Department
TR&MP – Tax Reform and Modernization Program
VAT – Value Added Tax
WHVAT – Withholding VAT

ix
ABSTRACT
A stable Revenue collection helps promote and strengthen a country’s revenue
collection targets. This helps countries meet their expenditure within a certain
financial period. The Kenya Revenue Authority is tasked with this very important
duty. Considering its basic function which is to collect and administer tax system in
the country, it has to ensure that it has put in place the right measures to attain this
goal .The purpose of this study was to establish the effect of enforcement measures
on Value Added Tax revenue for firms in the large corporate taxpayer category in
Kenya. The total population consisted of all 1052 large firms operating in Kenya as
categorized by KRA. Since the population of the study was large, sampling was
necessary .The sample size consisted of 106 firms in the Large Taxpayers’ Office.
The study used secondary data which was readily available from the Kenya Revenue
Authority and the Kenya National Bureau of Statistics. The study adopted a
descriptive survey of the firms in the large taxpayer category. It has been thought
strong tax enforcement measures on the VAT revenue for firms can contribute
significantly to the attainment of the goal of revenue collection Secondary data was
collected from KRA annual reports on VAT revenue from 2008 to 2014. Regression
analysis was conducted in order to establish the effect of enforcement measures on
Value Added Tax revenue for firms in the large corporate taxpayer category in Kenya
The dependent variable of the study was the VAT revenue. It is a proportion of the
contribution of VAT revenue to the GDP. The enforcement measures; audit rate,
penalties and criminal sanctions were the independent variables of the study. The
findings from the study showed that enforcement measures such as audit rate,
imposition of penalties, criminal sanctions and another determinant of VAT revenue;
the contribution of imports to VAT revenue, had varying degrees of relationship to
the Value Added Tax revenue for firms in the large corporate taxpayer category. The
study revealed that audit rate, penalties and contribution of imports to VAT revenue
positively influenced Value Added Tax revenue for firms in the large corporate
taxpayer category, whereas criminal sanctions negatively affected Value Added Tax
revenue for these firms. The study recommends that more emphasis should be on
conducting VAT audits by the tax agency and also impose penalties on non-compliant
taxpayers as this will yield to more VAT revenue.

1
CHAPTER ONE
INTRODUCTION
1.1 Background of the Study
Unlike their developed counterparts, most developing countries rely heavily on taxes
to finance their budgetary expenditures. In Kenya, taxation is the single largest source
of government budgetary resources (Moyi & Ronge, 2006). One of the striking
characteristics of Kenya is that unlike many other sub-Saharan countries today, it is a
high tax-yield country with a tax-to-GDP ratio of over 20 per cent (KIPPRA, 2006).
The Kenya Revenue Authority (KRA) is the predominant government revenue
collection agency accounting for over 96% of government ordinary revenue.KRA
administers 17 revenue Acts, with the key ones (in terms of revenue importance)
being Value Added Tax (VAT Cap 476), Income Tax Act (Cap 470), East Africa
Community Customs Management Act (EACCMA), The Customs and Excise Act
(Cap 472) and the Traffic Act Cap 403 (Cherogony, 2013).
Value Added Tax has become the most common consumption tax in the world. It was
first introduced in France in 1954. Its essence is that it is charged at all levels of
production, but with the provision of some mechanism enabling firms to offset the tax
they have paid on their own purchases of goods and services against the tax they
charge on their sales of goods and services. Although this characteristic feature is very
clear cut, the VATs observed in practice show considerable diversity as regards,
among other things, the range of inputs for which tax offsetting is available and the
range of economic activities to which the tax applies, that is, the base of the tax
(Ebrill, Keen, Bodin and Summers, 2001).
VAT was introduced in Kenya in 1990 to replace sales tax which had been in
existence since 1973. Compared with other indirect taxes, VAT has more revenue

2
potential: it is more broad-based and entails a trail of invoices that helps improve tax
compliance and enforcement (Simiyu, 2003).Tax modernization programs under Tax
Reform and Modernization Programs (TR & MP) were initiated in Kenya back in
1986 with the main objective of broadening the government’s revenue base and
regulating the expenditure through strict fiscal controls. This gave birth to the
adoption of VAT system whose aim was to bring in more revenue for the government.
These reforms have continuously been carried out to revamp the growth in revenue
for the government to meet its huge budgetary needs. Despite these programs, VAT
has not been responsive to the changes in reform and has remained very rigid to
changes in GDP. (Kotut & Menjo, 2012).
Value Added Tax, like any other tax, is vulnerable to evasion and fraud, although it
has some distinctive features that make it less vulnerable than other forms of taxation
(Keen & Smith, 2007). Over the last few years however, there has been a marked
increase in losses of VAT revenue through evasion and fraud. For example, in the
European Union (EU), the abolition of internal EU frontiers at the end of 1992 opened
up new areas of vulnerability. In March 2006 the first ever fall of in annual nominal
VAT receipts in the United Kingdom was attributed by some to fraud (Ainsworth,
2006). In Kenya, the poor performance in VAT revenue has been exacerbated by
VAT evasion which has been a major drawback on VAT revenue collection.
The dominant view in research and practice of tax administration is that tax
compliance is largely a function of taxpayers’ rational pursuits of their self- interests.
From this perspective, taxes are costs that taxpayers try to avoid or reduce.
Consequently, taxpayers are likely to evade taxes unless tough measures are taken
that render tax evasion an unattractive option. Therefore it is assumed deterrence is a

3
means of generating compliance (Allingham and Sandmo, 1972, Andreoni, Erard and
Feinstein, 1998).
According to Andreoni et al, (1998), the problem of tax noncompliance is as old as
taxes themselves. Explaining the patterns of noncompliance and finding ways of
tackling the vice is of great concern among many nations in the world. The economics
of tax compliance can be approached from different perspectives: it can be viewed as
a problem of public finance, organizational design, labor supply, law enforcement or
ethics or a combination of these. As a problem of law enforcement, questions about
the deterrent effects on tax enforcement associated with penalties and the probability
of detection are central both to tax compliance and law enforcement.
Tax enforcement measures are measures used for collection and recovery of tax-
related liabilities and other amounts. These measures involve a sequence of related or
unrelated activities on those taxpayers who knowingly evade tax and also extend to
those who might not be aware on their tax liability. Little effort has been expensed to
determine non-compliance in VAT evasion and how enforcement impacts on its
revenue. We therefore undertake to focus on determining the relationship between
these two phenomena and contribute to the already available literature in research.
1.1.1 Enforcement Measures
The main idea behind the economic theory of compliance is that taxpayers will not
pay taxes but for the fear of detection and punishment, (Alm, 1999). To enhance tax
compliance, governments around the world have devised ways to increase tax
revenue. According to Jantscher (1990), these include a range of related activities
such as taxpayer identification and registration, taxpayer service and education,
control of filing and payments, refunds, inspection and enforcement.

4
Tax enforcement measures find their basis on the economic theory model proposed by
Allingham and Sandmo, (1972). In their paper, Allingham and Sandmo model tax
compliance behavior as a utility maximization decision where a taxpayer will
consider the benefit of tax evasion against the probability of getting caught evading
(paying the correct taxes plus interest and penalties).
Enforcement measures vary with their level of effectiveness and they include audits,
imposition of penalties and fines and legal or criminal sanctions. Tax audit is one of
the most effective policies to protect tax evasion behavior. The level of audit can be
determined by two elements: one is how many taxpayers are selected for audit and the
second is how much intensive the audit is. The first element is easily measured by the
number of audited taxpayers divided by the total number of taxpayers. The second
element is difficult to measure and is commonly measured by the first element to
indicate the level of tax audit for practical comparison (Hyun, 2005).
The imposition of fines as an enforcement measure will depend on how the taxpayers
view them. In an antagonistic climate, fines can be a part of the game of “Cops” and
“robbers” while in a synergistic climate; they can be seen as retribution against a
behavior that harms the community (Nicoleta, 2011). The administration of penalties
on non-compliant taxpayers is an enforcement measure towards daunting tax evasion.
Penalties are imposed differently by different tax authorities across the world. Hyun,
(2005) observed that penalty rate on taxpayers that had an intention to evade tax are
higher than those of unintentional evaders.
Criminal sanctions have also been studied as deterrence measures against non-
compliance. Economics model of crime perspective in tax evasion adopts heavily
from criminologist Gary S Becker, (1968) economics of crime model. Becker

5
observed that tax evasion which is synonymous with tax compliance is a top white-
collar crime (ACFE, 2010) and thus this model is appropriate. Becker, (1968)
explained criminal actions from a rational utility maximizing decision-making process
where the criminal weighs the costs and benefits before deciding to commit a crime.
Studies on enforcement strategy as a deterrence measure against non-compliance have
had mixed results. For example, threatening taxpayers in an experiment with cross
examination of their upcoming returns increased tax compliance just for low and
middle income taxpayers, but decreased it for high income taxpayers, while other
experiments report that imprecise information increases compliance, (Slemrod,
Blumenthal and Christian, 2001).A review by Fischer, Wartick and Mirk, (1992)
indicates that audit probabilities also deter tax evasion and augment tax revenue.
However, their review summarizes inconsistent finding on audit probabilities. The
probability that a taxpayer will be audited on filing their returns has an effect on their
compliance.
1.1.2 Value Added Tax Revenue
By mid-2006, around 140 countries had already implemented VAT. The widespread
use of VAT is partly due to its perceived efficiency and effectiveness in raising tax
revenues compared to other indirect taxes. In 1999-2000, the average VAT collected
in countries that have VAT was over 20% of total tax revenue (Bird and Grendron,
2007).
According to Ebrill, et al, (2001), VAT has become a key source of government
revenue. About 4 billion people, 70 percent of the world’s population, now live in
countries with a VAT, and it raises about $18 trillion in tax revenue—roughly one-
quarter of all government revenue. Much of the spread of the VAT, moreover, has
6
taken place over the last 20 years. From having been largely the preserve of more
developed countries in Europe and Latin America, it has become a pivotal component
of the tax systems of both developing and transition economies.
VAT is a tax on consumption which is charged at all stages of production, with the
provision of a mechanism enabling firms to offset the tax they have paid on their own
purchases of goods and services against the tax they charge on their sale of goods and
services. Taxpayers registered for VAT have many tax obligations clustered into;
registration in the system, timely filing and lodgment of requisite taxation
information, accurate and complete reporting of information and timely payment of
VAT (Organisation for Economic Co-operation and Development, 2004).
VAT in Kenya has over the years been underperforming compared to other taxes.
This tax has from fiscal year 2003/04 been stagnant contributing an average of 26% to
the total government revenue (Statistical Annexe to the Budget Speech for Financial
year 2010/11 & 2011/12). The trend has been recurring and has contributed to the
shortfalls in total tax collections by KRA. Many reforms have been carried out on
VAT which has led to numerous amendments in the VAT legislation. Despite this, the
National Treasury indicates that after two decades of reforms, VAT structure has
become complex, inefficient and unproductive, contrary to some of the reasons why
Kenya adopted it in the first place (Director of Economic Affairs, 2012).
The revenue produced by VAT depends on three broad sets of factors: the rules
describing rates, bases, threshold and other structural features of tax; the scale of
taxable activities (the amount of final expenditure, for instance, on items taxable at
standard rate); and the degree to which the rules are complied with, (Ebrill et al,
2001). The interactions between these factors are important. Tax rates, for instance,

7
are typically set in light of tax bases and revenue requirements. The ease of
enforcement will depend on the formal structure of the tax: multiple rates, for
example, may lead to the misclassification of items, and a high standard rate may
encourage evasion.
Noncompliance in VAT is not only a problem in Kenya. It is clear from the few
studies that have been published that VAT evasion is widespread and involves
significant revenue losses, though the extent varies considerably across countries.
Agha and Haughton (1996), summarizes the findings of five countries from five
countries in Europe and two in Asia: their figures suggest that revenue losses vary
from a low 3% (France, United Kingdom) to a high of 40% (Italy). These figures can
go even higher in the sub-Saharan Africa, given that there has been a slow pace in
socio-political development.
1.1.4 Enforcement Measures and Value Added Tax Revenue
An important property of the tax system is to generate automatic growth in fiscal
revenues over time without necessarily resorting to discretionary policy or
inflationary financing (Moyi and Ronge, 2006). The key claim made by advocates of
the VAT is that it is a particularly effective way of raising tax revenue. Cnossen
(1990) for example, argues that ‘purely from a revenue point of view, VAT is
probably the best tax ever invented’. Advocates have also long recognized, of course,
that the VAT, like any other tax, is vulnerable to evasion and fraud, but stress
distinctive features of the VAT that may make it less vulnerable than other forms of
taxation (Keen & Smith, 2007).
Over the last few years, however, there has been a marked increase in concern with
losses of VAT revenue through evasion and fraud. For example, Germany’s current

8
VAT revenue has recently been decreasing in spite of the recent growth in GDP.
While many causes, such as changes in the legal framework and increased accounts of
business failure have been offered to explain this fact, there is significant reason to
believe that tax evasion has been the most detrimental factor contributing to VAT
revenue losses (Dziadkowski, 2002).The European Commission (2004), for example,
reports that losses for fraud- most famously, ‘carousel fraud; - have recently
amounted to 10 per cent of the net VAT receipts in some member states. Tax evasion
generates billions of dollars of losses in government revenue and creates large
distortions, especially in developing countries. The compliance gap in VAT has not
improved since the replacement of sales tax with VAT.
Tax evasion is affected among other things by enforcement policies. Such policies
vary widely across countries. According to OECD (2009), the Australian Taxation
Office (ATO) audits 8% of VAT registrants each year, compared to 20% for Her
Majesty’s Revenue and Custom (HMRC) in the United Kingdom. Also, maximum
sanctions for fraudulent reports differ significantly between these two countries:
penalties may reach 50% of the amount of evaded tax in Australia, against 100% in
the United Kingdom. Although less public data are available, there is also evidence
that tax enforcement varies across economic sectors within a given country.
According to the French Court of Audit (2010), law, finance, insurance, and health
services firms were almost never audited in the Rhône-Alpes-Bourgogne region
between 2003 and 2007.
VAT enforcement measures are imbued in the economic models that have deterrence
effects on VAT non-compliance which in effect raises VAT revenue. The economic
models predict that higher penalties and audit probabilities should discourage non-
compliance. Though both have a deterrence effect, their degree of impact differs with

9
higher audit probabilities probably having more impact than higher penalties
(Andreoni et al, 1998; Hessing, Elffers, Robben and Webley, 1992). The results of
several surveys have indicated that self-reported non-compliers are less likely than
compliers to believe that such acts would result in apprehension and punishment
(Hessing, Elffers & Weigel, 1988).
There has been a considerable amount of research into tax compliance over the last 25
years (Andreoni al, 1998). Many new models of the compliance process have been
devised and there has been a wide range of empirical studies. However, nearly all of
these studies have focused on personal income tax compliance: business tax in general
and VAT compliance has received very little attention (Murray, 1995).
1.1.4 Firms in the Large Corporate Taxpayer Category in Kenya
In most developing countries, the majority of VAT collected is from imports with the
remainder collected from a few large taxpayers which reflects difficulties with
compliance and enforcement experienced in developing countries (Bird, 2005).In
Kenya, firms in the Large Corporate Taxpayer sector or Large Taxpayer’s Office -
LTO are all firms whose threshold in terms of turnover is above KES. 1Billion
annually. LTO was formed as an operations unit in 1998 to provide a one stop shop in
the administration of Income Tax and VAT matters affecting large taxpayers. It
became a fully-fledged department headed by a Commissioner in 2006 with the sole
purpose of administering domestic taxes matters affecting large taxpayers. Firms in
the large taxpayer category are of great significance in tax collection as they
contribute to more than 50% of the total tax revenues yearly (KRA Website).
Companies in the large taxpayer category have several characteristics that make them
complex. According to OECD (2009), these firms are characterized by multiple

10
operating entities, diverse business interest, high volume transactions, large number of
employees, international trade dealings, unique industry characteristics, widely spread
in geographical terms, complex accounting principles and complicated policies and
strategies to minimize tax liabilities. The complexities in large firms make it difficult
for the tax agencies to fully understand their operations. These firms employ abusive
and aggressive tax planning practices that represent a significant compliance
challenge and remain a priority.
Firms in this category are critical in VAT revenue collections. An important aspect is
that these firms are heavy consumers of goods and services that are vatable and are
usually supplied by taxpayers in the other categories i.e. small and medium taxpayers.
There is a general belief that firms in large taxpayer unit have high levels of
compliance as they employ professionals and engage high end advisers on tax
matters. However, OECD (2009) reports that there is a high tendency for tax
malpractices involving fraud and evasion. Firms in this category are multinational
companies that engage in international business dealings with transfer pricing
implications that are complex. Noncompliance among firms in the large taxpayer
category in Kenya cannot be underestimated. A good example is the introduction of
withholding VAT (WHVAT) by KRA in which firms in large taxpayer category were
appointed by the Commissioner of Domestic Taxes as withholding agents to withhold
and remit VAT from their suppliers and enhance VAT revenue. (KRA website).
WHVAT was later scrapped owing to among other reasons, the fact that not all VAT
amount withheld was remitted to KRA’s account at the Central Bank of Kenya (CBK)
which adversely affected the overall VAT revenue performance.
This called for KRA to be aggressive in employing enforcement measures to deter
VAT evasion and other noncompliance issues. VAT audits on these taxpayers have

11
proved essential in increasing their level of compliance with VAT law and raising a
considerable amount of concealed revenue. Furthermore, in the course of conducting
audits to big firms, small and medium taxpayers, who are noncompliant are also
apprehended and forwarded to their respective stations for follow up.
When unpaid VAT is discovered, these firms are compelled by law to pay all the
outstanding VAT plus a fine not exceeding one million shillings or an imprisonment
for a term not exceeding three years or both (VAT, 2013). There are several cases
where KRA has sued some large taxpayers in courts of law. This is as a result of VAT
and other tax evasion by these firms. Where an out of court agreement is not reached,
through tribunal, they end up being sued for fraud and/or evasion and the companies
end up being compelled to pay all the outstanding amount, penalties and fines to the
Authority.
1.2 Research Problem
The goal of tax administration around the world is to raise the prevailing levels of
voluntary compliance significantly and permanently (Macharia, 2012). However, tax
evasion and malpractices engaged by taxpayers impairs the taxation’s macro-
economic objectives thus creating a gulf between actual and potential government tax
revenue raising many issues which need urgent attention and solutions..
No government can announce a tax system and then rely on taxpayer’s sense of duty
to remit what is owed. Some dutiful people will undoubtedly pay what they owe, but
many others will not. Over time, the ranks of the dutiful people will shrink. Paying
taxes must be made a legal responsibility of citizens with penalties attendant on
noncompliance. But even in the face of those penalties, tax evasion exists and always
has (Slemrod, 2007). Most studies that have been carried out have concentrated on
12
personal income tax compliance (Webley et al, 2002). This is surprising given the
economic and social importance of VAT. VAT has been introduced in a large number
of countries – the most recent one being China and those countries in Central and
Eastern Europe applying for membership of the EU (Cnossen, 1998). It is difficult to
get an accurate picture, but it is clear from the few studies that have been published
that VAT evasion is widespread and involves significant revenue losses, though the
extent varies across countries (Webley et al, 2002). Aga and Haughton (1996)
summarizes the findings from five countries in Europe and two in Asia: their figures
suggest that revenue losses vary from a low 3% (France, United Kingdom) to a high
of 40% (Italy). Even the low figures represent a huge sum of money (3 billion dollars
for France) and a very high proportion of firms involved in some non-compliance.
Duverne (1990), for instance, reports that 66% of French VAT taxpayers audited had
understated the value of taxable sales (a quarter of them fraudulently) and 40% had
overstated the value of taxable inputs. Similarly, a study of Dutch businesses found
that 34% of firms had evaded VAT (Cnossen, 1981). Thus, due to the meager
performance, the performance of VAT is under serious scrutiny to establish the
reasons behind its slow response.
In Kenya, the bulk of revenue collection; about 50% are collected from firms in the in
large taxpayer category. Taxpayers in this category have been clustered into sectors
according to the nature of business activities undertaken. The total revenue collected
by KRA in the fiscal year ending June 2014 amounted to about KES 899.5 million
against a target of KES. 963.8Million indicating a 93% performance. This has been
detrimental on the overall performance on the mandate of KRA which in turn has
resulted to a lot of pressure on the tax agency especially with the expanded budgetary
targets of KES. 1.8Trillion.The trend of VAT revenue performance in LTO in the

13
recent past is worrying since it has not met the set targets. For instance, in fiscal year
2011/2012 actual collection was 54.91Billion against a corporate target of KES.
69.05Billion.Similarly, in 2013/2013 actual collections in VAT by LTO amounted to
KES. 55.99Billion against a corporate target of 74.2B. In the financial year that ended
in June 2014, VAT total corrections grew by only 0.65 per cent compared to other
taxes that expanded by double digits. In the same fiscal year, treasury indicated that
there would be increased VAT audits for 50 largest taxpayers along suspected VAT
evasion by these firms (Irungu, 2013).
According to Macharia (2014), tax evasion is a great contributor to low tax revenues.
Macharia observes that tax evasion in Kenya by some has led to tax evasion by others
thus largely impacting on the distribution of tax burden as well as public resources
leading to increase in taxes and revenue loss which may in the long run grind the
functioning of the public sector to a halt. Nyaga, (2014), in her study on the
relationship between tax compliance, enforcement and taxpayer services found a
positive relationship on audit rate, and a negative relationship on tax compliance and
taxpayer services.
Studies of economic factors that affect tax compliance have been consistently
inconclusive leaving researchers to state that the more important question is why
people pay taxes and not why they evade them. (Slemrod, 1992; Alm et al,. 1992).
Research has found that much of the empirical studies have loose connection to
theory. Several studies have been carried out on enforcement measures on tax
compliance. However, these studies focused on income taxes and very few have
touched on VAT (Webley et al, 2002). The concentration of both economic and non-
economic factors on personal income taxes has made VAT appear an inferior tax
system which is not true. Furthermore, research conducted on tax compliance has not

14
been keen to know the direct business view on enforcement measures on VAT
compliance in big businesses.
Several studies have been carried out on tax compliance in Kenya. These studies have
majorly been on individual taxpayers or small and medium enterprises (SMEs). None
has focused on the effect of enforcement measures on VAT revenue for firms in the
large taxpayer category in Kenya. Chege (2010)did a research on the effect of using
electronic tax registers on VAT compliance on classified hotels in Nairobi and found
that there were increased levels of VAT declaration following the introduction of
ETRs. Nyaga (2014) conducted a research seeking to know the relationship between
tax compliance, enforcement and taxpayer services in Kenya. Her studies focused on
the effect enforcement measures have on individual income taxes. The study found
that audit and penalties have a positive relationship with tax compliance; taxpayer
service and criminal sanctions have a negative relationship with tax compliance.
There exists a gap in the research studies done as none has contemplated on how
enforcement measures affects VAT revenue. This study therefore sought to find out
the effect of enforcement measures on VAT revenue for firms in the large corporate
category in Kenya. The important question in this study is. Do enforcement measures
affect Value Added Tax revenue (VAT)?
1.3 Research Objective
The main objective of this research is to determine the effect of enforcement measures
of audit, penalties, and criminal sanctions on VAT revenue.

15
1.4 Value of the Study
Research on VAT compliance and its contribution to VAT revenue has not received
adequate attention universally (Tanzi and Shlome, 1993) and in the developing world,
it remains unavailable (Andreoni et al., 1998).This has even been worse on
compliance researches on VAT. Many of the studies done have been majorly on direct
taxes and little has been on VAT (Webley et al., 2002). This research will contribute
to the existing scholarly work on VAT compliance in the developing world as Kenya
is a developing nation.
The inadequacy of VAT to meet the expected outcome has been a headache to KRA.
Reforms have been made on VAT under TR&MP in an attempt to raise VAT
revenues, but the response has been below expectations. The study will be beneficial
to tax administrators (KRA) in knowing what measures contribute to an increased
compliance on VAT so that resources can be directed there to net more taxpayers to
be compliant thus raising tax revenue collected. The study will also be useful to
policy makers at the treasury and the legislature. The findings will enable them weigh
the effective means by which compliance is enhanced and this will enable them know
how tax administration can be empowered to increase VAT compliance.

16
CHAPTER TWO
LITERATURE REVIEW
2.1 Introduction
This chapter presents a literature review on prior studies that have been done on
enforcement measures that are an integral part of tax compliance. The chapter also
reviews some empirical studies done globally and locally on effect enforcement
measures on VAT revenue. The chapter ends with a summary of the literature review.
2.2 Theoretical Review
This study borrows from the existing research of tax compliance measures. It was
influenced by the following two theories put forward by researchers on enforcement
measures on tax.
2.2.1 Economic Utility/Deterrence Theory
The contemporary revival of the economic analysis of crime began in 1968 with
Becker’s’ classic article on crime and punishment. While Becker mentioned tax
evasion as an area of application for his general model, Allingham and Sandmo
(1972), provided the analysis. Generally, this approach treats noncompliance as a
rational individual decision based upon probabilities of detection, conviction and
levels of punishment.
According to Allingham and Sandmo (1972), tax compliance is an expected utility
(EU) maximizing decision where the taxpayer takes into account the tax rate,
probability of audit and the penalty in determining the declared income. The
taxpayer’s actual income is exogenously given and known by the taxpayer but not the
Internal Revenue Service-IRS. A constant proportional tax is applied to reported

17
income, the amount of which is chosen by the taxpayer. With some exogenous and
constant probability, the taxpayer is audited , if he or she is discovered to be
underreporting income, a penalty proportional to the amount of undeclared income,
at a rate higher than the proportional tax rate, must be paid. The taxpayer chooses a
level of reported income so as to maximize his or her expected utility of net wealth.
Optimal tax evasion depends on the chance of getting caught and penalized, the size
of the penalty for evasion and the individual’s degree of risk aversion.
Yitzhaki (1974) pointed out that if the penalty (and any related non pecuniary costs)
for discovered evasion is proportional to the tax understated rather than (Allingham
and Sandmo assumed, the income understated), then the tax rate has no effect on the
terms of the tax evasion gamble. As the rate rises, the cost of a detected
understatement of taxes rises in the exact proportion to the reward from a successful
understatement of taxes, so the reward-to-risk ratio is unchanged. In this situation, a
higher tax rate has only an income effect and, for example, if a taxpayer’s level of
(absolute) risk aversion increases as after-tax income falls, a higher tax rate will
decrease tax evasion.
Many years of subsequent analysis has extended this model in a number of
dimensions, including allowing an endogenous probability of detection, analyzing
evasion jointly with the labour supply decision (thus directly addressing the shadow
economy), incorporating the sources of uncertainty other than the chance of audit, and
addressing general equilibrium considerations (Slemrod, 2007). This economics-of-
crime approach gives the sensible result that compliance depends upon enforcement,
as represented by the audit and penalty rates. Indeed, it is straightforward to show

18
with comparative statics analysis that declared income increases with an increase
either in the probability of detection or in the penalty rate (Alm, 2013).
This theory incorporates enforcement measures in determining tax compliance levels.
This study borrows heavily from the A-S model in that it seeks to establish the
relationship tax enforcement measures have on VAT revenue. The theory observes a
taxpayer weighs the cost of being caught evading tax versus the benefit of going
unnoticed. If the cost of being caught is high, then it will be beneficial for the
taxpayer to just comply with the tax law and this will have a positive effect on tax
revenue.
2.2.2 Prospect Theory of Tax Evasion
This theory describes the way people choose between probabilistic alternatives that
involve risk. Under the prospect theory, the carriers of utility are gains and losses
relative to some reference point (Dhami & al-Nowaihi, 2006). An important
application of prospect theory is to the equity- premium puzzle in finance which is
similar in spirit to the tax evasion puzzle in that both can be formulated in terms of a
portfolio choice problem.
Alm, Jackson and McKee (1992), suggest that one possible explanation for why
people pay taxes might potentially be based on non-linear transformation of
probabilities to overweigh the probability of a tax audit, which provides for an
obvious deterrent to tax evasion activity. Restricted prospect theory has been used in
“advance tax payments” in an attempt to deter tax evasion. Where advance tax
payments exceeds actual tax liability, in which case the taxpayer correctly reports
income, the taxpayer gets a refund, a gain. Therefore, the taxpayer’s utility function is
concave to gains. On the other hand, if the advance payment were lower than the

19
actual tax liabilities, the taxpayer’s utility function would be convex for losses and
might be more willing to take a gamble of evading taxes (Yaniv, 1999; Elffers and
Hessing, 1997).
2.3 Determinants of Value Added Tax Revenue
The adoption of a VAT is often seen as an opportunity in many developing countries
to modernize tax administration which may reflect the influence of international
financial organizations (such as the IMF and the World Bank) in the decision to
introduce VAT. Many developing countries, however, find the vat more difficult to
administer than initially thought and problems with administration and enforcement
often undermine the effectiveness of the VAT (Bernardi, Gandullia and Fumagalli,
2005).
Enforcement of laid down deterrence measures on VAT noncompliance theoretically
contribute to increased VAT revenues. Earlier studies show that taxpayers are utility
maximizers who possessed actual knowledge of penalty and detection rates. They
advocated that increasing the penalty rate and/or the probability of detection was a
deterrent and led to greater income declaration (Allingham and Sandmo, 1972).
2.3.1 Value Added Tax Rate
According to Bogetic and Hassan, (1993), the most important determinant of VAT
revenue is the VAT rate. The VAT rate determines to what extent tax is to be levied
on taxable goods and services. A too low rate will bring minimal VAT revenues.
There is positive correlation between tax rates and tax revenues (Gillis, Shoup and
Sicat, 1990).

20
The estimated VAT rate that will generate positive revenue, which can be interpreted
as the minimum rate from the revenue perspective, is close to 2 percent, (Bogetic &
Hassan, 1993).Their study found that the RATE coefficient was strongly significant
and, in the linear model, explained 71 percent of the variation in VAT revenues. In
the United Kingdom, Adam and Roantree, (2015), indicated that the simplest way for
the government to raise a large amount of additional revenue would be to increase the
rates of one of the three taxes that account for most of its revenue, i.e. income tax,
national insurance contribution and the VAT. Their study found out that a 1 per cent
point increase in the main VAT rate would raise $ 5.2 billion additional revenue.
Gilliset et.al, (1990), in their survey of the VAT lessons, noted that VAT has
developed a worldwide reputation as a governments “money machine", as few other
single tax instruments can mobilize as large revenue as a well designed and
implemented VAT. The experiences of the 49countries showed that, over the range of
existing rates, with few exceptions, VAT revenue rises with the rate. Their study
found that the average rate is 14.4%, and it realizes a share of 5.1% of the GDP,
implying the average revenue productivity ratio of 35% of GDP. This means that
raising the tax rate one percentage point would on the average increase the share of
revenues in GDP by 0.35%. The average rate of revenue productivity in countries
with several rates is 0.35%, somewhat lower than for countries which have a single
rate (0.37%). It follows that using several rates would not generate larger revenues
than applying one rate.
Multiple rate structure is inherently complex, but yet, many argue for it on both
efficiency and equity grounds. The efficiency argument hinges on Ramsey rule
applied to consumption taxation (Le, 2003). The rule specifies that to minimize
21
deadweight loss, tax rate on a good should be set inversely proportional to the good’s
own demand elasticity. It implies that the rates should be differentiated across
different groups of goods and services of various demand elasticities. On the other
hand, supporters of a multiple rate structure on the equity ground would argue that tax
rate differentiation is needed to mitigate the regressively of a tax: lower rates must be
applied to the goods and services consumed primarily by the poor. In practice,
however, a multiple rate structure poses a great challenge to the tax compliance and
administration (Asirigwa, 2011). A single VAT rate is usually viewed as simple
during the computation of payable VAT. The general model will indicate that a
growth of revenues from the VAT occurs when the rate is raised and the coverage of
the tax base is broadened, while differentiation of the rates causes a rise of costs and
thereby a negative impact on revenue (Kuliš & Miljenović 1997).
2.3.2 Value Added Tax Base
The VAT base is given by the legal definition of goods and services that are rated for
VAT payments. The VAT base will differ from country to country and is proxied by
the proportion of consumer spending that is zero rated and VAT exempted as a
proportion of GDP (Kent & Williams, 2000). The higher the proportion of consumer
spending that is zero rated and VAT exempted, the lower the VAT base.
The comprehensive VAT is typically levied on a broad base which includes all goods
and services. However, countries vary in their coverage of the base, particularly with
regard to the treatment of services. The negative impact of extensive exemptions on
the size of the base can be quite dramatic. Kay and Davis (1990) estimate, on the
basis of a survey of 32countries, that the complete exemption of all services excludes
from the VAT base between 45 to 78 percent of a country's GDP. This, in turn,

22
increases the pressure on the fiscal authorities to use higher rate to mobilize target
VAT revenue from a smaller base. Also, it is evident that some countries that use
almost identical rates experience very different revenue performance. One source of
different performances is often the size or the coverage of the base The underlying
hypothesis is that the wider the base, the smaller is the number of goods and services
exempted, and the larger the VAT revenue-to-GDP ratio (Bogetic & Hassan, 1993).
2.3. Contribution of Imports to VAT
Importation of goods and services in an economy depends on the consumption level of
the particular country. The higher the consumption, the higher the imports. Due to
the fact that VAT is a consumption tax, primarily VAT income depends on the
consumption level in the country. Importation increases with consumption and it
reduces the demand for domestic goods. An increase in imports results to higher VAT
income (Hybka, 2009).
The significant role for the degree of trade in an economy in explaining VAT yields is
consistent with a key empirical feature of the VAT: revenue collected on imports
commonly accounts for a large proportion of total revenues. In about two-thirds of
developing and transitional economies, more than half of all VAT revenue is collected
on Imports – an average of 55 per cent.VAT collections on imports are generally a
crucial part of ensuring effective collection of tax throughout the chain of production.
By the same token, getting collection right at that stage can go a long way to securing
the success of the VAT overall (Ebrill et al, 2001).
2.4 Empirical Studies
In this section, the study reviewed existing studies both local and international on the
effect of enforcement measures on VAT revenue in Kenya.

23
In order to meet their vast budgets, governments around the world have devised ways
of employing various measures to reap more on taxes. As it would be, some taxpayers
are also way ahead to beat the systems so as to remain non-compliant. This has led
the tax agencies to employ enforcement measures of audit rate, penalties, audit
probabilities and criminal sanctions to net in non-compliant taxpayers. In an attempt
to investigate the reasons for taxpayer non-compliance, Becker, Bucher and Sleekings
(1981), used tax evasion game in which participants were given a monthly income
and punishment parameters. Based on these, taxpayers were requested to make their
tax declaration. The major finding of their study were that tax evasion increased with
tax rate and that keeping the net gain from evasion constant, evasion fell as the
fine/penalty was increased.
Dublin and Wilde (1988) conducted an empirical analysis of federal tax auditing and
compliance in USA. The study had an objective of establishing the relationship
between tax audits and compliance from IRS tax returns made in 1969. Data was
analyzed by Ordinary Least Square regression. Among other variables that
contributed to increased tax compliance, which in turn enhanced tax revenues, Dublin
and Wilde found that there was a strong deterrence effect on non-compliance. They
concluded that IRS was effectively right to direct its resources to audit conductions to
enhance tax revenue.
A study conducted by Frey and Feld (2002), evaluated deterrence and morale on
taxation in Switzerland. In their empirical analysis, they used cross section time
series data from 26 cantons over the period 1975-1995. Their enforcement technique
was represented by the authoritarian procedure of the tax agency in which standard
penalties and audit rates were increased. The results surprisingly showed that the

24
probability of detection through audit was statistically significant (at the 5% level)
and had a theoretically unexpected positive sign. This suggested that a higher
probability of being caught through audit raised (rather than lowered) tax evasion
which affected tax revenue. However, an increase in standard penalty lowered tax
evasion in a statistically significant way (1%) which corresponds to the theoretical
expectations. They observed that enforcement measures are not the sole contributors
to increased compliance and how taxpayers view treatment from tax agency also
contributed to compliance.
In a study titled ‘Tax Knowledge and Tax Compliance determinants in Self-
Assessment System in Malaysia”, Mohd (2010), concluded that in the self-assessment
system in Malaysia, tax knowledge has a significant impact on tax compliance and
the level of tax knowledge varies among respondents. Males, Malaysian, residents of
Eastern region, high income earners and taxpayers who have attended tax courses
appear to be the most knowledgeable taxpayer groups. The results also indicate that
tax compliance was influenced by probability of being audited, perception of
government spending, penalties, personal financial constraints, and referent group.
These results were validated through a multiple method of questionnaires (direct and
hypothetical questions) and analysis (stepwise multiple regressions and multiple
regressions).
Bergman (2003) investigated tax compliance behavior in Argentina using two
approaches; the measures to enhance commercial taxpayers and extensive campaigns
and audits which will increase the probability of detection among taxpayers. The
results suggested that as the number of audits and the probability of detection
increased, taxpayers were encouraged to comply with tax laws and accurately report

25
their income which had a positive impact on tax revenue. This suggests that
unintentional evasion may occur rather than intentional evasion. He also claimed that
the lack of audits and investigations implemented by tax authorities in the 1980s in
Argentina had driven taxpayers to behave ‘recklessly’. Moreover, as taxpayers were
aware that they would not be detected due to lack of investigations, they incorporated
more complex tax evasion strategies and less traceable documentations so that they
could pay less tax. Findings by Bergman are consistent with the theoretical
proposition that the fear of detection influences the level of compliance behavior,
suggesting that the evaders take precautionary measures when the perceived risk of
detection is high. Findings from Bergman have also evidenced that probability of
being detected plays a significant role in inducing compliance behavior.
Slemrod, Blumenthal and Christian (2001), conducted a research on taxpayers
response to an increased audit probability – evidence from controlled experiment in
Minnesota. They selected a group of 1724 taxpayers and informed them through
letters that the tax returns that they were about to file would be closely examined and
compared this to a control group that did not receive the letter. They observed that the
low and middle income taxpayers in the treatment group on average increased tax
payments compared to the previous year.
In an experiment study, Feld and Tyran (2012) found that the tax compliance is
higher on average in endogenous penalty treatment in which subjects are allowed to
approve or reject the proposal of a penalty as compared to an exogenous penalty
treatment where penalty is imposed by the experimenter. The main explanation why
people show higher tax morale if they are allowed to vote on a penalty is legitimacy.
Compliance rates are higher if the penalty is accepted than in the case it is rejected.

26
Naibei, Momanyi and Oginda (2012), in their study on the relationship between
income size, inspection and VAT compliance on private firms in Kenya sampled 233
registered firms where questionnaires were administered to the respondents. Data was
analyzed through correlation analysis. The results showed that there was a higher
VAT compliance level on those firms which had undergone a tax audit by KRA. 58%
of the businessmen agreed that tax audits acted as deterrence on tax evasion. This in
effect had a positive effect on the VAT revenues collected by KRA.
In his study on the factors affecting tax compliance by Real Estate developers in
Nakuru town, Osebe, (2013) reveals that tax compliance cost is a contributory factor
to tax compliance. From the study findings, there is enough indication that tax
compliance cost is associated with high levels of tax compliance thereby increasing
tax revenues. Taxpayers do a cost-benefit analysis of the cost of being caught through
audits and the probability of being penalized, together with the possibility of criminal
sanctions and where the magnitude is high; they end up following tax law and in
effect comply. The study also provides some preliminary evidence that fines and
penalties play a vital role in improving tax revenue.
Nyaga (2014), in her study on tax compliance, enforcement and taxpayer service in
Kenya purposed to explore the relationship between enforcement policies and
taxpayer service on tax compliance. The study used simple regression analysis of
aggregate variables representing enforcement measures against audit, penalties,
criminal sanctions and taxpayer service. A sample frame list of self-employed
individual taxpayers was used for 2003 to 2012. Nyaga found that audit and penalty
had a positive relationship with tax compliance and hence tax revenue and taxpayer
service and criminal sanctions had a negative relationship. With the variability in
27
audit rate accounting for only 31% of the variability in tax compliance, she concluded
that why Kenyans pay taxes remains an interesting question that required further
research.
Mararia (2014), evaluated the effect of Integrated Tax Management System (ITMS)
on tax compliance by the small and medium enterprises in Nairobi central district.
The target population for the study comprised of 200 taxpayers out of which 100
taxpayers were picked as a representative sample. Data was analyzed by use of
Statistical Package for Social Sciences. Although the study was mainly on ITMS
effect on tax compliance, Mararia found that penalties and fines had a significant
positive relationship with tax compliance. This resulted to an overall increase in
collections as penalties and fined deterred tax evasion by taxpayers.
2.5 Summary of Literature Review
There has been a considerable amount of research which has been carried out on tax
compliance (Andreoni, et al, 1998). Studies on the economic factors that affect tax
compliance have been consistently inconclusive leaving researchers to state that the
more important question is why people pay taxes and not why they evade them
(Slemrod, 1992; Alm et al., 1992).According to Webley, et al, (2002), there are very
minimal studies on VAT non-compliance. The main purpose for pushing for
increased tax compliance through a reduction of tax evasion, helping taxpayers
through taxpayer service and other mechanisms is to increase tax collections. The
effects of audits, penalties and criminal sanctions vary sometimes even within the
same context (Witte & Woodbury, 1985; Dubin & Wilde, 1988).
From the empirical studies, it is clear that tax evasion has been a problem to many
governments and that tax enforcement has been a tool used by many tax agencies to

28
deter further non-compliance. However, most empirical studies have focused on
personal income tax. There has not been much concentration on VAT which is an
important tax. Taxpayers in different tax brackets behave differently on taxation
matters. The few studies carried out on VAT have focused majorly on Small and
Medium enterprises and the black market. It is therefore paramount to study how
enforcement measures contribute to the revenue collection on VAT for firms in the
large taxpayers’ category.

29
CHAPTER THREE
RESEARCH METHODOLOGY
3.1 Introduction
This chapter outlines the research methodology as the mode of achieving the purpose
of the study. It specifically highlights the methods used in carrying out the study in an
attempt to answer the research question. In addition, various methodological issues
discussed include population, sample design, data collection, validity and reliability
and data analysis.
3.2 Research Design
Research design used in this study is a causal study design that involves an
investigation of what effects one variable has on the other among different variables,
(Kothari, 2004). This study adopts both descriptive and explanatory designs.
Causality in this study is most preferred because the study sought to investigate what
effect enforcement measures have on VAT revenue in the Large Taxpayer Sector in
Kenya.
3.3 Population
The target population refers to a group of individuals, objects or items from which
samples are taken for measurement (Mugenda and Mugenda, 2003). The target
population consists of 1052 firms in the large corporate taxpayers’ category under
LTO mandate as at June 2013. This group of taxpayers is chosen because, as
discussed in chapter one, firms in LTO contribute to over 50% of the total tax
collections by KRA. This would literally be taken to mean that the contribution made
by these taxpayers in the Kenyan economy cannot go unnoticed.

30
3.4 Sample
A sample is a representation or subset of the total population to be studied since it is
impossible to study the entire population. A sample of 106 firms from the large
taxpayer category was considered in this study.
3.4.1 Sample Frame
Sampling is the process of selecting a subset of cases in order to draw the conclusion
of the entire set. The sample frame was drawn from firms in all the seven sectors in
LTO namely; Agriculture & Wholesalers, Oil, Transport and Services, Food & Other
Manufacturers, Government and Construction, Banks and Insurance, Top 25 and
Excise sector. A hundred and six (106) companies were selected as a sample for the
study between 2008/09 to 2013/2014 fiscal years.
3.4.2 Sampling Technique
The sampling technique used was stratified and simple random sampling. The sample
was obtained from companies in each category which have either been subjected to
an audit; penalty or legal sanctions were selected from each sector. Every tenth firm
of every sector was chosen to make a total of 106 companies, except for Top 25
where all the 25 companies were selected and 25 companies from excise sector.
3.5 Data Collection
The study used secondary data. Secondary data is information obtained from research
articles, books, or casual interviews (Mugenda & Mugenda, 1999). This information
was obtained from the monthly, quarterly and yearly reports of the audit, legal and
debt sections of KRA and the KRA data base. The data collected covered a period of
six years from 2008 to 2014.
31
3.6 Validity and Reliability
According to Kothari (2004), validity is the degree to which an instrument measures
what it is supposed to measure. Validity was achieved by having objective data and
pre-testing a sample of the information used.Reliability on the other hand refers to a
measure of the degree to which research instruments yield consistent results
(Mugenda & Mugenda, 2003). In this study reliability was achieved by selecting a
sample and testing it for accuracy from database.
3.7 Data Analysis
To establish the level of tax compliance, an audit must have taken place (Andreoni et
al., 1998). In this study; to establish the effect of enforcement measures on VAT
revenue, we used aggregate data from audit records, penalty schedules and legal
schedules. Data was analyzed using Statistical Package for Social Sciences (SPSS
Version 20.0) program.
Both quantitative analysis and regression analysis were used as data analysis
technique. The data collected was run through various models so as to clearly bring
out the effect of enforcement measures i.e. audit rate, penalties and criminal sanctions
on VAT revenue in taxpayers in LTO.
3.7.1 Analytical Model
A multi linear regression model was used to predict the effect of enforcement
measures (audit rate, penalty and criminal sanctions) on the VAT revenue for firms in
the large taxpayer category. The VAT revenue in the linear regression equation is the
Y of the equation, i.e. the dependent variable while audit rate, penalties and criminal
sanctions are the independent variables Xi. Other variables that have been identified
to have an effect on VAT revenue which are the rate of VAT, the tax base, are control

32
variables that are not included in the equation. However, the contribution of imports
to VAT revenue has been included in the estimated regression equation as below.
To answer the research question in chapter one, the estimated equation will take the
following form;
Y = α + β1X1 + β2X2 +β3X3 + β4X4 + β5X5+ β6X6 +Ɛ
Where, Y is the VAT revenue which is the dependent variable. It is a proportion of
the contribution of VAT revenue to the GDP.
α is a constant or the y intercept,
X1 denotes the audit rate,
X2 represents penalties imposed on non-compliant firms,
X3 denotes criminal sanctions,
X4 represents the contribution of imports to VAT revenue
β1, β2, β3, β4, β5 & β6– are variable coefficients
Ɛ is the error term.
The audit rate is represented by X1 which is an independent variable that will be
measured as; the amount of VAT revenue collected from firms subjected to audit in
the large taxpayer category per year divided by the total VAT revenue collected from
firms in the large taxpayer category.
Audit rate = 𝑎𝑚𝑜𝑢𝑛𝑡 𝑜𝑓 𝑉𝐴𝑇 𝑟𝑒𝑣𝑒𝑛𝑢𝑒 𝑐𝑜𝑙𝑙𝑒𝑐𝑡𝑒𝑑 𝑓𝑟𝑜𝑚 𝑉𝐴𝑇 𝑎𝑢𝑑𝑖𝑡𝑠
𝑡𝑜𝑡𝑎𝑙 𝑉𝐴𝑇 𝑟𝑒𝑣𝑒𝑛𝑢𝑒 𝑐𝑜𝑙𝑙𝑒𝑐𝑡𝑒𝑑 𝑓𝑟𝑜𝑚 𝑓𝑖𝑟𝑚𝑠 𝑖𝑛 𝐿𝑇𝑂
Penalties imposed are independent variables on non-compliant taxpayer and are
denoted by X2. The measure for this factor is adopted from the Witte and Woodbury,
(1988) study, where penalties are measured by the number of firms with VAT related
civil penalties divided by the total collections for the year.

33
Penalties = 𝑉𝐴𝑇 𝑟𝑒𝑣𝑒𝑛𝑢𝑒 𝑓𝑟𝑜𝑚 𝑐𝑖𝑣𝑖𝑙 𝑝𝑒𝑛𝑎𝑙𝑡𝑖𝑒𝑠
𝑡𝑜𝑡𝑎𝑙 𝑉𝐴𝑇 𝑐𝑜𝑙𝑙𝑒𝑐𝑡𝑒𝑑 𝑓𝑟𝑜𝑚 𝐿𝑇𝑂
Criminal sanctions are represented by X3. Under this variable, the total VAT revenue
emanating from penalties imposed on firms investigated for VAT fraud per year is
divided by the total VAT revenue collected from firms in the large taxpayer category.
From 2010, KRA was allowed by the Attorney General, who is the defacto Director
of Public Prosecutions, to install six of its officers, who are legal professionals as
prosecutors in tax evasion cases. According to the authority, this arrangement has
enabled more timely, effective and successful prosecutions. Furthermore, KRA‟s
prosecutors are in a position to apply the legislative framework, knowledge and other
capacities for combating corruption and other crimes, to “register substantial wins in
court cases.
Criminal sanctions =
𝑉𝐴𝑇 𝑟𝑒𝑣𝑒𝑛𝑢𝑒 𝑓𝑟𝑜𝑚 𝑓𝑖𝑟𝑚𝑠 𝑖𝑛 𝑡ℎ𝑒 𝑙𝑎𝑟𝑔𝑒 𝑡𝑎𝑥𝑝𝑎𝑦𝑒𝑟 𝑖𝑛𝑣𝑒𝑠𝑡𝑖𝑔𝑎𝑡𝑒𝑑 𝑓𝑜𝑟 𝑓𝑟𝑎𝑢𝑑
𝑡𝑜𝑡𝑎𝑙 𝑉𝐴𝑇 𝑟𝑒𝑣𝑒𝑛𝑢𝑒 𝑓𝑟𝑜𝑚 𝑓𝑖𝑟𝑚𝑠 𝑖𝑛 𝑙𝑎𝑟𝑔𝑒 𝑡𝑎𝑥𝑝𝑎𝑦𝑒 𝑐𝑎𝑡𝑒𝑔𝑜𝑟𝑦
The contribution of VAT on imports to the total VAT revenue collections is
represented by X4. This will be the total VAT amount received from imports relative
to the VAT revenues expressed as a percentage per annum.
VAT on imports = 𝑉𝐴𝑇 𝑜𝑛 𝑡𝑜𝑡𝑎𝑙 𝑖𝑚𝑝𝑜𝑟𝑡𝑠
𝑇𝑜𝑡𝑎𝑙 𝑉𝐴𝑇 𝑐𝑜𝑙𝑙𝑒𝑐𝑡𝑖𝑜𝑛𝑠
VAT rate is a control variable that also affects the VAT revenue.. According to
(Bogetic & Hassan 1993), rate is taken as a percent. Kenya started off with a standard
rate of 17% but with 14 other rates, (the highest being 210%). Currently, there is a
single standard rate of 16%. (See Appendix I). The VAT base is also another control
34
variable that has an effect on VAT revenue, which was not examined in this study.
The base of the VAT depends on how the system of VAT is defined. Under the
Kenyan law, VAT is consumption type, basically conforms to the destination
principle. This type of system means that in principle the tax base consists of final
sales of goods. Assuming a zero rate of the tax on exports, and gross investments on
entrepreneurs, the theoretical tax base, which does not include VAT itself would be
obtained from the GDP in market prices, adjusted for the value of the indirect taxes
which the VAT is replacing by subtracting the value of visible exports, non–factor
services, and gross investments, adding in the value of visible imports and non-factor
services.

35
CHAPTER FOUR
DATA ANALYSIS AND DISCUSSION
4.1 Introduction
This chapter presents the analysis of data that was collected, results and discussion of
the findings. The chapter is divided into five sections, i.e. Descriptive statistics,
correlation analysis, regression analysis and ends with a discussion on the findings.
The study relied on secondary data for analysis. Ordinary Least Square (OLS) was
used.
4.2 Descriptive Statistics
This section sought to provide a description of variables for the averages of the
variables used in describing the relationship between variables .The results from the
analysis are presented in the table shown below.
Table 4.1 Descriptive Statistics of Variables. Average VAT revenue from
Enforcement Measures in Billions of Kenya Shillings
N Minimum Maximum Mean Std
Deviation
Variance
VAT
Revenue
Audit rate
Penalties
Criminals
sanctions
Imports to
VAT
Valid N
106
106
106
106
106
106
0.00745
0.0115
0.005
0.0033
0.0013
0.0343
0.0803
0.00745
0.513
0.00513
0.003182
0.001727
0.00223564
0.0033564
0.0024506223
.0566066
.039837
.063700
.007026
.0022612
0.321
5.457
9.712
0.022
2.366
Source: Author, 2015

36
In the findings above, there are 106 observations which were used for this study for
all the variables. The mean of the independent variable, VAT revenue was 0.003182.
This was taken to be the total VAT revenue contribution to the GDP. The mean for
dependent variables i.e. audit rate, penalties, criminal sanctions and the VAT on
imports was 0.001727, 0.00223564, 0.0033564, and 0.0024506223 respectively.
4.3 Correlation Analysis
Pearson correlation was used to examine if there was correlation or degree of
association for the variables in the study.
Table 4.2 Correlation Analysis
1 2 3 4 5
VAT revenue 1
Audit rate 0.590 1
Penalties .839 .146 1
Criminal sanctions -.40 .317 .282 1
VAT on imports .614 .427 -.109 .211 1 1
Source: Author, 2015
*Correlation is significant at the 0.05 level (2-tailed)
From the correlation analysis above, there exists a correlation between variables. The
findings show that a negative correlation exists between VAT revenue and criminal
sanctions with a correlation coefficient of -0.40. The findings also show positive
correlations between VAT revenue and Audit rate, penalties and VAT on imports of
0.590, 0.839 and 0.614 respectively. Therefore, all these three variables will
positively increase VAT revenue. These findings illustrate the results obtained from
correlation analysis for the sampled firms for the period of study at 0.05 level of
significance.

37
4.4 Regression Analysis
Table 4.3 Model Summary
Model R R Square Adjusted R Square Std. Error of the Estimate
0. 909a .827 .753 .0730618
a. Predictors (Constant), Audit rate, penalties, Import to VAT revenue, criminal
sanctions
Regression Analysis in table 4.3 shows that the coefficient of determination (R2)
equals 0.827. That is the Audit rate, penalties, criminal sanctions and the contribution
of imports to VAT revenue explains 82.7% only of factors affecting VAT revenue,
leaving 17.3 % unexplained
Table 4.4 ANOVAb
a. Predictors (Constant), Audit rate, penalties, Import to VAT revenue, criminal
sanctions
b. Dependent variable: Contribution of VAT to revenue to GDP
ANOVA findings in table 4.4 show that there is a strong significant relationship
between the predictor variables (Audit rate, penalties, criminal sanctions, contribution
of Imports to VAT) and response variable VAT revenue. An F ratio is calculated
which represents the variance between the groups, divided by the variance within the
groups. A large ratio indicates that there is more variability between the groups
(caused by the independent variable) than there is within each group, referred to as
Model Sum of squares df Mean square F significance
1
Regression
Residual
Total
0.179
0.037
0.216
5
100
105
0.60
0.005
11.161
0.0050a

38
the error term. From the above, the significance level of the model is 0.005 which
shows that the data is ideal for making a conclusion on the population’s parameter as
the value of significance; p value is 0.0050 which is less than 0.05 significance level.
Table 4.5 Regression Coefficients
Coefficientsa
Model
Unstandardized coefficients
Standardized
Coefficients
t
Sig. B Std. Error Beta
1 (Constant)
Audit rate
Penalties
Criminal Sanctions
Imports to VAT
1.995
0.344
0.026
-0.049
1.23
0.421
0.070
0.023
0.021
0.030
-1.326
-0.410
1.045
1.245
4.37
-4.936
-1.138
2.335
1.569
.002
.002
.293
.052
.256
a. Predictors (Constant), Audit rate, penalties, Import to VAT revenue,
criminal sanctions
These are the values for the regression equation for predicting the dependent variable
from the independent variable. From the regression model:
Y = α + β1X1 + β2X2 +β3X3 + β4X4 + β5X5 +Ɛ
The regression equation is presented as shown below.
Y = 1.995 + 0.344X1 +0.026X2 -0.049X3 +1.23X4+0.421
A Constant of 1.995, shows that if the Audit rate, penalties, criminal sanctions and
contribution of imports to VAT, are all held constant at zero, VAT revenue would be
1.995 Billion. The regression coefficient for Audit rate is 0.344. This means that the
relationship between the Audit rate and VAT revenue is positive. This implies that an
increase in Audit rate results to 34.4% increase in VAT revenue. The regression
coefficient for penalties is 0.026 meaning that the relationship between penalties
imposed on firms within the large taxpayer category and VAT revenue is positive.

39
This implies that an increase in penalties imposed on firms results to an increase VAT
revenue by 2.6%. The regression coefficient for criminal sanctions ratio is -0.049.
The relationship between criminal sanctions on fraudulent taxpayers and VAT
revenue is negative. This implies that an increase in criminal sanctions and strict
enforcement of criminal sanctions results to a decrease in total VAT revenue.
The regression coefficient for contribution of imports to VAT revenue is 1.23. The
relationship between the contribution of imports to VAT and VAT revenue is positive
implying that an increase in imports contributes to a great increase in VAT revenue
collected.
4.5 Discussion of Findings
The purpose of this study was to determine the effect of enforcement measures
employed by the Kenya’s tax agency (KRA) on VAT revenue and the study focused
on firms in the large taxpayer category as classified by the tax agency. Aggregate data
relating to VAT revenue collected from employing techniques such as audits,
imposing penalties and instituting legal sanctions for fraudulent taxpayers was
regressed against VAT revenue collections as a measure of the GDP. There is a
strong significant relationship between the predictor variables (Audit rate penalties,
criminal sanctions, contribution of imports to VAT).
The enforcement measure of audit rate was, as expected, found to have a significant
positive relationship with VAT revenue collected. This is in line with both the tax
compliance theory and majority of prior studies on the variable. These findings are
consistent with Keen and Mansour (2009) research that looked at the current
challenges in revenue mobilization; Improving tax compliance. The research found a
close relationship between audits as an enforcement strategy for tax compliance

40
measures and the amount of revenue for various revenue collecting bodies in different
countries collect.
The relationship between penalty imposition and VAT revenue is positive and non-
significant. Compared to prior studies the result is not unexpected. Prior studies have
set forth conflicting relationships between penalties and VAT revenue. The most
common result in these studies is the non-significance of the relationship. Nyaga
(2014) found that penalty rate contributed to 4.2% of tax compliance and an F-
statistic showed that it was non-significant. The result of the relationship between
criminal sanctions and VAT revenue was as expected – negative and non-significant.
The negative relationship is congruent with compliance theory, that punishment is not
an effective way of deterring undesired behavior.
The study of Eissa and Jack (2009) also found no significant variations in the various
tax compliance measures on VAT revenue for large and small firms in Kenya .They
also found that penalties for non or under-payment of taxes are defined by law, and
interest of 2 percent per month is charged on tax arrears, calculated starting from the
date the tax was due. While it is standard practice to punish non-compliance starting
on the date the tax was due, long delays between the submissions of a return and
auditing tend to increase interest payments by those who are found to have underpaid.
The relatively high (2 percent) monthly interest rate provides the KRA with little
financial incentive to speed up auditing. They further identified a legislative source of
inflexibility in the penalty system. In particular, penalties for non-payment of VAT,
income tax, and customs and excise taxes were defined under three separate laws,
which were difficult to coordinate and to adjust as changing circumstances require.

41
Eissa & Jack (2009) also found that KRA can increase the revenue by strictly
enforcing the measures for compliance put in place such as increasing the number of
audits and penalties. The study found that the relationship between criminal sanctions
and VAT revenue is positive. This implies that an increase in criminal sanctions
results to an increase in VAT revenue and vice versa. Aquino, et. al., (2010) studied
the tax compliance measures on small and large Philippines firms. Results indicated
that strictly enforced criminal sanctions measures are associated with high VAT
revenue. His study showed that high criminal sanctions are associated positively with
the amount of revenue collected. This is different from the findings of this study
where the study found that the relationship was negative. The relationship between
the contributions of VAT on imports to VAT with VAT revenue is positive. This
implies that an increase in contribution to VAT ratio results to an increase in VAT
revenue vice versa.

42
CHAPTER FIVE
SUMMARY, CONCLUSION AND RECOMMENDATIONS
5.1 Introduction
This chapter presents a summary of the findings presented in chapter four according
to the study objective. It is therefore the final chapter and therefore serves as a
conclusion of the study. The chapter also has limitations encountered during the
study, recommendations to policy makers and concludes with a suggestion for further
research.
5.2 Summary
The study sought to investigate the effect of enforcement measures on Value Added
Tax revenue for firms in the large corporate taxpayer category in Kenya. The period
of study was six years between 2008 and 2014. A sample of 106 firms was selected
from the population of all firms categorized as large taxpayers by KRA. Data used
was obtained from the monthly, quarterly and yearly reports of the audit, legal and
debt sections of KRA and the KRA data base. The study found that there exists a
positive relationship between Audit rate and VAT revenue. The effect is medium and
significant. The economic theory of tax compliance states that as the possibility of
being detected cheating increases, there is an increase in the level of compliance.
Therefore, the findings of this study are as expected and in line with theory and
majority of prior studies. This implies that an increase in Audit rate results to
increased VAT revenue. The large audit rate coefficient also means that tax audits are
an effective enforcement strategy for ensuring compliance for the Kenyan tax
authority. It is fitting with Andreoni et al., (1998) that ‘a small increase in (the
probability of) audit increases compliance by a good margin’. Governments can

43
increase their VAT revenue by increasing the Audit rate and strictly enforcing the
Audit rate as a measure of tax compliance.
The study also found a positive relationship between penalties imposed on non-
compliant taxpayers and VAT revenue. An earlier study done in the US by Witte and
Woodbury, (1985) showed that, notices of penalties charged sent out to taxpayers by
the data processing unit had a significant effect on tax compliance. If the data
processing unit adopted this method concerning penalties, that is, sending out notices
of penalties owed, it might greatly improve the effect of penalties on tax compliance.
After all, penalties are a much cheaper enforcement measure and more far reaching.
This would also counter the problem of penalties charged to unknowing taxpayers.
This implies that an increase in imposition of penalties on errant taxpayers results to
an increase in VAT revenue.
On criminal sanctions the study found that there exists a negative relationship
between criminal sanctions and VAT revenue. This in turn implies that an in increase
in criminal sanctions results to a decrease in the amount of VAT revenue. Legal
proceedings therefore negatively affect VAT revenue. The higher the taxpayers are
subjected to legal battles on fraudulent issues, the lower is the contribution in VAT
collections. The theory of compliance behavior and criminal psychology both state
that punishment does not help prevent undesirable behavior. Previous studies have
also found that punishment of noncompliant taxpayers tends to erode tax morale –
internal motivation to pay taxes.
The study found a positive relationship between contribution of imports to VAT and
VAT revenue. An increase in level of imports to VAT Ratio results to an increase in
the amount of VAT collected and vice versa. The study found that higher contribution

44
to VAT is associated with high VAT revenue .Therefore KRA should strictly apply
these measures as a means of enforcing compliance for firms in the LTO in order to
enhance the amount of VAT revenue collected.
5.3 Conclusion
Tax enforcement measures are a very important component of VAT revenue
collection because they directly affect the amount of revenue a country collects within
a certain period of time .Therefore steps should be taken to ensure strict enforcement
of these measures as a means of attaining this goal. Ordinary Least Square (OLS)
regression found that Audit rate is positively associated to the VAT revenue. The
results show that KRA can improve their VAT collection performance by managing
the enforcement of audits efficiently. Penalties too have positive relationship with
VAT revenue. This means that more resources should move towards audits as it has
the highest positive coefficient. More staff and strategies should go towards
increasing the efficiency and effectiveness of VAT audits. Criminal sanctions on the
other hand have a negative relationship with VAT revenue. The findings indicate that
VAT revenue decreases with increasing in number of taxpayers investigated for fraud
and prosecuted. Criminal sanctions are therefore non-significant in VAT revenue
collections and the authority should not engage much in this. Although KRA faces
challenges to this end of attaining these goals, it needs to put its powers to the stretch
by ensuring strict observance of the measures that will result in a high amount of
VAT revenue being collected.
The study therefore concludes that enforcement measures especially audit and
imposition of penalties are an important area in the field of tax collection and
administration. It therefore requires KRA to employ the most efficient enforcement

45
measures such as conducting audits and imposing penalties on non-compliant
taxpayers in order to increase the VAT revenue collection.
5.4 Limitation of the Study
The study was limited to firms within the large taxpayer category most of which are
located or have their head offices in Nairobi. These firms, as much as they are the
biggest contributors of VAT revenue collection, the effect of enforcement measures
should not be limited to these firms only. Actually, the effect of these measures
should be on all the companies that have been registered for VAT. However, time
was a limitation to study these effects on other taxpayers in other categories that
include MTO and MST.
The study was limited to six years. The period of study was too short to observe
lengthy changes in variables overtime. Some of changes could not be observed then.
Period under review for the study was short and that could not allow extensive
analysis of the relationship between audit rates, imposition of penalties and criminal
sanctions to VAT revenue collections which also resulted to a limitation.
5.5 Recommendations
From the study findings, efficient tax enforcement measures results to improved VAT
revenue by the KRA. From the findings, there exists a positive relationship between
Audit rate and VAT revenue. The study recommends that the frequency of VAT
audits by the tax agency be increased. This will ensure a wide coverage of firms that
are audited. The contribution of audits will significantly increase total VAT
collections. There is need for KRA to also strategize and implement efficient ways on
how audits are conducted. This is because the research found that with increased level
of audit, more VAT is collected. This means that more taxpayers will be covered in

46
the audit procedures and therefore resulting to increased levels of VAT compliance.
The Kenya Revenue Authority should to that effect increase the number of staff
carrying out audits. The staff should be effectively facilitated so that they can carry
out these VAT audits efficiently.
On VAT penalties, there should be an active policy that penalizes errant taxpayers. In
the current VAT Act, the common penalty is Kshs. 10,000. The authority should
think of increasing the penalty amount so as to collect more revenue. VAT penalty
should be graduated so that more errant taxpayers are penalized more.
5.6 Suggestions for Further Research
The study explains 60.9% only of VAT revenue on the firms in the large taxpayer
category leaving 39.1 % unexplained. The 39.1% represents other variables that
explain this study did not include. Little research has been done on enforcement
measures on VAT revenue collections. The study therefore suggests that further
research studies on the same area be done to determine variables that explain the
39.1%.
Similarly, since this study was done in large taxpayer firms, it is difficult to
generalize the findings to other firms which are in MTO & MST. Studies should be
done about the effect of the enforcement measures on those in other categories.
Further, a longer period of time should be studied in order to get an extensive analysis
on the relationship between enforcement measures and VAT revenue for firms in the
large taxpayer category.
47
REFERENCES
ACFE, (2010). International Fraud Examiners Manual. Austin, Texas.
Adam, S., & Roantree, B. (2015). Options of Increasing Tax. Institute of Fiscal
Studies, 7, 63-45.
Agha, A. & Haughton, J. (1996). Designing VAT systems: Some Efficiency
Considerations. Review of Economics and Statistics, 78, 303-308.
Allingham, M.G. & Sandmo, A. (1972). Income Tax Evasion: A theoretical analysis.
Journal of Public Economics 1(3), 137-156.
Alm, J., Jackson, B. & McKee, M. (1992). Estimating the Determinants of Taxpayer
Compliance with Experimental-data. National Tax Journal, 45(1), 107-114.
Alm, J. (1999). Tax Compliance and Administration. Handbook on Taxation. New
York
Alm, J. (2013). Expanding the Theory of Tax Compliance from Individual to Group
Motivations, Tulane University.
Al-Nowaihi, A.& Dhami, S. (2006). A Simple Derivation of Prelec’s Probability
Weighting Function. Journal of Mathematical Psychology, 47, 263-291.
Andreoni, J., Erard, B. & Feinstein, J. (1998). Tax Compliance. Journal of Economic
Literature. 36, (2), 57-105.
Aquino, N., Tullao, T. & Nadurata, T. (2010). Tax Compliance on Small and Large
Firms in Philippines. Unpublished Research Work.
Asirigwa, D.A. (2011). The Determinants of Value Added Tax Revenue in Kenya.
Unpublished MBA project, University of Nairobi.

48
Becker, Gary S. (1968). Crime and Punishment - An Economic Approach. Journal of
Political Economics. 76(2), 169-217.
Becker, W., Bucher, J. & Sleeking, S. (1987). The Impact of Public Transfer on Tax
Evasion, Journal of Public Economics, 34, 243-344
Bergman, M. S. (2003). Tax Reforms and Tax Compliance: The Divergent Paths of
Chile and Argentina. Journal of Latin American Studies, 35, 593-624.
Bernardi, L., Fumagalli, L. & Gandullia, L. (2005). Overview of Tax Systems and
main tax policy issues. In Bernardi, L., Fraschini, A. & Shome, P.
(2006), Tax Systems and Tax Reforms in South and East Asia, New York.
Bird, R. M. & Grendron, P. (2007). The VAT in Developing and Transitional
Countries, Cambridge University Press: Cambridge.
Cherogony, J. (2013). The Effect of Debt Management Tools on Revenue Collection at
Kenya Revenue Authority. Unpublished MSC (Finance) project, University of
Nairobi
Cnossen, S. (1990). Taxing Value Added: The OECD Experience. International VAT
Monitor 5, 2–16.
Cnossen, S. (1998). Global Trends and Issues in Value Added Taxation. International
Tax and Public Finance, 5, 399-428.
Commission of the European Communities (2004). Report from the Commission to
the Council and the European Parliament on the Use of Administrative
Cooperation Arrangements in the Fight against VAT Fraud, 260 final.
Court of Audit. (2010). The Methods and Outcomes of Fiscal Control. Public Annual
Report, Paris.

49
Director of Economic Affairs Ministry of Finance (31st January 2012) via
http://www.treasury.go.ke/index.php/resource-center/cat_view/77-downloads-
from-departments/74-economic-affairs-department-downloads.
Dubin, J. A. & Wilde, L. L. (1988). An Empirical Analysis of Federal Income Tax
Auditing and Compliance. National Tax Journal, 41, 61 – 74.
Duverne, D. (1990). Coordinate audits of income tax and VAT. Presented at the
Conference on administrative aspects of a Value-Added Tax. Washington D.C
Dziadkowski, D. (2002). Development of the Sales Tax Revenue and Financial
Impact of Recent Models in the Sales Tax, Institute for Economic Research,
13, 571-580.
Ebrill, L., Keen, M., Bodin, J & Summers, V. (2001). The Modern VAT, Washington
D.C: IMF.
Eissa, N.O. & Jack, W. (2009). Tax Reforms in Kenya: Policy and Administrative
Issues. Initiative for Policy Dialogue Working Paper Series No. 9
Elffers, H. & Hessing, D. J. (1997). Influencing the Prospects of Tax Evasion. Journal
of Economic Psychology, 18, 289-304.
Feld, L.P. & Tyran, J. R. (2002). Tax evasion and voting: An experimental analysis,
Kyklos Journal, 55, 197-222.
Frey, B.S. & Feld, L.P. (2002). Deterrence and Morale in Taxation: An Empirical
Analysis. CESIFO Working Paper, 760.
Friedland, N., Maital, S. & Rutenberg, A. A. (1978). A Simulation Study of Income
Tax Evasion. Journal of Public Economics, 10(1), 107-116.
Gillis, M., Shoup, C., & Gerardo, P. S. (1990) (Eds.). Value Added Taxation in
Developing Countries: A World Bank Symposium, Washington D.C: World
Bank.
50
Government of Kenya. (1986). Sessional Paper No 1 of 1986 on Economic
Management for Renewed Growth.
Hessing, D. J., Elffers, H., & Weigel, R. H. (1988). An Integrative Scheme for Tax
Evasion Behavior. In Shlomo Maital (Ed.), Applied Behavioral Economics, (2)
, 568- 575). Brighton: Wheatsheaf.
Hessing, D. J., Elffers, H., Robben, H. S. J., and Webley, P. (1992).Does deterrence
deter? Measuring the effect of deterrence on tax compliance in field studies
and experimental studies. In J. Slemrod (Ed.). Why people pay taxes: Tax
compliance and enforcement. Michigan: University of Michigan Press
Hybka, M.M. (2009). VAT Collection Efficiency in Poland Before and After
Accession to the European Union –a Comparative Analysis. Ekonomika, 7-18
Hyun, J. K., (2005).Tax Compliances in Korea and Japan: Why are they different?
Policy Research Institute, Ministry of Finance, pp. 115
Irungu, G. (2013, December). Large taxpayers face fresh audits on VAT. Daily
Nation. Retrieved from http://www.nation.co.ke/business/Large-tax-payers-
face-fresh-audits-on-VAT/-/996/2113732/-/37wetez/-/index.html.
Jantscher, M. C. (1990). Administering the VAT. In M. Gillis, C.S. Shoupand G.P.
Sicat (Eds) Value Added Taxation in Developing Countries. Washington D.C:
World Bank
Kariuki, E. & Ongore, V. (2010).Revenue Administration and Reforms in Kenya:
Experience and Lessons. Kenya Revenue Authority, Nairobi.
Kay, J. A. & Davis, E. H. (1990). The VAT and Services. In Gillis, Malcolm, Carl, S.
Shoup, & Gerardo P. Sicat (1990) (Eds.). Value Added Taxation in Developing
Countries. A World Bank Symposium. The World Bank, Washington D.C. 72-
82.

51
Keen, M. & Smith, S. (2007). VAT Fraud and Evasion: What do we Know and What
can be done. Washington: IMF
Kent, M. & Williams, L.W. (2000). Have VAT Rates Reached their Limit?: An
Empirical Note, Applied Economics Letters, 7(2), 111-115.
Keen, M. & Mansour, M. (2009). Revenue Mobilization in Sub-Saharan Africa:
Challenges from Globalization. IMF Working Paper No. 9/157
Kenya Revenue Authority, (2003). Tax Compliance in Kenya. Research & Corporate
Planning.
Kenya Revenue Authority (KRA website).http://www.kra.go.ke/index.php/large-
taxpayers-office/about-lto/vision
KIPPRA. (2004). Tax Compliance Study: Tax Policy Unit in Macroeconomics
Division. Kenya Institute of Public Policy Research and Analysis, Nairobi
Kothari, C. R. (2004). Research Methodology, Methods and Techniques. (4th ed).
NEW Age International Limited, India.
Kotut, S. C. & Menjo, I. K. (2012). Elasticity and Buoyancy of Tax Components and
Tax Systems in Kenya, Research Journal of Finance and Accounting, 3, (5),
45-55.
Kuliš, D. & Miljenović, Ž, (1997). Estimate of Revenues from the Value Added Tax
in the Republic of Croatia. Occasional paper, 2, Institute of Public Finance,
Zagreb.
Le, T. M. (2003). Value Added Taxation: Mechanism, Design, and Policy Issues.
Paper prepared for the World Bank course on Practical Issues of Tax Policy
in Developing Countries. Washington D.C.
Macharia, J. K. (2014). The Effect of Tax Evasion on Tax Revenues in Kenya
(Unpublished MBA Project), University of Nairobi.

52
Mararia, A, K. (2014). The Effect of Integrated Tax Management System on Tax
Compliance by Small and Medium Sized Enterprises in Nairobi Central
Business District (Unpublished MSC Finance project), University of Nairobi.
Mohd, R. (2010). Tax Knowledge and Tax Compliance Determinants in Self-
Assessment System. An unpublished thesis submitted to the University of
Birmingham for the degree of Doctor of Philosophy, available at http://www.a
cta.uob.edu.au/asfc.html.
Moyi, E., & Ronge, E. (2006). Taxation and Tax Modernization in Kenya: A
Diagnosis of Performance and Options for Further Reform. Institute of
Economic Affairs.
Mugenda, O. M.& Mugenda, A. G. (2003). Research methods: Quantitative and
Qualitative Approaches. Nairobi: Acts Press.
Murray, M. N. (1995). Sales tax compliance and audit selection. National Tax
Journal, 48,515-530.
Naibei, I. K., Momanyi, G. & Oginda, M. N. (2012). Relationship between Income
size, Inspection and VAT Compliance: Evidence from Private Firms in
Kenya. African Research Review, 6(1), 1-17.
Nicoleta, B.M., (2011). A Review of Factors for Tax Compliance. Romania, 69-70.
Nyaga, G. A. (2014). Tax Compliance, Enforcement and Taxpayer Services in Kenya:
A case study (Unpublished Master of Commerce Thesis), Strathmore
University, Kenya.
OECD. (2004). Compliance Risk Management: Managing and improving Tax
Compliance, Centre for Tax Policy and Administration.

53
OECD. (2009). Developments in VAT compliance management in selected countries,
Forum on Tax Administration, Information Note. Paris: OECD.
Republic of Kenya. Statistical Annex to the budget speech (2010/2011& 2011/2012)
Simiyu, N.T. (2003). Taxation in Kenya, (5th ed). Foundation Institute of Professional
s. Nairobi
Slemrod, J. (1992). (ed). Why People Pay Taxes: Tax Compliance and Enforcement.
University of Michigan Press, Ann Arbor.
Slemrod, J. (2007). Cheating Ourselves: The Economics of Tax Evasion. The Journal
of Economic Perspectives, 21(1), 105-112.
Slemrod, J., Blumenthal, M., & Christian, C. (2001). Taxpayer response to an
increased probability of audit: evidence from a controlled experiment in
Minnesota. Journal of Public Economics, 79(3), 455-483.
Tanzi, V.& Shome, P. (1993). A Primer on Tax Evasion. Staff Papers – International
Monetary Fund, 40,(4), 24-26.
Webley, P., Adams C. & Elfers H. (2002). VAT compliance in the United Kingdom,
Center for Tax System Integrity, Research School of Social Sciences. Working
paper, 41.
Yaniv, G. (1999). Tax Compliance and Advance Tax Payments: A Prospect Theory of
Analysis. National Tax Journal, 52, 752-764.
Yitzhaki, S. (1974). A Note on Income Tax Evasion: A Theoretical Analysis. Journal
of Public Economics, 3(2), 2001-2002.

54
Zeljko, B. & Fareed, H. (1993). Determinants of Value-Added Tax Revenue: A Cross
Section Analysis. IMF working paper, Fiscal Affairs Department,
International Monetary Fund, Washington D.C.

55
APPENDICES
APPENDIX I: VAT RATES IN KENYA 1989-2006
Year Number of VAT rates Standard rate Highest Rates
1989-90 15 17 210
1990-91 9 18 150
1991-92 8 18 100
1992-93 6 18 50
1993-94 4 18 40
1994-95 4 18 30
1995-96 4 15 25
1996-97 3 15 15
1997-98 3 17 17
1998-99 4 16 16
1999-00 4 15 15
2000-01 4 18 18
2001-02 4 18 18
2002-03 4 18 18
2003-04 3 16 16
2005-06 1 16 16
Source: KRA.

56
APPENDIX II: VAT REVENUE FROM ENFORCEMENT
MEASURES
COMPANY VAT AUDIT
RATE
PENALTIES CRIMINAL
SANCTIONS
VAT ON
IMPORTS
Central Glass 0.0168 .803 .035 .005 .513
Africa Oil Kenya 0.014 .0115 .0038 .035 .428
PIL 0.0186 .585 .008 .0038 .0033
Ashut Quality
Products
0.0156 .149 .0185 .008 .0059
Red Sea Chemist 0.0158 .803 .003 .0185 .0065
Dorman’s Ltd 0.0148 .0115 .00745 .003 .0172
Rupa Cotton
Mills EPZ Ltd
0.0188 .149 .0046 .00745
.0033
Commercial
Motor Spare Ltd
0.0168 .803 .0185 .0046 .0059
Chandaria
Industries
0.0202 .0115 .003 .0185 .0065
East Africa Breweries 0.0118 .585 .00745 .003 .0172
Unga Group Ltd 0.0202 .149 .005 .00745 .433
Uniliver Kenya Ltd 0.0248 .803 .035 .005 .485
GM 0.015 .0115 .0038 .035 .513
Kenya Tea Packers 0.0104 .585 .008 .0038 .428
Delmonte 0.02 .149 .0185 .008 .0033
Reckitt Benkister East 0.084 .803 .0046 .0185 .513
Beta Health Care 0.0202 .0115 .0185 .003 .428
Nestle Kenya Ltd 0.0206 .149 .003 .00745 .0033
Crown Berger 0.0176 .803 .00745 .005 .0059
East African Cables 0.0164 .0115 .005 74.65 .0065
Equator Bottles Ltd 0.0192 .775 .035 28.73 .0172
Nairobi Bottlers Ltd 0.0334 .708 .0038 64.06 .0033
Coastal Bottlers Ltd 0.0332 .783 .008 62.07 .0059
PL .00745 .585 .005 .0172 .433
Colgate Palmolive .0046 .149 .035 .0033 .485
Haco Tigers .00185 .803 .0038 .0059 .513
Kisii Bottlers .003 .0115 .008 .0065 .428
Sameer Africa .00745 .585 .0185 .0172 .0033
Ellams Ltd .0046 .149 .003 .0033 .0059
PZ Cusssons .0185 .803 .00745 .0059 .0065
MRM .003 .0115 .0046 .0065 .0172
Spin Knit .00745 .149 .0185 .0172 .0033
Rai Plywoods .0046 .803 .003 .0033 .0059
Corrugated Sheets .0185 .0115 .00745 .0059 .0065
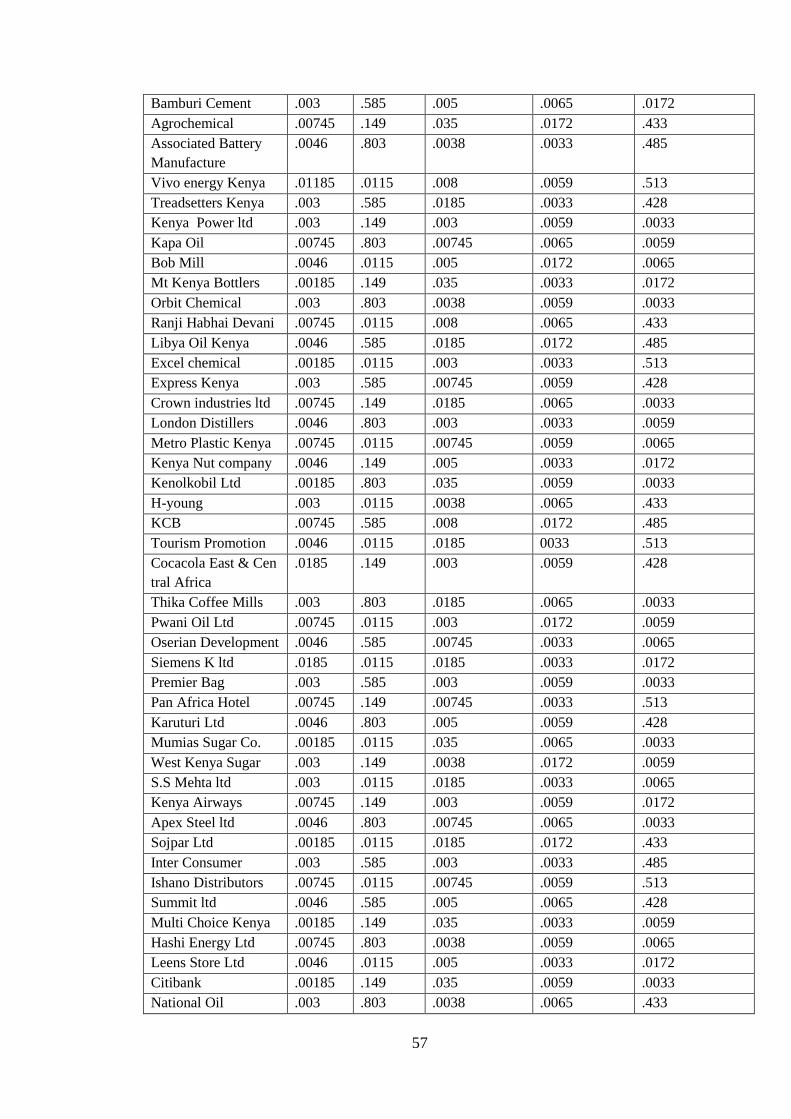
57
Bamburi Cement .003 .585 .005 .0065 .0172
Agrochemical .00745 .149 .035 .0172 .433
Associated Battery
Manufacture
.0046 .803 .0038 .0033 .485
Vivo energy Kenya .01185 .0115 .008 .0059 .513
Treadsetters Kenya .003 .585 .0185 .0033 .428
Kenya Power ltd .003 .149 .003 .0059 .0033
Kapa Oil .00745 .803 .00745 .0065 .0059
Bob Mill .0046 .0115 .005 .0172 .0065
Mt Kenya Bottlers .00185 .149 .035 .0033 .0172
Orbit Chemical .003 .803 .0038 .0059 .0033
Ranji Habhai Devani .00745 .0115 .008 .0065 .433
Libya Oil Kenya .0046 .585 .0185 .0172 .485
Excel chemical .00185 .0115 .003 .0033 .513
Express Kenya .003 .585 .00745 .0059 .428
Crown industries ltd .00745 .149 .0185 .0065 .0033
London Distillers .0046 .803 .003 .0033 .0059
Metro Plastic Kenya .00745 .0115 .00745 .0059 .0065
Kenya Nut company .0046 .149 .005 .0033 .0172
Kenolkobil Ltd .00185 .803 .035 .0059 .0033
H-young .003 .0115 .0038 .0065 .433
KCB .00745 .585 .008 .0172 .485
Tourism Promotion .0046 .0115 .0185 0033 .513
Cocacola East & Cen
tral Africa
.0185 .149 .003 .0059 .428
Thika Coffee Mills .003 .803 .0185 .0065 .0033
Pwani Oil Ltd .00745 .0115 .003 .0172 .0059
Oserian Development .0046 .585 .00745 .0033 .0065
Siemens K ltd .0185 .0115 .0185 .0033 .0172
Premier Bag .003 .585 .003 .0059 .0033
Pan Africa Hotel .00745 .149 .00745 .0033 .513
Karuturi Ltd .0046 .803 .005 .0059 .428
Mumias Sugar Co. .00185 .0115 .035 .0065 .0033
West Kenya Sugar .003 .149 .0038 .0172 .0059
S.S Mehta ltd .003 .0115 .0185 .0033 .0065
Kenya Airways .00745 .149 .003 .0059 .0172
Apex Steel ltd .0046 .803 .00745 .0065 .0033
Sojpar Ltd .00185 .0115 .0185 .0172 .433
Inter Consumer .003 .585 .003 .0033 .485
Ishano Distributors .00745 .0115 .00745 .0059 .513
Summit ltd .0046 .585 .005 .0065 .428
Multi Choice Kenya .00185 .149 .035 .0033 .0059
Hashi Energy Ltd .00745 .803 .0038 .0059 .0065
Leens Store Ltd .0046 .0115 .005 .0033 .0172
Citibank .00185 .149 .035 .0059 .0033
National Oil .003 .803 .0038 .0065 .433

58
Corporation
Amiran
Communications
.00745 .0115 .0185 .0172 .485
Wines of the World .0046 .149 .003 .0033 .513
Kenya Kazi Services .00185 .0115 .00745 .0059 .428
Gapco Kenya Ltd .003 .149 .0185 .0065 .0033
Erdeman Kenya ltd .0046 .803 .003 .0172 .0059
Keroche Ltd .00185 .0115 .00745 .0033 .0065
AAA Growers .003 .585 .005 .0033 .0172
Safaricom Ltd .00745 .0115 .035 .0059 .433
Erdeman Co Ltd .0046 .585 .005 .0033 .485
Total Touch Cargo .00745 .149 .035 .0059 .513
Alan Dick Company .0046 .585 .0038 .0172 .428
Kenya Sugar
Authority
.00185 .149 .005 .0033 .0059
Kenya Re .003 .803 .035 .0059 .0065
Hass Petroleum .00745 .0115 .0038 .0065 .0172
YH Wholesalers .0046 .149 .0185 .0033 .0033
Lion of Kenya
Insurance
.00185 .803 .003 .0059 .433
Kenya AA .003 .0115 .00745 .0033 .485
Alliance One
Tobbaco
.00745 .149 .0185 .0059 .513
Naivas Ltd .0046 .0115 .003 .0065 .428
Mobile Kenya Ltd .00185 .803 .035 .0033 .485
Liquid
Telecommunications
.003 .0115 .005 .0059 .513
African Spirits Ltd .00745 .585 .035 .0065 .428
Kibos Sugar .0046 .0115 .0038 .0172 .0059
Soltan Selmac Ltd .00185 .585 .005 .0033 .0065
Air Kenya Ltd .003 .585 .035 .0358 .0172
Aggreko
International
.00745 .0115 .0038 .0356 .0033
Erickson
international
.0046 .585 .0185 .0148 .433
Gulf energy ltd .00185 .149 .003 .01456 .485
Source: KRA Database

59
APPENDIX III: SUMMARY OF GDP & VAT IN BILLIONS OF
KENYA SHILLINGS.
YEAR GDP
IN
BKSH
TOTAL
VAT
FROM
LTO
REVENUE
FROM
AUDITS
TOTAL VAT
REVENUE
(LTO+DR)
VAT
REVENUE
FROM
PENALTIES
VAT
REVENUE FROM
TAXPAYERS
INVESTGATED
FOR FRAUD
VAT ON
IMPORTS
2008 2107.6 55.262 0.633 141.008 0.44 0.36 60.408
2009 2366.98 30.16 17.63 145.53 0.142 0.52 62.946
2010 2549.83 78.006 11.62 155.23 0.27 0.26 75.336
2011 3024.79 69.73 55.97 185.38 0.265 0.41 95.149
2012 3176.03 47.09 45.87 231.31 0.45 0.28 75.740
2013 3331.65 66.90 81.21 218.71 0.138 0.27 114.197
2014 5340.01 70.04 29.41 255.22 0.213 0.32 121.56
Source: KRA Revenue Bulletin – 2014 & KNBS

60
APPENDIX IV: VAT CONTRIBUTION TO GDP;
CONTRIBUTION OF VAT FROM AUDIT, PENATIES,
CRIMINAL SANTIONS & IMPORTS TO VAT REVENUE
YEAR
VAT/GDP
(Y)
AUDIT
RATE
(X1)
PENALTIES
(X2)
CRIMINAL
SACTIONS
(X3)
VAT ON IMPORTS/TOTAL
VAT
(X4)
2008 .0003 .0115 .008 .0065 .428
2009 .00745 .585 .005 .0172 .433
2010 .0046 .149 .035 .0033 .485
2011 .0185 .803 .0038 .0059 .513
2012 .0144 .974 .0096 .0059 .327
2013 .0244 .012 .0021 .004 .522
2014 .0055 .42 .003 .0046 .476
Source: KRA 2014