The effect of alkali niobate addition ... - D-Scholarship@Pitt
8
The effect of alkali niobate addition on the phase stability and dielectric properties of Pb ( Zn 1 ∕ 3 Nb 2 ∕ 3 ) O 3 based ceramic Jong-Sung Park, Jung-Kun Lee, and Kug Sun Hong Citation: Journal of Applied Physics 101, 114101 (2007); doi: 10.1063/1.2733612 View online: http://dx.doi.org/10.1063/1.2733612 View Table of Contents: http://scitation.aip.org/content/aip/journal/jap/101/11?ver=pdfcov Published by the AIP Publishing Articles you may be interested in Dielectric and AC-conductivity studies of Dy2O3 doped (K0.5Na0.5)NbO3 ceramics AIP Advances 4, 087113 (2014); 10.1063/1.4892856 Enhanced dielectric, ferroelectric, and electrostrictive properties of Pb(Mg1/3Nb2/3)0.9Ti0.1O3 ceramics by ZnO modification J. Appl. Phys. 113, 204101 (2013); 10.1063/1.4801881 Structural change in polar nanoregion in alkali niobate added Pb(Zn1/3Nb2/3)0.95Ti0.05O3 single crystal and its effect on ferroelectric properties J. Appl. Phys. 112, 074109 (2012); 10.1063/1.4757620 ( 1 − x ) Ba Ti O 3 − x ( Na 0.5 K 0.5 ) Nb O 3 ceramics for multilayer ceramic capacitors Appl. Phys. Lett. 90, 132905 (2007); 10.1063/1.2717559 Relaxorlike dielectric properties and history-dependent effects in the lead-free K 0.5 Na 0.5 Nb O 3 – Sr Ti O 3 ceramic system Appl. Phys. Lett. 85, 994 (2004); 10.1063/1.1779947 [This article is copyrighted as indicated in the article. Reuse of AIP content is subject to the terms at: http://scitation.aip.org/termsconditions. Downloaded to ] IP: 130.49.166.8 On: Tue, 04 Nov 2014 19:16:46
Transcript of The effect of alkali niobate addition ... - D-Scholarship@Pitt

The effect of alkali niobate addition on the phase stability and dielectric properties ofPb ( Zn 1 ∕ 3 Nb 2 ∕ 3 ) O 3 based ceramicJong-Sung Park, Jung-Kun Lee, and Kug Sun Hong Citation: Journal of Applied Physics 101, 114101 (2007); doi: 10.1063/1.2733612 View online: http://dx.doi.org/10.1063/1.2733612 View Table of Contents: http://scitation.aip.org/content/aip/journal/jap/101/11?ver=pdfcov Published by the AIP Publishing Articles you may be interested in Dielectric and AC-conductivity studies of Dy2O3 doped (K0.5Na0.5)NbO3 ceramics AIP Advances 4, 087113 (2014); 10.1063/1.4892856 Enhanced dielectric, ferroelectric, and electrostrictive properties of Pb(Mg1/3Nb2/3)0.9Ti0.1O3 ceramics by ZnOmodification J. Appl. Phys. 113, 204101 (2013); 10.1063/1.4801881 Structural change in polar nanoregion in alkali niobate added Pb(Zn1/3Nb2/3)0.95Ti0.05O3 single crystal and itseffect on ferroelectric properties J. Appl. Phys. 112, 074109 (2012); 10.1063/1.4757620 ( 1 − x ) Ba Ti O 3 − x ( Na 0.5 K 0.5 ) Nb O 3 ceramics for multilayer ceramic capacitors Appl. Phys. Lett. 90, 132905 (2007); 10.1063/1.2717559 Relaxorlike dielectric properties and history-dependent effects in the lead-free K 0.5 Na 0.5 Nb O 3 – Sr Ti O 3ceramic system Appl. Phys. Lett. 85, 994 (2004); 10.1063/1.1779947
[This article is copyrighted as indicated in the article. Reuse of AIP content is subject to the terms at: http://scitation.aip.org/termsconditions. Downloaded to ] IP:
130.49.166.8 On: Tue, 04 Nov 2014 19:16:46

The effect of alkali niobate addition on the phase stability and dielectricproperties of Pb„Zn1/3Nb2/3…O3 based ceramic
Jong-Sung ParkSchool of Materials Science and Engineering, Seoul National University, Seoul 151-744, Korea
Jung-Kun LeeMaterials Science and Technology Division, Los Alamos National Laboratory, Los Alamos,New Mexico 87545
Kug Sun Honga�
School of Materials Science and Engineering, Seoul National University, Seoul 151-744, Korea
�Received 26 August 2006; accepted 18 March 2007; published online 1 June 2007�
While Pb�Zn1/3Nb2/3�O3–PbTiO3 �PZN-PT� single crystals have shown superior ferroelectricproperties, less scientific and technical interests have been placed on PZN-PT polycrystallineceramics due to their poor thermodynamic stability and the difficult processing conditions. Here, westabilized the PZN-PT based ceramics by adding alkali niobates such as NaNbO3 �NN� and KNbO3
�KN� and investigated their structure and dielectric properties. Two stabilization mechanisms aresuggested in alkali niobate added PZN-PT ceramics, increased tolerance factor and enhancedelectronegativity difference. KN stabilized the perovskite structure of PZN-PT based ceramics moreeffectively than NN. Both PZN-PT-KN and PZN-PT-NN ceramics showed the typical behavior ofrelaxor ferroelectrics. The temperature of maximum dielectric constant of PZN-PT-NN was slightlyhigher than that of the PZN-PT-KN, which was explained by the difference in ionic size and B-siteordering. © 2007 American Institute of Physics. �DOI: 10.1063/1.2733612�
I. INTRODUCTION
Relaxor ferroelectric materials with the general formulaPb�B�B��O3 are of great interest because of their high piezo-electric constants and electromechanical coefficients. Amongthem, Pb�Zn1/3Nb2/3�O3–PbTiO3 �PZN-PT� single crystalshave shown excellent piezoelectric properties �Kp�92%,d33=2500 pC/N� near a morphotropic phase boundary�MPB� between rhombohedral and tetragonal phases.1 How-ever, since the PZN-PT system has poor thermodynamic sta-bility, it can be synthesized only by adding excess Pb flux athigh temperature or applying high pressure. The instabilityof PZN-PT is attributed to �i� mutual interaction between thelone pairs of the Pb2+ cation and Zn2+ cations and �ii� shortPb–O bond length.2,3 To synthesize the PZN based ceramics,other perovskite materials such as BaTiO3 �BT� and SrTiO3
�ST� are added as phase stabilizers.4,5 The stabilization ofPZN by partially substituted BT and ST was explained usingtolerance factor or electronegativity difference. To make theperovskite structure stable, the former is required to bewithin proper value of ionic radius for the perovskite struc-ture and the latter is required for strong ionic bond. BT andST well satisfy these conditions because the tolerance factorof BaTiO3 �1.06� and SrTiO3 �1.00� compensates the smalltolerance factor of PZN �0.986� and the electronegativity dif-ference of BaTiO3 �2.23� and SrTiO3 �2.20� increases that ofPZN �1.80�. However, because of the low Curie temperatureof BT and ST, the 10 mol % addition of BT decreased thetemperature of maximum dielectric constant �Tmax� of
PZN-PT based ceramics to below about 60 °C and the addi-tion of ST reduced the Tmax of PZN based ceramic moreseriously.6,7 Therefore the dependence of piezoelectric prop-erties on temperature is increased in PZN-PT-BT and PZN-PT-ST based ceramics.
In this study, we stabilize PZN based ceramics by addingalkali niobates and investigate their phase transition behaviorand dielectric properties. KNbO3 �KN� is ferroelectric withorthorhombic perovskite structure at room temperature andhas the same sequence of phase transition as BaTiO3
�rhombohedral↔orthorhombic↔ tetragonal↔cubic phase�but all the transitions occur at higher temperature thanBaTiO3. NaNbO3 �NN� is antiferroelectic with orthorhombicperovskite structure at room temperature and is transformedto the cubic structure above 640 °C.7–9 Therefore, the in-creased thermal stability of PZN based ceramics is expectedin PZN-PT-KN and PZN-PT-NN systems. Alkali ions havebeen widely used to control the electric properties of perov-skite ferroelectrics.10–12 In both Pb�Zr,Ti�O3 �PZT� andPZN, the alkali ions substituting for A-site ions work as elec-tric hardener. They increase coercive field and quality factor�Qm�, and lower dielectric constant and dielectric loss.10 Theeffect of the acceptor on the electrical properties has beenattributed to the formation of oxygen vacancies to keepcharge neutrality in solid solutions. However, in this study,increase in the concentration of oxygen vacancies by addingalkali niobate is negligible because Nb5+ in B-site of theperovskite structure compensates the negative charge of thealkali ions in A-site of the perovskite structure. Therefore,the other factors such as the tolerance factor and the elec-tronegativity difference become more important in this work.Here, we present the structural stability against temperature
a�Author to whom correspondence should be addressed; electronic mail:[email protected]
JOURNAL OF APPLIED PHYSICS 101, 114101 �2007�
0021-8979/2007/101�11�/114101/7/$23.00 © 2007 American Institute of Physics101, 114101-1
[This article is copyrighted as indicated in the article. Reuse of AIP content is subject to the terms at: http://scitation.aip.org/termsconditions. Downloaded to ] IP:
130.49.166.8 On: Tue, 04 Nov 2014 19:16:46

and the effects of A-site cation on the dielectric properties ofalkali niobate doped PZN, and discuss the nature of thephase stability.
II. EXPERIMENTAL PROCEDURES
The compositions of the PZN-PT-RN �R=Na,K� solidsolution were prepared containing various amounts of PT
across the MPB using the mixed oxide method. Reagent-grade PbO, ZnO, Nb2O5, K2CO3, Na2CO3, and TiO2 pow-ders were used as the starting materials. Starting materialswere weighed, and then mixed for 24 h with stabilized ZrO2
media and ethanol. After drying, the mixed powders werecalcined for 2 h at 850 °C. The calcined powders were ballmilled for 24 h. The dried powders were granulated, pressed
FIG. 1. �Color online� XRD results of 80%PZN+10%PT+10%RN �R=K,Na� after calcinations as a function of temperature and PbO excess; �a�80PZN+10PT+10KNbO3, �b� 80PZN+10PT+10NaNbO3, �c� 80PZN-10PT-10KN+x mol % PbO after calcination at 1100 °C, �d� 80PZN-10PT-10KN+x mol % PbO after calcination at 1100 °C, and �e� a ratio of perovskite phase in various PZN-PT-RN.
114101-2 Park, Lee, and Hong J. Appl. Phys. 101, 114101 �2007�
[This article is copyrighted as indicated in the article. Reuse of AIP content is subject to the terms at: http://scitation.aip.org/termsconditions. Downloaded to ] IP:
130.49.166.8 On: Tue, 04 Nov 2014 19:16:46
into pellets with 1000 kg/cm2 uniaxial pressure, then sin-tered with PbO atmospheric powders in a covered crucible at1000–1100 °C for 2 h.
The crystal structure of solid solution samples was in-vestigated using x-ray diffraction. Data collection was per-formed in the 2� range of 20°–60° using a Bragg-Brentanodiffractometer and Cu K� radiation �M18XHF-SRA, MACScience Co.�. In order to obtain enhanced resolution, �111�and �200� reflections were measured by a step scanning witha step size of 0.01° and counting time of 5 s/step.
Electrodes for dielectric measurements with 10 mm di-ameter were prepared by sputtering platinum. The dielectricconstants were measured by using an impedance analyzer�Hewlett Packard, model 4194A, USA� in the frequencyrange from 100 Hz to 10 MHz at ac electric voltage of 1 V.The samples were placed in a furnace and heated from roomtemperature to 300 °C during the dielectric measurement.Cooling and heating were performed at a rate of 50 °C/h.
III. RESULTS AND DISCUSSION
A. Stabilization of PZN based solid solutions
Figures 1�a� and 1�b� show x-ray diffraction �XRD� re-sults of 80%PZN+10%PT+10%RN �R=K,Na� after calci-nations as a function of temperature and PbO excess. Theamount of perovskite increased with increasing temperatureand the addition of 10%RN accelerated the formation of theperovskite phase. However, the small amount of the pyro-
chlore phase23 was still observed even after 1100 °C calci-nation. In Fig. 1�c�, the ratio of a perovskite phase compoundwas calculated by the following equation:
Ratio of perovskite phase �%� =Iperov
Iperov + Ipyro� 100 �1�
�Iperov, intensity of perovskite �110� peak; Ipyro, intensity ofpyrochlore �222� peak�. In 90%PZN-10%PT, the amount ofthe perovskite phase was smaller than 20% and most of thecalcined powders have the pyrochlore phase, as shown in thefollowing equation:13
3PbO + ZnO + Nb2O5 → Pb2Nb2O7 + PbO + ZnO. �2�
However, when 10%RN was added, the ratio of the perov-skite phase increased up to 92%–95% as the calcined tem-perature increased up to 1000 °C. Above 1000 °C, the ratioof the perovskite phase decreased due to the volatilization ofPbO. To compensate the volatized PbO, 6% of excessivePbO was added to PZN-PT-RN. Figures 1�c� and 1�d� show
TABLE I. The tolerance factor and electronegativity difference ofPb�Zn1/3Nb2/3�O3, KNbO3, and NaNbO3.
Pb�Zn1/3Nb2/3�O3 KNbO3 NaNbO3
Tolerance factor 0.986 1.054 0.967Electronegativity difference 1.80 2.23 2.18
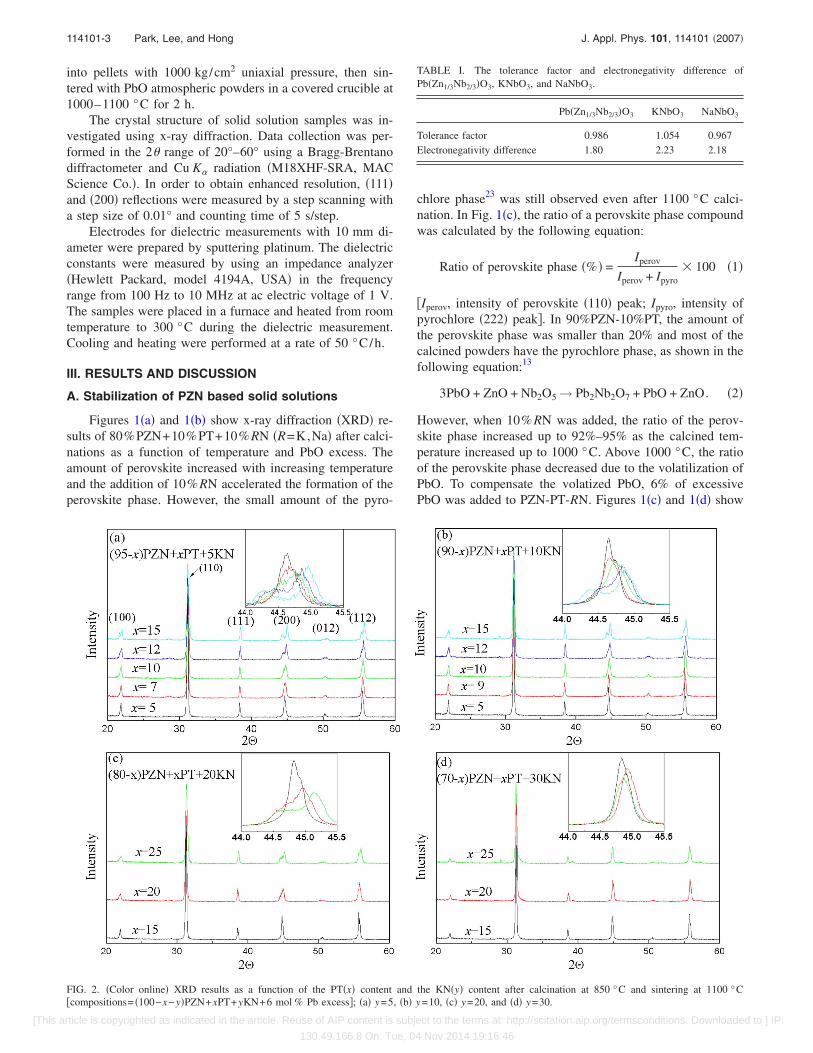
FIG. 2. �Color online� XRD results as a function of the PT�x� content and the KN�y� content after calcination at 850 °C and sintering at 1100 °C�compositions= �100−x−y�PZN+xPT+yKN+6 mol % Pb excess�; �a� y=5, �b� y=10, �c� y=20, and �d� y=30.
114101-3 Park, Lee, and Hong J. Appl. Phys. 101, 114101 �2007�
[This article is copyrighted as indicated in the article. Reuse of AIP content is subject to the terms at: http://scitation.aip.org/termsconditions. Downloaded to ] IP:
130.49.166.8 On: Tue, 04 Nov 2014 19:16:46
the effect of excess PbO on the phase stability ofPZN-PT-RN. Pure perovskite phase was obtained at1000 °C calcination and maintained at temperature higherthan 1000 °C by adding both 10% RN and 6% of excessPbO. Also, it is noted that KN stabilized the perovskite phasemore effectively than NN.
There are several possible mechanisms for the stabiliza-tion of the perovskite phase such as tolerance factor, elec-tronegativity difference, and repulsive interaction between�6s�2 lone pair of Pb2+ cation and Zn2+ cation.2 When com-prising solid solutions with PZN, both KN and NN decreasethe repulsive interaction between �6s�2 lone pairs of Pb2+
cation and Zn2+ cation because smaller Nb5+ cation is sub-stituted for larger Zn2+.2 The other two factors affecting thestability of the perovskite structure are tolerance factor andelectronegativity. The tolerance factor and the electronega-tivity difference are given by the following equations:
t =�2�rA + rO�2�rB + rO�
�tolerance factor� , �3�
� =��A−O + �B−O�
2�electronegativity difference� . �4�
The tolerance factor and electronegativity difference betweencation and anion for PZN, KN, and NN are summarized in
Table I.2,14 The tolerance factor and electronegativity differ-ence of KN are larger than those of PZN. Therefore, theaddition of KN into PZN can increase the tolerance factorand electronegativity difference of PZN based solid solu-tions. In the case of NN, its tolerance factor is smaller thanthat of PZN and only its electronegativity difference is largerthan that of PZN. Therefore, NN decreases the tolerance fac-tor while it increases the electronegativity difference. It isnoted that PZN can be stabilized only by the increase ofelectronegativity difference though the tolerance factor de-creases by adding NN to PZN-PT. This indicates that theelectronegativity may be more important to stabilize the per-ovskite structure of PZN than the tolerance factor. It isshown that three factors contribute to the stabilization of theperovskite phase when KN is added, increased tolerance fac-tor, enhanced electronegativity difference, and decreased re-pulsive interaction. In the case of addition of NN, the twolatter terms contributed to the stabilization of the perovskitestructure. This is the reason why KN stabilized the perov-skite phase of PZN based solid solutions more effectivelythan NN.
B. Change in the MPB of the ternary systems
Figure 2 shows the XRD results of perovskite PZN-PT-KN with 6 mol % Pb excess that are sintered at 1100 °Cfor 2 h. The inset in Fig. 2 enlarges the �002� peak. The splitof peak to �200� and �002� was found with increasing PTcontent. This indicates the morphotropic phase transition be-tween the rhombohedral and tetragonal phases in the PZN-PT-KN solid solutions. The amount of PT corresponding to
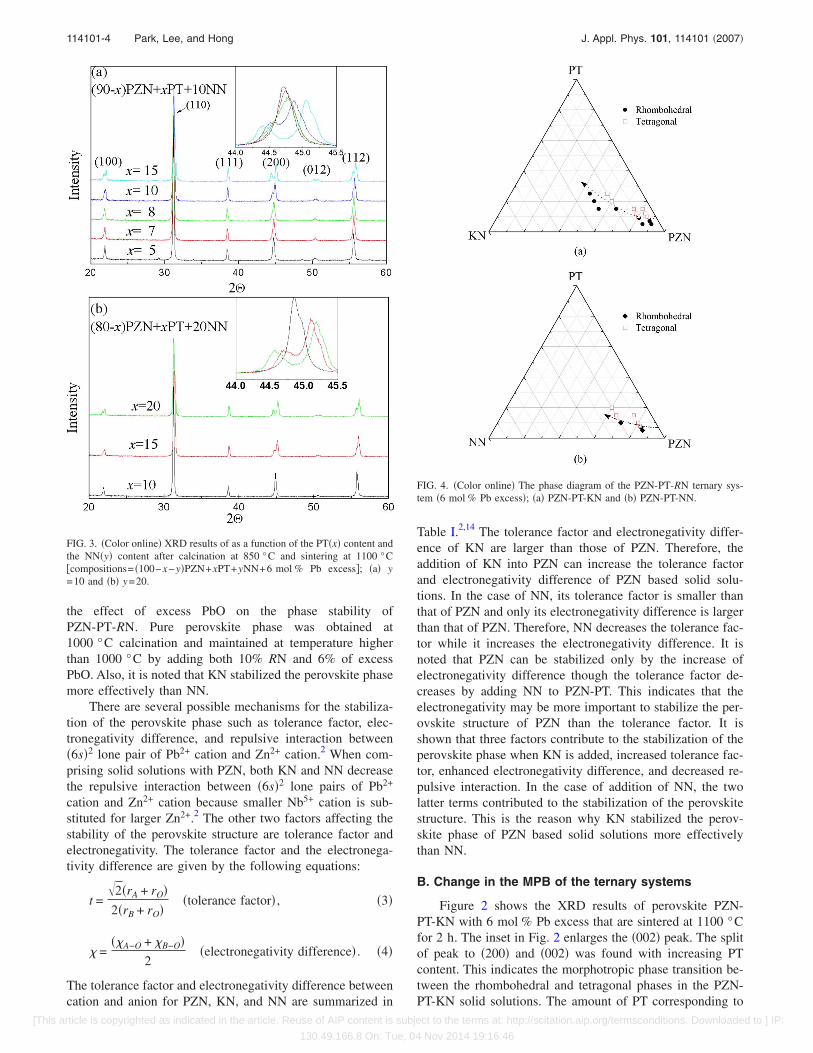
FIG. 3. �Color online� XRD results of as a function of the PT�x� content andthe NN�y� content after calcination at 850 °C and sintering at 1100 °C�compositions= �100−x−y�PZN+xPT+yNN+6 mol % Pb excess�; �a� y=10 and �b� y=20.
FIG. 4. �Color online� The phase diagram of the PZN-PT-RN ternary sys-tem �6 mol % Pb excess�; �a� PZN-PT-KN and �b� PZN-PT-NN.
114101-4 Park, Lee, and Hong J. Appl. Phys. 101, 114101 �2007�
[This article is copyrighted as indicated in the article. Reuse of AIP content is subject to the terms at: http://scitation.aip.org/termsconditions. Downloaded to ] IP:
130.49.166.8 On: Tue, 04 Nov 2014 19:16:46
the MPB of the PZN-PT-KN solid solutions depends on theratio of KN. As the ratio of KN increases, the MPB rangemoves to the regime with larger amount of PT.
Figure 3 is the XRD results of the PZN-PT-NN solidsolutions with 6 mol % Pb excess that are sintered at1100 °C for 2 h. The morphotropic phase transition betweenthe rhombohedral and tetragonal phases was observed when7%–8% PT was added to the solid solution containing 10%NN and 10–15 mol % PT was added to the solid solutioncontaining 20% NN. This also shows that the MPB moved tothe regime with larger amount of PT as the amount of alkaliniobate increases. In contrast to PZN-PT-KN, the pure per-ovskite phase of PZN-PT-NN was not synthesized when theamount of alkali niobate was as small as 5 mol %, which canbe explained by the different tolerance factors.
Figure 4 shows phase diagrams summarizing the resultsof XRD analysis on the phase evolution. The amount of PTto induce the morphotropic phase transition �xPT
MPB� is larger
for PZN-PT-KN than for PZN-PT-NN when the amount ofKN is the same as that of NN. This difference in the crystalstructure of the solid solution is attributed to the ionic size.When larger K cation �1.64 � replaced smaller Pb cation�1.49 �,14 the displacement of Pb cation along the �001�direction becomes more difficult due to elastic and electricinteractions, and the MPB of the solid solutions was ob-served in the regime with larger content of PT.5,15
C. Dependence of dielectric properties on temperature
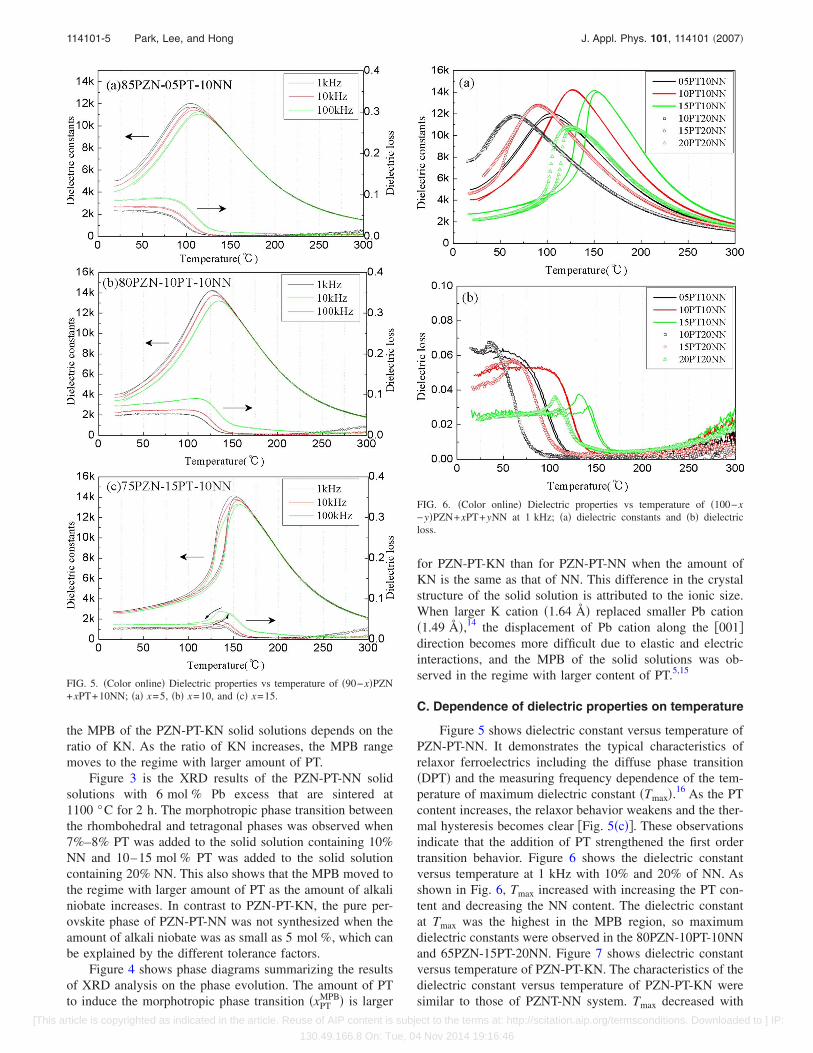
Figure 5 shows dielectric constant versus temperature ofPZN-PT-NN. It demonstrates the typical characteristics ofrelaxor ferroelectrics including the diffuse phase transition�DPT� and the measuring frequency dependence of the tem-perature of maximum dielectric constant �Tmax�.
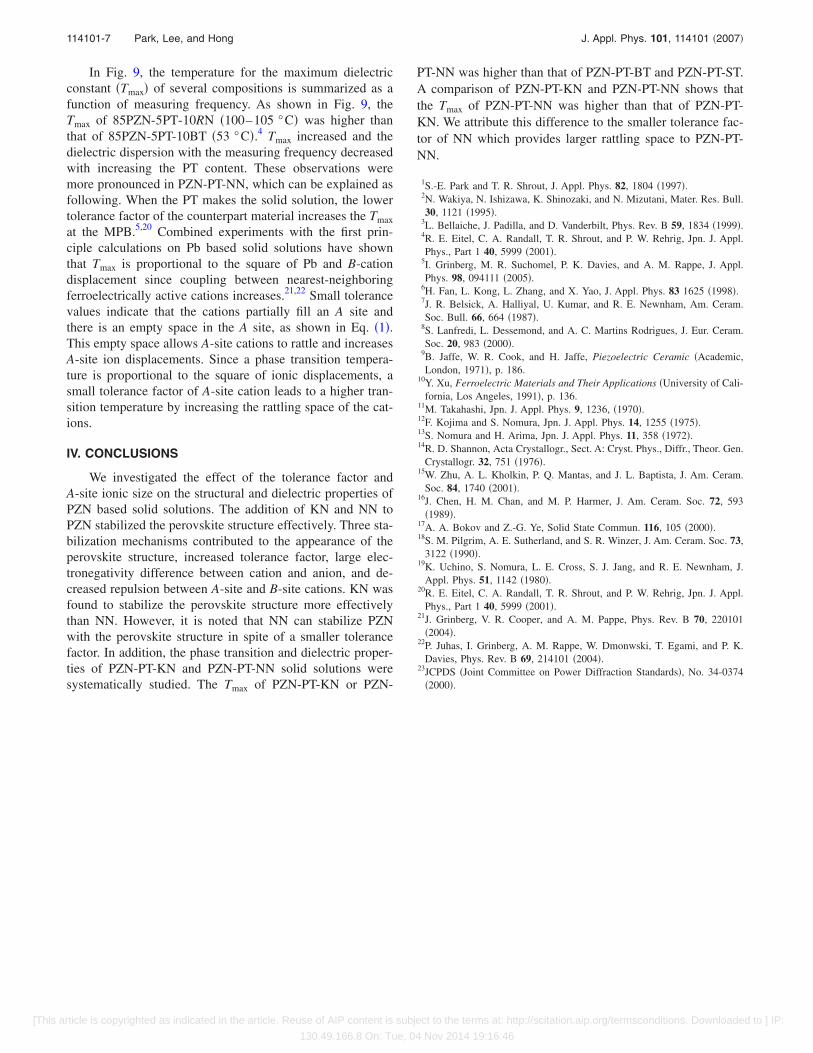
16 As the PTcontent increases, the relaxor behavior weakens and the ther-mal hysteresis becomes clear �Fig. 5�c��. These observationsindicate that the addition of PT strengthened the first ordertransition behavior. Figure 6 shows the dielectric constantversus temperature at 1 kHz with 10% and 20% of NN. Asshown in Fig. 6, Tmax increased with increasing the PT con-tent and decreasing the NN content. The dielectric constantat Tmax was the highest in the MPB region, so maximumdielectric constants were observed in the 80PZN-10PT-10NNand 65PZN-15PT-20NN. Figure 7 shows dielectric constantversus temperature of PZN-PT-KN. The characteristics of thedielectric constant versus temperature of PZN-PT-KN weresimilar to those of PZNT-NN system. Tmax decreased with
FIG. 5. �Color online� Dielectric properties vs temperature of �90−x�PZN+xPT+10NN; �a� x=5, �b� x=10, and �c� x=15.
FIG. 6. �Color online� Dielectric properties vs temperature of �100−x−y�PZN+xPT+yNN at 1 kHz; �a� dielectric constants and �b� dielectricloss.
114101-5 Park, Lee, and Hong J. Appl. Phys. 101, 114101 �2007�
[This article is copyrighted as indicated in the article. Reuse of AIP content is subject to the terms at: http://scitation.aip.org/termsconditions. Downloaded to ] IP:
130.49.166.8 On: Tue, 04 Nov 2014 19:16:46

decreasing the PT content or increasing the KN content, andthe dielectric constant at Tmax was maximized in the MPBregion.
The DPT of PZN-PT-RN is analyzed quantitatively byusing a diffuseness parameter which Smolenskii and Rolovintroduced to express the standard deviation in the Gaussiandistribution of Curie temperatures �TC� of individualnanodomains,17–19
�max
�= 1 +
�T − Tm�2
2�g2 . �5�
When T�Tmax, �max/� is linearly proportional to �T−Tm�2
and the diffuseness �g is determined from the slope of �max/�
vs �T−Tm�2. The diffuseness parameter is calculated in Fig.8. The diffuseness of DPT decreased as the PT content in-creased or the NN content decreased. In addition, Fig. 8shows that the diffuseness of PZN-PT-KN is larger than thatof PZN-PT-NN. 75PZN-10NN-15PT has a very small � of44.1, which is consistent with the appearance of the firstorder phase transition in Fig. 5�c�. This indicates that thechemical properties of an individual nanorelaxor includingTC are more uniform in PZN-PT-NN solid solutions than inPZN-PT-KN.
FIG. 7. �Color online� Dielectric properties vs temperature for �100−x−y�PZN+xPT+yKN; �a� x=5, y=10, �b� x=15, y=10, and �c� measured at1 kHz.
FIG. 8. Diffuseness parameter of �100−x−y�PZN+xPT+yRN.
FIG. 9. �Color online� Tmax vs frequency of PZNT-RN �R=Li,Na,K��composition= �100−x−y�PZN+xPT+yRN�; �a� 10NN and 10KN and �b�20NN and 20KN.
114101-6 Park, Lee, and Hong J. Appl. Phys. 101, 114101 �2007�
[This article is copyrighted as indicated in the article. Reuse of AIP content is subject to the terms at: http://scitation.aip.org/termsconditions. Downloaded to ] IP:
130.49.166.8 On: Tue, 04 Nov 2014 19:16:46
In Fig. 9, the temperature for the maximum dielectricconstant �Tmax� of several compositions is summarized as afunction of measuring frequency. As shown in Fig. 9, theTmax of 85PZN-5PT-10RN �100–105 °C� was higher thanthat of 85PZN-5PT-10BT �53 °C�.4 Tmax increased and thedielectric dispersion with the measuring frequency decreasedwith increasing the PT content. These observations weremore pronounced in PZN-PT-NN, which can be explained asfollowing. When the PT makes the solid solution, the lowertolerance factor of the counterpart material increases the Tmax
at the MPB.5,20 Combined experiments with the first prin-ciple calculations on Pb based solid solutions have shownthat Tmax is proportional to the square of Pb and B-cationdisplacement since coupling between nearest-neighboringferroelectrically active cations increases.21,22 Small tolerancevalues indicate that the cations partially fill an A site andthere is an empty space in the A site, as shown in Eq. �1�.This empty space allows A-site cations to rattle and increasesA-site ion displacements. Since a phase transition tempera-ture is proportional to the square of ionic displacements, asmall tolerance factor of A-site cation leads to a higher tran-sition temperature by increasing the rattling space of the cat-ions.
IV. CONCLUSIONS
We investigated the effect of the tolerance factor andA-site ionic size on the structural and dielectric properties ofPZN based solid solutions. The addition of KN and NN toPZN stabilized the perovskite structure effectively. Three sta-bilization mechanisms contributed to the appearance of theperovskite structure, increased tolerance factor, large elec-tronegativity difference between cation and anion, and de-creased repulsion between A-site and B-site cations. KN wasfound to stabilize the perovskite structure more effectivelythan NN. However, it is noted that NN can stabilize PZNwith the perovskite structure in spite of a smaller tolerancefactor. In addition, the phase transition and dielectric proper-ties of PZN-PT-KN and PZN-PT-NN solid solutions weresystematically studied. The Tmax of PZN-PT-KN or PZN-
PT-NN was higher than that of PZN-PT-BT and PZN-PT-ST.A comparison of PZN-PT-KN and PZN-PT-NN shows thatthe Tmax of PZN-PT-NN was higher than that of PZN-PT-KN. We attribute this difference to the smaller tolerance fac-tor of NN which provides larger rattling space to PZN-PT-NN.
1S.-E. Park and T. R. Shrout, J. Appl. Phys. 82, 1804 �1997�.2N. Wakiya, N. Ishizawa, K. Shinozaki, and N. Mizutani, Mater. Res. Bull.30, 1121 �1995�.
3L. Bellaiche, J. Padilla, and D. Vanderbilt, Phys. Rev. B 59, 1834 �1999�.4R. E. Eitel, C. A. Randall, T. R. Shrout, and P. W. Rehrig, Jpn. J. Appl.Phys., Part 1 40, 5999 �2001�.
5I. Grinberg, M. R. Suchomel, P. K. Davies, and A. M. Rappe, J. Appl.Phys. 98, 094111 �2005�.
6H. Fan, L. Kong, L. Zhang, and X. Yao, J. Appl. Phys. 83 1625 �1998�.7J. R. Belsick, A. Halliyal, U. Kumar, and R. E. Newnham, Am. Ceram.Soc. Bull. 66, 664 �1987�.
8S. Lanfredi, L. Dessemond, and A. C. Martins Rodrigues, J. Eur. Ceram.Soc. 20, 983 �2000�.
9B. Jaffe, W. R. Cook, and H. Jaffe, Piezoelectric Ceramic �Academic,London, 1971�, p. 186.
10Y. Xu, Ferroelectric Materials and Their Applications �University of Cali-fornia, Los Angeles, 1991�, p. 136.
11M. Takahashi, Jpn. J. Appl. Phys. 9, 1236, �1970�.12F. Kojima and S. Nomura, Jpn. J. Appl. Phys. 14, 1255 �1975�.13S. Nomura and H. Arima, Jpn. J. Appl. Phys. 11, 358 �1972�.14R. D. Shannon, Acta Crystallogr., Sect. A: Cryst. Phys., Diffr., Theor. Gen.
Crystallogr. 32, 751 �1976�.15W. Zhu, A. L. Kholkin, P. Q. Mantas, and J. L. Baptista, J. Am. Ceram.
Soc. 84, 1740 �2001�.16J. Chen, H. M. Chan, and M. P. Harmer, J. Am. Ceram. Soc. 72, 593
�1989�.17A. A. Bokov and Z.-G. Ye, Solid State Commun. 116, 105 �2000�.18S. M. Pilgrim, A. E. Sutherland, and S. R. Winzer, J. Am. Ceram. Soc. 73,
3122 �1990�.19K. Uchino, S. Nomura, L. E. Cross, S. J. Jang, and R. E. Newnham, J.
Appl. Phys. 51, 1142 �1980�.20R. E. Eitel, C. A. Randall, T. R. Shrout, and P. W. Rehrig, Jpn. J. Appl.
Phys., Part 1 40, 5999 �2001�.21J. Grinberg, V. R. Cooper, and A. M. Pappe, Phys. Rev. B 70, 220101
�2004�.22P. Juhas, I. Grinberg, A. M. Rappe, W. Dmonwski, T. Egami, and P. K.
Davies, Phys. Rev. B 69, 214101 �2004�.23JCPDS �Joint Committee on Power Diffraction Standards�, No. 34-0374
�2000�.
114101-7 Park, Lee, and Hong J. Appl. Phys. 101, 114101 �2007�
[This article is copyrighted as indicated in the article. Reuse of AIP content is subject to the terms at: http://scitation.aip.org/termsconditions. Downloaded to ] IP:
130.49.166.8 On: Tue, 04 Nov 2014 19:16:46