The E⁄ect of Computer Use on Child Outcomescp2124/papers/computer2.pdf · The E⁄ect of Computer...
41
The E/ect of Computer Use on Child Outcomes Ofer Malamud Cristian Pop-Eleches University of Chicago and NBER Columbia University, BREAD, NBER May 2008 Abstract This paper examines the impact of having access to a home computer on child and adolescent outcomes. To avoid the bias due to non-random access to home computers, we exploit a unique government program which provided vouchers towards the purchase of a personal computer for low-income children enrolled in Romanian public schools. Since the xed number of vouchers were allocated based on a simple ranking of family income, this program a/ords a stark regression discontinuity which allows comparisons across students very similar in family income and other respects, but who experienced markedly di/erent access to a computer at home. In 2007, we conducted a household survey of children who participated in the program in 2005. Using these data, we show that children who received a voucher were 50 percent more likely to own a computer. Next, we show that receipt of a voucher had a large impact on time spent in front of the computer and decreased the amount of time spent watching TV and doing homework. Children in household that won a voucher also report having lower school grades and lower educational aspirations. There is also suggestive evidence that winning a voucher is associated with negative behavior outcomes. Nevertheless, we nd that having a stay- at-home mom and the presence of rules regarding computer use do mitigate some of the negative e/ects of winning a computer voucher, indicating that parental monitoring and supervision may be important mediating factors. Email [email protected] and [email protected]. This project would not have been possible without the nancial support of ISERP at Columbia University, NCEEER and the Population Research Center (PRC) at NORC and the University of Chicago. We wish to thank Ray Fisman, Nora Gordon, Caroline Hoxby, Eleanor Kane, Jens Ludwig, Bruce Meyer, Andrei Schleifer, Cristina Vatulescu, Wesley Yin, as well as seminar participants at the Demography Workshop and the CHPPP Workshop in Chicago and the NBER Economics of Education Program Meetings. We are grateful to Grigore Pop-Eleches who has greatly contributed to the development and implementation of the project. We also thank Ioana Veghes at Gallup Romania for managing the survey and the data collection e/ort. All errors and opinions are our own.
Transcript of The E⁄ect of Computer Use on Child Outcomescp2124/papers/computer2.pdf · The E⁄ect of Computer...

The E¤ect of Computer Use on Child Outcomes
Ofer Malamud Cristian Pop-Eleches�
University of Chicago and NBER Columbia University, BREAD, NBER
May 2008
Abstract
This paper examines the impact of having access to a home computer on child andadolescent outcomes. To avoid the bias due to non-random access to home computers,we exploit a unique government program which provided vouchers towards the purchaseof a personal computer for low-income children enrolled in Romanian public schools.Since the �xed number of vouchers were allocated based on a simple ranking of familyincome, this program a¤ords a stark regression discontinuity which allows comparisonsacross students very similar in family income and other respects, but who experiencedmarkedly di¤erent access to a computer at home. In 2007, we conducted a householdsurvey of children who participated in the program in 2005. Using these data, we showthat children who received a voucher were 50 percent more likely to own a computer.Next, we show that receipt of a voucher had a large impact on time spent in front of thecomputer and decreased the amount of time spent watching TV and doing homework.Children in household that won a voucher also report having lower school grades andlower educational aspirations. There is also suggestive evidence that winning a voucheris associated with negative behavior outcomes. Nevertheless, we �nd that having a stay-at-home mom and the presence of rules regarding computer use do mitigate some ofthe negative e¤ects of winning a computer voucher, indicating that parental monitoringand supervision may be important mediating factors.
�Email [email protected] and [email protected]. This project would not have been possiblewithout the �nancial support of ISERP at Columbia University, NCEEER and the Population ResearchCenter (PRC) at NORC and the University of Chicago. We wish to thank Ray Fisman, Nora Gordon,Caroline Hoxby, Eleanor Kane, Jens Ludwig, Bruce Meyer, Andrei Schleifer, Cristina Vatulescu, WesleyYin, as well as seminar participants at the Demography Workshop and the CHPPP Workshop in Chicagoand the NBER Economics of Education Program Meetings. We are grateful to Grigore Pop-Eleches whohas greatly contributed to the development and implementation of the project. We also thank Ioana Veghesat Gallup Romania for managing the survey and the data collection e¤ort. All errors and opinions are ourown.

1 Introduction
The development of the personal computer in the late 1970s enabled households to purchase
a computer for the home, and children to gain access to an important new technology. At
present, over three-quarters of all American children aged 3 to 17 years live in a household
with a computer. (U.S. Census Bureau, 2005) However, large disparities in computer own-
ership by race and family income remain. Data from the 2003 Current Population Survey
(CPS) indicate that less than half of children with family incomes under $25,000 lived in
a household with a computer, compared to 92 percent of those with family incomes over
$100,000. Furthermore, access to computer technology is far less common among children in
developing countries, and the disparities between the rich and poor are often much greater.
Estimates from the OECD�s 2003 Programme for International Student Assessment (PISA)
show that most 15 year old students in developed countries have access to a computer at
home (91 percent in the United States). In contrast, only about half of 15 year olds enrolled
in school have access to a home computer in emerging Eastern European countries such as
Poland, Latvia and Serbia.1 Among 15 year olds in the bottom SES quartile within these
countries, fewer than a quarter have access to a home computer.2 (OECD, 2005)
Many government and non-governmental organizations are trying to bridge this �digital
divide� across nations and between households. For example, Brazil embarked on some
of the earliest government-run initiatives to bring inexpensive computers to its citizens.
In 2003, the government announced a new plan to encourage domestic manufacturers to
develop inexpensive consumer PCs for Brazilians with incomes between $140 and $1,400
USD. (Rebelo, 2005) Most recently, the One Laptop per Child (OLPC) program has received
substantial publicity in its e¤orts to develop a cheap laptop computer suitable for children
1This is probably an understatement of cross-country disparities in access since 15 year olds who remainenrolled in school in developing countries are more likely to come from advantaged family backgrounds.
2This fraction is substantially lower for less-developed countries such as Thailand, Tunisia, and Turkey,and essentially zero for countries in sub-Saharan Africa and parts of south Asia.
2

in developing countries. Peru and Uruguay have already placed orders for thousands of
computers while others, such as Ethiopia, Thailand, and Nigeria have made preliminary
commitments. (eWeek, 2007) Even in cases where these computers are provided for school
use, they are also intended to serve as home computers.3 However, these major e¤orts
to increase computer access among children are happening despite relatively little credible
evidence regarding the e¤ect of home computers on children�s educational and behavioral
outcomes.
The risks and bene�ts of increased computers use among children have been a matter of
substantial public debate. As with concerns about television, many have expressed the worry
that children might become �addicted� to interactive computer products.4 Some negative
physical consequences are clearly associated with long periods of computer use, such as
repetitive strain injuries, eye strain, and increased risk of obesity. Excessive computer use
is also hypothesized to lead to decreased social involvement and isolation. If computers
are used for playing games or for accessing the Internet, children may be exposed to adult
content that can have detrimental e¤ects on social and behavioral outcomes. More generally,
it is possible that time spent on computers displaces other activities more valuable from a
developmental perspective. On the other hand, computers may help introduce children to an
important new technology. This may foster the development of computer skills which lead
to better labor market outcomes as adult.5 Computers may also facilitate learning through
the use of educational software. Indeed, in contrast to television, the interactive nature of
3The chairman of OPLC, Nicholas Negroponte, explains that �mobility is important, especiallywith regard to taking the computer home at night.. . . .bringing the laptop home engages the family.�http://laptop.org/faq.en_US.html
4Nevertheless, recent evidence on the e¤ect of early exposure to television on test scores suggests that(1950s) television did not lead to lower cognitive achievement. (Gentzkow and Shapiro, 2007) In relatedstudies, Olken (2007) �nds that television and radio reduces social participation in Indonesia while Jensenand Oster (2007) show that access to cable TV improves women�s status in India.
5Krueger (1993) estimated a large wage premium among Americans who use a computer at work. How-ever, DiNardo and Pishke (1997) have cast some doubt on whether these represent causal estimates for thee¤ect of computer use by taking advantage of more detailed information on work activities from Germany.
3

computer technology has often been viewed with great promise.6 Since computers represent
such a versatile technology, the potential risks and bene�ts are highly dependent on the
availability of di¤erent types of software and the patterns of actual use.7
Moreover, in considering the e¤ect of computers at home, parental involvement and
monitoring may be especially important mediating factors for the e¤ect of home computers on
child and adolescent outcomes. In their qualitative study of home computer use, Giacquinta
et. al. (1993) �nd that children engaged in educational computing only if parents took a
very active role in selecting software and spending time with the children at the computer.
When left on their own, most of the children in their sample only used home computers for
games and regarded educational program as boring. If parental involvement and monitoring
are positively correlated with parental education and income, the risks of home computer
use may be more likely among disadvantaged populations.8
This paper seeks to provide a credible estimate for the e¤ect of home computer access
on educational and behavioral outcomes for children and adolescents. We analyze a govern-
ment program administered by the Romanian Ministry of Education which subsidized the
purchase of home computers for low-income children. The program o¤ered about 27,000
vouchers worth 200 Euros (about $240) in 2005 towards the purchase of a personal computer
for students enrolled in Romania�s public schools. Similar to programs in other countries, the
Euro 200 program was intended to increase home computer use among low-income families
and promote computer skills for school-aged children. Since the �xed number of vouchers
were allocated based on a simple ranking of family income, we employ a regression disconti-
nuity design that allows comparisons across students very similar in family income and other
respects, but markedly di¤erent in their access to a computer at home. With data that we
6See Wartella and Jennings (2000) for comparisons between computers and more traditional media.7Evidence from the 2003 CPS indicate that 83 percent of American children aged 3 to 17 with a computer
at home used it to play games, the most common single use. (U.S. Census Bureau, 2005)8Schneider and Coleman (1993) highlight the importance of parental involvement in children�s schooling
and document that higher SES parents exhibit higher levels of involvement.
4

collected through in-person household interviews, we estimate the impact of winning a pro-
gram voucher on computer ownership and computer use, as well as academic and behavioral
outcomes.
We �nd that winning a 200 Euro voucher increased the likelihood of households owning
a home computer by 25 percentage points, or approximately 50 percent higher compared to
households that had incomes above the program threshold. As might be expected, higher
rates of computer ownership also led to increased computer use. Computers were turned
on for almost 1 hour longer each day in households that were just under the threshold for
winning, and children in households who won a voucher used computer signi�cantly more
than their counterparts who did not win a voucher. In terms of time-use, we estimate that
children who won a program voucher reduced the time spent watching television and the time
spent doing homework, each by about 3 hours a week. Children in household who won a
voucher also had lower school grades and a lower likelihood of planning to go to college. The
e¤ect of winning a computer voucher on behavioral outcomes is somewhat less conclusive,
with voucher winners receiving lower behavior grades in school but no signi�cant e¤ect on
drinking behavior, weight and two behavior indices: Behavioral Problem Index (BPI) and
Rosenberg Self-esteem Index. In sum, providing home computers for low-income children in
Romania did not appear to improve educational and behavioral outcomes. This may not
be surprising given that relatively few parents report having educational software installed
on their computer, and few children report using the computer for educational purposes.
Interestingly, we �nd evidence that having a stay-at-home mom and the presence of rules
about computer use do mitigate some of the negative e¤ects of winning a computer voucher,
and suggests that parental supervision may be an important mediating factor.
The paper is organized as follows: Section 2 discusses the related literature regarding the
e¤ect of home (and school) computers on child and adolescent outcomes. Section 3 provides
background on the Euro 200 program. Section 4 describes the data collection e¤ort and
5

the resulting data. Section 5 explains the empirical strategy which underlies the analysis.
Section 6 presents the results and Section 7 concludes.
2 Related Literature
There is a small but growing literature examining the e¤ect of home computer use on educa-
tional outcomes using readily available survey data. Attewell and Battle (1999) use the 1988
National Educational Longitudinal Survey (NELS) to show that having a home computer
is associated with higher test scores in both mathematics and reading. After controlling
for di¤erences in demographic and individual characteristics, they �nd that students with
home computers score 3 to 5 percent higher on these tests than those students without home
computers. Interestingly, they �nd that these positive e¤ects are signi�cant only for high
SES households and, therefore, speculate that more a uent and higher educated parents
are better able to provide a conducive environment for children to engage in learning with
computers.
Using data from the Computer and Internet Use Supplement to the 2001 Current Popula-
tion Survey (CPS), Fairlie (2005) shows that having access to a home computer is associated
with a higher likelihood of being enrolled in school. He �nds that teenagers with home
computers are over 10 percentage points more likely to be enrolled in school than their
counterparts without home computers. Controlling for family income, parental education,
parental occupation and other background characteristics, this di¤erential declines to only
1.4 percentage points. These �ndings indicate that selection on observable characteristics is
quite substantial in this setting, and suggests that selection on unobserved characteristics
may be the source of even further bias. Beltran, Das, and Fairlie (2006) extend this work
using the 2000-2003 CPS Supplements and National Longitudinal Survey of Youth (NLYS)
1997. They �nd that teenagers with access to home computers are 6 to 8 percentage points
6

more likely to graduate from high school after controlling for various individual, parental,
and family characteristics.9 Although they attempt to address the possibility of omitted
variables by using parental use of the Internet at work and the presence of another teenager
in the household as instruments, the resulting estimates are statistically insigni�cant and
the exclusion restrictions are not entirely credible.
In contrast to these �ndings, Fuchs and Woessmann (2004) estimate a negative relation-
ship between home computers and student achievement using PISA data. They observe
that the bivariate relationship between the availability of home computers and student per-
formance on math and reading tests is positive, similar to the �ndings from other studies.
However, once they control for detailed student, family and school characteristics, they �nd
that the relationship between availability of home computer use and test scores becomes
negative and signi�cant. Students with home computers score about 5 achievement points
(approximately.05 of a standard deviation) lower on both math and reading tests. While
they recognize that this analysis remains �descriptive rather than causal,� they maintain
that these estimates should be closer to the true causal e¤ect from an exogenous variation
in computer availability.
Evidence concerning the e¤ect of computer use in school on educational attainment is also
quite mixed. Angrist and Lavy (2002) �nd that the quasi-random installation of computers
in Israeli schools did not lead to improvements in math test scores. In related work, Goolsbee
and Guryan (2006) show that Internet and communications subsidies in US schools (through
the E-rate program) led to increased Internet investment but did not lead to improved student
test scores. Rouse and Krueger (2004) present evidence from a randomized experiment
showing that an instructional reading computer program improved certain limited aspects
9Schmitt and Wadsworth (2004) also provide evidence of a positive relationship between home computerownership and subsequent academic achievement in Britain. Using the British Household Panel Survey,they �nd that access to a home computer is associated with higher rates of completion of British schoolexaminations (GCSEs and A-levels) after including individual, household and geographical controls, as wellas proxies for household wealth and prior educational attainment
7
of students language skills but did not improve broader language abilities. However, a
recent study by Barrow, Markman and Rouse (2007) evaluated a randomized experiment
which provided computer instruction in algebra and found signi�cant e¤ects on mathematics
achievement. Finally, Banerjee et. al. (2007) examine the e¤ect of an computer-assisted
learning program in India which o¤ered children two hours of computer time per week to
play games that involve solving math problems. They �nd a positive e¤ect of computer use
on math test scores, suggesting that closely targeted computer instruction may be bene�cial.
Closely related to research on educational outcomes, the psychological literature has
explored the e¤ect of computer and internet use on children�s time-use, as well as cognitive
and behavioral outcomes. Subrahmanyam et. al. (2000, 2001) review some �ndings from
recent US-based studies: children with a computer at home spend more time using it and
substitute away from watching television (Kraut et al., 2001; Stanger, 1998); children playing
computer based games display higher levels of spatial ability (Subrahmanyam and Green�eld,
1994); e¤ects on social and behavioral outcomes are quite mixed. Again, the possibility of
omitted variables implies that these �ndings are merely suggestive. However, these cognitive
and non-cognitive (social and behavioral) outcomes may play an important role in enhancing
educational outcomes.
3 The Euro 200 Program
The voucher program, widely known as the Euro 200 program in Romania, was proposed by
the Prime Minister�s o¢ ce and adopted by unanimous vote in Parliament in June 2004 as
Law 269/2004. According to the law, the o¢ cial purpose of the program was to establish a
mechanism to increase the purchase of computers through �nancial incentives based on social
criteria, in order to promote competence in computing knowledge. Although the incumbent
party su¤ered a narrow electoral defeat in the November-December 2004 elections, the new
8

governing coalition actually expanded the resources allocated to the voucher program: thus,
whereas 25,051 families received vouchers in 2004, the number of awards increased to 27,555
in 2005, 28,005 in 2006 and over 38,379 in 2007.10 The law also speci�ed that the computers
bought through the program had to be new and had to meet the following minimum spec-
i�cations: 1.6 GHz processor, 128 MB RAM memory, 40 GB hard-disk with a keyboard,
mouse and monitor, as well as some preinstalled software.
The 200 Euro ($240) subsidy covered a substantial part of the cost of a new computer
that met the minimum speci�cations. Nevertheless, households did need to �top up� the
vouchers with their own income. For example, the voucher covered about 75 percent of the
price of a system at Romania�s largest computer retailer, who sold almost 40 percent of
the program computers in 2005.11 (Comunicatii Mobile, 2005) According to data from the
Ministry of Education, 94 percent (25,908 of 27,555) of the issued vouchers were converted
into computer purchases by the recipients. Overall, the Euro 200 program was sizable by
national standards and accounted for about 4.4% of total new computer sales in Romania
in 2005.12
The program was targeted towards children from low income families. To be eligible to
apply for the program, a household was required to have at least one child under the age
of 26 enrolled in grades 1 to 12 of a private or public school or attending university. At
the same time only households with monthly family income per household member of less
than 1,500,000 lei (around $50) were eligible to apply. The calculation of income included
all permanent sources of income of family members in the month prior to the application,
10Along with the total number of vouchers, the proportion of applicants who received computers alsoincreased dramatically from about 20% in 2004 to 53% in 2005, 96% in 2006 and 100% in 2007. As a result,the most recent two rounds of the program cannot be used for the current research design, since they do notprovide meaningful control groups against which to evaluate treatment e¤ects.11Comunicatii Mobile (http://www.comunic.ro/article.php/Aproape_jum%C4%83tate_din_sistemele_v%C3%A2ndute_%C3%AEn_programul_guvernamental_quotEuro_200quot_au_fost_oferite_de_Flamingo/1459/)12The market for computers in Romania is extremely competitive so it does not appear that computer
retailers were able to extract the value of the voucher subsidy from consumers.
9

with the exception of unemployment bene�ts, state support for children, merit scholarships
and social scholarships.13 In 2005, 51,748 households applied for the program and met
the threshold. Following the application deadline, all the applicants were ranked based on
their family income per household member. Since the government had a limited budget, it
restricted the number of vouchers to 27,555 in the 2005 program round, which corresponded
to a maximum income of 506,250 lei ($17).14 Neither the number of winners nor the income
threshold was known to the applicants in advance. This feature of the program is essential
for implementing the regression discontinuity design which enables us to compare students
with incomes close to the 506,250 lei threshold who experienced a discontinuity in access to
a home computer.
In order to encourage the use of these computers for educational purposes, the Ministry
of Education also o¤ered 530 multimedia educational lessons to voucher winners. These
lessons were designed during 2001 to 2004 as part of a larger e¤ort to introduce information
technology into the education process. The lessons included subjects such as math, biol-
ogy, physics, geography, computer science, history and chemistry for di¤erent grades and
were developed under the guidelines of the Ministry of Education in accordance with the
national teaching curriculum. Computer retailers who participated in the Euro 200 program
were encouraged to install these lessons at no charge on the computers of program winners.
However, as revealed by our household survey, relatively few parents report having educa-
tional software installed on their computer, and few children report using the computer for
educational purposes.
13The application form included several explicit warnings against reporting false incomes and familiesneeded to provide supporting documentation along with the application.14Vouchers were issued in the name of the child, and therefore not transferable. Nevertheless, it is possible
that families, in turn, sold their computer to other buyers. We show that this was not an important issueempirically.
10

4 Data
The primary data used in this paper are from a 2007 household survey we conducted with
families who applied to the 2005 round of the Euro 200 program.15 In order to conduct this
survey, we obtained the list of 1554 families who participated in this round of the Euro 200
program in the Romanian counties of Valcea and Covasna. This list contained the names
of the parent and child who applied to the program, the place of residence and the name
of the child�s school. It also included information on the income per family member in the
month prior to the application deadline, which is essential for implementing the regression
discontinuity design. With the help of Gallup Romania, we then surveyed a target sample of
1317 families who lived in localities with at least four families that applied to the program.16
Of these remaining 1317 families, 858 were successfully interviewed for a response rate of
65%, which is in line with Gallup�s interview rate for this population. While the remaining
sample is not completely representative of the program applicant pool or the population of
the two counties more generally, we found no evidence that response rates di¤ered between
households who won vouchers and their counterparts who did not receive vouchers.
The household survey had three separate components. First, we interviewed the family
in order to obtain demographic information about each member of the household and basic
household characteristics, including information about computer ownership. Then, as in
other household surveys such as the NLSY, we collected information on child outcomes
through parental reports and self-reports. In particular, we surveyed parents in order to elicit
information on each child in the family and conducted a separate interview with each child
present at home on the day of the survey. Both the parental and the child questionnaires
included questions about our main variables of interest, such as computer ownership and
15The survey was conduct in the spring of 2007, between May and June, while most kids were still inschool and preparing to take their end-of-year exams.16This helped minimize the cost of surveying individuals in areas with few program participants.
11
use, child GPA and child behavioral problems. However, due to a limited budget, we were
not able repeat all the questions (such as the time use questions or career plans) in both
child-level surveys.
Table 1 presents summary statistics for the main variables in this part of the survey. Aver-
age monthly income per household member is about 525,000 Romanian lei, which translates
into approximately $20. Since the program was targeted towards low income families, it
is not surprising that the sample population is predominantly rural and has comparatively
low levels of educational attainment (almost half of the heads of household did not com-
plete any form of secondary school). Compared to national averages, our sample contains
an unusually large fraction of Hungarians re�ecting the fact that one of the two counties in
the study (Covasna) has a large Hungarian majority. Among our 858 applicant families, 49
percent received a voucher in the 2005 round of the Euro 200 program and 98 percent of
the vouchers awarded were observed to have been cashed out. Computer ownership is quite
high at around 75 percent, suggesting that about half of households who did not qualify
for a voucher in the 2005 round had a computer by the spring of 2007. The high level of
computer ownership at among these households is explained mostly by the fact that many
received a similar voucher in the subsequent rounds of the Euro 200 program in 2006 and
2007. Interestingly, only about 30 percent of households had educational software installed
on their home computer, despite the fact that educational software was available from the
Ministry of Education at no cost. At the same time, access to the Internet among families
in our sample is extremely limited, with only 6 percent of families having Internet access
at home. When interpreting our results, it is important to keep in mind that the voucher
program increased computer access for households with very limited access to the Internet.
On average, computers were reported to be turned on for approximately 1.8 hours each day,
or about 2.5 hours conditional on having a computer.
Panel A of Table 2 presents parental reports concerning some important time-use, acad-
12

emic, and behavioral outcomes for almost 1,800 children.17 In some regressions, we restrict
our attention to the 1,351 children enrolled in grade school (grades 1 to 12). The sample is
pretty evenly split between boys and girls and the children�s average age is 13.5 years. We
elicited the frequency of home computer use on a scale of 1 (less than once a month) to 5
(every day use).18 Among the entire sample, almost a quarter used their home computer
every day and another 18 percent used their home computer several times a week. Among
those households with a home computer, over 80 percent of children used their computer
more than once a week. On average, children watched about 2.1 hours of television per day.
In order to get a more accurate measure, we also construct a weekly measure of TV viewing
by multiplying the hours by the frequency of TV use over time.19 Given the high frequency
of TV viewing, we determine that children watched almost 13 hours of television per week.
Only about 30 percent of children were reported to read at least several times a week. In
terms of academic outcomes, the average GPA reported by the head of household during
2005-06 is 8.36 out of a possible 10. About three-quarters of children are said to have plans
to go to college, and approximately 10 percent have plans for a career related to computer
work. In terms of behavioral outcomes, the average grade for school behavior during 2005-06
was extremely high at 9.93 out of a possible 10. We also asked household heads if their chil-
dren had exhibited various behavior problems during the past three months. We created an
index for the fraction of the problems that were reported to be �sometimes�or �often�true
of the child, as opposed to �not true�to the following behaviors: trouble getting along with
teachers, disobedience at home, disobedience at school, hanging around with troublemakers,
bullying others, inability to sit still, and whether the child prefers to be alone.20
17We allowed the head of household to report on up to 5 children. This sample censoring applied to onlytwo families who had 7 and 9 children respectively.18In addition, we recorded 2 (once or twice a month), 3(once a week), and 4 (several times a week).19The frequency of TV viewing was reported in a similar fashion to the frequency of computer use.20The questions are based on items used in the National Health Interview Survey and the National Lon-
gitudinal Survey of Youth Children�s Supplement (NLSY-CS). As in recent MTO evaluations (Katz, Kling,and Leibman, 2001), we focus on seven questions that asked about behaviors which the mothers could ob-
13

Panel B of Table 2 presents summary statistics based on over 1,100 child interviews. for
various time-use, academic, and behavioral outcomes. As before, we sometimes restrict our
attention to the 1,013 children enrolled in grade school (grades 1 to 12). Average age and
child gender in this sample are broadly similar to those in the sample of parental reports.
We also asked children about the frequency with which they used their computers for games,
education, and other activities.21 Among those with computers, almost 70 percent of children
report that they play games at several times a week. In contrast, only 20 percent of children
report that they use educational software more than once a week (in part because only 40
percent of families with computers actually own educational software). On average, children
reported doing about 1.9 hours of homework per day. Again, we also construct a weekly
measure of homework hours by multiplying the hours by the frequency of homework over
time. According to this measure, children spend about 12.5 hours a week doing homework
assignments. Children also report spending about 8.8 hours a day sleeping. We also asked
about several academic and behavior outcomes. Average GPA for 2005-2006 reported by the
children was, at 8.35, almost identical to that reported by parents. In addition, we conducted
the 10 item Rosenberg Self-Esteem Scale in order to provide a self-reported measure of non-
cognitive skills.22 Finally, we also asked children about the frequency with which they drunk
alcohol in recent months.
serve directly, as opposed to generic questions about behavior or questions requiring intuition about howtheir child was feeling.21The tables report average frequency (as with time-use variables) unconditioned on computer ownership.22The Rosenberg test consists of 10 statements related to overall feelings of self-worth or self-acceptance.
The items are answered on a four-point scale which ranges from �strongly agree�(1) to �strongly disagree�(4). Summing the ratings after reverse scoring the negatively worded items, scores range from 10 to 40, withhigher scores indicating lower self-esteem.
14

5 Empirical strategy
As mentioned above, the Romanian Ministry of Education o¤ered approximately 27,000
computer vouchers to low-income students enrolled in Romania�s public schools in 2005.
Since these computer vouchers were allocated according to a simple income cuto¤, we employ
a regression discontinuity (RD) design to compare outcomes across families with similar
income and other characteristics but experienced di¤erent levels of program entitlements.
This enables us to address the possibility of omitted variable bias between recipients of
government bene�ts and their counterparts who were ineligible. The basic regression model
used through the analysis is as follows:
outcomei = �0Xi + �winneri + f (incomei) + "i (1)
where outcomei represents a particular child outcome such as computer use, hours doing
homework, or GPA, by child i. Xi includes a set of control variables, such as age, ethnicity,
gender, and educational attainment. In practice, these control variables have very little e¤ect
on our estimates of the discontinuity and serve mainly to increase precision. winneri is an
indicator variable equal to 1 if monthly household income per capita is less than the minimum
cut-o¤ for the voucher program of 506,250 lei, and 0 otherwise. The coe¢ cient �, our main
coe¢ cient of interest, indicates the e¤ect of receiving a 200 euro computer voucher on the
relevant outcome. Finally, f (incomei) is a smooth function of income, which is the forcing
variable in the context of this regression discontinuity design. As in many recent studies
employing this technique, we specify a linear model of this forcing variable, but allow it to
vary on either side of the discontinuity.23 While our primary speci�cation uses a linear spline
23See Dinardo and Lee (2004) for use of parametric functions in regression discontinuity design. Estimatingthis equation using non-parametric methods, along the lines of Hahn, Todd, and van der Klaauw (2001) andPorter (2003), also leads to similar results.
15

in income, we also estimate regressions with alternative polynomial functions for robustness.
Note that we restrict our analysis to the reduced-form e¤ects of winning a voucher on
various child outcomes. Since many families who did not win a voucher in 2005 successfully
reapplied during the next two rounds (summers of 2006 and 2007), computer ownership at
the time of the survey in 2007 underestimates the di¤erence in access between households
who won and did not win vouchers for the period from 2005 to 2007. In other words, we have
variation in the exposure to computer ownership that isn�t captured by observed ownership
in 2007. Therefore, instrumenting for computer ownership with having received a voucher
would not �scale up�our estimates in the appropriate fashion. Instead, we describe some
rough calculations that enable us to translate the e¤ect of winning a voucher into the impact
of computer ownership on outcomes.
The central assumption underlying the RD design is that we have correctly speci�ed
the function of income (the forcing variable) which determines assignment of the computer
voucher. Another important assumption is that households were not able to manipulate the
forcing variable, by reporting a lower income. While it is possible that individual families
underreported their income, such cheating probably doesn�t represent a serious concern.24
The minimum cut-o¤ of 506,250 lei for the voucher program was not known ex-ante; it
was determined by the amount of funds available and by the number of households who
applied and their corresponding income, none of which were known prior to the start of
the program. Indeed, in later rounds, almost all household who applied ended up receiving
vouchers. Underreporting would only be a problem for our identi�cation strategy if it varied
di¤erentially on either side of the income cut-o¤. Still, we did test for manipulation of the
forcing variable by examining the density of reported income around the cuto¤ and found
no evidence of cheating. (McCrary, 2007)
24As mentioned previously, the Euro 200 application form included stern warnings against any attempt tofalsify information on income.
16

6 Results
6.1 E¤ect on Computer Ownership and Computer Use
The 2005 round of the Euro 200 program provided vouchers for the purchase of a computer
to all families with monthly incomes per family member below the cuto¤ of 506,250 lei. We
begin by showing the dramatic e¤ect of winning a voucher on computer ownership in these
households. In Panel A of Figure 1, we normalize the household income per family member
for the families in our sample to be 0 at the 506,250 lei cuto¤. The sharp discontinuity at
the cuto¤ mark is clearly visible and illustrates the empirical strategy which underlies our
regression discontinuity design. Panel B documents that the proportion of awarded vouchers
actually cashed in to buy computers was extremely high. Column 3 of Table 3 indicates
that households who won a voucher were about 25 percentage points more likely to have a
computer at home, a 50 percent increase over the likelihood of owning a computer among
those who did not win a voucher. Panel D of Figure 1, which plots the probability of owning
a computer based on residuals from a regression of computer ownership on our standard set
of controls, reveals a similar discontinuity and con�rms that families around the cuto¤ with
very similar family incomes experienced a very di¤erent likelihood of owning a computer at
home.
As explained earlier, the rates of computer ownership reported at the time of the 2007
survey will underestimate the di¤erences in exposure to computers during the entire period
from 2005 to 2007 (since households who did not win a voucher in 2005 may have won one
in the summers of 2006 or 2007). Hence, we use administrative data on 2006 and 2007
program winners to de�ne computer ownership in our sample at the end of the 2005-2006
academic year. Using this alternative de�nition, columns 1 and 2 of Table 3 indicate that the
di¤erence in the probability of computer ownership for households who won a 2005 voucher
is over 50 percentage points. Panel C of Figure 1 illustrates the dramatic increase in the
17

magnitude of the discontinuity. These results highlight the di¢ culty of translating the e¤ect
of winning a voucher into the impact of computer ownership on outcomes. The 25 percentage
point di¤erence in computer ownership at the time of the 2007 survey would suggest that
the e¤ects of owning a computer are four times the e¤ects of winning a voucher (4�).25 In
contrast, since the di¤erence in computer ownership at the end of the 2005-2006 academic
year is closer to 50 percentage points, a more accurate rescaling for the impact of computer
ownership on outcomes, such as 2005-2006 GPA, is actually only twice the e¤ect of winning
a voucher (2�).
Given that winning a voucher does indeed lead to increased computer ownership, we
examine whether it also a¤ects the numbers of hours the computer is turned on and actual
computer use among children. Panel E of Figure 1 shows the discontinuity in hours that
the computer is turned on. Column (5) of Table 3 estimates that households who won
a voucher had their computer turned on by 0.8 additional hours each day as compared
to those household who did not receive a voucher.26 Estimating this same result at the
child level yields a slightly lower magnitude, at 0.78 hours, but still signi�cant. We also
estimate the probability that households who won a voucher had a computer installed with
educational software, since this may have some in�uence on whether the computer is used
in activities that enhance academic outcomes. The e¤ect of winning on having a computer
with educational software is not signi�cant at the household level (column 7) but statistically
signi�cant at the child level (column 8). Finally, we consider the frequency of computer use
for each child in the family as reported by parents and the children themselves. Columns 9
and 10 of Table 3 and Panel F of Figure 1 con�rm that children in households who won a
voucher use a home computer signi�cantly more frequently.
25Note that this resembles the standard calculation used in moving from an intention-to-treat (ITT)estimator to a treatment-on-the-treated (TOT) estimator. Such scaling of the reduced form estimate by theproportion of individuals that actually received the treatment was introduced by Bloom (1984)26If we rescale the coe¢ cients as suggested above, getting access to a home computer increases the time
that a computer is on by about 3.2 hours a day.
18

6.2 E¤ect on Time-Use
Having established the large impact of the Euro 200 program on computer ownership and
computer use, Table 4 presents estimates for the e¤ect of winning a voucher on children�s
time-use. Column 1 shows that children just below the income cut-o¤ were spending about
0.3 hours less doing homework at each sitting. In column 2, we combine the frequency
of homework and the typical time spent doing homework into a variable which measures
the total hours of homework a week. Children in households who won a computer voucher
spent approximately 2.3 fewer hours doing homework as compared to those who did not
win a voucher. Panels A and B of Figure 2 show the discontinuities in homework hours per
session and homework hours per week respectively. In addition to homework, ownership of
a computer also seems to crowd out time spent watching TV. In column 4 of Table 4 we
observe that winning a computer voucher decreases the time spent watching TV by about
0.4 hours a day. When we combine TV hours with the frequency of TV use, this translates
into a reduction of approximately 3.5 hours of TV watching per week (see column 5 of Table
4). Panels C and D of Figure 2 show the discontinuities in TV hours per day and TV hours
per week respectively.
Table 4 also presents results for two additional outcomes of interest. Children in house-
holds that won a computer voucher are 8 percent less likely to read at least once a week and
appear to sleep about 27 minutes less per day. These results, though sizable, need to be
interpreted with care since they are rather imprecisely measured and are not statistically sig-
ni�cant at conventional levels. Similarly, the discontinuities for reading and sleep in Panels
E and F of Figure 2 are not as stark. But overall, these �ndings provide strong evidence that
the increase in time spent in front of a computer among winners of the Euro 200 program
led to large reductions in hours spent watching TV and doing homework, as well as some
indication that children spent less time reading and sleeping.
19

6.3 E¤ect on Academic and Behavioral Outcomes
In Table 5, we explore the impact of winning a computer voucher on a range of academic
and behavioral outcomes. In light of the large decrease in time spent doing homework,
we �rst examine the e¤ect of winning a voucher on measures of school performance. We
elicited information about average school grades for the 2005-2006 academic year, the �rst
year following the distribution of the computers. Both columns 1 and 2 of Panel A indicate
a negative e¤ect of winning a voucher on GPA as reported by parents and the children
themselves. The e¤ect is statistically signi�cant for the child reports, at 0.36 grade points
or about one third of a standard deviation.27 The decrease in GPA based on parental
reports is smaller and not statistically signi�cant at conventional levels. Similarly, parents in
households who won a voucher are 13 percentage points less likely to report that their child
intends to attend college. Panels A and B of Figure 3 each display a visible discontinuity
around the income cut-o¤ for GPA and the intention to attend college. Interestingly, winning
a voucher does not increase the intention to major in computer science in college.
Panel B investigates the impact of winning a voucher on various behavioral outcomes.
Children in households who received a voucher show a large reduction in their school behavior
grade during the 2005-2006 school-year. This result is large and statistically signi�cant, and
the discontinuity clearly visible in Panel D of Figure 3. We also explore the e¤ect of computer
ownership on the Rosenberg Self-Esteem index, the Behavioral Problem Index (BPI), as well
as child weight and drinking behavior. However, we �nd no signi�cant impacts on these
variables. To summarize, the evidence on GPA, college plans and the school behavior grade
presented in Table 5 suggests that, if anything, computer ownership has a negative impact
on child academic and behavioral outcomes.
27Again, scaling these coe¢ cients using computer ownership in 2006, these regression results suggest thatcomputer ownership decreases GPA by about 0.6 of a standard deviation. Note that, although large, thise¤ect is not very precisely measured.
20

6.4 Heterogeneous E¤ects
In order to delve deeper and try to understand our �ndings thus far, we explore how the
e¤ects of winning a computer voucher vary by both family and individual characteristics.
Given that parental supervision and monitoring may be important mediating factors for the
e¤ect of home computers on child and adolescent outcomes, we begin by focusing on several
proxies for parental involvement. First, we introduce an indicator variable for whether the
mother is a stay-at-home mom. Approximately 60 percent of the mothers in our sample
were reported to be stay-at-home moms.28 Second, we include a variable based on a survey
question in which we asked parents whether they had rules to regulate computer use for
each child. About one third of parents in homes with computers indicated the existence of
such rules.29 Finally, we also examine the e¤ect of having a less educated mother to check
whether there are di¤erences associated with parental education. We proceed to estimate
equations in which the variable for winning a Euro 200 voucher is interacted with these
various parental characteristics.30
Table 6 presents results from estimating this equation for six of our main outcome vari-
ables (hours computer on, homework hours per week, TV hours per week, GPA, school
behavior grade and college plans). Panel A reveals signi�cant di¤erences among program
winners who have stay-at-home mothers. For �ve out of our six outcome variables, the in-
teraction between winner and having a mother at home is large and with the opposite sign
of the main e¤ect. Moreover, these interactions are statistically signi�cant for homework
hours per week, GPA and the behavior grade. In other words, the presence of a stay-at-
home mom substantially mitigates the negative e¤ects of winning a computer voucher on
28We do not include women who are unemployed in this de�nition of stay-at-home moms.29Note that these variables are potentially endogenous since they are measured after receipt of a computer.30Speci�cally we estimate the equation: outcomei = �0Xi + �winneri + �parent_charsi + �winneri �
parent_charsi+f (incomei)+"iwhere parent_charsi is an indicator for whether the mother stays at home,parents have rules about computer use, or the mother only has a primary education.
21

these outcomes.31 Similar but weaker results can be seen in Panel B for the interaction of
winning a voucher and the presence of rules for computer use in the household. Column 1 of
Panel B indicates that this interaction is negative and statistically signi�cant for the hours
computers are turned on, implying that the largest increase in computer use occur in families
where parents do not restrict access to the computer.32 While the remaining columns also
suggest di¤erential e¤ects on time spent watching TV and GPA, these estimates are not
very precise. Panel C shows that the e¤ects of winning a computer voucher do not vary
signi�cantly with the education level of the mother. This is consistent with the view that
the role of stay-at-home mothers in explaining the heterogeneity of outcomes is driven by
their ability to better monitor the activities of children in the home.
Appendix Table 1 explores the impact of child characteristics on the e¤ect of winning
a computer voucher. We focus on interactions with child age, gender, and the number of
siblings.33 Using the same six outcomes in Panels A to C, we do not �nd evidence that the
e¤ects of winning a computer voucher vary signi�cantly with respect to these characteristics.
6.5 Robustness Checks
For robustness, we examine whether our main controls vary continuously around the income
cuto¤. Appendix Table 2 presents evidence showing that the discontinuities for age, gender
and education of the primary caregiver as well as age, gender and ethnicity of the child are
almost always small and statistically insigni�cant. In only one case (probability of being
Roma) do we reject the null hypothesis. The smoothness of these controls around the
discontinuity can also be observed in Appendix Figure 2, which shows plots corresponding
31Using F-tests for joint signi�cance we still reject a zero e¤ect of vouchers for the subsample of kidswith stay-at-home moms. If we actually limit to the sample of stay-at-home moms, the coe¢ cients are notsigni�cant but this is mostly due to lack of power.32This is striking insofar as having rules is associated with higher levels of computer use in the cross-section.33Speci�cally we estimate the equation: outcomei = �0Xi + �winneri + �child_charsi + �winneri �
child_charsi + f (incomei) + "iwhere child_charsi includes age, gender and number of siblings.
22
to a number of background variables included in the table.
All of our main results thus far were estimated using a linear spline speci�cation for
the income function. Panel A of Appendix Table 3 present results for six of our main
outcome variables of interest (hours computer on, homework hours per week, TV hours per
week, GPA, behavior grade and college plans) using alternative speci�cations for the income
function. These include linear, quadratic and cubic trends in income as well as a quadratic
and cubic spline. In Panel B, we consider two alternative samples which restrict the windows
around the cuto¤s to 500,000 and 300000 lei. Obviously, the precision of our estimates are
bound to be lower in these narrow windows. Finally, Panel C shows results using two
alternative sets of possible control variables. One speci�cation drops all the control variables
while the other includes additional household characteristics such as availability of sewage,
hot water and toilet. Most of our estimates remain signi�cant across di¤erent speci�cations.
However, even in cases where we lose some precision, the magnitude of these estimates
remains quite similar.
7 Conclusion
This paper examines the e¤ect of access to a home computer on educational and behavioral
outcomes among low-income children and adolescents. Using data that we collected through
in-depth household interviews during 2007, we implement a regression discontinuity design
and estimate the impact of winning a government-funded voucher worth 200 Euros towards
the purchase of personal computer in 2005. We �nd that winning such a voucher signi�cantly
increases the likelihood that households own a home computer by about 50 percent. Since
the voucher only covered about 75 percent of the cost of a new computer, this result indicates
that households expended further resources to acquire this technology. As expected, higher
rates of computer ownership among winners also led to increased computer use. Computers
23
were turned on for almost 1 hour longer each day in households that were received a voucher
and children in these households were signi�cantly more likely to use computers than their
counterparts who did not win a voucher. We �nd that children who won a voucher spent
signi�cantly less time watching television and doing homework. Moreover, the e¤ect on
homework appears to have had real consequences for school performance. We �nd evidence
indicating that children who won a voucher had lower school grades. Parents reported that
these children had a signi�cantly lower expectation of going to college. Finally, we also �nd
suggestive evidence that winning a voucher is associated with negative behavioral outcomes.
These �ndings indicate that providing home computers to low-income children in Ro-
mania led them to experience worse outcomes. How do we interpret these �ndings? It
does not appear that these results are driven by the poor implementation of the Romania�s
voucher program. In fact, the program seems to have been successful in increasing home
computer ownership and use among low-income children. However, despite the e¤orts of
the Romanian Ministry of Education to encourage the use of these computers for educa-
tional purposes through the provision of educational lessons, relatively few children have
educational software installed on their computer, and fewer still report using the educational
software on a regular basis. Instead, our analysis brings out the important role of parents in
shaping the impact of home computer use on child and adolescent outcomes. We �nd that in
families where mothers stay at home and where parents have rules regarding computer use,
the negative e¤ects of winning a voucher are greatly reduced. Thus, our �ndings suggest
caution regarding the broader impact of home computers on child outcomes. They also raise
questions about the usefulness of recent large-scale e¤orts to increase computer access for
disadvantaged children around the world without paying su¢ cient attention to how parental
oversight a¤ects a child�s computer use.
24

References
Angrist, Joshua, and Victor Lavy (2002) "New Evidence on Classroom Computers andPupil Learning," The Economic Journal, 112: 735-65.
Attewell, Paul, and Juan Battle (1999) �Home Computers and School Performance,�TheInformation Society 15: 1-10.
Banerjee, Abhijit , Shawn Cole , Esther Du�o Leigh Linden, (2007) "Remedying Ed-ucation: Evidence from Two Randomized Experiments in India," Quarterly Journal ofEconomics 122(3): 1235-1264
Barrow, Lisa, Markman, Lisa and Rouse, Cecilia E., (2007) "Technology�s Edge: TheEducational Bene�ts of Computer-Aided Instruction" Federal Reserve Bank of ChicagoWorking Paper No. 2007-17
Beltran, Daniel, Das, Kuntal and Fairlie, Robert W. (2006) "Do Home Computers ImproveEducational Outcomes? Evidence from Matched Current Population Surveys and theNational Longitudinal Survey of Youth 1997" IZA Discussion Paper No. 1912
Cuban, Larry (2001) Oversold and Underused: Computers in the Classroom. Cambridge:Harvard University Press.
DiNardo, J., & Pischke, J.S. (1997) �The returns to computer use revisited: Have pencilschanged the wage structure too?�Quarterly Journal of Economics 112(1): 291-304.
�Four countries commit to buy 4 million Linux-powered OLPC laptops.� (2006)eWeek.com
Fairlie, Robert W. (2005) �The E¤ects of Home Computers on School Enrollment,�Eco-nomics of Education Review 24: 533�547
Fuchs, Thomas, and Ludger Woessmann (2004) �Computers and Student Learning: Bi-variate and Multivariate Evidence on the Availability and Use of Computers at Home andat School" CESIFO Working Paper No. 1321
Gentzkow, Matthew and Jesse Shapiro (2008) �Preschool television viewing and adolescenttest scores: Historical evidence from the Coleman study�Quarterly Journal of Economics,123(1): 279-323
Giacquinta, J.B., Bauer, J., and J.E. Levin (1993) Beyond Technology�s Promise: AnExamination of Children�s Educational Computing at Home Cambridge, UK: CambridgeUniversity Press
Goolsbee, Austan, and Jonathan Guryan (2006) �The Impact of Internet Subsidies inPublic Schools," Review of Economics and Statistics 88(2): 336�347
Hahn, J., P. Todd, and W. van der Klaauw (2001) �Identi�cation and Estimation ofTreatment E¤ects with a Regression Discontinuity Design,�Econometrica 69 (1), 201�209
25

Jensen, Robert and Emily Oster (2007) �The Power of TV: Cable Television and Women�sStatus in India�, mimeo
Lawrence F. Katz, Je¤rey R. Kling and Je¤rey B. Liebman (2001) �Moving to Opportunityin Boston: Early Results of a Randomized Mobility Experiment,�Quarterly Journal ofEconomics 116, 607-54
Kirpatrick, H., and L. Cuban (1998) "Computers Make Kids Smarter�Right?" TechnosQuarterly for Education and Technology, 7:2.
Kraut, R. E., Kiesler, S., Boneva, B. & Shklovski, I. (2001) �Examining the impact ofInternet use on TV viewing: Details make a di¤erence�In R. Kraut, M. Brynin, and S.Kiesler (Eds)
Krueger, Alan B. (1993) �How Computers Have Changed the Wage Structure: Evidencefrom Microdata, 1984-1989�Quarterly Journal of Economics 108 (1): 33-60
Olken, Benjamin (2007) �Do Television and Radio Destroy Social Capital? Evidence fromIndonesian Villages�, NBER Working Paper 12561
Organisation for Economic Co-operation and Development (OECD) (2005) Are StudentsReady for a Technology-Rich World?What PISA Studies Tell Us (PISA) Paris: OECD
Rebelo, P. (2005) �Brazil�s bumpy road to the low-cost PC�CNet News.com
Rouse, Cecilia E., and Alan B. Krueger (2004) �Putting Computerized Instruction to theTest: A Randomized Evaluation of a "Scienti�cally-Based" Reading Program,�Economicsof Education Review, 23: 323-38
Schmitt, John, and Jonathan Wadsworth (2004) �Is There an Impact of Household Com-puter Ownership on Children�s Educational Attainment in Britain?�Centre for EconomicPerformance Discussion Paper No. 625
Schneider, B., and J. S Coleman, eds. (1993) Parents, their children, and schools. Boulder,CO: Westview Press
Stanger, J.D. (1998) Television in the home Philadelphia: Annenberg Public Policy Cen-ter, University of Pennsylvania.
Subrahmanyam, K., and Green�eld, P.M. (1994) �E¤ect of video game practice on spatialskills in girls and boys�Journal of Applied Developmental Psychology 15:13�32
Subrahmanyam, K, R. Kraut, P. Green�eld and E. Gross (2000). �The Impact of HomeComputer Use on Children�s Activities and Development�, The Future of Children �Chil-dren and Computer Technology 10(2)
Subrahmanyam, K., Green�eld, P., Kraut, R., & Gross, E. (2001) �The impact of computeruse on children�s and adolescents�development�Applied Developmental Psychology 22, 7-30
26

U.S. Census Bureau (2005) �Computer and Internet Use in the United States: 2003�Current Population Reports P23-208
27

Notes: The dependent variables are defined in Table 2. In Panels C-F, the open circles plot residuals from regressions of the dependent variables on a number of parental and child background variables. The solid lines are fitted values to residuals from regressions of the dependent variable on a linear spline. The income variable is the monthly household income per family member used by the Euro 200 program and is normalized to be 0 at the 506,000 lei ($17) cutoff. Source: 2007 Euro 200 Survey.
01
Yes
=1 N
o=0
-500000 0 500000 1000000Income
Panel A: Winner of Voucher
01
Yes
=1 N
o=0
-500000 0 500000 1000000Income
Panel B: Used Voucher0
1P
ropo
rtion
-500000 0 500000 1000000Income
Panel C:Computer at Home-20060
1P
ropo
rtion
-500000 0 500000 1000000Income
Panel D:Computer at Home-2007
04
Hou
rs p
er d
ay
-500000 0 500000 1000000Income
Panel E: Hours Computer On
14
Com
pute
r Use
Inde
x
-500000 0 500000 1000000Income
Panel F: Home Computer Use
Figure 1 - Computer Ownership and Use

Notes: The dependent variables are defined in Table 2. The open circles plot residuals from regressions of the dependent variables on a number of parental and child background variables. The solid lines are fitted values to residuals from regressions of the dependent variable on a linear spline. The income variable is the monthly household income per family member used by the Euro 200 program and is normalized to be 0 at the 506,000 lei ($17) cutoff. Source: 2007 Euro 200 Survey.
13
Hou
rs p
er s
essi
on
-500000 0 500000 1000000Income
Panel A: Homework Hrs per Session
520
Hou
rs p
er w
eek
-500000 0 500000 1000000Income
Panel B: Homework Hours per Week1
3H
ours
-500000 0 500000 1000000Income
Panel C: Hours TV per Session5
20H
ours
-500000 0 500000 1000000Income
Panel D: Hours TV per Week
810
Hou
rs o
f sle
ep
-500000 0 500000 1000000Income
Panel E: Hours Sleep
01
Yes
=1 N
o=0
-500000 0 500000 1000000Income
Panel F: Read More Than Weekly
Figure 2 - Time Use

Notes: The dependent variables are defined in Table 2. The open circles plot residuals from regressions of the dependent variables on a number of parental and child background variables. The solid lines are fitted values to residuals from regressions of the dependent variable on a linear spline. The income variable is the monthly household income per family member used by the Euro 200 program and is normalized to be 0 at the 506,000 lei ($17) cutoff. Source: 2007 Euro 200 Survey.
7.5
9P
ropo
rtion
-500000 0 500000 1000000Income
Panel A: GPA
.51
Yes
=1 N
o=0
-500000 0 500000 1000000Income
Panel B: College plans9.
510
.5P
ropo
rtion
-500000 0 500000 1000000Income
Panel C: Behavior Grade0
.2B
PI
-500000 0 500000 1000000Income
Panel D: Behavioral Problem Index
1622
Inde
x
-500000 0 500000 1000000Income
Panel E: Rosenberg Index
3555
Wei
ght i
n K
Gs
-500000 0 500000 1000000Income
Panel F: Weight
Figure 3 - Academic and Behavioral Outcomes

Notes: The dependent variables are defined in Table 2. The open circles plot residuals from regressions of the dependent variables on the remaining background variables. The solid lines are fitted values to residuals from regressions of the dependent variable on a linear spline. The income variable is the monthly household income per family member used by the Euro 200 program and is normalized to be 0 at the 506,000 lei ($17) cutoff. Source: 2007 Euro 200 Survey.
-10
10Y
ear o
f birt
h
-500000 0 500000 1000000Income
Panel A:Parent year of birth
-.5.5
Per
cent
Fem
ale
-500000 0 500000 1000000Income
Panel C: Parent gender-.5
.5P
erce
nt S
econ
dary
-500000 0 500000 1000000Income
Panel C: Parent primary ed.-.2
5.2
5P
erce
nt T
ertia
ry
-500000 0 500000 1000000Income
Panel D: Parent tertiary ed.
-55
Yea
r of b
irth
-500000 0 500000 1000000Income
Panel E: Child year of birth
-.5.5
Per
cent
Fem
ale
-500000 0 500000 1000000Income
Panel F: Child gender
Appendix Figure 1 - Specification Tests

Table 1: Summary Statistics at the Household LevelMean SD N
Winner 0.490 0.500 858Income (ven) 524,979 450,898 852Used Coupon 0.480 0.500 858Number of children 2.104 0.929 858Female HoH 0.119 0.324 858Age of HoH 43.009 8.057 855Ethnicity of HoH Romanian 0.532 0.499 857 Hungarian 0.408 0.492 857 Gypsy 0.060 0.237 857Education of HoH Primary 0.226 0.418 846 Secondary 0.748 0.434 846 Tertiary 0.026 0.159 846Computer ownership Have a computer 0.749 0.434 856 Have a computer in 2006 0.648 0.478 856 Have a computer w/ educ software 0.303 0.460 769 Have internet 0.053 0.223 855 Hours computer is on 1.785 1.967 844Stay_at_home mother 0.598 0.491 850Mother has Primary Education 0.186 0.389 838Locality 58.81 33.45 858
Notes: SD is the standard deviation and N is the sample size. All summary statistics are based on the head of household. Source: 2007 Euro 200 survey.

Table 2: Summary Statistics at the Child levelMean SD N
Panel A: Parental survey reportsGender 0.478 0.500 1,794Age 13.487 5.138 1,790Time use Home computer use (frequency) 2.781 1.696 1,732 Hours TV per day 2.141 1.371 1,513 Hours TV per week 12.935 9.660 1,505 Read (every day) 0.271 0.445 1,698Educational and Behavioral outcomes GPA 2005-2006 8.355 1.025 789 Behavior grade 2005-2006 9.931 0.391 934 Plan to attend high school 0.941 0.235 903 Plan to attend college 0.749 0.434 1,195 Career in computers 0.096 0.295 1,247 BPI Index 0.091 0.163 1,616 Weight (kilos) 45.331 17.106 1,726Parents have rules for computers 0.263 0.440 1,713
Panel B: Child survey reportsGender 0.499 0.500 1,161Age 14.133 4.307 1,161Ethnicity Romanian 0.531 0.499 1,164 Hungarian 0.398 0.490 1,164 Roma 0.068 0.252 1,164Computer use (more than once a week) for games 0.475 0.500 1,159 for education 0.152 0.359 1,161 for other activities 0.413 0.493 1,151Time use Home computer use (frequency) 2.475 1.933 1,131 Hours homework per day 1.944 1.124 1,091 Hours homework per week 12.400 8.437 1,086 Hours sleep 8.806 1.254 1,095Educational and Behavioral outcomes GPA 2005-2006 8.347 1.047 693 Rosenberg index 19.710 3.834 1,055 Drunk 1.266 0.572 1,157
Notes: SD is the standard deviation and N is the sample size. Source: 2007 Euro 200 survey.

Table 3: Effect of the Euro200 program on Computer Ownership and Use
dependent variable Computer at home '06 Computer at home '07 Hours computer on Computer with educational software Home Computer use
(1) (2) (3) (4) (5) (6) (7) (8) (9) (10)
Winner 0.544*** 0.525*** 0.245*** 0.276*** 0.851** 0.772** 0.122 0.174** 0.529** 0.975***[0.067] [0.069] [0.065] [0.070] [0.339] [0.375] [0.089] [0.086] [0.244] [0.341]
Sample Size 834 1741 830 1729 818 1704 745 1555 1677 995R2 0.53 0.54 0.44 0.45 0.25 0.26 0.3 0.33 0.35 0.36Mean of dep. var. 0.648 0.653 0.749 0.751 1.785 2.021 0.303 0.466 2.781 2.475Survey household household household household household household household household household childUnit household child household child household child household child child child
Notes: Robust standard errors in brackets. In regressions where the unit of observation is the child, the standard errors are clustered at the household level. ***, ** and * indicate statistical significance at the 1, 5 and 10 percent level respectively. The dependent variables are defined in Tables 1 and 2. "Winner" is defined as 1 for individuals with an income above the program cutoff of 506,000 lei ($17), 0 otherwise. In the household level regressions, the controls include age, gender, ethnicity and education of the head of household as well as locality controls. In the child level regressions, we additionally also control for age, gender and ethnicity of the child. All regressions include a linear spline in income. Source: 2007 Euro 200 survey.

Table 4: Effect of the Euro200 program on Time Use
dependent variable Homework hours Homework hours per week Reading every week TV hours TV hours per week Hours sleep
(1) (2) (3) (4) (5) (6)
Winner -0.284* -2.341* -0.081 -0.408* -3.461** -0.269[0.169] [1.306] [0.067] [0.225] [1.714] [0.188]
Sample Size 997 994 1301 1157 1154 965R2 0.27 0.31 0.29 0.25 0.25 0.30Mean of dep. var. 1.944 12.400 0.271 2.141 12.935 8.806Survey child child household household household childUnit child child child child child child
Notes: Robust standard errors clustered at the household level are in brackets. ***, ** and * indicate statistical significance at the 1, 5 and 10 percent level respectively. The dependent variables are defined in Tables 1 and 2. "Winner" is defined as 1 for individuals with an income above the program cutoff of 506,000 lei ($17), 0 otherwise. All regressions include controls for age, gender, ethnicity and education of the head of household, age, gender and ethnicity of the child and locality controls. All regressions include a linear spline in income. Source: 2007 Euro 200 survey.
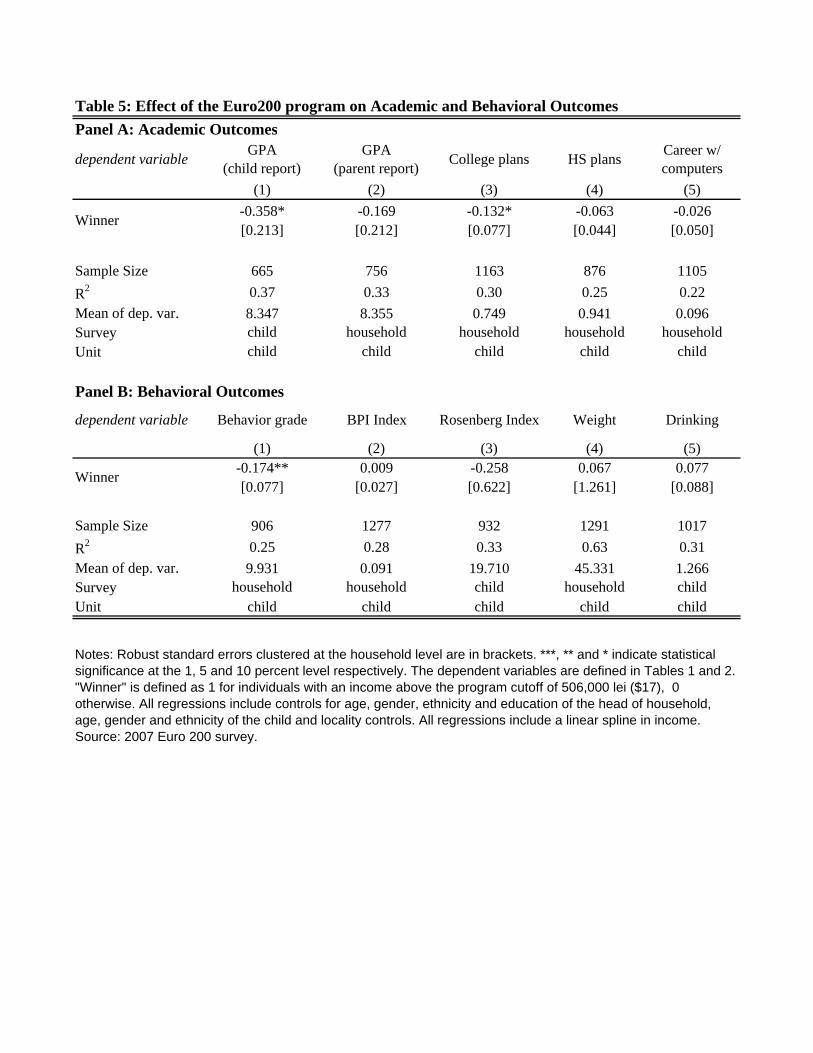
Table 5: Effect of the Euro200 program on Academic and Behavioral OutcomesPanel A: Academic Outcomes
dependent variable GPA (child report)
GPA (parent report) College plans HS plans Career w/
computers(1) (2) (3) (4) (5)
Winner -0.358* -0.169 -0.132* -0.063 -0.026[0.213] [0.212] [0.077] [0.044] [0.050]
Sample Size 665 756 1163 876 1105R2 0.37 0.33 0.30 0.25 0.22Mean of dep. var. 8.347 8.355 0.749 0.941 0.096Survey child household household household householdUnit child child child child child
Panel B: Behavioral Outcomes
dependent variable Behavior grade BPI Index Rosenberg Index Weight Drinking
(1) (2) (3) (4) (5)
Winner -0.174** 0.009 -0.258 0.067 0.077[0.077] [0.027] [0.622] [1.261] [0.088]
Sample Size 906 1277 932 1291 1017R2 0.25 0.28 0.33 0.63 0.31Mean of dep. var. 9.931 0.091 19.710 45.331 1.266Survey household household child household childUnit child child child child child
Notes: Robust standard errors clustered at the household level are in brackets. ***, ** and * indicate statistical significance at the 1, 5 and 10 percent level respectively. The dependent variables are defined in Tables 1 and 2. "Winner" is defined as 1 for individuals with an income above the program cutoff of 506,000 lei ($17), 0 otherwise. All regressions include controls for age, gender, ethnicity and education of the head of household, age, gender and ethnicity of the child and locality controls. All regressions include a linear spline in income. Source: 2007 Euro 200 survey.
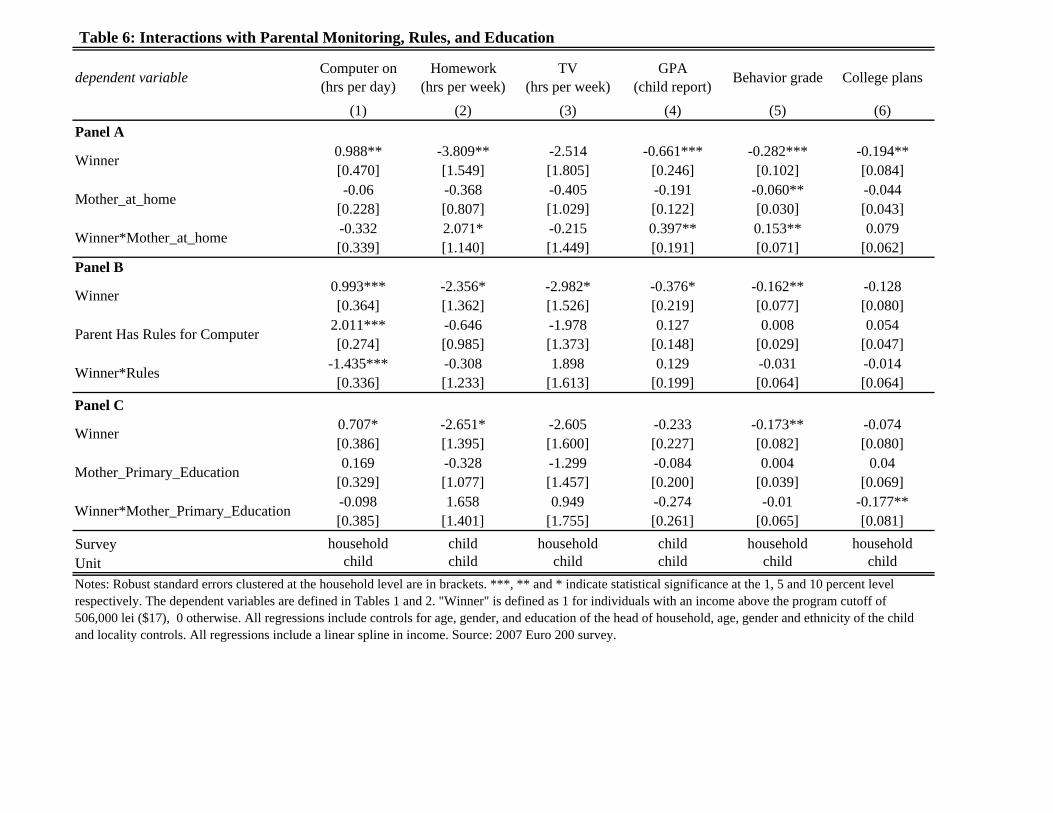
Table 6: Interactions with Parental Monitoring, Rules, and Education
dependent variable Computer on (hrs per day)
Homework (hrs per week)
TV (hrs per week)
GPA (child report) Behavior grade College plans
(1) (2) (3) (4) (5) (6)Panel A
Winner 0.988** -3.809** -2.514 -0.661*** -0.282*** -0.194**[0.470] [1.549] [1.805] [0.246] [0.102] [0.084]
Mother_at_home -0.06 -0.368 -0.405 -0.191 -0.060** -0.044[0.228] [0.807] [1.029] [0.122] [0.030] [0.043]
Winner*Mother_at_home -0.332 2.071* -0.215 0.397** 0.153** 0.079[0.339] [1.140] [1.449] [0.191] [0.071] [0.062]
Panel B
Winner 0.993*** -2.356* -2.982* -0.376* -0.162** -0.128[0.364] [1.362] [1.526] [0.219] [0.077] [0.080]
Parent Has Rules for Computer 2.011*** -0.646 -1.978 0.127 0.008 0.054[0.274] [0.985] [1.373] [0.148] [0.029] [0.047]
Winner*Rules -1.435*** -0.308 1.898 0.129 -0.031 -0.014[0.336] [1.233] [1.613] [0.199] [0.064] [0.064]
Panel C
Winner 0.707* -2.651* -2.605 -0.233 -0.173** -0.074[0.386] [1.395] [1.600] [0.227] [0.082] [0.080]
Mother_Primary_Education 0.169 -0.328 -1.299 -0.084 0.004 0.04[0.329] [1.077] [1.457] [0.200] [0.039] [0.069]
Winner*Mother_Primary_Education -0.098 1.658 0.949 -0.274 -0.01 -0.177**[0.385] [1.401] [1.755] [0.261] [0.065] [0.081]
Survey household child household child household householdUnit child child child child child childNotes: Robust standard errors clustered at the household level are in brackets. ***, ** and * indicate statistical significance at the 1, 5 and 10 percent level respectively. The dependent variables are defined in Tables 1 and 2. "Winner" is defined as 1 for individuals with an income above the program cutoff of 506,000 lei ($17), 0 otherwise. All regressions include controls for age, gender, and education of the head of household, age, gender and ethnicity of the child and locality controls. All regressions include a linear spline in income. Source: 2007 Euro 200 survey.

Appendix Table 1: Heterogenous Effects
dependent variable Computer on (hrs per day)
Homework (hrs per week)
TV (hrs per week)
GPA (child report) Behavior grade College plans
(1) (2) (3) (4) (5) (6)Panel A
Winner 0.791** -3.097** -2.824* -0.345 -0.178** -0.153*[0.394] [1.374] [1.581] [0.235] [0.077] [0.081]
Female -0.165 1.531** -0.538 0.577*** 0.037 0.136***[0.124] [0.721] [0.683] [0.106] [0.028] [0.032]
Winner*Female 0.02 1.581 0.531 -0.027 0.01 0.05[0.171] [1.034] [0.910] [0.170] [0.053] [0.048]
Panel B
Winner 1.074** -5.818** -0.539 -0.372 -0.099 -0.03[0.466] [2.396] [2.044] [0.570] [0.194] [0.135]
Age -0.041 -0.491*** -0.163 -0.063 -0.014 -0.022[0.026] [0.185] [0.142] [0.049] [0.017] [0.015]
Winner*Age -0.02 0.244* -0.147 0.001 -0.005 -0.007[0.020] [0.138] [0.105] [0.032] [0.011] [0.009]
Panel 3
Winner 1.724** -4.001** -1.925 -0.139 -0.115 -0.124[0.720] [1.988] [2.514] [0.293] [0.095] [0.116]
Number_of_siblings 0.307 -0.711* 0.12 -0.062 0.035** -0.045[0.190] [0.403] [0.589] [0.082] [0.018] [0.030]
Winner*Number_of_siblings -0.329 0.683 -0.23 -0.063 -0.025 0.006[0.234] [0.529] [0.694] [0.093] [0.021] [0.036]
Survey household child household child household householdUnit child child child child child childNotes: Robust standard errors clustered at the household level are in brackets. ***, ** and * indicate statistical significance at the 1, 5 and 10 percent level respectively. The dependent variables are defined in Tables 1 and 2. "Winner" is defined as 1 for individuals with an income above the program cutoff of 506,000 lei ($17), 0 otherwise. All regressions include controls for age, gender, and education of the head of household, age, gender and ethnicity of the child and locality controls. All regressions include a linear spline in income. Source: 2007 Euro 200 survey.

Appendix Table 2: Specification Tests (Effect of the Euro200 program on covariates)Panel A: HH Characteristics
dependent variable Age Gender Primary Secondary Tertiary
(1) (2) (3) (4) (5)
Winner 1.128 0.104 0.028 -0.033 0.005[1.545] [0.072] [0.062] [0.067] [0.027]
Sample Size 837 837 837 837 837R2 0.20 0.17 0.40 0.37 0.23Mean of dep. var. 43.009 0.119 0.226 0.748 0.026Survey household household household household householdUnit household household household household household
Panel B: Child Characteristicsdependent variable Age Gender Romanian Hungarian Roma
(1) (2) (3) (4) (5)
Winner -0.122 -0.041 -0.037 -0.028 0.065**[0.476] [0.086] [0.029] [0.037] [0.033]
Sample Size 1023 1023 1023 1023 1023R2 0.30 0.10 0.90 0.82 0.51Mean of dep. var. 14.133 0.499 0.531 0.398 0.068Survey child child child child childUnit child child child child child
Notes: Robust standard errors clustered at the household level are in brackets. ***, ** and * indicate statistical significance at the 1, 5 and 10 percent level respectively. The dependent variables are defined in Tables 1 and 2. "Winner" is defined as 1 for individuals with an income above the program cutoff of 506,000 lei ($17), 0 otherwise. All regressions include a linear spline in income. Source: 2007 Euro 200 survey.

Appendix Table 3: Robustness checksPanel A: Academic Outcomes
dependent variable Computer on (hrs per day)
Homework (hrs per week)
TV (hrs per week)
GPA (child report)
Behavior grade College plans
(1) (2) (3) (4) (5) (6)Alternative Trends
Linear 0.937*** -1.416 -3.358* -0.184 -0.083 -0.113*[0.311] [1.168] [1.821] [0.192] [0.061] [0.065]
Quadratic 0.810** -2.604* -3.298* -0.334 -0.204** -0.140*[0.342] [1.332] [1.782] [0.221] [0.081] [0.080]
Cubic 0.692* -3.150** -2.726 -0.182 -0.204*** -0.126[0.368] [1.421] [2.057] [0.242] [0.076] [0.089]
Linear spline 0.851** -2.340* -3.461** -0.357* -0.174** -0.132*[0.339] [1.306] [1.714] [0.214] [0.077] [0.077]
Quadratic spline 0.578 -3.252* -4.418** -0.204 -0.186* -0.013[0.438] [1.969] [2.243] [0.350] [0.101] [0.119]
Cubic Spline 0.104 -1.722 -7.174** -0.253 -0.249** 0.055[0.555] [2.499] [3.281] [0.474] [0.116] [0.153]
Alternate Windows
full window 0.851** -2.341* -3.461** -0.356* -0.173** -0.132*[0.339] [1.305] [1.714] [0.213] [0.077] [0.077]
500,000 lei window 0.574 -2.580* -3.513* -0.233 -0.165** -0.193**[0.362] [1.528] [2.105] [0.262] [0.074] [0.095]
300,000 lei window 0.51 -2.313 -5.635** -0.058 -0.107 -0.086[0.540] [2.186] [2.223] [0.436] [0.079] [0.140]
Alternative control
No controls 1.082*** -0.905 -3.607** -0.31 -0.137 -0.072[0.298] [1.217] [1.607] [0.200] [0.099] [0.075]
Main controls 0.851** -2.340* -3.461** -0.357* -0.174** -0.132*[0.339] [1.307] [1.714] [0.213] [0.077] [0.077]
Additional controls 0.926*** -3.311** -2.862* -0.424** -0.185** -0.123[0.344] [1.399] [1.575] [0.213] [0.083] [0.079]
Notes: Robust standard errors clustered at the household level are in brackets. ***, ** and * indicate statistical significance at the 1, 5 and 10 percent level respectively. The dependent variables are defined in Tables 1 and 2. "Winner" is defined as 1 for individuals with an income above the program cutoff of 506,000 lei ($17), 0 otherwise. Source: 2007 Euro 200 survey.

Appendix Table 4: OLS Results for Selected VariablesPanel A: Time Use
dependent variable TV Hours per week Homework hours per week Read every day Sleep
(1) (2) (3) (4)
Computer -0.983 1.17 -0.021 -0.05[1.530] [0.956] [0.055] [0.138]
Sample Size 619 519 664 511R2 0.29 0.34 0.35 0.38Mean of dep. var. 12.935 12.400 0.271 8.806Survey household child household childUnit child child child child
Panel B: Academic and Behavioral Outcomes
dependent variable GPA 05-06 College plans Behavior grade Rosen Index
(1) (2) (3) (4)
Computer 0.386*** 0.146*** 0.037 -0.818*[0.134] [0.047] [0.036] [0.445]
Sample Size 413 600 473 495R2 0.43 0.37 0.43 0.41Mean of dep. var. 8.347 0.749 9.931 19.710Survey household household household childUnit child child child child
Notes: Robust standard errors clustered at the household level are in brackets. ***, ** and * indicate statistical significance at the 1, 5 and 10 percent level respectively. The dependent variables are defined in Tables 1 and 2. All regressions include controls for age, gender, ethnicity and education of the head of household, age, gender and ethnicity of the child and locality controls. All OLS regressions are restricted to the households that did not win a voucher in the 2005 round of the Euro 200 program. Source: 2007 Euro 200 survey.