The Education system in pakista - UNESCO - Homepage | UNESCO
45
The Education System in Pakistan D. Lynd
Transcript of The Education system in pakista - UNESCO - Homepage | UNESCO

The Education
System in Pakistan
D. Lynd

42 pages
ISBN 978 969 8035 06 8
Produced by: Dr. Douglas Lynd, Education Consultant, Canada.
© UNESCO 2007
Published byUNESCO Islamabad, PakistanHouse #17, Street #8, Sector F-7/3P.O. Box 2034Islamabad, Pakistan
Phone: +92 51 2611170-3Fax: +92 51 2611175E-mail: [email protected]: www.un.org.pk/unesco
Printed in Pakistan
The author is responsible for interpretation of data and information in this publication, and for the opinion expressed therein, which are not necessarily those of UNESCO.
The Education System in Pakistan:Assessment of the National Education Census

THE EDUCATION SYSTEM IN PAKISTAN:AN ASSESSMENT FROM NATIONAL EDUCATION STATISTICS
D. Lynd
for
UNESCO Pakistan
December, 2
The Education System
in Pakistan: Assessment of the
National Education Census


Preface
Reliable and accurate education statistics are a condition for sound educational planning and management. The first ever Pakistan National Education Census (NEC), 2005-06, was conducted bythe Federal Ministry of Education and the Statistics Division, Federal Bureau of Statistics. It covered 245,682 institutions, including public and private schools, colleges and universities, professional institutions, vocational and technical centres, mosque schools, deeni madaris, and non-formal education centres.
A number of statistical tables for the national and provincial levels were published. However, analysis of the data could go further in order to generate education indicators describing the education situation in Pakistan, and develop analyses underpinned by findings and technical explanations.
In this report, internationally recognised education indicators and the International Standard Classification of Education (ISCED) have been used. The indicators cover, amongst others, access, internal efficiency, gender disparity, all of which are necessary to monitor the evolution of the education system.
UNESCO Islamabad presents this report as a complementary analysis to the national efforts in carrying out the National Education Census.
UNESCO Islamabad


Table of Contents
Page
Preface
Executive Summary 7
Introduction 9
1. Capacity & Participation Issues in Pakistan's Education System 112. School Administration 203. Girls Education 244. Teaching Posts & Teacher Training 285. School Facilities 31
Appendices
Appendix 1: MDG & EFA Indicators 34Appendix 2: References 40
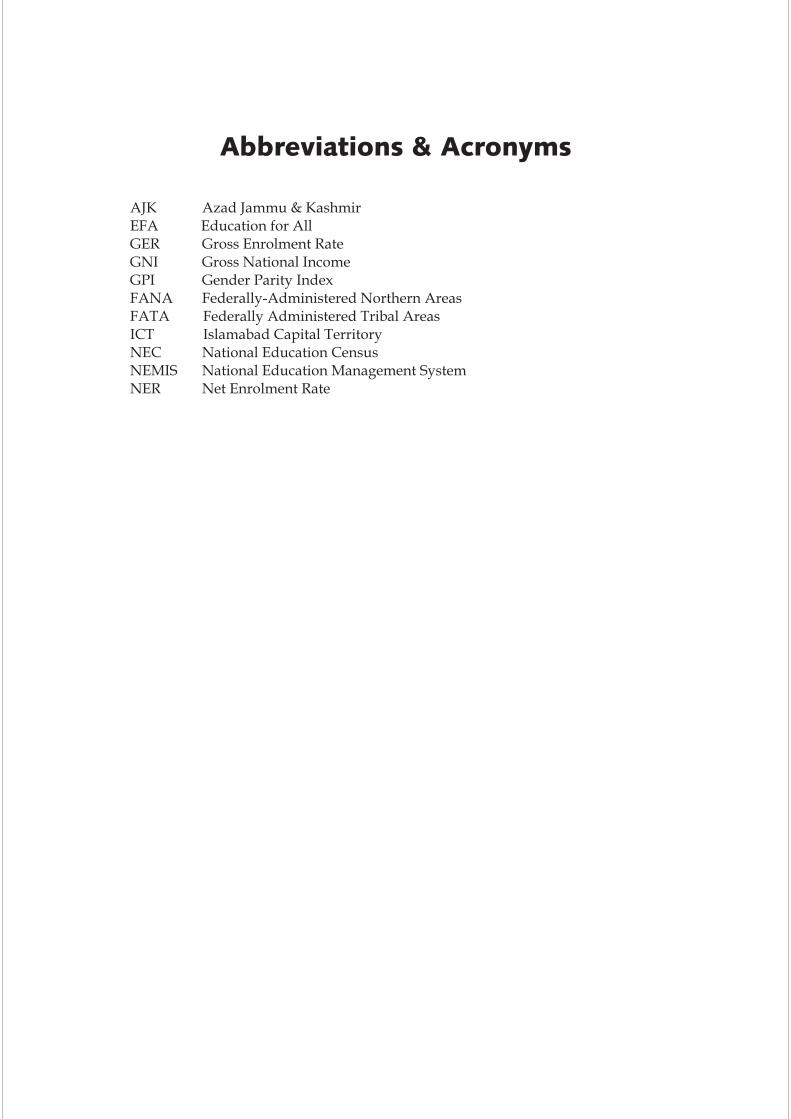
Abbreviations & Acronyms
AJK Azad Jammu & KashmirEFA Education for AllGER Gross Enrolment RateGNI Gross National IncomeGPI Gender Parity Index FANA Federally-Administered Northern Areas FATA Federally Administered Tribal AreasICT Islamabad Capital TerritoryNEC National Education CensusNEMIS National Education Management SystemNER Net Enrolment Rate

List of Tables & Charts
PageTables
Table 1: 2006 GNI & Population of Countries Selected for Comparison with Pakistan's Education System 10
Table 2: Percentage of Students by Level of Education, 2006 11Table 3: Average Student Places per Grade, 2006 12Table 4: Repetition Rates by Grade, Pakistan, 2006 36
Charts
Chart 1: Percentage of Students by Level of Education, Pakistan, 2006 12Chart 2: Average Student Places per Grade by Level of Education, Pakistan, 2006 13Chart 3: Average Secondary Student Places per Grade as a Percentage of
Average Primary Student Places per Grade, Selected Countries, 2005 14Chart 4: Average Upper Secondary Student Places per Grade as a Percentage of
Average Lower Secondary Student Places per Grade, Selected Countries, 2005 15Chart 5: Net Enrolment Rates by Level of Education and Province, 2006 16Chart 6: Primary Net Enrolment Rates, Selected Countries, 2005 17Chart 7: Gross Enrolment Ratios by Level of Education and Province, 2006 18Chart 8: Gross and Net Enrolment Rates by Level of Education, Pakistan, 2006 19Chart 9: Percentage of Students in Basic Education by School Administration &
Location, 2006 20Chart 10: Percentage of Students in Basic Education by School Administration &
Level of Education, 2006 21Chart 11: Percentage of Students in Basic Education by School Administration &
Province, 2006 22Chart 12: Percentage of Primary Students in Private Education,
Selected Countries, 2005 23Chart 13: Gender Parity Index for Basic Education Students by Level of Education,
Pakistan, 2006 24Chart 14: Gender Parity Index by Level of Education and Location, 2006 25Chart 15: Gender Parity Index for Primary Education by Province, 2006 26Chart 16: Gender Parity Index for Primary Education, Selected Countries, 2005 27Chart 17: Percentage of Vacant Teaching Posts by Level of Education,
Pakistan, 2006 28Chart 18: Percentage of Vacant Teaching Posts by Level of Education &
Location, Pakistan, 2006 29Chart 19: Percentage of Vacant Teaching Posts by Level of Education &
Province, 2006 29Chart 20: Percentage of Untrained Teachers by School Administration &
Location, Pakistan, 2006 30Chart 21: Percentage of Primary Schools Without Selected Facilities by School
Administration & Location, Pakistan, 2006 31Chart 22. Percentage of Primary Schools Without Selected facilities by Location,
Pakistan, 2006 32

Chart 23: Percentage of Schools with Electricity by Level of Education School Administration, Pakistan, 2006 33
Chart 24: Percentage of Public Students and Schools with Electricity by Level of Education, Pakistan, 2006 33
Chart 25: Gross Enrolment Ratios in Early Childhood Care & Development, Selected Countries, 2005 34
Chart 26: Apparent Gross Intake Rate to Grade 1, Primary, Selected Countries 2005 35
Chart 27: Literacy Rates of Youth (aged 15 to 24 years) by Gender, Selected Countries 37
Chart 28: Literacy Rates of Adults (aged 15 and over) & Youth (Aged 15 to 24), Selected Countries 38
Chart 29: Gender Parity Index of Adult (Aged 15 & Over) & Youth (Aged 15 to 24) Literacy Rates, Selected Countries 39

Executive Summary
The National Education Census (NEC) of 2005/06 was the first education census conducted in the history of Pakistan that was specifically designed to collect information on all types of schools. Itthus generated a complete and comprehensive picture of the current education system in the country, and provides a robust information baseline from which to measure future progress. Through ensuring a complete listing of schools, it also assists other education data collection activities in the field.
Pakistan also has a National Education Management Information System (NEMIS) which collects education data annually. The system covers public education sector, but to date has not comprehensively covered private sector educational provision. Since some 31% of basic education students attend private schools, it is therefore important that up-to-date information be made available on this sub-sector, to ensure that policy development is based on knowledge of the entire education system not just the public sector alone.
The NEC provides a snapshot of current conditions in education (including in the private sector), but it does not show whether conditions are improving or deteriorating over time. In order to answer such questions, similar data has to be obtained on a regular basis on both public and private schools. This can be achieved in one of three ways: first, the current NEMIS can be expanded to include private schools in their annual survey. If this is not operationally feasible, an ad hoc survey of private schools could be implemented on a regular basis; or instead, a third option would be to repeat the NEC periodically.
If the last alternative were chosen, analysts and policy makers would be likely to require an interval between censuses of no more than four or five years, to ensure its usefulness to coincide with the national planning cycle. Therefore, a second NEC would have to be implemented by 2010/2011 to accurately describe the education system and to assess its progress towards meeting national goals. A two-year planning cycle for such a census is therefore recommended, which means that work should begin now to set this in motion and to achieve such an objective.
However, the current NEC has certain basic deficiencies. For example, it does not collect information on the age of students, which is important for assessing student participation and monitoring change over time. Survey activities in the future should include such information.
A combination of the NEC and the NEMIS shows that over 36 million students were attending an educational institution in 2005/06. Just under 50% of those students (17.8 million) were studying at the primary level, 20.9% (7.5 million) in pre-primary, 15.4% (5.6 million) in middle elementary, 6.9% (2.5 million) in secondary, 2.5% (.9 million) in higher secondary and 4.9% (1.8 million) at the post-secondary level.
It is clear that Pakistan is still a long way from achieving universal primary enrolment. As indicated 1by the primary Net Enrolment Rate (NER)'s estimate of 62% , over 35% of the population 5 to 9 years
of age is not in school Given a population of 5 to 9 years old of some 19.5 million, this means that about 7 million children aged 5 to 9 are out of the education system.
Page 7
1 Provided by the Academy of Educational Planning & Management.

Furthermore, under current conditions, the education system does not provide for a substantial percentage of students to move beyond the primary level. At present, the average enrolment per grade at the middle elementary level is less than one-half the average enrolment per grade at the primary level. This is considerably less than that of most other countries, and it is clear that the delivery system needs to significantly increase the proportion of students capable of studying beyond the primary level.
Pakistan has a Gross Enrolment Rate (GER) at the primary level of almost 80% - (when all primary enrolment is measured against the population 5 to 9 years of age). The difference of 80% between the Net Enrolment Rate (NER) of 62% and the GER is due to the number of primary students who are over 9 years of age or under 5 years of age. Given the number of repeaters in primary grades and the incidence of students beginning their primary school after age 5, it is likely that most of the difference is due to overage students. Numerically, this means that over 2.5 million students in primary school are over 9 years of age. Any reduction in this number, possibly by decreasing the repetition rate, may open up places in the primary system for some of children not currently in school.
Private education institutions enroll 31% of the students who are in basic education (pre-primary through higher secondary). In urban centers, private schools account for slightly more students(51%) than the public sector (49%). However, the situation is reversed in rural areas, where over 80% of students attend public schools. At the primary, middle elementary and secondary levels of education, almost one-third of all students attend private schools. Although most countries have less extensive private provision of basic education than in Pakistan, some experience higher percentages, such as the Netherlands and Lebanon, both of which have over 60% of their basiceducation provided by the private sector.
In Pakistan, there were 14 million girls studying in basic education in 2005, compared to 18.3 million boys. In other words, there were over 4 million more boys than girls in basic education, which resultsin a Gender Parity Index (GPI) of .76. This disparity in favour of boys was prevalent at all levels of basic education, with the exception of the higher secondary level, where there was parity between the sexes, producing a GPI of 1.0. In Pakistan, because there are more boys than girls in the relevantpopulation, this represents a small disparity in favour of girls. This level of GPI at the higher secondary level shows that many more boys than girls discontinued their education after secondary school, with the result that their numbers matched those of the girls in the final level.
Vacant teaching posts and untrained teachers both affect the quality of education provided to Pakistan's youth. In 2005/06, basic education had a vacancy rate of 6.5%, though the higher secondary level had the largest vacancy rate, with over 9% of the teaching positions remaining unfilled. Most teachers in the public school system had received professional training: (only 5%were untrained). However, by comparison, over half of the teachers in private schools had received no professional training.
Analysis of the NEC shows that many schools are in need of better facilities to improve the teaching environment. For example, 9% of primary schools do not have a blackboard, 24% do not have textbooks available for the children and 46% do not have desks for the students. Private primary schools are better equipped with desks and blackboards, but almost one-quarter of primary schools in both the public and private sectors do not have any textbooks. Only 36% of the public primary schools in the country have electricity, though the picture improves further up the educational ladder, with most middle elementary, secondary and higher secondary schools having access to electricity.
Page 8

Introduction
This paper was commissioned by UNESCO Pakistan. It describes Pakistan's education system through a series of highlights drawn mainly from published data released by the Academy of Education Planning and Management. The data used were taken primarily from the National Education Census (NEC) conducted in 2005/06, and the National Education Management Information System (NEMIS), 2005/06. The NEC was the first such survey conducted in the history of Pakistan and it provides a comprehensive view of the education system covering all educational institutions. Where possible, data were included from the 2007 publication Pakistan Education
2Statistics 2005-2006, to ensure that this paper reflects the latest available statistical information. The data are used to calculate internationally recognized education indicators and to draw comparisonswith selected other countries, to help benchmark the system's characteristics. The present paper makes extensive use of charts to communicate information on the particular facet of education under review.
The paper is divided into five chapters that concentrate on the basic education levels. Chapter 1 examines at the capacity of, and participation in, the education system. Data are reviewed by level (stage) of education and by province. Chapter 2 looks at school administration - the degree to which the system depends on public and private institutions; and determines locationally where (urban, rural) and at what levels of education private schools predominate. Chapter 3 assesses the system'sprogress towards achieving gender parity. Chapter 4 reviews NEC data on teaching posts and teacher training, because the need to fill vacant teaching positions and to provide training for untrained teachers will directly affect future education budgets. Chapter 5 looks at school facilities, including teaching materials, furniture and utilities, drawing selectively from some of the large amount of data on school facilities provided in the NEC.
The paper examines education indicators from selected other countries from adjacent countries (Iran, India), and from the South Asian region (Sri Lanka, Indonesia, Philippines, Vietnam). A random selection (based on data availability) of comparator countries (Nigeria, Egypt) has also been used. To enable the reader to determine their appropriateness for comparison with Pakistan, the Gross National Income (GNI) per Capita (GNI converted to $US using the World Bank atlas method divided by mid-year population estimates) and the population are provided for the selected countries in the Table 1.
Page 9
2 AEPAM/NEMIS Statistics Study No. 215

Throughout this paper, education data are identified by the end of the school year under review. For example, data labeled as 2006 refer to the school year 2005-2006 (or 2006 if the school year in some countries is the same as a calendar year). The analysis concentrates on education at the pre-primary through higher secondary levels at the expense of post-secondary levels. These levels of education as a group are referred to as “basic education” in the paper, although use of the term often does not include pre-primary schooling. The emphasis on these levels was necessitated by limitations of time and data availability, and in no way reflects the lack of importance of postsecondary levels of education.
The two main data classifications used in the present paper are: (i) urban and rural; and (ii) publicand private. These classifications are based on publications of the Academy of Education Planningand Management, Washington DC.
Appendix 1 reviews a list of international education indicators, identifies those that cannot be calculated from the published data and displays those that could be calculated or found from other sources. The UNESCO Institute for Statistics was the main source of data and indicators used here from countries other than Pakistan. Appendix 2 contains the references used, which mainly consist of publications based on the Pakistan NEC.
Page 10
CountryGNI per Capita(current $ US)
Population(millions)
Pakistan
India
Iran
Egypt
Sri Lanka
Indonesia
Vietnam
Nigeria
South Asia
Low IncomeCountries
770
820
3000
1350
1300
1420
690
640
766
650
159
1110
69
75
20
223
84
145
1493
2403
Table 1: 2006 GNI & Population of Countries Selected for Comparison with Pakistan's Education System
Source: World BankHttp://web.worldbank.org/WBSITE/EXTERNAL/DATASTATISTICS

1. Capacity & Participation Issues in Pakistan's Education System
Assuming that the enrolment at each level (stage) of education in Pakistan represents the capacity of the system to accommodate students, this means that almost half (49.3%) of the capacity of the entire education system is devoted to primary education.
NEC/NEMIS data show that Pakistan's education system focuses strongly on primary education. Despite this concentration, however, there are still many children between 5 to 9 years of age that are not attending school and it would appear that the primary system needs to expand if universal primary enrolment is to be achieved. Other countries reviewed have significantly larger proportions of children of primary age in their primary education programmes. At the same time, the system's ability to accommodate students who wish to continue their education beyond the primary level is relatively low, which has both economic and social implications for Pakistan's future. Balancing growth at the primary level with growth at the higher levels of education should be a priority.
In 2005/06, Pakistan's education system accommodated over 36 million students. Of these, 95% (34 million) were studying at basic education levels, pre-primary through higher secondary.
Page 11
3 Higher Secondary includes Intermediate Colleges; Non-formal Basic Education and Deeni Madaris. Enrolment has been added and distributed by level according to enrolment in public and private schools.
Table 2: Percentage of Students by Level of Education, 2006
Source: 3“Pakistan Education Statistics, 2005-06” AEPAM/NEMIS Statistics Study No. 215, Ministry of Education, Table 0.1
1,765,828Postsecondary 4.9
34,331,609Sub-total Basic Education 95.1
Preprimary
Primary
Middle Elementary
Secondary/Trade Voc.
Higher Secondary
Students
7,547,470
17,806,488
5,566,186
2,508,644
902,821
%
20.9
49.3
15.4
6.9
2.5
36,097,437Total 100.0

Information on the flow of students from grade to grade and from one level of education to the next (transition rate) is required to accurately reflect the relationship between each of the levels of education. In the absence of these measures, the average number of student places for each grade was used a measure of the capacity of the education system at each level. As primary education has a current capacity of just over 17.8 million students, it can accommodate an average of 3.6 million for each grade/year (17.8 million student places divided by the 5 grades of primary school) under existing conditions (number of teachers, current class sizes, school facilities, etc.). Of course, enrolment is not always divided in this way, as the lower grades may have more students and the higher, less students. However, it does indicate the overall capacity to accommodate primary students. By comparison, pre-primary education can accommodate an average of over 3.8 million, middle elementary 1.9 million, secondary 1.3 million and higher secondary 451,000 students.
Source: 5“Pakistan Education Statistics, 2005-06” AEPAM/NEMIS Statistics Study No. 215, Ministry of Education, Table 0.1 .
Middle Elementary 5,566,186 3 1,855,395
Secondary/Trade Voc. 2,508,644 2 1,254,322
Primary 17,806,488 5 3,561,298
Higher Secondary 902,821 2 451,410
Preprimary 7,547,470 2 3,773,735
Students GradesAverage Student Places per Grade
Table 3: Average Student Places per Grade, 2006
Page 12
4 & 5 Higher Secondary includes Intermediate Colleges; non-formal Basic Education and Deeni Madaris enrollment has been added and distributed by level according to enrolment in public and private schools.
Chart 1. Percentage of Students by Level of Education*, Pakistan, 2006
Source: 4“Pakistan Education Statistics, 2005-06” AEPAM/NEMIS Statistics Study No. 215, Ministry of Education, Table 0.1 .
20.9
49.3
15.4
6.9
2.54.9
Preprimary
Primary
Middle Elementary
Secondary
Higher Secondary
Postsecondary

The number of places for students in primary level education is slightly lower than the average places in pre-primary. It would appear likely that there will be sufficient primary places to accommodate students entering from pre-primary programmes. However, if there are also large numbers of children wishing to enter primary grade 1 who have not been in a pre-primary programme, there will be a shortage of primary places. An even larger disparity occurs at the higher levels of education: for example, the number of middle
Similarly, it is possible to compare average student places at the upper secondary level with those at the lower secondary level. Comparison shows that the average number of upper secondary places is very low (28%) compared to lower secondary. As a result, a smaller percentage of students in Pakistan than in other countries are able to continue their education at the upper secondary level: see Chart 4.
elementary places will only support about half of the average number of those in primary schools. Similarly, secondary places are only available for 65% of middle elementary students and higher secondary places for 40% of secondary students: see Chart 2.
Other countries provide greater opportunities for students to proceed beyond primary level education. Using the ISCED classification of levels, it is possible to compare the percentage of lower secondary student places (middle elementary and secondary for Pakistan) to primary student places per grade. In fact, both Sri Lanka and Iran provide as many student places per grade at the lower secondary level as they do at the primary level. Pakistan's percentage is much lower (46%) than all of the selected comparator countries: see Chart 3.
Page 13
Chart 2. Average Student Places per Grade by Level of Education, Pakistan , 2006
3.8
3.6
1.9
1.3
0.5
0.0
0.5
1.0
1.5
2.0
2.5
3.0
3.5
4.0
Preprimary Primary Middle Elementary Secondary/Trade
Voc.
Higher Secondary
Mil
lio
ns

In preparing future budgets, the education system will have to weigh up the need for meeting the EFA goal of universal primary education against the need for increasing the number of placesavailable for students to further their education beyond the primary level. With limited resources available, a balance between improving both may be more productive than solely concentrating on primary education.
Page 14
6 Pakistan data for 2006. Secondary includes middle elementary and secondary for Pakistan.
Chart 3. Average Secondary Student Places per Grade as a Percentage of Average Primary Student Places per Grade, Selected Countries, 2005
6Source: UNESCO Institute for Statistics, 2005 www.uis.unesco.org Data Centre .
46
6166
75
100 102
0
20
40
60
80
100
120
Pakistan India Indonesia Philippines Iran Sri Lanka
Pe
rce
nta
ge

The question arises of how close is Pakistan to achieving universal primary education?
The Net Enrolment Ratio (NER) provides the answer. The NER is a ratio of the number of students at a level of education who are of the official age for that level to the comparably aged population. A value of 100% means that universal primary education has been achieved. Pakistan's NER at the primary level is 62%. In other words, 62% of children five to nine years of age were attending primary education in 2005/06.
The NER for primary education ranged from almost 80% in the Islamabad Capital Territory (ICT) to under 50% in Balochistan. An NER was not available for Azad Jammu and Kashmir (AJK) or for Federally Administered Northern Areas (FANA). 35% of children 10 to 12 years of age were studying at the middle elementary level of education; 23% of children 13 and 14 were studying at the secondary level; and fewer than 10% of teenagers 15 and 16 years of age were studying at the higher secondary level, as shown in Chart 5.
Page 15
7 Pakistan data for 2006. Secondary includes middle elementary and secondary for Pakistan.
Chart 4. Average Upper Secondary Student Places per Grade as a Percentage of Average Lower Secondary Student Places per Grade, Selected Countries, 2005
7Source: UNESCO Institute for Statistics, 2005 www.uis.unesco.org Data Centre .
28
55
66
77
86
94
0
10
20
30
40
50
60
70
80
90
100
Pakistan India Indonesia Sri Lanka Philippines Iran
Pe
rce
nta
ge

By comparison, primary NERs for selected other countries show that significantly larger proportions of children of primary age are in primary level education, than in Pakistan, as shown in Chart 6.
Page 16
Chart 5. Net Enrolment Rates* by Level of Education and Province, 2006
Source: AEPAM, Shami, Butt, Mushtaq, EFA Indicators Draft (NEC 2005-06) p. 2.
0
10
20
30
40
50
60
70
80
90
Province
NE
R
35
23
9
62
38
24
9
62
29
23
11
62
68
41
25
8
44
17
11
5
79 80
76
53
49
19
9
3
NWFP Balochistan ICT FATASindhPunjabPakistan
Primary
Middle
Secondary
Higher

The Gross Enrolment Ratio (GER) is another measure of participation in education. It measures the percentage of students regardless of age that are studying at each level of education compared to the school-age population for that level. The GER for primary enrolment in Pakistan is almost 80% of the school age population (5-9 years of age). Comparable GERs for mid-elementary, secondary and higher secondary are 45, 30 and 12 respectively when enrolment is compared to the appropriate population. Gross enrolment rates are higher in urban centers than in rural areas: see Chart 7.
Page 17
8 The UNESCO estimate of Pakistan's primary NER for 2005 is slightly higher than the 62% for 2006 provided by the AEPAM.
Chart 6. Primary Net Enrolment Rates, Selected Countries,* 2005
8Source: UNESCO Institute for Statistics, 2005 www.uis.unesco.org Data Centre .
68 68
88 89
94 94 95 96 97
0
20
40
60
80
100
120
Pakistan Nigeria Vietnam India Egypt Philippines Iran Indonesia Sri Lanka
NE
R

In clarification, the GER is always larger than the NER, because it includes students at a given level of education who are either older or younger than the official age group for that level of education. Here, there is a difference of 17 percentage points in the two rates at the primary level, 10 percentage points at the middle elementary and secondary levels and 2 percentage points at the higher secondary level. It is likely that most students are over age at the primary level, given the number of repeaters in primary grades and the possibility that some children begin their primary education when they are over 5 years of age. Numerically, this means that over 2.5 million students in primary school are over 9 years of age in Pakistan: see Chart 8.
If it were possible to lower the number of repeaters in primary grades and ensure that children begin their primary education at age 5, a significant number of places would become available for more children to attend primary school. This would help Pakistan move closer towards the goal of universal primary education.
Page 18
Chart 7. Gross Enrolment Ratios by Level of Education and Province, 2006
Source: AEPAM, Shami, Butt, Mushtaq, EFA Indicators Draft (NEC 2005-06), p. 2
79 80 79
87
56
36
4548
37
53
2224
30 31 2933
14 1212 1214
106 4
102 10297
68
0
20
40
60
80
100
120
Pakistan Punjab Sindh NWFP Balochistan FATA ICT
Province
GE
R
Primary
Mid-elem.
Secondary
Higher-Sec

Page 19
Chart 8. Gross and Net Enrolment Rates by Level of Education, Pakistan, 2006
Source: AEPAM, Shami, Butt, Mushtaq, EFA Indicators Draft (NEC 2005-06), p.2
79
62
45
35
30
20
1210
0
10
20
30
40
50
60
70
80
90
Primary Mid-elementary Secondary Higher secondary
GER
NER
Pe
rce
nta
ge

2. School Administration
The degree to which education systems rely on private education institutions (i.e., those controlled and managed by non-governmental organizations, such as a religious body, trade union or businessenterprise) varies considerably from country to country. This ranges from systems where all education institutions are public (institutions controlled and managed by a public education authority or a government agency), to others where a combination of public and private institutions share the responsibility of teaching children. Where private providers play an important role in the education system, they may or may not receive public funding; and they may or may not be required to meet certain standards such as the provision of a set curriculum or the professional and academic training requirements for their teaching staff. Pakistan is an example of a country that has both public and private sector educational institutions, which has a larger proportion of its youth attending private institutions than in many other countries. As a result, it is important for Pakistan to obtain comprehensive data from both of these types of schools on a regular basis, to ensure that policy development is based on knowledge of the entire education system - not just for the publicsector alone.
Private education institutions enroll 31% of students who are studying in basic education (pre-primary through higher secondary). In urban centers, private schools account for more students(51%) than the public sector (49%). However, the situation is reversed in rural areas, where over 80% of students are attending public schools, as illustrated in Chart 9.
Page 20
Chart 9. Percentage of Students in Basic Education by School Administration and Location, 2006
Source: “Pakistan Education Statistics, 2005-06” AEPAM/NEMIS Statistics Study No. 215, Ministry of Education, Table 0.5 including
only preprimary, primary, middle, secondary, higher secondary and intermediate college enrolment.
81
19
4951
69
31
0
10
20
30
40
50
60
70
80
90
Public Private Public Private Public Private
Rural Urban Rural and Urban
Pe
rce
nta
ge

Providers of private education are more prominent at the pre-primary level, where 38% ofpreprimary students are enrolled. At the primary, middle elementary and secondary levels, almost one-third of all students attend private schools. However, the percentage of students at the higher secondary level studying in private schools is lower, at 18%, as seen in Chart 10.
Private schools are most prevalent in FANA, where 4 out of every 10 basic education students attend private schools (41%). FATA and Balochistan are at the other extreme, where over 80% of basic education is provided by the public sector, and where private education accounts for less than 20%of total provision.
Page 21
Chart 10. Percentage of Students in Basic Education by School Administration and Level of Education, 2006
Source: “Pakistan Education Statistics, 2005-06” AEPAM/NEMIS Statistics Study No. 215, Ministry of Education, Table 0.5 including
only preprimary, primary, middle, secondary, higher secondary and intermediate college enrolment.
62
38
70
30
69
31
70
30
82
18
0
10
20
30
40
50
60
70
80
90
Public Private Public Private Public Private Public Private Public Private
Preprimary Primary Middle Elementary Secondary Higher Secondary
Pe
rce
nta
ge

In comparison with other countries, private basic education in Pakistan enrolls more students than in most other countries. In fact, only 10 countries with relatively large populations in the world have a higher percentage of students in private primary education, led by The Netherlands (69%) and Lebanon (66%). Using the same countries as selected in Section 1, Chart 6, (where data were available) all show a lower percentage of students in private schools than in Pakistan: see Chart 12.
Page 22
Source: “Pakistan Education Statistics, 2005-06” AEPAM/NEMIS Statistics Study No. 215, Ministry of Education, Table 0.8, 0.11,
0.14 including only preprimary, primary, middle, secondary, higher secondary and intermediate college enrolment.
Chart 11. Percentage of Students in Basic Education by School Administration and Province, 2006
6965
69
76
84
65
59
86
70
3135
31
24
16
35
41
14
30
0
10
20
30
40
50
60
70
80
90
100
Pkaist
na
Punjab
Sindh
NW
FP
Baloc
ihtsan
AJK
FANA
FATA ICT
Public
Private
Pe
rce
nta
ge

Page 23
Chart 12. Percentage of Primary Students in Private Education, Selected Countries, 2005
9Source: UNESCO Institute for Statistics, 2005 www.uis.unesco.org Data Centre
30
17 17
87
5
2
0
5
10
15
20
25
30
35
Pakistan India Indonesia Philippines Egypt Iran Sri Lanka
Pe
rce
nta
ge
9 Data for India and Sri Lanka is from 2003; data for Pakistan is from 2006.

3. Girls Education
almost equal to the number of boys, indicating that Pakistan shows a disparity in favour of girls at this level of education. This implies that many more boys than girls discontinued their education after secondary school with the result that their numbers matched those of the girls in the final level.
The participation of female children in basic education has historically lagged behind that of their male counterparts in many countries. In the absence of data that could be used to calculate net enrolment rates by gender (enrolment by age and population by age), a measure that helps determine the extent of gender disparity is the Gender Parity Index (GPI). The GPI is defined as the ratio of females to males. A GPI of 1 generally indicates parity between the sexes. However, as Pakistan's school age population has a larger number of boys than girls, a GPI of approximately .95 would indicate that the percentage of girls and boys in school would be the same. A GPI of between 0 and 1 (in Pakistan between 0 and .95) means a disparity in favour of boys while a GPI greater than 1 (greater than .95) indicates a disparity in favour of girls.
In Pakistan, there were 14 million girls studying in basic education in 2006, compared to 18.3 million boys. In other words, there were over 4 million more boys than girls, resulting in a GPI of 0.76: see Chart 13, below. The disparity in favour of boys was prevalent at all levels of basic education, with the exception of the higher secondary level where the number of girls was
Page 24
Chart 13. Gender Parity Index for Basic Education Students by Level of Education, Pakistan, 2006
Source: “Pakistan Education Statistics, 2005-06” AEPAM/NEMIS Statistics Study No. 215, Ministry of Education, Table 0.1 including
only preprimary, primary, middle, secondary, higher secondary and intermediate college enrolment.
0.810.76
0.70 0.70
1.00
0.76
0.00
0.20
0.40
0.60
0.80
1.00
1.20
Preprimary Primary Middle Secondary Higher Sec. Total
Ge
nd
er
Pa
rity
Ind
ex

Without exception, the participation of girls was higher in urban centres than in rural areas,although their numbers still did not match those of boys in pre-primary, primary, middle elementary and secondary schools. However, at the higher secondary level in urban centres, girls outnumbered boys, resulting in a GPI of 1.13. The GPI in rural areas is considerably lower at all levels and at the secondary level it is less than 0.5. In other words, there were over twice as many boys as girls in these schools, as shown in Chart 14.
The GPI for primary education indicates that urban centres in the Punjab have a small disparity in favour of girls: see Chart 15. The ICT and AJK have small disparities in favour of boys both in urban and rural areas as does Sindh and FANA in their urban centres. The GPI in the rural areas of FATA show that less than half of the enrolment in primary education is female.
Page 25
Source: “Pakistan Education Statistics, 2005-06” AEPAM/NEMIS Statistics Study No. 215, Ministry of Education, Table 0.5 including only preprimary, primary, middle, secondary, higher secondary and intermediate college enrolment.
Chart 14. Gender Parity Index by Level of Education and Location, 2006
0.92
0.68
0.90
0.76
0.91
0.70
0.89
0.56
0.93
0.46
1.16
0.68
0.20
0.40
0.60
0.80
1.00
1.20
1.40
Ge
nd
er
Pa
rity
Ind
ex
0.00
Urban Rural Urban Rural Urban Rural Urban Rural Urban Rural Urban Rural
Total Preprimary Primary Middle
elementary
Secondary Higher
secondary

Page 26
The participation of females in primary education compared to males is lower in Pakistan than in other selected countries. Most countries have GPIs around 0.9 - still a disparity in favour of boys - butto a lesser degree than in Pakistan. Iran, for example, has a disparity in favour of females with a GPI of 1.15: see Chart 16.
Chart 15. Gender Parity Index for Primary Education by Province, 2006
“Pakistan Education Statistics, 2005-06” AEPAM/NEMIS Statistics Study No. 215, Ministry of Education, Tables 0.8, 0.11, 0.14.Source:
0.91
0.70
0.99
0.81
0.88
0.54
0.66
0.590.61
0.64
0.920.91
0.39
0.910.93
0.00
0.20
0.40
0.60
0.80
1.00
1.20
kistan
Pa Pun
jab
Sindh
NW
FP
c
Balo
histan
AJK
0.93
0.82
FANA
FTAA
ICT
Ge
nd
er
Pa
rity
Ind
ex
Urban
Rural

Page 27
Chart 16. Gender Parity Index for Primary Education, Selected Countries, 2005
Source: 10UNESCO Institute for Statistics, 2005 www.uis.unesco.org Data Centre for all countries except Pakistan .
0.760.81
0.88 0.89 0.89 0.90.94 0.96
1.15
0
0.2
0.4
0.6
0.8
1
1.2
1.4
Pak
ista
n
Niger
ia
Egpty
Sri
anL
kaIn
dia
Vietn
am
Idnon
esia
Phili
ppiens
Iran
GP
I
10 Data for Sri Lanka are 2003. Source for Pakistan: “Pakistan Education Statistics, 2005-06” AEPAM/NEMIS Statistics Study No. 215, Ministry of Education, Table 0.1.
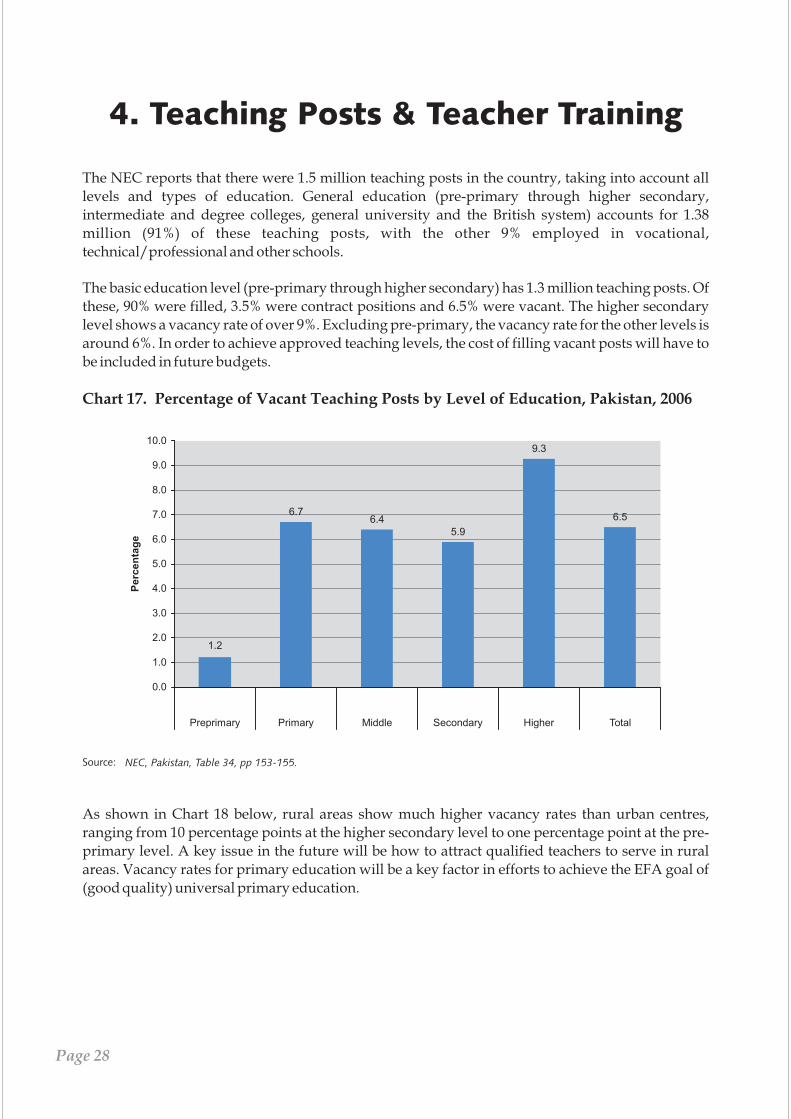
4. Teaching Posts & Teacher Training
The basic education level (pre-primary through higher secondary) has 1.3 million teaching posts. Of these, 90% were filled, 3.5% were contract positions and 6.5% were vacant. The higher secondary level shows a vacancy rate of over 9%. Excluding pre-primary, the vacancy rate for the other levels is around 6%. In order to achieve approved teaching levels, the cost of filling vacant posts will have to be included in future budgets.
As shown in Chart 18 below, rural areas show much higher vacancy rates than urban centres, ranging from 10 percentage points at the higher secondary level to one percentage point at the pre-primary level. A key issue in the future will be how to attract qualified teachers to serve in rural areas. Vacancy rates for primary education will be a key factor in efforts to achieve the EFA goal of (good quality) universal primary education.
The NEC reports that there were 1.5 million teaching posts in the country, taking into account all levels and types of education. General education (pre-primary through higher secondary, intermediate and degree colleges, general university and the British system) accounts for 1.38 million (91%) of these teaching posts, with the other 9% employed in vocational, technical/professional and other schools.
Page 28
NEC, Pakistan, Table 34, pp 153-155.Source:
Chart 17. Percentage of Vacant Teaching Posts by Level of Education, Pakistan, 2006
1.2
6.76.4
5.9
9.3
6.5
0.0
1.0
2.0
3.0
4.0
5.0
6.0
7.0
8.0
9.0
10.0
Preprimary Primary Middle Secondary Higher Total
Pe
rce
nta
ge

Vacancy rates in the Punjab are higher than in other provinces, at all levels of education except primary, where Sindh and ICT have relatively more vacancies. The vacancy rate for higher secondary teaching posts in the Punjab is 13%. Over 8% of primary teaching positions in Sindh and ICT are vacant. However, FATA, FANA and AJK all report lower vacancy rates.
Page 29
NEC, Pakistan, Table 34, pp.153-155Source:
Chart 18. Percentage of Vacant Teaching Posts by Level of Education and Location, Pakistan, 2006
2.0
0.9
7.9
3.5
9.5
1.9
9.8
3.1
15.6
5.5
9.1
3.1
0.0
2.0
4.0
6.0
8.0
10.0
12.0
14.0
16.0
18.0
Rural Urban Rural Urban Rural Urban Rural Urban Rural Urban Rural Urban
Preprimary Primary Middle Secondary Higher Basic Education
Pe
rce
nta
ge
Chart 19. Percentage of Vacant Teaching Posts by Level of Education and Province, 2006
NEC, Pakistan and Provinces, Table 34.Source:
0.0
2.0
4.0
6.0
8.0
10.0
12.0
14.0
Pakista
n
Punjab
id
Sn
h
NW
FP
Balo
hcista
nIC
T
FATA
FANA
AJK
Primary
Middle
Secondary
Higher
Pe
rce
nta
ge

Another factor that affects the quality of education provided is the training level of the teaching force. The NEC data presented in Chart 20 below indicate that a significant number of teachers in the private sector (over 50%) lack a professional qualification and as a result are classified as untrained. By comparison, most teachers in the public sector did have a professional qualification, with only5% reporting no training. Data were not available by level of education, but it is expected that most of the untrained teachers were teaching at the lower levels of education.
Page 30
Chart 20. Percentage of Untrained Teachers by School Administration and Location, Pakistan, 2006
NEC, Pakistan, Table 34, pp 153-155Source:
4
75
51 51 51
17
35
25
0
10
20
30
40
50
60
Rural Total Rural Total Rural Urban TotalUrban
Public
Urban
Private Public and Private
Pe
rce
nta
ge

5. School Facilities
Many schools are in need of better facilities to improve the teaching environment. For instance, 9% of primary schools do not have a blackboard, 24% do not have textbooks available for pupils, and 46% do not have desks for their students. Private primary schools are better equipped with desks and blackboards, but overall, almost a quarter of primary schools in both the public and private sector do not have any textbooks.
Primary schools in urban centers are better equipped with blackboards and desks but 33% of the urban schools do not have textbooks compared to 23% of rural schools: see Chart 22. Furthermore, half of all rural schools lack desks for their students.
The NEC collected a large amount of data on school facilities including teaching materials, classroom furniture and utilities. These are reviewed selectively in the following section. Specifically, some data (on textbooks for example) are more important educationally than others.
Page 31
11 It should be noted that the number of schools reporting that they do not have desks for students does not include those who reported that the desks for students were inadequate. Therefore the percentage needing such equipment is even higher than reported in this section.
Source: 11NEC, Pakistan, Tables 40, 41, 42, pp 171-200
Chart 21. Percentage of Primary Schools Without Selected Facilities by School Administration and Location, Pakistan, 2006
10
56
2
9
23
36
23
29
24
51
32
36
18
46
0
10
20
30
40
50
60
Rural Urban Rural Urban
Public Public Private Private Total
Pe
rce
nta
ge
Black/white Board
Text Books
Desks

Almost all private schools have electricity in their schools, with the exception of middle elementaryschools where only 79% have electricity. By comparison, the public sector, especially at the lower levels of educational provision, have fewer schools equipped with electricity. For example, only 36% of public primary schools have access to electricity.
Page 32
12 It should be noted that the number of schools reporting that they do not have desks for students does not include those who reported that the desks for students were inadequate. Therefore the percentage needing such equipment is even higher than reported in this section.
Chart 22. Percentage of Primary Schools Without Selected Facilities by Location, Pakistan, 2006
12NEC, Pakistan, Tables 40, 41, 42, pp 171-200Source:
10
23
50
3
33
26
9
24
46
0
10
20
30
40
50
60
Rural Urban
Pe
rce
nta
ge
Black/white Board
Text Books
Desks

Although the percentage of public schools with electricity is low, the percentage of students who attend such schools is considerably higher. For example, 36% of public primary schools have electricity, but over half (60%) of primary students attend such schools. Data indicate that schools with larger enrolments are more likely to have access to electricity provision.
Page 33
Chart 23. Percentage of Schools with Electricity by Level of Education and School Administration, Pakistan, 2006
Source: NEC, Pakistan, Tables 40, pp 171-179
48
98
36
8279
98
90
9995
99
0
20
40
60
80
100
120
Public Private Public Private Public Private Public Private Public Private
Preprimary Primary Middle elementary Secondary Higher secondary
Pe
rce
nta
ge
Source: NEC, Pakistan, Tables 40, pages 171-179; AEPAM, Shami, Butt, Mushtaq, EFA Indicators Draft (NEC 2005-06), pp 25-27.
Chart 24. Percentage of Public Students and Schools with Electricity by Level of Education, Pakistan, 2006
5448
60
36
91
79
9690
9995
0
20
40
60
80
100
120
En
rolm
en
t
Sch
oo
ls
En
rolm
en
t
Sch
oo
ls
En
rolm
en
t
Sch
oo
ls
En
rolm
en
t
Sch
oo
ls
En
rolm
en
t
Sch
oo
ls
Preprimary Primary Middle Secondary Higher
Pe
rce
nta
ge

MDG & EFA Indicators
1. Gross Enrolment Ratio in Early Childhood Care and Development
Using NEC data, the GER in Early Childhood Care and Development is 89.3%. This is based on an estimated enrolment of 6.9 million and a population aged 3 and 4 of 7.8 million. The EFA Indicators Draft (NEC 2005-06) publication, Goal 1's Table 1, p. 1, shows a GER of 97% based on an enrolment of 7.4 million and a population of 7.6 million. It is not clear where the enrolment figure of 7.4 million came from, as the NEC had a count of 6.6 million: (see NEC Table 18, page 109). The number 6.9 million as used in this paper is slightly higher, because of the addition of some undistributed enrolment: (see Table 2, p.12).
2. Percentage of New Entrants to Primary Grade 1 Having Attended Some Form ofOrganized Early Childhood Development Programme
Presented below is a brief reference to each indicator listed in the Terms of Reference for this report. Where possible, the indicator has been reproduced using the relevant reference data.
The NEC did not ask schools for this information so it was impossible to calculate a percentage based on NEC data. The EFA Indicators Draft (NEC 2005-06) publication reports that 56% of new entrantsto primary Grade 1 had attended some form of organized ECCE programme but it is not evident where such information was obtained. If the GER for ECCE of either 89% or 97% (see first indicator)
Page 34
Appendix 1
Chart 25. Gross Enrolment Ratios in Early Childhood Care and Development, Selected Countries, 2005
Source: UNESCO Institute for Statistics, 2005 www.uis.unesco.org Data Centre.
(1)Author's calculation
(2) AEPAM, Shami, Butt, Mushtaq, “EFA Indicators “EFA Indicators Draft NEC 2005-06,” Goal 1, Table 1, p1
15 16
34
46
60
89
97
0
20
40
60
80
100
120
Niger
ia
Egypt
Indo
nesia
Pihlip
pine
s
India
Iran
Vietn
am
Pak
ista
n(1)
Pkaista
n(2)
GE
R
4411 4411

are correct, then one would assume that a higher percentage of new entrants would have experienced an early childhood development programme.
Data on the population 5 years of age - (the official primary entrance age) - is required in order to calculate the apparent intake rate, but this was not available for Pakistan. Calculation of the intake rate also requires data on the number of new entrants to Grade 1. However, it was possible to calculate this number by subtracting the number of repeaters in Grade 1 from the total Grade 1 enrolment.
The EFA Indicators Draft (NEC 2004-05) publication, Goal 2, Table 1, calculates a gross intake rate to primary level, using the population aged 5 to 9 (all of primary). This is quite different from the internationally proposed indicator and therefore an international cross-comparison is not possible.
3. Apparent (Gross) Intake Rate: New Entrants in Primary Grade 1 as a percentage of Population of Official Entry Age
Using the population aged 5 to 9 noted above and in the absence of any other information on the population, this paper estimated the population 5 years of age by dividing the population aged 5 to 9 by 5. By taking this population estimate (4 million), Grade 1 enrolment of 4.35 million (NEC Pakistan publication, p.109), and subtracting 3.5% repeaters (NEC Highlight Table 19, p.33), there are 4.2 million new entrants. These numbers give a gross intake rate of 105%. It is assumed that this very high percentage occurs because many new entrants are over-age (or under-age). The same phenomenon occurs in many other countries.
Page 35
105
88
102
116121 123
135 136
0
20
40
60
80
100
120
140
160
Pakistan(1) Vietnam Egypt Nigeria Indonesia Iran Philippines India
Gro
ss
Inta
ke
Rate
Chart 26. Apparent Gross Intake Rate to Grade 1, Primary, Selected Countries, 2005
Source: UNESCO Institute for Statistics, 2005 www.uis.unesco.org Data Centre. (1) Author's calculation

4. Net Intake Rate to Primary: New Entrants to Primary Grade 1 of the Official Primary School Entrance Age as a percentage of Corresponding Population
5. Gross Enrolment Ratio
6. Net Enrolment Ratio
7. Public Current Expenditure on Primary Education (a) as % of GNP; (b) per Pupil as % of GNP per capita*
9. Percentage of Primary School Teachers Having Required Academic Qualifications*
10. Percentage of Primary School Teachers Certified to Teach According to National Standards*
11. Pupil Teacher Ratio*
12. Repetition Rates by Grade
13. Survival Rate to Grade 5 (percentage of a pupil cohort reaching grade 5)
It was not possible to calculate this indicator, as it requires both the number of new entrants to Grade 1 who are 5 years of age and the population of children 5 years of age. Neither was available. It may be possible to estimate the population but certainly not the new entrants who are 5 years of age.
See Section 1, pages 18-20 of this report.
See Section 1, pages 16-20 of this report.
8. Public Expenditure on Primary Education as percentage of Total Public Education Expenditure*
To calculate a valid pupil/teacher ratio it is necessary to know the number of teachers teaching at each level of education. Teachers are only classified by school level and as some schools have students and teachers in more than one level, the requisite data are not available.
The repetition rates for Grades 1 through 5 are provided in NEC Highlights Table 19, p.33, as follows:
This indicator requires enrolment and number of repeaters by grade over time. This information was not available from the NEC.
Page 36
Data not available to calculate the indicator.
Table 4. Repetition Rates by Grade, Pakistan, 2006
Grades
Grade 1
Grade 2
Grade 3
Grade 4
Grade 5
Total
3.5%
2.8%
2.6%
3.1%
3.0%
Male
3.6%
3.0%
2.6%
3.1%
3.3%
Female
3.3%
2.6%
2.5%
3.1%
2.6%

14. Coefficient of Efficiency (ideal number of pupil years needed for a cohort to complete the primary cycle, expressed as percentage of the number of pupil years)
15. Percentage of Pupils Having Reached At Least Grade 4 Primary Schooling Who Master a Set of Nationally-Defined Basic Learning Competencies
16-18. Literacy Rate of 15-24 year olds; Adult Literacy Rate (% of population aged 15+ which is literate); Literacy Gender Parity Index (ratio of female:male literacy rates)
Literacy is defined as the ability to read and write, with an understanding of a simple statement related to one's daily life. It involves a continuum of reading and writing skills and often includesbasic arithmetic skills (numeracy). The literacy rate is the number of literate persons in a given age group, expressed as a percentage of the total population in that age group: (see UNESCO Institute for Statistics website data centre, glossary of terms at www.uis.unesco.org.) For the purpose of monitoring progress towards the EFA and MDG global literacy goals, UNESCO produces adult literacy rates (population aged 15 years and over) and youth literacy rates (population aged 15 to 24 years). The literacy rates of Pakistan's youth are relatively low compared to other countries, with just over half (53%) of females aged 15 to 24 years being considered literate. In comparison, over three quarters (77%) of the boys in the same age group are literate; and some countries in the region have almost achieved a fully-literate youth population: see Chart 27.
This indicator requires a cohort analysis that was not available from the references provided to the author.
The data required for this indicator was not available.
Page 37
Source: UNESCO Institute for Statistics, 2005 www.uis.unesco.org Data Centre. The reference year for countries is not the same,
but all years are between 2002-2005.
Chart 27. Literacy Rates of Youth (aged 15 to 24 years) by Gender, Selected Countries*
53
77
99 9997
94
68
84
97 98
0
20
40
60
80
100
120
Pakistan Indonesia Philippines India Iran
96 95
Sri Lanka
Pe
rce
nta
ge
of
lite
rate
Female
Male

The percentage of literate adults (15 years of age and over) in Pakistan is also lower than that of other countries in the region, with only half of the country's adult population being considered literate. However, it is important to look at improved literacy rates for youth when compared to those of adults, as this will impact future adult literacy rates: see Chart 28 below. In Pakistan's case, the literacy rate for youth is 15 percentage points higher than for adults, which is an encouraging sign. It also represents the highest difference of the countries reviewed (although it is not possible for those closer to having fully-literate populations to obtain such marked increases).
The disparity in the literacy rates of adult males and females should also decrease in the future, as the number of literate female youth is increasing faster than the number of literate male youth. In other words, the literacy difference between females and males is less for youth than for adults. This is evident in the Gender Parity Index (GPI) of youth in Pakistan, which is currently 0.69, whereas the GPI for adults is 0.55. The GPI for youth in most countries is higher than for adults and in the Philippines and in Sri Lanka, there are more young girls than boys who are literate: see Chart 29.
Page 38
Chart 28. Literacy Rate of Adults (aged 15 and over) and Youth (aged 15 to 24 years), Selected Countries*
UNESCO Institute for Statistics, 2005 www.uis.unesco.org Data Centre. The reference years for countries are not the same
but all years are between 2002 and 2005.
Source:
50
65
90
99
9395
61
76
82
97
0
20
40
60
80
100
120
Pakistan Indonesia Philippines India Iran
91
96
Sri Lanka
Pe
rce
nta
ge
of
lite
rate
Adult
Youth

Page 39
UNESCO Institute for Statistics, 2005 www.uis.unesco.org Data Centre. The reference years for countries are not all the same
but all years quoted are between 2002 and 2005.
Source:
Chart 29. Gender Parity Index of Adult (aged 15 and over) and Youth (aged 15 to 24) Literacy Rates, Selected Countries
0.55
0.69
0.92
1.001.02 1.03
0.65
0.80
0.87
0.990.97
1.01
0.00
0.20
0.40
0.60
0.80
1.00
1.20
Pakistan Indonesia Philippines India Iran Sri Lanka
GP
I
Adult
Youth

References
1. Government of Pakistan, Ministry of Education, Academy of Education Planning and Management, Statistics Division, Federal Bureau of Statistics, “National Education Census 2005 Pakistan”
1.1 Ibid., “National Education Census 2005 Punjab”1.2 Ibid., “National Education Census 2005 Sindh”1.3 Ibid., “National Education Census 2005 NWFP”1.4 Ibid., “National Education Census 2005 Balochistan”1.5 Ibid., “National Education Census 2005 ICT”1.6 Ibid., “National Education Census 2005 FATA”1.7 Ibid., “National Education Census 2005 FANA”1.8 Ibid., “National Education Census 2005 AJK”1.9 Ibid., “National Education Census Highlights”1.10 Ibid., “National Education Census District Education Reports”1.11 Ibid., “National Education Census District Reports, Punjab”1.12 Ibid., “National Education Census District Reports, AJK”
2. Government of Pakistan, Ministry of Education, “Financing of Secondary, Higher Secondary and College Education”
3. Ministry of Education, Academy of Education Planning and Management, “Pakistan Education Statistics, 2004-2005”
3.1 Ibid., “Pakistan Education Statistics, 2005-2006” AEPAM/NEMIS Statistics Study No. 215
3.1 Ibid., “Pakistan Education Statistics”
4. Shami, Shah, Ahmad, “National Education Core Indicators,” Academy of Educational Planning and Management, Islamabad
5. Shami, Butt, Mushtaq, “EFA Indicators (NEC 2005-06) Draft,” Academy of EducationPlanning and Management
Appendix 2
Page 40

United NationsEducational, Scientific and
Cultural Organization
Email: [email protected]
Website: www.un.org.pk/unesco/


![Homepage [] · Homepage](https://static.fdocuments.us/doc/165x107/60621dae80c0393da026878f/homepage-homepage.jpg)