The Economics of Relational Contracts: Supporting Empirical Evidence Ricard Gil UC – Santa Cruz...
75
The Economics of Relational Contracts: Supporting Empirical Evidence Ricard Gil UC – Santa Cruz (visiting LSE Management) [email protected] European School of New Institutional Economics 2011
-
Upload
dina-henderson -
Category
Documents
-
view
213 -
download
0
Transcript of The Economics of Relational Contracts: Supporting Empirical Evidence Ricard Gil UC – Santa Cruz...
The Economics of Relational Contracts:Supporting Empirical Evidence
Ricard GilUC – Santa Cruz (visiting LSE Management)
European School of New Institutional Economics 2011

Outline
1. Introduction
2. Theoretical framework
1. Formal vs. informal contracts
2. Testable implications
3. Empirical challenges and evidence
1. When is a contract enforceable?
• When parties– Understand its terms– Can verify breach– Are able/willing to enforce
• Third party (law & courts) can verify and enforce contractual agreement
• May be costly to make a contract enforceable

Tradeoff b/w formal & informal contracts
• Formal contracts– Enforceable by institutional 3rd parties (courts,
arbitrators)• Strong anti-breach remedies• Costly to include ex-post adjustment • High costs of making contract enforceable
• Informal contracts– Enforceable by the parties and/or market
• Weaker anti-breach remedies• Less costly to include ex-post adjustment• Lower costs of making contract enforceable

2. An illustrative model
• P wants A to provide non-standard performance d– P=employer, A=employee, d=effort
• P has benefit πP(d) & outside option πP
• A has benefit πA(d) & outside option πA
• To make contract on d enforceable, P spends– f(d) if enforcer = court
– i(d) < f(d) if enforcer = P

2.1. Formal contract
• A feasible formal contract sets performance d & price p such that
– PCP: πP(d)-f(d)-p ≥ πP p ≤ πP(d)-f(d)-πP – PCA: πA(d)+p ≥ πA p ≥ πA-πA(d)
πA-πA(d) ≤ p ≤ πP(d)-f(d)-πP πP(d)+πA(d)-f(d) ≥ πP+πA
• The optimal contract dF maximizes the joint surplus πP(d)+πA(d)-f(d) s.t. πP(d)+πA(d)-f(d) ≥ πP+πA

2.2. Informal contract• A feasible informal contract sets performance d,
upfront payment w & bonus b such that– PCP: πP(d)-i(d)-w-b ≥ πP – PCA: πA(d)+w+b ≥ πA
– ICP: -b+(1/r)[πP(d)-i(d)-w-b] ≥ (1/r)πP
– ICA: πA(d)+b+(1/r)[πA(d)+w+b] ≥ πA(d*)+(1/r)πA
• Note: d* = argmax πA(d) = A’s opportunistic action
• Setting b & w so that ICA & PCA bind yields πP(d)+πA(d)-i(d) ≥ πP+πA+r[πA(d*)-πA(d)]
• The optimal contract dI maximizes πP(d)+πA(d)-i(d)
s.t. πP(d)+πA(d)-i(d) ≥ πP+πA+r[πA(d*)-πA(d)]

2.3. Formal & informal contracts may be friends
• Complements or substitutes?
• P & A will add to the informal contract “cheap” provisions that– Constrain A to provide standard performance d, or change A’s
payoff function, reducing her temptation to r[π(d**)-π(d)]– Create the quasi rent w+b when monetary payments are not
practical– These may be suboptimal in a purely formal contract
• Key understanding how the use of formal and/or informal contracting affects the value of fallback option

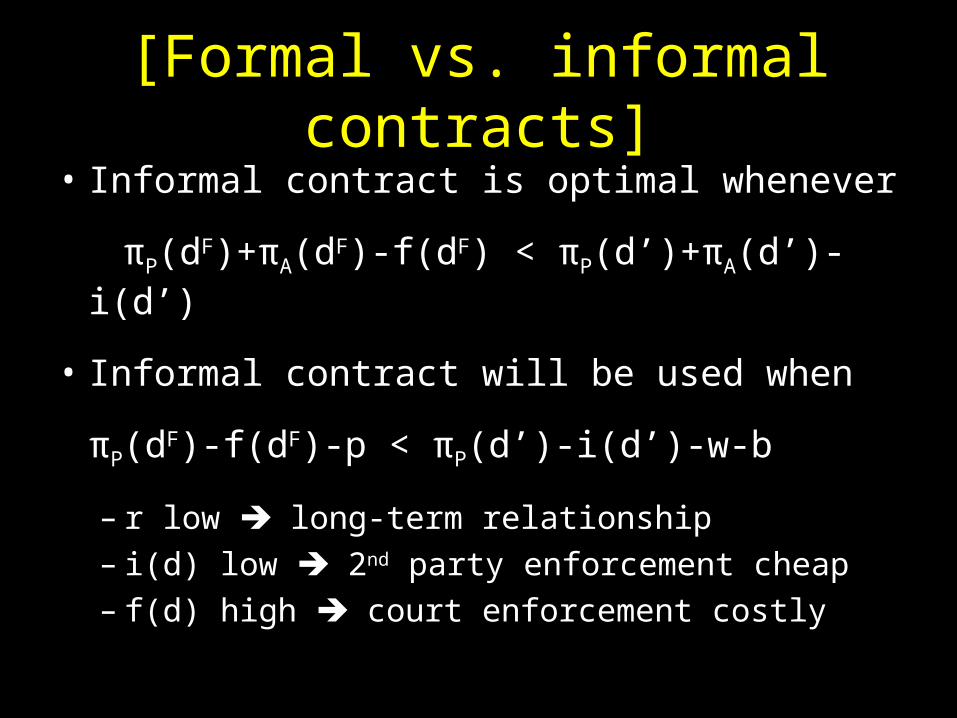
3. Formal vs. informal contracts
• Informal contract is optimal whenever
πP(dF)+πA(dF)-f(dF) < πP(d’)+πA(d’)-i(d’)
• Informal contract will be used when
πP(dF)-f(dF)-p < πP(d’)-i(d’)-w-b
– r low long-term relationship– i(d) low 2nd party enforcement cheap– f(d) high court enforcement costly

3.1. Informal contracts
•Self-enforcing contracts as long as
ICP: -b+(1/r)[πP(d)-i(d)-w-b] ≥ (1/r)πP
ICA: πA(d)+b+(1/r)[πA(d)+w+b] ≥ πA(d*)+(1/r)πA
•Empirical literature focuses on instances for which IC constraints may not bind

4. Methodological summary: How to assess informal contracts?
• Look for links b/w contract design, outcomes & long-term relationships– Variation in past and future interactions
• Look for relationships w/o a formal contract

4.1. Examples Through Evidence– Outsourcing:
• Corts & Singh JLEO ’04,
• Gil & Marion ’10 • Macchiavello & Morjaria ’11
– Social Networks:• Gil & Hartmann JLEO ’11
• Jackson & Schneider ’11
– Interplay of Formal & Informal Contracts • Gil ’11

Corts & Singh JLEO ’04
• Contracts b/w Oil & gas explorators and contracted drillers– Fixed price: strong incentives & strong holdup risks– Cost +: weak incentives & weak holdup risks
• Past interactions “cost +” contracts today• Effect greater for exploratory wells
– Note: in expl. wells costs predictable & effort important holdup (incentive) problems less (more) severe
• Interpretation– Informal contract on driller’s effort, not on fair bargaining– Cheap informal contracts (i ↓) or closer relationship (r ↓)
parties rely more on informal contract
[Formal vs. informal contracts]
• Informal contract is optimal whenever
πP(dF)+πA(dF)-f(dF) < πP(d’)+πA(d’)-i(d’)
• Informal contract will be used when
πP(dF)-f(dF)-p < πP(d’)-i(d’)-w-b
– r low long-term relationship– i(d) low 2nd party enforcement cheap– f(d) high court enforcement costly

The Role of Repeated Interactions, Self-Enforcing Agreements and Relational [Sub]Contracting:
Evidence from California Highway Procurement Auctions
Ricard Gil and Justin MarionUC - Santa Cruz
• How valuable are supplier relationships? Dependence on continuation value of relationship?
• Auctions for California Department of Transportation (Caltrans) highway construction projects– Universe of 5,120 contracts, May 1996 – December 2005– Winning and losing bids (26,125 total): 1,735 bidders and 2,900 subs
– All project characteristics and address of contractor and subcontractor– Follow prime contractor and subcontractor interactions over time
• Model: Unobservable quality, hold-up temptation– Relational contract lowers cost of employing a subcontractor
• Key contribution: estimate how these effects depend on continuation value of relationship

Measurement
• One way to measure relationship: use prior interactions between firms and suppliers (Corts and Singh, 2004)
• Continuation value? Past interactions may indicate future interactions
• Identification problems
– Prior relationships have value in relationship-specific productivity (Miller, 2008)
• Current cost correlated with measure of relational capital
– Suppose measure future supplier relationship
• Future interactions potentially depend on success of relationship
• Cannot separately identify continuation value from current costs
• Our measure of continuation value: Future Caltrans contracts in same geographic area
Arrival rate of projects exogenous to relationship-specific productivity

Institutional details
• Caltrans awards road construction and repair contracts through sealed-bid first-price auctions
• Potential bidders are notified through newsletter
• Bidders prequalified according to their characteristics and history
• Caltrans engineers provides a list of items required
• Each bid must include list of subcontractors– Each subcontractor included certified for her task– List if greater than $10K or (0.5% of total)– Constraints: Affirmative action, specialty items, caps
• Ex-post changes not unusual (Bajari, Houghton and Tadelis (2007)) due to unforeseen contingencies
• Project work flow important
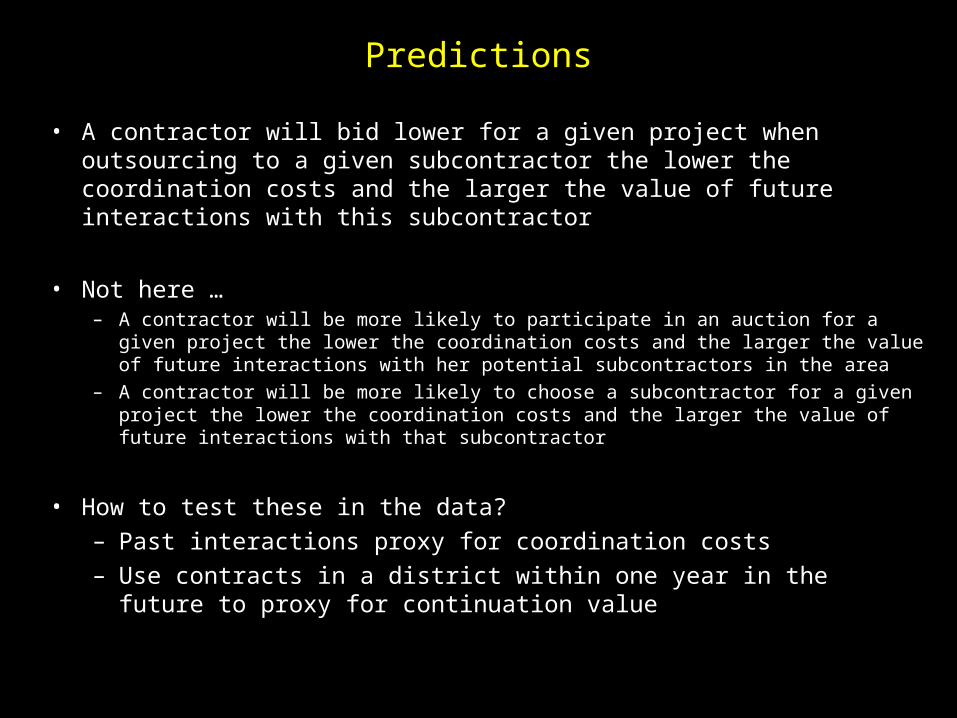
Predictions
• A contractor will bid lower for a given project when outsourcing to a given subcontractor the lower the coordination costs and the larger the value of future interactions with this subcontractor
• Not here …– A contractor will be more likely to participate in an auction for a given project the
lower the coordination costs and the larger the value of future interactions with her potential subcontractors in the area
– A contractor will be more likely to choose a subcontractor for a given project the lower the coordination costs and the larger the value of future interactions with that subcontractor
• How to test these in the data?– Past interactions proxy for coordination costs– Use contracts in a district within one year in the future to proxy for
continuation value

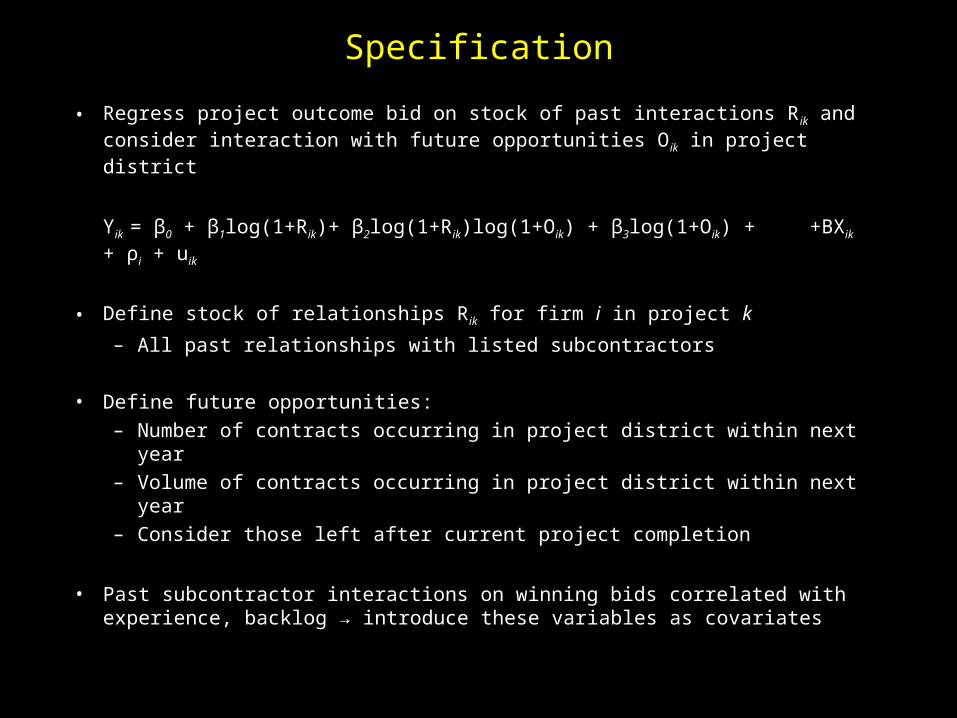
Specification
• Regress project outcome bid on stock of past interactions Rik and consider interaction with future opportunities Oik in project district
Yik = β0 + β1log(1+Rik)+ β2log(1+Rik)log(1+Oik) + β3log(1+Oik) + +BXik + ρi + uik
• Define stock of relationships Rik for firm i in project k
– All past relationships with listed subcontractors
• Define future opportunities:
– Number of contracts occurring in project district within next year
– Volume of contracts occurring in project district within next year
– Consider those left after current project completion
• Past subcontractor interactions on winning bids correlated with experience, backlog → introduce these variables as covariates

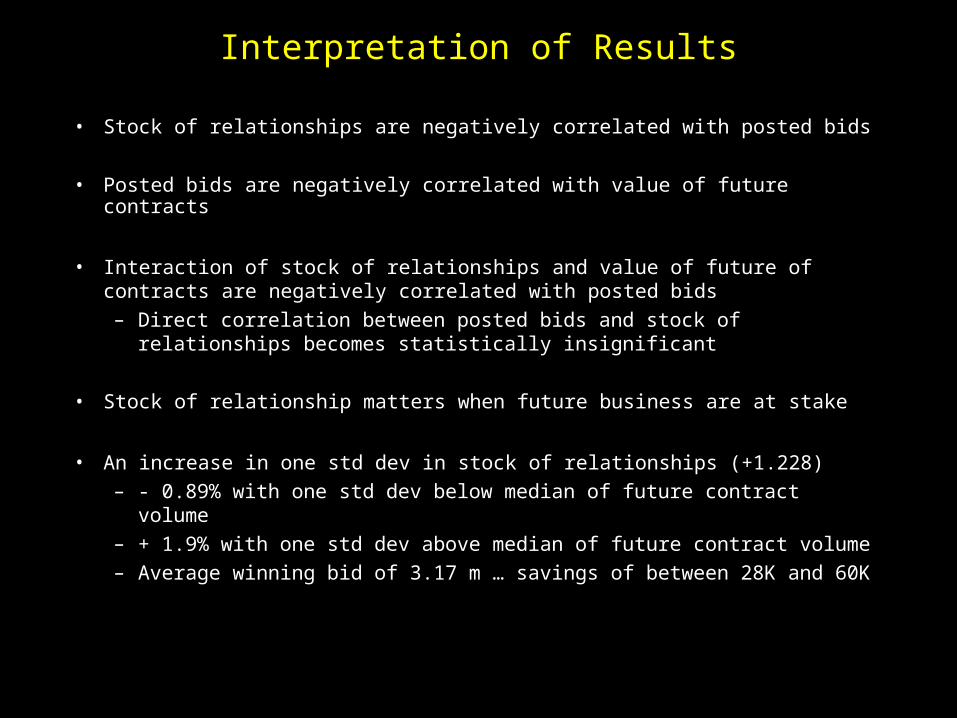
Interpretation of Results
• Stock of relationships are negatively correlated with posted bids
• Posted bids are negatively correlated with value of future contracts
• Interaction of stock of relationships and value of future of contracts are negatively correlated with posted bids
– Direct correlation between posted bids and stock of relationships becomes statistically insignificant
• Stock of relationship matters when future business are at stake
• An increase in one std dev in stock of relationships (+1.228)
– - 0.89% with one std dev below median of future contract volume
– + 1.9% with one std dev above median of future contract volume
– Average winning bid of 3.17 m … savings of between 28K and 60K

[Informal contracts]
•Self-enforcing contracts as long as
ICP: -b+(1/r)[πP(d)-i(d)-w-b] ≥ (1/r)πP
ICA: πA(d)+b+(1/r)[πA(d)+w+b] ≥ πA(d*)+(1/r)πA

With incomplete contracts parties rely on long term relationships to facilitate trade.
Theoretical literature has developed many different models – few empirical papers.
In the context of Kenya rose exports, this paper:1. computes value of the relationship,2. uses a shock to distinguish different models
The Value of Relationships:Evidence from a Supply Shock to Kenya Rose Exporters
Rocco Macchiavello & Ameet MorjariaWarwick University, Harvard Kennedy School

Exports of Roses from Kenya provide an ideal setting:
1. Transactions recorded in Customs data: all exports of flowers from Kenya 09/2004 - 08/2009
2. Use spot market price to compute future rents
3. Short-run shock: post-election violence in January 2008
4. Firm survey designed and conducted by authors through 2 hour face-to-face interviews in Kenya during summer 2008
5. Other sources to complement information
Data

Spot Market (Dutch Auctions) in the Netherlands- Firms have accounts and can export flowers anytime, - No contractual obligation, price determined through bidding,- Quality and Payments enforced by the Auctions.
Direct Relationships with foreign buyers- no formal contract enforcement available- sellers value stable orders and prices, buyers value reliability. Parties work out an informal “marketing plan” at the beginning of the season- save on transport and intermediation
Two Export Channels

1. Flowers are one of main exports from Kenya – the second largest exporter of flowers in the World
2. Industry counts about a hundred large, vertically integrated, exporting firms. All flowers are exported
3. Seasonal Industry
4. Two export channels: Dutch Auctions and Direct Relationships with Foreign Buyers:
- identical logistic & transport, but different incentives
Industry
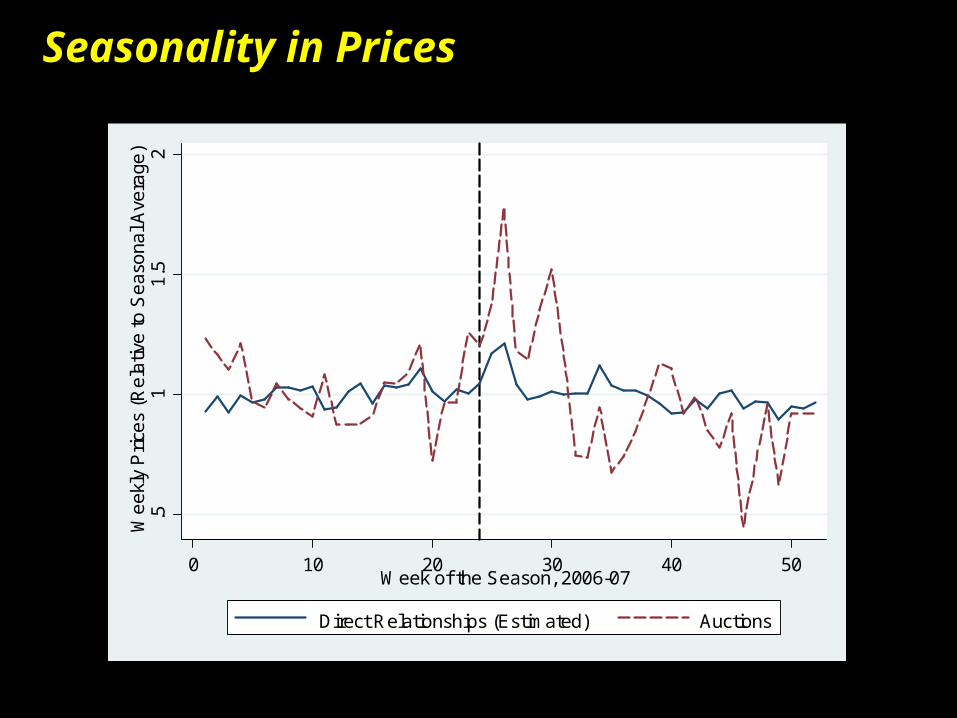
.51
1.5
2W
eek
ly P
rice
s (R
ela
tive
to S
eas
ona
l Ave
rage
)
0 10 20 30 40 50Week of the Season, 2006-07
Direct Relationships (Estimated) Auctions
Seasonality in Prices

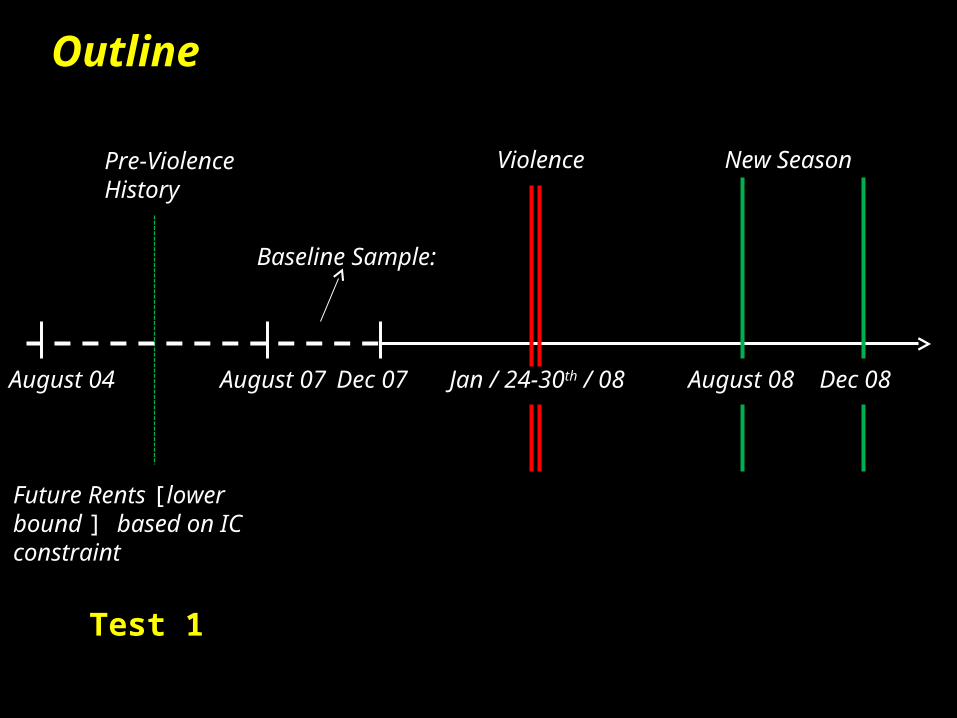
Outline
August 04 Jan / 24-30th / 08
Violence New Season
Future Rents [lower bound ] based on IC constraint
Test 1
Response to Shock
Test 2
Future Outcomes in the Relationship
Test 3
August 07 Dec 07 August 08 Dec 08
Pre-Violence History
Baseline Sample:

1. Following contested presidential elections at the end of 2007
2. Two spikes: - December 31st – January 4th - January 24-30th
3. The violence did not affect all of Kenya
The Ethnic Violence: Timing and Geography

The Geography of Ethnic Violence
The Ethnic Violence did not concern all parts of Kenya where flower firms are located

The violence caused exports to drop mainly because of missing workers (see Ksoll et al. (2010))
-6-4
-20
2D
e-S
eas
ona
lize
d V
olum
es
(Lo
g)
-10 -5 0 5 10Weeks from Beginning of Conflict
Conflict No ConflictDifference
The Economics of Ethnic Violence
Outline
August 04 Jan / 24-30th / 08
Violence New Season
Future Rents [lower bound ] based on IC constraint
Test 1
August 07 Dec 07 August 08 Dec 08
Pre-Violence History
Baseline Sample:

Relationship Value: Different Samples
0.1
.2.3
.4D
ensi
ty
-2 -1 0 1 2 3Relationship Value, in Logs, Season 2006/07
Established Relationships Surviving until 2007/08New Relationships Surviving until 2007/08Relationships that did not Survive until 2007/08

Test 1: Relationship Value and Relationship Age

Outline
August 04 Jan / 24-30th / 08
Violence New Season
Response to Shock
Test 2
August 07 Dec 07 August 08 Dec 08
Pre-Violence History
Baseline Sample:
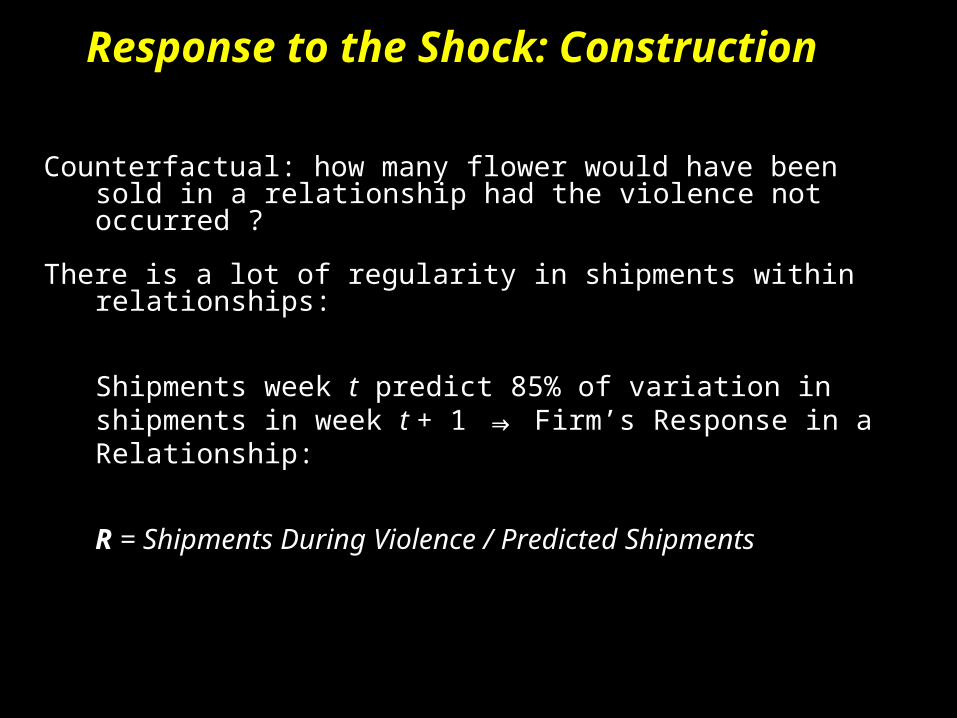
Counterfactual: how many flower would have been sold in a relationship had the violence not occurred ?
There is a lot of regularity in shipments within relationships:
Shipments week t predict 85% of variation in shipments in week t + 1 ⇒ Firm’s Response in a Relationship:
R = Shipments During Violence / Predicted Shipments
Response to the Shock: Construction

Test 2: Response to Shock and Relationship Value
Dependent Variable: Response to Shock
[1] [2] [5]
0.066*** 0.077* -0.011
[0.023] [0.048] [0.040]
Firms Fixed Effects yes yes yesRelationship Controls yes yes yesBuyer Fixed Effects no yes noNumber of observations 94 94 95
Relationship Value
Conflict Region No Conflict
Region

Outline
August 04 Jan / 24-30th / 08
Violence New Season
Future Outcomes in the Relationship
Test 3
August 07 Dec 07 August 08 Dec 08
Pre-Violence History
Baseline Sample:

Test 3: Relationship’s Survival and Response to Shock
Dependent Variable: Relationship Death
[1] [2] [3] [4]
0.057 0.041 0.213* 0.168*
[0.051] [0.061] [0.117] [0.094]
0.007 -0.007
[0.032] [0.032]
-0.130* -0.113*
[0.069] [0.059]
Relationship Controls yes yes yes yesFirm Controls no yes no yesBuyer Fixed Effects no yes no yesNumber of observations 189 189 189 189
Conflict Region
Conflict Region X Response to Shock
Reliability at Time of Violence

Test 1:Corr ( Relationship Value , History ) >> 0
Test 2: Corr ( Response to Shock , Relationship Value) >> 0
Test 3: Corr ( Future Outcomes , Response to Shock) >> 0
Firms value acquiring and maintaining a reputation for being reliable suppliers
Summary

[Informal contracts]
•Self-enforcing contracts as long as
ICP: -b+(1/r)[πP(d)-i(d)-w-b] ≥ (1/r)πP
ICA: πA(d)+b+(1/r)[πA(d)+w+b] ≥ πA(d*)+(1/r)πA
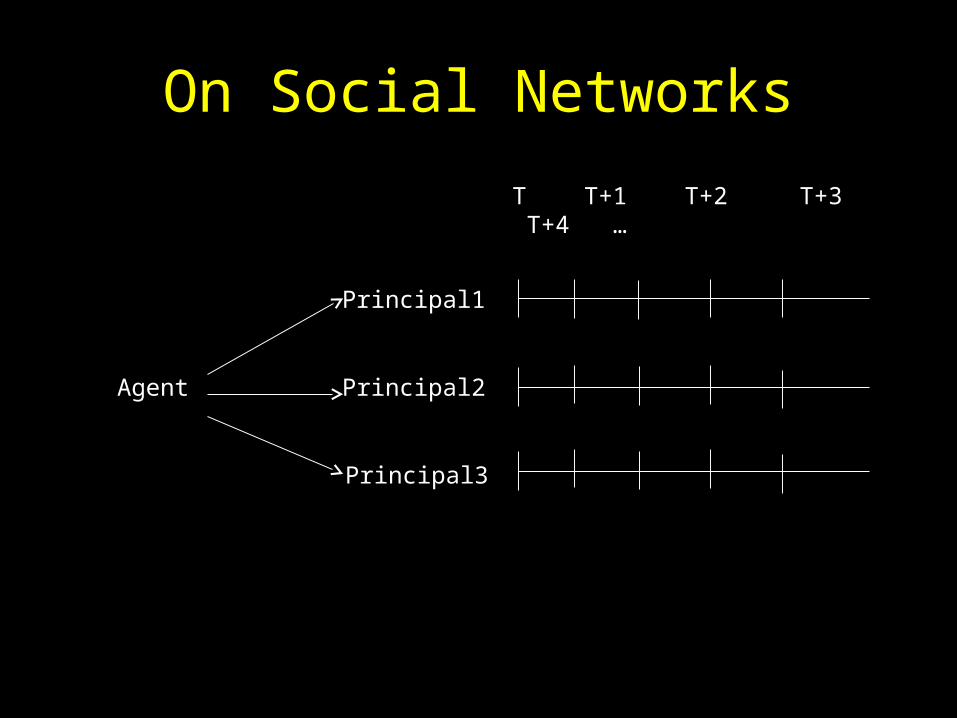
On Social Networks
Agent
Principal1
Principal2
Principal3
T T+1 T+2 T+3 T+4 …

On Social Networks
Agent
Principal1
Principal2
Principal3
T T+1 T+2 T+3 T+4 …

Airing Your Dirty Laundry:Vertical Integration, Reputational Capital and Social Networks
Ricard Gil and Wes HartmannUC – Santa Cruz, Stanford GSB
• Are firms in social networks more willing to outsource (i.e. less likely to vertically integrate)?
• What does the relationship between social networks and vertical integration suggest about the determinants of the boundaries of the firm?

Why Laundry Services and Koreatown?
• Each store makes 2 “make-or-buy decisions”:– Laundry and Dry Cleaning
• Over 80 cleaners within a 2 mile radius of many addresses in Los Angeles
• Useful institutional details for identifying the determinants of the boundaries of the firm
• 2000+ Korean cleaners in southern CA indicate the likely presence of a network

Framework Predictions for Relationship Between SN and VI
Positive Relationship • Reputations with workers
lower the costs of “managed coordination”
• Reputations with creditors lower the capital costs of integrating
Negative Relationship • Reputations with
suppliers lower the costs of “using the market”
• Poor access to formal credit in SN decreases ability to integrate

Definition of the Social Network
• Members:– Koreans in Koreatown
• Non-members:– Koreans elsewhere– Non-Koreans in Koreatown or elsewhere
• Communication and therefore reputation (within laundry industry and society members) should be enhanced in Koreatown


Data Description
• Data from laundry service stores. – 173 stores surveyed. – 138 stores answered.– 4 areas in LA:
• Korea Town (30+18)• China Town/Downtown (30).• Century City (30)• Santa Monica (30).
• Tract level demographic information.

Table 3. Integration Statistics by Social Network Status
Dry Cleaning Laundering
Korea Town
Korean 0.5000 0.3846(0.1000) (0.0973)
Non Korean 0.8462 0.8462(0.1042) (0.1042)
Elsewhere
Korean 0.7353 0.5882(0.0768) (0.0857)
Non Korean 0.7231 0.5231(0.0559) (0.0624)
Difference in Differences -0.3584 -0.5267(0.1728) (0.1776)
The table describes average integration incidence by service (dry cleaningor laundering), location (korea town or elsewhere) and langauge (koreanor non-korean). Standard Errors are in parenthesis.

[Formal vs. informal contracts]
• Informal contract is optimal whenever
πP(dF)+πA(dF)-f(dF) < πP(d’)+πA(d’)-i(d’)
• Informal contract will be used when
πP(dF)-f(dF)-p < πP(d’)-i(d’)-w-b
– r low long-term relationship– i(d) low 2nd party enforcement cheap– f(d) high court enforcement costly

Social Networks and Economic Performance
• If the social network is beneficial:
– The costs of using the market have been lowered relative to the costs of managing activities within the firm.
– This supports the notion that better outsourcing opportunities may help explain the positive relationship between social networks and vertical integration
– The role of access to credit in a social network is diminished in this developed country context

Do social networks reduce moral hazard?Evidence from the New York City taxi industry
Henry Schneider, Cornell UniversityKirabo Jackson, Northwestern University
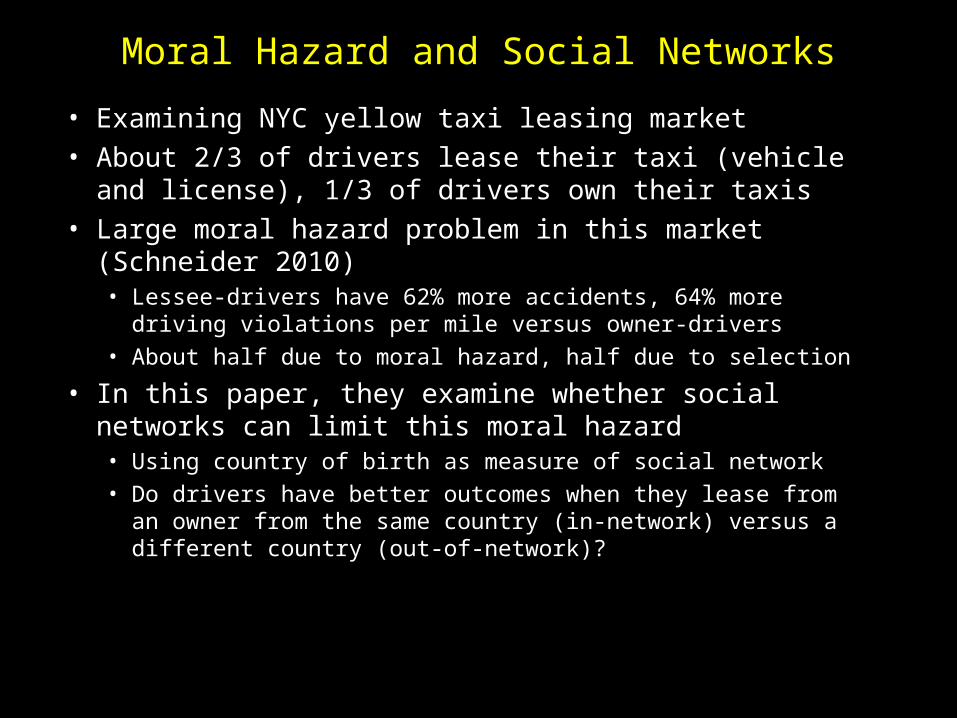
Moral Hazard and Social Networks
• Examining NYC yellow taxi leasing market• About 2/3 of drivers lease their taxi (vehicle and
license), 1/3 of drivers own their taxis• Large moral hazard problem in this market
(Schneider 2010)• Lessee-drivers have 62% more accidents, 64% more
driving violations per mile versus owner-drivers• About half due to moral hazard, half due to selection
• In this paper, they examine whether social networks can limit this moral hazard• Using country of birth as measure of social network• Do drivers have better outcomes when they lease from an
owner from the same country (in-network) versus a different country (out-of-network)?

New York City Taxi-Leasing Market
• Typically two drivers per taxi – each drives one 12-hour shift per day
• Number of licenses has essentially been fixed since 1940s• About one-fourth of licenses have specification that owner-must-drive• Various kinds of leasing arrangements (12-hour shifts to 6-month
contracts)
• Here focus on drivers leasing long-term from owner-drivers (~20% of taxis)
• Lessees pay lease fee: capped by taxi regulators at $650/week and therefore face moral hazard
– Lessee-drivers keep all fare revenues and pay some operating costs (Gas, tolls, fines)
– Lessee-drivers also generate costs for owner-drivers (Mechanical failures, accident damage or fines for vehicle safety among others)
– Revenues and costs both increase in driver aggressiveness– Drivers keep full benefit but don’t bear full cost of aggressiveness
– Costs divided this way because costly to monitor driver behavior and contracting on outcomes is also hard
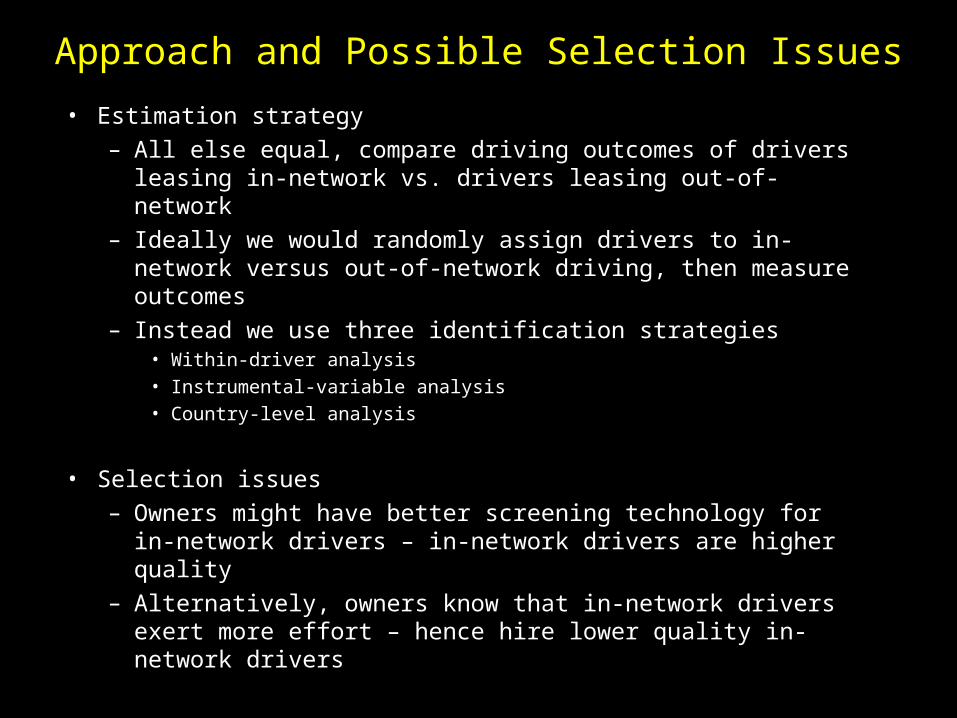
Approach and Possible Selection Issues
• Estimation strategy– All else equal, compare driving outcomes of drivers leasing
in-network vs. drivers leasing out-of-network– Ideally we would randomly assign drivers to in-network
versus out-of-network driving, then measure outcomes– Instead we use three identification strategies
• Within-driver analysis• Instrumental-variable analysis• Country-level analysis
• Selection issues– Owners might have better screening technology for in-
network drivers – in-network drivers are higher quality– Alternatively, owners know that in-network drivers exert
more effort – hence hire lower quality in-network drivers

The Data
• Proprietary data on all NYC yellow taxi drivers• From NYC Taxi and Limousine Commission – the government regulatory
agency• All variables for 2005, some for 2007
• Driving outcomes• Summonses – taxi regulations violations• Convictions – from NYPD, driving violations• Accidents – from NYPD, over $1000/damage or injuries
• Driver characteristics• Name, address, NYC taxi-driving experience, country of birth, English
language test results, driving test results, lease period, taxi owner
• Match to Census data using addresses• Census reports country of birth of all residents in Census tract• Measure network strength as fraction of residents in Census tract from
same country

Market Organized Around Country Networks – Suggesting Benefits
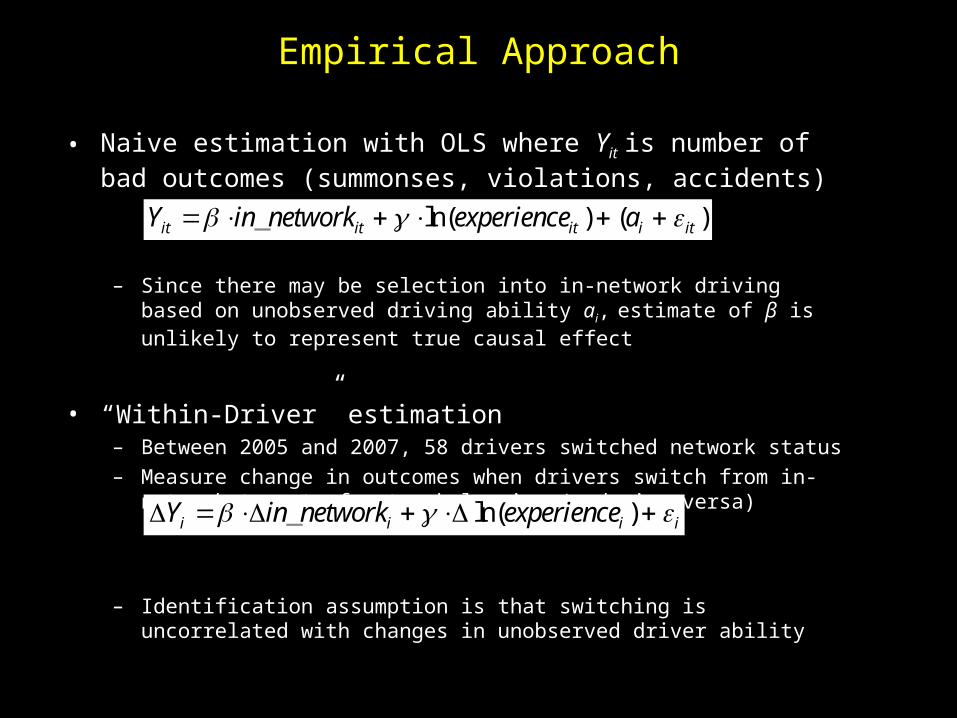
Empirical Approach
• Naive estimation with OLS where Yit is number of bad outcomes (summonses, violations, accidents)
– Since there may be selection into in-network driving based on unobserved driving ability ai, estimate of β is unlikely to represent true causal effect
• “Within-Driver” estimation – Between 2005 and 2007, 58 drivers switched network status– Measure change in outcomes when drivers switch from in-network to out-
of-network leasing (and vice versa)
– Identification assumption is that switching is uncorrelated with changes in unobserved driver ability
Yit in_networkit ln(experienceit ) (ai it )
Yi in_networki ln(experiencei ) i
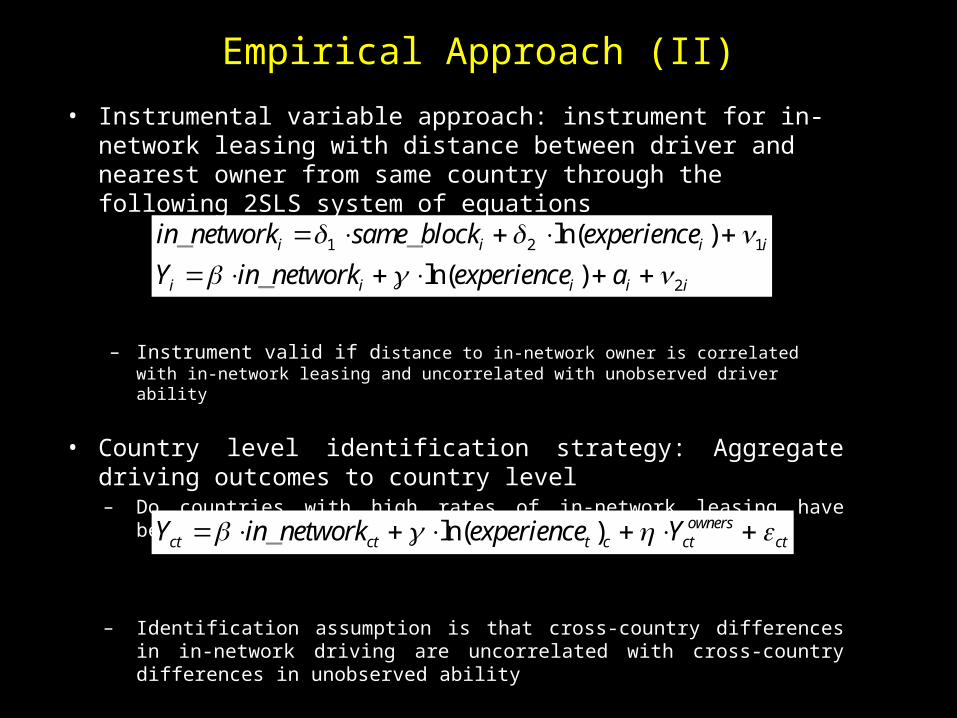
Empirical Approach (II)
• Instrumental variable approach: instrument for in-network leasing with distance between driver and nearest owner from same country through the following 2SLS system of equations
– Instrument valid if distance to in-network owner is correlated with in-network leasing and uncorrelated with unobserved driver ability
• Country level identification strategy: Aggregate driving outcomes to country level
– Do countries with high rates of in-network leasing have better outcomes?
– Identification assumption is that cross-country differences in in-network driving are uncorrelated with cross-country differences in unobserved ability
in_networki 1 same_blocki 2 ln(experiencei ) 1i
Yi in_networki ln(experiencei ) ai 2i
Yct in_networkct ln(experiencet )c Yctowners ct
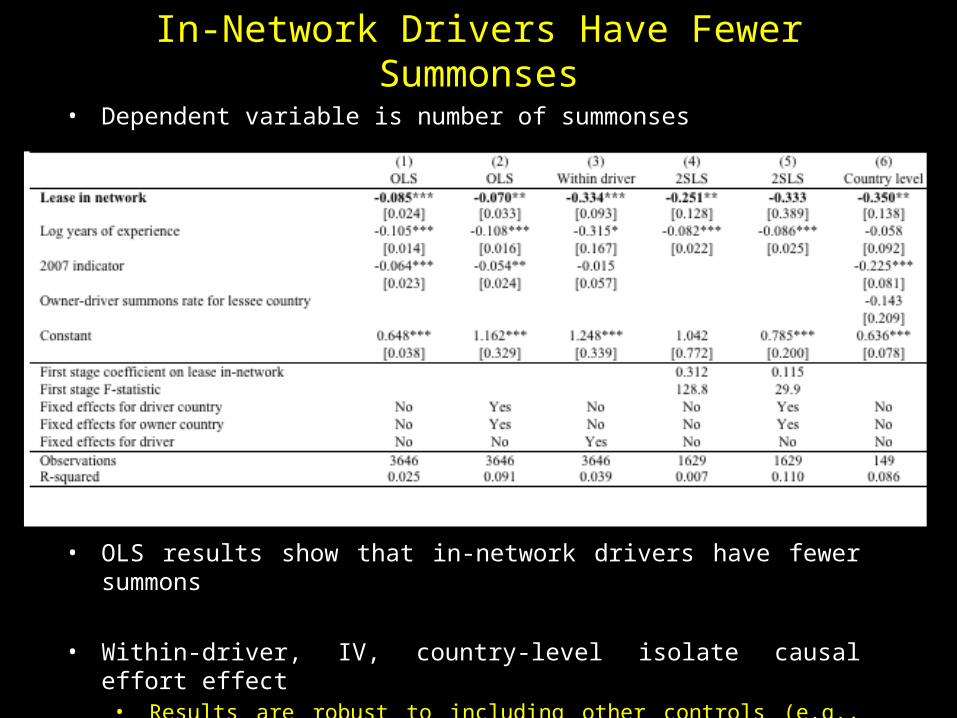
In-Network Drivers Have Fewer Summonses
• Dependent variable is number of summonses
• OLS results show that in-network drivers have fewer summons
• Within-driver, IV, country-level isolate causal effort effect• Results are robust to including other controls (e.g., age, education)• In-network effect becomes larger – indicates in-network drivers have lower
ability• Standard deviation of number of summonses is 0.72, so effects are large

[Informal contracts]
•Self-enforcing contracts as long as
ICP: -b+(1/r)[πP(d)-i(d)-w-b] ≥ (1/r)πP
ICA: πA(d)+b+(1/r)[πA(d)+w+b] ≥ πA(d*)+(1/r)πA

64
On the Interplay of Formal and Informal Contracts:Evidence from Movies
• How do formal and relational contracting interplay?
• I use unique data set from Spanish movie exhibitor – Ex-ante and ex-post contract terms for 416 movies in 26
theaters from Jan 2001 - Jun 2002 (18,592 obs)– Variation across movies (different informational characteristics),
theaters and weeks since release
• Borrow framework from BGM (2009), adapt model in BGM (1994) to movie industry institutional settings
• Back-of-the-envelope calculation of the effect of relational contracting on movie run length and revenues

Institutional Details
• Movie industry main players– No studios in this paper– Distributor (what movie to distribute)– Exhibitor (on-screen movie run length)
• Governance structure– No formal contract, all decided ex-post– Formal Contract, might be adjusted ex-post
• Revenue sharing contracts– Distributor share varies from 70% to 30%– Sharing terms vary across weeks and movies– Contracts are silent about movie run length (decided by exhibitor)

66
Average Share Distributor per Week since Release
30
35
40
45
50
55
60
65
1 2 3 4 5 6 7 8 9 10 11 12Week Since Release
Dis
trib
uto
r S
ha
re
No US Release
US Revenue<$50m
$50m<USRevenue<$100m
US Revenue>$100m

67
Ex-post Renegotiation• If no formal contract is used,
– Run length and revenue split determined ex-post for each week and after movie is pulled
• If formal contract is used,– Run length may or may not be extended beyond contract– Contracts are unilaterally terminated by the exhibitor (pull movie)– Distributor never asks for renegotiation (one-sided renegotiation)– Ex-post, exhibitors evaluate net revenues and compare them to costs– Exhibitor asks ex-post for renegotiation for each week independently
• Firms punish through market if opportunistic behavior

68
Spy Game
0.20
0.25
0.30
0.35
0.40
0.45
0.50
0.55
0.60
0.65
1 2 3 4 5 6 7 8
Weeks Since Release
Pearl Harbor
0.20
0.25
0.30
0.35
0.40
0.45
0.50
0.55
0.60
0.65
1 2 3 4 5 6 7 8
Week Since Release
Ocean's Eleven
0.20
0.25
0.30
0.35
0.40
0.45
0.50
0.55
0.60
0.65
1 2 3 4 5 6 7 8
Week Since Release
What Women Want
0.20
0.25
0.30
0.35
0.40
0.45
0.50
0.55
0.60
0.65
1 2 3 4 5 6 7 8
Week Since Release
69
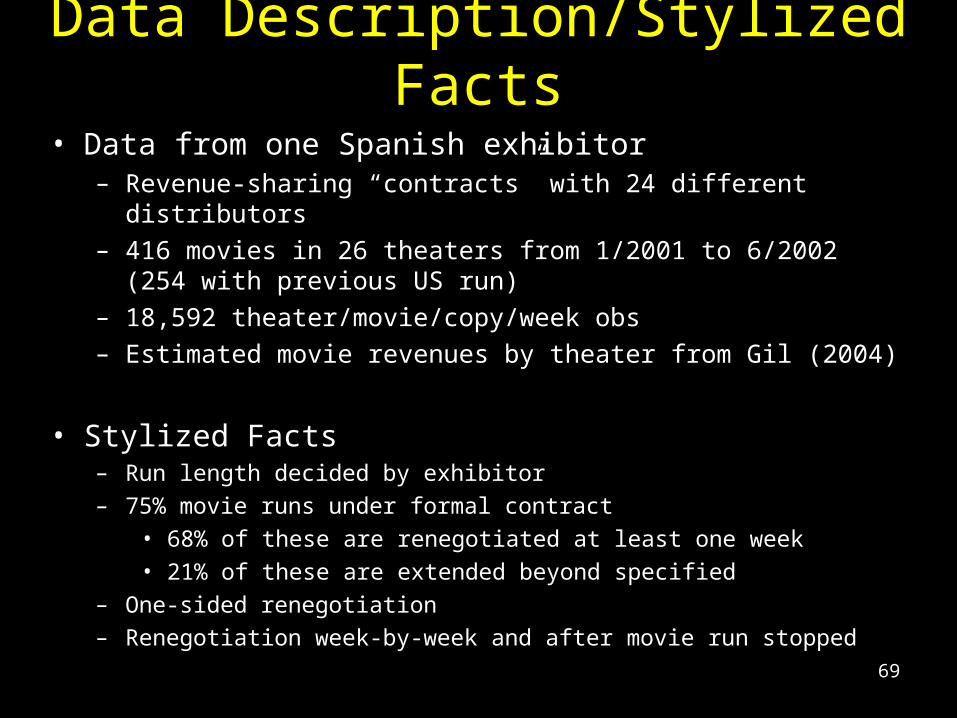
Data Description/Stylized Facts
• Data from one Spanish exhibitor – Revenue-sharing “contracts” with 24 different distributors – 416 movies in 26 theaters from 1/2001 to 6/2002 (254 with
previous US run)– 18,592 theater/movie/copy/week obs– Estimated movie revenues by theater from Gil (2004)
• Stylized Facts– Run length decided by exhibitor
– 75% movie runs under formal contract
• 68% of these are renegotiated at least one week
• 21% of these are extended beyond specified
– One-sided renegotiation
– Renegotiation week-by-week and after movie run stopped

70
Table 2. OLS Regressions on the Decision of Whether Using Formal Contracts
Dependent Variable: Any Formal Contract?
(1) (2) (3) (4) (5)
US Release -0.9332 -0.9271 -0.8958 -0.2099 -0.2478(0.2636)*** (0.2657)*** (0.2583)*** (0.0696)*** (0.2423)
Ln[1+US Box Office] 0.0618 0.0613 0.0592 0.0133 0.0168(0.0165)*** (0.0166)*** (0.0160)*** (0.0040)*** (0.0138)
Screens 0.0048 0.0050(0.0038) (0.0038)
Seats per Screen 0.0005 0.0005(0.0002)** (0.0002)**
No. Copy -0.0102(0.0284)
No. Movies 2003-04 0.0042(0.0014)***
Tickets/Movie 2003-04 0.0009(thousands) (0.0004)**
Constant 0.4767 0.4629 0.6327 0.7378 -0.0474(0.1584)*** (0.1441)*** (0.0999)*** (0.0208)*** (0.2784)
FE Movie Copy No Yes Yes Yes YesFE Theater No No Yes Yes YesFE Distributor No No No Yes NoCluster Se Distributor Yes Yes Yes No Yes
Observations 5204 5204 5204 5204 5204R-squared 0.06 0.06 0.08 0.54 0.26

71
Value of Relational Contracting (I)
• Back-of-the-envelope calculation of the effect of informal contracting on run length and revenues– Build two different counterfactuals from existing data
• Building counterfactuals– C1:
• Formal contracts: Run length stops at renegotiation• Informal contracts: Run length stops after release
– C2: • Estimate average stopping rule based on revenues per
each theater-week pair (alternative formal contract specifies revenue threshold specific to theater and week)
• Run length stops after revenue goes below specified threshold
72
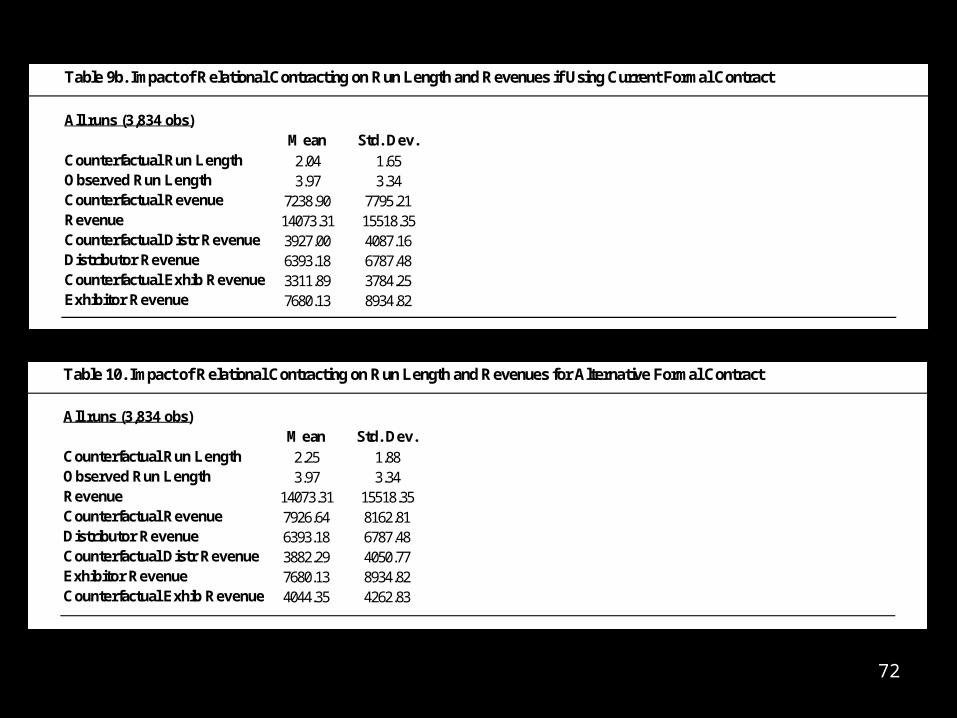
Table 9b. Impact of Relational Contracting on Run Length and Revenues if Using Current Formal Contract
All runs (3,834 obs)Mean Std. Dev.
Counterfactual Run Length 2.04 1.65Observed Run Length 3.97 3.34Counterfactual Revenue 7238.90 7795.21Revenue 14073.31 15518.35Counterfactual Distr Revenue 3927.00 4087.16Distributor Revenue 6393.18 6787.48Counterfactual Exhib Revenue 3311.89 3784.25Exhibitor Revenue 7680.13 8934.82
Table 10. Impact of Relational Contracting on Run Length and Revenues for Alternative Formal Contract
All runs (3,834 obs)Mean Std. Dev.
Counterfactual Run Length 2.25 1.88Observed Run Length 3.97 3.34Revenue 14073.31 15518.35Counterfactual Revenue 7926.64 8162.81Distributor Revenue 6393.18 6787.48Counterfactual Distr Revenue 3882.29 4050.77Exhibitor Revenue 7680.13 8934.82Counterfactual Exhib Revenue 4044.35 4262.83

73
Take-aways
• Formal, informal and relational contracts may be complements, not substitutes– Informal contracts do everything a formal contract cannot do– Formal contracts work as limits to reneging temptation– Relational contracts work as enforcement mechanism for the
informal agreement
• Using informal contracting doubles movie run length and box office revenues per run

[Formal vs. informal contracts]
• Informal contract is optimal whenever
πP(dF)+πA(dF)-f(dF) < πP(d’)+πA(d’)-i(d’)
• Informal contract will be used when
πP(dF)-f(dF)-p < πP(d’)-i(d’)-w-b
– r low long-term relationship– i(d) low 2nd party enforcement cheap– f(d) high court enforcement costly

[Informal contracts]
•Self-enforcing contracts as long as
ICP: -b+(1/r)[πP(d)-i(d)-w-b] ≥ (1/r)πP
ICA: πA(d)+b+(1/r)[πA(d)+w+b] ≥ πA(d*)+(1/r)πA


![[International Business] Pernod Ricard](https://static.fdocuments.us/doc/165x107/58a0754c1a28ab19098b4a5b/international-business-pernod-ricard.jpg)