THE ECONOMICS OF CRIME - Personal Webspace for QMUL
43
Chapter 52 THE ECONOMICS OF CRIME RICHARD B. FREEMAN Harvard University and NBER Center Jor Economic Performance, LSE Contents Abstract JEL codes 1 Introduction 2 Measures and magnitudes 2.1 Participation in crime and offenses per criminal 3 Crime in a market context 3.1 The market 3.2 The market model and incapacitation 4 Evidence on the supply of crime 4.1 The effect of legitimate opportunities: unemployment 4.2 The porous boundary between legal and illegal work 4.3 The effect of legitimate opportunities: earnings inequality and legitimate earnings 4.4 The effect of sanctions 4.5 Social interactions and the geographic concentration of crime 5 Does crime pay? criminal earnings and risk 5.1 Do incentives explain the age and sex pattern? 5.2 Future legitimate economic outcomes 6 Crime prevention activities 6.1 Specific crime prevention programs 6.2 Measuring the benefits from crime reduction 6.3 Individual efforts to prevent crime 6.4 Partial privatization of criminal justice activities? 7 Conclusion: how big is the economics contribution? References 3530 3530 3530 3533 3536 3538 3539 3540 3541 3542 3543 3545 3546 3549 3551 3553 3554 3556 3557 3558 3560 3561 3562 3563 Handbook of Labor Economics, Volume 3, Edited by O. AshenJ~lter and D. Card © 1999 Elsevier Science B.V. All rights reserved. 3529
Transcript of THE ECONOMICS OF CRIME - Personal Webspace for QMUL
Chapter 52
THE ECONOMICS OF CRIME
RICHARD B. FREEMAN
Harvard University and NBER Center Jor Economic Performance, LSE
Contents
Abstract JEL codes 1 Int roduct ion 2 Measures and magni tudes
2.1 Participation in crime and offenses per criminal 3 Cr ime in a market context
3.1 The market 3.2 The market model and incapacitation
4 Ev idence on the supply o f c r ime 4.1 The effect of legitimate opportunities: unemployment 4.2 The porous boundary between legal and illegal work 4.3 The effect of legitimate opportunities: earnings inequality and legitimate earnings 4.4 The effect of sanctions 4.5 Social interactions and the geographic concentration of crime
5 Does c r ime pay? cr iminal earnings and risk 5.1 Do incentives explain the age and sex pattern? 5.2 Future legitimate economic outcomes
6 Cr ime prevent ion activi t ies 6.1 Specific crime prevention programs 6.2 Measuring the benefits from crime reduction 6.3 Individual efforts to prevent crime 6.4 Partial privatization of criminal justice activities?
7 Conclus ion: h o w big is the economics contr ibut ion? Refe rences
3530 3530 3530 3533 3536 3538 3539 3540 3541 3542 3543 3545 3546 3549 3551 3553 3554 3556 3557 3558 3560 3561 3562 3563
Handbook of Labor Economics, Volume 3, Edited by O. AshenJ~lter and D. Card © 1999 Elsevier Science B.V. All rights reserved.
3529
3530 R. B. Freeman
Abstract
Crime is a major activity in the US, with implications for poverty and the allocation of public and private resources. The economics of crime focuses on the effect of incentives on criminal behavior, the way decisions interact in a market setting; and the use of a benefit-cost framework to assess alternative strategies to reduce crime. This essay shows that most empirical evidence supports the role of incentives in the criminal decision: legitimate labor market experiences, sanctions including incarceration, and the risk of apprehension all influence decisions to engage in crime. By putting crime into a market setting, economic analysis highlights the difficulty of reducing crime through incapacitation: when the elasticity of supply to crime is high, one criminal replaces another in the market; and thus the importance of deterring crime by altering behavior. Most analyses show that "crime pays" in the sense of offering higher wages than legitimate work, presumably in part to offset the risk of apprehension. But some important facts about crime - long term trend increases and decreases; the geographic concentration of crime; the preponderance of men and the young in crime - seem to go beyond basic economic analysis. © 1999 Elsevier Science B.V. All rights reserved.
JEL codes: J22; K42
1. Introduct ion
Should I mug you or burgle your home, abscond with the company treasury, sell or buy illegal drugs, cheat on my income tax, shoplift?
How will the chances of apprehension or the magnitude of criminal penalties or legit- imate employment and earnings opportunities affect my decision to commit crime?
Should you buy locks and window gates, take out theft insurance, avoid walking in the park at night, or hire private guards to protect your business or residence?
Should you support additional taxes for more police, more prisons, or juvenile delin- quency prevention programs?
Should the police put more officers on the street or use modern surveillance technolo- gies to monitor public places or develop extensive community policing programs?
The questions that motivate the economic analysis of crime make for headlines in the tabloids or lor police dramas on the television. Headlines aside, the economics of crime is an important area of research in the US for several reasons.
"First, because crime is a major activity. In 1997 the police reported 13.5 million crimes or 5079 crimes per 100,000 residents, while citizens reported that they were victimized by crime nearly three times as frequently - 36.8 mill ion crimes. ~ On the 1991 National Survey of I~tug Abuse~ 2.6% of adults reported that they had committed a felony 2 in the past year, which given under-reporting of crimes, suggests that on the order of 4%
J US Bureau of Census Statistical Abstract of the US 1997, Tables 314, 315, 324. 2 The felonies reported were: stolen a car, used force or a weapon to get money, broken into a house, beaten
someone badly, sold an illegal drug, or been arrested for a serious offense.
Ch. 52: The Economics of Crime 3531
of adults commi t t ed serious crimes. 3 On the order of 30% of adult males are arrested for a
serious c r ime at one t ime in their l ives (Blumste in et al., 1986, p. 57). In 1997 approxi-
mate ly 1.7 mi l l ion Amer icans were incarcerated4; over 3.2 mi l l ion adults were under
probat ion and about 0.7 mi l l ion were paroled. 5 In total, 2 .9% of adult US residents
were "unde r superv is ion" by the cr iminal jus t ice system. The vast bulk o f those arrested, admit t ing to cr ime, and incarcerated are male, so that 1
in 20 adult men was "unde r superv is ion" by the cr iminal jus t ice system in 1997. 6 Based
on t990s rates of first incarcerat ion, the Justice Depar tmen t es t imates that approximate ly
9% of Amer ican m e n wil l be in prison at one point in their l ives! 7
The vast bulk of those arrested, admit t ing to cr ime, and incarcera ted are young. In 1995,
for example , 72% of persons arrested were aged 13-34, whereas 13-34 year olds make up
jus t 32% of the populat ion. Similar ly , in 1991, 67% of state pr ison inmates were aged 18-
34, whereas 18-34 year olds make up just 34% of the adult (18 or older) populat ion
group. ~ In 1995 law enfo rcemen t agencies made 2.9 mi l l ion arrests of persons aged less
than t 8; some 1.4 mi l l ion juveni les were taken into pol ice custody, and roughly 0.5 mi l l ion
juven i les were on probat ion in the mid-1990s.9 The age and gender pattern of c r ime seems
universal . Arres t rates r ise wi th age, peak in the mid to late teens or early twenties, then fall
(Hirschi and Gottfi 'edson, 1983; Blumste in et al., 1986, Fig. 1.2). A disproport ionate
number of those i nvo lved in c r ime are black, which creates a ma jo r social p rob lem in
A m e r i c a ' s inner cities. G iven the high levels o f cr ime, it is not surprising that c r ime prevent ion is a major
economic activity. In 1997 the publ ic budget for the cr iminal jus t ice system was on the
order o f 100 bi l l ion dollars - near ly ha l f spent on police, a third on corrections, and the
remain ing fifth on jud ic ia l and legal activities. Upda t ing a 1985 study of private security
programs, Hal lcres t Systems, Inc es t imated that in 1991 the budget for private security
3 Greenwood et al. (1994) estimate the under reporting to be 41.2% by comparing actual to reported arrests for California. See D.8.
4 The Bureau of Justice Statistics reports 1,725,842 inmates in custody in June 1997. Sixty-one percent of this group were in state prisons, 33% in local jails, and the remaining 6% in federal prisons. See Bureau of Justice Statistics, Prison and Jail Inmates at Midyear 1997, January 1998, NCJ-167247, Table 1.
5 Probation and parole data relate to 31 December 1996 and thus understate the numbers relative to the inmate population in mid-1997. See US Department of Justice Probation and Par'ole Population Reached Almost 3.9 Million Last Year, August 14, 1997.
6 Ninety-four percent of the prison population, 90% of the jail population, and 79% of the persons on probation were male in 1995 (Bureau of Justice Statistics, Characteristics of Adults on Probation, 1995 (USGPO, Dec. 1997) p. 3.
7 US Bureau of Justice Statistics, Lifetime Likelihood of Going to State or Federal Prison 3/97 NCJ-160092. 8 US Bureau of Justice Statistics, Sourcebook of Criminal Justice Statistics 1996, Table 4.4 gives distributions
of arrests and the population by age. US Bureau of the Census, Statistical Abstract 1997 Table 356, for the age of prisoners, and Table 33 for the age of the population.
9 US Department of Justice Statistics, Sourcebook of Criminal Justice Statistics 1996, Table 4.6 gives arrest rates, Table 4.25 gives juveniles taken into police custody.
3532 R. B. Freeman
exceeded that for public law enforcement by some 73% (Cunningham et al., 1991).t° In 1997 over 2 million persons worked in "protective service" occupations exclusive of firefighters. In addition to police and corrections officials, there were nearly 0.75 million private guards, detective agencies and protective service firms (Industry standard indus- trial classification code SIC 7381 and 7382) massively increased their employment from 62,000 in 1964 to over 690,000 workers in early 1998.
The economics of crime is also important because crime is closely related to poverty, social exclusion, and other economic problems. Most criminals have limited education and labor market skills, poor employment records, and low legitimate earnings. For instance, the 1991 Survey of State Prison Inmates reports that two-thirds had not graduated high school, though many had obtained a general equivalency degree (US Department of Justice, Bureau of Justice Statistics, 1993). Among 25-34 year olds, approximately 12% of all male high school dropouts were incarcerated in 1993. The average AFQT score of criminals is below that of non-criminals. A disproportionate number of criminals report that they were jobless in the period prior to their arrest.
What is true for criminals is also true for victims. Persons from disadvantaged or low income groups are over-represented among the victims from crime. Victimization surveys show that blacks are more likely to be victims of violent crime than whites and are also more likely to be victims of property crimes, despite owning less property. The rate of victimization for violent crimes (which range from robbery to assault to rape) is inversely related to household income, while the rate of victimization for property crimes rises only modestly with income. LI Benefit-cost assessments of social interventions to help disad- vantaged young men, such as the Job Corps or the Perry Pre-School early education experiment, depend critically on cost savings from reductions in crime.
The economics of crime is also important because crime is an area of extreme behavior that puts economic analysis to a rigorous test. Crime is inherently risky, so that attitudes toward risk are critical in decision-making. Criminal behavior is subject to strategic gaming by the police, criminals, and the public, per the Prisoner's Dilemma. Social interactions among potential criminals, potential victims, and the criminal justice system, moreover, go beyond the price system. An increase in the number of criminals can reduce the likelihood of being caught for a crime, augmenting the incentive to commit crime, or it may induce others into crime by setting an example.
Since Becker (1968), economists have increasingly studied the determinants and conse-
I°'This is a highly speculative number due to "a paucity of intbrmation based on rigorous empirical research" (Cunningham et al., 1991, p. 2). The claim that private security forces "dwarf public law enforcement ... by 2 1/2 time" (p. 1) seems excessive. Current Population Survey data show more police and detectives in the public service, and shen~fs bailiffs ~nd other law enforcement officers than guards outside the public sector. US Bureau of Labor Statistics E~nployment and Earnings, January 1998.
11 US Department of Justice, Bureau of Justice Statistics, Sourcebook of Criminal Justice Statistics, 1996, Tables 3.2 for personal victimization ,and Table 3.20 3.21 for property victimization. The 1996 Criminal Victi- mization Survey shows no trend in property victimization by income group until the $75,000 or more household income class, which has a modestly higher rate (304.6 per 100,000) than households with less than $7500 income (282.7 per 100,000). US Department of Justice Web Site, cv96.txt, November 1997 NCJ-165812.
Ch. 52: The Economics of Crime 3533
quences of crime, but researchers from other disciplines dominate the area. Criminology is a distinct field of its own, with professional journals and specialized expertise. 12 Psychol- ogy and sociology are important because crime runs in families, raising issues about genetic predispositions and the effect of family background on criminal propensities. Hernnstein (1996) has argued that criminals differ along many dimensions from the non-criminal population: they have "criminogenic traits" that reach back to childhood delinquency, score lower on IQ tests, evince problem psychological behavior, and have a genetic source was well. Many criminologists stress the role of childhood experiences, particularly child abuse (Widom, 1997), as a determinant of youth criminal behavior. Ethnographers have developed rich analyses of the youth gangs which provide the social setting for much crime, t3 And, as debates over the death penalty and legalization of drugs
and sexual harassment highlight, normative concerns play a great role in defining crime and appropriate punishment. 14
This essay focuses on what economics brings to the table: insights into the effect of incentives on criminal behavior, the way decisions interact in a market setting; and the use of a benefit-cost framework to assess alternative strategies to reduce crime. Because so much research is done outside of economics proper, the essay examines what other social scientists as well as economists have contributed in these areas. Js
2. Measures and magnitudes
There are four basic sources of statistics on criminal activities in the US: administrative records on crimes reported to the police, gathered by the Federal Bureau of Investigation though its Uniform Crime Reporting Program from law enforcement agencies around the country; the National Victimization Survey, an annual survey that asks whether citizens have been victimized in various ways and whether they reported the offense to the police; general surveys of the population that include modules of questions on criminal activities; and specialized data sets that focus on criminal activity, including longitudinal surveys of the crime behavior of given cohorts, surveys of prisoners, and the like.
~ Outside of academe, there is a criminal justice community that provides statistics on crime and that monitors 'alternative crime prevention or rehabilitation strategies, such as random preventive patrolling or quick police response and community policing. The Web Site of the Bureau of Justice Statistics offers easy access to data and reports; the National Archive of Criminal Justice Data at the University of Michigan is a repository of diverse data files.
13 See the wide range of disciplines of author's in James Q. Wilson Crime and Public Policy (ICS Press, 1983) and his 1996 book with Joan Petersilia, Crime.
~4 Isaac Ehrlich's findings on the deterrent effects of capital punishment in the 1970s caused an uproar among researchers, in part because Ehrlich was addressing an issue of criminal justice about which people have deep moral feelings. A panel from the National Academy of Science reviewed the work as part of its study of the effectiveness of sanctions, found some data errors, but did not overturn the thrust of Ehrlich's case. See Vandaele (1978).
Js I have benefited from joint work with Jeffrey Fagan. See Fagan and Freeman (1997).
( A )
R. B. Freeman
000 -
500 -
000
500 -
000
500 -
000 -
500 -
000
500 -
000 -
500 -
O -
3534
5 0 0
T- - I I I J I . . . . . ~ I ; I ~ r I I I J I J
o, o, o~ o, N N o, N N o', N o~ o~
2 5 0 0 0 -
2 4 0 0 0 -
2 3 0 0 0 -
2 2 0 0 0 -
2 1 0 0 0 -
2 0 0 0 0 -
1 9 0 0 0 -
1 8 0 0 0 -
1 7 0 0 0 -
1 6 0 0 0 -
1 5 0 0 0 -
1 4 0 0 0 -
1 3 0 0 0 -
1 2 0 0 0 -
1 1 0 0 0 -
10000
( B )
i ~ t t i ; i k i ~ L - ~ h i i - - - T i i i
x--
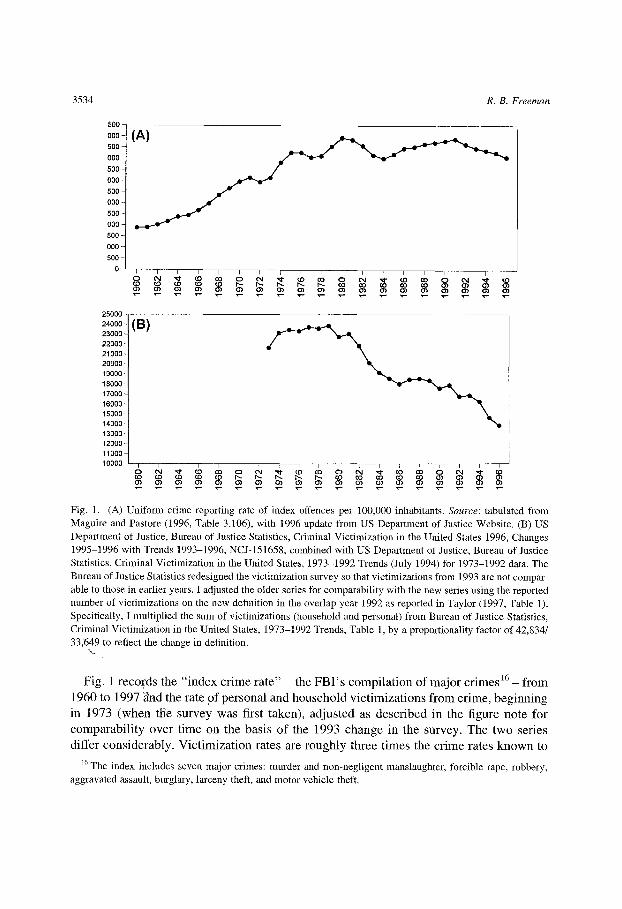
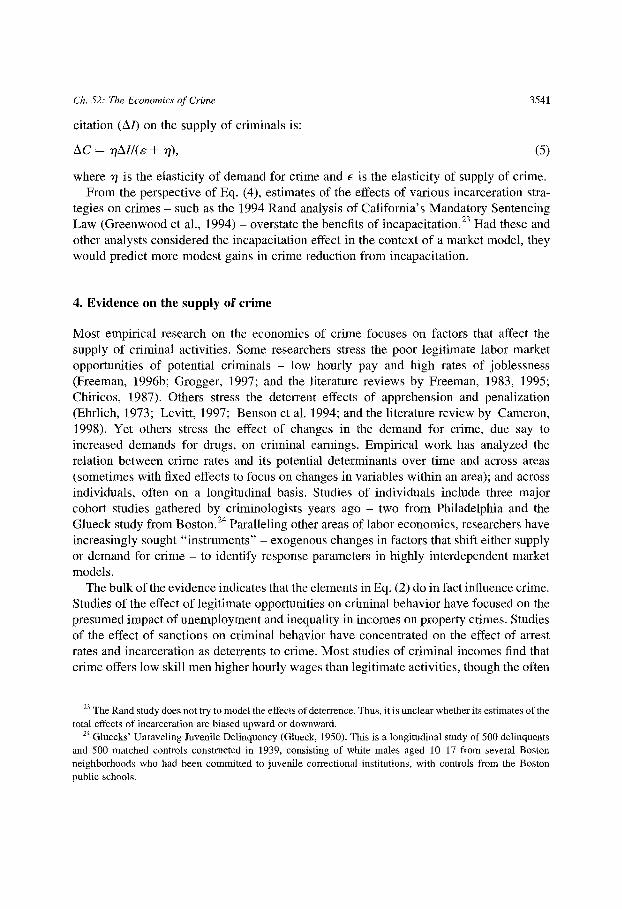
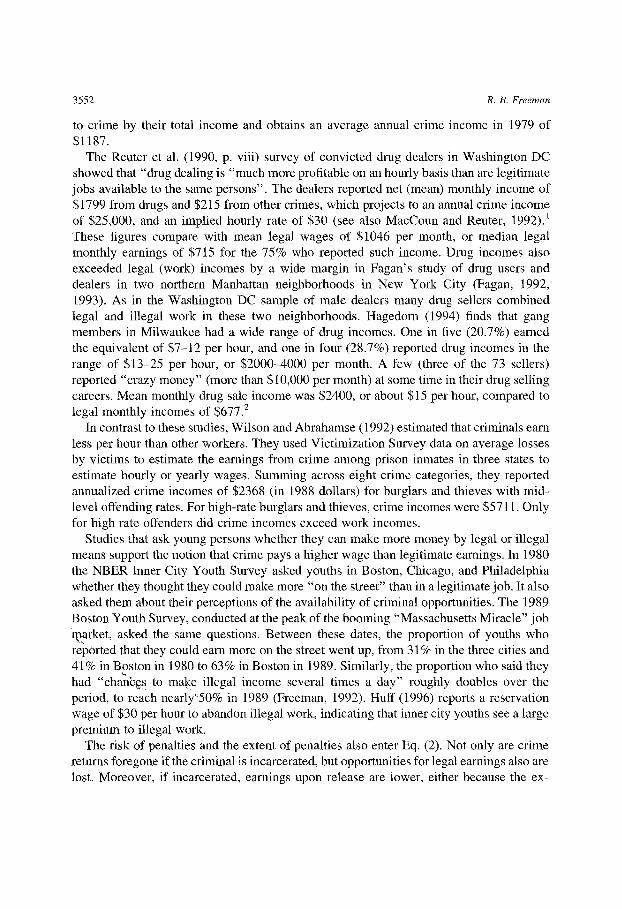
Fig. 1. (A) Uniform crime reporting rate of index offences per 100,000 inhabitants. Source: tabulated from Maguire and Pastore (1996, Table 3.106), with 1996 update from US Department of Justice Website. (B) US Department of Justice, Bureau of Justice Statistics, Criminal Victimization in the United States 1996, Changes 1995-1996 with Trends 1993-1996, NCJ-151658, combined with US Department of Justice, Bureau of Justice Statistics, Criminal Victimization in the United States, 1973-1992 Trends (July 1994) for 1973-1992 data. The Bureau of Justice Statistics redesigned the victimization survey so that victimizations from 1993 are not compar- able to those in earlier years. I adjusted the older series for comparability with the new series using the reported number of victimizations on the new definition in the overlap year 1992 as reported in Taylor (1997, Table 1). Specifically, I multiplied the sum of victimizations (household and personal) from Bureau of Justice Statistics, Criminal Victimization in the United States, 1973--1992 Trends, Table 1, by a proportionality factor of 42,834/ 33,649 to reflect the change in definition.
Fig. 1 records the " index c r ime ra te" - the F B I ' s compi l a t ion of major c r imes 16 - f rom
1960 to 1997 ~ind the rate of persona l and househo ld v ic t imiza t ions f rom cr ime, beg inn ing
in 1973 (when tile survey was first taken), ad jus ted as desc r ibed in the figure note for
comparab i l i ty over t ime on the basis o f the 1993 change in the survey. The two series
differ cons iderably . Vic t imiza t ion rates are rough ly th ree t imes the c r ime rates k n o w n to
~6 The index includes seven major crimes: murder and non-negligent manslaughter, forcible rape, robbery, aggravated assault, burglary, larceny theft, and motor vehicle theft.
Ch. 52: The Economics of Crime 3535
police because victims do not report all crimes, t7 Victims differentially report crimes to the police for several reasons. The benefits of reporting a crime may be small - the police are unlikely to retrieve your stolen bicycle or wallet, so why spend the time and effort reporting the theft? Some crimes are committed by intimates, whom the victim may not want to punish or who can wreak vengeance on the victim. On the other hand, car thefts are almost always reported, because the victim will receive insurance money.
The index crime rate rose sharply in the 1960s and 1970s - the great crime wave that brought crime to the forefront of national discussion - level led off in the 1980s and dropped in the 1990s. By contrast, the victimization rate falls sharply from the 1980s through the 1990s. Whereas in 1997 the UCR crime rate was 15% below its 1980 peak level, the vict imization rate was 39% below its 1980 level. One reason for the differential pattern is that the rate of reporting crimes to pol ice rose over the period. Boggess and Bound (1993) estimate that this accounts for about one-quarter of the differential trend and hypothesize that much of the remaining difference is due to increased police filing of reports. Decomposing crimes by type, most of the discrepancy is for crimes that "are known to be poorly measured both by the UCR and (victims survey)" , while series that are well-measured, such as motor vehicle theft, robbery, and burglary, are more closely aligned.
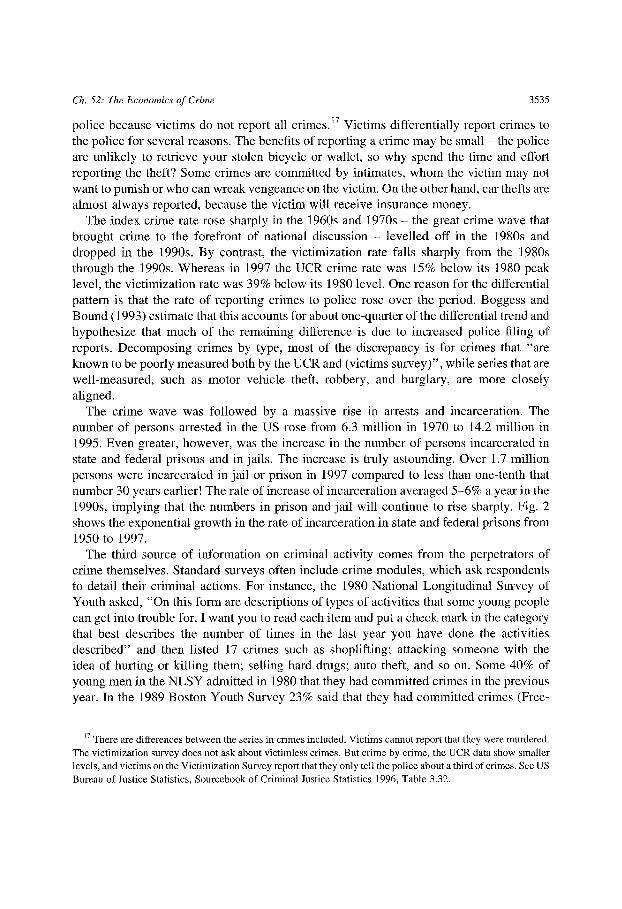
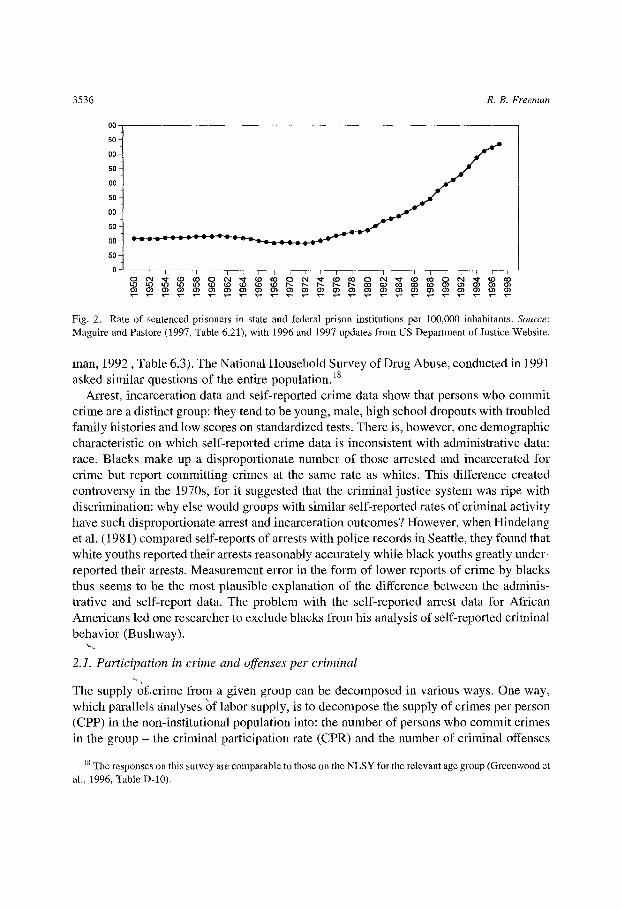
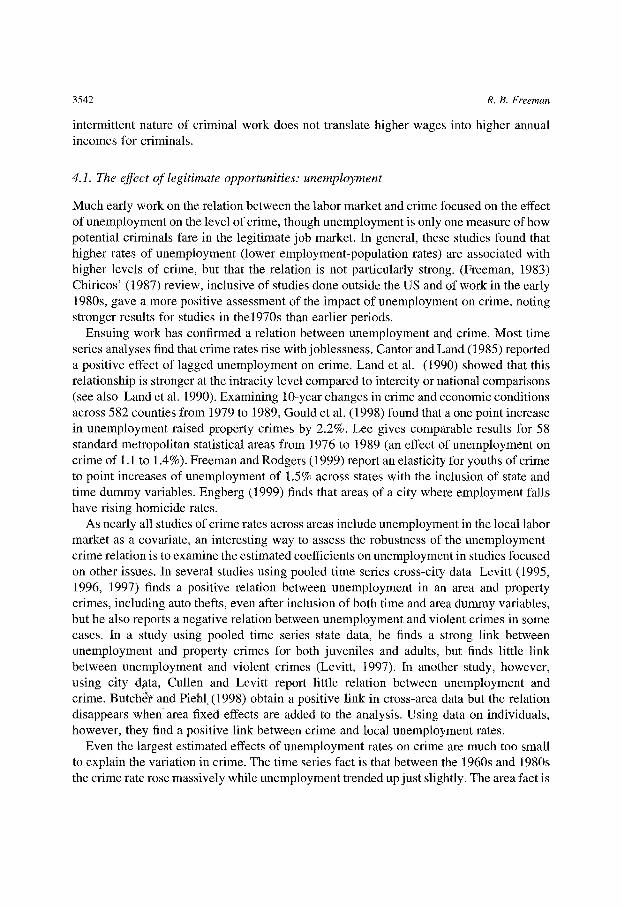
The crime wave was followed by a massive rise in arrests and incarceration. The number of persons arrested in the US rose from 6.3 mil l ion in 1970 to 14.2 mil l ion in 1995. Even greater, however, was the increase in the number of persons incarcerated in state and federal prisons and in jails. The increase is truly astounding. Over 1.7 mill ion persons were incarcerated in jai l or prison in 1997 compared to less than one-tenth that number 30 years earlier! The rate of increase of incarceration averaged 5-6% a year in the 1990s, implying that the numbers in prison and ja i l will continue to rise sharply. Fig. 2 shows the exponential growth in the rate of incarceration in state and federal prisons from 1950 to 1997.
The third source of information on criminal activity comes from the perpetrators of crime themselves. Standard surveys often include crime modules, which ask respondents to detail their criminal actions. For instance, the 1980 National Longitudinal Survey of Youth asked, "On this form are descriptions of types of activities that some young people can get into trouble for. I want you to read each i tem and put a check mark in the category that best describes the number of times in the last year you have done the activities described" and then listed 17 crimes such as shoplifting; attacking someone with the idea of hurting or kill ing them; selling hard drugs; auto theft, and so on. Some 40% of young men in the NLSY admitted in 1980 that they had commit ted crimes in the previous year. In the 1989 Boston Youth Survey 23% said that they had committed crimes (Free-
L7 There are differences between the series in crimes included. Victims cannot report that they were murdered. The victimization survey does not ask about victimless crimes. But crime by crime, the UCR data show smaller levels, and victims on the Victimization Survey report that they only tell the police about a third of crimes. See US Bureau of Justice Statistics, Sourcebook of Criminal Justice Statistics 1996, Table 3.32.
00-
50
O0
50
00
50
O0
50
O0
500:
R. B. Freeman 3536
Fig. 2. Rate of sentenced prisoners in state and federal prison institutions per 100,000 inhabitants. Source: Maguire and Pastore (1997, Table 6.21), with 1996 and 1997 updates from US Department of Justice Website.
man, 1992, Table 6.3). The National Household Survey of Drug Abuse, conducted in 1991 asked similar questions of the entire population. 18
Arrest, incarceration data and self-reported crime data show that persons who commit crime are a distinct group: they tend to be young, male, high school dropouts with troubled family histories and low scores on standardized tests. There is, however, one demographic characteristic on which self-reported crime data is inconsistent with administrative data: race. Blacks make up a disproportionate number of those arrested and incarcerated for crime but report committing crimes at the same rate as whites. This difference created controversy in the 1970s, for it suggested that the criminal justice system was ripe with discrimination: why else would groups with similar self-reported rates of criminal activity have such disproportionate arrest and incarceration outcomes? However, when Hindelang et al. (1981) compared self-reports of arrests with police records in Seattle, they found that white youths reported their arrests reasonably accurately while black youths greatly under- reported their arrests. Measurement error in the form of lower reports of crime by blacks thus seems to be the most plausible explanation of the difference between the adminis- trative and self-report data. The problem with the self-reported arrest data for African Americans led one researcher to exclude blacks from his analysis of self-reported criminal behavior (Bushway).
2.1. Participation in crime and offenses per criminal
The supply~of.crime from a given group can be decomposed in various ways. One way, which parallels ~malyses ~)f labor supply, is to decompose the supply of crimes per person (CPP) in the non-institutional population into: the number of persons who commit crimes in the group - the criminal participation rate (CPR) and the number of criminal offenses
~8 The responses on this survey are comparable to those on the NLSY for the relevant age group (Greenwood et al., 1996, Table D-10).
Ch. 52: The Economics of" Crime 3537
per active criminal (A):
CPP = CPR × A. (1)
Since young men commit most crimes, it is natural to use the young male population (say those aged 18-34) as the base for estimating the CPP. Because the age-gender composition of the population changes more slowly than crime numbers, however, the criminal activity rate of young men moves much like the overall crime rate. The implica- tion is that despite the strong demographic component of crime, changes in crime rates depend more on behavior, as reflected in age-crime offense rates, than on changes in the demographic composition of the population. This is in fact the conclusion of various studies that have looked at the effect of demographic changes on crime (see Phillips and Votey, 1990; Levitt, 1997).
Evidence on offenses per active criminal (A) is hard to come by. There are problems of definition - is drug selling one crime or many depending on how many drug sales are made? - and issues in the reliability of self-reported criminal behavior, perhaps because of systemic measurement error in self-reports (Spelman, 1994). In any case, studies report widely varying numbers. Studies of prisoners suggest an average number of crimes of approximately 60-180 per year (Marvell and Moody, 1994, Table 1 summarize the evidence). But because a small number of criminals report that they committed a large number of crimes, the median number of offenses per prisoner is just 12-15 per year, and relatively many criminals commit only one or two crimes, giving an entirely different picture of the extent of criminal activity per criminal.19 Since prisoners are a high offend- ing group, moreover, their crime rates should exceed those of the non-incarcerated popu- lation. Criminologists also estimate crimes per criminal by asking persons arrested how many times they were arrested; and dividing the number of arrests by police data on the arrests per crime. These estimates suggest a rate of offenses per criminal of around 11 (Marvell and Moody, 1996, p. 112). Finally, we have numbers of crimes reported by youths on household surveys. In the NLSY, non-incarcerated youths who admit having committed crimes report 7 crimes over the year.
While the average number of crimes differs among studies, all estimates of offenses per criminal show a highly skewed distribution. This was first documented in Wolfgang et al.'s (1972) study of "chronic offenders" in a cohort of men born in Philadelphia in 1945 and has been replicated in other data sets, including the report of Tracy et al. (1985) on a 1958 Philadelphia cohort. The original Philadelphia study found that 18% of delinquents committed 52% of criminal offenses; the follow-up estimated that 23% of delinquents committed 61% of offenses. In addition, the Philadelphia study found that adult criminals come disproportionately from juvenile delinquents. Greenwood et al. 1996 estimate that
19 This will bias downward the number cormnitting crime and bias upward the estimated reduction in crime from incapacitation. Consider a non-institutional population of 100 with 100 crimes, which are committed by 25 people who commit 4 crimes each. Assume the jails hold 2 high-propensity criminals, who commit 50 crimes. The estimated population committing crimes would then be 2, whereas in fact it is 25. See Cohen and Canela- Cacho (1994) for analyses of the potential decline in the incapacitation effect as the number of prisoners grows.
3538 R. B. Freeman
in California, the upper half of the distribution of offenders in prison committed 10.6 crimes per year while those in the lower half of offenders committed 0.6 crimes per year. That a small group commits the bulk of offenses has impel led some analysts to examine the pay-offs to an incarceration strategy that would focus on that minority (Greenwood and Abrahamse, 1982).
The criminal participation rate and offense rates per criminal in (1) are truncated statistics, since they refer to the non-incarcerated population. For some purposes it is useful to consider the incarcerated criminals and active criminals as the relevant criminal population for analysis. If this population was roughly constant, incarceration would greatly reduce the number of crimes, particularly if society imprisoned chronic offenders. In fact, the massive 1970-1990s increase in the number of incarcerated persons in the US did not reduce the crime rate by anything like the amount that one would expect if there was a constant population of criminals (Zimring and Hawkins, 1991; Freeman, 1992). 2o The implicat ion is that the total supply of criminals varies with circumstances and thus that incarcerated criminals or their criminal actions were at least partially replaced in the market during 1970-1990. From the perspective of economics, the decline in the returns to crime associated with rising incarceration must have been offset by increases in the other incentives to commit crime - for instance, by falls in legitimate earnings relative to criminal earnings over this period.
3. Crime in a market context
Viewed through the lenses of the standard economic model of decision-making, indivi- duals choose between criminal activity and legal activity on the basis of the expected utility from those acts. I f Wc is the gain from successful crime, p the probabili ty of being apprehended, S the extent of punishment, and W is earnings from legitimate work, the decision-maker will choose to commit crimes in a given time period rather than do legitimate work when:
(1 - p ) U ( W c ) - p U ( S ) > u ( w ) . (2)
This equation has three implications for empirical analysis. , First, it implies that crime must pay a higher wage than legitimate activities. With
p & O, U(Wc) > U(W) only if Wc > W. As p rises the gap between Wc and W must increase to maintain the advantage of crime. Successful crime must pay off more the greater the ~c,hance of being apprehended.
Second, Ei~':, (2) implies that attitudes toward risk~ measured by the curvature of U, will
20 To see this, consider what a 1 million person increase in the number of incarcerated criminals would do to the crime rate if, say, each incarcerated person would have committed 12 crimes per year. Absent any replacement of these criminals, crimes would drop by 12 million. That the number of crimes did not drop by this amount implies that the non-incarcerated population replaced some of the crimes. Using calculations like this, Freeman (1996) shows that the "propensity to commit crime" by non-incarcerated persons rose sharply in the 1980s.
Ch. 52: The Economics of Crime 3539
influence the decision to commit crimes: risk averse persons will respond more to changes in the chances of being apprehended than to changes in the extent of punishment, holding fixed the expected net income from crime ((1 - p ) W c - p S - W) .
Third, and most important, Eq. (2) shows that the major factors that affect the decisions to commit crime - criminal versus legitimate earnings, the chance of being caught, and the extent of sentencing - are intrinsically related. Someone who accepts (2) as a valid description of the decision to commit crime cannot argue that tougher sentences will work to reduce crime whereas improvements in the legitimate opportunities of criminals cannot do so, and conversely.
Eq. (2) is a two activity, one period model that treats crime and legitimate work as substitutes. The model can be expanded in various ways to allow for: additional alloca- tions of time; 21 the effect of crime in one period on future legit imate and criminal earnings; the risk that a criminal is vict imized by other criminals; the degree of social opprobrium for crime, and, perhaps most important in light of empirical analyses, the possibil i ty that crime and legal work are not exclusionary acts. You can commit crimes while holding a legal job or can shift from crime to legal work and back again, depending on relative rewards. Still, there is a virtue to the simple equation: it highlights the major variables on which most empirical work focuses.
3.1. The market
The individual decision to commit crime is, of course, only the first part of any economic analysis. To get the supply of crimes and criminal part icipation equations for the popula- tion, aggregate (2) across individuals to obtain the supply curves of crime:
CPP = f ( W c , p , S, W ) or CPP = f ( 1 - p ) W c - pS - W ) , p ) , (3)
CPR = g(Wo,p , S, W) or CPR = g(1 - p)Wc - p S - W , p ) , (4)
where the first term represents the expected value of crime versus legal work, and p measures risk.Most empirical work on the economic determinants of crime estimates the response of crime or criminals with respect to each determinant variable separately rather than imposing the expected value structure on the data. In part this because the studies often concentrate on measuring one or another of the determinants of crime accurately, and risk getting poorer estimates for the variable of interest by imposing the expected value form on data when other elements may be badly measured.
The demand side of the crime market is a downward sloping relation between numbers of crimes and criminal earnings. Victimless crimes - drugs, prostitution, gambling - are
21 It is possible to expand the model in ways that make the predictions ambiguous. Block and Heinecke and Witte do this by allowing time spent in legal and illegal activities to enter the utility function directly. Witte and Schmidt do this by expanding the number of time outcomes. These expansions in turn lead to peculiar results when the utility function is subject to decreasing absolute risk aversion, such as predicting that increased unemployment lowers crime (because it lowers income, and thus willingness to undertake risky crimes).
3540 R. B. Freeman
normal consumer goods that consumers will buy less of when the price (a function of We) rises. But the amount of victims' crime should also be negatively related to Wc or to the expected reward to crime ((1 - p)Wc - pS - W) in a demand type relation. One reason is that additional crimes are likely to induce society to increase p or S, cutting the rewards to crime. Another is that as criminals commit more crimes, they will move from more lucrative crimes to less lucrative crimes.
An upward sloping supply curve to crime and downward sloping "demand" relation produce a market clearing level of crime and rewards to crime, comparable to the market clearing wages and employment for other occupations or industries. While the simple demand-supply framework fails to explain some important phenomenon, such as the concentration of crime in geographic areas or over time, or to allow for the adverse effect of crime on legitimate earnings, it has an important implication for the efficacy of mass incarceration in reducing crimes.
3.2. The market model and incapacitation
A major benefit of incarceration is that it removes criminals fi'om civil society so that they cannot commit additional offenses. Given the wide variation in crimes committed by criminals, incarceration of chronic offenders should have a particularly large effect in reducing crime. The reduction in crime due to incarceration is known as the incapacitation effect, and can be analyzed using a demographic accounting framework (see Greenwood, 1983; Blumstein et al., 1986). Arithmetically, if you lock up someone who commits, say, l0 muggings a year in a dark alley, and no one replaces that criminal in the alley, the number of muggings should drop by 10. 22
Until the US greatly increased its inmate population, most analysts viewed the incapa- citation effect as a powerful one: increase the number of inmates tenfold, as the US did from 1964 to 1994, and surely the crime rate would plummet. But estimates of the incapacitation effect over the 1977-1986 suggest that crime should have dropped to zero (Zimring and Hawkins, 1991) or at least have fallen more sharply than it did (Free- man, 1996a), whereas crime rates remained high. Something is evidently missing from the standard incapacitation analysis.
The market model tells us what is missing and directs attention to the additional information needed to assess more accurately the benefits of incapacitation. The standard incapacitation model implicitly assumes an inelastic supply curve to crime. With a zero elasti~ supply curve, an inward shift in the curve due to incapacitation reduces crime commensurate with the shift. But if the supply of crime has some positive elasticity, the effect of the shift will necessarily be less (see Fig. 3). In the extreme, an infinitely elastic supply curve to crime implies that locking up one criminal "creates" another criminal or increases the rate at which existing criminals commit crimes (A), so that incapacitation has no effect on crime rates. In terms of supply and demand, the impact of increased incapa-
22 Greenwood and Abrahtunse (1992) and Greenwood and Turner (198) provide more sophisticated analysis of incapacitation. Blumstein et al. (1978) National Academy of Sciences report also considers incapacitation in
Ch. 52: The Economics of Crime 3541
citation (A/) on the supply of criminals is:
A C = ~ l A l / ( e + ~1), (5)
where ~/ is the elasticity of demand for crime and • is the elasticity of supply of crime. From the perspective of Eq. (4), estimates of the effects of various incarceration stra-
tegies on crimes - such as the 1994 Rand analysis of Cal i fornia 's Mandatory Sentencing Law (Greenwood et al., 1994) - overstate the benefits of incapacitation. 23 Had these and other analysts considered the incapacitation effect in the context of a market model, they would predict more modest gains in crime reduction from incapacitation.
4. Evidence on the supply of crime
Most empirical research on the economics of crime focuses on factors that affect the supply of criminal activities. Some researchers stress the poor legitimate labor market opportunities of potential criminals - low hourly pay and high rates of joblessness (Freeman, 1996b; Grogger, 1997; and the literature reviews by Freeman, 1983, 1995; Chiricos, 1987). Others stress the deterrent effects of apprehension and penalization (Ehrlich, 1973; Levitt, 1997; Benson et al. 1994; and the literature review by Cameron, 1998). Yet others stress the effect of changes in the demand for crime, due say to increased demands for drugs, on criminal earnings. Empirical work has analyzed the relation between crime rates and its potential determinants over t ime and across areas (sometimes with fixed effects to focus on changes in variables within an area); and across individuals, often on a longitudinal basis. Studies of individuals include three major cohort studies gathered by criminologists years ago - two from Philadelphia and the Glueck study from Boston. 24 Paralleling other areas of labor economics, researchers have increasingly sought "instruments" - exogenous changes in factors that shift either supply or demand for crime - to identify response parameters in highly interdependent market models.
The bulk of the evidence indicates that the elements in Eq. (2) do in fact influence crime. Studies of the effect of legitimate opportunities on criminal behavior have focused on the presumed impact of unemployment and inequality in incomes on property crimes. Studies of the effect of sanctions on criminal behavior have concentrated on the effect of arrest rates and incarceration as deterrents to crime. Most studies of criminal incomes find that crime offers low skill men higher hourly wages than legitimate activities, though the often
23 The Rand study does not try to model the effects of deterrence. Thus, it is unclear whether its estimates of the total effects of incarceration are biased upward or downward.
24 Gluecks' Unraveling Juvenile Delinquency (Glueck, 1950). This is a longitudinal study of 500 delinquents and 500 matched controls constructed in 1939, consisting of white males aged 10-17 from several Boston neighborhoods who had been committed to juvenile correctional institutions, with controls from the Boston public schools.
3542 R. B. Freeman
intermittent nature of criminal work does not translate higher wages into higher annual incomes for criminals.
4.1. The effect of legitimate opportunities: unemployment
Much early work on the relation between the labor market and crime focused on the effect of unemployment on the level of crime, though unemployment is only one measure of how potential criminals fare in the legitimate job market. In general, these studies found that higher rates of unemployment (lower employment-population rates) are associated with higher levels of crime, but that the relation is not particularly strong. (Freeman, 1983) Chiricos' (1987) review, inclusive of studies done outside the US and of work in the early 1980s, gave a more positive assessment of the impact of unemployment on crime, noting stronger results for studies in the1970s than earlier periods.
Ensuing work has confirmed a relation between unemployment and crime. Most time series analyses find that crime rates rise with j oblessness. Cantor and Land (1985) reported a positive effect of lagged unemployment on crime. Land et al. (1990) showed that this relationship is stronger at the intracity level compared to intercity or national comparisons (see also Land et al. 1990). Examining 10-year changes in crime and economic conditions across 582 counties from 1979 to 1989, Gould et al. (1998) found that a one point increase in unemployment raised property crimes by 2.2%. Lee gives comparable results for 58 standard metropolitan statistical areas from 1976 to 1989 (an effect of unemployment on crime of 1.1 to 1.4%). Freeman and Rodgers (1999) report an elasticity for youths of crime to point increases of unemployment of 1.5% across states with the inclusion of state and time dummy variables. Engberg (1999) finds that areas of a city where employment falls have rising homicide rates.
As nearly all studies of crime rates across areas include unemployment in the local labor market as a covariate, an interesting way to assess the robustness of the unemployment- crime relation is to examine the estimated coefficients on unemployment in studies focused on other issues. In several studies using pooled time series cross-city data Levitt (1995, 1996, 1997) finds a positive relation between unemployment in an area and property crimes, including auto thefts, even after inclusion of both time and area dummy variables, but he also reports a negative relation between unemployment and violent crimes in some cases. In a study using pooled time series state data, he finds a strong link between unemployment and property crimes for both juveniles and adults, but finds little link between unemployment and violent crimes (Levitt, 1997). In another study, however, using city ~lgta, Cullen and Levitt report little relation between unemployment and crime. Butchdr and Pieht (1998) obtain a positive link in cross-area data but the relation disappears whenarea fixed effects are added to the analysis. Using data on individuals, however, they find a positive link between crime and local unemployment rates.
Even the largest estimated effects of unemployment rates on crime are much too small to explain the variation in crime. The time series fact is that between the 1960s and 1980s the crime rate rose massively while unemployment trended up just slightly. The area fact is
Ch. 52: The Economics of Crime 3543
that in any given period crime rates differ massively across SMSAs whose unemployment rates vary much less.
There is stronger support from data on individuals that crime is linked closely to unemployment. Nearly all studies find that persons prone to unemployment are more likely to commit crimes and that people who commit crimes are more likely to do so during spells of unemployment. Thornberry and Christenson (1984) find that in the 1945 Philadelphia cohort unemployment had significant effects on crime, largely for African American youths and youths from blue-collar backgrounds. Using the same data set, Witte and Tauchen (1994) found that employment (but not wages) was related to crime. Sampson and Laub (1993) re-analyzed data from the Gluecks' 1939 Boston cohort and found that measures ofj ob stability during early adult years (17-25) were inversely related to adult arrest rates for several crime types and that job stability during ages 25-32 had a significant negative effect on crime participation during later (32-45) adult years. Elliot (1994, Table 1) reports that persons who have engaged in "serious violent behavior" are more likely to terminate this if they are employed than if they are unemployed.
Farrington et al. (1986) used interview data from the Cambridge Study of Delinquent Development, a longitudinal study of 411 adolescent males, to show that property crime rates were higher when subjects were unemployed, but that crime was more likely only among unemployed youths who held attitudes more favorable to offending. Those who generally were law-abiding did not commit crimes during periods of unemployment. The crime- unemployment relationship was also stronger among youths with histories of low statusj obs.
Studies with ex-offenders also show that unemployment (and legal earnings) affects crime. In the Transitional Aid Research Project (TARP), a randomized experiment that tested the effects of income supports for ex-offenders from Texas and Georgia released from prison in 1976-1977 (Rossi et al., 1980). Needels (1994) found that employment and (legal) earnings have strong significant negative effects on subsequent crimes following release from prison: in a ten year follow-up of Georgia releasees, criminal activity was markedly lower among those with higher legal earnings.
Thus, unemployment is related to crime, but if your prior was that the relation was overwhelming, you were wrong. Joblessness is not the overwhelming determinant of crime that many analysts and the public a priori expected it to be. Why?
4.2. The porous boundary between legal and illegal work
Perhaps the major reason is that crime and legitimate work are not exclusive activities. Eq. (2) makes the crime/legitimate work decision a dichotomous one, but this is an over- simplification. The border between illegal and legal work is porous, not sharp. Some persons commit crimes while employed - doubling up their legal and illegal work. Some persons use their legal jobs to succeed in crime (Myers, 1983). Some criminals shift between crime and work over time, depending on opportunities. Fagan and Freeman (1997) review a number of studies that show the doubling up of crime and work at a moment in time and the movement of persons who commit crimes between crime and
3544 R. B. Freeman
work over time. These studies find that even experienced drug dealers often hold legal jobs, possibly to tide themselves over during periods when the drug business is especially dangerous; that youths shift between crime and work with some regularity; and that employment has only a modest effect on whether or not they commit any crime. Using the NLSY, Freeman has shown that among youths who report committing crimes, only those on the verge of incarceration have greatly reduced legitimate employment.
This conclusion is supported by ethnographic work that finds that many youths view crime and legal work as valid ways to make money and choose one or other depending on market opportunities. Anderson (1990, 1994) describes how young males in inner city Philadelphia regard the drug economy as a primary source of employment, and how their delinquent street networks are their primary sources of status and social control. Hagedorn (1988, 1994a,b), Padilla (1992, 1993), and Moore (1992) offer similar descriptions for various ethnic groups in different cities. Participants in the illegal economies in these studies regularly engage in a variety of income-producing crimes, including drug selling, fencing, auto theft, petty theft and fraud, commercial extortion, and residential and commercial burglary and in legal work as well. Young inner city men use the language of work ("getting paid," "going to work") to describe their crimes, z5 Sanchez-Jankowski (1991) argues in fact that an "entrepreneurial spirit" is the "driving force in the work view and behavior of gang members" (p. 101) that pushes them to engage in the profitable world of drug sales or auto theft. Bourgois (1989), on other hand, stresses the importance of non-pecuniary factors, claiming that drug dealers prefer the "more dignified workplace" of drug selling than the low wages and "subtle humiliations" of low level legal jobs (p. 41).
One interpretation of the porous boundary between crime and legitimate work is that young offenders are engaged in an active process of income optimization, taking advantage of economic opportunities that present themselves. Decentralized drug markets or numbers running offer youths the chance to earn income through occasional work at hourly rates higher than conventional secondj obs, making it attractive even for those with full-time legal work to shift over. Fagan (1992, p. 121) points out that drug dealers may even have incentives to hold legal jobs while earning higher incomes from drug sales: expanding networks of contacts, building some legitimate work experience for the future, and devel- oping an escape route should legal or social pressures push them out of the business. Free- man (1995) applies an ecological model of foraging animals to crime-prone youth: they wander city streets with a reservation wage for crime and a reservation wage for legal work, and.undertake either act when the potential benefits exceed the relevant reservation wage.
All of this work has one important implication for the economics of crime: it suggests but does not prove that youths shift sufficiently readily between legal and illegal work so as to make the ~lasticity of the supply of crime quite high.
25 See, for example: Sullivan (1989), Padilla (1992), Taylor (1990), Williams (1989). Felix Padilla describes bow gang members in a Puerto Rican Chicago neighborhood regarded low-level drug sellers in their gang as "working stiffs" who were being exploited by other gang members.
Ch. 52: The Economics of Crime 3545
4.3. The effect o f legitimate opportunities: earnings inequality and legitimate earnings
From the 1973 through the 1990s the real earnings of the less skil led young men who constitute the bulk of the crime-prone population fell, while income inequality rose greatly. According to (2) this should have increased the rate of crime. Falls in legitimate earnings reduce the payoff to legal work (W). Assuming that wages from crime depend posit ively on the income of the higher paid (the more they have the more the criminal can steal), increases in the wages of the higher paid will also add to the payoff to crime. But rises in inequality that are associated with increases in the real income of both groups may have no such effect, and even when incomes rise at the top and fall at the bottom, the higher paid may respond to increased crime by taking more protective actions, such as moving to gated communities, installing security systems, and the like, which will part ial ly offset the effects of inequality on crime.26 The magnitude of the worsened job market opportunities for less skilled young men and rise in inequality were sufficiently large to suggest that they could have played a major role in the increase in criminal activity.
Studies that have examined the relation between inequality and cr ime generally find that more inequali ty is associated with more crime (see the reviews by Chiricos, 1987; Freeman, 1983, 1994). Land et al. (1990) even report that homicide rates are correlated with measures of inequality across cities. Lee (1993) found a substantive positive relation between inequal- ity and crime rates across SMSAs in 1970 and 1980. His estimated effect of inequality on crime suggests that the increased inequality in the 1980s induced a 10% increase in the UCR but this relation disappeared with the inclusion of area fixed effects. In the most extensive study to date, Gould et al. (1998) have found a strong link between the wages paid to low skill workers, measured in a variety of ways, and crime. Using a pooled cross-section time series design across counties and states, they report elasticities of property crime to the pay of low skilled workers ranging from - 0.31 (retail income per retail worker) to - 1.0 (mean wages of non-college men, inclusive of dummy variables for area and time.
Studies that focus on responses to legitimate earnings, or perceptions thereof, find that higher legal earnings reduce crime. In its 1980 crime module the NLSY asked respondents the proportion of their income that came from illegal activity. Holding fixed time worked at legitimate jobs, and the number of crimes committed, persons who report that much of their earnings were i l legal should have relatively higher i l legal hourly pay than legitimate pay than persons who made only a small proportion of their income from crime. They should thus be more deeply involved in crime, and all else the same, more likely to end up incarcerated in the future, as turns out to be case (Freeman, 1995; Fagan and Freeman,
26 The expected value of crime is (1 -p)Wc - p S - W. Assume that We depends proportionately on the earnings of higher paid (H): W~ = vH, where v < 1; and that the sanction depends proportionately on the legal earnings of the criminal (uW). Then the expected value of crime is (1 - p)vH - (pu + 1)W. Since H is multiplied by a factor less than 1 while Wis multiplied by a factor greater than 1, equal proportionate increases in H and W will reduce the present value of crime. Thus a rise in inequality with both H and W increasing would have to be relatively large to offset the bigger impact of changes in W than in H in this equation.
3546 R. B. Freeman
1997). 27 Grogger (1997) estimated an econometric model of the crime behavior of young men in the NLSY that suggests that youth part icipation in crime has an elasticity with respect to wages of 0.6-0.9. This is sufficiently high to suggest that much of the 1970- 1980 rise in the arrest rates of youths can be attributed to the fall in their real wages. Using the NBER Inner City Youth Survey, Vicusi, 1986a,b found that perceptions of risk combined with earnings opportunities influenced the supply of young blacks to crime. With the same data set, Freeman (1987) reported a significant positive relation between criminal part icipation and whether individuals perceived that they could earn more on the street than in the job market.
In sum, while we need better information on i l legal earnings to pin down the respon- siveness of crime to the net return to crime, the information we do have suggests that the elasticity of the supply of offenses is reasonably high.
4.4. The effect o f sanctions 2'~
The extent to which sanctions deter crime is a major topic. The bulk of the research suggests that penalties work in the predicted direction. Beginning with Ehrlich (1973), many studies have related offenses across areas or t ime to arrests per offense as indicators of p in Eq. (2). These studies invariably find that the number of offenses is negatively related to arrests per offense. They suffer, however, from ratio bias due to the measurement error in crime rates; and simultaneity bias due to the potential feedback of the number of offenses on arrests per offense. Both of these problems are l ikely to create a negative relation between crimes per capita and arrests per c r i m e Y Since police invariably make arrests, moreover, changes or differences in the number of police ought to affect crime similarly as arrests per crime. But most studies that relate the number of police per capita to the number of" offenses per capita find little effect (see the reviews by Marvell and Moody, 1997; Cameron, 1998). Here too, the real relation - if any - may be distorted by measurement error (increased police may mean increased reporting of crime) and simul- taneity (when crimes rise, citizens are likely to hire more police). Fisher and Nagin (1978) have stressed the econometric problems of identifying the supply of crime curve and the effects of sanctions in most 1970s empirical studies.
Despite the potentially great impact of measurement etxor on the relation between arrest rates and crime, only Levitt (1995) has tried to assess the magnitude of the bias. Using a panel of large US cities, he regressed the number of crimes of different types on arrests per crime using a difference format, in which he varied the length of the differences. Since
27 Because~the NLSY has never repeated the crime module, evidence on future crime behavior is limited to whether or not t}~e-responddnt was interviewed in jail or prison.
a81 have benefited from reading Daniel S. Nagin "Criminal Deterrence Research at the Outset of" the Twenty- first Century" Crime and Justice, 1998.
29 Random measurement error will produce a negative correlation between crimes and arrests per crime because the error will change crimes and 1/crimes in opposite directions. The simultaneity bias will also be negative since an exogenous increase in crime reduce arrests per crime but is unlikely to affect arrests, which may depend on a relatively fixed number of police.
Ch. 52: The Economics of Crime 3547
longer run differences should be less affected by measurement error, a significant amount of measurement error should show up in a falling absolute value to the coefficients on arrests. Fail ing to find such a pattern, he concludes that "there is little evidence that the use of reported crime rates induces a substantial bias in the est imated effects of arrest rates" (pp. 14-15). I f detailed geographic data were available from the vict imization survey, we might be able to probe this issue further, using the vict imization measure of crime by itself or as an instrumental variable to correct for measurement errors.
An alternative way to deal with the measurement problem is to measure sanctions relative to the total population rather than to crimes. Levitt (1997) examines the depen- dence of juvenile and adult crime rates not only on the numbers of juveniles or adults in custody per crime but on the number of juveniles or adults in custody per juvenile or adult. Replacing crimes with persons in the divisor of the sanction measure eliminates the ratio bias from having the crime rate on one side of the equation and its inverse on the other side. Using a pooled cross state t ime series data set, with dummy variables for year and state, and separate state-level trends, Levitt finds that delinquents in custody per juvenile and adults in prison per adult reduce the relevant crime rates, and that the difference between the sanctions given to youths and adults helps explain changes in the crimes committed by youths as they age and become adults. Crime rates rise less rapidly (or fall) with age in states which put relatively large numbers of adults in custody compared to youths in custody than in states which put fewer adults in custody relative to youths. Thus, differences in the extent of sanctions in the juveni le justice system relative to the adult justice system helps explain differences in the rate of youth crime relative to adult crime.
The main way of identifying the effect of sanctions on the supply of crime is to find factors that exogenously shift sanctions.
At one extreme are studies of crime rates in the wake of strikes by police or other sharp declines in the possibil i ty of being caught for criminal activity, such as riots in cities or in the case of one Danish study (Andenaes), the arrest of the Copenhagan police force by the Nazis. These studies show that huge drops in the number of pol ice are associated with large increases in crime (University of Maryland, Department of Criminology and Crim- inal Justice, 1997, Fig. 8.1). For instance, bank robberies and burglaries zoomed in Montreal when that city suffered a police strike in 1979 (Clark, 1969). It is reassuring to know that sanctions work in the extremum, but the behavior identified in these studies is presumably far from the responses of potential criminals to more modest policy-relevant changes in sanctions.
Police crackdowns of various sorts, which raise the probabil i ty of apprehension for particular crimes, offers another potential way to identify the effects of sanctions on crime. 3o Sherman's (1990) review concluded that the increased police effort had an initial deterrent effect which declined over time, as the temporary nature of the crackdowns
30 ff the police decision to crack down on particular crimes is motivated by the likelihood that cracking down on that crime will have an especially large effect on crime, one cannot generalize the effects to other crimes.
3548 R. B, Freeman
became clearer to potential offenders. While it is possible that crackdowns on one crime have a displacement effect on others - leading criminals to shift from say drug sales to robbery, it is also possible that some crackdowns reduce crime more generally. In fact, studies that try to measure the possible sanction-induced displacement of crime geogra- phically or to some other crimes invariably find that displacement effects are modest (Clarke and Cornish, 1985; Hesseling, 1995; Levitt, 1995), and in some cases that it is positive (Sampson and Cohen, 1988).
Marvell and Moody (1996) and Levitt (1996) have used different identification strate- gies to try to determine the effect of increased policing in reducing crime. Marvell and Moody exploit the time sequencing of the link between the number of police and crime (it is difficult to increase the police ranks rapidly in response to crime) and find a significant inverse relation: more police reduces crime. Levitt uses the fact that around election years, cities hire more police, to measure the exogenous change in policing and finds that the number of sworn officers instrumented on elections reduces most categories of crime. Both Marvell and Moody (1994) and Levitt (1995) have also examined the sanction of increased incarceration on crime and also obtain significant effects for sanctions, again using different identification strategies. Here, Levitt exploits the fact that overcrowding of prisons forced some states to let some prisoners out early, while Marvell and Moody exploit the fact that increases in crime do not show up quickly in increased prison popula- tions.
A very different way of testing the deterrent effect of sanctions is to examine links between how individuals perceive the risk of being sanctioned and their criminal behavior. One set of studies has found that self-reported criminality is lower when individuals perceive a greater risk from crime (see the review by Nagin, 1998, pp. 62-71). For example, on the Boston Youth Survey, youths who do not commit crimes report a much higher probability that they will suffer from crimes than other youths. But cross- section contrasts do not show how the effect of changing sanctions influence the decision of any youth. Scenario-based studies provide a way to address this problem. These studies present individuals with carefully described situations and then ask them how they would behave and how they perceive the risk of sanctions in that situation. By artfully varying circumstances among randomly selected respondents, one can make reasonable deduc- tions about the relation between perceived sanctions and responses. The main finding is that perceived risk is associated with smaller illegal activity (Nagin, 1998).
"But perhaps the strongest support for the notion that perceived sanctions affect behavior occurs every April 15, when citizens fill in their tax forms. Compliance rates are high for wage and sa!ary earnings where the IRS receives W2 forms) but not for cash income from the "grey" edonomy (Kagan, 1989).
Yet another way to examine the deterrence of sanctions is to contrast the future crime behavior of young persons who are differentially sanctioned for initial offenses. Three studies that have followed the careers of serious juvenile offenders report that the more serious the penalties imposed on the juveniles, the less likely were they to be apprehended from crimes in ensuing years (Murray and Cox; Empey and Lubeck; Empey and Erickson,
Ch. 52: The Economics of Crime 3549
cited by Wilson, 1998), though whether this caused them to deter from crimes or simply made them more careful criminals was never established (Wilson, 1998).
In short, as far as we can tell, sanctions work, though the est imated magnitude of the sanctions effect varies across studies, possibly reflecting differences in the situations where sanctions are applied.
4.5. Social interactions and the geographic concentration o f crime
Crime is highly concentrated in certain geographic areas and among certain types of people, and rises and falls over t ime in waves. In 1995, for instance, the FBI crime index per hundred thousand persons varied among metropoli tan areas from 12,319 for Miami, Flor ida to 2196 for Wheeling, West Virginia. Similarly, within cities, crime is concentrated in a l imited number of areas or precincts. It is difficult to account for the concentration of crime across areas or over time in terms of standard demographic vari- ables or measures of incentives. These variables do not differ enough across areas to explain more than 30% or so of the geographic variation in crime (Glaeser et al., 1995).
Social interaction models that posit that individual behavior depends not only on the incentives facing the individual but also on the behavior of the individuals ' peers or neighbors offer one promising way to explain the concentration of crime by area and over time. Given the same expected return from crime, you may be more l ikely to commit crime if your peers commit crime than if they do not commit crimes. Your decision, in turn, affects their behavior. As a result, social interaction models build in a "behavioral multiplier" that can blow up elasticities of individual responses to explain the excessive variation in crime rates across areas or time.
Glaeser et al. (1995) have shown that a relatively simple interaction model fits the geographic variation in crime rates reasonably well across cities and among precincts in NYC as well. Empirically, they show that the sample variance in crime rates (corrected for observable differences among areas) far exceeds the variance one would expect if deci- sions to commit crimes were independent. They develop a one parameter interaction model that produces a covariance in decisions and fits the geographic data for serious crimes. Estimating the same model for murder and rape, suicides, deaths from cancer, among other outcomes, they find little evidence for social interactions: the sample variance for these variables are reasonably well explained by a standard Poisson model.
Sampson et al. (1997) examine the ability of a social interactions model to explain variation in crime rates across areas in a different way. Interviewing nearly 8800 residents in 343 neighborhoods, they asked residents whether in their neighborhood people "can be trusted.., share the same values ... get along with one another" and whether neighbors can be counted on to intervene when children are acting up. They use the responses to create an index of "collect ive efficacy" - the informal social controls that operate through interac- tions of neighbors - and find that this index helped explain a large proportion of the variation of perceived and actual crime across neighborhoods. Consistent with their find- ing, an earlier study of crimes among Baltimore blocks found that membership in volun-
3550 R. B. Freeman
tary organizations are associated with less violent crime block by block (Taylor et al., 1984).
Still, the evidence in neither of these studies is decisive. Glaeser et al. (1995) do not prove that the excess variation in crime rates is due to interactions; they interpret the excess variance through a social interaction lens.. Sampson et al. (1997) do not prove that the causality runs from collective efficacy to crime. Perhaps some other factor creates differences in crime across neighborhoods which itself may create the attitudes that under- lie collective efficacy.
But there is complementary ethnographic evidence on the role of youth gangs in crime that lends support to a social interaction interpretation of the crime data. Gangs are an important social institution in the US. The 1995 National Youth Gang Survey reported that over 665,000 young Americans were in gangs (Moore, 1996). Much illegal work is organized within ethnic gangs that combine economic and cultural interests, often in very narrow geographic areas. In Boston, for instance, virtually all youth gangs are found in an area of 1.7 square miles, about 4% of the cities area.(Kennedy et al., 1996). The Rochester Youth Study found that gang members commit a disproportionate share of serious crime and that youths commit twice as many crimes when they are members than when they are not members (Thornberry and Christenson, 1984).
Ethnographers have documented how gang members remain longer in the gang in the 1990s than in earlier years, assuming leadership roles and manipulating the gang for their own economic advantage through perpetuation of gang culture and ideology (Moore, 1996). Chin and Fagan (1994) describe the complex economic relationship between street gangs and adult social and economic institutions in three Chinatown neighborhoods in New York City. The adult groups, descendants of the tongs that were the shadow govern- ments in Chinatown a century ago, are involved in both legal social and business activities and a variety of illegal businesses that employ street gangs. The gangs guard territories and act as surrogates in violently resolving conflicts and rivalries between the adult groups. Chin (in press) concludes that the gangs prosper economically while functionally main- taining the cultural and economic hegemony of these ambiguous adult leadership groups. Moreover, the gangs are involved in a variety of income-producing activities, especially commercial extortion, that are shielded from legal pressures by cultural processes that tolerate and integrate their activities into the social fabric of everyday life in Chinatown. Taylor (1990), describing drug gangs in Detroit, and Padilla (1992) also talk about the use of haoney rather than violence as social control within African American and Latino drug selling gangs if a worker steps out of line, he simply is cut off from the business, a punishment~ more salient than threats to physical safety. Drug selling groups function as economic uni~:S with m~nagement structures oriented toward the maintenance of profit- ability and efficiency.
Finally, we can infer from the behavior of parents, who often move to suburbs or take other actions to prevent their children from interacting with youth gangs or juvenile delinquents, that social interactions matter a lot.
Ch. 52: The Economics of Crime
5. Does crime pay? criminal earnings and risk
3551
The economic model suggests that, as long as individuals on the margin of crime are not risk- loving, crime should pay for those who choose it in the sense that (a) the earnings from successful crimes should exceed those from legitimate work; and (b) the discounted present value of crime, taking account of the risk of arrest and incarceration should exceed the discounted present value of legitimate work; while the discounted values adjusted for risk should be equal on the margin. By putting the crime decision into an expected utility frame- work, the model directs attention at the risk attitudes of persons on the margin of crime.
Since criminals are disproportionately less educated young men from troubled homes and disadvantaged minority backgrounds, they have low legitimate earnings prospects. Whether these youths make more from crime on an hourly, annual, or lifetime basis than they could or do make from legitimate work is difficult to determine, largely because information on criminal earnings are scattered and poorly measured, but also because their legal work record is often intermittent as well. Most data on criminal earnings comes from self-reports, whose accuracy is questionable. Most crime is self-employment, creating problems of valuations of non-cash exchanges, discounts in fencing stolen goods, net and gross incomes from drug sales, and so on. Some studies, like the NLSY, ask respon- dents only for the proportion of their income from crime, presumably on the notion that they could not accurately estimate actual earnings. Some studies of drug dealer, by contrast, ask for rather detailed information on criminal earnings and costs (MacCoun and Reuter, 1992; Fagan, 1993). The hours spent on crime are, if anything, even harder to pin down than the hours self-employed persons work at legitimate jobs. Subject to data problems, almost all analyses conclude that crime pays a higher hourly rate than legitimate work but that the work from crime is sufficiently intermittent and risky that annual crime incomes may be lower than the annual income the criminal could get from legal work. The combination of crime and legal work potentially provides higher annual income than either activity by itself for those who engage in crime.
The 1980 NBER survey of young black men in three cities (Freeman and Holzer, 1986; Vicusi, 1986b) found that annual crime incomes were $1607 in 1980 dollars. But because of the skew in crime incomes, crime income was a substantial income supplement for many youths. 31 The 1989 Boston Youth Survey found self-reported annual earnings that ranged from $752 for infrequent offenders to $5376 for youths committing crime at least once a week, with an average of $1607 (Freeman, 1991). Hourly rates varied from $9.75 for frequent offenders to $88 for infrequent offenders, suggesting a diminishing return ti'om criminal activity. Average hourly wages from crime were $19. All these estimates exceed the average legal wage of $7.50 that these young men reported, and their potential after tax take home pay of $5.60 per hour. Grogger estimates illegal incomes from the NLSY by multiplying respondents' reports of the fraction of their income they attributed
31 Thompson and Cataldo (1986) question the veridicality of self-reports in their criticism of Vicusi's (1986a) analysis.
3552 R. B. Freeman
to crime by their total income and obtains an average annual crime income in 1979 of $1187.
The Reuter et al. (1990, p. viii) survey of convicted drug dealers in Washington DC showed that "drug dealing is "much more profitable on an hourly basis than are legitimate jobs available to the same persons". The dealers reported net (mean) monthly income of $1799 from drugs and $215 from other crimes, which projects to an annual crime income of $25,000, and an implied hourly rate of $30 (see also MacCoun and Reuter, 1992). 1 These figures compare with mean legal wages of $1046 per month, or median legal monthly earnings of $715 for the 75% who reported such income. Drug incomes also exceeded legal (work) incomes by a wide margin in Fagan's study of drug users and dealers in two northern Manhattan neighborhoods in New York City (Fagan, 1992, 1993). As in the Washington DC sample of male dealers many drug sellers combined legal and illegal work in these two neighborhoods. Hagedorn (1994) finds that gang members in Milwaukee had a wide range of drug incomes. One in five (20.7%) earned the equivalent of $7-12 per hour, and one in four (28.7%) reported drug incomes in the range of $13-25 per hour, or $2000-4000 per month. A few (three of the 73 sellers) reported "crazy money" (more than $10,000 per month) at some time in their drug selling careers. Mean monthly drug sale income was $2400, or about $15 per hour, compared to legal monthly incomes of $677. 2
In contrast to these studies, Wilson and Abrahamse (1992) estimated that criminals earn less per hour than other workers. They used Victimization Survey data on average losses by victims to estimate the earnings from crime among prison inmates in three states to estimate hourly or yearly wages. Summing across eight crime categories, they reported annualized crime incomes of $2368 (in 1988 dollars) for burglars and thieves with mid- level offending rates. For high-rate burglars and thieves, crime incomes were $5711. Only for high rate offenders did crime incomes exceed work incomes.
Studies that ask young persons whether they can make more money by legal or illegal means support the notion that crime pays a higher wage than legitimate earnings. In 1980 the NBER Inner City Youth Survey asked youths in Boston, Chicago, and Philadelphia whether they thought they could make more "on the street" than in a legitimate job. It also asked them about their perceptions of the availability of criminal opportunities. The 1989 Boston Youth Survey, conducted at the peak of the booming "Massachusetts Miracle" job market, asked the same questions. Between these dates, the proportion of youths who
\ , .
reported that they could earn more on the street went up, from 31% in the three cities and 41% in Boston in 1980 to 63% in Boston in 1989. Similarly, the proportion who said they had "chanb~s to make illegal income several times a day" roughly doubles over the period, to reach nearly'50% in 1989 (Freeman, 1992). Huff (1996) reports a reservation wage of $30 per hour to abandon illegal work, indicating that inner city youths see a large premium to illegal work.
The risk of penalties and the extent of penalties also enter Eq. (2). Not only are crime returns foregone if the criminal is incarcerated, but opportunities for legal earnings also are lost. Moreover, if incarcerated, earnings upon release are lower, either because the ex-
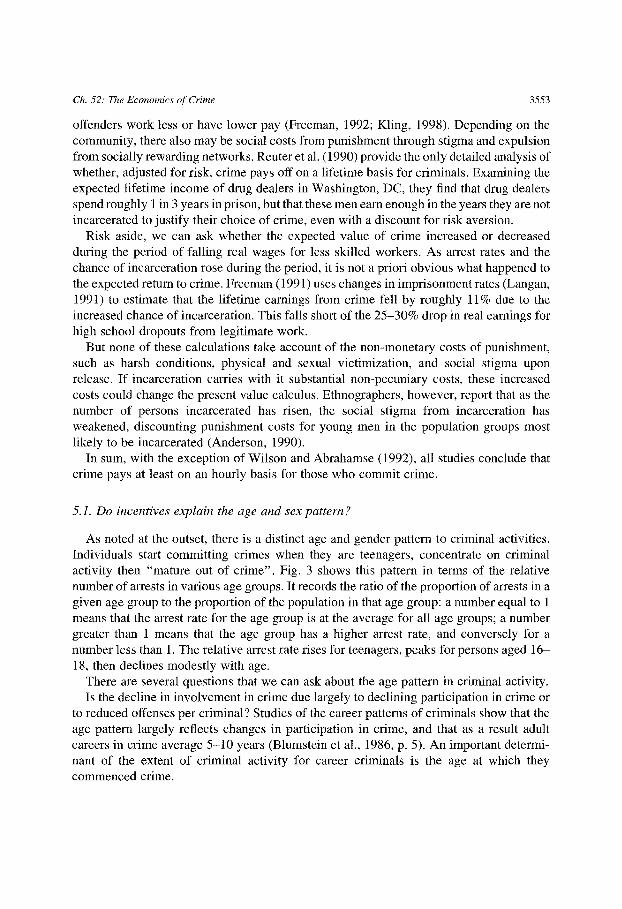
Ch. 52: The Economics of Crime 3553
offenders work less or have lower pay (Freeman, 1992; Kling, 1998). Depending on the community, there also may be social costs from punishment through stigma and expulsion from socially rewarding networks. Reuter et al. (1990) provide the only detailed analysis of whether, adjusted for risk, crime pays off on a lifetime basis for criminals. Examining the expected lifetime income of drug dealers in Washington, DC, they find that drug dealers spend roughly 1 in 3 years in prison, but that these men earn enough in the years they are not incarcerated to justify their choice of crime, even with a discount for risk aversion.
Risk aside, we can ask whether the expected value of crime increased or decreased during the period of falling real wages for less skilled workers. As arrest rates and the chance of incarceration rose during the period, it is not a priori obvious what happened to the expected return to crime. Freeman (1991) uses changes in imprisonment rates (Langan, 1991) to estimate that the lifetime earnings from crime fell by roughly 11% due to the increased chance of incarceration. This falls short of the 25-30% drop in real earnings for high school dropouts from legitimate work.
But none of these calculations take account of the non-monetary costs of punishment, such as harsh conditions, physical and sexual victimization, and social stigma upon release. If incarceration carries with it substantial non-pecuniary costs, these increased costs could change the present value calculus. Ethnographers, however, report that as the number of persons incarcerated has risen, the social stigma from incarceration has weakened, discounting punishment costs for young men in the population groups most likely to be incarcerated (Anderson, 1990).
In sum, with the exception of Wilson and Abrahamse (1992), all studies conclude that crime pays at least on an hourly basis for those who commit crime.
5.1. Do incentives explain the age and sex pattern ?
As noted at the outset, there is a distinct age and gender pattern to criminal activities. Individuals start conmaitting crimes when they are teenagers, concentrate on criminal activity then "mature out of crime". Fig. 3 shows this pattern in terms of the relative number of arrests in various age groups. It records the ratio of the proportion of arrests in a given age group to the proportion of the population in that age group: a number equal to 1 means that the arrest rate for the age group is at the average for all age groups; a number greater than 1 means that the age group has a higher arrest rate, and conversely for a number less than 1. The relative arrest rate rises for teenagers, peaks for persons aged 16- 18, then declines modestly with age.
There are several questions that we can ask about the age pattern in criminal activity. Is the decline in involvement in crime due largely to declining participation in crime or
to reduced offenses per criminal? Studies of the career patterns of criminals show that the age pattern largely reflects changes in participation in crime, and that as a result adult careers in crime average 5-10 years (Blumstein et al., 1986, p. 5). An important determi- nant of the extent of criminal activity for career criminals is the age at which they commenced crime.
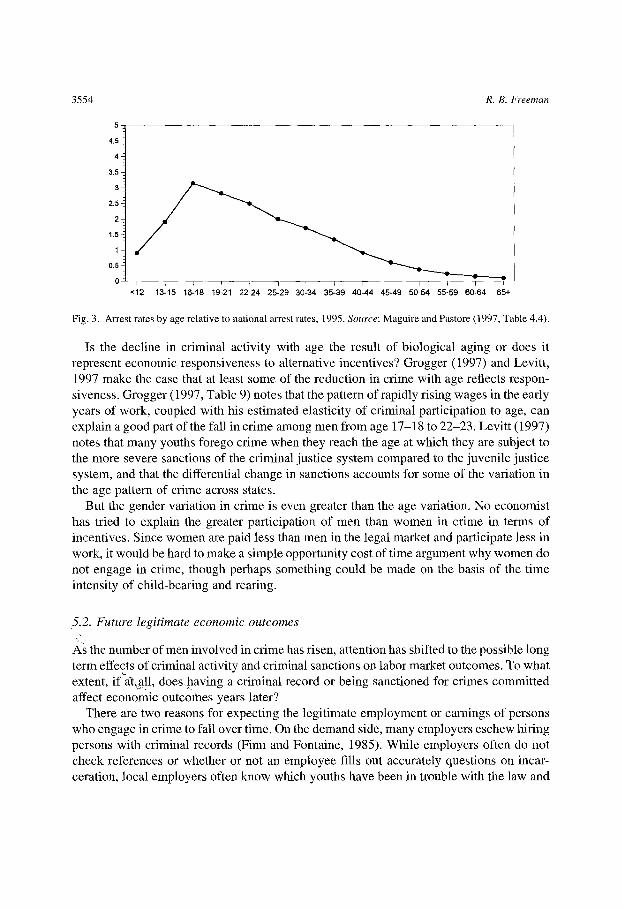
3554
5 -
R. B. Freeman
4.5-
4
3 .5-
2.5 - 22
1.s-~ 1 2
0.s~
<12 13-15 19-21 30-34 16-18 221-24 253-29 35139 40~44 45-49 50!54 55-59 60-64 65+
Fig. 3. Arrest rates by age relative to national arrest rates, 1995. Source: Maguire and Pastore (1997, Table 4.4).
Is the decline in criminal activity with age the result of biological aging or does it represent economic responsiveness to alternative incentives? Grogger (1997) and Levitt, 1997 make the case that at least some of the reduction in crime with age reflects respon- siveness. Grogger (1997, Table 9) notes that the pattern of rapidly rising wages in the early years of work, coupled with his estimated elasticity of criminal participation to age, can explain a good part of the fall in crime among men from age 17-18 to 22-23. Levitt (1997) notes that many youths forego crime when they reach the age at which they are subject to the more severe sanctions of the criminal justice system compared to the juvenile justice system, and that the differential change in sanctions accounts for some of the variation in the age pattern of crime across states.
But the gender variation in crime is even greater than the age variation. No economist has tried to explain the greater participation of men than women in crime in terms of incentives. Since women are paid less than men in the legal market and participate less in work, it would be hard to make a simple opportunity cost of time argument why women do not engage in crime, though perhaps something could be made on the basis of the time intensity of child-bearing and rearing.
5.2. Future legitimate economic outcomes
".ix As the number of men involved in crime has risen, attention has shifted to the possible long term effects of criminal activity and criminal sanctions on labor market outcomes. To what extent, ifal\a!l, does..having a criminal record or being sanctioned for crimes committed affect economic outcomes years later?
There are two reasons for expecting the legitimate employment or earnings of persons who engage in crime to fall over time. On the demand side, many employers eschew hiring persons with criminal records (Finn and Fontaine, 1985). While employers often do not check references or whether or not an employee fills out accurately questions on incar- ceration, local employers often know which youths have been in trouble with the law and
Ch. 52: The Economics of Crime 3555
have gone to prison. On the supply side, individuals who are sent to prison may increase their criminal human capital (Myers, 1983) while their legitimate work skills depreciate.
Freeman's studies of the effects of criminal activity on the labor market outcomes for youths in the NLSY, NBER Inner City Survey, and Boston Youth Survey found that incarceration was significantly linked to lower future employment and weeks worked, though they do not tell us whether the link is due to the sentencing or to the fact that only youths deeply involved in crime are incarcerated. In the NLSY young men who were incarcerated worked around 12 weeks less per year as other young men over an ensuing seven year period, giving a 25% lower rate of work activity. In the NBER Inner City Survey, weeks worked dropped sharply for the same men after incarceration compared to their weeks worked before incarceration. In these data sets other lesser brushes with the law - arrest, probation - had little effect on employment and earnings. One reason for the huge incarceration effect in the NLSY is that persons incarcerated have a high probability of engaging in crime again and being re-incarcerated and thus not able to work even if they wanted to do so. But even among non-institutionalized young men, those who have been to jail/prison have lower employment rates than others and a lower rate of employment than they had before going to jail or prison (Fagan and Freeman, 1997).
Other studies, using different data sets tell somewhat different stories. Bushway's (1996) analysis of the National Youth Survey 32 found adverse effects from being arrested on both weeks worked and weekly earnings. Within three yem's of an arrest, respondents who were arrested worked seven weeks less, and earned $92 per week less, than would otherwise be expected without an arrest (Bushway, 1996, p. 35). Grogger (1995) merged longitudinal arrest records from the California correctional system with unemployment insurance earnings records to examine the effects of arrests and sanctions on male employ- ment and earnings. Men who were arrested, convicted, or sent to jail or prison had lower earnings and employment than others, but these relations diminished greatly with the addition of individual fixed effects, implying that arrests reduce future legal wages more in the short-term than in the long run. In the fixed effect model, the adverse impact of jail and prison on employment falls overt time but the adverse impact on earnings was stable over a six quarter period. Workers who went to prison had about a 20% lower earnings than others, while those who went to jail experienced about a 15% lower earnings (Table III compared to Table I means). Using the NLSY, Grogger, 1995 attributed about one-third of black-white differences in non-employment to the effect of arrests on future employment. Waldfogel (1992) finds a large effect of incarceration on earnings and employment; while Nagin and Waldfogel (1995) find a positive effect of conviction on employment in a sample of British youths. Kling (1998) links information on defendents in federal courts to unemployment insurance records in California to contrast employment and earnings for a three year period before and after time served in prison. In a sample where only a third of the population is employed in a quarter, he finds that imprisonment of various lengths has only a modest depressent effect on employment of at most 0.03 points
:~2 This is a longitudinal study with a representative sample of 1725 adolescents who were 11-17 years of age in 1976 (Elliott et al., 1989).
3556 R. B. Freeman
while having a much larger effect on earnings in a quarter, ranging from 23 to 31%. But since the UI does not include hours worked, it is possible that the large earnings effect may reflect in part changes in hours worked.
The negative earnings effect is more pronounced among white collar criminals, who earn 10-30% less 5-8 years after release than those convicted but not incarcerated. And there is evidence that conviction affects legitimate earnings as well. Lott (1992b) finds that conviction for embezzlement and larceny reduces the future legitimate incomes by about 40%, while Lott (1993a) shows even greater drops in legitimate income, presumably due to reduced time in legitimate work, for persons convicted of drug dealing.
Studies that link involvlement with the criminal justice system to future outcomes suffer from one potential omitted variable problem. Personal characteristics unobserved in the data may affect both sentencing and furore labor market performance. Judges may, for instance, give probation to one young person and a prison sentence to another because the youths differ in unobserved ways that will affect job market success. Kling deals with this problem by exploiting the fact that different judges have different sentencing strategies. Since cases are randomly assigend to judges, judges can be used as an instrumental variable for sentences. A "harsh" judge will give a tougher sentence than a "soft" judge to otherwise similar criminal defendants. This provides the exogenous variation in sentencing needed to identify the causal effect of sentences. His results, while often imprecise, show larger earnings than employment effects from incarceration.
In short, involvement with the criminal justice system affects future labor market outcomes. Incarceration is negatively correlated with future outcomes while the correla- tion between arrest and conviction and ensuing work activity is generally more moderate. The question remains open, however, about the causal mechanisms, if any, that underlie the links. Moreover, the effects probably vary among groups and over time and across prison experiences. As more and more men are sent to jail or prison - recall that the Justice Department estimates that 1 in 9 American men will spend some time incarcerated - any stigma attached to incarceration in the job market may fall. The adverse relation between incarceration and labor outcomes may also have a strong age component, being larger among younger men and smaller among older men in the declining part of the age-crime curve. Finally, as noted earlier, at least some well-constructed studies (Saylor and Gaes, 1992) find that prisoners who receive job training or who work in prison have better
employment experiences after release than others.
6. Crim6 preventio n activities
Since crime hurts victims physically and/or financially, the state and individuals spend considerable resources trying to prevent crime. Optimization of individual or social output requires that we pursue these activities only up to the point where the marginal value of reduction in crime equals the marginal cost of the specified crime prevention activity. If the technology of crime prevention was well-known, if all actors in the criminal justice
Ch. 52: The Economics of Crime 3557
system were efficient optimizers, and if there were no externalities from individual crime prevention activities, we might conclude that society has the amount of crime we "want". None of these "ifs" appear to be correct. There are substantial debates over modes of crime prevention and innovations in technology and policing; over whether sanctions are more or less effective than social programs, and on the relation between individual efforts to reduce crime and public efforts.
6.1. Specific crime prevention programs
Various jurisdictions and groups in the US have sought to reduce the rate of crime through diverse innovative programs, ranging from trying to frighten youths from engaging in crime to providing recreational activities to counseling parents of juvenile delinquents. Many of these programs contain an evaluation component, though the evaluation is often of a weak scientific sort (i.e., without random assignment or a well-specified control group, without sufficient sample size to detect modest effects with any confidence, or without serious consideration of attrition of the treatment/control sample). Still, there have been enough reasonable evaluation studies to allow researchers to undertake meta analyses of the effects of programs in some areas, and enough high quality evaluations of particular programs to support conclusions at least about those programs. Meta analyses of juvenile delinquency programs (Lipsey, 1992) and various rehabilitation programs (Andrews et al., 1990) find that the typical program has modest crime-reducing effects - effect sizes (the ratio of the difference in outcomes between the treatment group and the control group relative to the standard deviation in the outcome in the sample) on the order of 0.20 (two- tenths of a standard deviation). This falls in the range of reviews of studies of social interventions of various forms, that has shifted the view of many social scientists from the 1970s view that "nothing works" to the current belief that "most things work a bit". (Lipsey and Wilson, 1993).
In 1996-1997 the University of Maryland Department of Criminology and Criminal Justice conducted the most comprehensive review of crime prevention programs, includ- ing summaries of several meta-statistical analyses, for the US Department of Justice. The Maryland review covered some 500 plus programs, ranging from school programs to family interventions to job training to policing strategies. It scored studies by their "scien- tific rigor" and tried to assess "what works, what doesn't, what's promising". Overall, the review found that most (though not all) inexpensive short programs are ineffective in reducing crime. This includes such well-publicized programs as Scared Straight (taking young at-risk youth to prisons, to see what awaits them if they commit crimes), correc- tional boot camps, police visits to homes where there is domestic violence, random patrols and rapid response by police to 999 calls, Neighborhood Watch programs, and Midnight Basketball, among others. At the same time, the review reported favorably on some longer run and potentially expensive programs, ranging from intensive residential training programs for at-risk youth to long-term frequent home visitation to at-risk youths and their parents, intensive supervision of probated or paroled criminals, additional police
3558 R. B. Freeman
patrols at hot spots of crime. They also found that some less expensive programs, such as Big Brother/Sister mentoring programs among others, are also promising in the sense that initial evaluations suggest that they reduce crime, at least in the short run.
Neither the meta-statistical analyzes nor the Maryland review were designed to compare the effectiveness of programs that operate on the incentive variables that economists stress as opposed to the attitudinal/background variables that other disciplines stress. This makes it is difficult to use the evaluation evidence to assess the contribution of economic incen- tives in crime. Some programs based on economic/sanction factors that enter Eq. (2) seem to work - some prison-based vocational education programs (Lattimore et al. 1989) and prison industry (Saylor and Gaes, 1992), the Job Corps intensive residential training programs, highly intensely supervised probation or parole programs, police strategies focused on crime hot spots. In addition, providing cash incentives for high risk youths to graduate high school also seems effective (Greenwood et al., 1996). But other equally sensible and seemingly well-designed programs seem not work - giving released prisoners unemployment benefits to tide them over until they find a job (Berk et al., 1980); in-prison training plus job placement assistance, participation in academic and vocational programs in prison (Adams et al., 1994). Exemplifying the wide range of results for programs that might expected to affect the economic calculus similarly, Lipsey's recta-analysis of the effectiveness of different treatments for juvenile delinquents shows that employment programs were most effective, while vocational programs were least effective. Perhaps the safest conclusion is that programs based on influencing incentives are not discernibly more or less effective than programs based on influencing attitudes or social conditions.
But social decisions about crime prevention programs should depend not only on their effectiveness but on their costs. Here, incentive-based programs have an advantage, since incentives can operate rapidly and can be relatively inexpensive whereas early social interventions take a long time to bear fruition and are often very costly. Greenwood et al. (1994) have simulated the reductions in crime and costs of four types of interventions: training for parents with young children who are aggressive in school; home visits by child care professionals followed by day care programs; monitoring and supelwising delinquent high school age youth; and offer four years of cash and other incentives to induce disad- vantaged youths to graduate high school. Their finding is that graduation incentives had by far the highest cost effectiveness in part because the rewards come quickly. Whether the Greenwood et al. assessment that incentives are more cost-effective than other policies hNds up to further analysis or not, it moves discussion in the right direction: toward contrasting the efficacy per dollar spent on the relevant alternatives, rather than studying a single program in isolation.
6.2. Measuring the benefits from crime reduction
A complete benefit-cost analysis of the resources spent to prevent crime requires one other hat'd-to-determine statistic: the marginal dollar value of the reduction in crime due to any policy. This statistic is hard to determine because the value consists not only of reduced
Ch. 52: The Economics of Crime 3559
pecuniary losses but also, and arguably more importantly, of the reduced non-pecuniary loss from being victimized.
Estimates of the average cost of crime, much less of the marginal cost, are difficult to make. The National Crime Victimization Survey estimates the direct monetary losses of crimes, by asking victims to estimate losses from theft or damage, medical expenses, and pay loss due to injury. The 1992 estimate was that the average burglary cost $834, the average auto theft, $3990, the average robbery $555, and so on (Klaus, 1994). The average crime was estimated to cost victims 3.4 days of working time. The total economic loss to victims of crime, including medical costs, and lost work time was estimated to be $532 per crime or 17.6 billion dollars for all reported crimes in that year. This is just 0.3% of GDP in that year.
But these figures do not cover the non-pecuniary costs of crime in the form of the misery created for victims. Some criminologists have estimated a more inclusive cost of crime, based on jury evaluation of non-pecuniary costs (Cohen, 1988) and medical evaluations of injuries, including psychological problems (Miller et al., 1993). Some estimates include the lost legitimate earnings of incarcerated criminals, which may affect the well-being of spouses or children - 56% of male prisoners have children under the age of 18 (Bureau of Justice Statistics, 1991, p. 10). Others exclude earnings, on the argument that the criminal consumes most of those earnings (Levitt, 1995). None include the suffering of the families of criminals. For all their problems, these estimates are undoubtedly closer to the truth than figures limited to the money stolen. They exceed reported monetary losses by massive amounts. For example, the estimated average pain and suffering and cost of risk of death created by a robbery is approximately eleven times the direct monetary loss (Cohen, 1988, Table 3). Estimates of the cost of pain, suffering, and economic loss for the average crime are on the order of $2300 (DiIulio and Piehl, 1991) to $3000 (Levitt, 1995). 33 These costs underlie the case for allocating considerable resources to crime control activities, includ- ing prison or alternative sentencing, and lbr any social programs that can prevent crime.
The one crime prevention program that analysts put to a benefit-cost test is incarcera- tion. The skyrocketing prison and jail population, with its accompanying rising costs, has generated debate over whether "prison pays". The answer depends in part on the number of crimes that the incarcerated criminal would commit if he were free, and on the response of others on the margin of crime to the incarceration. Using an entire distribution of crimes per criminal, DiIulio and Piehl (1991) estimate that the benefit-cost ratio for imprisonment exceeds one for the median number of crimes per criminal, but falls below one for those in the lower quartile of the distribution of crimes. Given the uncertainty in the estimates, this suggests that prison just pays on the margin. Using regression based estimates of the effect of incarceration on crimes, Marvell (1994) reaches a similar conclusion that prison popu- lations also just pay off at the margin. Neither of these studies take account of the utility victims and the public may get fi'om seeing criminals receive their "just reward", which would inflate the benefits. In any case, the high costs of crime and of incarceration suggest that if prison pays on the margin, so too would even modestly effective alternative senten-
33 Levitt reports $45,000 as the estimated cost per criminal and estimates that criminals commit 15 crimes per
year, for the $3000 estimate that I use.
3560 R. B. Freeman
cing procedures (house confinement, electronic surveillance, parole, etc.; see Clear and Braga (1995)) or jobs/social programs for crime-prone groups.
6.3. Individual efforts to prevent crime
Individuals seek to protect themselves from crime not only through collective action organized through the state-run criminal justice system, but also through group action organized through private channels and through individual action. Individuals form neigh- borhood watch groups; hire private guards; exit crime-intense environments; buy alarms and protective equipment; keep attack dogs and guns. While we lack good survey data on the magnitude or efficacy of all of these various responses, much less the degree to which they substitute or complement one another, the scattered knowledge that we do have suggests that individual responses to the threat of crime are sizeable.
One maj or response is to leave crime-prone areas. Cullen and Levitt (1996) have used a pooled cross-city time series data set to examine how the population of cities changes with rising crime rates, conditional on other factors, such as the SMSA unemployment rate. In a variety of data sets, using ordinary least squares and instrumental variables regressions, 34 they found that increases in crime rates have a substantial and highly significant adverse effect on the city population: a 1% increase in the crime rate induces a 1-2% decline in city population. The effect is larger for families with children and persons in higher income groups. Their finding that people move from high crime areas is consistent with earlier criminology research (Sampson and Wooldredge, 1986; Smith and Jarjoura, t988)
Many individuals respond to the threat of crime to their household by buying locks or alarms or other forms of protection. These forms of protection can have negative or positive spillovers for the neighbors of the individual. On the negative side, if my door is locked or my windows have protective bars, or my apartment building well-lit with a private guard, the prospective burglar may go to your place, instead. This is a form of displacement of crime, from those with greater private protection to those with less private protection. On the positive side, if my protective measures reduce the overall return to crime, my actions will help deter crime in general. The Lojack system for recovering stolen cars studied by Ayres and Levitt (1996) provides a striking example of individual measures that have a beneficial effect on others. The Lojack firm places a secret radio transmitter in a car, which enables the police to track the stolen vehicle, but which are not discoverable by car thieves. Ninety-five percent of cars with Lojack are recovered. This redtrces the profitability of auto thefts in general, and thus should reduce the number of auto thefts. Ayres and Levitt (1996) use a cross-city before-after research design to assess the effects 6( Lojack and find that cities that introduce Lojack experience a drop in car thefts. Since the potential thief does not know whether any given car has the system (though he may surmise that more expensive cars are more likely to have it), the deterrent
3,~ Worried that the crime rate may depend on population, they instrumented the change in crime with the change in prison commitments per crime. The instrumental variable analysis works because COlmniunents are negatively related to the crime rate and positively related to the change in population.
Ch. 52: The Economics of Crime 3561
effect operates market wide. Lojack is a privately created crime reduction system which requires police cooperation and thus exemplifies the complementarity between some public and private activities in the fight against crime.
Philipson and Posner (1996) use data from an insurance company on burglar alarms to examine the effect of the rate of burglary in a state on the purchase of alarms and also find a positive relation between the crime and individual protective action. In an earlier study using a sample of Washington, DC, households, Clotfelter (1978) examined the effect of the rate of robbery and burglary on other forms of private protective measures, such as installing locks or burglar alarms, putting bars on windows, staying at home for fear of crime in the neighborhood, and so on. Eight of nine protective measures were significantly positively related to the burglary/robbery rate in the area, implying that the higher the crime rate, the more protective measures citizens took. Neither of these studies have the data needed to determine whether the protective measures worked, at least in the sense of producing lower chances of robbery/burglary for families that took them than for unpro- tected families. If the measures reduced crime overall in a neighborhood, their estimates of citizen response to crime would be biased downward, since are not "corrected" for the crime-reducing impact of the protective measures.
As more private sector resources have gone to crime protection activities, and the number of private guards and detectives risen relative to police officers, the question naturally arises as to the extent to which private protective activity public activity are substitutes. Philipson and Posner (1996) find some evidence in their state by year data set that the proportion of homes with burglar alarms drops with improved public sector anti- crime activities, in the form of criminal case filings. Also using cross state data, Clotfelter (1977) found a fairly high but imprecisely estimated elasticity of substitution with respect to the relative price of the two forms of protection against crime and found that states with greater employment in wholesaling and finance tended to hire more private guards. Bartel (1975) found little evidence of substitution between police and private guards hired by firms. As the Lojack example indicates, there are situations in which public and private efforts to reduce crime are likely to be complementary as well as substitutable.
6.4. Partial privatization o f criminal justice activities ?
To what extent, if at all, might crime be better controlled through privatization of some criminal justice activities than through the public sector criminal justice system?
To what extent, if at all, should the criminal justice system target more resources to the compensation of victims of crime?
Privatization of criminal justice activities (like the death penalty) is highly contentious, with ideological overtones, but it is also an area where empirical evidence can help resolve disagreements. In the absence of random assignment controlled experiments of private versus public crime prevention programs, our main source of information are case studies of private sector initiatives. Benson (1998) provides a wide-ranging review of the role of the private sector in criminal justice which includes: the growing number of private
3562 R. B. Freeman
prisons; San Francisco's long standing use of "Private Special Police" to patrol neighbor- hoods; police outsourcing of some services; local government contracting police services from private firms; Federal Bureau of Prisons contracting all of its halfway houses to the private sector; university use of private campus policing, company preferences for resol- ving some criminal acts by employees; as well as diverse forms of mediation, liaisons between the police and private security forces. Reynolds (1994) presents evidence that the use of private bail agencies and bounty hunters and bail enforcement agents has been extremely successful and contrasts the minute fugitive rate for the private bail system with the high rate of failure of state run pretrial release of non-violent prisoners. Whatever one' s views of where the public/private divide should be in criminal justice activities, these studies make it clear that there is much action on the private side that merits analytic attention.
In To Serve and Protec t , Benson (1998) goes further and argues that additional priva- tization of criminal justice activity would help reduce crime, particularly if it created greater incentives for victims and others to play a more active role in crime prevention. Much of the argument is based on the economic incentive model, but the analysis is consistent with "community policing" strategies that seek to involve private citizens in crime prevention activities derived from a social interaction view of the determinants of crime. Benson also argues that the criminal justice system should expend greater resources in giving restitution to the victims of crime. This is an area in which the US has a highly variable set of policies. At one extreme are the limited penalties for illegal firing of worker for union activity. At the other is the possibility of huge economic payments through court suits over discrimination or harassment. The O.J. Simpson trials gave a contrasting picture of the use of the criminal justice system and of the private court system as modes of penalization and giving restitution to victims. Benson notes the greater use of fines, much of which are paid to victims of crime, in several foreign countries, such as France, and suggests that this may be a more cost-effective way of sanctioning criminals while using the money to give more to victims. Current prison employment programs give only a modest sums of the earnings of offenders to victims.
7. Conclusion: how big is the economics contribution?
A'S-noted at the outset, research on crime is an area dominated by non-economists, some of whom are attuned to incentive-response issues and others of whom stress very different factors, such as family background and criminogenic traits. When Becker (1968) and Ehrlich (197'3) first pu'shed economic analysis into the area of crime, criminologists did not greet economists with open arms. The incentive-based model of crime embodied in Eq. (2) left out too much for some tastes. Thirty odd years later, economists still stand out as "new kids" on the block but there is a concordance of views about tile importance, and limitations, of individual incentive based models. It is heartening for an economist to see the great stress ethnographers put on economic rewards in the behavior of youth gangs and
Ch. 52: The Economics of Crime 3563
the way young at-risk youths view working legally versus working illegally as options that fit the basic economic calculus. It must be heartening for the non-economists to see that economic researchers have come to stress social interactions and other non-market factors in crime, as well. My (biased economists ') assessment is that economics has made a major positive contribution to our knowledge of crime, and that economic ideas, and professional economists will play a larger role in research on crime in the future.
But it would be wrong to claim that we (or others working in the crime area) have cracked the big question that has made crime such a hot issue in the past two decades - why crime rose so rapidly in the 1960s and 1970s; continued at high levels despite mass incarceration; and then began to fall sharply in the 1990s in the UCR data or earlier, using victimization reports. We can tell a plausible broad brush story about the massive rise in crime - sanctions weakened in the 1970s, the economic returns to crime rose as the earnings of less skilled workers fell sharply and as demand for drugs grew, but this explanation requires a reasonably high aggregate elasticity of supply of young persons to crime, possibly due to social interactions, for which we have only limited estimates that need not convince the skeptical. We can also tell a (more complicated) story about the 1990s drop in crime, in terms of the possible non-linear effects of a tight labor market, increases in apprehension rates, and incapacitation finally putting so many criminals in jail/prison to cut into the crime rate. But just as we have not managed to give a compelling explanation of such important economic phenomenon as the post-1973 or thereabouts fall in productivity nor the 1980-1990s rise in inequality nor the improvement in female earnings relative to male earnings, it is hard to see us nailing this social change down quickly, either. Economic analysis of crime has succeeded, but there is still a lot more to do and learn.
References
Adams, Kenneth (1994), "A large scale multidimensional test of the effect of prison education programs on offenders' behavior", The Prison Journal 74: 433-449.
Andenaes, Johannes (1974), Punishment and deterrence (University of Michigan Press, Ann Arbor, MI). Anderson, Elijah (1990), Streetwise: race, class and change in an urban community (University of Chicago Press,
Chicago, IL). Anderson, Elijah (1994), "Code of the street", Atlantic Monthly May. Andreoni, James (1995), "Criminal deterrence in the reduced form: a new perspective on Ehrlich's seminal
study", Economic Inquiry 33: 476~483. Andrews, D.A., I. Zinger, R.D. Hoge, J. Bonta, P. Gendreau and F.T. Cullen (1990), "Does correctional treatment
work? a clinically-relevant and psychologically-informed recta-analysis", Criminology 28: 369404. Ayres, lan and Steven D. Levitt (1996), "Measuring positive externalities from unobservable victim precaution:
an empirical analysis of lojack", Unpublished manuscript (Yale Law School and Harvard University). Bartel, Ann P. (1975), "An analysis of firm demand for protection against crime", Journal of Legal Studies 4:
443M78. Bastian, Lisa (1995), Criminal victimization (1993), Bureau of Justice Statistics Bulletin, National Crime Victi-
mization Survey. NCJ-I 51658 (US Department of Justice, Office of" Justice Programs, Washington, DC).
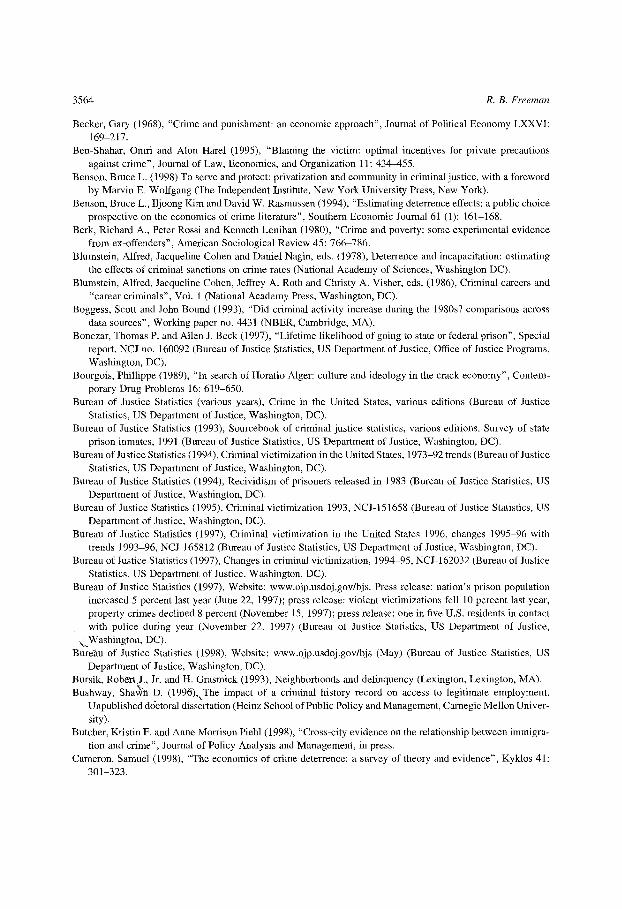
3564 R. B. Freeman
Becker, Gary (1968), "Crime and punishment: an economic approach", Journal of Political Economy LXXVI: 169-217.
Ben-Shahar, Oruri and Alon Harel (1995), "Blaming the victim: optimal incentives for private precautions against crime", Journal of Law, Economics, and Organization 11: 434~55.
Benson, Bruce L. (1998) To serve and protect: privatization and community in criminal justice, with a foreword by Marvin E. Wolfgang (The Independent Institute, New York University Press, New York).
Benson, Bruce L., Iljoong Kim and David W. Rasmussen (1994), "Estimating deterrence effects: a public choice prospective on the economics of crime literature", Southern Economic Journal 61 (1): 161-168.
Berk, Richard A., Peter Rossi and Kenneth Lenihan (1980), "Crime and poverty: some experimental evidence from ex-offenders", American Sociological Review 45: 766-786.
Blumstein, Alfred, Jacqueline Cohen and Daniel Nagin, eds. (1978), Deterrence and incapacitation: estimating the effects of criminal sanctions on crime rates (National Academy of Sciences, Washington DC).
Blumstein, Alfred, Jacqueline Cohen, Jeffrey A. Rotb and Christy A. Visher, eds. (1986), Criminal careers and "career crilninals", Vol. 1 (National Academy Press, Washington, DC).
Boggess, Scott and John Bound (1993), "Did criminal activity increase during the 1980s? comparisons across data sources", Working paper no. 4431 (NBER, Cambridge, MA).
Bonczar, Thomas P. and Allen J. Beck (1997), "Lifetime likelihood of going to state or federal prison", Special report, NCJ no. 160092 (Bureau of Justice Statistics, US Department of Justice, Office of Justice Programs, Washington, DC).
Bourgois, Phillippe (1989), "In search of Horatio Alger: culture and ideology in the crack economy", Contem- porary Drug Problems 16: 619-650.
Bureau of Justice Statistics (various years), Crime in the United States, various editions (Bureau of Justice Statistics, US Department of Justice, Washington, DC).
Bureau of Justice Statistics (1993), Sourcebook of criminal justice statistics, various editions. Survey of state prison inmates, 1991 (Bureau of Justice Statistics, US Department of Justice, Washington, DC).
Bureau of Justice Statistics (1994), Criminal victimization in the United States, 1973-92 trends (Bureau of Justice Statistics, US Department of Justice, Washington, DC).
Bureau of Justice Statistics (1994), Recividism of prisoners released in 1983 (Bureau of Justice Statistics, US Department of Justice, Washington, DC).
Bureau of Justice Statistics (1995), Criminal victimization 1993, NCJ-151658 (Bureau of Justice Statistics, US Department of" Justice, Washington, DC).
Bureau of Justice Statistics (1997), Criminal victimization in the United States 1996, changes 1995-96 with trends 1993-96, NCJ-165812 (Bureau of Justice Statistics, US Department of Justice, Washington, DC).
Bureau of Justice Statistics (1997), Changes in criminal victimization, 1994-95, NCJ-162032 (Bureau of Justice Statistics, US Department of Justice, Washington, DC).
Bureau of Justice Statistics (1997), Website: www.ojp.usdoj.gov/bjs, Press release: nation's prison population increased 5 percent last year (June 22, 1997); press release: violent victimizations fell 10 percent last year, property crimes declined 8 percent (November 15, 1997); press release: one in five U.S. residents in contact with police during year (November 22, 1997) (Bureau of Justice Statistics, US Department of Justice,
,,Washington, DC). Bureau of Justice Statistics (1998), Website: www.ojp.usdoj.gov/bjs (May) (Bureau of Justice Statistics, US
Department of Justice, Washington, DC). Bursik, Robt"rt J., Jr. and H. Grasmick (1993), Neighborhoods and delinquency (Lexington, Lexington, MA). Bushway, S h a ~ - D . (1996), The impact of a criminal history record on access to legitimate employment.
Unpublished doctoral dissertation (Heinz School of Public Policy and Management, Carnegie Mellon Univer- sity).
Butcher, Kristin F. and Anne Morrison Piehl (1998), "Cross-city evidence on the relationship between immigra- tion and crime", Journal of Policy Analysis and Management, in press.
Cameron, Samuel (1998), "The economics of crime deterrence: a survey of theory and evidence", Kyldos 41: 301-323.
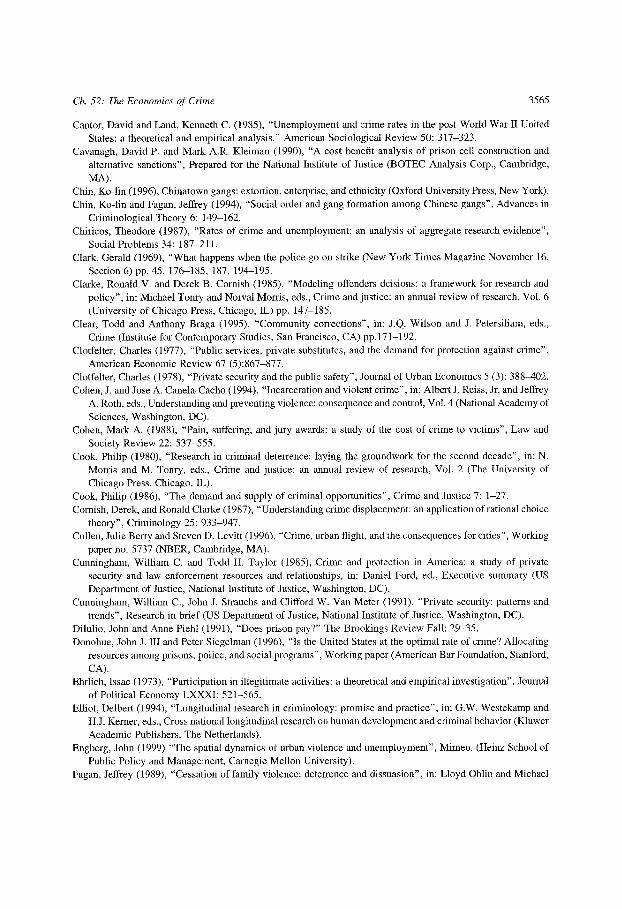
Ch. 52: The Economics of Crime 3565
Cantor, David and Land, Kenneth C. (1985), "Unemployment and crime rates in the post-World War I1 United States: a theoretical and empirical analysis." American Sociological Review 50: 317-323.
Cavanagh, David P. and Mark A.R. Kleiman (1990), "A cost benefit analysis of prison cell construction and alternative sanctions", Prepared foa" the National Institute of Justice (BOTEC Analysis Corp., Cambridge, MA).
Chin, Ko-lin (1996), Chinatown gangs: extortion, enterprise, and ethnicity (Oxford University Press, New York). Chin, Ko-lin and Fagan, Jeffrey (1994), "Social order and gang formation among Chinese gangs", Advances in
Criminological Theory 6:149 162. Chiricos, Theodore (1987), "Rates of crime and unemployment: an analysis of aggregate research evidence",
Social Problems 34: 187-211. Clark, Gerald (1969), "What happens when the police go on strike (New York Times Magazine November 16,
Section 6) pp. 45, 176-185, 187, 194-195. Clarke, Ronald V. and Derek B. Cornish (1985), "Modeling offenders deisions: a framework for research and
policy", in: Michael Tonry and Norval Morris, eds., Crime and justice: an annual review of research, Vol. 6 (University of Chicago Press, Chicago, IL) pp. 147-185.
Clear, Todd and Anthony Braga (1995), "Community corrections", in: J.Q. Wilson and J. Petersiliam, eds., Crime (Institute for Contemporary Studies, San Francisco, CA) pp.171-192.
Cloffelter, Charles (1977), "Public services, private substitutes, and the demand for protection against crime", American Economic Review 67 (5):867-877.
Clotfelter, Charles (1978), "Private security and file public safety", Journal of Urban Economics 5 (3): 388-402. Cohen, J. and Jose A. Canela-Cacho (1994), "Incarceration and violent crime", in: Albert J. Reiss, Jr. and Jeffrey
A. Roth, eds., Understanding and preventing violence: consequence and control, Vol. 4 (National Academy of Sciences, Washington, DC).
Cohen, Mark A. (1988), "Pain, suffering, and jury awards: a study of the cost of crime to victims", Law and Society Review 22: 537-555.
Cook, Philip (1980), "Research in criminal deterrence: laying the groundwork for the second decade", in: N. Morris and M. Tonry, eds., Crime and justice: an annual review of research, Vol. 2 (The University of Chicago Press, Chicago, IL).
Cook, Philip (1986), "The demand and supply of criminal opportunities", Crime and Justice 7: 1-27. Cornish, Derek, and Ronald Clarke (I 987), "Understanding crime displacement: an application of rational choice
theory", Crhninology 25: 933-947. Cullen, Julie Berry and Steven D. Levitt (1996), "Crime, urban flight, and the consequences for cities", Working
paper no. 5737 (NBER, Cambridge, MA). Cunningham, William C. and Todd H. Taylor (1985), Crime and protection in America: a study of private
security and law enforcement resources and relationships, in: Daniel Ford, ed., Executive summary (US Department of Justice, National Institute of Justice, Washington, DC).
Cunningham, William C., John J. Straucbs and Clifford W. Van Meter (1991), "Private security: patterns and trends", Research in brief (US Department of Justice, National Institute of Justice, Washington, DC).
Dilulio, John and Anne Piehl (1991), "Does prison pay?" The Brooldngs Review Fall: 29-35. Donohue, John J. ]~I and Peter Siegelman (1996), "is the United States at the optimal rate of crime? Allocating
resources among prisons, police, and social programs", Working paper (American Bar Founda6on, Stanford, CA).
Ehrlich, Issac (1973), "Participation in illegitimate activities: a theoretical and empirical investigation". Journal of Political Economy LXXXI: 521-565.
Elliot, Delbert (1994), "Longitudinal research in criminology: promise and practice", in: G.W. Westekamp and H.J. Kerner, eds., Cross national longitudinal research on human development and criminal behavior (Kluwer Academic Publishers, The Netherlands).
Engberg, John (1999) "The spatial dynamics of urban violence and unemployment", Mimeo. (Heinz School of Public Policy and Management, Carnegie Mellon University).
Fagan, Jeffrey (1989), "Cessation of family violence: deterrence and dissuasion", in: Lloyd Ohlin and Michael
3566 R. B. Freeman
Tonry, eds., Family violence, crime and justice: an annual review of research, Vol. 11 (University of Chicago Press, Chicago, IL) pp. 377425.
Fagan, Jeffrey (1992), "Drug selling and licit income in distressed neighborhoods: the economic lives of street- level drug users and dealers", in: George E. Peterson and Adelle V. Harrell, eds., Drugs, crime and social isolation: barriers to urban opportunity (Urban Institute Press, Washington DC) pp. 99-142.
Fagan, Jeffrey (1993), "The political economy of drag dealing among urban gangs", in: Robert Davis, Arthur Lurigio and Dennis P. Rosenbamn, eds., Drugs and community (Charles Thomas, Springfield, IL) pp. 19-54.
Fagan, Jeffrey and Richard Freeman (1997), "Crime, work and unemployment", Mimeo. August. Fagan, J.A. and Ko-lin Chin (1990), "Violence as regulation and social control in the distribution of crack", in:
Mario de la Rosa, Bernard Gropper and Elizabeth Lambert, eds., Drugs and violence, NIDA research mono- graph no. 103 (National Institute of Drug Abuse, U.S. Public Health Administration, Rockville, MD) pp. 8 - 39.
Farrington, David P. (1986), "Age and crime", in: Michael Tonry and Norval Morris, eds., Crime and justice: an annual review of research, Vol. 7 (University of Chicago Press, Chicago, IL) pp. 189-250.
Farrington, David P., Bernard Gallagher, Lyndia Morley, Raymond J. St. Ledger and Donald J. West (1986), "Unemployment, school leaving and crime", British Journal of Criminology 26: 335-356.
Federal Bureau of Investigation (1998), Website: www.fbi.gov.ucr (May). Press release, UCR 1997 preliminary annual release (May 17, 1998); press release, UCR preliminary release - January through June 1997 (Novem- ber 23, 1997).
Finn, R. and P. Fontaine (1985), "The association between selected characteristics and perceived employability of offenders", Criminal Justice and Behavior 12 (3): 353-365.
Fisher, Franklin M. and D. Nagin (1978), "On the feasibility of identil~cing the crime function in a simultaneous model of crime rates and sanction levels", in: Blumstein, Cohen and Nagin, eds., Detenence and incapacita- tion: estimating the effects of criminal sanctions on crime rates (National Academy of Sciences, Washington, DC) pp. 361-399.
Freeman, Richard B. (1983), "Crime and unemployment", in: James Q. Wilson, ed., Crime and public policy (Institute for Contemporary Studies Press, San Francisco, CA) pp. 89-106.
Freeman, R. (1987), "The relation of criminal activity to black youth employment", The Review of Black Political Economy Summer-Fall, 99-107.
Freeman, Richard B. (1991), "Employment and earnings of disadvantaged young men in a labor shortage economy", in: Christopher Jencks and Paul E. Peterson, eds., The urban underclass (Brookings Institution Press, Washington, DC) pp. 103-121.
Freeman, Richard B. (1992), "Crime and the economic status of disadvantaged young men", in: George E. Peterson and Wayne Vroman, eds., Urban labor markets and job opportunities (Urban Institute Press, Washington, DC) pp. 201-238.
Freeman, Richard B. (1995), "The labor market", in: James Q. Wilson and Joan Petersilia, eds., Crime and public policy, 2nd edition (Institute for Contemporary Studies, San Francisco, CA) pp. 171-192.
Freeman, Richard B. (1996a), "Why do so many young American men commit crimes and what might we do about it?" Journal of Economic Perspectives 10 (1): 25~,2.
Freeman, Richard B. (1996b), "The supply of youths to crime", in: Susan Pozo, ed., Exploring the underground "ecpnomy (W.E. Upjohn Institute for Employment Research, Kalamazoo, MI) Chapter 3.
Freeman, Richard B. and Harry J. Holzer, eds. (1986), The black youth unemployment crisis (University of Chicago f~ress and NBER, Chicago, IL).
Freeman, Rich~d~ B. and WiUianl Rodgers (1999), "Area economic conditions and the labor market outcomes of young men in the 1990s e~pansion", Working paper no. 7073 (NBER, Chicago, IL).
Gendreau, P. and R.R. Ross (1987), "Revivification of rehabilitation: evidence from the 1980's", Justice Quar- terly 4: 349407.
Gendreau, P., T. Little, and C. Goggin (1995), "A Meta-analysis of the predictors of ault offender recidivism: what works!" Unpublished manuscript (University of New Brunswick, St. John, Canada).
Ch. 52: The Economics of Crime 3567
Glaeser, Edward, Bruce Sacerdote and Jose Sheinkmna (1995), " Crime and social interactions", Quarterly Journal of Economics 111 (445): 507-548.
Glueck, Sheldon and Eleanor Glueck (1950), Unravelling juvenile delinquency (Harvard University Press, Cambridge MA).
Good, David H., Maureen A. Pirog-Good and Robin C. Sickles (1986), "An analysis of youth crime and employ- merit patterns", Journal of Quantitative Criminology 2:219-236.
Gould, Eric, Bruce Weinberg and David Mustard (1998) "Crime rates and local labor market opportunities in the United States: 1979-1995", Mimeo. (NBER Labor Studies Summer Conference).
Grasmick, Harold G. and Robert J. Bursik, Jr. (1990), "Conscience, significant others, and rational choice: extending the deterrence model." Law and Society Review 24 (3): 837-861.
Greenberg, David F. (1975), "The incapacitative effect of imprisomnent: some estimates", Law and Society Review 9 (4): 541-580.
Greenberg, David F. (1977), "Delinquency and the age structm'e of society", Contemporary Crises 1: 189-223. Greenwood, Peter W. and Allan F. Abrahamse (1982), "Selective incapacitation", Report R-2815-NIJ (RAND,
Santa Monica, CA). Greenwood, Peter W. and Susan Turner (1987), "Selective incapacitation revisited: why the high-rate offenders
are hard to predict", Report R-3397-NIJ (RAND, Santa Monica, CA). Greenwood, Peter W., C. Peter Rydell, Allan F. Abrahamse, Jonathan P. Caulkins, James Chiesa, Karyn E. Model
and Stephen P. Klein (1994), Three strikes and you're out: estimating benefits and costs of California's new mandatory-sentencing law (RAND, Santa Monica, CA).
Greenwood, Peter W., Karyn E. Model, C. Peter Rydell and James Chiesa (1996), "Diverting children from a life of crime: measuring costs and benefits", Criminal justice series (RAND, Santa Monica, CA).
Grogger, Jeffrey (1995), "The effect of arrests on the employment and earnings of young men", Quarterly Journal of Economics 110: 51-72.
Grogger, Jeffrey (1997), "Market wages and youth crime", Working paper no. 5983 (NBER, Cambridge, MA). Hagedorn, J. (1991), "Gangs, neighborhoods, and public policy", Social Problems 38. Hagedom, J. (1994a), "Neighborhoods, markets and gang drug organization", Journal of Research in Crime and
Delinquency 31: 264 294. Hagedorn, J. (1994b), "Homeboys, dope fiends, legits, and new jacks", Criminology 32: 197-219. Hagedorn, John, with Perry Macon (1988), People and folks: gangs, crime and the underclass in a rustbelt city
(Lake View Press, Chicago, IL). Hannerz, Ulf (1969), Soulside: inquiries into ghetto culture and community. (Columbia University Press, New
York). Hernnstein, R.J. (1995) "Criminogenic traits", in: James Q. Wilson and Joan Petersilia, eds., Crime (ICS Press,
San Francisco, CA) Chapter 3. Hesseling, Rene (1994) "Displacement: a review of the empirical literature", in: R. Clarke, ed., Crime Prevention
Studies III: 197-230. Hindelang, Michael J., Travis Hirschi and Joseph Weis (1981), Measuring delinquency (Sage, Beverly Hills,
CA). Hirschi, Travis and Michael Gottfredson (1983), "Age and the explanation of crime", American Journal of
Sociology 89: 552-584. Homey, Julie, D. Wayne Osgood and lneke H. Marshall (1995), "Criminal careers in the short-term: intra-
individual variability in crime and its relation to local life circumstances", American Sociological Review 60: 655-673.
Huff, C. Ronald, ed. (1990), Gangs in America (Sage Publications, CA). Izzo, R.L. and R.R. Ross (1990) Meta-analysis of rehabilitation programs for juvenile delinquents", Criminal
Justice and Behavior 17: 134-142. Kagan, Robert A. (1989), "On the visibility of income tax law violations", in: Jeffrey A. Roth and John Scholz,
eds., Taxpayer compliance, Vol. 2 (University of Pennsylvania Press, Philadelphia, PA). Kennedy, David M., Anne M. Piehl and Anthony A. Braga (1996), "Youth violence in boston: gun markets,
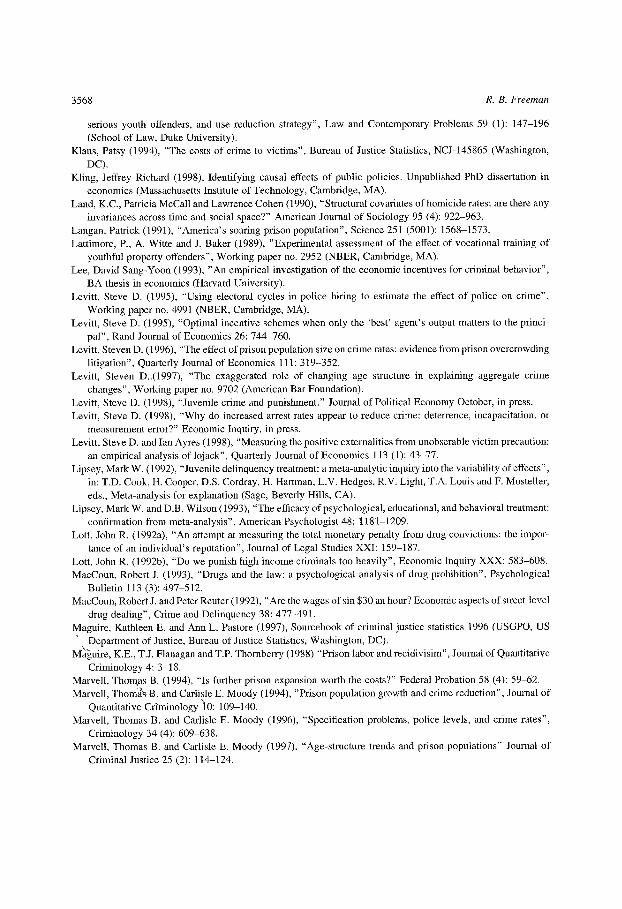
3568 R. B. Freeman
serious youth offenders, and use reduction strategy", Law and Contemporary Problems 59 (1): 147-196 (School of Law, Duke University).
Klaus, Patsy (1994), "The costs of crime to victims", Bureau of Justice Statistics, NCJ-145865 (Washington, DC).
Kling, Jeffrey Richard (1998), Identifying causal effects of public policies. Unpublished PhD dissertation in economics (Massachusetts Institute of Technology, Cambridge, MA).
Land, K.C., Patricia McCall and Lawrence Cohen (1990), "Structural covariates of homicide rates: are there any invariances across time and social space?" American Journal of Sociology 95 (4): 922-963.
Langan, Patrick (1991), "America's soaring prison population", Science 251 (5001): 1568 1573. Lattimore, P., A. Witte and J. Baker (1989), "Experimental assessment of the effect of vocational training of
youthful property offenders", Working paper no. 2952 (NBER, Cambridge, MA). Lee, David Sang-Yoon (1993), "An empirical investigation of the economic incentives for criminal behavior",
BA thesis in economics (Harvard University). Levitt, Steve D. (1995), "Using electoral cycles in police hiring to estimate the effect of police on crime",
Working paper no. 4991 (NBER, Cambridge, MA). Levitt, Steve D. (1995), "Optimal incentive schemes when only the 'best' agent's output matters to the princi-
pal", Rand Journal of Economics 26: 744-760. Levitt, Steven D. (1996), "The effect of prison population size on crime rates: evidence from prison overcrowding
litigation", Quarterly Journal of Economics 111 : 319-352. Levitt, Steven D..(1997), "The exaggerated role of changing age structure in explaining aggregate crime
changes", Working paper no. 9702 (American Bar Foundation). Levitt, Steve D. (1998), "Juvenile crime and punishment." Journal of Political Economy October, in press. Levitt, Steve D. (1998), "Why do increased arrest rates appear to reduce crime: deterrence, incapacitation, or
measurement error?" Economic Inquiry, in press. Levitt, Steve D. and Ian Ayres (1998), "Measuring the positive externalities from unobserable victim precaution:
an empirical analysis of lojack", Quarterly Journal of Economics 113 (1): 43-77. Lipsey, Mark W. (1992), "Juvenile delinquency treatment: a meta-analytic inquiry into the variability of effects",
in: T.D. Cook, H. Cooper, D.S. Cordray, H. Hartman, L.V. Hedges, R.V. Light, T.A. Louis and F. Mosteller, eds., Meta-analysis for explanation (Sage, Beverly Hills, CA).
Lipsey, Mark W. and D.B. Wilson (1993), "The efficacy of" psychological, educational, and behavioral treatment: confirmation from meta-analysis", American Psychologist 48:1181-1209.
Lott, John R. (1992a), "An attempt at measuring the total monetary penalty from drug convictions: the impor- tance of an individual's reputation", Journal of Legal Studies XXI: 159-187.
Lott, John R. (1992b), "Do we punish high income criminals too heavily", Economic Inquiry XXX: 583-608. MacCoun, Robert J. (1993), "Drugs and the law: a psychological analysis of drug prohibition", Psychological
Bulletin 113 (3): 497 512. MacCoun, Robert J. and Peter Reuter (1992), "Are the wages of sin $30 an hour? Economic aspects of street-level
drug dealing", Crime and Delinquency 38: 477-491. Maguire, Kathleen E. and Ann L. Pastore (1997), Sourcebook of criminal justice statistics 1996 (USGPO, US
, Department of Justice, Bureau of Justice Statistics, Washington, DC). Ma'gnire, K.E., T.J. Flanagan and T.P. Tbornberry (1988) "Prison labor and recidivisim", Journal of Quantitative
Criminology 4: 3-18. Marvell, Thovoas B. (1994), "Is further prison expansion worth the costs?" Federal Probation 58 (4): 59-62. Marvell, Thom~.B. and Carlisle E. Moody (1994), "Prison population growth and crime reduction", Journal of
Quantitative Crhnlnology ]0: 109-140. Marvell, Thomas B. and Carlisle E. Moody (1996), "Specification problems, police levels, and crime rates",
Criminology 34 (4): 609-638. Marvell, Thomas B. and Carlisle E. Moody (1997), "Age-structure trends and prison populations" Journal of
Criminal Justice 25 (2): 114-124.
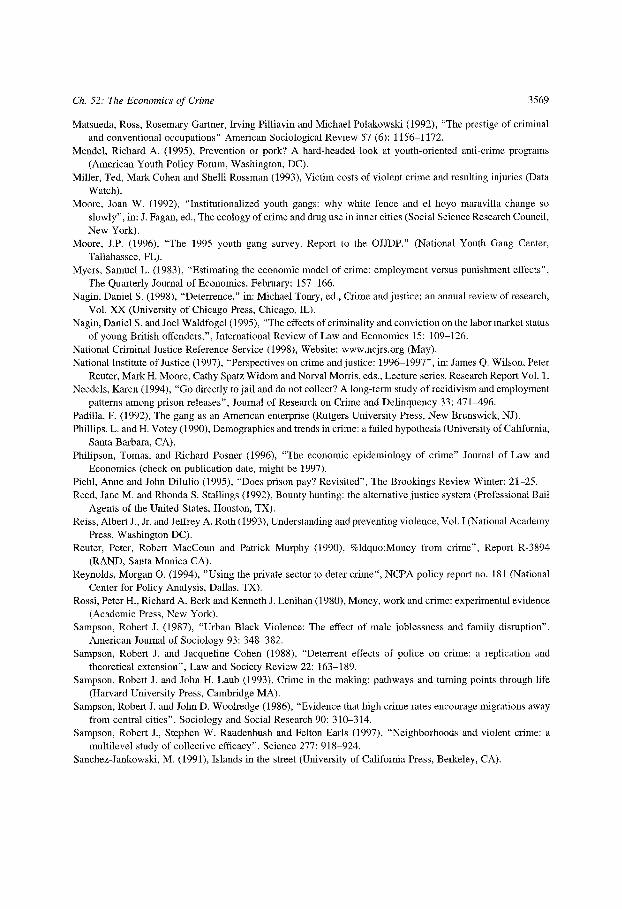
Ch. 52: The Economics of Crime 3569
Matsueda, Ross, Rosemary Gartner, Irving Pilliavin and Michael Polakowski (1992), "The prestige of criminal and conventional occupations" American Sociological Review 57 (6): 1156-1172.
Mendel, Richard A. (1995), Prevention or pork? A hard-headed look at youth-oriented anti-crime programs (American Youth Policy Forum, Washington, DC).
Miller, Ted, Mark Cohen and Shelli Rossman (1993), Victim costs of violent crime and resulting injuries (Data Watch).
Moore, Joan W. (1992), "Institutionalized youth gangs: why white fence and el hoyo maravilla change so slowly", in: J. Fagan, ed., The ecology of crime and drug use in inner cities (Social Science Research Council, New York).
Moore, J.P. (1996), "The 1995 youth gang survey. Report to the OJJDP." (National Youth Gang Center, Tallahassee, FL).
Myers, Samuel L. (1983), "Estimating the economic model of crime: employment versus punishment effects", The Quarterly Journal of Economics. February: 157-166.
Nagin, Daniel S. (1998), "Deterrence." in: Michael Tonry, ed., Crime and justice: an annual review of research, Vol. XX (University of Chicago Press, Chicago, 1L).
Nagin, Daniel S. and Joel Waldfogel (1995), "The effects of criminality and conviction on the labor market status of young British offenders,", International Review of Law and Economics 15: 109-126.
National Criminal Justice Reference Service (1998), Website: www.ncjrs.org (May). National Institute of Justice (1997), "Perspectives on crime and justice: 1996 1997", in: James Q. Wilson, Peter
Reuter, Mark H. Moore, Cathy Spatz Widom and Norval Morris, eds., Lecture series. Research Report Vol. 1. Needels, Karen (1994), "Go directly to jail and do not collect? A long-terln study of recidivism and employment
patterns among prison releases", Journal of Research on Crime and Delinquency 33: 471496. Padilla, F. (1992), The gang as an American enterprise (Rutgers University Press, New Brunswick, NJ). Phillips. L. and H. Votey (1990), Demographics and trends in crime: a failed hypothesis (University of California,
Santa Barbara, CA). Philipson, Tomas, and Richard Posner (1996), "The economic epidemiology of crime" Journal of Law and
Economics (check on publication date, might be 1997). Piehl, Anne and John DiIulio (1995), "Does prison pay? Revisited", The Brookings Review Winter: 21-25. Reed, Jane M. and Rhonda S. Stallings (1992), Bounty hunting: the alternative justice system (Professional Bail
Agents of the United States, Houston, TX). Reiss, Albert J., Jr. and Jelli'ey A. Roth (1993), Understanding and preventing violence, Vol. I (National Academy
Press, Washington DC). Reuter, Peter, Robert MacCoun and Patrick Murphy (1990), %ldquo;Money from crime", Report R-3894
(RAND, Santa Monica CA). Reynolds, Morgan O. (1994), "Using the private sector to deter crime", NCPA policy report no. 181 (National
Center lbr Policy Analysis, Dallas, TX). Rossi, Peter H., Richard A. Berk and Kenneth J. Lenihan (1980), Money, work and crime: experimental evidence
(Academic Press, New York). Sampson, Robert J. (1987), "Urban Black Violence: The effect of male joblessness and family disruption",
American Journal of Sociology 93: 348-382. Sampson, Robert J. and Jacqueline Cohen (1988), "Deterrent effects of police on crime: a replication and
theoretical extension", Law and Society Review 22: 163-189. Sampson, Robert J. and John H. Laub (1993), Crime in the making: pathways and tuming points tt~rough life
(Harvard University Press, Cambridge MA). Sampson, Robert J. and John D. Woolredge (1986), "Evidence that high crime rates encourage migrations away
from central cities", Sociology and Social Research 90: 310-314. Sampson, Robert J., Stephen W. Raudenbush and Felton Earls (1997), "Neighborhoods and violent crime: a
multilevel study of collective efficacy", Science 277: 918-924. Sanchez-Jankowski, M. (1991), Islands in the street (University of California Press, Berkeley, CA).
3570 R. B. Freeman
Saylor, William G. and Gerald G. Gaes (1992), "The post-release employment project: prison work has measur- able effects on post-release success", Federal Prisons Journal 2:33 36.
Shavell, Steven (1991), "Individual precautions to prevent theft: private versus socially optimal behavior", International Review of Law and Economics 11: 123-132.
Sherman, Lawrence (1990), "Initial and residual deterrence", in: Michael Tonry and Norval Morris, eds., Crime and Justice: A review of Research, Vol. 12 (University of Chicago Press, Chicago, IL).
Smith, D.R. and G.R. Jarjoura (1988), "Social structure and criminal victimization", Journal of Research in Crime and Delinquency 25: 27-52.
Spelman, W. (1994), Criminal incapacitation (Plenum Press, New York). Sullivan, M. (1989), Getting paid: youth crime and unemployment in three urban neighborhoods (Cornell
University Press, New York). Taylor, Bruce M. (1997), "Changes in criminal victimization, 1994-95", National Crime Victimization Survey,
NCJ-162032 ( Bureau of Justice Statistics, US Department of Justice, Office of Justice Programs, Washington, DC).
Taylor, Ralph B., Stephen D. Gottfredson and Sidney Brower (1984), "Block crime and fear: defensible space, local social ties and territorial functioning", Journal of Reserach in Crime and Delinquency 21: 303-331.
Thompson, James W. and James Cataldo (1986), Comment on "market incentives for criminal behavior", in: Richard B. Freeman and Harry J. Holzer, eds., The Black Youth Unemployment Crisis, (University of Chicago Press and the National Bureau of Economic Research, Chicago, IL) pp. 347-351.
Thornberry, Terence and R.L. Christenson (1984), "Unemployment and criminal iinvolvement: an investigation of reciprocal causal structures", American Sociological Review 56: 609-627.
Tracy, Paul E., Marvin E. Wolfgang and Robert M. Figlio (1985), Delinquency in two birth cohorts (US Department of Justice, Office of Juvenile Justice and Delinquency Prevention).
Trasler, Gordon B. (1979), "Delinquency, recidivism, and desistance" British Journal of Criminology 19: 314- 322.
TuImell, Kenneth D. (1992), Choosing crime: the criminal calculus of property offenders (Nelson-Hall, Chicago, IL).
UK Central Statistical Office (1995), Social Trends 1995 (UK Central Statistical Office, London). University of Maryland, Department of Criminology and Criminal Justice (1997), Preventing crime: what works,
what doesn't, what's promising. A report to the United States Congress, including the authors Lawrence W. Sherman, Denise Gottfredson, Doris MacKenzie, John Eck, Peter Reuter and Shawn Bushway, NCJ 165366 (US Department of Justice, Office of Justice Programs, Washington, DC).
US Bureau of the Census (1995), The Black Population in the United States: March 1994 and 1993 current population reports, series P20-480. (USGPO, Washington, DC).
US Bureau of the Census (various years), Statistical abstract (USGPO, Washington, DC). Vandaele, Walter (1978), "Participation in illegitimate activites: Ehi'lich revisited", in: Blumstein, Cohen and
Nagin, eds., Deterrence and incapacitation: estimating the effects of criminal sanctions on crime rates (National Academy of Sciences, Washington, DC) pp. 270-335.
Visher, C.A. (1987), "Incapacitation and crime control: does a 'lock'em up' strategy reduce crime?" Justice Quarterly 4 (4): 513-543.
Vichsi,. W. Kip (1986a), "Market incentives for criminal behavior", in: Richard B. Freeman and Harry J. Holzer, eds., The black youth unemployment crisis (University of Chicago Press and the National Bureau of Economic ~esearch, Chicago, IL) pp. 301-346.
Vicusi, W. Kip ~{986b), "The risks and rewards of criminal activity: a comprehensive test of criminal deter- rence", Journal of Labor Economics 4: 317-340.
Waldlogel, Joel (1994), "The effect of criminal convictions on income and the trust "reposed in the workmen", Journal of Human Resources 29: 62-81.
Weis, Joseph G. (1986), "Issues in the measurement of criminal careers", in: Alfred Bhimstein, Jacqueline Cohen, Jeffrey Roth and Christy Visher, eds., Criminal Careers and "Career Criminals." Vol. 2 (National Academy Press, Washington, DC).
Ch. 52: The Economics of Crime 3571
Widom, Cathy Spatz (1997), "Child victims: in search of opportunities for breaking the cycle of violence", in: Perspectives on crime and justice: 1996-1997, Lecture series,, lecture 4, Vol. 1. Research report (National Institute of Justice, Washington, DC).
Williams, Kirk and Richard Hawkins (1986), "Perceptual research on general deterrence." Law and Society Review 20: 545-568.
Williams, Terry (1989), The cocaine kids (Addison-Wesley, New York). Wilson, James Q. (1998), "What, if anything, can the federal government do about crime?" in: Perspectives on
crime and justice: 1996-1997, Lecture series, lectare 1, Vol. 1, Research report (National Institute of Justice, Washington, DC).
Wilson, James Q. and Allan Abrahamse (1992), "Does crime pay?" Justice Quarterly 9 (3): 359-377. Wilson, James Q. and Joan Petersilia, eds. (1995), Crime (Institute for Contemporary Studies, San Francisco,
CA). Witte, Ann D. (1980), "Estimating the economic model of crime with individual data", Quarterly Journal of
Economics 94: 57-87. Witte, Ann D. and Helen Tauchen (1994) "Work and crime: an exploration using panel data" Public Finance, in
press. Wolfgang, Marvin, Robert Figlio and Thorsten Sellin (1972), Delinquency in a birth cohort (University of
Chicago Press, Chicago, IL). Wright, Richard, Robert H. Logie and Scott Decker (1995), "Criminal expertise and offender decision making: an
experimental study of the target selection process", Journal of Research in Crime and Delinquency 33 (4). Zedlewski, Edwin (1987), Making confinement decisions (US Department of Justice, Washington, DC). Zimring, Franklin E. and Gordon Hawkins (1991), The scale of imprisonment (University of Chicago Press,
Chicago, IL).