The Economic Impact of Commercial Space Transportation on the U.S. Economy May 20, 2004
22
The Economic Impact of Commercial Space Transportation on the U.S. Economy May 20, 2004 Paula Trimble Federal Aviation Administration Associate Administrator for Commercial Space Transportation
-
Upload
timon-espinoza -
Category
Documents
-
view
20 -
download
1
description
The Economic Impact of Commercial Space Transportation on the U.S. Economy May 20, 2004 Paula Trimble Federal Aviation Administration Associate Administrator for Commercial Space Transportation. Overview. - PowerPoint PPT Presentation
Transcript of The Economic Impact of Commercial Space Transportation on the U.S. Economy May 20, 2004

The Economic Impact of Commercial Space Transportation on the U.S.
Economy
May 20, 2004
Paula Trimble
Federal Aviation Administration
Associate Administrator for Commercial Space Transportation

2
Overview
• Presentation of FAA/AST’s report describing the economic contributions that commercial space transportation makes to our nation’s economy
• Second study produced by the FAA’s Office of Commercial Space Transportation– First study published in 2001, included 1999 impacts
– This study quantifies impacts for the year 2002
• Illustrates the important role of commercial space transportation in economic growth and development

3
Weather forecasts
News gathering
Direct-to-home TV
( ( (
(
( ( (
( (
( ( ( (
(
( ( ((
( ( ( (
Bank transaction
Driver aids: satellite radio & Global Positioning System
“Pay-at-the-pump”
Videoconferencing
Fax & paging
Package trackingInternational
telephone calls
High-speed Internet
Satellites in Daily Life

4
Objectives
• Highlight the extent to which other industry sectors profit from activity in the commercial space transportation sector
• Provide an outlook for commercial launch and the potential economic impacts of various future scenarios

5
Study Approach
• Industries analyzed: launch vehicle manufacturing and services; satellite manufacturing; satellite services; ground equipment manufacturing; and remote sensing
• Measured impacts using RIMS II model developed by U.S. Department of Commerce, Bureau of Economic Analysis– Measure impacts in terms of economic activity, earnings, and jobs
• Satellite Industry Association (SIA) revenue data• Report includes:
• Detailed industry break-outs• Comparison of 1999 and 2002 impacts• Forecast of impacts for 2010

6
2004 Study Results Part I

7
Summary Highlights
The commercial space transportation industry, along with the industries it enables, generated significant impacts on the nation’s economy in 2002
•$95.0 billion in economic activity
•$23.5 billion in earnings
•576,400 jobs

8
2002 Impacts by Industry Segment
IndustryEconomic Activity
($000) Earnings ($000) Employment (Jobs)
Launch vehicle manufacturing 791,759$ 206,328$ 4,828 Satellite manufacturing 4,937,867 1,379,491 31,262 Ground equipment manufacturing 37,934,507 10,134,674 247,160 VSAT services 2,371,500 624,060 14,467 Satellite data services 2,635,000 693,400 16,075 Transponder leasing 4,321,400 1,137,176 26,363 Mobile satellite telephony 447,950 117,878 2,733 DTH 39,784,600 8,667,120 218,649 Remote sensing 555,282 192,702 5,108 Distribution industries 1,245,881$ 374,916$ 9,803
Total Impacts 95,025,746$ 23,527,745$ 576,448
• Satellite services were the greatest contributor to economic activity and jobs impacts with a total of $49.6 billion in economic activity and 278,287 jobs
• Employment data represent the total number of jobs in all affected industries, not just the industry itself

9
Distribution of Total Economic Activity Impacts
• Satellite services and ground equipment manufacturing contributed the largest portions of economic activity– 80% of Satellite Services impact from DTH TV
Ground equipment manufacturing
40%
Satellite manufacturing5%
Launch vehicle manufacturing
1%
Distribution industries1%
Remote sensing<1%
Satellite services52%

10
Industry 1999 2002 1999 2002 1999 2002
Launch vehicle manufacturing and services 3,515,978$ 791,759$ 1,071,722$ 206,328$ 28,617 4,828 Satellite manufacturing 6,839,132 4,937,867 1,964,415 1,379,491 57,372 31,262 Ground equipment manufacturing 24,030,337 37,934,507 6,893,878 10,134,674 213,076 247,160 Satellite services 25,818,414 49,560,450 6,150,105 11,239,634 186,954 278,287 Remote sensing 235,879 555,282 85,292 192,702 2,820 5,108 Distribution industries 873,971 1,245,881 265,780 374,916 8,506 9,803
Total Impacts 61,313,711$ 95,025,746$ 16,431,192$ 23,527,745$ 497,345 576,448
Economic Activity ($000) Earnings ($000) Employment (Jobs)
Comparison of 1999 and 2002 Impacts
• From 1999 to 2002, economic activity impact increased 55%
• Earnings impact grew 43%
• Jobs created increased about 16%

11
Comparison of 1999 and 2002 Impacts
• While the overall economic impact of commercial space activities has increased, the various industry segments performed differently– Launch vehicle and satellite manufacturing impacts declined
sharply since 1999, primarily due to a sharp decrease in the manufacture and launch of commercial spacecraft
– Satellite services recorded a major increase in economic impact as direct-to-home television and other services attracted more customers
• Gains made by satellite services and ground equipment manufacturing outweighed the decreases in launch vehicle and satellite manufacturing, resulting in a net increase in economic impact from 1999 to 2002
12
Comparison of 1999 and 2002 Impacts
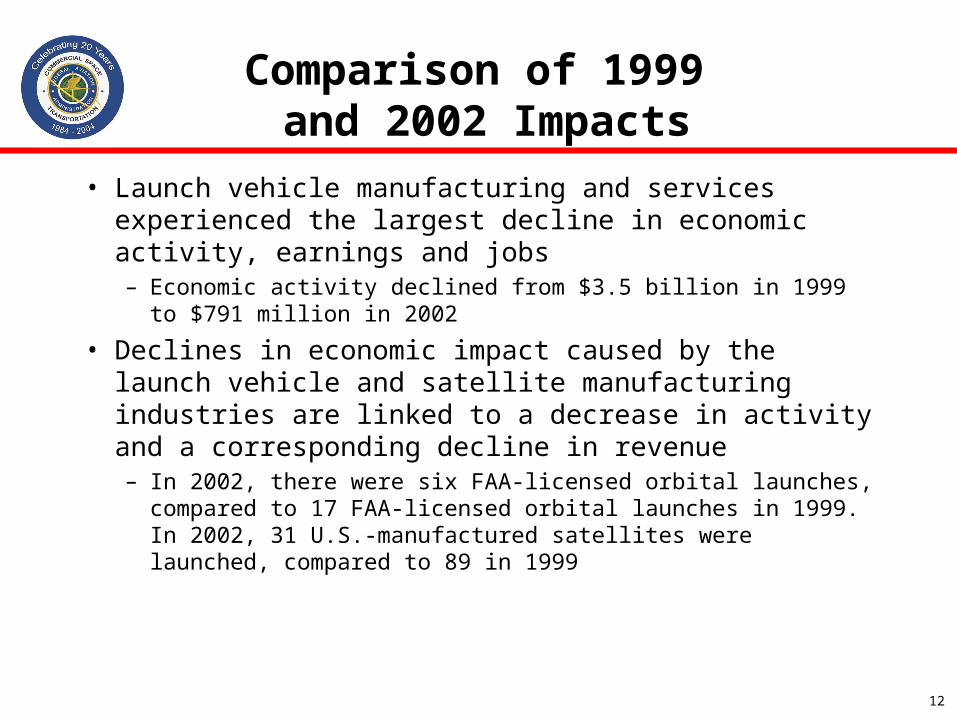
• Launch vehicle manufacturing and services experienced the largest decline in economic activity, earnings and jobs– Economic activity declined from $3.5 billion in 1999 to $791
million in 2002
• Declines in economic impact caused by the launch vehicle and satellite manufacturing industries are linked to a decrease in activity and a corresponding decline in revenue– In 2002, there were six FAA-licensed orbital launches, compared
to 17 FAA-licensed orbital launches in 1999. In 2002, 31 U.S.-manufactured satellites were launched, compared to 89 in 1999

13
Most Affected Industries
• Commercial space transportation affects all major U.S. industry sectors defined by the RIMS model
• In 2002, Communications and Electronic and Other Electronic Equipment industry sectors were the two most affected sectors in terms of additional economic activity, earnings, and jobs– The communications sector includes the sale of satellite services,
telephone communications, cellular service, operation of satellite Earth stations, telemetry and tracking services, and terrestrial Internet, email and fax services
– The electronic and other electric equipment sector includes electrical industrial equipment, such as power transformers, motors and generators; electrical wiring equipment; communications equipment; electronic components, such as electron tubes and semiconductors; and other miscellaneous electrical supplies, such as microprocessors and integrated circuits

14
Industry Comparisons
• Selected national impact studies between 1999 and 2002 for comparison
• All studies used the RIMS II model, except biotechnology, which used IMPLAN (an input-output model similar to RIMS II)
• Economic impact of the civil aviation industry is over 10 times larger than the impact of the commercial space transportation and enable industries, while the impact of shipbuilding industry is 8 times smaller
Industry (year of impacts)Economic Activity
($billion)Earnings ($billion)
Jobs
Civil Aviation (2000) $1,000.0 $310.1 10,000,000
Recreational Fishing (2001) $116.0 $30.1 1,068,000
Commercial Space Transportation and Enabled Industries (2002) $95.0 $23.5 576,000
Commercial Space Transportation and Enabled Industries (1999) $61.3 $16.4 497,000
Biotechnology (1999) $47.0 N/A 437,400
Commercial Shipbuilding (2001) $11.0 $9.4 147,230
Computer and Video Games (2000) $10.5 $7.2 219,000

15
Digital Audio Radio System (DARS)
• DARS segment treated separately because the economic models used in the preparation of the analysis are dependent on the revenue recorded by the various industries studied
• Because XM Satellite Radio and Sirius Satellite Radio are in the early stages of their businesses and are still dependent on outside investment, the model would likely underestimate their impact
Sirius XM Total
Number of subscribers (2003) 261,061 1,360,228 1,621,289
Number of subscribers (2002) 29,947 347,159 377,106Revenues (2003) $12,900,000 $91,800,000 $104,700,000 Revenues (2002) $805,000 $20,181,000 $20,986,000 Net loss (2003) $437,500,000 $584,500,000 $1,022,000,000
Total investment to date $2,400,000,000 $2,100,000,000 $4,500,000,000

16
2004 Study Results Part II
17
Overview
• First attempt by FAA/AST to assess the future economic impact of the commercial launch industry in the United States– Analysis does not include enabled industries
– Impacts only estimated for the year 2010
• 2 scenarios (constrained and robust)
• Analysis can be used to guide discussions of the policies, plans, and investments that may shape the launch industry of 2010

18
Methodology
• Analysis included 3 key factors: – Number of commercial launches expected worldwide in 2010
– GSO, NGSO, sounding rockets, SRLVs (i.e., public space travel)
– Utilized existing forecasts to determine the potential economic impacts
– U.S. market share– Constrained scenario: 10% for commercial orbital and suborbital
launches
– Robust scenario: 60% share for orbital, 75% for suborbital
– U.S. launch revenues
• RIMS II model– Same multipliers as used for launch in Part I
– Multipliers change minimally over time, but can not be forecast
19
Results
• Under the constrained scenario, commercial launch would generate about $496 million in economic activity in 2010, compared to $791 million in 2002
• By contrast, the robust scenario results in economic activity impacts of $3.5 billion--very similar to the actual 1999 results, when the launch industry was far more active than today

20
Results
Economic Impact of the Launch Vehicle Manufacturing and Services Sector in 2010 (Orbital Component Only)
Economic Impact of the Launch Vehicle Manufacturing and Services Sector in 2010 (Suborbital Component Only)
Constrained Robust
Economic Activity ($000) 454,528$ 3,263,805$ Earnings ($000) 118,448$ 850,531$ Employment (Jobs) 2,772 19,901
Constrained Robust
Economic Activity ($000) 42,227$ 295,590$ Earnings ($000) 11,004$ 77,029$ Employment (Jobs) 257 1,802
•Suborbital component comprises <10% of total impacts

21
Results
Economic Impact of the Launch Vehicle Manufacturing and Services Sector in 1999, 2002, and 2010
•Robust scenario results 7 times larger than constrained scenario and 4.5 times greater than 2002 actual results
•Robust scenario very similar to 1999 actual results
1999Results
2002Results
2010Constrained
2010Robust
Economic Activity ($000) 3,515,978$ 791,759$ 496,755$ 3,559,395$ Earnings ($000) 1,071,722$ 206,328$ 129,452$ 927,560$ Employment (Jobs) 28,617 4,828 3,029 21,704

22
Conclusion
• While the overall contribution of enabled industries to the U.S. economy has grown in recent years, the role commercial space transportation itself has played has diminished
• Key difference between 1999 and the robust 2010 scenario is the total number of commercial launches worldwide: 39 in 1999 versus only 25 forecast for 2010
• Bottom Line: The U.S. commercial space transportation industry must become more competitive and capture a greater fraction of the overall market in order to provide the same level of economic impact that it did in 1999