The Economic Effects of Federalism and Decentralization ... · PDF fileThe Economic Effects of...
34
The Economic Effects of Federalism and Decentralization – A Cross-Country Assessment Stefan Voigt Lorenz Blume CESIFO WORKING PAPER NO. 2766 CATEGORY 2: PUBLIC CHOICE AUGUST 2009 An electronic version of the paper may be downloaded • from the SSRN website: www.SSRN.com • from the RePEc website: www.RePEc.org • from the CESifo website: Twww.CESifo-group.org/wpT
Transcript of The Economic Effects of Federalism and Decentralization ... · PDF fileThe Economic Effects of...

The Economic Effects of Federalism and Decentralization – A Cross-Country Assessment
Stefan Voigt Lorenz Blume
CESIFO WORKING PAPER NO. 2766 CATEGORY 2: PUBLIC CHOICE
AUGUST 2009
An electronic version of the paper may be downloaded • from the SSRN website: www.SSRN.com • from the RePEc website: www.RePEc.org
• from the CESifo website: Twww.CESifo-group.org/wp T
CESifo Working Paper No. 2766
The Economic Effects of Federalism and Decentralization – A Cross-Country Assessment
Abstract This paper explores the idea that institutional details matter and that attempts to estimate the economic effects of federalism by employing a simple dummy variable neglect potentially important institutional details. Based on a principal component analysis, seven aspects of both federalism and decentralization are used as variables for explaining differences in (1) fiscal policy, (2) government effectiveness, (3) economic productivity, and (4) happiness. The results show that institutional details do, indeed, matter. Different aspects of federalism impact on the outcome variables to different degrees. This study adds to our knowledge on the transmission mechanisms of federalism and decentralization.
JEL Code: H71, H11.
Keywords: federalism, decentralization, fiscal federalism, economic effects of constitutions, constitutional economics.
Stefan Voigt Chair for Institutional and International
Economics Philipps University Marburg
Barfüßertor 2 35032 Marburg
Germany [email protected]
Lorenz Blume Economics Department
University of Kassel Nora-Platiel-Strasse 4
34127 Kassel Germany
The authors thank participants at research seminars at Erasmus University Rotterdam, the Joseph von Sonnenfels Center at Vienna University, and the Workshop Series in “Law & Economics” at Zurich University, as well as the Solvay Business School at Université Libre Bruxelles, for intriguing questions. Anne van Aaken, Alois Stutzer, and Pierre-Guillaume Méon helped with constructive critique. The paper was finished while Stefan Voigt was a Senior Fellow at the Institute for Advanced Study in Greifswald (Germany).

2
The Economic Effects of Federalism and Decentralization
1 Introduction
Currently, some two dozen federally structured states exist, meaning that out of approximately 200 sovereign states, every eighth state has a federal structure. Population-wise, nearly 40% of the world’s people (i.e., around 2 billion) live in federal states. Moreover, there seems to be a trend toward decentralizing ever more government functions. Even “paradigmatically unitary states” such as the United Kingdom and France are decentralizing or “devolutionizing.” This is reason enough to look at the economic effects of federalism and decentralization.
In a companion paper to this one, Blume and Voigt (2008) derive seven different aspects of federalism and decentralization by drawing on principal components: (1) token executive elections, (2) subnational expenditure, (3) fiscal independence, (4) subnational democracy, (5) federal veto, (6) federal competence, and (7) composition of parliament. Empirically, these aspects are found in various combinations, implying that federally constituted states can be highly centralized and states constituted in a unitary fashion can be highly decentralized (e.g., in terms of subnational expenditure). Based on these insights, we hypothesize that a cross-country analysis to investigate the economic effects of federalism and decentralization should not rely solely on federalism dummies, as some previous empirical studies have done, because potentially crucial institutional details are not explicitly taken into account under that approach.
In this paper, we ask whether the different independent aspects of federalism and decentralization identified in the companion paper have effects on (1) fiscal policy, (2) government effectiveness, (3) economic productivity, and (4) happiness. We run regression analysis for a cross-section of up to 80 countries. Drawing on a federalism dummy often leads to results that are very different from those reached by drawing on the seven aspects mentioned in the paragraph above. In some cases, both the dummy and some of the seven aspects turn out to be significant. In these cases, use of the more detailed variables provides a finer-grained view of the underlying causes provoking the effects. In other cases, the dummy is not significant but one or two of the more precise variables are, providing even more valuable insight.
Three aspects appear to have strong effects on economic variables: electing municipal governments locally, empowering federal units to veto at least some federal-level legislation, and the fractionalization of parliament in terms of the
3
heterogeneity of interests represented therein. Interestingly, these three dimensions display problematic effects both on fiscal policy variables (they are connected with higher budget deficits and more spending on social and welfare services) and government efficiency (being connected with lower levels of government efficiency and higher levels of corruption). Yet, both labor and total factor productivity are significantly higher in federally constituted states.
The rest of the paper is organized as follows. Section 2 develops our hypotheses. Section 3 presents an overview of the empirical evidence on the effects of federalism and decentralization. Section 4 briefly reviews the results of our companion paper. Section 5 contains a description of the regression analysis and posits possible interpretations of the results. Section 6 concludes.
2 Some Theory
One of the foremost scholars of federalism, William Riker, is very critical regarding its economic consequences. Riker (1975, 131) argues that due to the large variety in the organization of federal states, a theory about the operation of federalism is “probably impossible.” He is quite explicit in expressing his doubts about the relevance of this particular constitutional feature (1975, 155): “Nothing happens in a federation because of the federal constitutional arrangements that could not happen otherwise in fundamentally the same way.” Other scholars, however, disagree with this assessment and assert that outcomes emerge precisely because a state is constituted along federal lines.
The conjecture that federalism could have relevant economic consequences draws on a number of theoretical traditions. For example, relying on Hayek (1939), one branch of the literature argues that more information on the functioning of government techniques is produced when constituent governments simultaneously experiment with various solutions. Another branch, going back to Tiebout (1956) and reinforcing the information argument, claims that competition by constituent governments for mobile citizens gives constituent governments incentives to provide their populations with a bundle of collective goods preferred by that population and at a competitive price. These two branches both deal with aspects of horizontal competition between various government units. Another strand of the literature (Olson 1969; Oates 1972) deals with vertical competition, i.e., the relationship between the federal and the state level (and, in particular, potential externalities). Closely related is the literature that deals with common pool and/or moral hazard problems of federalism, especially the difficulty the federal level has in credibly committing to not bail out single constituent states. Better information
4
and/or more adequate government incentives are conjectured to have far-reaching effects on government spending, the quality of governance, and, at the end of the day, on income and growth.
In the literature to date, arguments as to the possible effects that federalism and decentralization might have on our four groups of dependent variables, namely, fiscal policy, government effectiveness, overall productivity, and happiness, are far from being unambiguous such that the expected sign of the coefficient is unclear ex ante. Thus, empirical tests become even more important. The benefits of federal structures are expected to originate from the competition between constituent governments (i.e., from noncooperation) whereas the costs arise from the necessity of cooperating on some issues (i.e., from cooperation).
Possible Effects on Fiscal Policies
Hayek (1939) argues that competition between governments reveals information on efficient ways to provide public goods. Assuming that governments have incentives to make use of that information gives rise to two hypotheses with regard to fiscal policies, namely: Hypothesis #1a: C.p., federal states have lower expenditures (both central government and total government) than unitary states, and the corresponding Hypothesis #2a: C.p., federal states have lower revenues than unitary states. This concept has been explored by others, using various terms, yardstick-competition being one of them (see, e.g., Salmon 1987; Besley and Case 1995).2
Tiebout’s (1956) argument is a little more complicated. In his model, the lower government levels compete for taxpaying citizens, meaning that the lower governments have incentives to cater to citizen preferences. One could thus expect federally organized states to produce fiscal policies more in line with the preferences of the median voter at the local or state level. Whether this automatically translates into lower taxes, lower budgets, and lower deficits is a different question because such an argument implicitly assumes that the median voter would always desire that taxes, budgets, and deficits be low.
Unequivocal predictions concerning the direct effect of a federal structure on revenues, expenditures, and debts are thus impossible. On the other hand,
2 In this section, many competing hypotheses concerning the effects of federalism will be presented. The hypotheses presented by supporters of federalism are denoted with an “a” after the number; those of the critics with a “b.”
5
Tiebout’s argument does support an indirect effect: if (fiscal) policies are more in line with citizen preferences in federal than in unitary states, then the legitimacy of federations should be higher, c.p. This should result in lower monitoring costs for tax compliance, which should, in turn, imply that deficits are lower both due to a lower degree of tax evasion and because less resources are spent on monitoring taxpayers. Thus Hypothesis #3: C.p., federal states should enjoy higher levels of legitimacy than unitary states.
To this point, we have focused on the possible benefits of a federal constitution. We now discuss its possible costs. The multicentered, i.e., federal, provision of public goods could imply that the overall number of bureaucrats is higher in a federal state than in a unitary state. All else equal, this would translate into higher expenditures/deficits in federal states. Additionally, some cooperation between the central government and the constituent governments is required. Resources need to be put into coordinating various activities. Moreover, if both levels of government act as though they have final decision-making power in some policy areas, conflict is likely. Working to resolve these conflicts will also eat up some resources.3 All these considerations lead us to predict that expenditures will be higher in federally constituted states than in unitary ones (Hypothesis #1b) and, correspondingly, that revenues and/or deficits should also be higher in such states (Hypothesis #2b).
The constitutions of federally organized states are difficult to change, meaning that the number of states, their borders, and also their competencies, will be rather stable. This situation also entails costs: reallocating tasks presupposes the consent of those who will not be in charge anymore, which seems unlikely (unless some (possibly efficiency-reducing) compensation is offered). In other words, the rigidities inherent in federalism prevent an efficient (re-)allocation of tasks. Even if the current number and size of states is optimal for the provision of one public good, it is unlikely that it will be optimal for the provision of all public goods. Given that the existing number of states is too high, economies of scale cannot be realized. Tanzi (2000), for one, suspects that those providing public goods will be insufficiently specialized. These considerations tend to reinforce Hypotheses #1b and 2b.
It can be argued that government deficits are simply the difference between revenues and expenditures and that there would, hence, be no need to explicitly
3 Riker (1975, 144) puts this succinctly: “Lawyers, especially constitutional lawyers have a little more work in a federation than in a unitary system: otherwise there is not much difference.”
6
deal with deficits in addition to revenues and expenditures. Such a supposition could be premature, however, if incentives to incur debts differ systematically between federal and unitary states. Given that lower-level government units in unitary states do not have the competence to incur deficits autonomously, but that they do in federal states, federal states are subject to a moral hazard problem not found in unitary states.4 The federal government will regularly issue “no bail-out clauses” but they will not always be credible.5 When they are not, constituent governments have incentives to incur deficits because they expect to be bailed out should they be incapable of repaying their loans. Assuming that a “perfect” solution to this moral hazard problem is unlikely, Hypothesis # 4 seems reasonable: C.p., aggregate government deficit will be higher in federal than in unitary states.
However, a number of factors might mitigate this problem: if there are strong, disciplined parties that are active throughout most of the federation and one party is in charge of the federal as well as most of the constituent governments, party leaders may be able to prevent state officials from externalizing the negative effects of overborrowing (Rodden and Wibbels 2002). This mitigating effect is composed of institutional as well as noninstitutional aspects: the structure of the party system is a consequence of the heterogeneity of the country as well as of its electoral institutions, whereas the dissimilitude of federal and constituent governments is the result of voter choice. Another consideration, namely, the relevance of the number as well as the symmetry of constituent governments for subnational debts, has, again, given rise to competing hypotheses: scholars emphasizing competition between constituent governments argue that a high number of similarly sized states would reduce the danger of noncompetitive cartels. With regard to the issue of overborrowing, Wildasin (1997) argues that large states could become “too big to fail.” In other words, a large number of small states would make the federal government’s no bail-out promise more credible because the cost of letting a small state go bust is less than the cost of letting a large state go bust. On the other hand, it has been argued (Rodden and Wibbels 2002) that large member states can internalize more of the benefits generated by responsible fiscal policies. Similar arguments can be made with
4 The relationship between the central government and the lower units in unitary states might be more aptly described by drawing on principal agent theory and its familiar monitoring problems. For such a view, see Seabright (1996).
5 Rodden (2002, 672) points out that the creditworthiness of the federal level might be jeopardized if it does not bail out the constituent governments.
7
respect to the number of constituent governments: if the implementation of a responsible fiscal policy depends on the ability of the various governments to coordinate their behavior, successful coordination will be more likely when there are fewer players.
Further, the assumption that federal states enjoy borrowing autonomy and local governments of unitary states do not is probably false. In reality, constituent governments have various degrees of borrowing autonomy, and Hypothesis #4 could be mitigated if that autonomy is constrained to a high degree (Rodden 2002). Finally, a no bail-out clause might be more credible if the federal government is itself subject to hard budget constraints. If monetary policy decisions are taken and implemented by a truly independent central bank, this might mitigate the problem of constituent government borrowing.
The final possibly mitigating factor has to do with an institutional detail of many federations: their constituent governments are often represented in an upper chamber in which sparsely populated regions are often overrepresented (Samuels and Snyder 2001). If these areas are mainly populated by fiscally conservative farmers, this could lead to lower fiscal deficits (Rodden 2004). Thus, an empirical test of Hypothesis #4 should explicitly control for these potentially mitigating factors.
There is a recent and intense debate over whether competition within federations leads to a “race to the bottom” or, conversely, a “race to the top” (for a concise survey of the pertinent literature on fiscal competition, see Wildasin 2008). The race to the bottom is expected with regard to norms and standards but also with regard to social and welfare programs. Given that competition in social and welfare spending is even possible, proponents of the race to the bottom view put their faith in the following Hypothesis #5a: C.p., federations are expected to spend less on social and welfare programs than unitary states. Those arguing in favor of a race to the top unsurprisingly argue the exact opposite; hence Hypothesis #5b: C.p., federations are expected to spend more on social and welfare spending than unitary states.
As the above discussion makes very clear, the expected effects of federalism on fiscal policies are murky, to say the least. Empirical tests are, hence, crucial.
Possible Effects on Government Effectiveness
We turn now to the possible effects of federal constitutions on a number of governance indicators. Dozens of governance indicators can be found in the
8
literature; we restrict ourselves to discussing just a few. Following Persson and Tabellini (2003), government effectiveness will be proxied for by the indicator of the same name that is part of the Governance Indicators published by the World Bank (Kaufmann et al. 2005). This indicator combines perceptions of the quality of public service provision, the quality of the bureaucracy, the competence of civil servants, the independence of the civil service from political pressures, and the credibility of the government’s commitment to policies. Second, their variable “graft” will be employed; this variable is intended to reflect the level of corruption in a society. We thus need to deal with possible effects of federal/unitary constitutions on government effectiveness and corruption.
Government effectiveness will depend, at least in part, on the quality of the bureaucrats running the administration. It is possible that government jobs in provincial state capitals are not attractive to highly qualified personnel who prefer working in the private sector but who would be willing to enter government service if the offered position is based in a glamorous capital. This idea gives rise to Hypothesis #6b: government effectiveness is expected to be lower in federal than in unitary states.
Another aspect of government effectiveness is the extent to which a government’s promises are credible. The number of veto players, i.e., those players who have the power to veto a new policy, is usually higher in federal than in unitary states. This means that a greater number of players must consent if the government wants to renege on its promises, implying that the credibility of promises made by federal governments is higher than that of governments of unitary states. In this area of government effectiveness, then, federations are expected to have advantages over unitary governments (Hypothesis #6a).
Because resources spent on rent seeking cannot be allocated into more productive venues they constitute social waste. The question is which type of government, federal or unitary, induces more resources spent on rent seeking. Once again, there are competing predictions. If one assumes that the resources spent on rent seeking are a function of the expected (change of) utility, less resources should be spent under federal constitutions because more actors need to be convinced (the number of veto players argument again) of the necessity of doing so. However, the time dimension might have a countervailing effect. Since the existence of the constituent states is constitutionally guaranteed under federal constitutions but the existence of subnational governments is not guaranteed under unitary constitutions, rent seeking investments under federations might pay off over a higher number of periods and appear, hence, more attractive.

9
For a change, the answer to the question of whether corruption levels will be higher under federal or unitary constitutions is one that has attracted little controversy. Constituent governments will be closer to the people, will be playing infinitely repeated games with local constituents, and will thus be subject to local capture (see, e.g., Tanzi 2000). This concept is summarized in Hypothesis # 7b: Corruption levels will be higher under federal than under unitary constitutions. Shleifer and Vishny (1993) introduce the concept of “efficient corruption,” under which paying once for a favor is sufficient to get it done. “Inefficient corruption” is thus corruption where more than one actor needs to be paid because there is a multitude of actors with some decision-making competence involved in the favor requested. This concept reinforces Hypothesis #7b.
The local capture hypothesis is not completely free of critics, of course. The argument against it is that the behavior of constituent governments is more transparent in federations and politicians are, hence, more accountable for their actions. This would imply that corruption is lower under federal constitutions (Hypothesis #7a). Corruption can also be interpreted as a sign of the inadequacy of a rule system; under dysfunctional rules, even welfare-enhancing activities will often require corrupt behavior. This concept makes it possible to argue that since the constituent units of federal states are closer to the people, it is likely that their rules will be more adequate than those of unitary states. State governments under federal constitutions can be conceptualized as principals, whereas state governments under unitary constitutions are more like agents of the national government. If it is indeed true that principals are less prone to corruption than are agents, Hypothesis # 7a receives additional support.
The above discussion makes it obvious that the expected net effects of federalism on governance indicators are far from crystal clear.
Possible Effects on Productivity
The expected effects of federalism on productivity levels is another murky area. The argument that their higher number of veto players gives federations an advantage over unitary states in terms of commitment capacity has already been made. This higher commitment capacity might have the potential to directly increase total factor productivity. This is closely related to another effect also expected from systems with a high number of veto players: policy swings will be less pronounced as a consequence of changes in the national government. More stable government policies permit private actors to form longer-term expectations, which might, in turn, increase overall productivity. This is the basis for Hypothesis # 8a: c.p., federal constitutions should be correlated with higher levels

10
of productivity than unitary constitutions. But again, this hypothesis can be turned upside down: in a situation where exogenous shocks necessitate swift action, it is likely that federally structured states will find it more difficult to take such action than will unitary governments.
The higher number of veto players in federal states is also conjectured to have the indirect effect of strengthening certain institutions. For example, the independence of central banks is always at risk. However, the greater the number of actors that need to consent to a change in degree of central bank independence, the less likely such change is. A higher degree of central bank independence can itself have positive effects on the credibility of non bail-out promises, as discussed above. If federations are more likely to have truly independent central banks, then inflation rates are likely to be lower, which would, again, be conducive to productivity.
Further, having more than one power center always entails the possibility of power struggles and instability. Instability and high productivity are not often found to co-reside, and Hypothesis # 8b thus reads that c.p. federal constitutions should be correlated with lower levels of productivity than unitary states.
In our discussion of government type and its effects on fiscal policy, we conjectured that federations might enjoy higher levels of legitimacy, which could result in lower deficits. This argument can be extended to productivity: if the (local) public goods provided in federations are more closely aligned with citizen preferences than they are in a unitary state, this can be interpreted to imply that the goods are better tailored to the needs of the regional population, which should, in turn, be reflected in higher levels of total factor productivity.
Beyond Purely Economic Variables
An empirical study of welfare and its determinants is notoriously difficult, but interest remains high in attempting to do so because it would be extremely illuminating to know whether people living under different institutions experience different levels of welfare or utility. During the last decade, many authors have argued that reported levels of life satisfaction (“happiness”) could be an adequate proxy for welfare (e.g., Frey and Stutzer 2000). Why should decentralization and/or federalism have an impact on happiness? Public goods provided in federally organized states are conjectured to be more in line with citizen preferences than in unitary states. If citizen preferences are, on average, taken more seriously in federations than in unitary states, this ought to be reflected in the general satisfaction of the state’s citizens. The corresponding Hypothesis #9

11
reads: C.p., citizens of federal states are expected to express higher levels of general satisfaction with their lives than are citizens of unitary states.
3 Review of Empirical Results
In their book-length study on the economic effects of constitutions, Persson and Tabellini (2003) analyze the effects of constitutional institutions on exactly those groups of variables we discussed in the previous section. Persson and Tabellini control for the effects of federally constituted states by relying on a federalism dummy. They report that the variable was insignificant for explaining differences in rent extraction (2003, 61), but significant for explaining differences in both labor and total factor productivity, with federal systems doing better than unitary ones (2003, 71).
More specific evidence on the effects of federalism on total government spending is found in Rodden (2003), who shows, in a cross-country study covering the period from 1980 to 1993, that in countries in which local and state governments have competence to set the tax base, total government expenditure is lower. Feld et al. (2003) find that more intense tax competition, induced by a federal structure, leads to lower public revenue—at least in the case of Swiss cantons.
The findings as to the effects of federalism on governance indicators (Persson and Tabellini’s second group of dependent variables) are ambiguous. Treisman (2000) finds that federal states have, c.p., higher corruption levels than unitary states. Fisman and Gatti (2002), on the other hand, find that fiscal decentralization is strongly and significantly associated with lower corruption levels. However, these results only seem contradictory: Treisman relies on a dummy variable for federal states, whereas Fisman and Gatti really deal with fiscal decentralization, which they proxy for by the share of subnational spending over total government spending. It obviously matters a great deal whether one is interested in the effects of federalism or the effects of decentralized provision of public goods. Several, more recent, papers emphasize that decentralization can have various dimensions: Gerring et al. (2006) find that unitarism and various governance measures are strongly—and positively—correlated. They find not only significant statistical but also significant substantive correlation with the absence of corruption, bureaucratic quality, number of phone lines, more trade openness, and fewer infant deaths, as well as higher literacy rates. Dreher (2006) finds that higher subnational revenue, expenditure, and employment are correlated with better values in governance indicators proxied for the rule of law, law and order, time to start a business, and judicial independence. Freille (2006) contains the intriguing
12
finding that both fiscal decentralization and constitutional centralization (i.e., unitarism) are simultaneously associated with lower corruption. Drawing on data that became available since his earlier work, Treisman (2007, 235) now finds that the correlation between perceived corruption and federal structure is not at all robust.
The available evidence as to the effects of federalism (or decentralization) on income and growth is equally ambiguous. There are only half a dozen studies that employ a cross-country approach and most of them deal only with OECD members. With a cross-section of 91 countries, Enikopolov and Zhuravskaya (2003) is an exception. They find that higher decentralization of revenue is correlated with lower real GDP per capita growth rates in developing countries. Davoodi and Zou (1998) report similar results based on decentralization of spending in 46 countries. Thießen (2003a, 2003b) finds the opposite for a cross-section of 21 developed countries and a panel of 26 countries. Feld et al. (2004) survey the literature in more detail, including empirical results for individual countries. The results of these studies are just as ambiguous as those mentioned here. We argue that the inconsistent results are due not only to the insufficient distinction between federalism and decentralization, but also to the very coarse measures that have been used for delineating federations.
4 Seven Independent Aspects of Federalism and Decentralization
To test the hypotheses developed in Section 2 of this paper, we need indicators for federalism and decentralization. In our companion paper (Blume and Voigt 2008), we reject the idea of having “a” single all-encompassing indicator of federalism. Federal states are a very heterogeneous lot and many—possibly important—differences will not be appropriately accounted for if we try to compress all differences into one single dimension. Whereas the term federalism refers to a constitutional decision, the actually realized degree of (fiscal, political, or administrative) decentralization is a consequence of policy choices made on the post-constitutional level. The degree of decentralization can thus be largely independent from the constitutional choice. We therefore work with a number of different indicators that focus on different aspects of federalism and decentralization as this may allow us to nail down the specific institutional arrangements that are responsible for differences, if any, in outcomes.
To answer the question of whether this concept is reflected in the data, the companion paper runs a factor analysis drawing on 25 indicators that have been used as variables for both federalism and decentralization. We find significantly
13
more than two latent constructs, indicating that the distinction between federalism and decentralization is still too coarse. Indeed, seven aspects of federalism and decentralization can be separated from each other. These seven aspects account for some 70 percent of the variation in the 25 original variables. We present them in the order of their eigenvalues.
(1) The first aspect merges the elements of democracy on the subnational level (namely, whether local and regional governments are elected) with the competence of the center to override decisions of the lower government tiers. We call this aspect token executive elections. It is best represented by Kearney’s (1999) original variable LOCEXE, which indicates whether local executives (but not legislatives) are directly or indirectly elected.
(2) The second aspect is primarily composed of the subnational share of total expenditure and the subnational revenues out of own resources. This covers an important aspect of fiscal decentralization. We call it subnational expenditure. It is best represented by the original variable DECEXP, from the IMF’s Government Finance Statistics Yearbooks, which reflects the subnational share of total expenditure.
(3) The third aspect centers on vertical transfers; we term it fiscal independence. It is best represented by the original variable TRANSFER, again from the IMF’s Government Finance Statistics Yearbooks, which is a proxy for vertical imbalance reflecting the transfers to subnational governments as a share of subnational government expenditures.
(4) The fourth aspect primarily deals with democratic elections at the subnational level; it also includes a variable on the age of parties, thus reflecting subnational democracy. It is best represented by the original variable MUNI, from the Database of Political Institutions provided by the World Bank (Beck et al. 2000), which documents whether municipal legislatures and governments are locally elected.
(5) The fifth aspect is driven by two constitutional variables, namely, the competence of the subnational levels to veto national legislation or to veto national legislation regarding finance issues. We call it federal veto. It is best represented by the original variable SUBVETO, constructed by Treisman (2002), which deals with the competence of the constituent units to block (certain kinds of nonfinancial) legislation.
(6) The next aspect deals with another core aspect of federalism, namely, the issue of whether the states have some residual autonomy. It also reflects some important fiscal aspects that we would expect federations to have. We call it federal competence. It is best represented by the original variable REVSHARE, also produced by Kearney (1999), which represents the right

14
of the lower government levels to a portion of the revenues transferred to them in a regular and unconditional fashion.
(7) The seventh, and last, aspect, deals with the composition of parliament. It thus deals, again, with an aspect of democracy, here not on the institutional level but, rather, on the policy level. It is best represented by the original variable GOVFRAC, provided by Beck et al. (2000) and picked up by Enikolopov and Zhuravskaya (2006), which reflects the probability that two deputies picked at random from among the government parties will be of different parties. The lower this value, the stronger the governing party.
In summary, the companion paper identifies seven independent components out of a data set of 25 variables often used to measure federalism and decentralization, three of which deal more with democracy, (1, 4, and 7), two with fiscal decentralization issues (2 and 3), and two with federalism in a narrow sense (5 and 6). The regressions are not run with the derived factors but with those single variables displaying the highest factor loadings on the factors, the reason being that the original variables are easier to interpret.6
Table 1 provides descriptive statistics for the variables that will be used as proxies for the seven aspects identified by factor analysis.
Table 1: Descriptive Statistics
Name Description N Mean Min Max SD
locexe local elections executive 46 2.17 0.00 4.00 2.01
decexp share of expenditures 85 22.15 0.37 65.39 16.87
transfer share of transfers 91 34.56 0.16 98.12 26.33
muni local elections 77 1.31 0.00 2.00 0.83
subveto right to block legislation 133 0.33 0.00 2.00 0.66
revshare autonomous revenues 46 2.00 0.00 4.00 1.26
govfrac fractionalization of gov. 131 0.28 0.00 0.88 0.29
Table 2 sets forth the bivariate correlations of these seven variables. Although a number of correlations are significant, not a single correlation is larger than 0.4. This indicates that the seven variables reflect seven dimensions of both federalism and decentralization that are largely independent from each other. Moreover, Table 2 reveals that the most frequently used federalism dummies reflect three of
6 The estimates based on the factors are very similar to those based on the most important single variable here presented.

15
the seven dimensions in particular, namely, fiscal decentralization, national legislation veto powers of subnational units, and revenue autonomy. Conceptually, the first of these three has more to do with decentralization.7
Table 2: Bivariate Correlations of the Seven Aspects of Federalism and Decentralization as Well as Their Correlations with Federalism Dummies
Name locexe decexp transfer muni subveto revshare govfrac
locexe
1
decexp 0.396* (34)
1
transfer 0.247 (35)
0.138 (78)
1
muni 0.356 (27)
0.217 (44)
0.034 (46)
1
subveto 0.229 (46)
0.299**(85)
0.123 (90)
0.141 (73)
1
revshare 0.209 (46)
0.384* (34)
-0.016 (35)
0.000 (27)
0.334* (46)
1
govfrac 0.044 (45)
0.148 (81)
0.034 (86)
-0.027 (74)
0.031 (126)
0.169 (45)
1
federalism dummies#
0.284 (46)
0.360**(85)
0.059 (91)
0.129 (77)
0.421**(133)
0.386** (46)
0.132 (131)
** and * signify that the Bravais Pearson correlation is significant at the 1 or 5 percent level, respectively. # Mode of the federalism dummies used by Elazar (1995), Kearney (1999), Watts (1999), Derbyshire and Derbyshire (1999), the Forum of Federations (2002), and the CIA World Factbook (2006).
The main conclusion of this section is that indicators of federalism and decentralization should aim at keeping conceptually different dimensions, such as revenue autonomy and constitutional veto powers, separate. In the cross-country analysis of economic effects in the next section, we therefore rely on the seven variables mentioned here as proxies for the seven aspects of federalism and decentralization in our companion paper.
5 Estimation Approach and Results
Our estimation approach is straightforward and based directly on the theoretical section of this paper. We are interested in estimating the dependent variable, Y, that can stand for (1) various aspects of fiscal policy, including the perceived
7 A table containing the bivariate correlations between the seven factors (instead of the seven variables with the highest loadings) is superfluous. All values below the main diagonal are exactly 0 as principal component analysis generates the factors such that their partial correlations are nil.
16
legitimacy of the state, (2) government effectiveness, (3) economic productivity, or (4) reported levels of life satisfaction (“happiness”) of a country.
Yi = αi + β Mi + γ FDi + δZi + ui
The fiscal policy variables are mainly taken from the data set used by Persson and Tabellini (2003), i.e., central government expenditure as a percentage of GDP (CGEXP), central government revenue as a percentage of GDP (CGREV), central government surplus as a percentage of GDP (SPL), and central government expenditures consolidated on social services and welfare as a percentage of GDP (SSW). An additional variable, the total government expenditures as share of GDP (TOTEXP), is taken from Heston et al. (2002). CGEXP, CGREV, and TOTEXP are chosen to test Hypotheses 1 and 2, SPL for testing Hypothesis 4, and SSW for testing Hypothesis 5. Another effect related to fiscal policy, as well as to government efficiency, is conjectured to be the consequence of the Tiebout vision of federal competition: if the public goods bundles provided by the different constituent governments more closely reflect the preferences of the their citizens, the legitimacy that citizens attribute to federal states is predicted to be higher than that attributed to unitary states. As no direct indicators of legitimacy are readily available, we use the answer to a question contained in the World Values Survey dealing cheating on taxes (“Please tell me for each of the following statements whether you think it can always be justified, never be justified, or something in between: … Cheating on tax if you have the chance [% “never justified” coded 1 on a 10-point scale where 1 = never and 10 = always]). On the one hand, this variable (CHEATING) is a crude proxy for legitimacy; on the other, it serves our purposes well as the conjecture is that higher degrees of legitimacy should have positive effects on fiscal variables (less expenditure, fewer deficits) as well as on productivity. The relationship between the proxy and the fiscal variables ought to be straightforward. The variable CHEATING is chosen to test Hypothesis 3.
The next endogenous variable on government efficiency (GOVEF) is taken from the Governance Indicators of the World Bank (Kaufmann 2005). It combines perceptions of the quality of public service provision, the quality of the bureaucracy, the competence of civil servants, the independence of the civil service from political pressures, and the credibility of the government’s commitment to policies into a single indicator on a scale between 0 and 10, where higher values signal higher effectiveness. We take the average values for 1996,
17
1998, 2000, 2002, and 2004. According to the Governance Indicators of the World Bank, the variable GRAFT focuses on perceptions of corruption. It has values between 0 and 10, where lower values signal higher effectiveness. An alternative measure is the Corruption Perceptions Index (CPI) from Transparency International, measuring perceptions of abuse of power on a scale of 0–10 (lower values meaning lower levels of corruption). We take the average over the years 2000–2005. The variable GOVEF is chosen to test Hypothesis 6 and the variables GRAFT and CPI to test Hypothesis 7.
As productivity measures for testing Hypothesis 8, we use the natural logarithm of output per worker (LOGYL) for the year 2000 and the natural logarithm of total factor productivity (LOGA) calculated for the year 2000 on the basis of a Cobb-Douglas function following the model of Hall and Jones (1999). Beyond the impacts that federalism and decentralization have on fiscal policies, governance indicators, and overall productivity, defenders of decentralization could argue that having one’s government close would be a value per se, that it would be a good thing even if it did not have any productivity increasing effect (Hypothesis 9). Therefore, we also look at cross-country differences in “happiness” according to happiness surveys collected by Veenhoven (2004) and arranged on a 10–0 scale, with higher values signaling higher happiness (HAPPINESS).
The vector M is made up of a number of standard variables conventionally used to explain the respective Y along the lines of Persson and Tabellini (2003).
FD is one of our seven aspects of federalism and decentralization. Since the seven aspects are based on independent (uncorrelated) components identified by a factor analysis, the regression coefficients would not change significantly if all the variables were put into one regression. Differences are due only to differences in the country sample (because the seven different indicators are available for different countries); we therefore abstain from showing a regression with all seven variables in one estimation. As a benchmark, we also show a regression with a dummy variable for federalism. This variable is the mode of the federalism dummies used by Elazar (1995), Kearney (1999), Watts (1999), Derbyshire and Derbyshire (1999), the Forum of Federations (2002), and the CIA World Factbook (2006).
The cross-section analysis is performed with the OLS technique, while inference is based on t-statistics computed on the basis of White heteroscedasticity-consistent standard errors. To control for possible endogeneity, we run Hausman tests on the basis of instruments proposed by Panizza (1999), who identifies the determinants of fiscal centralization drawing on Tobit estimates and some 60
18
countries. Depending on the specification, per capita income, the geographical size of a country, its level of ethnolinguistic fractionalization, and the realized degree of democracy proved to be significantly correlated with the degree of fiscal centralization. We therefore decided to use the natural logarithm of real GDP per capita (LYP), the natural logarithm of total population in millions (LPOP), the index of ethnolinguistic fractionalization (AVELF), and the age of democracy (AGE) as instruments. Except for one variable (GOVFRAC), the Hausman test is usually insignificant. Endogeneity is, hence, not a severe problem.
The Z vector is comprised of a number of control variables that can be geographical, historical, political, or economic, as well as institutional. In the theoretical section, we pointed out that high expenditure levels could be the result of median voter preferences for costly public good bundles. It is thus necessary to control for voter preferences. Ideally, this could be done by controlling for the fiscal or ideological preferences of the electorate. Two measures were used here: the first one measures the degree of fiscal conservatism of the voters; the second one reflects ideological preferences of legislative and executive majorities. The first measure is taken from the World Values Survey. There are two variables, one aiming at the self-evaluation of the surveyed person, the other aiming at his or her normative ideal for the entire society.8 The second measure is taken from Whytock (2006), who coded political party affiliations of the executive and legislative branches according to the following scheme: –1 if both the executive branch and legislative branch are right-leaning ideologically (with the negative sign implying lower expected government spending) and +1 if both the executive and the legislative branch are left-leaning (0 otherwise).
Of course, it could be the case that federalism and decentralization have substantial effects only in combination with other constitutional institutions. Remember that Riker (1964, 1975) conjectures that there is a very close correlation between the party structure and the kind of federation in a given country: “most writers identify the decentralization of parties as a correlate (or in some cases even a consequence) of the federal constitution” (1975, 133). We propose to turn this argument on its head: electoral systems are probably the
8 The wording of the two questions is as follows: “In political matters, people talk of ‘the left’ and ‘the right.’ How would you place your views on this scale, generally speaking?” (left–right 1–10); “And now, could you please tell me which type of society your country should aim to be in the future. For each pair of statements, would you prefer being closer to the first or to the second alternative? A society with extensive social welfare, but high taxes. A society where taxes are low and individuals take responsibility for themselves” (somewhat closer to, on a scale 1–5).

19
single most important determinant of the number of parties in a country. The number of parties is, of course, logically correlated with the degree of party fractionalization. This implies that the electoral system determines the kind of federalism to be expected in a country. C.p., federal countries with majority rule as an electoral system are expected to implement more centralized versions of federalism than countries relying on proportional representation. This entails the possibility that the electoral system displays an effect on economically relevant variables not only directly, but also indirectly via the kind of federalism it induces. This possibility is explicitly controlled for by including the variable MAJ in the Z-vector. Another intricate interdependence is also derived from Riker (1975, 110). Federations need to produce a stable balance between the loyalty their citizens feel toward the constituent governments and that they feel toward the central government. With regard to the United States, Riker claims that the independence of the presidency was a crucial feature that permitted the development of a national orientation of loyalty. C.p., federations coupled with presidential government forms will be more stable than federations coupled with parliamentary government. If, in turn, stability is conducive to higher productivity, then the form of government ought to be explicitly taken into account. We do this by including the variable PRES in the Z-vector.
Finally, the Z-vector includes geographic controls (ASIAE, LAC, and SSA) and we also include legal origins (COMMLAW) as a control variable.
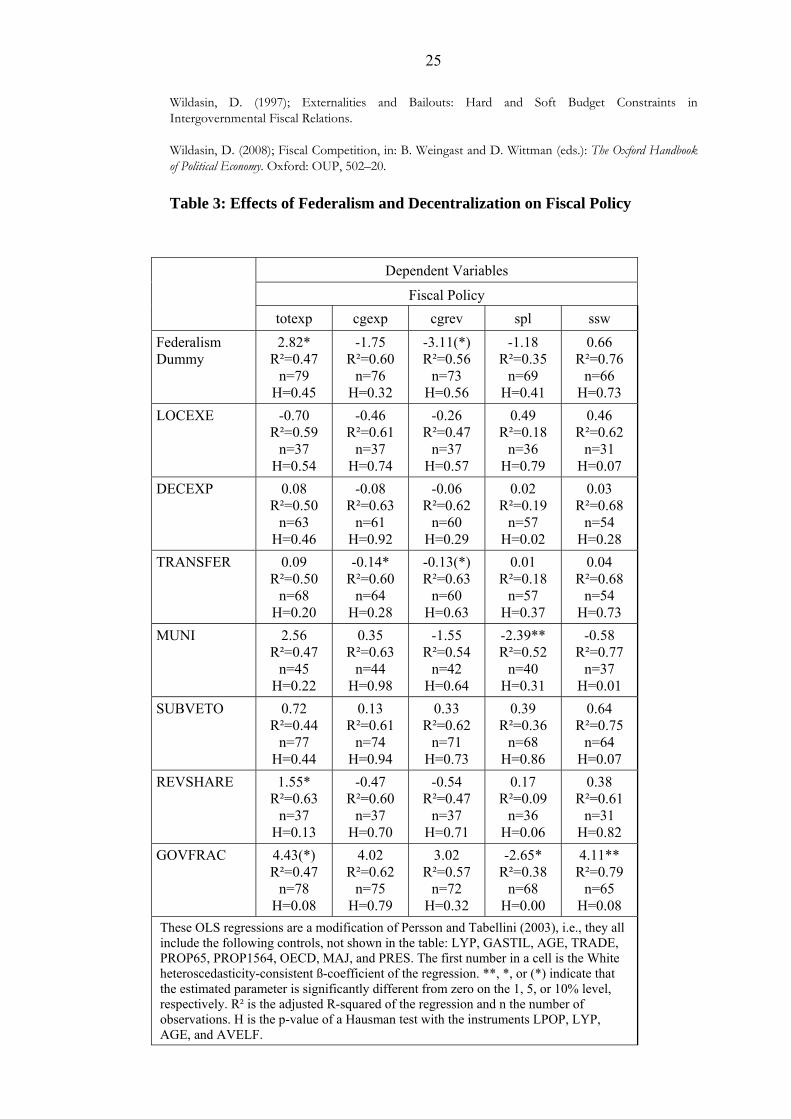
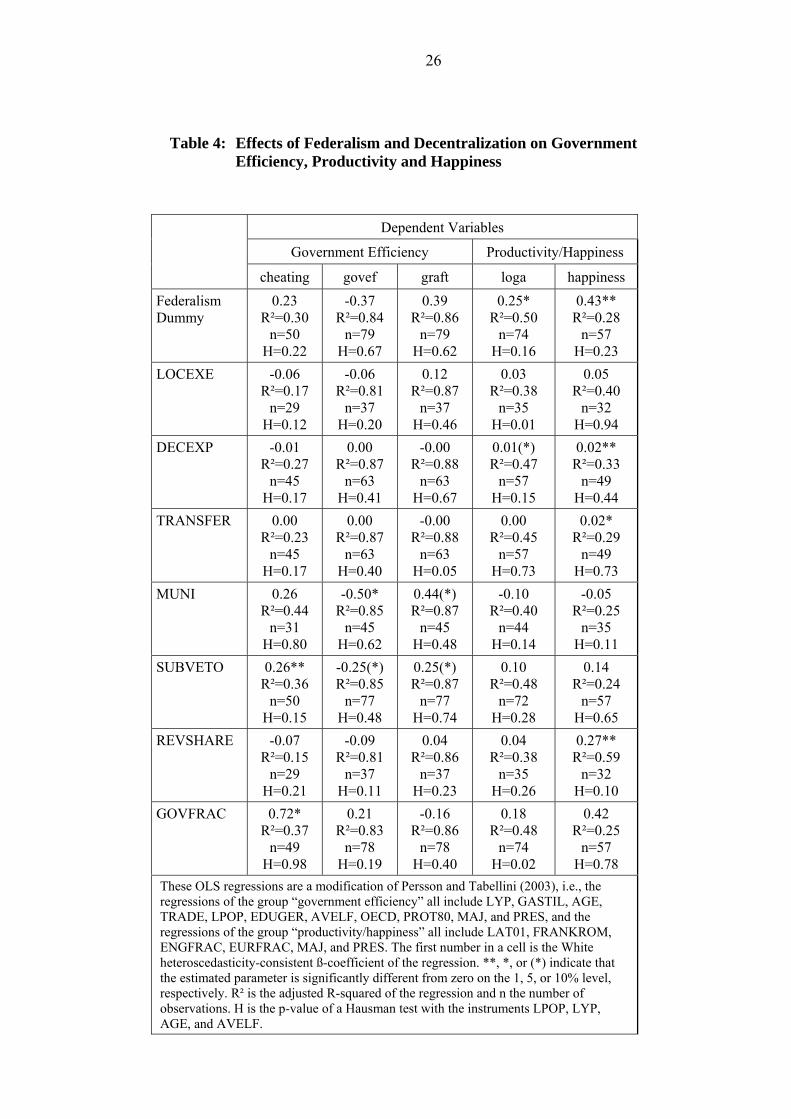
The results are summarized in Tables 3 and 4.9 A number of findings are particularly noteworthy.
(1) Institutional details clearly matter! The central motivation for conducting this study was our conjecture that a simple dummy variable for federalism cannot do justice to the various dimensions of federalism. Given that the dummy turns out to be significant, our more precise estimates allow us to pin down which aspect of federalism drives the result. Even more interesting is the finding that with regard to the variables budget surplus (SPL), expenditures and social services and welfare (SSW), cheating, government effectiveness, and graft (and the Corruption Perceptions Index (CPI)), the federalism dummy is not significant, but particular aspects of federalism are, some of them at a very high level of significance.
9 The results for CPI are very similar to those of GRAFT. This is also the case for the results of LOGYL, which are almost identical to those of LOGA. We thus do not report these results in the tables.
20
(2) With regard to total government expenditure (Column 1 of Table 3), the federalism dummy has a positive sign and is significant at the 5% level. Looking at the seven aspects used here to proxy for both federalism and decentralization allows us to identify REVSHARE (representing the unconditional right of lower government levels to a portion of the government revenues) and GOVFRAC (representing the fractionalization of parliament) as the two variables driving this result. The effect of REVSHARE on total government expenditure is economically substantial: a one standard deviation increase in REVSHARE is connected with an increase of 2% in total government expenditure and a one standard deviation increase in GOVFRAC is connected with an increase in overall government spending of 1.3%. This can be interpreted as some evidence in support of Hypotheses 1b and 2b.
(3) The dummy variable indicates a positive correlation between federalism and output per worker (as well as total factor productivity; Column 4 in Table 4). Both effects can be ascribed to DECEXP (the subnational share of expenditures). The higher this is, the higher both types of productivity. A one standard deviation increase of DECEXP is connected with an increase in output per worker of US$ 1,185. This variable is thus obviously economically significant, which can be interpreted as evidence in favor of Hypothesis 8a.
(4) As already pointed out, the federalism dummy has no significant correlation with either budget surplus or expenditures on social services and welfare (Columns 4 and 5 in Table 3). However, drawing on the more fine-grained indicators, a different picture emerges. Both MUNI (indicating whether municipal governments are locally elected) and GOVFRAC are negatively correlated with budget surplus, indicating that the presence of these institutional features leads to higher deficits. A one standard deviation increase in MUNI is connected with a 2-point increase of the deficit as a share of GDP. GOVFRAC has an effect of .8 points. This can be interpreted as evidence in favor of Hypothesis 2b (Columns 1–3 in Table 4).
(5) Similar results obtain when government efficiency is the dependent variable. In none of the four proxies chosen is the federalism dummy significant. However, analyzing the seven aspects again paints a different picture. This is particularly the case for the two variables taken from the Worldwide Governance Indicators. High levels of MUNI are correlated with lower levels of government effectiveness and higher corruption. SUBVETO (proxying for the competence of the constituent units to veto certain kinds of legislation) has similar effects. Similar results emerge when CHEATING

21
is used as the dependent variable. The results can be interpreted as a corroboration of Hypotheses 6b and 7b.
(6) It is noteworthy that of the seven aspects resulting from the principal component analysis, only one is never significantly correlated with any of our outcome variables, namely, LOCEXE. But taking into consideration that LOCEXE indicates the presence of token executive elections, this is in line with our priors.
(7) For explaining variation in both fiscal policies as well as government effectiveness, only four of the seven aspects are ever significant. The effects of these four aspects would not be greeted with cries of pleasure by very many: they lead to higher total government expenditures, to higher budget deficits, to higher spending on social services and welfare, to lower government effectiveness, and to higher levels of corruption. Even more surprising is that output per worker as well as total factor productivity are positively correlated with some of the aspects analyzed here. One possible transmission channel could be via happiness, discussed next.
(8) The correlation between our measure of happiness and the federalism dummy can be interpreted as empirical evidence in favor of Hypothesis 9. Our approach allows us to identify the specific institutional features behind that result. A one standard deviation increase in DECEXP, TRANSFER, and REVSHARE leads to fairly similar improvements in levels of reported life satisfaction (between 0.328 and 0.527 points). One could speculate that gains in happiness more than make up for problematic fiscal policies and government effectiveness. But this is only speculation.
(9) Finally (but not shown in the tables), we asked whether there are substantial nonlinear effects by estimating the quadratic term of our explanatory variables. Inclusion of the quadratic term at times increases the precision of the estimates. Taking central government revenues as the dependent variable, the coefficient of DECEXP is now 0.356 and significant at the 95% level. Although the quadratic term is also significant, its size is negligible (–0.008). A similar result obtains when social and welfare spending is the dependent variable. Now, the coefficient of DECEXP is 0.26 and it is significant at the 95% level. The effects are also substantially important: a one standard deviation increase in DECEXP is connected with an almost 6-point increase in central government revenues and a 4.4-point increase in social and welfare spending.
22
6 Conclusion and Outlook
This paper is based on the assumption that federalism and decentralization are two distinct concepts that not only can be kept separate theoretically, but that are also empirically combined in manifold ways: there are federally structured states that are decentralized, and also federally structured states with a high degree of centralization. On the other hand, unitary states can also be highly decentralized. This paper complements a companion paper (Blume and Voigt 2008) in which seven aspects of federalism/decentralization are identified by drawing on 25 frequently used indicators of both federalism and decentralization. Based on these seven aspects, the economic effects of federalism and decentralization are estimated in this paper.
The results show that institutional detail matters: drawing on a federalism dummy often leads to results that are very different from those reached by drawing on the seven aspects. In some cases, both the dummy and some of the seven aspects are significant. In these cases, use of the more detailed variables provides a finer-grained view of the underlying causes provoking the effects. In other cases, the dummy is not significant but one or two of the more precise variables are, providing even more valuable insight.
Three aspects seem to have strong effects on economic variables: electing municipal governments locally, empowering federal units to veto at least some federal-level legislation, and the fractionalization of parliament in terms of the heterogeneity of interests represented therein. Interestingly, these three dimensions display problematic effects for both fiscal policy (they are connected with higher budget deficits and spending on social and welfare services) and government efficiency (being connected with lower levels of government efficiency and higher levels of corruption). Yet, both labor and total factor productivity are significantly higher in federally constituted states. We speculate that this may be due, at least in part, to the higher levels of happiness reported in federal states.
These results should be interpreted with caution: the number of available observations depends on the specific indicator, which means that some of the differences could be due to differences in the sample (rather than the variable used). This calls for an extension in the number of available observations.
Methodologically, the impact of both federalism and decentralization could also be ascertained by looking at countries that have changed their institutional setup.
23
One of the foremost scholars of federalism, William Riker, claimed that “[n]othing happens in a federation because of the federal constitutional arrangements that could not happen otherwise in fundamentally the same way.” He might be right in stating that things can happen in the same way; however, we show that in may cases, it is unlikely that they will.
References
Beck, Th., G. Clarke, A. Groff, Ph. Keefer, P. Walsh (2000); New Tools and New Tests in Comparative Political Economy: The Database of Political Institutions. Washington, DC: World Bank.
Besley, T., and A. Case (1995); Incumbent Behavior: Vote-Seeking, Tax-Setting, and Yardstick Competition, American Economic Review, 85(1):25–45.
Blume, L., and S. Voigt (2008); Federalism and Decentralization—A Critical Survey of Frequently Used Indicators, available at: http://papers.ssrn.com/sol3/papers.cfm?abstract_id=1263995.
Blume, L., Müller,J., Voigt, S., & Wolf, C. (2009). The Economic Effects of Constitutions: Replicating – and Extending – Persson and Tabellini, Public Choice 139:197-225.
Davoodi, H., and H. Zou (1998); Fiscal Decentralization and Economic Growth: A Cross-Country Study, Journal of Urban Economics, 43:244–57.
Derbyshire, J., and I. Derbyshire (1999); Political Systems of the World, 3rd ed. Oxford: Helicon.
Elazar, D. (1995); From Statism to Federalism: A Paradigm Shift, Publius, 25(2):5–18.
Enikolopov, H., and E. Zhuravskaya (2006); Decentralization and Political Institutions, CEPR Discussion Paper No. 3857.
Feld, L, G. Kirchgässner, and Chr. Schaltegger (2003); Decentralized Taxation and the Size of Government: Evidence from Swiss State and Local Governments, CESifo Working Paper 1087, December.
Feld, L. and S. Voigt (2003); Economic Growth and Judicial Independence: Cross Country Evidence Using a New Set of Indicators, European Journal of Political Economy 19(3).497-527.
Feld, L. P., Zimmermann, H., & Döring, Th. (2004). Federalism, Decentralization and Economic Growth, Discussion Paper Series “Fiscal Federalism and national growth”, No.1, University of Marburg, Germany.
Fisman, R., and R. Gatti (2002); Decentralization and Corruption: Evidence Across Countries, Journal of Public Economics, 83:325–45.
http://www.forumfed.org/federalism/cntrylist.asp?lang=en.
Freille, Sebastian (2006); Federalism, Decentralization and Corruption, available at: http://www.ssrn.com.
Frey, B., and A. Stutzer (2000); Happiness, Economy and Institutions, Economic Journal, 110(466):918–38.
Gerring, J., Str. Thacker, and C. Moreno (2006); Are Federal Systems Better Than Unitary Systems? Mimeo, Boston University.
24
Hayek, F. v. (1939); Economic Conditions of Inter-State Federalism, New Commonwealth Quarterly, S.131–49.
Olson, M. (1969); The Principle of Fiscal Equivalence: The Division of Responsibilities Among Different Levels of Government, American Economic Review, 59:479.
Panizza, U. (1999); On the Determinants of Fiscal Centralization: Theory and Evidence, Journal of Public Economics, 74:97–139.
Persson, T., and G. Tabellini (2003); The Economic Effects of Constitutions. Cambridge, MA: MIT Press.
Riker, W. (1964); Federalism: Origins, Operation, Significance. Boston: Little Brown.
Riker, W. (1975); Federalism, in: F. I. Greenstein and N. Polsby (eds.): The Handbook of Political Science, Volume V: Government Institutions and Processes. Reading, MA: Addision Wesley.
Rodden, J. (2002); The Dilemma of Fiscal Federalism: Grants and Fiscal Performance Around the World, American Journal of Political Science, 46(3):670–87.
Rodden, J. (2003); Reviving Leviathan: Fiscal Federalism and the Growth of Government, International Organization, 57:695–729.
Rodden, J. (2004); Comparative Federalism and Decentralization—On Meaning and Measurement, Comparative Politics, 36(4):481–500.
Rodden, J., and E. Wibbels (2002); Beyond the Fiction of Federalism—Macroeconomic Management in Multitiered Systems, World Politics, 54:494–531.
Salmon, Pierre (1987); Decentralization as an Incentive Scheme, Oxford Review of Economic Policy, 3:24–43.
Samuels, D., and R. Snyder (2001); The Value of a Vote: Malapportionment in Comparative Perspective, British Journal of Political Science, 31:651–71.
Seabright, P. (1996); Accountability and Decentralization in Government: An Incomplete Contracts Model, European Economic Review, 40:
Tanzi, V. (2000); Some Politically Incorrect Remarks on Decentralization and Public Finance, in: J.-J. Dethier (ed.): Governance, Decentralization and Reform in China, India and Russia. Boston: Kluwer, 47–63.
Thießen, U. (2003a); Fiscal Decentralization and Economic Growth in High Income OECD Countries, Fiscal Studies, 24(3): 237–74.
Thießen, U. (2003b); Fiscal Federalism in Western European and Selected Other Countries: Centralization or Decentralization? What is Better for Economic Growth, DIW Berlin.
Tiebout, Ch. (1956); A Pure Theory of Local Expenditures, Journal of Political Economy, 64:416–24.
Treisman, D. (2000); The Causes of Corruption: A Cross-National Study, Journal of Public Economics, 76:399–457.
Treisman, D. (2002); Defining and Measuring Decentralization: A Global Perspective. Mimeo: Department of Political Science, UCLA.
Treisman, D. (2007); What Have We Learned About the Causes of Corruption from Ten Years of Cross-National Empirical Research? Annual Review of Political Science, 10:211–44.
Watts, R. L. (1999); Comparing Federal Systems, 2nd ed. Ontario: Institute of Intergovernmental Relations.
25
Wildasin, D. (1997); Externalities and Bailouts: Hard and Soft Budget Constraints in Intergovernmental Fiscal Relations.
Wildasin, D. (2008); Fiscal Competition, in: B. Weingast and D. Wittman (eds.): The Oxford Handbook of Political Economy. Oxford: OUP, 502–20.
Table 3: Effects of Federalism and Decentralization on Fiscal Policy
Dependent Variables
Fiscal Policy
totexp cgexp cgrev spl ssw Federalism Dummy
2.82* R²=0.47
n=79 H=0.45
-1.75 R²=0.60
n=76 H=0.32
-3.11(*) R²=0.56
n=73 H=0.56
-1.18 R²=0.35
n=69 H=0.41
0.66 R²=0.76
n=66 H=0.73
LOCEXE -0.70 R²=0.59
n=37 H=0.54
-0.46 R²=0.61
n=37 H=0.74
-0.26 R²=0.47
n=37 H=0.57
0.49 R²=0.18
n=36 H=0.79
0.46 R²=0.62
n=31 H=0.07
DECEXP 0.08 R²=0.50
n=63 H=0.46
-0.08 R²=0.63
n=61 H=0.92
-0.06 R²=0.62
n=60 H=0.29
0.02 R²=0.19
n=57 H=0.02
0.03 R²=0.68
n=54 H=0.28
TRANSFER 0.09 R²=0.50
n=68 H=0.20
-0.14* R²=0.60
n=64 H=0.28
-0.13(*) R²=0.63
n=60 H=0.63
0.01 R²=0.18
n=57 H=0.37
0.04 R²=0.68
n=54 H=0.73
MUNI 2.56 R²=0.47
n=45 H=0.22
0.35 R²=0.63
n=44 H=0.98
-1.55 R²=0.54
n=42 H=0.64
-2.39** R²=0.52
n=40 H=0.31
-0.58 R²=0.77
n=37 H=0.01
SUBVETO 0.72 R²=0.44
n=77 H=0.44
0.13 R²=0.61
n=74 H=0.94
0.33 R²=0.62
n=71 H=0.73
0.39 R²=0.36
n=68 H=0.86
0.64 R²=0.75
n=64 H=0.07
REVSHARE 1.55* R²=0.63
n=37 H=0.13
-0.47 R²=0.60
n=37 H=0.70
-0.54 R²=0.47
n=37 H=0.71
0.17 R²=0.09
n=36 H=0.06
0.38 R²=0.61
n=31 H=0.82
GOVFRAC 4.43(*) R²=0.47
n=78 H=0.08
4.02 R²=0.62
n=75 H=0.79
3.02 R²=0.57
n=72 H=0.32
-2.65* R²=0.38
n=68 H=0.00
4.11** R²=0.79
n=65 H=0.08
These OLS regressions are a modification of Persson and Tabellini (2003), i.e., they all include the following controls, not shown in the table: LYP, GASTIL, AGE, TRADE, PROP65, PROP1564, OECD, MAJ, and PRES. The first number in a cell is the White heteroscedasticity-consistent ß-coefficient of the regression. **, *, or (*) indicate that the estimated parameter is significantly different from zero on the 1, 5, or 10% level, respectively. R² is the adjusted R-squared of the regression and n the number of observations. H is the p-value of a Hausman test with the instruments LPOP, LYP, AGE, and AVELF.
26
Table 4: Effects of Federalism and Decentralization on Government Efficiency, Productivity and Happiness
Dependent Variables
Government Efficiency Productivity/Happiness
cheating govef graft loga happiness Federalism Dummy
0.23 R²=0.30
n=50 H=0.22
-0.37 R²=0.84
n=79 H=0.67
0.39 R²=0.86
n=79 H=0.62
0.25* R²=0.50
n=74 H=0.16
0.43** R²=0.28
n=57 H=0.23
LOCEXE -0.06 R²=0.17
n=29 H=0.12
-0.06 R²=0.81
n=37 H=0.20
0.12 R²=0.87
n=37 H=0.46
0.03 R²=0.38
n=35 H=0.01
0.05 R²=0.40
n=32 H=0.94
DECEXP -0.01 R²=0.27
n=45 H=0.17
0.00 R²=0.87
n=63 H=0.41
-0.00 R²=0.88
n=63 H=0.67
0.01(*) R²=0.47
n=57 H=0.15
0.02** R²=0.33
n=49 H=0.44
TRANSFER 0.00 R²=0.23
n=45 H=0.17
0.00 R²=0.87
n=63 H=0.40
-0.00 R²=0.88
n=63 H=0.05
0.00 R²=0.45
n=57 H=0.73
0.02* R²=0.29
n=49 H=0.73
MUNI 0.26 R²=0.44
n=31 H=0.80
-0.50* R²=0.85
n=45 H=0.62
0.44(*) R²=0.87
n=45 H=0.48
-0.10 R²=0.40
n=44 H=0.14
-0.05 R²=0.25
n=35 H=0.11
SUBVETO 0.26** R²=0.36
n=50 H=0.15
-0.25(*) R²=0.85
n=77 H=0.48
0.25(*) R²=0.87
n=77 H=0.74
0.10 R²=0.48
n=72 H=0.28
0.14 R²=0.24
n=57 H=0.65
REVSHARE -0.07 R²=0.15
n=29 H=0.21
-0.09 R²=0.81
n=37 H=0.11
0.04 R²=0.86
n=37 H=0.23
0.04 R²=0.38
n=35 H=0.26
0.27** R²=0.59
n=32 H=0.10
GOVFRAC 0.72* R²=0.37
n=49 H=0.98
0.21 R²=0.83
n=78 H=0.19
-0.16 R²=0.86
n=78 H=0.40
0.18 R²=0.48
n=74 H=0.02
0.42 R²=0.25
n=57 H=0.78
These OLS regressions are a modification of Persson and Tabellini (2003), i.e., the regressions of the group “government efficiency” all include LYP, GASTIL, AGE, TRADE, LPOP, EDUGER, AVELF, OECD, PROT80, MAJ, and PRES, and the regressions of the group “productivity/happiness” all include LAT01, FRANKROM, ENGFRAC, EURFRAC, MAJ, and PRES. The first number in a cell is the White heteroscedasticity-consistent ß-coefficient of the regression. **, *, or (*) indicate that the estimated parameter is significantly different from zero on the 1, 5, or 10% level, respectively. R² is the adjusted R-squared of the regression and n the number of observations. H is the p-value of a Hausman test with the instruments LPOP, LYP, AGE, and AVELF.
27
Appendix 2: Descriptions of the Variables
Many variables used in this paper are based on Persson and Tabellini (2003, PT) or Blume, Müller, Voigt, and Wolf (2008, BMVW).
AGE: Age of democracy defined as AGE = (2000 – DEM_AGE) / 200, with values varying between 0 and 1, source: PT and BMVW. AVELF: Index of ethnolinguistic fractionalization, ranging from 0 (homogeneous) to 1 (strongly fractionalized) averaging five sources; sources: PT and BMVW. ASIAE: Regional dummy variable, equal to 1 if a country is in East Asia, 0 otherwise; source: CIA (2005). CGEXP: Central government expenditures as a percentage of GDP, constructed using the item Government Finance-Expenditures in the IFS, divided by GDP at current prices and multiplied by 100; sources: PT and BMVW. CGREV: Central government revenues as a percentage of GDP, constructed using the item Government Finance-Revenues in the IFS, divided by GDP at current prices and multiplied by 100; sources: PT and BMVW. CHEATING: The variable is based on a question of the World Values Survey (“Please tell me for each of the following statements whether you think it can always be justified, never be justified, or something in between: … Cheating on tax if you have the chance” [% “never justified” coded 1 on a 10-point scale where 1= never and 10 = always]). COMMLAW: Dummy for common law legal origin, coded 1 if legal origin is common law, coded 0 if legal origin is any other. CPI: Corruption Perception Index measuring perceptions of abuse of power by public officials. Average over 2000–2005. Index values between 0 and 10, lower values meaning lower levels of corruption (recoded from the original version); source: Transparency International and Internet Center for Corruption Research (http://www.icgg.org/). DDI: Direct Democracy Index (DDI) as provided by Fiorino and Ricciuti (2007) drawing on various sources. The countries are classified as (1) radical democrat; (2) progressive; (3) cautious; (4) hesitant; (5) fearful; (6) beginner; and (7) authoritarian. DECEXP: Subnational share of expenditures (% total); source: IMF’s Government Finance Statistics (GFS), 2002. DE_FACTO_JI: Factual independence of the judiciary; values between 0 and 1, with 1 signaling a high level of actual independence; source: Feld and Voigt (2003). EDUGER: Total enrollment in primary and secondary education as a percentage of the relevant age group in the country’s population, based on values for 1998 and 1999; sources: PT and BMVW. ENGFRAC: Fraction of a country’s population that speaks English as a native language; sources: PT and BMVW. EURFRAC: Fraction of a country’s population that speaks one of the major languages of Western Europe: English, French, German, Portuguese, or Spanish; sources: PT and BMVW. FRANKROM: Natural log of trade share forecasted by Frankel and Romer’s gravity model of international trade, which takes both a country’s population and its geographical location into account; sources: PT and BMVW. GASTIL: Average of indexes for civil liberties and political rights, each index is measured on a 1–7 scale,

28
with 1 representing the lowest degree of freedom. Countries whose averages are between 1 and 2.5 are called “not free,” those between 3 and 5.5 “partially free,” and those between 5.5 and 7 as “free”; sources: PT and BMVW. GOVEF: Government effectiveness according to the Governance Indicators of the World Bank. Combines perceptions of the quality of public service provision, the quality of the bureaucracy, the competence of civil servants, the independence of the civil service from political pressures, and the credibility of the government’s commitment to policies into a single indicator. Values between 0 and 10, where higher values signal higher effectiveness; average values for 1996, 1998, 2000, 2002, and 2004; sources: PT and BMVW. GOVFRAC: The probability that two deputies picked at random from among the government parties will be of different parties; source: Beck et al. (2000). GRAFT: Graft, according to the Governance Indicators of the World Bank, focuses on perceptions of corruption. Values between 0 and 10, where lower values signal higher effectiveness; average values for 1996, 1998, and 2000; source: Kaufmann, D., Worldbank (2005): Governance Indicators: 1996–2004. HAPPINESS: Happiness according to happiness surveys collected by Veenhoven (2004) and arranged on a 10–0 scale, with higher values signaling higher happiness. LAC: Regional dummy variable; equal to 1 if a country is in Latin America, Central America, or the Caribbean, 0 otherwise; source: CIA (2005). LAT01: Rescaled variable for latitude, defined as the absolute value of LATITUDE divided by 90 and taking on values between 0 and 1; sources: PT and BMVW. LOCEXE: Records whether or not a country’s local executives are elected “4” if yes, “0” otherwise; source: Kearney (1999). LOGA: Natural logarithm of total factor productivity, calculated for the year 2000 on the basis of a Cobb-Douglas function following the model of Hall and Jones (1999); source: BMVW. LOGYL: Natural logarithm of output per worker calculated for the year 2000 following Hall and Jones (1999). LPOP: Natural logarithm of total population (in millions); sources: PT and BMVW. LYP: Natural logarithm of real GDP per capita in constant dollars (chain index) expressed in international prices, base year 1985; average for the years 1990–1999; sources: PT and BMVW. MAJ: Dummy variable for electoral systems; equal to 1 if the entire lower house in a country is elected under plurality rule, 0 otherwise. Only legislative elections (lower house) are considered; sources: PT and BMVW. MUNI: 0 if neither local executive nor local legislature are locally elected. 1 if the executive is appointed, but the legislature elected. 2 if both are locally elected; source: Beck et al. (2000). OECD: Dummy variable; equal to 1 for all countries that were members of the OECD; source: OECD (2006). PRES: Dummy variable for government forms; equal to 1 in presidential regimes, 0 otherwise. Only regimes in which the confidence of the assembly is not necessary for the executive to stay in power (even if an elected president is not chief executive, or if there is no elected president) are included among presidential regimes Most semi-presidential and premier-presidential systems are classified as parliamentary; sources: constitutions and electoral laws; PT and BMVW. PROP1564: Percentage of a country’s population between 15 and 64 years old; sources: PT and BMVW. PROP65:
29
Percentage of a country’s population over the age of 65; sources: PT and BMVW. PROT80: Percentage of the population in a country professing the Protestant religion in 1980 (younger states are counted based on their average from 1990 to 1995); sources: PT and BMVW. REVSHARE: Measures whether a country’s central government regularly and unconditionally transfers a portion of national taxes to lower levels of government; “4” if both subnational levels receive, “2” if one does, “0” otherwise; source: Kearney (1999). SPL: Central government budget surplus (if positive) or deficit (if negative) as a percentage of GDP, based on “DEFICIT (-) OR SURPLUS” as share of GDP average for 1990–1999; sources: PT and BMVW. SSA: Regional dummy variable; equal to 1 if a country is in Sub-Saharan Africa, 0 otherwise; source: CIA (2005). SSW: Central government expenditures consolidated on social services and welfare as a percentage of GDP; sources: PT and BMVW. SUBVETO: Dummy variable coded 1 if regionally chosen upper house of parliament has constitutional right to block legislation; source: Treisman (2002). TOTEXP: Total government expenditure as share of GDP. TRADE: Sum of exports plus imports of goods and services measured as a share of GDP; sources: PT and BMVW. TRANSFER: Vertical imbalance; source: IMF’s Government Finance Statistics (GFS), 2002.
CESifo Working Paper Series for full list see Twww.cesifo-group.org/wp T (address: Poschingerstr. 5, 81679 Munich, Germany, [email protected])
___________________________________________________________________________ 2701 Felix Bierbrauer, Optimal Income Taxation and Public Goods Provision in a Large
Economy with Aggregate Uncertainty, July 2009 2702 Marc Gronwald, Investigating the U.S. Oil-Macroeconomy Nexus using Rolling
Impulse Responses, July 2009 2703 Ali Bayar and Bram Smeets, Government Deficits in the European Union: An Analysis
of Entry and Exit Dynamics, July 2009 2704 Stergios Skaperdas, The Costs of Organized Violence: A Review of the Evidence, July
2009 2705 António Afonso and Christophe Rault, Spend-and-tax: A Panel Data Investigation for
the EU, July 2009 2706 Bruno S. Frey, Punishment – and beyond, July 2009 2707 Michael Melvin and Mark P. Taylor, The Crisis in the Foreign Exchange Market, July
2009 2708 Firouz Gahvari, Friedman Rule in a Model with Endogenous Growth and Cash-in-
advance Constraint, July 2009 2709 Jon H. Fiva and Gisle James Natvik, Do Re-election Probabilities Influence Public
Investment?, July 2009 2710 Jarko Fidrmuc and Iikka Korhonen, The Impact of the Global Financial Crisis on
Business Cycles in Asian Emerging Economies, July 2009 2711 J. Atsu Amegashie, Incomplete Property Rights and Overinvestment, July 2009 2712 Frank R. Lichtenberg, Response to Baker and Fugh-Berman’s Critique of my Paper,
“Why has Longevity Increased more in some States than in others?”, July 2009 2713 Hans Jarle Kind, Tore Nilssen and Lars Sørgard, Business Models for Media Firms:
Does Competition Matter for how they Raise Revenue?, July 2009 2714 Beatrix Brügger, Rafael Lalive and Josef Zweimüller, Does Culture Affect
Unemployment? Evidence from the Röstigraben, July 2009 2715 Oliver Falck, Michael Fritsch and Stephan Heblich, Bohemians, Human Capital, and
Regional Economic Growth, July 2009

2716 Wladimir Raymond, Pierre Mohnen, Franz Palm and Sybrand Schim van der Loeff,
Innovative Sales, R&D and Total Innovation Expenditures: Panel Evidence on their Dynamics, July 2009
2717 Ben J. Heijdra and Jochen O. Mierau, Annuity Market Imperfection, Retirement and
Economic Growth, July 2009 2718 Kai Carstensen, Oliver Hülsewig and Timo Wollmershäuser, Price Dispersion in the
Euro Area: The Case of a Symmetric Oil Price Shock, July 2009 2719 Katri Kosonen and Gaёtan Nicodème, The Role of Fiscal Instruments in Environmental
Policy, July 2009 2720 Guglielmo Maria Caporale, Luca Onorante and Paolo Paesani, Inflation and Inflation
Uncertainty in the Euro Area, July 2009 2721 Thushyanthan Baskaran and Lars P. Feld, Fiscal Decentralization and Economic
Growth in OECD Countries: Is there a Relationship?, July 2009 2722 Nadia Fiorino and Roberto Ricciuti, Interest Groups and Government Spending in Italy,
1876-1913, July 2009 2723 Andreas Wagener, Tax Competition, Relative Performance and Policy Imitation, July
2009 2724 Hans Fehr and Fabian Kindermann, Pension Funding and Individual Accounts in
Economies with Life-cyclers and Myopes, July 2009 2725 Ernesto Reuben and Arno Riedl, Enforcement of Contribution Norms in Public Good
Games with Heterogeneous Populations, July 2009 2726 Kurt Schmidheiny and Marius Brülhart, On the Equivalence of Location Choice
Models: Conditional Logit, Nested Logit and Poisson, July 2009 2727 Bruno S. Frey, A Multiplicity of Approaches to Institutional Analysis. Applications to
the Government and the Arts, July 2009 2728 Giovanni Villani, A Strategic R&D Investment with Flexible Development Time in
Real Option Game Analysis, July 2009 2729 Luca Di Corato and Michele Moretto, Investing in Biogas: Timing, Technological
Choice and the Value of Flexibility from Inputs Mix, July 2009 2730 Gilad D. Aharonovitz, Nathan Skuza and Faysal Fahs, Can Integrity Replace
Institutions? Theory and Evidence, July 2009 2731 Michele Moretto and Sergio Vergalli, Managing Migration through Conflicting
Policies: an Option-theory Perspective, July 2009 2732 Volker Nitsch, Fly or Cry: Is Airport Noise Costly?, July 2009

2733 Francesco Cinnirella and Joachim Winter, Size Matters! Body Height and Labor Market
Discrimination: A Cross-European Analysis, July 2009 2734 Samuel Bowles and Sandra Polanía Reyes, Economic Incentives and Social
Preferences: A Preference-based Lucas Critique of Public Policy, July 2009 2735 Gary Burtless, Lessons of the Financial Crisis for the Design of National Pension
Systems, July 2009 2736 Helmuth Cremer, Firouz Gahvari and Pierre Pestieau, Fertility, Human Capital
Accumulation, and the Pension System, July 2009 2737 Hans Jarle Kind and Frank Stähler, Market Shares in Two-Sided Media Industries, July
2009 2738 Pamela Campa, Alessandra Casarico and Paola Profeta, Gender Culture and Gender
Gap in Employment, August 2009 2739 Sebastian Gechert, Supplementary Private Health Insurance in Selected Countries:
Lessons for EU Governments?, August 2009 2740 Leif Danziger, Endogenous Monopsony and the Perverse Effect of the Minimum Wage
in Small Firms, August 2009 2741 Yan Dong and John Whalley, A Third Benefit of Joint Non-OPEC Carbon Taxes:
Transferring OPEC Monopoly Rent, August 2009 2742 Valentina Bosetti, Carlo Carraro and Massimo Tavoni, Climate Change Mitigation
Strategies in Fast-Growing Countries: The Benefits of Early Action, August 2009 2743 Christina Felfe, The Willingness to Pay for Job Amenities: Evidence from Mothers’
Return to Work, August 2009 2744 Jörg Franke, Christian Kanzow, Wolfgang Leininger and Alexandra Väth, Effort
Maximization in Asymmetric N-Person Contest Games, August 2009 2745 Bruno S. Frey and Paolo Pamini, Making World Heritage Truly Global: The Culture
Certificate Scheme, August 2009 2746 Frank N. Caliendo, Is Social Security behind the Collapse of Personal Saving?, August
2009 2747 Caterina Liesegang and Marco Runkel, Corporate Income Taxation of Multinationals
and Fiscal Equalization, August 2009 2748 Chrysovalantou Milliou and Apostolis Pavlou, Upstream Horizontal Mergers and
Efficiency Gains, August 2009 2749 Rüdiger Pethig and Christian Wittlich, Interaction of Carbon Reduction and Green
Energy Promotion in a Small Fossil-Fuel Importing Economy, August 2009

2750 Kai Carstensen, Oliver Hülsewig and Timo Wollmershäuser, Monetary Policy
Transmission and House Prices: European Cross-country Evidence, August 2009 2751 Olaf Posch, Explaining Output Volatility: The Case of Taxation, August 2009 2752 Beatrice Scheubel, Daniel Schunk and Joachim Winter, Don’t Raise the Retirement
Age! An Experiment on Opposition to Pension Reforms and East-West Differences in Germany, August 2009
2753 Daniel G. Arce, Dan Kovenock and Brian Roberson, Suicide Terrorism and the
Weakest Link, August 2009 2754 Mario Larch and Wolfgang Lechthaler, Comparative Advantage and Skill-Specific
Unemployment, August 2009 2755 Horst Raff and Nicolas Schmitt, Buyer Power in International Markets, August 2009 2756 Seppo Kari, Hanna Karikallio and Jukka Pirttilä, The Impact of Dividend Taxation on
Dividends and Investment: New Evidence Based on a Natural Experiment, August 2009 2757 Mirco Tonin and Michael Vlassopoulos, Disentangling the Sources of Pro-social
Behavior in the Workplace: A Field Experiment, August 2009 2758 Nicole Grunewald and Inmaculada Martínez-Zarzoso, Driving Factors of Carbon
Dioxide Emissions and the Impact from Kyoto Protocol, August 2009 2759 Yu-Fu Chen and Michael Funke, Booms, Recessions and Financial Turmoil: A Fresh
Look at Investment Decisions under Cyclical Uncertainty, August 2009 2760 Jan-Egbert Sturm and Jakob de Haan, Does Central Bank Communication really Lead
to better Forecasts of Policy Decisions? New Evidence Based on a Taylor Rule Model for the ECB, August 2009
2761 Larry Karp, Sacrifice, Discounting and Climate Policy: Five Questions, August 2009 2762 Marianna Belloc and Samuel Bowles, International Trade, Factor Mobility and the
Persistence of Cultural-Institutional Diversity, August 2009 2763 Charles Noussair and Fangfang Tan, Voting on Punishment Systems within a
Heterogeneous Group, August 2009 2764 Birgit Bednar-Friedl and Karl Farmer, Internationally Coordinated Emission Permit
Policies: An Option for Withdrawers from the Kyoto Protocol?, August 2009 2765 Pierre M. Picard and David E. Wildasin, Labor Market Pooling, Outsourcing and Labor
Contracts, August 2009 2766 Stefan Voigt and Lorenz Blume, The Economic Effects of Federalism and
Decentralization – A Cross-Country Assessment, August 2009