The Economic Benefits of Natural Gas Pipeline...
47
IHS ECONOMICS The Economic Benefits of Natural Gas Pipeline Development on the Manufacturing Sector Prepared for the National Association of Manufacturers May 2016 Consulting Report ECR | Private Report Brendan O’Neil Managing Director, Consulting Phil Hopkins Director, Consulting Julie Gressley Research Economist
Transcript of The Economic Benefits of Natural Gas Pipeline...

IHS ECONOMICS
The Economic Benefits of Natural Gas Pipeline Development on the Manufacturing Sector
Prepared for the National Association of Manufacturers
May 2016
Consulting Report
ECR | Private Report
Brendan O’Neil Managing Director, Consulting
Phil Hopkins Director, Consulting
Julie Gressley Research Economist
mmicetich
Underline

IHS Economics | The Economic Benefits of Natural Gas Pipeline Development on the Manufacturing Sector
Contents
CHAPTER ONE: A DESCRIPTION OF THE NATURAL GAS PIPELINE SYSTEM ....................................... 4
Introduction and Overview ........................................................................................................................................... 4
Natural Gas Users .......................................................................................................................................................... 5
Electric Power ............................................................................................................................................................... 5 Industrial ....................................................................................................................................................................... 5 Residential ..................................................................................................................................................................... 6 Commercial ................................................................................................................................................................... 6
The Natural Gas Pipeline System ................................................................................................................................. 6
Natural Gas Gathering Pipelines ................................................................................................................................... 7 Natural Gas Processing Plants ...................................................................................................................................... 7 Natural Gas Transmission Pipelines ............................................................................................................................. 9 Storage Facilities ......................................................................................................................................................... 10 Natural Gas Distribution Pipelines .............................................................................................................................. 11 Natural Gas Liquids (NGLs) and Liquefied Petroleum Gas (LPG) Pipelines ............................................................ 12 NGLs and LPG Marine Terminals .............................................................................................................................. 12 Natural Gas Fractionators ........................................................................................................................................... 13 Liquefied Natural Gas Facilities ................................................................................................................................. 14
CHAPTER TWO: DRIVERS OF PIPELINE GROWTH – NATURAL GAS SUPPLY AND DEMAND ......... 15
Supply Growth ............................................................................................................................................................. 15
Well Productivity........................................................................................................................................................ 16 Infrastructure Development ........................................................................................................................................ 18
Demand Growth........................................................................................................................................................... 19
Drivers of New Natural Gas Demand ......................................................................................................................... 20 Natural Gas Liquids and Petrochemicals .................................................................................................................... 22
CHAPTER THREE: NATURAL GAS PIPELINE CONSTRUCTION & OPERATION COSTS ..................... 24
Backward Linkages ..................................................................................................................................................... 24
Construction and Operating Costs for Typical Natural Gas Pipelines................................................................... 26
Natural Gas Gathering Pipelines ................................................................................................................................. 26 Natural Gas Transmission Pipelines ........................................................................................................................... 26 Natural Gas Distribution Pipelines .............................................................................................................................. 27 IHS QUE$TOR Model ............................................................................................................................................... 27
CHAPTER FOUR: NATURAL GAS PIPELINE, MANUFACTURERS, AND THEIR FORWARD LINKAGES
....................................................................................................................................................................................... 28
Natural Gas–Intensive Sectors ................................................................................................................................... 28
Electric Use by the Manufacturing Sector .................................................................................................................. 30
States with Clusters of Natural Gas-Intensive Sectors ............................................................................................. 30
Use of Natural Gas for Electric Energy Generation ................................................................................................. 32
Forward Linkages ........................................................................................................................................................ 33
Macroeconomic Impacts of Lower Natural Gas Prices ............................................................................................ 34

IHS Economics | The Economic Benefits of Natural Gas Pipeline Development on the Manufacturing Sector
IHSTM ECONOMICS
Copyright notice and legal disclaimer
© 2016 IHS. No portion of this report may be reproduced, reused, or otherwise distributed in any form without prior written consent, with the exception of any internal client distribution as may be permitted in the license agreement between client and IHS. Content reproduced or redistributed with IHS permission must display IHS legal notices and attributions of authorship. The information contained herein is from sources considered reliable but its accuracy and completeness are not warranted, nor are the opinions and analyses which are based upon it, and to the extent permitted by law, IHS shall not be liable for any errors or omissions or any loss, damage or expense incurred by reliance on information or any statement contained herein. IHS and the IHS logo are trademarks of IHS. For more information, please contact IHS at www.ihs.com/CustomerCare.
Results ......................................................................................................................................................................... 35 Impact on Key Manufacturing Sectors ....................................................................................................................... 36
CHAPTER FIVE: ECONOMIC EFFECTS OF NATURAL GAS PIPELINE CONSTRUCTION AND
OPERATION ............................................................................................................................................................... 38
Natural Gas Pipeline Costs ......................................................................................................................................... 38
U.S. Economic Impacts of Natural Gas Transmission Line Construction ............................................................. 38
Manufacturing Employment Impacts by State ............................................................................................................ 39 U.S. Economic Impacts of Natural Gas Transmission Pipeline Operation and Maintenance .................................... 40
Projections for Continued Growth in Pipeline Spending ......................................................................................... 41
Appendix A: U.S. Economic Contributions of Constructing Natural Gas Transmission Lines in 2015 by
Manufacturing Subsector ........................................................................................................................................... 42
Appendix B: Employment Contribution of Constructing Natural Gas Transmission Lines in 2015 by State and
Manufacturing Subsector ........................................................................................................................................... 44
Appendix C: U.S. Economic Contribution of Operating & Maintaining Existing Natural Gas Transmission
Pipelines in 2015 by Manufacturing Subsector ......................................................................................................... 46

IHS Economics | The Economic Benefits of Natural Gas Pipeline Development on the Manufacturing Sector
© 2016 IHS 4 May 2016
CHAPTER ONE: A DESCRIPTION OF THE NATURAL GAS PIPELINE SYSTEM
Introduction and Overview
The rapid increase in domestic natural gas (NG) production continues to reshape the U.S. economy and redefine America’s
competitive advantages within the global economy, especially within the manufacturing sector. In the continuing effort to
understand how a resurgent oil and gas industry impacts broad-based manufacturing, IHS examined how the expansion of
NG pipeline infrastructure benefits the U.S. manufacturing sector. Beyond exploration and production companies, many
firms across a diverse set of industry sectors are beneficiaries of tens of billions of dollars in capital expenditures and
operating and maintenance (O&M) expenditures made annually across the hydrocarbon value chain. Going forward, lower
natural gas prices will result in benefits to consumer purchasing power and confidence, higher profits among businesses,
and improvements in cost-competitiveness for domestic manufacturers relative to their international competitors. The U.S.
economy experienced significant gains in 2015: IHS estimates that economic benefits from increased domestic shale gas
production and the accompanying lower NG prices include contributions of $190 billion to real gross domestic product (GDP), 1.4 million additional jobs, and $156 billion to real disposable income.
IHS Energy expects that the ongoing development of conventional and unconventional NG plays in the U.S. Lower 48 will
keep supply growth steady between 2016 and 2025, enabling it to meet domestic demand. The rapid growth of NG
production in some of the major shale plays has created bottlenecks in some parts of the U.S. where there is insufficient
transmission pipeline capacity to move the NG to market. IHS estimates that approximately $25.8 billion was spent in the
U.S. in 2015 to construct 6,028 miles of new natural gas transmission pipelines, resulting in a temporary increase in
employment of 347,788 jobs, with 59,874 in the manufacturing sector. Similarly, the construction spending is expected to
have contributed $34 billion to GDP and $21.9 billion to labor income in 2015. This study presents current unit cost
estimates, in dollars per mile, for constructing and operating three types of NG pipelines: gathering, transmission, and local
distribution. The focus of this study is on the economic impacts of constructing and operating new NG transmission lines,
as they are the means by which pipeline-ready NG is transported from the wellhead to local markets; the effects of the other two other types of NG pipelines will also be considered as appropriate.
Well-understood economic contributions are derived from midstream and downstream energy capital and O&M
expenditures across a diverse supply chain. Recent IHS analyses on the U.S. ‘manufacturing renaissance’ identified clear
competitive advantages that have emerged for manufacturing in America as a result of the increased supply of
competitively priced natural gas. For energy-intensive industries such as chemicals, metals, food, and refining, production
costs have been reduced as a result of the increase in natural gas supply, and IHS expects these industries to outperform the U.S. economy as a whole through 2025.
The improved competitive positioning of industries in the manufacturing sector is shaping state and local economic
development strategies across the country. Increased supplies of NG, especially at lower delivered prices, enhances the
competitiveness of economies by making them more attractive to manufacturing activities that are large, and intensive
users of NG such as chemicals, food, paper, and metals. The close proximity of existing clusters of manufacturing
establishments to increased NG supplies can generate new pipeline-related economic development, often because of the
availability of direct connections to a new or expanded NG pipeline. In a recent IHS manufacturing strategy study for the
City of Philadelphia Industrial Development Corporation, core recommendations included expansion of NG pipeline
capacity from the Marcellus Shale region to the Greater Philadelphia area as an enabler for expanding the regional
manufacturing sector. Recent IHS research indicates that sectors such as food, cement, wood, paper, chemicals, and
primary and fabricated metal products will be the largest beneficiaries of increased supplies and lower NG prices, as they
both use it intensively (i.e., consume a high number of British Thermal Units (Btu) per unit of output) and require large
amounts of it, especially in chemicals subsectors, where it is used as a feedstock. Expansions of NG pipeline capacity are
also needed to enable the construction of new NG-fired electric generating plants. In addition to providing key inputs for
the construction of NG pipelines, the manufacturing sector will also benefit economically from the capital expenditures for
new electric generating plants and for facilities used to process and store NG and natural gas liquids (NGLs).
In a nutshell, the combination of increased access to shale gas and the transmission lines that move that affordable energy
to manufacturers across America meant 1.9 million jobs in 2015 alone. In the following sections, IHS will identify the
major sources of demand for NG by the manufacturing subsector and describe the key components of the gathering,

IHS Economics | The Economic Benefits of Natural Gas Pipeline Development on the Manufacturing Sector
© 2016 IHS 5 May 2016
transmission, and distribution system. The focus of this analysis will be on the effects of increased NG supply and the
construction and operation of NG transmission pipelines on the manufacturing sector.
Natural Gas Users
According to the U.S. Energy Information Administration
(EIA), over 24.4 trillion cubic feet of NG was delivered to
consumers in 2014.1 Natural gas consumption is typically
classified into five main categories of end users, as described below.
Electric Power
The electric power sector uses large amounts of NG as a
fuel in producing electricity. The electric power sector
consumed 8,100,000 million cubic feet (MMcf) of natural
gas in 2014, the largest end user share at 34%. In addition,
the electric power sector has had the second-highest growth
rate in demand for NG among major end-user categories,
with a compound annual growth rate (CAGR) of 4.1% from 2004 through 2014.2
Industrial
Many industries use NG as a fuel or a feedstock for production, with approximately 80% of total industrial demand for NG
coming from the manufacturing sector. The remaining 20% comes from other industrial activities, such as agriculture,
construction and mining.3 Our U.S. Industrial Gas Demand report identified four ways that NG is used by the
manufacturing sector:
As a fuel for direct process uses, such as drying, melting, process cooling and refrigeration
As a fuel for direct non-process uses in manufacturing establishments, such as heating, ventilation, and air
conditioning (HVAC), lighting, and other uses
As a fuel for indirect purposes, primarily in boilers that are used to produce electricity and steam
As a feedstock, with almost 93% occurring in the petroleum refining, chemical, and primary metals sectors
The three fuel uses account for 91% of total demand for NG by the manufacturing sector, while the remaining 9% is for
feedstock.
Industrial end users of NG are the second-largest consumers of natural gas, using 7.6 million MMcf in 2014. The industrial
sector accounted for 31% of consumption of delivered NG in the US in 2014. Growth in industrial use of NG has been
slower than most other end-use categories, with a CAGR of 0.5% from 2004 through 2014. Industrial gas consumption had
declined over two decades as a result of increasing energy efficiency, high gas prices in the years before the shale gas
revolution, and slow growth in industrial production for the most gas-intensive industries, many of which were hit hard by
the Great Recession,4 but are currently showing signs of stabilization.
1 U.S. Energy Information Administration. “Natural Gas Consumption by End Use.” Accessed July 2015.
http://www.eia.gov/dnav/ng/ng_cons_sum_dcu_nus_a.htm. 2 U.S. Energy Information Administration. Total consumption. 30 June 2015 release. 3 IHS CERA, March 2014, U.S. Industrial Gas Demand. mil 4 IHS CERA Fueling the Future with Natural Gas: Bringing It Home, page VII-1.
5,087,314 , 20.9%
3,466,600 , 14.2%
7,623,826 , 31.3%
35,280 , 0.1%
8,149,111 , 33.4%
Residential (MMcf)
Commercial (MMcf)
Industrial (MMcf)
Vehicle Fuel (MMcf)
Electric Power (MMcf)
Consumption amounts and shares of delivered natural gas by end use category in the United States in 2014
Source: U.S. Energy Information Administration

IHS Economics | The Economic Benefits of Natural Gas Pipeline Development on the Manufacturing Sector
© 2016 IHS 6 May 2016
Residential
Residential consumption of NG natural
gas typically includes household uses,
such as heating, cooling, cooking, and
other similar activities. Residential
consumption growth is relatively slow, at
CAGR of 0.5% from 2004 through 2014,
to 5 million MMcf. While there has been
a 31% increase in residential customers
served between 1990 and 2011,
residential gas customers reduced their
consumption of gas by approximately
1.2% a year, in part, through the use of
more energy-efficient homes and
appliances. When normalized for
weather, NG consumption has been relatively flat in that time period.5
Commercial
Commercial businesses use NG for non-
manufacturing purposes, such as for
heating, cooling, and so on. Typical
commercial users include leisure sectors,
wholesale and retail trade, and government agencies. Commercial consumption of NG is relatively low, as compared with
other end users, at around 3.5 MMcf in 2014, and growing at a CAGR of 1% from 2004 through 2014.
Recently, vehicles powered by NG have increased in popularity. While use as a vehicle fuel is a small proportion of overall
consumption, about 0.1% of total delivered NG consumption in 2013 and 2014, it is the fastest growing consumer of
natural gas, with a compound annual growth rate (CAGR) of 4.8% from 2004 through 2014. On-road vehicles account for
79% of total demand for transportation fuels.6 Given recent declines in the price of NG fuels, there is significant growth
potential in natural gas vehicles.
The Natural Gas Pipeline System
The on-shore NG pipeline system is a complex network that transports NG from the wellhead to the end user, and in 2014,
it was composed of over 1.52 million miles of pipeline7 that are located in every state in the country. The NG pipeline system is composed of three major subsystems:
Gathering pipelines
Transmission pipelines
Distribution pipelines
Each of the three pipeline segments performs different functions in the NG system and has varying requirements for
materials, construction, and operations. In this section, we will describe the NG logistics system, which includes major
pipelines segments, facilities, and basic components that are required on those segments and their relative size in mileage.
5 IHS CERA Fueling the Future with Natural Gas: Bringing It Home, page 81. 6 IHS CERA Fueling the Future with Natural Gas: Bringing It Home, page 209. 7 Mileage includes pipelines that are active, inactive/idle, and temporarily abandoned.
Regional residential prices - natural gas and electricity (constant $2012 per MMBtu)

IHS Economics | The Economic Benefits of Natural Gas Pipeline Development on the Manufacturing Sector
© 2016 IHS 7 May 2016
The largest clusters of natural gas pipeline are located in natural gas production areas the South, which includes pipeline
from NG–rich Texas, Louisiana, and the Gulf Coast. Pennsylvania, Wyoming, Oklahoma, and Colorado also have
significant clustering of natural gas pipeline systems. The rise of unconventional technologies has expanded the U.S.
production base sufficiently that domestic gas resource production could supply current U.S. consumption for 88 to 154
years.8
According to the U.S. Department of Transportation,9 in 2014 the
length of on-shore natural gas pipeline system was 1,573,477 miles
and comprised the following components:
Gathering pipelines: 11,390 miles in 26 states, 0.7% of the
total
Transmission pipelines: 297,800 miles in 50 states, none in the
District of Columbia, 18.9% of the total
Distribution pipelines: 1,264,287 miles in all 50 states and the
District of Columbia, 80.4% of the total
Natural Gas Gathering Pipelines
The gathering pipeline system is the first step in the NG delivery
system, linking together small branches of pipeline to push NG
collected from the wells in the NG and oil fields into larger pipelines
to move NG through the system. The gathering pipeline systems is
composed of small, low-pressure pipelines that sometimes travel
through multiple leaseholder fields and occasionally require the help
of compressors to generate additional pressure to push the NG on its
way. Operating pressure in gathering pipeline systems varies
considerably based upon pressure produced from wells. The first stop
in the gathering pipeline system is a leasing facility, where the
volume of NG is metered, or measured, to assess royalties owed to
leaseholders.
Typically, when NG is pumped from the ground, it contains
constituents that could damage the pipeline system that must be
removed before it can be put into a transmission line (i.e., pipeline-
ready NG). Each pipeline has a rating for the quality of NG, pressure,
and quantity it can handle. Gathering pipeline systems are smaller in
diameter, as they handle smaller quantities of NG. Gathering pipeline
systems are located mainly in NG-producing states. There were
11,390 miles of gathering pipelines in the United States in 2014 with
about 56% of the total in Texas, Louisiana, and Oklahoma; however,
more gathering pipe is being installed in Pennsylvania, Ohio,
Colorado, and West Virginia.
Natural Gas Processing Plants
Natural gas processing facilities are the next point in the system, where impurities and marketable gas and liquids by-
products are separated, based on future pipeline standards for these materials. Natural gas, especially “wet” gas, often has
8 IHS CERA Fueling the Future with Natural Gas: Bringing It Home, page ES-5. 9 U.S. Department of Transportation, Pipeline and Hazardous Materials and Safety Administration.
http://phmsa.dot.gov/portal/site/PHMSA/menuitem.6f23687cf7b00b0f22e4c6962d9c8789/?vgnextoid=a872dfa122a1d110VgnVCM1000009ed07898
RCRD&vgnextchannel=3430fb649a2dc110VgnVCM1000009ed07898RCRD&vgnextfmt=print.
State 2013
Alabama 271,986
Alaska 3,215,358
Arizona 72
Arkansas 1,139,654
California 252,310
Colorado 1,604,860
Florida 18,011
Illinois 2,887
Indiana 7,938
Kansas 292,467
Kentucky 94,665
Louisiana 2,413,575
Maryland 32
Michigan 123,622
Mississippi 413,329
Missouri -
Montana 63,242
Nebraska 1,032
Nevada 3
New Mexico 1,271,185
New York 23,458
North Dakota 345,787
Ohio 186,181
Oklahoma 2,143,999
Oregon 770
Pennsylvania 3,259,042
South Dakota 16,205
Tennessee 5,400
Texas 8,211,255
Utah 470,863
Virginia 139,382
West Virginia 717,892
Wyoming 2,047,757
U.S. Natural Gas Gross Withdrawals
(MMcf) 30,005,254
Source: EIA
Natural Gas Gross Well Withdrawals by State,
2013 (MMcf)

IHS Economics | The Economic Benefits of Natural Gas Pipeline Development on the Manufacturing Sector
© 2016 IHS 8 May 2016
valuable by-products that are processed and resold. Primarily, the various types of NG liquids (NGL themselves have a
variety of uses, including as petrochemical feedstock (e.g., ethane, butane, and isobutene) and fuel (e.g., propane).
Other by-products of NG processing that may be extracted and sold include: sulphur, carbon dioxide, nitrogen, and
condensate (heavier liquids). Compressors then help push NG toward transmission line inlets. According to IHS,10 as of
June 2015, there were a total 728 operating NG processing plants in the United States, with a combined capacity of 83,955
million cubic feet per day (MMcf/d). The accompanying map shows the current spatial distribution of gas processing
plants in the United States. The map clearly shows they are located in the major gas-producing formations in the United
States, such as the Marcellus in western Pennsylvania, the Bakken in western North Dakota, and the formations
concentrated in Louisiana, Oklahoma, and Texas. Some of the plants along the Louisiana and Texas coasts also process NG produced off shore in the Gulf of Mexico.
10 IHS Energy, June 2015. Second Quarter – North American NGL Markets Infrastructure Update.

IHS Economics | The Economic Benefits of Natural Gas Pipeline Development on the Manufacturing Sector
© 2016 IHS 9 May 2016
Natural Gas Transmission Pipelines
The transmission pipeline
system is composed of much
larger pipelines that move
NG within (intrastate) and
across (interstate) states.
Typically, interstate lines are
owned by large holding
companies. Transmission
lines are constructed of high-
strength steel that is 0.25 to
0.75 inches thick and
typically range from 20 to 42
inches in diameter. The
transmission system can
operate at a pressure of 200
to 1,500 pounds per square
inch (psi),11 based on the
maximum allowable
operating pressure rating of
the pipe. The pipelines are
also coated with epoxy to
protect them from corrosion.
The volume of NG and its
speed of movement, up to 30
miles per hour through the
transmission system depend upon the diameter of the pipe and its pressure, which is dictated by several factors: 1) ambient
conditions, such as elevation and temperature; 2) proximity to compressor stations; and 3) the amount of pressure
generated by the compressor station. As NG moves along the transmission lines, it generates friction, and as pressure falls,
NG speeds slow down. Generally, compressor stations are located between 50 to 100 miles apart12 on transmission lines,
but in regions where NG must move through large elevation changes and/or temperature changes, they are located closer
together to give NG a boost. Compressor stations typically also contain filtering and scrubbing systems to capture any
contaminants that the NG may have picked up along its
journey.
Given the importance of NG pressure and volume within the
transmission pipeline, valves, safety monitoring systems, and
pipeline redundancy around compressor stations are crucial
to the transmission system. Control centers and operators
constantly monitor and adjust the pressure and volume in
lines. Valves that can be operated remotely are used to shut
off the flow of NG to pipelines that are undergoing
maintenance or have been flagged for safety reasons.
Natural gas moving through the transmission pipeline system
generally follows 11 distinct transportation route corridors,
from producing regions to consumer regions. Five major
routes originate from the Texas/Louisiana/Gulf Coast area,
11 American Gas Association website. Accessed July 2015. < https://www.aga.org/how-does-natural-gas-delivery-system-work> 12 Shively, B. and Ferrare, J. “Understanding Today’s Natural Gas Business.” Enerdynamics Corps. 2007
Compressors: A compressor is a machine driven by
an internal combustion engine or turbine that creates
pressure to “push” the gas through the lines
Condensate: A gas that becomes a liquid when exposed to atmospheric pressure
Supervisory Control and Data Acquisition
(SCADA): Systems that monitor transmission
pipelines automatically, transmitting data on
pipeline operation points, such as volume, pressure,
and temperature
Natural Gas Market Centers and Hubs in Relation to Major Natural Gas Transportation Corridors, 2009
Source: U.S. Energy Information Administration

IHS Economics | The Economic Benefits of Natural Gas Pipeline Development on the Manufacturing Sector
© 2016 IHS 10 May 2016
four originate from Canada, and two originate from the Rocky Mountain area. On these routes, there are multiple points,
referred to as hubs/market centers, where transmission pipelines intersect. Hubs provide services such as wheeling between
pipelines, exchanges, title transfers, price discovery, electronic trading, parking (temporary storage), and lending.
Distribution hubs are privately owned and are often used as price points for trading and contracts. Large end-user clients
will often purchase titles for NG, as well as futures from hubs, which will be delivered through the transmission and distribution systems.
The end point of the transmission line is located at the city gate, also referred to as the gate station, where transmission
mainlines meet the local distribution system, and is typically operated by the local distribution company (LDC). Most NG
end users are located past the city gate, on the distribution pipeline system. Almost all residential and commercial gas users rely on gas LDCs for their gas purchases and/or deliveries.13
Few power utilities and industrial manufacturers, that consume a large volume of NG, will be located along the main
transmission. Smaller transmission line pipe offshoots of 6- to 16-inch-diameter pipe provide service to local distribution
companies or directly to large end-user customers.14 The frequency in which end-user clients are located along
transmission lines, rather than along the distribution lines, is regional in nature.
Storage Facilities
Transmission lines move NG away from the gathering lines, toward end users that receive their gas via local distribution
systems. A number of NG demand factors, which will be described in Chapter Two, determine where and when NG is in
demand. Surplus NG will be sent to storage facilities. Cost-efficient availability of storage and inventory near the consumer
play a significant role in NG pricing. Geographic circumstances, pipeline availability, and demand fluctuation affect the kind of storage that is available and the potential inventory flow.
Underground storage facilities are used for longer-term storage, and there are three main types that may be located near the production region or the end-user region:
Depleted NG or oil fields, which are typically located either in producing regions or in formally producing regions
that are closers to consumption areas. Depleted fields are optimal storage locations, as much of the necessary
infrastructure for withdrawal is already in place, keeping conversion costs low. Additionally, they account for more
than 80% of capacity.
Salt caverns, which are located primarily in Gulf Coast states, but also in the Northeast, Midwest, and Southwest,
allow for high rates of withdrawal and injection, but the conversion costs are higher than depleted field conversion.
Saline aquifers, which are also located primarily in the Midwest, can be suitable for underground storage, based on
their geological qualities. Converted aquifers require a larger “cushion” of gas and greater monitoring of
performance to maintain safe injection and withdrawal performance.
Monthly underground storage, including inventories, withdrawals, and injections, are monitored and reported by the EIA
on a monthly basis. According to EIA, there are approximately 400 active underground storage facilities in the Lower 48
states with inventories that fluctuate on a monthly basis, following seasonal patterns for heating and cooling.
13 IHS CERA Fueling the Future with Natural Gas: Bringing It Home, page 79. 14 Shively, B. and Ferrare, J. “Understanding Today’s Natural Gas Business.” Enerdynamics Corps. 2007.

IHS Economics | The Economic Benefits of Natural Gas Pipeline Development on the Manufacturing Sector
© 2016 IHS 11 May 2016
Natural Gas Distribution Pipelines
The distribution pipeline system is the final pipeline system in the delivery system from wellhead to consumer. Local
distribution companies deliver gas supply within market areas to customers using 1,264,287 miles of smaller-diameter,
low-pressure mains and approximately 880,000 miles of customer service lines that deliver gas from a street connection to
the customer’s meter.15 Distribution pipelines are smaller than transmission pipelines, ranging from 24 inches to 2 inches in
diameter. Pressure ranges from 60 psi, in pipelines located nearest to the transmission line, to 0.25 psi near, near homes and
small businesses. The distribution system consists of pipes (mains and lines), small compressors, regulators to reduce
pressure, valves to control flow, metering to measure the flow, and supervisory, control, and data acquisition systems
(SCADA) to monitor and remotely control flow. Older distribution lines have been made of various types of material, but newer distribution lines are often constructed with PVC piping, which is less corrosive than metals.
As NG flows through the city gate from the transmission line, interconnects (local distribution companies or local utilities)
meter the gas, regulate the pressure (depressurize), and scrub and filter the gas to ensure it is clean and free of water vapor.
Natural gas is odorless until mercaptan, the familiar rotten-egg-smelling odorant, is added as an additional safety measure
at this point. Local distribution companies or local utilities transport and distribute NG from this point onward to end users.
Industries and commercial machinery operators often require higher pressure to operate, and regulators along the
distribution system are used to adjust pressure to meet end users’ needs. Large end users often hold title to their own gas
through market transactions and pay local distribution companies for transportation services. Gas LDCs serve more than 65
million residential customers, more than 5 million commercial customers, and more than 190,000 industrial and power-
generation customers.16 The local NG distribution system is very complex, with service areas ranging from very large to
quite small.
15 American Gas Foundation “Gas Distribution Infrastructure: Pipeline Replacement and Upgrades,” page 1. 16 IHS CERA Fueling the Future with Natural Gas: Bringing It Home, page 79.

IHS Economics | The Economic Benefits of Natural Gas Pipeline Development on the Manufacturing Sector
© 2016 IHS 12 May 2016
Natural Gas Liquids (NGLs) and Liquefied Petroleum Gas (LPG) Pipelines
NGLs are produced primarily by NG processing plants and usually contain some or all of the following five types of
liquids: ethane, butane, isobutene, propane, and pentane. About 71% of NGLs in the United States are produced by NG
processing, the remaining 29% are generated during refining, consisting primarily of propane and butane, and a small
volume of ethane. According to IHS, only about 60% of U.S. natural gas production requires processing; the rest is too dry
(i.e., low liquid content). The shale plays with the wettest NG are the largest sources of NG liquids, including the Eagle
Ford in Texas, and the Utica and Marcellus formations in western Pennsylvania, southeast Ohio, and West Virginia.
IHS estimates that total production of NGLs in the United States in 2014 averaged just over 3.7 million barrels per day.
(mmb/d). The seasonal fluctuation in production levels is clearly evident. The production and transportation of NGLs
requires the use of NGL storage facilities. IHS recently estimated that the major companies involved in NGL production
and transportation currently have a total NGL storage capacity of 328.5 million barrels. Liquefied petroleum gas (LPG) is
produced from crude oil refining or NG processing. It consists primarily of propane, normal butane, and isobutene, and
current definitions exclude ethane and olefins. According to the U.S. Department of Energy,17 LPG can be liquefied
through pressurization (without requiring cryogenic refrigeration) for convenience of transportation or storage. Both NGLs
and LPG are sent via pipelines from processing location, which are usually located in or adjacent to the major NG fields, to
locations where they can be processed into other products. According to IHS,18 there are currently 66,443 miles of NGL pipelines in the United States operated by major companies with a combined capacity of 14,757,802 barrels per day (b/d).
NGLs and LPG Marine Terminals
Marine terminals are used to transfer NGLs and LPG from land transportation modes, such as pipelines and rail, to ships
for export or the reverse when they are imported. The map below shows the location of the currently operating LPG marine
terminals in the United States.
17 U.S. Department of Energy, Energy Information Administration, July 2015. Glossary. http://www.eia.gov/tools/glossary/index.cfm?id=L. 18 IHS Energy, June 2015. Second Quarter – North American NG Markets Infrastructure Update

IHS Economics | The Economic Benefits of Natural Gas Pipeline Development on the Manufacturing Sector
© 2016 IHS 13 May 2016
Natural Gas Fractionators
Natural gas liquids fractionation facilities process NGLs into other products that are then used as inputs into petrochemical
productions. For example, a fractionator may use several different processes to separate ethane from the NGL stream.
According to IHS,19 in 2013 there were a total of 93 NGL fractionators located in the United States with a combined
processing capacity of 4,423 thousand barrels per day (mbd). The map below shows the spatial distribution and capacities
of the major clusters of NG fractionators in the United States and Canada. While fractionators are usually located in major
NG producing regions, they can also be located at the end of pipelines carrying NGLs and LPG, for example. Sunoco
Logistics has recently started construction of a 35,000 bpd fractionation plant at its Marcus Hook Industrial Complex,
located on the Delaware River about 25 miles south of Philadelphia.
19 IHS Energy, June 2015. Second Quarter – North American NGL Markets Infrastructure Update.

IHS Economics | The Economic Benefits of Natural Gas Pipeline Development on the Manufacturing Sector
© 2016 IHS 14 May 2016
Liquefied Natural Gas Facilities
Liquefied natural gas (LNG) is produced by cooling to a temperature of approximately -260 degrees Fahrenheit. The
primary reasons for liquefying NG are to store it for future use (i.e., in a peak shaving facility) and re-gasifying it when it is
needed and putting it back into a pipeline to transport it, such as in an LNG tanker, or for direct use, such as a fuel in NG
vehicles. Natural gas in liquid form takes up about 1/600th of its volume when in gaseous form. The major types of LNG
facilities include:
Liquefaction plants that convert pipeline ready gas to liquid form prior to storage, transport, or other use.
Regasification facilities.
Storage facilities, including peak shaving plants.
Marine terminals through which LNG can be either exported or imported.
As described by the Department of Energy,20 LNGs can be liquefied through pressurization (without requiring cryogenic
refrigeration) for convenience of transportation or storage. Both NGLs and LNG are sent via pipelines from processing
locations, which are usually located in or adjacent to the major NG fields, to locations where they can be processed into
other products. According to IHS,21 there are currently 66,443 miles of NGL pipelines in the United States operated by major companies with a combined capacity of 14,757,802 b\d.
According to the Federal Energy Regulatory Commission (FERC),22 there are currently 11 operating LNG export/import
terminals in the United States with a combined capacity of 18.5 billion cubic feet per day (Bcfd). All of them are located along the Atlantic Ocean and Gulf of Mexico coasts, with 12.9 Bcfd of capacity present along the Gulf of Mexico coast.
Peak shaving facilities store LNG and re-gasify it to meet peak demands for NG. According to FERC, there are 13 peak
shaving plants located in the United States, primarily in the Middle Atlantic and Northeast states. The role of supply and
demand in NG availability and pricing are described in the next chapter.
20 U.S. Department of Energy, Energy Information Administration, July 2015. Glossary. http://www.eia.gov/tools/glossary/index.cfm?id=L 21 IHS Energy, June 2015. Second Quarter – North American NG Markets Infrastructure Update. 22 Federal Energy Regulatory Commission, July 2015. http://www.ferc.gov/industries/gas/indus-act/lng/lng-existing.pdf.

IHS Economics | The Economic Benefits of Natural Gas Pipeline Development on the Manufacturing Sector
© 2016 IHS 15 May 2016
CHAPTER TWO: DRIVERS OF PIPELINE GROWTH – NATURAL GAS SUPPLY
AND DEMAND
The NG resource base in North America is plentiful and low cost. A geological assessment of 17 unconventional NG plays
in North America published by IHS Energy in 2010 indicated that many years of growing gas demand could be supplied at
a breakeven wellhead price of $3.75 to 4.50/btu. Recent technological advances and price moves suggest that the reserve
base is even larger and the current break-even prices are even lower.
Nevertheless, supply does not generally grow at a steady rate. Investment decisions are made in consideration of the
prevailing and expected market environment. There is often a lag of several months, as rigs are hired and wells are drilled,
completed, and hooked up to gathering lines and other
infrastructure before new production begins to flow. As a
result, supply responds to market changes with a lag.
Operators’ responses to price changes will be further delayed
if they have placed corporate hedges against adverse changes in the market.
Supply Growth
Supply growth continues at a strong pace, despite obstacles. With the widespread adoption of unconventional gas
production techniques, the U.S. Lower 48 gas resource base has become a juggernaut of supply growth.23 Between 2007
and 2014 U.S. Lower 48 gas production grew by approximately 2.5 billion cubic feet per day (Bcfd), or 4% of total
production, every year.24 In one 12-month period ending December 2011, production grew by about 5.6 Bcfd. In 2014, the year-over-year increase was 3.8 Bcfd on an annual average basis.
Growth has persisted despite falling prices for both gas and oil and significantly lower rig activity. The industry has fueled
growth, despite these obstacles, by improving drilling and completion technology and increasing productivity in dry gas
plays. Additionally, producers have
focused their drilling activities on the
most productive areas of each play to
maximize production and minimize
cost.
Rig counts have fallen while
production continues to grow The
U.S. Lower 48 gas-directed rig count
averaged 332 in 2014, a more than
75% decline since 2008 when there
were almost 1,500 gas-directed rigs
operating. Gas-directed drilling has
declined further in 2015, averaging
250 through July.
23 U.S. Lower 48 excludes the non-contiguous states of Alaska and Hawaii. 24 In this section, natural gas refers to dry natural gas.
The unexpected growth of Appalachian production
has upended traditional gas flows
and created new infrastructure needs.

IHS Economics | The Economic Benefits of Natural Gas Pipeline Development on the Manufacturing Sector
© 2016 IHS 16 May 2016
Oil-directed drilling is also a significant
contributor to NG production in the U.S.
Lower 48 because in many oil plays, NG
is intermixed with the oil and gets
produced via the same well. While in
some cases, where infrastructure does
not exist, this gas is burned off in a
process called flaring, in most cases, the
gas is collected and brought to market on
the pipeline system. This is called
associated gas, and in 2014 it represented
approximately one-fifth of all U.S.
Lower 48 NG production. Because gas is
produced as a byproduct of oil in these
areas, well economics are tied to the
price of oil and not gas. As a result,
associated gas production depends on the
amount of oil-directed drilling that
occurs. Oil prices, namely West Texas
Intermediate (WTI) Crude, have fallen dramatically over the past year, from over $100/bbl in July 2014 to approximately
$46/bbl in October 2015. While the impact on oil-directed drilling did lag behind the fall in oil prices, the oil rig count fell
from 1,602 in early October 2014 to 578 by the end of October 2015, a decline of 64 %.
Despite declining drilling activity for both gas and oil, gas production continues to grow as rig efficiency and well
productivity both increase. Drillers are focusing on the most productive areas of plays, and rigs are drilling more complex
wells with longer horizontal segments and more hydraulic fracturing stages to increase productivity. At the same time, the
practice of drilling multiple wells on a single pad along with other innovations has significantly reduced the time required
to drill a well. In the Marcellus, for example, average drill days have declined significantly for many operators since 2009,
indicating the learning trends among operators in the play.
Well Productivity
Well productivity is steadily increasing in many plays. As operators become more familiar with the geological structure of
plays and sub-plays, they are able to target the most productive areas for drilling. They are also making steady incremental
gains in extending laterals and reducing well costs via drilling and completion efficiencies. Additional technological
developments in drilling technique are
expected to improve productivity over the
next five years. Such technological
innovations, together with new connections
to the interstate pipeline network, have
allowed a much quicker ramp-up of plays
brought into development in recent years.
The Marcellus and Utica plays have been
leaders in production growth; with
production exceeding 12 Bcfd only 72
months after development began in 2007.
By comparison, the Barnett play took more
than 200 months from its initial
development in 1995 to reach peak
production of about 5 Bcfd. The data
indicate that operators are indeed able to
ramp up production today much more quickly than they could 20 years ago.

IHS Economics | The Economic Benefits of Natural Gas Pipeline Development on the Manufacturing Sector
© 2016 IHS 17 May 2016
The shift toward liquids-rich plays has reduced
gas costs. Revenues from NG liquids (NGLs),
which are produced with natural gas, such as
ethane, butane, propane, and natural gasoline,
defray part or all of total well costs. In many
cases, NGL revenues exceed the total cost of
the well, and, in such situations, the break-even
price of dry gas production can be significantly
lower, if not negative.25 For example, using
December 2014 NGL prices, NGL revenues in
the Marcellus Shale reduce the average break-
even price of gas from the play from $4.13 to $2.40/thousand cubic feet (Mcf).
The Woodford play dramatically demonstrates
the impact that NGL revenues can have on
project economics. In that play, break-even
prices drop from $7.85 to $2.21/Mcf in the gas-directed portion of the play and from $19.35 to ($4.50)/Mcf in the oil-
directed portion. This means that despite a negative price of ($4.50)/Mcf, operators in the oil portion of the Woodford
would receive a positive 10% return on their projects. In contrast, the dry Haynesville shale play has few liquids, and the
difference between the breakeven price with and without NGL revenues is only about $0.10/Mcf.
Production growth is likely to be concentrated in
Appalachia, but Texas and Louisiana will grow as well.
Unconventional gas activity is concentrated in five major
regions throughout North America: Western Canada, the
Rocky Mountains, the Permian and San Juan basins in
West Texas and New Mexico, the Texas Gulf Coast, and
Appalachia. Most of the recent growth, as well as projected
development, have been centered in the Appalachian
region of the Eastern United States, where gas activity had
been sparse prior to 2007. The unexpected growth of
Appalachian production has upended traditional gas flows and created new infrastructure needs.
Over the past two years, the Marcellus play has been the
most prolific contributor to gas supply growth, with gas
production from this formation growing by more than 10
Bcfd between 2012 and 2014. Combined with the Utica,
the other major Appalachian play, the Marcellus is
expected to account for almost 75% of the total growth, or
22.7 Bcfd, in the U.S. Lower-48 productive capacity
between 2015 and 2025. The Haynesville play, which has
declined in recent years as operators have shifted toward
plays with more NGLs, is expected to rebound, driven by
demand growth in southern U.S. markets and increasing
well productivity within that play. As a result, the
Haynesville production will grow by more than 3 Bcfd by
25 The break-even price calculation assumes a 10% internal rate of return (IRR) on investment. Therefore a negative break-even price for gas can be
interpreted as indicating an IRR greater than 10%. Alternatively, an operator could pay a customer to take the gas and still generate a 10% rate of
return.
Table 1
North American full-cycle "IHS outlook" break-even prices ($/Mcf)
Without
NGL credit
With NGL
credit
Play 2015 2015
Barnett $9.13 $6.31
Cotton Valley $5.98 $4.62
Haynesville Shale $3.87 $3.76
Fayetteville Shale $4.29 $3.98
Jonah $6.29 $4.11
Marcellus Shale $4.13 $2.40
Montney $5.79 ($1.28)
Pinedale $4.60 $3.32
Utica Gas $5.96 $3.48
Woodford $11.52 $0.07
Woodford Gas $7.85 $2.21
Woodford Oil $19.34 ($4.50)
Source: IHS Energy
Note 3 : Negative numbers indicates a negative gas
prices is required to reduce the return to 10%, given
that the liquids revenues produce a much higher
return
Note 4: Break-even prices for Woodford are show n
both at a play level and subplay level to demonstrate
how play economics can vary w ithin a play.
Source: IHS Energy
© 2015 IHS
Note 1: Full-cycle unit break-even prices are calculated at the play level for the “typical” gas w ell
and include leasehold, F&D, royalty, opex, taxes, and return. Capital costs are success-w eighted
and based on equipment needed for the “typical” w ell. WACC is assumed to be 10%. Taxes are
based on tax benefits available to all producers. Well useful life is assumed to be 20 years. Costs
show n here do not include transportation costs to Henry Hub.
Note 2: Reflects IHS Energy's f irst quarter 2014 price outlooks for crude oil and NGLs.

IHS Economics | The Economic Benefits of Natural Gas Pipeline Development on the Manufacturing Sector
© 2016 IHS 18 May 2016
2025, or almost 75% higher than 2015 levels. The Eagle Ford Play in Texas, which combines a mixture of oil- and gas-
directed drilling, will also see production increase. Outside of the United States, production in Western Canada, which
exports significant quantities of gas to the United States via pipeline, will also grow significantly, driven by anticipated
LNG exports and the need to replace declining conventional production in the Western Canada Sedimentary Basin. This
growth could potentially be constrained by transportation costs on the TransCanada Mainline (Canadian Mainline), the
main route for Western Canadian gas to reach U.S. Midwest and Northeast markets, if those rates make gas from Western
Canada uncompetitive in destination markets.
IHS Energy expects that the ongoing development of unconventional gas plays in the U.S. Lower 48 will keep supply
growth robust between 2016 and 2025 and will help supply keep up with rapidly growing demand. Our outlook projects an
average annual gas production growth of 3.0 Bcfd in the U.S. Lower 48, the majority of which will come from plays in the
Appalachian basin. By 2025, total U.S. Lower 48 gas production is expected to reach 102.9 Bcfd, an increase of 33.3 Bcfd, or 48% higher, relative to 2014.
Infrastructure Development
Infrastructure development in the North American pipeline and storage grid over the next 10 years will be driven by
producers’ choices of how to profit from production growth out of the Marcellus and Utica plays. The rapid growth of low-
cost production out of these areas has created a bottleneck, as drillers are unable to find pipeline capacity to move gas from
the well to consumer markets. IHS expects new infrastructure development to spread in all directions from Appalachia to
support 22.7 Bcfd of productive capacity growth from the Marcellus (19.3 Bcfd) and Utica (3.4 Bcfd) between 2015 and
2025. Producers and shippers have signed up for long-term contracts on pipeline capacity additions to downstream
consuming markets totaling about 23.7 Bcfd at this point and representing almost $30 billion in investment. The majority
of new additions are designed to send gas to the U.S. Southeast. 14.6 Bcfd, or 62% of total contracted capacity additions, is
heading to the Southeast. 3.5 Bcfd/ (15%), 3.2 Bcfd (13%), and 2.5 Bcfd (10%) are designed to bring Appalachian gas to the U.S. Northeast, U.S. Midwest, and Eastern Canada, respectively.
This investment has already created new flow patterns, as Appalachia has been able to displace other supply regions out of
the Northeast markets. The Appalachian production will be forced to gain access to additional new downstream markets,
requiring the necessary pipeline capacity to deliver the gas. This is partially possible by re-engineering existing pipelines
historically importing gas into the northeastern United States and Eastern Canada to reverse the direction of flow and send
low-cost Appalachian gas to additional demand regions. Many pipelines, like the Rockies Express Pipeline, which just
reversed its Zone 3 between Illinois and Ohio to carry gas west into the Midwest and Chicago market, are already doing

IHS Economics | The Economic Benefits of Natural Gas Pipeline Development on the Manufacturing Sector
© 2016 IHS 19 May 2016
this. As the potential for reversal of existing pipelines is exhausted, the supply growth in Appalachia will require the
construction of brand-new pipeline capacity.
Additionally, as U.S. production activity shifts to Appalachia, many pipelines originating in traditional Western and Gulf
Coast supply regions are facing increasingly difficult operating conditions. Pipelines out of the Rockies, the Haynesville,
the Barnett, and even the Fayetteville may have difficulty renewing long-term contracts that expire later this decade or in
the early 2020s. Beyond 2025, the growth in demand for gas-fired power generation will have a significant impact on the
pipeline system. This is particularly true if additional pipelines are needed in order to ensure the reliability of electric
demand.
Demand Growth
Abundant low-priced NG is driving a massive ongoing
and upward shift in NG demand. Low prices together
with new environmental regulations are resulting in the
retirement of a significant number of coal-fired power
plants, many of which will be replaced by gas-fired
capacity. Gas-intensive industries, which are identified
in Chapter Four, are relocating facilities to North
America from overseas, attracted by low prices and
abundant supplies of NG and NGL. Domestic trucks,
vans, ships, and even locomotives are being built or
retrofitted to run on NG. LNG exports are planned
from the U.S. Lower 48 and Canada, and U.S. pipeline
exports to Mexico are increasing. And all of the growth
in NG production will require greater use of NG for
field operations and as a pipeline transportation fuel.
Total NG demand is poised to increase by 40 percent
over the next decade—double the growth of the past 10 years.
IHS Economics | The Economic Benefits of Natural Gas Pipeline Development on the Manufacturing Sector
© 2016 IHS 20 May 2016
Such demand growth represents a fundamental change for gas producers that for the past 10 years have struggled to find
enough markets to sell the production surge accompanying the “shale gale.” Meeting the expected demand growth will
require production growth to exceed even the steep increases of recent years. IHS Energy expects that the required supply
will become available. Resources are ample, and operators have demonstrated an ability to increase production steadily
despite declining prices and rig counts. New pipeline and processing infrastructure expansion will be a key to connecting new supply sources with new and growing sources of demand.
Drivers of New Natural Gas Demand
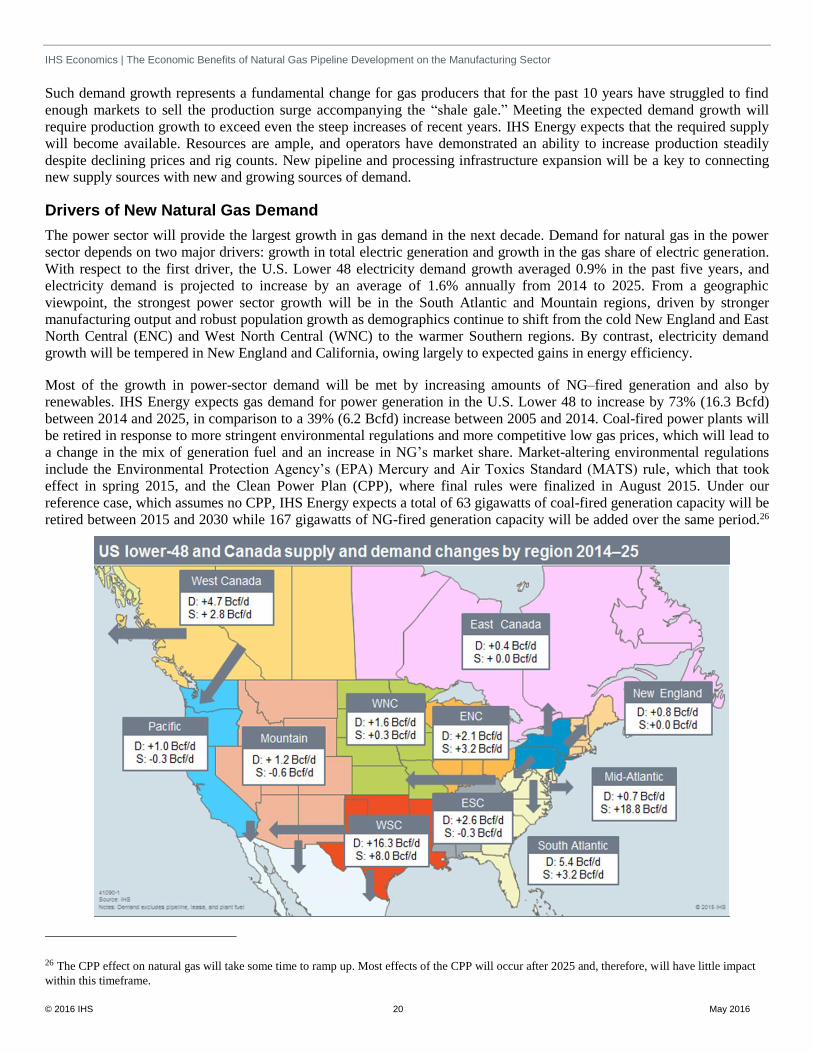
The power sector will provide the largest growth in gas demand in the next decade. Demand for natural gas in the power
sector depends on two major drivers: growth in total electric generation and growth in the gas share of electric generation.
With respect to the first driver, the U.S. Lower 48 electricity demand growth averaged 0.9% in the past five years, and
electricity demand is projected to increase by an average of 1.6% annually from 2014 to 2025. From a geographic
viewpoint, the strongest power sector growth will be in the South Atlantic and Mountain regions, driven by stronger
manufacturing output and robust population growth as demographics continue to shift from the cold New England and East
North Central (ENC) and West North Central (WNC) to the warmer Southern regions. By contrast, electricity demand
growth will be tempered in New England and California, owing largely to expected gains in energy efficiency.
Most of the growth in power-sector demand will be met by increasing amounts of NG–fired generation and also by
renewables. IHS Energy expects gas demand for power generation in the U.S. Lower 48 to increase by 73% (16.3 Bcfd)
between 2014 and 2025, in comparison to a 39% (6.2 Bcfd) increase between 2005 and 2014. Coal-fired power plants will
be retired in response to more stringent environmental regulations and more competitive low gas prices, which will lead to
a change in the mix of generation fuel and an increase in NG’s market share. Market-altering environmental regulations
include the Environmental Protection Agency’s (EPA) Mercury and Air Toxics Standard (MATS) rule, which that took
effect in spring 2015, and the Clean Power Plan (CPP), where final rules were finalized in August 2015. Under our
reference case, which assumes no CPP, IHS Energy expects a total of 63 gigawatts of coal-fired generation capacity will be
retired between 2015 and 2030 while 167 gigawatts of NG-fired generation capacity will be added over the same period.26
26 The CPP effect on natural gas will take some time to ramp up. Most effects of the CPP will occur after 2025 and, therefore, will have little impact
within this timeframe.

IHS Economics | The Economic Benefits of Natural Gas Pipeline Development on the Manufacturing Sector
© 2016 IHS 21 May 2016
The ENC, East South Central (ESC), and South Atlantic (SA) census divisions are expected to account for the majority of
the net coal capacity retired in North America over this period. Hence, IHS Energy projects these regions will have some of the biggest increases in power-sector gas demand.
The second-largest demand increases are being felt in the U.S. industrial sector, which uses NG as both a fuel and a
feedstock to meet a variety of energy requirements. The manufacturing sector accounts for about 80% of total industrial
gas demand, with the remaining 20% coming from agriculture, construction, and mining. Within manufacturing, 91% of
NG consumption is for fuel (including drying, melting, machine drive, space heating) and the remaining 9% is feedstock
use in the refining, chemicals and primary metals sectors. Manufacturing’s use of NG is concentrated in a few mature
sectors. Chapter Four of this report describes the use of NG in manufacturing, identifying nine sectors at the three-digit
North American Industry Classification System (NAICS) code level that accounted for 91.3% of consumption in 2010 as
NG–intensive sector. The nine sectors are (in descending order of NG consumption): chemicals, petroleum and coal, food,
primary metals, paper, non-metallic minerals, fabricated metals, wood products, and textile mills. The remaining 8.7% is
used in 12 subsectors such as: transportation equipment, plastics and rubber products, machinery, computers and electronics, and electrical equipment.
Many of these industries—most notably the chemicals industry—are actively pursuing strategies to take advantage of low
NG prices. Standing alone, the chemicals industry is expected to be the third-largest source of growth in gas demand
through 2025. IHS has estimated that as much as $100 billion will be invested between 2013 and 2025 in new chemical,
plastics, and related derivative manufacturing facilities in the United States. These investment figures are for
manufacturing facilities only; additional infrastructure investment will go hand in hand to support feedstock requirements. IHS Energy estimates that NG demand in the chemical industry will grow by about 40% between 2014 and 2020.
Despite the advantages of lower NG prices, NG demand in most industries is a derived demand, depending on the level of
output of the industry in question. Except for a few select industrial segments, such as ammonia and methanol, which use
NG as their primary feedstock, gas expenses are only a small fraction of the
total cost base when it is being used as a fuel. An expanding industry is likely
to increase its demand for NG, regardless of the level of gas costs, more
readily than an industry that is not expanding. Therefore, the growth prospects
of the major gas-consuming industries are an important indicator of future NG
demand in the industrial sector. Prospects are mixed for various industries.
Three of the top four gas-consuming industries are projected to realize strong
growth: chemicals, iron and steel, and processed foods are expected to
increase output by 30% or more above their pre-recession 2007 levels by
2025. Three other industries—petroleum and coal products, non-metallic
minerals, and pulp and paper—are expected to show small gains compared
with 2007. Lagging gas demand in the slow-growing industries will partly
offset the strong growth in the growing industries.
IHS Energy expects industrial-sector NG demand in the U.S. Lower 48 to rise
by 17% from 20.9 Bcfd in 2014 to 24.5 Bcfd in 2025. The West South Central
(Texas and Louisiana) and the East North Central and Pacific regions, the
home of growing manufacturing activity and petrochemical plants, are
expected to account for 44%, 15% and 11% of industrial NG demand by 2025,
respectively.
The U.S. Lower 48 will be a net exporter of NG in 2018.27 With U.S. Lower 48 NG supplies more than adequate to meet
domestic demand and significantly cheaper than global supplies, an increasing amount will be desired by export markets.
Pipeline exports to Mexico from the West South Central (Texas) and Mountain (Arizona) divisions are increasing
significantly in the medium term, and LNG exports from the West South Central (Texas and Louisiana) are expected to
27 U.S. Lower 48 net exports include LNG exports and natural gas pipeline exports to Canada and to Mexico. North America (Canada and the U.S.
Lower 48) has been a net exporter since 2011.
“There is a mismatch,
geographically, in the growth in
natural gas demand and supply in
the U.S. Lower 48. The sum of
exports, power, and industrial
demand will substantially exceed
supply growth in the West South
Central, East South Central, and
Mountain regions, creating a
demand for new natural gas
infrastructure to serve these
divisions.”

IHS Economics | The Economic Benefits of Natural Gas Pipeline Development on the Manufacturing Sector
© 2016 IHS 22 May 2016
begin in 2016. By 2025, LNG exports and pipeline exports to Mexico from the U.S. Lower 48 are expected to reach 15
Bcfd, up by 15% since 2014.
There is a mismatch, geographically, in the growth in NG demand and supply in the U.S. Lower 48. The sum of exports,
power, and industrial demand will substantially exceed supply growth in the West South Central, East South Central, and
Mountain regions, creating a demand for new NG infrastructure to serve these divisions. In contrast, supply growth will
significantly outpace demand growth in the Mid-Atlantic region. In addition to the Marcellus and Utica gas production
developments, there will be some other areas of significant pipeline and processing plant infrastructure activity. For
instance, LNG exports will, in many cases, require upstream pipeline capacity expansions—of varying degrees—to support
steady-state utilization of liquefaction facilities. These will range from 50 to 100 miles for pipeline header systems in the
U.S. Gulf Coast to transport NG from existing pipeline systems to the LNG terminal facilities. New pipeline capacity will
also be required in New England, parts of the Southeast, and Florida to support power-sector demand for gas.
The need for new capacity would increase existing regional constraints and bottlenecks in the NG transmission network,
with the extent of the effect varying by region. As we note above, the primary drivers of growth in demand for NG are
increased use of it to generate electricity and higher production in manufacturing. The map above presenting demand
growth for NG between 2014 and 2025 by Census region shows that absolute increases in demand will range between 0.7
Bcf/d and 2.6 Bcf/d in seven of the nine regions, with the largest increases of 5.4 Bcf/d and 16.3 Bcf/d occurring in the
South Atlantic and West South Central Regions, respectively. As states and electric utilities proceed with planning to
comply with the most recent set of CPP regulations, the demand for NG to generate electricity is likely to change. Our
December 2015 analysis of the CPP finds that between 2022 and 2040 NG consumption for electric power generation
under mass trading will average 4.6 Bcfd higher than under our reference case that assumes no CPP. The same analysis
finds that average annual coal consumption for the electric power generation during the same period will be 15% lower than under the reference case.
Natural Gas Liquids and Petrochemicals
The production of NGLs has grown more
than 60% from 2010 through 2015, and is
forecast to grow another 42% through 2020.
Newer current and forecast productive
capacities and volumes of NGLs from the
Eagle Ford shale, Utica shale, Marcellus
shale, and tight oil plays and sub-plays in the
Permian Basin present large potential
opportunities for petrochemical feedstock
consumption.
NGLs, such as ethane, propane, butane,
isobutane, and pentane, are used in a variety
of industries including cooking and heating
for residential and commercial and
petrochemical and plastic. Manufacturers
that require large volumes of NGLs as a
feedstock must be connected to a pipeline, as
other modes of transportation are unable to provide the volumes they require.
Regions and manufacturers have experienced some limitation in their ability to make use of additional NGLs supply as the midstream processing and pipeline capacity has not kept up with resource development.

IHS Economics | The Economic Benefits of Natural Gas Pipeline Development on the Manufacturing Sector
© 2016 IHS 23 May 2016
Integrating the refining capacity into the area to a
petrochemical complex could improve the
competitive position of an area’s refiners relative
to international refiners. Similarly, the added
flexibility and markets the U.S. Gulf Coast refiners
enjoy because of the local petrochemical
complexes give them an operational and cost
advantage over refiners that do not have
petrochemical complex access. As midstream
pipeline capacity expands to regions with
insufficient or no current access to NGLs,
opportunities will expand for NGL processing, and
most especially, for industries that require large
volumes of forward-linkage products, such as manufacturers that use NGLs as their raw material.
28 http://www.alleghenyfront.org/story/frequently-asked-questions-about-ethane-crackers.
An example of midstream capacity challenges
The increase in NGL supply in the Marcellus region has led Sunoco Logistics to develop the Mariner East
system that will deliver NGLs via pipeline to its Marcus Hook Industrial Complex in Delaware County,
Pennsylvania; the first phase started operating in December 2014. The availability of NGLs will be a key factor
in creating an integrated petrochemical complex in the Philadelphia market. If petrochemical capacity can be
built, additional opportunities could be realized through the integration with surrounding refineries and into the
local economy. In 2012, there was some concern of potentially ‘stranded’ NG in Marcellus due to the lack of
takeaway capacity which would have created a supply of discounted gas that could have been used in gas-to-
liquid (GTL) options. However, the development of GTL options depends upon the relative competitiveness of
pricing between oil and NG, and the cost of converting NG into petroleum products. Given current oil market
pricing, the pricing differential between the two resources is too small to justify conversion costs. Additionally,
the lead time required for the construction of the Mariner East 2 pipeline, which would carry NGLs, specifically
propane, from Marcellus to the Philadelphia area, also limits the speed with which manufacturers can take advantage of the large supply availability.
The completed Mariner East 1 pipeline has the capacity to deliver 70,000 barrels per day of ethane and propane
to the MHIC. The proposed Mariner East 2 pipeline project consists of two new pipelines, the first phase of
which would have a capacity of 275,000 b/d of NGLs such as propane, butane and ethane. When complete, the
entire Mariner East pipeline system would have a capacity of between 350,000 and 750,000 bpd. The Marcellus
and Utica supply potential for ethane as a petrochemical feedstock for the manufacturing of ethylene could be as
much as 1.1 million barrels per day, assuming 80 percent of the ethane produced with NG is extracted. Ethane
crackers produce ethylene, a basic chemical commodity that is a major building block used widely in the overall
petrochemical value chain. Ethylene is the root chemical for many varieties of plastics, resins, adhesives,
synthetic products,28 and also used in solvents, urethanes, and pharmaceuticals. In March 2016, the first vessel
carrying an export shipment of ethane was loaded at the Marcus Hook Industrial Complex bound for a petrochemical plant in Norway.

IHS Economics | The Economic Benefits of Natural Gas Pipeline Development on the Manufacturing Sector
© 2016 IHS 24 May 2016
CHAPTER THREE: NATURAL GAS PIPELINE CONSTRUCTION & OPERATION
COSTS
Backward Linkages
The economic sectors that provide the goods and services used in the construction and operation of NG pipelines are
referred to, in this report, as backward linkages. The backward linkages consist of the economic sectors that provide
intermediate inputs required to construct the pipelines that deliver NG to end users, such as commercial and industrial
businesses, transportation, electric-generating plants that use it as a fuel, and residential customers. Pipeline construction
generates increases in economic activity when inputs (e.g., steel pipe, coatings, construction equipment, compressors,
motors, gauges and instruments, sand and gravel, engineering and design services, etc.) are purchased from suppliers,
defined as the indirect impacts, and through the spending of disposable income by the construction workers. The total
economic impacts generated in a regional economy when a NG pipeline is built or expanded will depend on the mix of
intermediate inputs required and the extent to which they can be obtained from within the region as opposed to from
suppliers in distant locations. The purposes of this section are to describe the types and shares of goods and services used
in constructing and operating NG pipelines and to present unit capital cost estimates (i.e., dollars per mile) for typical
pipelines to provide an estimate of the level of direct spending that can occur in regional economies when they are installed.
Capital expenditures for constructing, expanding, and repurposing existing NG pipelines have had a significant
contribution to the U.S. economy since the expansion of unconventional oil and gas technology. In this section, we will
describe the components of pipeline construction and operations and their respective costs. In Chapter Five, we will measure their economic impacts of constructing and operating NG transmission lines in the United States
Capital expenditures for constructing new, and expanding or repurposing existing, NG pipelines, and related infrastructure,
such as compressor and pump stations, have had a significant impact on the U.S. economy. The rapid growth in the supply
of affordable domestically produced NG resulting from the rise of the unconventional energy sector has greatly increased
the demand for new NG pipelines and related infrastructure and, by extension, for the goods and services they require,
especially for the capital equipment from the manufacturing sector. In this section, we will describe the cost components of
pipeline construction and operation and also present unit capital costs (i.e., dollars per mile) for typical pipelines. Capital
and O&M cost estimates are presented for typical diameters of gathering, transmission, and distribution NG pipelines. Both the capital and annual O&M costs apply only to new 2015 pipeline construction.
The construction and operating costs for NG pipelines will vary based on a number of factors that affect the design of the
pipeline, including:
Nominal diameter.
Length.
Function (e.g., gathering, transmission or distribution).
Volumetric flow.
Pressure.
Number and spacing of compressor or booster stations.
Physical and environmental conditions along a right of way that affect costs, such as topography, weather, soil and
geologic conditions, types of habitat and adjacent land uses, number of crossings required for rivers, highways, rail,
etc.
Costs for obtaining permits, engineering design fees, insurance, and other services.
Cost of acquiring rights of way.
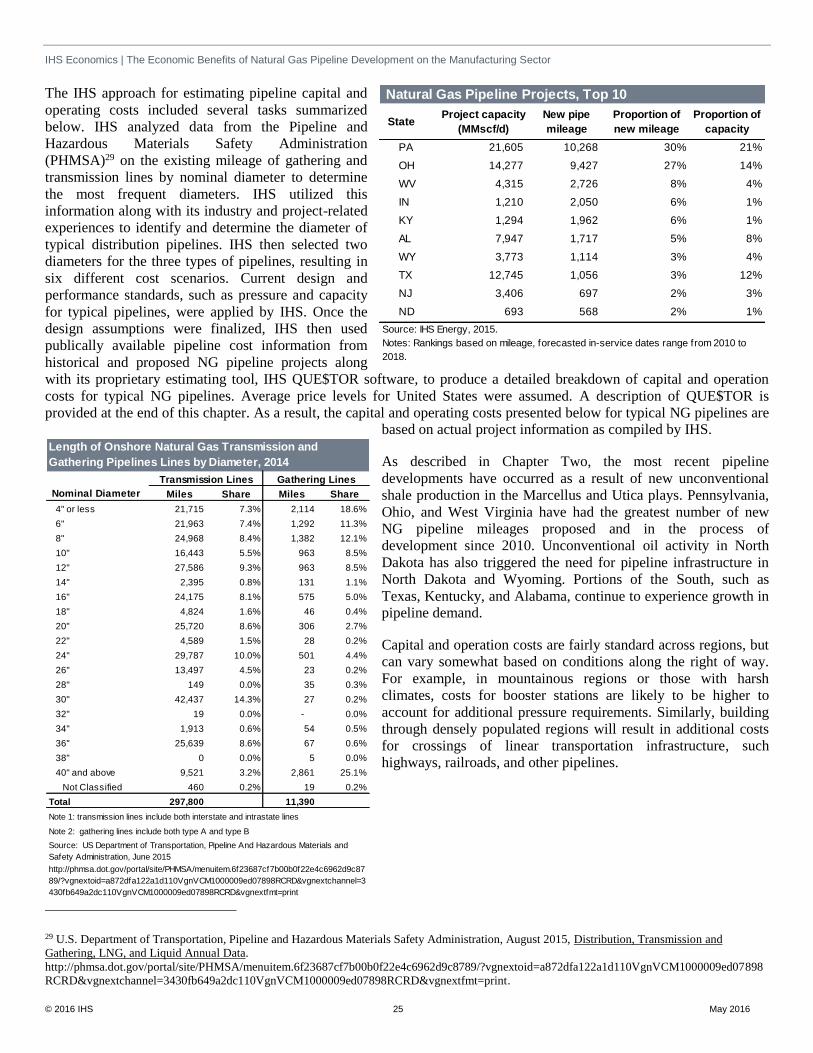
IHS Economics | The Economic Benefits of Natural Gas Pipeline Development on the Manufacturing Sector
© 2016 IHS 25 May 2016
The IHS approach for estimating pipeline capital and
operating costs included several tasks summarized
below. IHS analyzed data from the Pipeline and
Hazardous Materials Safety Administration
(PHMSA)29 on the existing mileage of gathering and
transmission lines by nominal diameter to determine
the most frequent diameters. IHS utilized this
information along with its industry and project-related
experiences to identify and determine the diameter of
typical distribution pipelines. IHS then selected two
diameters for the three types of pipelines, resulting in
six different cost scenarios. Current design and
performance standards, such as pressure and capacity
for typical pipelines, were applied by IHS. Once the
design assumptions were finalized, IHS then used
publically available pipeline cost information from
historical and proposed NG pipeline projects along
with its proprietary estimating tool, IHS QUE$TOR software, to produce a detailed breakdown of capital and operation
costs for typical NG pipelines. Average price levels for United States were assumed. A description of QUE$TOR is
provided at the end of this chapter. As a result, the capital and operating costs presented below for typical NG pipelines are based on actual project information as compiled by IHS.
As described in Chapter Two, the most recent pipeline
developments have occurred as a result of new unconventional
shale production in the Marcellus and Utica plays. Pennsylvania,
Ohio, and West Virginia have had the greatest number of new
NG pipeline mileages proposed and in the process of
development since 2010. Unconventional oil activity in North
Dakota has also triggered the need for pipeline infrastructure in
North Dakota and Wyoming. Portions of the South, such as
Texas, Kentucky, and Alabama, continue to experience growth in pipeline demand.
Capital and operation costs are fairly standard across regions, but
can vary somewhat based on conditions along the right of way.
For example, in mountainous regions or those with harsh
climates, costs for booster stations are likely to be higher to
account for additional pressure requirements. Similarly, building
through densely populated regions will result in additional costs
for crossings of linear transportation infrastructure, such
highways, railroads, and other pipelines.
29 U.S. Department of Transportation, Pipeline and Hazardous Materials Safety Administration, August 2015, Distribution, Transmission and
Gathering, LNG, and Liquid Annual Data.
http://phmsa.dot.gov/portal/site/PHMSA/menuitem.6f23687cf7b00b0f22e4c6962d9c8789/?vgnextoid=a872dfa122a1d110VgnVCM1000009ed07898
RCRD&vgnextchannel=3430fb649a2dc110VgnVCM1000009ed07898RCRD&vgnextfmt=print.
Nominal Diameter Miles Share Miles Share
4" or less 21,715 7.3% 2,114 18.6%
6" 21,963 7.4% 1,292 11.3%
8" 24,968 8.4% 1,382 12.1%
10" 16,443 5.5% 963 8.5%
12" 27,586 9.3% 963 8.5%
14" 2,395 0.8% 131 1.1%
16" 24,175 8.1% 575 5.0%
18" 4,824 1.6% 46 0.4%
20" 25,720 8.6% 306 2.7%
22" 4,589 1.5% 28 0.2%
24" 29,787 10.0% 501 4.4%
26" 13,497 4.5% 23 0.2%
28" 149 0.0% 35 0.3%
30" 42,437 14.3% 27 0.2%
32" 19 0.0% - 0.0%
34" 1,913 0.6% 54 0.5%
36" 25,639 8.6% 67 0.6%
38" 0 0.0% 5 0.0%
40" and above 9,521 3.2% 2,861 25.1%
Not Classified 460 0.2% 19 0.2%
Total 297,800 11,390
Note 1: transmission lines include both interstate and intrastate lines
Note 2: gathering lines include both type A and type B
Transmission Lines Gathering Lines
Source: US Department of Transportation, Pipeline And Hazardous Materials and
Safety Administration, June 2015
http://phmsa.dot.gov/portal/site/PHMSA/menuitem.6f23687cf7b00b0f22e4c6962d9c87
89/?vgnextoid=a872dfa122a1d110VgnVCM1000009ed07898RCRD&vgnextchannel=3
430fb649a2dc110VgnVCM1000009ed07898RCRD&vgnextfmt=print
Length of Onshore Natural Gas Transmission and
Gathering Pipelines Lines by Diameter, 2014
Natural Gas Pipeline Projects, Top 10
StateProject capacity
(MMscf/d)
New pipe
mileage
Proportion of
new mileage
Proportion of
capacity
PA 21,605 10,268 30% 21%
OH 14,277 9,427 27% 14%
WV 4,315 2,726 8% 4%
IN 1,210 2,050 6% 1%
KY 1,294 1,962 6% 1%
AL 7,947 1,717 5% 8%
WY 3,773 1,114 3% 4%
TX 12,745 1,056 3% 12%
NJ 3,406 697 2% 3%
ND 693 568 2% 1%
Source: IHS Energy, 2015.
Notes: Rankings based on mileage, forecasted in-service dates range from 2010 to
2018.

IHS Economics | The Economic Benefits of Natural Gas Pipeline Development on the Manufacturing Sector
© 2016 IHS 26 May 2016
The costs for capital equipment used in pipelines, such as steel pipe, coatings,
equipment, pumps, etc., will be very similar across the United States for most
projects at the point of production (i.e., there may be only a small number of
manufacturers and locations where the capital equipment is made) but the
delivered costs will vary based on the distance to the construction site and the
transport mode used to ship the input. Companies that design and build NG and
oil pipelines usually have the experience and capability to work under local
construction regulations and labor laws and can smoothly work with the
applicable government agencies and labor organizations. These companies
provide planning, engineering, construction, and project management services,
utilizing their fleets of specialty construction equipment on country-wide basis.
Thus, some capital goods and construction services are “imported” into a
region, especially if the project is located in a remote, rural area, which reduces
the overall local economic benefits that new pipeline construction provides.
One of the largest potential variations in construction costs for NG pipelines
comes from labor costs, which, as shown in the accompanying table, vary
substantially by state. Companies that provide specialized pipeline construction
services will hire local workers in the construction trade occupations if they are available and are often required to first hire
them from the local union. In North Dakota’s Bakken play, demand for pipeline construction rose rapidly and due to
insufficient quantities of locally skilled labor, many skilled workers were brought to the region as temporary labor. In
Pennsylvania’s Marcellus play, the local supply of skilled labor was larger, and fewer temporary workers were required,
but even there, specialized workers, such as foremen with pipeline construction expertise, were imported from outside the
region.
Construction and Operating Costs for Typical Natural Gas Pipelines
As noted above, IHS identified a variety of typical pipeline characteristics using current and historical pipeline construction
trends and national statistics on pipeline characteristics from PHMSA. A diameter-inch range of pipeline costs were
developed for two diameters for each pipeline type to provide high and low cost estimates, which were expressed on a unit
basis or the cost per mile. The construction costs presented below do not include the cost of acquiring rights of way, as it is
highly project specific.
Natural Gas Gathering Pipelines
Based on the PHMSA database, there were 11,390 miles of NG gathering pipelines in 2014. Gathering pipelines are
located in oil and gas fields and, therefore, are concentrated in the major oil and NG–producing states.
Capital costs for NG gathering lines assumed a pressure of 200 pounds per square inch gauge (psig), capacity of 25
MMCF/D, and a length of 25 miles in level terrain. These assumptions resulted in a total cost per mile ranging from $1.4
million to $1.8 million, respectively. Capital costs for gathering pipelines account for 39 percent and 46 percent
respectively of total costs for the two sizes of gathering pipes. This averages to approximately $560,000 and $828,000,
respectively, per mile of gathering pipeline mile. The construction costs for labor (i.e., wages and fringe benefits) comprise
23% and 21% respectively of the total cost for the two diameters of gathering pipes.
Unit O&M costs for the two sizes of newly constructed gathering pipelines are $154,000/mile and $163,000/mile annually.
The largest shares of costs are for operations labor and logistic and consumables, which accounted for about 80% of
operations costs. Gathering pipeline systems have the highest levels of operations labor of the three analyzed pipeline
systems. The unit O&M cost declines steadily after the first few years of operation as the new lines are integrated into existing systems.
Natural Gas Transmission Pipelines
Based on the PHMSA database, there were 297,800 miles of on-shore NG gathering pipelines in 2014. NG transmission
pipelines convey pipeline-ready NG from production locations to demanding regions. As described in Chapter One, they
flow along general transportation corridors and through switching hubs. Costs for transmission lines assumed a pressure of
State
Average
Annual
Wage in
2014
Index (US
= 1.00)
Arizona 48,411$ 0.97
Colorado 52,552$ 1.05
Massachusetts 61,032$ 1.22
Michigan 45,340$ 0.91
Virginia 47,189$ 0.95
US $ 49,892 1.00
Wage Levels in Oil and Natural Gas
Pipeline Construction Occupations
Note: w age levels w ere calculated as w eighted
averages using employment in occupational category
Source: Bureau of Labor Statistics, 2015,
Occupational Employment Statistics (OES) for the
2014

IHS Economics | The Economic Benefits of Natural Gas Pipeline Development on the Manufacturing Sector
© 2016 IHS 27 May 2016
900 psig, a capacity of 700 MM/d, and a length of 200 miles, resulting in a total unit construction cost per mile of $1.9
million and $3.6 million, respectively, for the two diameters.
Capital costs, which include equipment and materials, account for 44.3% and 56.1% of the total cost of constructing the
two sizes of pipeline, equivalent to approximately $860,000 and over $2 million of capital expenses per transmission
pipeline mile. The construction cost figures for labor (i.e., wages and fringe benefits) comprise 27% and 21.9%
respectively, of the total cost for the 12-inch and 30-inch lines.
Operations costs for newly constructed transmission pipelines ranged from $86,000 to $116,000 per pipeline mile. Given
the cumulative distance and activities needed to operate and maintain networks of transmission pipelines, the bulk of costs
are composed of operations labor, logistics and consumables, and insurance expenses. Operation labor costs account for a
smaller portion of costs than for gathering lines, as do inspection and maintenance costs. Insurance costs and logistics and
consumables are significantly higher as compared to gathering lines, the potential risks involved when moving large
volumes of NG through long distances.
Natural Gas Distribution Pipelines
In 2014, there was a total of 1,264,387 miles of NG distribution lines in the United States. Natural gas distribution
pipelines connect transmission lines to the consumer through an intricate series of small lower-pressure lines. As described in Chapter One, distribution pipelines systems are typically built and operated by local gas distribution utilities.
Costs for distribution pipelines were estimated for 4-inch and 8-inch diameters, assumed a pressure of 100 psig, a capacity
of 10 MMcf/d, and a distance of 5 miles. The assumptions are for newer projects, and they resulted in total construction
costs per mile of $1.4 million and $1.6 for the two sizes. Capital costs for distribution pipelines, which include equipment
and materials, account for just under half of the total cost of constructing the pipeline. This averages to approximately
$141,000 to $262,000 of capital expenses per distribution pipeline mile. Capital costs for distribution pipelines account for
10% and 16.7% of the total cost, much lower than the shares for the transmission and gathering lines, and equivalent to
$141,000 and $262,000, respectively, per pipeline mile.
Annual O&M unit costs for newly constructed distribution lines were $90,000 and $93,000 per pipeline mile for the two
sizes. The largest shares of costs were for operations labor and logistic and consumables, which accounted for about 70%
of operations costs. The annual O&M costs only apply to new construction; over time, as new distribution lines become
fully integrated into the existing pipeline distribution systems, and as network and economies of scale effects are captured, annual unit O&M costs for distribution lines will decline.
IHS QUE$TOR Model
Over the years, IHS has developed and continuously refines a software tool called QUE$TOR that is used for analyzing the
costs of new oil and gas projects. It was used to determine the NG pipeline construction and operating costs contained in
the tables above. The program has recently undergone a complete software rewrite, retaining all the former capabilities but
adding a significant increase in speed and functionality. QUE$TOR™ is a project modeling, evaluation and decision-
support system for global application in the oil and gas industry. The program enables users to estimate and run
sensitivities on the CAPEX and OPEX of alternative field development plans. Using detailed technical algorithms and
regional databases, QUE$TOR™ provides a consistent methodology for generating cost estimates and optimizing
development plans. At the heart of QUE$TOR™ are cost and technical databases (user accessible and customizable)
covering all producing regions of the world. These databases are updated every six months with costs gathered from actual
projects, fabricators, vendors, and service companies. Using primary input data (recoverable reserves, reservoir depth, and
water depth), a production profile is generated, the development concept is defined, and design flowrates calculated. The
program then sizes facilities, pipelines, and substructures, and calculates capital costs, drilling costs, operating costs, and
abandonment costs. These costs are then scheduled to provide project cash flows. The regional databases are populated
with unit rates for equipment items, materials, fabrication installation, hookup and commissioning, and other project costs.
QUE$TOR™ has been benchmarked against actual project costs and is continuously maintained to reflect the latest
changes in technology

IHS Economics | The Economic Benefits of Natural Gas Pipeline Development on the Manufacturing Sector
© 2016 IHS 28 May 2016
CHAPTER FOUR: NATURAL GAS PIPELINE, MANUFACTURERS, AND THEIR
FORWARD LINKAGES
Natural Gas–Intensive Sectors
The manufacturing sector uses NG primarily as a fuel and feedstock and to support activities performed during the
production of manufactured goods. As described in a recent IHS report30 the manufacturing sector uses NG as a fuel in the following specific ways:
Direct process uses: drying, melting, process cooling and refrigeration, and driving machines
Direct non-process uses: heating facilities, ventilation and air conditioning, lighting
Indirect uses: as a boiler fuel for producing steam and generating electricity
Fuel use accounts for approximately 91% of total NG used by the manufacturing sector with the remaining 9% used as a
feedstock, concentrated primarily in three sectors: petroleum and coal products (i.e., refining), chemicals, and primary
metals. The first two sectors accounted for 48.4% and 44.2% of total feedstock use of NG by the U.S. manufacturing sector
in 2010.31
To identify the manufacturing subsectors that are most dependent on, and thus would benefit directly from, increased
supplies of NG in a regional economy, we updated our March 2014 study on industrial gas demand by analyzing the use of
NG by manufacturing subsectors at the 3-digit NAICS level. The purpose of this analysis was to identify subsectors that were both:
Intensive users, defined as consuming high amounts of NG in billions of cubic feet per $1 billion of real, or
Large aggregate users of NG.
The primary source of NG consumption information by manufacturing subsectors was the U.S. Department of Energy’s
Manufacturing Energy Consumption Study (MECS).32 The MECS presents the 2010 consumption of nine types of energy
by manufacturing subsectors, generally at the 3-digit NAICS level, but with some selected four-digit sectors also included.
We combined this information with IHS estimates of real output by manufacturing subsector to derive estimates of NG use
intensity. We also estimated the intensity of electric power use by subsector to capture the effect of lower prices of NG as a
fuel used to generate electric power either purchased from utilities or generated on site. The manufacturing sector accounted for about 23% of total U.S. consumption of NG in 2010.33
Manufacturers generate substantial amounts of electric power on site, so they benefit indirectly from lower NG prices.
According to the EIA34 in 2014 the industrial sector generated just over 144 million megawatt hours of electric power on site, 60% of which was produced by burning NG.
The following table presents the results of the analysis. A total of nine three-digit sectors are identified as intensive NG–
using sectors; they are also, for the most part, the largest absolute consumer of NG. The nine NG–intensive sectors
accounted for 91.3% of total NG used by the manufacturing sector in 2010. At the time this report was performed (late 2015), the 2010 MECS was the most recent year for which data was available.
30 IHS CERA, March 2014, U.S. Industrial Gas Demand – The Striking Turnaround Progresses. 31 U.S. Department of Energy, Energy Information Administration, 2010, Manufacturing Energy Consumption Survey, Table 1.1 First Use of Energy
for All Purposes (Fuel and Nonfuel).
http://www.eia.gov/consumption/manufacturing/data/2010/. 32 U.S. Department of Energy, Energy Information Administration, 2010, Manufacturing Energy Consumption Survey, Table 1.1 First Use of Energy
for All Purposes (Fuel and Nonfuel).
http://www.eia.gov/consumption/manufacturing/data/2010/. 33 U.S. Department of Energy, Energy Information Administration, 2010, Annual Energy Review 2010.
http://www.eia.gov/totalenergy/data/annual/archive/038410.pdf. 34 U.S. Department of Energy, Energy Information Administration, October 2015, Electric Power Monthly.
http://www.eia.gov/electricity/monthly/epm_table_grapher.cfm?t=epmt_1_01.

IHS Economics | The Economic Benefits of Natural Gas Pipeline Development on the Manufacturing Sector
© 2016 IHS 29 May 2016
The table shows that the nine NG–intensive sectors are generally the largest, and most intensive, users of electricity; they
used 74.3% of all electricity consumed by the U.S. manufacturing sector in 2010. Because the NG–intensive sectors both
consume a lot of electricity and use it intensively, it means that lower NG prices will have two beneficial effects on them:
1) a direct reduction in the costs of purchasing and using NG, especially in the three sectors that use it as a feedstock and 2) an indirect reduction in costs through the use of cheaper electricity.
In addition to the long-term effect of the CPP in increasing the use of NG as a fuel to generate electricity, the EPA’s
November 2015 final revisions to “National Emission Standards for Hazardous Air Pollutants for Major Sources:
Industrial, Commercial, and Institutional Boilers, and Process Heaters,” known as Boiler MACT (for maximum achievable
control technology) also provides an incentive for manufacturing establishments to use increasing amounts of NG as a fuel
for boilers and process heaters. Boilers produce steam that is used in production processes; to directly generate electricity
on site; in cogeneration applications, such as combined heat and power (CHP) facilities that produce both steam and
electricity; and to heat commercial and institutional buildings. Process heaters heat intermediate inputs used during
manufacturing production.
Manufacturing Sub-sector
Natural gas
consmption
(billions of
cubic feet)
NG Intensity:
billions of cubic
feet/$1 billion in
constant 2010
output
Intensity
rank
Net
electricity
use (million
kWh)
Electricity use
intensity: million
kWh/$1 billion in
constant 2010
output
Intensity
rank
311 Food 567 0.94 7 75,407 124.74 9
312 Beverage and Tobacco Products 37 0.21 16 8,449 48.06 19
313 Textile Mills 31 1.08 6 13,240 459.99 1
314 Textile Product Mills 9 0.42 11 2,458 114.15 11
315 Apparel 2 0.16 18 1,069 83.44 15
316 Leather and Allied Products 1 0.11 19 243 26.14 21
321 Wood Products 34 0.47 10 15,323 210.26 6
322 Paper 390 2.40 3 60,497 372.13 3
323 Printing and Related Support 33 0.37 12 13,704 154.02 8
324 Petroleum and Coal Products 892 1.93 5 47,014 101.70 12
325 Chemicals 2,192 3.41 1 131,932 205.52 7
325 Plastics and Rubber Products 101 0.52 9 45,797 234.20 5
327 Nonmetallic Mineral Products 266 2.65 2 32,576 324.68 4
331 Primary Metals 550 1.99 4 117,284 423.51 2
332 Fabricated Metal Products 159 0.52 8 37,206 121.61 10
333 Machinery 70 0.21 15 20,386 61.34 17
334 Computer and Electronic Products 41 0.09 21 29,503 66.00 16
335 Electrical Equip., Appliances, and Components 35 0.32 13 10,689 99.17 13
336 Transportation Equipment 125 0.16 17 38,832 50.52 18
337 Furniture and Related Products 13 0.23 14 4,960 88.89 14
339 Miscellaneous 16 0.10 20 7,598 47.01 20
Durables 1,309 0.49 314,357 117.26
Non-durables 4,255 1.77 399,810 166.31
Total 5,564 1.09 714,167 140.45
Sectors in grey and bold are natural gas intensive sectors
Natural Gas and Electricity Use by Manufacturing Sub-sectors in 2010
Soources: IHS CERA, March 2014, US Industrial Gas Demand – the Striking Turnaround ProgressesIHS, 2015. US Industry Service, Output by Manufacuring Sector. United
States Deparment of Energy, Energy Information Administration, 2010, Manufacturing Energy Consumption Survey, Table 1.1 First Use of Energy for All Purposes (Fuel and
Nonfuel) http://w w w .eia.gov/consumption/manufacturing/data/2010/.

IHS Economics | The Economic Benefits of Natural Gas Pipeline Development on the Manufacturing Sector
© 2016 IHS 30 May 2016
Electric Use by the Manufacturing Sector
The immediately preceding table presents the total amount of electric power used by the 3-digit manufacturing subsectors
in 2010, along with the intensity of use in millions of k per $1 billion in real 2010 output. For the most part, the largest and
most intensive uses of NG are also the largest and most intensive users of electric power, with the exception being the
petroleum and coal sector, whose use intensity for electric power is below average. The consumption of electric power is
more evenly distributed across the manufacturing sector than NG, with durable and non-durable manufacturing accounting
for 44% and 56% respectively of total electricity use. The intensity of electricity use in the non-durables is 41.8% higher than in the durable sectors.
States with Clusters of Natural Gas-Intensive Sectors
Based on the nine NG intensive sectors identified above, IHS used our propriety Business Markets Insights (BMI) database
to identify states that have above-average concentrations of economic activity (e.g., employment and output) in these
sectors. The BMI database allows us to analyze, at the 6-digit NAICS level detail, the economies of all U.S. states,
metropolitan statistical areas, and counties.
The next table below presents estimates of economic activity—employment and output—in the NG–intensive sectors by
state in 2015, excluding the District of Columbia. IHS uses output when measuring the level of economic activity within
the NG intensive sectors, in addition to showing the total value of production, as it is also a good indicator of both demand
for inputs through the backward linkages and demand for output through the forward linkages. Because productivity (i.e.,
output per worker) varies so widely across the manufacturing sector, including within the nine NG–intensive sectors,
employment figures can be somewhat misleading, as sectors like petroleum and coke products have very high output per worker.
The five states with highest absolute levels of output in the NG–intensive sectors are Texas, California, Illinois, Ohio, and
Pennsylvania. Another group of five states—Texas, California, Louisiana, Illinois, and Pennsylvania—all have very large
petroleum refining sectors; these five plus New Jersey and Ohio also have high levels of activity in chemical manufacturing.
The five states with the highest output location quotients (LQs) in the NG–intensive sectors are Louisiana, Indiana,
Arkansas, Iowa, and Wisconsin. These five states have smaller economies that specialize in individual sectors such as food
(e.g., Arkansas, Iowa, and Wisconsin), petroleum refining, and chemicals (e.g., Louisiana), paper (e.g., Arkansas,
Louisiana, and Wisconsin), and primary and fabricated metals (e.g., Indiana). The five states with the highest output LQs
also tend to have the highest employment LQs, along with Alabama, Ohio, and Nebraska. Louisiana’s employment LQ in
the NG–intensive sector is relatively low, as much of its output occurs in petroleum refining, a capital-intensive sector with
a very high output/employment ratio.
Twenty-nine states had output LQs greater than 1.0 for the NG–intensive sector and accounted for 68.5% of total U.S.
output in these sectors in 2015. Similarly, 27 states had employment LQs greater than 1.0 higher for the entire NG–
intensive sector and accounted for 61.7% of total U.S. employment that same year.
According to the EIA,35 the top NG–producing states in 2014, in descending order, were Texas, Pennsylvania, Alaska,
Oklahoma, Wyoming, Louisiana, Colorado, New Mexico, Arkansas, and West Virginia, all with annual gross withdrawals
of at least 1,000,000 MMcf. Together these 10 states accounted for 87.4 of total U.S. NG production that year. Three
states—Alaska, Colorado, and New Mexico—had output LQs for the entire NG sector of less than 1.0, suggesting that a
high proportion of the NG they produce is exported to other states instead of being used within them as an intermediate
input by other manufacturing subsectors.
35 EIA, 2015, Natural Gas Gross Withdrawals. http://www.eia.gov/dnav/ng/ng_prod_sum_a_EPG0_FGW_mmcf_m.htm
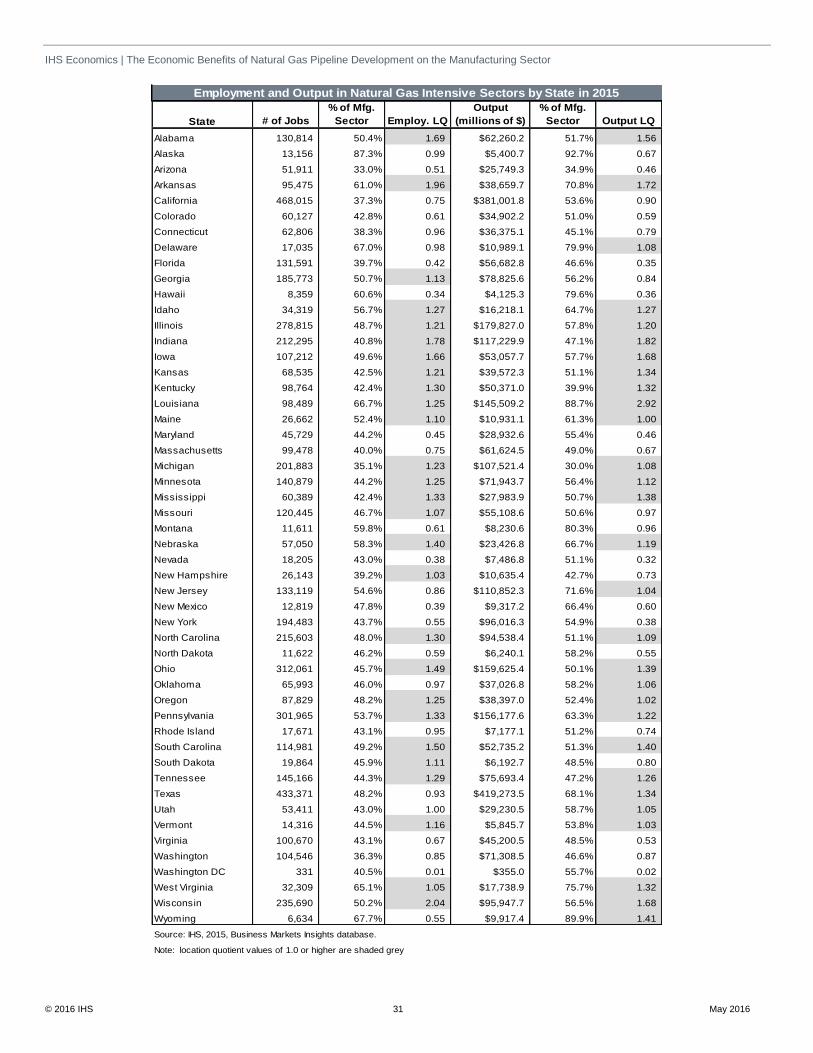
IHS Economics | The Economic Benefits of Natural Gas Pipeline Development on the Manufacturing Sector
© 2016 IHS 31 May 2016
State # of Jobs
% of Mfg.
Sector Employ. LQ
Output
(millions of $)
% of Mfg.
Sector Output LQ
Alabama 130,814 50.4% 1.69 $62,260.2 51.7% 1.56
Alaska 13,156 87.3% 0.99 $5,400.7 92.7% 0.67
Arizona 51,911 33.0% 0.51 $25,749.3 34.9% 0.46
Arkansas 95,475 61.0% 1.96 $38,659.7 70.8% 1.72
California 468,015 37.3% 0.75 $381,001.8 53.6% 0.90
Colorado 60,127 42.8% 0.61 $34,902.2 51.0% 0.59
Connecticut 62,806 38.3% 0.96 $36,375.1 45.1% 0.79
Delaware 17,035 67.0% 0.98 $10,989.1 79.9% 1.08
Florida 131,591 39.7% 0.42 $56,682.8 46.6% 0.35
Georgia 185,773 50.7% 1.13 $78,825.6 56.2% 0.84
Hawaii 8,359 60.6% 0.34 $4,125.3 79.6% 0.36
Idaho 34,319 56.7% 1.27 $16,218.1 64.7% 1.27
Illinois 278,815 48.7% 1.21 $179,827.0 57.8% 1.20
Indiana 212,295 40.8% 1.78 $117,229.9 47.1% 1.82
Iowa 107,212 49.6% 1.66 $53,057.7 57.7% 1.68
Kansas 68,535 42.5% 1.21 $39,572.3 51.1% 1.34
Kentucky 98,764 42.4% 1.30 $50,371.0 39.9% 1.32
Louisiana 98,489 66.7% 1.25 $145,509.2 88.7% 2.92
Maine 26,662 52.4% 1.10 $10,931.1 61.3% 1.00
Maryland 45,729 44.2% 0.45 $28,932.6 55.4% 0.46
Massachusetts 99,478 40.0% 0.75 $61,624.5 49.0% 0.67
Michigan 201,883 35.1% 1.23 $107,521.4 30.0% 1.08
Minnesota 140,879 44.2% 1.25 $71,943.7 56.4% 1.12
Mississippi 60,389 42.4% 1.33 $27,983.9 50.7% 1.38
Missouri 120,445 46.7% 1.07 $55,108.6 50.6% 0.97
Montana 11,611 59.8% 0.61 $8,230.6 80.3% 0.96
Nebraska 57,050 58.3% 1.40 $23,426.8 66.7% 1.19
Nevada 18,205 43.0% 0.38 $7,486.8 51.1% 0.32
New Hampshire 26,143 39.2% 1.03 $10,635.4 42.7% 0.73
New Jersey 133,119 54.6% 0.86 $110,852.3 71.6% 1.04
New Mexico 12,819 47.8% 0.39 $9,317.2 66.4% 0.60
New York 194,483 43.7% 0.55 $96,016.3 54.9% 0.38
North Carolina 215,603 48.0% 1.30 $94,538.4 51.1% 1.09
North Dakota 11,622 46.2% 0.59 $6,240.1 58.2% 0.55
Ohio 312,061 45.7% 1.49 $159,625.4 50.1% 1.39
Oklahoma 65,993 46.0% 0.97 $37,026.8 58.2% 1.06
Oregon 87,829 48.2% 1.25 $38,397.0 52.4% 1.02
Pennsylvania 301,965 53.7% 1.33 $156,177.6 63.3% 1.22
Rhode Island 17,671 43.1% 0.95 $7,177.1 51.2% 0.74
South Carolina 114,981 49.2% 1.50 $52,735.2 51.3% 1.40
South Dakota 19,864 45.9% 1.11 $6,192.7 48.5% 0.80
Tennessee 145,166 44.3% 1.29 $75,693.4 47.2% 1.26
Texas 433,371 48.2% 0.93 $419,273.5 68.1% 1.34
Utah 53,411 43.0% 1.00 $29,230.5 58.7% 1.05
Vermont 14,316 44.5% 1.16 $5,845.7 53.8% 1.03
Virginia 100,670 43.1% 0.67 $45,200.5 48.5% 0.53
Washington 104,546 36.3% 0.85 $71,308.5 46.6% 0.87
Washington DC 331 40.5% 0.01 $355.0 55.7% 0.02
West Virginia 32,309 65.1% 1.05 $17,738.9 75.7% 1.32
Wisconsin 235,690 50.2% 2.04 $95,947.7 56.5% 1.68
Wyoming 6,634 67.7% 0.55 $9,917.4 89.9% 1.41
Source: IHS, 2015, Business Markets Insights database.
Note: location quotient values of 1.0 or higher are shaded grey
Employment and Output in Natural Gas Intensive Sectors by State in 2015

IHS Economics | The Economic Benefits of Natural Gas Pipeline Development on the Manufacturing Sector
© 2016 IHS 32 May 2016
By contrast, there are a number of large states with high levels of output and employment in the–intensive sectors that
produce little or no NG, showing they are dependent on the NG pipeline system to receive their inputs. The large, pipeline-dependent states include California, Illinois, Indiana, Michigan, New Jersey, Ohio, New York, and Wisconsin.
Finally, the NG–intensive sectors account for high shares of manufacturing economic activity in a number of smaller states
including Alaska, Arkansas, Delaware, Louisiana, West Virginia, and Wyoming. These states have less diversity, with
NG–intensive activity concentrated in few sectors, resulting in high LQs. By contrast, the NG–intensive sectors account for
below-average shares of manufacturing activity in some large states with diverse manufacturing sectors including Arizona,
California, Florida, Michigan, Virginia, and Washington. These larger states have higher concentrations of manufacturing
activity in high-tech subsectors such as transportation equipment, computers and electronics, machinery, and electrical equipment.
Use of Natural Gas for Electric Energy Generation
The amount of NG being used as a fuel to generate electricity has been gradually increasing in recent years due in part to
the decreasing price and increased supply of NG. Electric utilities have been increasingly turning to NG as a fuel source,
especially for new electric-generating plants, such as combustion turbines and combined-cycle plants. The primary benefit
to the manufacturing sector is that the increasing use of low-cost NG as a fuel will result in lower generation cost for
electric power. Between 2007 and 2014, the amount of NG used in the generation of electricity rose at a CAGR of 2.6%,
increasing by 19.4%. Over that same period, the total amount of energy used by electric power from all sources (e.g., fossil
fuels, nuclear, renewables, and imports) fell by 4.4% at a CAGR of -0.6%. The significance of shifting electric power
sources to this study is that the rising demand for the use of NG as a fuel in electric power generation will contribute to
investment in new NG infrastructure, such as transmission lines, gas processing plants, and compressor stations.

IHS Economics | The Economic Benefits of Natural Gas Pipeline Development on the Manufacturing Sector
© 2016 IHS 33 May 2016
Forward Linkages
The outputs from the NG–intensive sectors are used as inputs by other sectors of the economy in a variety of ways. These
uses will be referred to as forward linkages and include:
Intermediate inputs (e.g., goods and services sold to other sectors that are used in production processes to make other
types of good and services, with no sales to final demand occurs).
Sales to final demand (e.g., goods and services that are not used as intermediate inputs and no further processing of
the output occur).
Types of final demand include:
Personal consumption expenditures (e.g., purchases of refined products such as gasoline at filling stations or home
heating oil).
Gross private investment.
Private inventory accumulation.
Exports or imports.
Government consumption and gross investment.
The forward linkage, or downstream manufacturing sectors, will potentially benefit from increases in the supply and/or
reductions in the price of NG that occur when the construction of new, or the expansion of existing, NG pipelines occurs.
The existing establishments in the nine NG–intensive sectors in a regional economy could potentially decide to expand,
which would, in turn, increase the supplies of, or reduce the prices of, their outputs that are used as intermediate inputs by
downstream sectors. IHS identified forward linkages in the manufacturing sector by analyzing the detailed input/output
tables for the U.S. economy, and by using the results of other recent energy studies we have performed.
Final demand sectors, such as personal consumption, exports, and imports, are also affected by changes in NG production
and pricing, but indirectly, through industry production changes captured by intermediate inputs shifts to industry
production. For example, personal consumption impacts, such as those resulting from lower electricity prices, are captured
first by the feedstock inputs to the electricity industry and flow-through to all industries before resulting in lower prices for
the consumer. U.S. industries’ substitution of domestic NG over higher-cost NG imports or higher-priced NG–derived
goods from abroad (such as manufactured chemicals) flow-through intermediate inputs, either adjusting production
processes toward less-expensive items or as increases in value-add or outputs. We, therefore, focus on the intermediate
inputs in this section, but describe indirect final demand results in our macroeconomic analysis later on.
The accompanying table shows the percentage distribution of output sold as an intermediate input by a NG–intensive
sector (i.e., the columns). The purchasing manufacturing subsectors are shown at the 3-digit NAICS code level. For
example, 25.1% of the total output sold as an intermediate input by the primary metals sector was purchased by fabricate
metals, while 11.7% went to machinery. The intermediate inputs used by industries varies widely across the nine NG–
intensive sectors, ranging from lows of 13.7% in the petroleum and coal sector (i.e., a high share of refined products are
sold to non-manufacturing sectors such as utilities, transportation, and construction) up to 70.3% in chemicals and 94.6%
for primary metals (most primary metal is then fabricated to make other products). Natural gas–intensive sectors with high
shares of their output sold as an intermediate input to other manufacturing sectors are those that are potentially more likely
to generate increased downstream economic development within a regional economy if their production increases, and
prices fall, due to the completion of a new NG pipeline.

IHS Economics | The Economic Benefits of Natural Gas Pipeline Development on the Manufacturing Sector
© 2016 IHS 34 May 2016
Macroeconomic Impacts of Lower Natural Gas Prices
IHS estimated the macroeconomic impacts of lower NG prices on the U.S. economy, with a specific focus on the effects on
the manufacturing sector. The wholesale and retail prices of NG in the United States have remained low, and even
declined, in recent years due to the rapid increase in production from shale formations, such as the Marcellus play in
western Pennsylvania and the Eagle Ford play in Texas.
In addition to the direct, indirect, and induced economic contributions of investing in and operation of new NG pipelines
built to carry the increased supplies to the market, the surge in domestic production, due in large part to the increased
supplies from shale gas production, has led to NG and, subsequently, electricity prices that are significantly lower than they
otherwise would have been. The result has been low and stable NG prices that have had a positive macroeconomic impact
across all sectors of the economy, as costs of intermediate inputs have been lowered. We find this effect has been
especially positive in the NG–intensive sectors identified above and in other manufacturing subsectors that use large amounts of electricity.
In this section, IHS estimates the economic effects of lower prices for NG using the IHS U.S. Macroeconomic Model.
NAICs
Code Description
311-
Food
313-
Textile
Mills
321-Wood
Products
322-
Paper
324-
Petroleum
and Coal
325-
Chemicals
327- Non
Metallic
Minerals
331-
Primary
Metals
332-
Fabricated
Metals
311 Food 44.0% 0.2% 0.1% 11.3% 0.6% 0.8% 0.8% 0.0% 2.3%
312 Beverage and Tobacco Product 4.0% 0.1% 0.2% 2.3% 0.1% 0.2% 2.8% 1.4% 1.6%
313 Textile Mills 0.0% 10.9% 0.0% 0.2% 0.0% 1.6% 0.1% 0.0% 0.1%
314 Textile Product Mills 0.0% 14.6% 0.1% 0.1% 0.0% 1.0% 0.0% 0.1% 0.1%
315 Apparel 0.0% 7.6% 0.0% 0.0% 0.0% 0.0% 0.0% 0.0% 0.0%
316 Leather and Allied Product 0.3% 0.6% 0.0% 0.0% 0.0% 0.1% 0.0% 0.0% 0.0%
321 Wood Product 0.0% 1.6% 20.0% 0.4% 0.2% 0.5% 1.0% 0.1% 1.0%
322 Paper 0.2% 5.1% 3.6% 26.2% 0.5% 1.9% 0.2% 0.1% 1.2%
323 Printing and Related Support Activities 0.3% 1.1% 0.0% 7.6% 0.5% 1.1% 0.0% 0.0% 0.5%
324 Petroleum and Coal Products 0.1% 0.1% 0.0% 0.2% 4.4% 1.8% 0.8% 0.1% 0.2%
325 Chemical 1.4% 0.0% 0.3% 3.9% 4.7% 40.9% 1.1% 0.1% 2.7%
326 Plastics and Rubber Products 0.0% 5.2% 1.3% 3.1% 0.3% 11.4% 1.2% 0.6% 2.0%
327 Nonmetallic Mineral Product 0.0% 0.8% 0.4% 1.2% 0.3% 0.9% 12.7% 0.4% 1.0%
331 Primary Metal 0.0% 0.0% 0.3% 1.0% 0.4% 0.4% 1.9% 24.7% 1.6%
332 Fabricated Metal Product 0.0% 0.0% 0.2% 1.5% 0.2% 1.5% 1.0% 25.1% 11.8%
333 Machinery 0.0% 2.0% 0.8% 1.5% 0.4% 0.9% 1.6% 11.5% 8.9%
334 Computer and Electronic Product 0.0% 0.1% 0.7% 1.2% 0.1% 1.3% 0.8% 3.4% 4.1%
335 Electrical Equip.& Appliances 0.0% 0.0% 0.3% 0.9% 0.3% 0.7% 1.2% 6.5% 2.9%
336 Transportation Equipment 0.0% 7.9% 2.9% 2.1% 0.2% 1.7% 4.5% 16.3% 13.6%
337 Furniture and Related Product 0.0% 7.8% 7.4% 0.9% 0.1% 0.4% 0.3% 1.3% 1.1%
339 Miscellaneous 0.0% 5.2% 1.0% 1.4% 0.1% 1.2% 0.5% 2.6% 1.4%
Total share to manufacturing 50.4% 70.8% 39.7% 67.3% 13.7% 70.1% 32.5% 94.4% 58.2%
Construction, NR, & Mining 8.7% 4.4% 41.7% 2.2% 17.8% 7.2% 52.8% 2.2% 24.8%
Trade, Transportation & Utilities 0.3% 9.0% 4.3% 5.2% 33.5% 1.1% 1.0% 0.6% 3.3%
Information 0.0% 0.4% 1.9% 2.8% 0.2% 0.3% 1.3% 0.2% 2.8%
Financial Activities 0.0% 0.4% 3.7% 1.3% 1.3% 1.0% 0.3% 0.9% 0.6%
Professional and Business Services 0.2% 1.0% 1.1% 4.2% 2.1% 3.4% 3.5% 1.0% 3.0%
Education and Health Care Services 7.2% 3.7% 0.9% 4.5% 1.5% 10.0% 2.5% 0.2% 0.6%
Leisure & Hospitality Services 22.6% 3.4% 3.2% 3.8% 1.5% 0.4% 3.3% 0.2% 2.4%
Other Services 0.2% 1.7% 0.2% 0.5% 0.6% 0.8% 0.8% 0.1% 1.0%
Government 10.3% 5.2% 3.4% 8.1% 27.7% 5.8% 2.1% 0.3% 3.2%
Total share to non-Mfg. uses 49.6% 29.2% 60.3% 32.7% 86.3% 29.9% 67.5% 5.6% 41.8%
Source: Bureau of Economic Analysis, 2015, 2007 Benchmark Input-Output coeff icients After Redefinitions
Use of output from the natural gas intensive sectors as an intermediate input by other sectors
Manufacturing Sectors
Non-Manufacturing Sectors
Note: The f igures show the percent of the total output, commodity basis, produced by the natural gas intensive sectors (top of each column) that are purchased by the row industry as in
intermediate input. For example, 11.4% of the output of chemicals sector (colum 8) is sold to the plastics and rubber sector as an intermediate input (row 15).

IHS Economics | The Economic Benefits of Natural Gas Pipeline Development on the Manufacturing Sector
© 2016 IHS 35 May 2016
The supply of NG at the wellhead in the United States has grown substantially in recent years, from 48.2 Bcfd in 2005 to
an estimated 74.3 Bcfd in 2015, an average annual growth rate of 4.4%. The significant increase in production volumes has
contributed to a sharp drop in prices, with the average annual Henry Hub price, in nominal dollars, falling from
$8.80/MMBtu in 2005 to an estimated $2.60/MMBtu in 2015, a decline of 238.2%. According to IHS’s December 2015
Monthly Gas Briefing Outlook, NG prices are expected to decline slightly in 2016 to $2.51/MMBtu before rising steadily thereafter, reaching $3.36/MMBTU by 2020.
To capture the macroeconomic contributions of NG pricing decreases, we compared the price of NG to the prices of
alternative competing energy sources and feedstock. We performed an update to a previous counterfactual analysis
performed by IHS in 2011 for America’s Natural Gas Alliance (ANGA). Consistent with the previous study, we also
considered the long-term expectation of future lower NG prices, where manufacturers and other industries will transition
production processes to incorporate additional use of NG as a fuel and/or feedstock. Until recently, repeated and persistent
historical price volatility of domestic NG resources had resulted in import dependency from Middle Eastern and Asian
resources, particularly for the chemical manufacturing industry. We incorporated the declining reliance of the U.S.
economy on NG imports that will result from the decrease of
pricing and increased availability of domestic NG sources.
The IHS macroeconomic forecast is updated monthly and has
already incorporated the short- and longer-term effects of NG
price and availability on the U.S. and global economy. As a
result of this methodological restraint, and to be consistent
with the 2011 IHS study, we performed a counterfactual
analysis that we refer to as the Constrained Shale Gas Case.
We started the scenario runs in 2012, reducing U.S. NG
production growth rates to historical trends and increased NG
prices to global LNG prices, specifically following European
oil-linked prices. Reduced domestic NG availability would be
met, in the short term, with a return to historical trends of
higher-level imports of NG resources to meet the growing
domestic demand for NG as a feedstock and fuel source (and
the indirect use of NG for electricity production). The
counterfactual impacts were evaluated for short-term and
long-term price effects alone, without consideration of capital investment shifts.
Results
The short-term impacts of today’s NG prices, as
opposed to constrained shale gas case with European
oil-linked prices, are increases to GDP, employment,
and disposable income (across all consumers). GDP
increased to a peak of 1.3 percent in 2014 and
maintained a 1.2 percent increase into 2015. The
employment contribution was 1.2 million in 2014 and
1.4 million in 2015. The long-term impacts through
2025 represent a shift toward equilibrium, with the
scenario differences decreasing with time, in terms of
pricing and GDP. The short-term boost in domestic
manufacturing competitiveness results in a 2 percent
increase in U.S. manufacturing capacity utilization,
which is sustained at 1 percent higher than the
constrained shale case from 2020 through 2025. The
U.S. economy also enjoys reductions in inflation and
unemployment. Overall, North American NG prices
have increased in stability, which contributes to long-term investment planning.

IHS Economics | The Economic Benefits of Natural Gas Pipeline Development on the Manufacturing Sector
© 2016 IHS 36 May 2016
Declining NG prices directly reduce electricity prices, as 30 percent of total NG consumption goes to electricity. The
model impacts found that retail electricity prices dropped 11 percent in 2013, and the declines in retail electricity prices are expected to persist through 2025.
“Lower gas and electricity prices serve to directly reduce the energy costs of households and businesses. Going forward,
consumers have greater purchasing power and higher confidence, businesses experience higher profits, and domestic
manufacturers are more cost-competitive relative to their international competitors as a result of lower NG prices.”36
Reduction in NG and electricity prices result in an increase in real personal consumption expenditures in the short-term
period of 2013 to 2016, peaking in 2014, with an increase in personal consumption expenditures of consumer durables of
3.1 percent. Investment also increases in the short term, with investment growing an average of 2.7 percent between 2013
and 2015, but increases return to equilibrium after 2015. Both exports and imports, overall, receive a modest increase with
the reduction of NG pricing, with increases ending by 2016. Imports grow at an average rate of 1.4 percent between 2013
and 2016, faster than exports, which grow at a rate of 0.3 percent in the same time period. The increase in imports is mostly associated with an increase in consumption spending.
The benefits of higher NG supply to the economy,
which lowers and stabilizes energy prices and electricity
prices in particular, can be summarized by the three
main macroeconomic aggregates that impact
households: real GDP, employment, and real disposable
income. The gains in in 2015 alone are significant. IHS
estimates that, as a result of the increase in domestic
shale gas production, real GDP (goods and services) is
$190 billion greater and there are 1.4 million more jobs,
contributing up to $156 billion more dollars of real
disposable income in 2015. Over the five-year period of
2013 to 2018, IHS forecasts, on average, $101 billion
more dollars in real GDP each year. This is produced
with an average 730,000 more jobs in the economy each
year contributing to $87 billion more dollars in real disposable income per year.
Impact on Key Manufacturing Sectors
In addition to the demand generated by energy-intensive
sectors and the indirect and induced impacts on
manufacturing, lower gas prices, from higher gas
supply, that help to lower energy costs also increases
employment and productivity, which results in a
corresponding increase in personal income. From 2013
to 2015, personal income averaged 1.4% higher and
households also spent less on electricity, which had the
combined effect of greater spending on consumable
goods and services. The overall impact on
manufacturers across a broad swath of industries is positive.
As expected, the increase in production due to lower NG
prices is significantly greater in the non-durable sectors
than in the durable sectors. The benefits from the
reduction in electricity prices are more evenly
36 “The Economic and Employment Contribution of Shale Gas in the United States,” IHS 2011. Prepared for America’s Natural Gas Alliance.

IHS Economics | The Economic Benefits of Natural Gas Pipeline Development on the Manufacturing Sector
© 2016 IHS 37 May 2016
distributed across the manufacturing sector. In 2010, the durable and non-durable sectors accounted for 44% and 56%
respectively of the total electricity used by the manufacturing sector. The intensity of electricity use in non-durable sector was 41.8% greater than in the durable sector.
The reason for the difference in the use-intensity of
electricity is that several of durable sectors use
relatively little electricity in their production processes
while generating high levels of output. The impact in
the short term is greater than over the longer term due
to the natural adjustments that occur in a dynamic
economy. As industries adjust to the new reality (in
the counterfactual case, higher gas prices), all other
prices begin to adjust so that the relative price
differentials reach equilibrium. As this occurs, the
initial production gains begin to level out and return to
their normal path of growth.
A closer look at the distribution of the percent
increases in production by subsector shows that the
NG intensive–sectors rank high on the list shown in
the accompanying chart. Five of the NG intensive
sectors—primary metals, paper, fabricated metals, chemicals, and non-metallic minerals—rank in the top 10. By contrast,
the percent production increases in the food and petroleum and coal products sectors are much lower. Similar patterns can be seen in the employment contribution.

IHS Economics | The Economic Benefits of Natural Gas Pipeline Development on the Manufacturing Sector
© 2016 IHS 38 May 2016
CHAPTER FIVE: ECONOMIC EFFECTS OF NATURAL GAS PIPELINE
CONSTRUCTION AND OPERATION
The purpose of this section is to assess the economic impact of the construction and operation and maintenance (O&M) of
NG pipelines on the U.S. economy, with a detailed analysis of the impacts on the manufacturing sector. The focus of this
section is on NG transmission lines. We first summarize unit costs for the construction and operation of NG transmission lines.
Natural Gas Pipeline Costs
As described in earlier sections of this report, there are three types of NG pipelines: gathering, transmission, and
distribution. We performed a two-part analysis: first, we estimated the economic impact from the construction and
operation of transmission pipelines forecast to be commissioned and begin operations in 2015, and second, we derived the
economic contribution of transmission pipelines operating prior to 2015. To estimate the economic impact from the
construction and operation of the proposed 2015 transmission pipelines, we determined their unit construction costs, in
dollars per mile, for two typical diameters. Based on our proprietary data, IHS estimated unit capital and O&M costs for
the two sizes of transmission pipelines as presented below; the O&M costs apply to only newly constructed pipelines during their first few years of operation.
12” diameter: Capital costs of $1,942,000/mile with corresponding annual O&M costs of $86,000/mile.
20” diameter line: Capital costs of $3,591,000/mile with corresponding annual O&M costs of $116,000/mile.
To estimate the economic impacts of operating and maintaining the existing NG transmission pipeline system, additional
research was required. The NG transmission system in 2014 consisted of about 297,800 miles of on-shore pipeline,
including active, inactive, and abandoned pipelines. IHS combined our proprietary data with an analysis by IHS Energy of
the FERC37 Form 2 and 2a company-level data to estimate an average annual O&M expenditure of about $32,900 per
existing transmission pipeline mile.
Because costs vary widely by project, and due to the difficulty of tracking and obtaining accurate data for many local
projects, we did not estimate the economic impacts of constructing and operating NG gathering or distribution lines in the
United States While IHS continually collects data on proposed NG transmission lines, we do not track proposed gathering
or distribution line projects. We note that the primary impacts on the manufacturing sector occur during the construction
phase, especially for transmission lines with their larger sizes and higher unit costs, because of the need for manufacturing
products such as steel, pumps and compressors, and equipment.
U.S. Economic Impacts of Natural Gas Transmission Line Construction
IHS estimates that approximately $25.8 billion was spent in the United States in 2015 to construct the proposed 6,028
miles of new NG transmission pipelines. IHS continually monitors the status of major NG transmission pipeline projects
across the country because of their importance to the NG pipeline system, so this expenditure figure is based on actual
data. Approximately 92% of the spending was for transmission pipelines with a diameter of at least 30 inches. The
accompanying table shows that the construction spending generated a temporary increase in employment of 348,789 jobs,
including 59,874 in the manufacturing sector. Similarly, the proposed spending is expected to contribute $34 billion to total
U.S. GDP, with 23.2% of that increase flowing to the manufacturing sector. The contribution to labor income was $21.9
billion in 2015, with 21.5% occurring in the manufacturing sector. The share of the total U.S. economic impacts occurring
in the manufacturing sector is lowest for employment because of the sector’s high level of worker productivity (i.e., high
values of output and GDP per worker) and its above-average wage levels.
37 Federal Energy Regulatory Commission, 2015, Form 2/2A Major and Non-Major Natural Gas Pipeline Annual Report
http://www.ferc.gov/docs-fling/forms/form-2/data.asp

IHS Economics | The Economic Benefits of Natural Gas Pipeline Development on the Manufacturing Sector
© 2016 IHS 39 May 2016
The accompanying table shows that for every mile of
NG transmission line pipeline built, a total of 57.9 jobs
would be created in the United States, including 9.9
manufacturing jobs per mile. The total U.S. economic
impacts presented in the table are the sum of the direct
spending, and the indirect and induced multiplier
effects.
A major of objective of this study is to measure how
the construction of new NG transmission pipelines
affects the manufacturing sector. The share of
economic benefits flowing to the manufacturing sector
for the 30-inch diameter pipeline is higher than the
share for the 12-inch diameter pipeline because
expensive capital goods and equipment, such as steel
pipe and pumps, comprise a higher share of the unit
cost for the 30-inch diameter line.
IHS estimated the total U.S. economic impacts within
manufacturing. Appendix A presents the U.S. impacts
for each of the 86 4-digit NAICS codes within the
manufacturing sectors. While the appendix shows that
all of the manufacturing subsectors will benefit to
some extent, between 71% and 75% of the economic
impacts, depending on the unit of measurement
considered (e.g. jobs, labor income, output, and value-added), will occur in the following 14 subsectors:
3241 Petroleum & Coal
3251 Basic Chemicals
3255 Paint, Coating, & Adhesives
3261 Plastics
3273 Cement & Concrete
3311 Iron & Steel Mills
3312 Steel Product Mfg. From Purchases
3315 Foundries
3323 Architectural & Structural Metals
3327 Machine Shops
3329 Other Fabricated Metal Products
3331 Agriculture, Construction, & Mining Machinery
3339 Other Machinery
3344 Semiconductor & Computers
Manufacturing Employment Impacts by State
The increase in manufacturing employment (59,874 direct jobs) from building NG transmission lines in 2015 was
disaggregated by 3-digit NAICS manufacturing subsector within each state. The first step in this analysis was to determine
where direct pipeline spending would occur in 2015 by state. IHS distributed the $25.8 billion of direct spending as follows:
30% for specialized capital goods and equipment such as steel pipe, compressors, and off-highway machinery was
allocated to those states where potential suppliers are located. IHS industry experts identified the states most likely
to receive the direct spending. For example, IHS steel industry experts identified producers in 16 states with mills
capable of producing the type of steel pipe required for NG transmission lines.
Impact Measure
Total Change
in Economic
Activity
% in the
Mfg.
Sector
Impact
per Mile
Employment (# of jobs) 348,789 17.2% 57.9
Direct 112,760 27.5% 18.7
Indirect 104,336 20.8% 17.3
Induced 131,693 5.8% 21.8
Labor Income (Millions of US$) 21,855.3$ 21.5% 3.63$
Direct 7,845.1$ 32.2% 1.30$
Indirect 7,253.5$ 23.6% 1.20$
Induced 6,756.7$ 6.8% 1.12$
Output (Millions of US$) 32,267.9$ 37.5% 5.35$
Direct 11,602.4$ 44.5% 1.92$
Indirect 10,990.3$ 46.1% 1.82$
Induced 9,675.1$ 18.3% 1.61$
Contribution to GDP (Millions of US$) 33,979.7$ 23.2% 5.64$
Direct 10,164.8$ 37.6% 1.69$
Indirect 11,736.1$ 26.2% 1.95$
Induced 12,078.9$ 8.2% 2.00$
US Economic Impacts of Construction Spending for New
Natural Gas Transmission Lines in 2015
Note: The figures above include only the construction of 2015 proposed transmission
lines. Additional economic impacts from the construction of gathering and distribution
lines are. IHS does not track gathering or distribution line projects.

IHS Economics | The Economic Benefits of Natural Gas Pipeline Development on the Manufacturing Sector
© 2016 IHS 40 May 2016
70% for items such as construction materials and labor compensation was allocated primarily within states and local
economies where pipeline would be built. The distribution was based on shares of project pipeline mileage in each
state.
Based on the location of companies capable of providing necessary components such as pipeline steel, we identified 21
states where direct spending on specialized capital goods would occur. The direct spending total in each state was then
allocated by economic sector and entered into the appropriate Impact Analysis for Planning (IMPLAN) sector based on the
unit pipeline construction cost figures developed for this study.
Appendix B presents the distribution of the U.S. increase in manufacturing jobs by state by 3-digit NAICS manufacturing
subsector. As expected, the employment effects largely track with the distribution of direct spending by state, although
every state benefits to some extent through the indirect and induced multiplier effects of capital and operating
expenditures. The following 10 states combined, listed in descending order of their employment increases, will receive
about 74% of the total increase in manufacturing employment: Texas, California, Louisiana, Ohio, Wyoming, Oklahoma,
Colorado, Indiana, Illinois, and Pennsylvania. Employment increases are also concentrated in the durable manufacturing
sectors because of the composition of the direct spending; nationally, 86% of the employment increase is in the durable
goods sectors (e.g., wood, non-metallic minerals, primary and fabricated metals, machinery, electrical equipment, computers, transportation equipment, furniture, and miscellaneous).
U.S. Economic Impacts of Natural Gas Transmission Pipeline Operation and
Maintenance
IHS estimated the economic contribution of existing NG
transmission lines O&M using an average per mile
expenditure of $32,900 for the 297,800 miles of
transmission pipeline. IHS estimates that the total U.S.
O&M spending for existing NG transmission pipelines was
$9.8 billion in 2015. This spending resulted in nearly
111,800 jobs in 2015. Detailed manufacturing
contributions are located in Appendix C. Natural gas
transmission line O&M spending contributed about $15.4
billion to the U.S. economy in 2015.
The estimates for the annual unit cost of operating and
maintaining newly constructed NG transmission lines were
$86,000 and $116,000/mile for the 12- and 30-inch-
diameter pipes, respectively. These cost assumptions were
applied to the 6,028 miles of new NG transmission lines
that IHS Energy estimates were constructed in 2015, whose first full year of operation is in 2016.
The accompanying table presents the combined impacts on
the US economy of O&M spending for both the 297,800
miles of existing natural gas transmission line, and the
6,028 miles of new pipeline built in 2015. These impacts
would be generated in 2016 (i.e., during the first full year
of operation for new pipelines completed in 2015), but the
impacts are presented in 2015 dollars to be consistent with
the rest of the report. The combined total of almost $10.5
billion in O&M spending will contribute 119,753 jobs and
$16.5 billion in GDP in 2016. On a unit basis, for every $1 billion in direct O&M spending on natural gas transmission
lines, the total increase in US employment would be 11,424 jobs, and $1,575 billion in US GDP. Approximately 4.3% of
the total employment increase would occur in the manufacturing sector while 13.7% of the additional GDP would be in manufacturing.
Impact Measure
Total Change in
Economic Activity
Impact per $1
billion of O&M
spending
Employment (# of jobs) 119,754 11,423.6
Direct 22,914 2,185.8
Indirect 27,369 2,610.8
Induced 69,472 6,627.1
Labor Income (Million US$) 11,814.8$ 1,127.0$
Direct 6,362.2$ 606.9$
Indirect 1,830.5$ 174.6$
Induced 3,622.1$ 345.5$
Output (Million of US$) 27,143.1$ 2,589.2$
Direct 10,305.8$ 983.1$
Indirect 5,768.7$ 550.3$
Induced 11,068.6$ 1,055.9$
Contribution to GDP (Million US$) 16,510.4$ 1,575.0$
Direct 6,950.9$ 663.1$
Indirect 3,091.0$ 294.9$
Induced 6,468.5$ 617.0$
US Economic Impacts of Projected O&M Spending for
Natural Gas Transmission Lines in 2016
Note: The above impacts are the combined O&M expenditures for the 303,828 miles
of NG transmission lines operating in 2016, w hich includes the 6,028 miles of new
pipeline constructed in 2015 w hose first full year of operation is 2016, and 297,800
miles of existing pipeline. While the spending occurs in 2016, impacts are presented
in current 2015$

IHS Economics | The Economic Benefits of Natural Gas Pipeline Development on the Manufacturing Sector
© 2016 IHS 41 May 2016
Annual O&M spending generates permanent increases in state and local economic activity, such as employment and value
added, as the NG pipeline system has to be continually operated and maintained. At the state and local levels, the economic
multiplier effects of O&M spending are usually comparable to or slightly higher than during construction, as higher shares
of inputs, including labor, maintenance and repair services, and supplies, are purchased locally. Finally, although the per-
mile economic impacts of O&M spending shown in the accompanying table are much lower than for construction, the
spending is distributed across roughly 50 times more pipeline miles. Consequently, annual O&M spending generates more
permanent benefits overall.
Projections for Continued Growth in Pipeline Spending
United States on-shore NG production rose 30.6% between 2007 and 2013 according to EIA.38 EIA estimates total annual
U.S. NG withdrawals in 2014 of 31.346 trillion cubic feet (Tcf). In 2013, on-shore NG production was 93.7% of total U.S.
production; if this share holds in 2014, total on-shore gross withdrawals would be 29.4 Tcf. On-shore production, as a
share of total U.S. NG production, has been steadily rising in recent years; as recently as 2007, it was 85.9%. Similarly, the
EIA estimates U.S. crude oil production has risen from 5.1 million barrels per day in 2007 to 8.7 million barrels per day in
2014, approaching the peak level of domestic oil production of just under 9.0 million barrels per day in 1985.
U.S. pipeline capital spending grew significantly over this same six-year period to support U.S. upstream oil and NG
activity and production plans. U.S. oil and NG transmission pipeline project spending increased from approximately $10.1
billion in 2010 to almost $37.4 billion in 2015. Average annual U.S. onshore pipeline capital spending over this period was
approximately $20.5 billion, with $14 billion spent on expanding NG transmission lines and the balance spent on crude oil
pipelines. Pipeline project spending was underpinned by the upstream production plans established in prior periods. While
the rate of capacity additions could slow over the short term, additions are needed over the medium to long term to meet IHS’s view of supply and demand fundamentals.
38 EIA, November 2015, Natural Gas Gross Withdrawals. http://www.eia.gov/dnav/ng/ng_prod_sum_a_EPG0_FGW_mmcf_a.htm.

IHS Economics | The Economic Benefits of Natural Gas Pipeline Development on the Manufacturing Sector
© 2016 IHS 42 May 2016
Appendix A: U.S. Economic Contributions of Constructing Natural Gas Transmission
Lines in 2015 by Manufacturing Subsector
NAICS Code and Description
Employment
(Number of
jobs)
Labor Income
(Millions of
US$)
Output
(Millions of
US$)
Contribution to
GDP (Millions of
US$)
3111 Animal Food Manufacturing 61 4.7 86.7 13.4
3112 Grain & Oilseed Manufacturing 62 5.7 126.7 15.8
3113 Sugar & Products Manufacturing 75 5.0 42.1 8.9
3114 Fruit & Vegetable Preserving 192 11.5 87.0 18.2
3115 Dairy Product Manufacturing 150 10.9 158.2 20.8
3116 Animal Slaughtering & Processing 509 23.3 203.9 27.5
3117 Seafood Product Preparation 45 2.5 17.4 2.8
3118 Bakeries & Tortilla Manufacturing 323 16.0 80.4 22.9
3119 Other Food Manufacturing 190 14.2 151.7 46.6
3121 Beverage Manufacturing 221 19.5 181.1 50.4
3122 Tobacco Manufacturing 15 2.2 46.6 31.3
3131 Fiber, Yarn, & Thread Mills 26 1.1 9.2 1.6
3132 Fabric Mills 47 2.6 15.7 3.8
3133 Textile & Fabric Mills 42 2.3 12.0 2.9
3141 Textile Furnishings Mills 64 3.1 17.0 4.3
3149 Other Textile Product Mills 98 4.3 15.7 5.2
3151 Apparel Knitting Mills 19 0.6 2.3 0.8
3152 Cut & Sew Apparel Manufacturing 186 7.7 24.8 9.2
3159 Accessories & Other Apparel Mfg. 12 0.5 1.9 0.6
3161 Leather & Hide Finishing 2 0.1 1.2 0.2
3162 Footwear Manufacturing 14 0.6 2.3 0.8
3169 Other Leather Products 12 0.5 2.1 0.7
3211 Sawmills & Wood Preservation 346 18.1 93.9 21.4
3212 Plywood & Engineered Wood Mfg. 245 13.0 58.2 20.0
3219 Other Wood Manufacturing 672 32.1 117.0 38.1
3221 Pulp, Paper & Paperboard Mills 159 17.9 139.2 38.6
3222 Converted Paper Products 481 38.8 218.9 57.0
3231 Support Activities - Printing 727 39.8 123.4 44.9
3241 Petroleum & Coal Prod. Mfg. 392 93.8 2,105.3 634.4
3251 Basic Chemical Mfg. 350 49.9 1,000.9 137.8
3252 Resin, Rubber, & Fiber Mfg. 173 22.8 266.9 37.9
3253 Agricultural Chemical Mfg. 57 6.8 96.1 14.9
3254 Pharmaceutical & Medicine Mfg. 251 44.3 350.3 116.3
3255 Paint, Coating, & Adhesive Mfg. 1,615 172.8 1,264.0 263.2
3256 Soap, Cleaning, & Toiletry Mfg. 108 10.9 129.9 41.5
3259 Other Chemical Product Mfg. 137 14.0 89.1 20.2
3261 Plastic Product Mfg. 1,280 84.1 447.9 144.1
3262 Rubber Product Mfg. 320 22.8 121.1 40.4
3271 Clay Product & Refractory Mfg. 141 9.2 28.7 11.6
3272 Glass & Glass Product 104 7.3 31.2 10.9
3273 Cement & Concrete Products 1,289 83.7 352.6 114.4
3274 Lime & Gypsum Products 69 5.5 33.9 9.9
3279 Other Nonmetallic Mineral Products 337 22.5 120.7 42.4
Economic Contributions by 4-digit NAICs Mfg. Sector from Constructing Natural Gas
Transmission Lines in the US in 2015
<continues next page>

IHS Economics | The Economic Benefits of Natural Gas Pipeline Development on the Manufacturing Sector
© 2016 IHS 43 May 2016
NAICS Code and Description
Employment
(Number of
jobs)
Labor Income
(Millions of
US$)
Output
(Millions of
US$)
Contribution to
GDP (Millions of
US$)
3311 Iron & Steel Mills 1,085 115.8 1,370.7 187.4
3312 Steel Product Mfg. From Purchases 662 54.8 518.9 71.1
3313 Alumina & Aluminum Production 168 14.0 130.3 17.7
3314 Other Nonferrous Metal Production 264 22.1 339.4 36.1
3315 Foundries 1,093 78.4 313.4 92.1
3321 Forging & Stamping 599 47.8 263.6 68.4
3322 Cutlery & Handtool Mfg. 100 7.7 27.5 11.7
3323 Architectural & Structural Mfg. 2,115 139.3 564.8 185.7
3324 Boiler, Tank & Container Mfg. 402 31.1 182.8 49.9
3325 Hardware Manufacturing 36 2.7 12.0 4.4
3326 Spring & Wire Product Mfg. 221 14.0 57.6 21.6
3327 Machine Shops Mfg. 2,004 134.0 374.9 166.8
3328 Coating, Engraving, & Heat Metals 780 47.1 192.5 69.7
3329 Other Fabricated Metal Products 28,771 2,138.2 8,087.7 2,952.9
3331 Ag., Construction, & Mining Machinery 1,869 192.9 1,957.6 530.4
3332 Industrial Machinery Mfg. 60 5.1 24.8 8.7
3333 Commercial & Service Industrial Machinery 130 10.6 60.9 21.6
3334 HVAC & Commercial Refrig. Equipment 236 16.0 69.0 25.0
3335 Metalworking Machinery 225 16.5 45.5 21.7
3336 Turbine & Power Transmission Equip. 239 23.0 193.6 49.5
3339 Other Machinery Mfg. 3,533 322.9 1,644.0 570.8
3341 Computer & Peripheral Eq. Mfg. 77 14.0 89.9 27.4
3342 Communications Eq. Mfg. 116 13.2 56.9 20.0
3343 Audio & Video Eq. Mfg. 14 1.5 8.0 2.0
3344 Semiconductor & Comp. Mfg. 570 62.8 446.1 200.3
3345 Electronic Instrument Mfg. 122 12.0 47.4 18.4
3346 Magnetic Media Mfg. 20 2.6 10.6 3.8
3351 Electric Lighting Eq. Mfg. 156 13.4 57.2 18.8
3352 Household Appliance Mfg. 61 4.9 33.2 8.5
3353 Electrical Equipment 398 36.7 166.6 55.3
3359 Other Electrical Eq. & Comp. Mfg. 258 22.5 114.5 35.8
3361 Motor Vehicle Mfg. 88 9.6 167.5 14.5
3362 Motor Vehicle Body & Trailer Mfg. 100 6.2 31.7 6.2
3363 Motor Vehicle Parts Mfg. 552 41.5 291.7 42.7
3364 Aerospace Product & Parts Mfg. 33 3.8 15.3 4.2
3365 Railroad Rolling Mfg. 32 2.9 18.4 3.4
3366 Ship & Boat Building 30 1.9 8.3 2.1
3369 Other Transportation Eq. Mfg. 25 2.0 18.5 3.1
3371 Household & Institutional Furniture Mfg. 289 13.9 50.4 20.0
3372 Office Furniture & Fixtures Mfg. 33 1.8 8.6 3.3
3379 Other Furniture Related Mfg. 39 2.1 11.4 4.0
3391 Medical Eq. & Supplies Mfg. 232 19.5 61.2 38.6
3399 Other Misc. Mfg. 417 29.5 96.3 48.8
Total in Manufacturing 59,874 4,701.3 26,716.1 7,893.0
Note: The f igures above are based on an IHS estimate of $25.8 billion in spending to construct 6,028 miles of new , on-shore natural
gas transmission lines in the US during 2015. Right-of-w ay acquisition costs are not included.
Economic Contributions by 4-digit NAICs Mfg. Sector from Constructing Natural Gas
Transmission Lines in the US in 2015

IHS Economics | The Economic Benefits of Natural Gas Pipeline Development on the Manufacturing Sector
© 2016 IHS 44 May 2016
Appendix B: Employment Contribution of Constructing Natural Gas Transmission Lines
in 2015 by State and Manufacturing Subsector
State 311 Food
312
Beverage
&
Tobacco
313
Textile
Mills
314
Textile
Product
Mills
315
Apparel 316 Leather
321 Wood
Products
322
Paper
323
Printing
324
Petroleum
& Coal
325
Chemicals
AK 16 1 0 0 0 0 1 0 1 20 0
AL 0 0 0 0 0 0 1 0 0 0 4
AR 82 2 0 2 8 3 26 31 10 9 21
AZ 21 7 1 3 3 0 13 7 13 3 26
CA 49 15 3 5 45 2 10 25 30 8 32
CO 6 2 0 0 1 0 1 4 4 0 1
CT 12 3 1 2 2 0 2 10 13 2 43
DE 19 1 0 0 0 0 1 1 1 6 11
FL 0 0 0 0 0 0 1 0 0 0 4
GA 124 12 27 58 14 0 45 56 33 8 82
HI 12 2 - 0 4 0 1 0 2 5 1
IA 97 3 0 2 5 0 23 14 17 4 44
ID 32 2 0 1 1 0 17 5 3 0 10
IL 31 4 1 4 1 1 20 23 38 13 52
IN 55 14 1 8 5 2 166 27 48 25 364
KS 60 1 0 2 3 0 4 4 19 17 36
KY 51 13 2 2 10 1 25 28 24 9 50
LA 9 3 0 0 1 0 2 6 4 7 4
MA 51 8 5 4 13 2 6 25 28 6 73
MD 1 1 0 0 0 0 2 0 1 1 11
ME 10 4 2 1 2 3 12 16 3 1 9
MI 12 3 1 3 1 0 47 11 18 2 49
MN 91 6 1 4 6 2 30 29 57 21 40
MO 72 13 0 5 16 2 19 23 29 9 79
MS 39 1 1 3 9 0 22 11 4 23 36
MT 5 2 0 1 0 0 8 0 2 8 3
NC 4 0 28 3 2 0 15 5 5 0 12
ND 9 0 0 1 0 0 5 0 2 4 1
NE 66 1 0 1 1 0 4 5 8 0 21
NH 4 2 3 1 1 0 4 6 5 1 10
NJ 0 0 0 0 0 0 0 0 0 0 2
NM 10 2 0 0 1 0 4 2 3 5 9
NV 9 2 0 1 0 0 2 3 7 2 7
NY 11 2 2 3 4 1 16 8 18 1 27
OH 160 39 3 9 9 1 296 71 100 65 1,016
OK 7 3 0 0 1 0 1 2 4 2 1
OR 51 11 0 2 6 1 62 13 15 4 17
PA 38 8 4 6 5 1 179 19 32 21 155
RI 6 1 3 1 0 0 2 4 4 0 13
SC 36 2 20 8 10 0 22 39 12 1 83
SD 16 1 1 1 1 0 5 2 3 0 5
TN 3 1 0 0 1 0 8 1 2 2 18
TX 82 18 2 5 8 2 20 46 47 34 70
UT 31 2 0 2 4 0 6 11 12 11 36
VA 3 1 0 0 0 0 11 1 2 1 19
VT 10 1 0 0 2 0 5 3 3 2 6
WA 74 17 1 4 6 1 37 26 14 23 31
WI 18 1 2 1 0 0 45 18 24 0 12
WV 1 0 0 0 0 0 8 0 1 0 32
WY 0 1 0 0 0 0 0 0 2 1 0
Sector Total 1,608 235 115 162 217 28 1,263 640 727 392 2,691
Employment Increases From Constructing of Natural Gas Transmission Lines in 2015 by State and Mfg. sub-sector
<continues next page>

IHS Economics | The Economic Benefits of Natural Gas Pipeline Development on the Manufacturing Sector
© 2016 IHS 45 May 2016
State
326
Plastics &
Rubber
327 Non
Metallic
Minerals
331
Primary
Metals
332
Fabricated
Metals
333
Machinery
334
Computer
&
Electronics
335
Electrical
Equip. &
Appliances
336
Trans.
Equip.
337
Furniture 339 Misc. State Total
AK 2 0 0 4 0 0 0 0 0 0 46
AL 0 3 0 2 0 0 0 0 0 0 13
AR 23 22 119 153 16 3 16 13 6 8 572
AZ 35 13 56 187 10 52 7 27 10 19 512
CA 56 13 297 4,679 1,041 120 55 18 12 38 6,552
CO 8 2 47 1,339 468 3 2 0 1 5 1,895
CT 18 13 62 292 19 19 26 38 4 17 598
DE 4 4 12 18 1 2 2 1 1 3 88
FL 0 4 0 2 0 0 0 0 0 0 14
GA 94 42 82 272 28 16 37 46 22 24 1,122
HI 6 1 0 4 0 0 0 1 1 2 42
IA 33 23 123 201 55 19 17 16 16 6 720
ID 6 3 10 61 4 20 3 2 3 3 186
IL 72 55 89 338 653 43 83 23 11 30 1,584
IN 108 288 140 354 83 17 43 59 28 33 1,866
KS 33 20 41 159 25 9 9 35 7 6 493
KY 46 33 197 204 26 8 31 57 10 8 835
LA 2 4 55 4,299 1 0 0 1 0 2 4,402
MA 38 26 45 327 23 86 25 12 7 38 848
MD 1 7 0 2 0 0 0 0 0 0 31
ME 7 5 5 56 3 3 0 8 2 3 157
MI 77 44 53 297 82 21 20 78 12 16 847
MN 60 31 129 425 44 69 28 11 17 44 1,143
MO 49 32 124 284 35 15 30 40 12 21 909
MS 28 12 54 94 16 5 17 25 32 6 439
MT 7 1 11 20 2 0 0 1 1 4 77
NC 22 7 12 77 24 12 34 10 5 6 284
ND 8 3 3 28 8 2 1 2 2 2 81
NE 18 11 25 88 13 7 4 8 3 10 294
NH 10 10 36 112 10 22 11 2 2 10 261
NJ 0 1 0 1 0 0 0 0 0 0 7
NM 9 2 6 21 2 10 2 1 1 4 93
NV 26 7 25 55 2 4 2 1 2 14 174
NY 25 25 21 130 48 35 31 11 5 15 439
OH 222 828 125 723 140 33 84 75 32 66 4,096
OK 16 3 76 2,469 396 1 2 5 0 3 2,992
OR 34 13 140 156 17 58 8 11 8 15 642
PA 66 159 115 362 59 26 68 16 16 21 1,378
RI 3 5 31 57 3 5 3 5 2 11 159
SC 48 43 140 265 27 10 35 35 4 12 852
SD 12 3 15 43 9 3 3 4 5 7 138
TN 2 19 0 8 1 0 1 1 1 1 71
TX 117 32 494 12,526 2,572 86 57 41 17 50 16,329
UT 28 10 68 125 10 19 5 11 13 34 438
VA 2 21 0 10 1 0 1 0 1 1 77
VT 9 3 4 24 3 8 3 2 3 3 93
WA 68 18 103 199 22 31 13 95 12 19 813
WI 40 6 72 214 286 15 52 13 10 9 840
WV 1 12 1 4 0 0 0 0 0 1 63
WY 0 0 8 3,256 0 0 1 0 0 1 3,271
Sector Total 1,600 1,941 3,271 35,028 6,291 920 873 861 360 649 59,874
Employment Increases From Constructing of Natural Gas Transmission Lines in 2015 by State and Mfg. sub-sector

IHS Economics | The Economic Benefits of Natural Gas Pipeline Development on the Manufacturing Sector
© 2016 IHS 46 May 2016
Appendix C: U.S. Economic Contribution of Operating & Maintaining Existing Natural
Gas Transmission Pipelines in 2015 by Manufacturing Subsector
NAICS Code and Description Employment
Labor
Income
(Millions of
US$)
Output
(Millions of
US$)
Contribution to
GDP (Millions of
US$)
3111 Animal Food Manufacturing 29 2.3 40.7 6.6
3112 Grain & Oilseed Manufacturing 27 2.5 51.5 7.1
3113 Sugar & Products Manufacturing 36 2.4 20.3 4.4
3114 Fruit & Vegetable Preserving 92 5.6 42.0 8.9
3115 Dairy Product Manufacturing 71 5.3 75.3 10.1
3116 Animal Slaughtering & Processing 243 11.3 96.4 13.4
3117 Seafood Product Preparation 21 1.2 8.2 1.3
3118 Bakeries & Tortilla Manufacturing 155 7.8 38.9 11.2
3119 Other Food Manufacturing 90 6.9 70.1 22.5
3121 Beverage Manufacturing 106 9.6 87.7 24.7
3122 Tobacco Manufacturing 7 1.0 22.7 15.0
3131 Fiber, Yarn, & Thread Mills 9 0.4 3.2 0.6
3132 Fabric Mills 17 0.9 5.4 1.3
3133 Textile & Fabric Mills 15 0.8 4.2 1.1
3141 Textile Furnishings Mills 26 1.3 6.6 1.8
3149 Other Textile Product Mills 48 2.2 7.5 2.6
3151 Apparel Knitting Mills 9 0.3 1.1 0.4
3152 Cut & Sew Apparel Manufacturing 79 3.4 11.2 4.1
3159 Accessories & Other Apparel Mfg. 6 0.2 0.9 0.3
3161 Leather & Hide Finishing 1 0.0 0.4 0.1
3162 Footwear Manufacturing 7 0.3 1.1 0.4
3169 Other Leather Products 5 0.2 1.0 0.3
3211 Sawmills & Wood Preservation 65 3.4 18.5 4.1
3212 Plywood & Engineered Wood Mfg. 37 2.0 9.5 3.1
3219 Other Wood Manufacturing 103 4.9 18.0 5.8
3221 Pulp, Paper & Paperboard Mills 47 5.4 41.5 11.7
3222 Converted Paper Products 132 10.9 62.6 17.1
3231 Support Activities - Printing 276 15.4 46.9 17.4
3241 Petroleum & Coal Prod. Mfg. 141 42.5 1,211.2 305.2
3251 Basic Chemical Mfg. 40 6.0 134.1 18.0
3252 Resin, Rubber, & Fiber Mfg. 26 3.4 38.1 5.5
3253 Agricultural Chemical Mfg. 12 1.5 20.5 3.9
3254 Pharmaceutical & Medicine Mfg. 124 22.2 180.8 58.4
3255 Paint, Coating, & Adhesive Mfg. 27 3.0 21.9 4.5
3256 Soap, Cleaning, & Toiletry Mfg. 50 5.1 59.4 19.1
3259 Other Chemical Product Mfg. 30 3.1 18.5 4.5
3261 Plastic Product Mfg. 272 17.9 92.3 30.6
3262 Rubber Product Mfg. 36 2.7 14.3 4.8
3271 Clay Product & Refractory Mfg. 13 0.8 2.7 1.1
3272 Glass & Glass Product 30 2.2 9.3 3.4
3273 Cement & Concrete Products 79 5.3 22.2 7.2
3274 Lime & Gypsum Products 9 0.7 4.6 1.3
3279 Other Nonmetallic Mineral Products 24 1.6 7.7 2.8
US Economic Impacts of Existing Natural Gas Pipeline Operation & Maintenance Spending in
2015 by 4-digit Mfg. sector
<continues nex page)

IHS Economics | The Economic Benefits of Natural Gas Pipeline Development on the Manufacturing Sector
© 2016 IHS 47 May 2016
NAICS Code and Description Employment
Labor
Income
(Millions of
US$)
Output
(Millions of
US$)
Contribution to
GDP (Millions of
US$)
3311 Iron & Steel Mills 36 3.9 45.8 6.3
3312 Steel Product Mfg. From Purchases 23 2.0 18.8 2.5
3313 Alumina & Aluminum Production 21 1.8 16.4 2.3
3314 Other Nonferrous Metal Production 16 1.4 19.9 2.3
3315 Foundries 34 2.4 9.4 2.8
3321 Forging & Stamping 27 2.0 11.0 3.0
3322 Cutlery & Handtool Mfg. 29 2.2 7.9 3.4
3323 Architectural & Structural Mfg. 352 23.9 97.7 32.2
3324 Boiler, Tank & Container Mfg. 29 2.3 14.3 3.8
3325 Hardware Manufacturing 7 0.6 2.5 0.9
3326 Spring & Wire Product Mfg. 22 1.4 5.7 2.2
3327 Machine Shops Mfg. 171 11.6 31.5 14.3
3328 Coating, Engraving, & Heat Metals 103 6.3 25.3 9.3
3329 Other Fabricated Metal Products 103 8.0 40.4 15.2
3331 Ag., Construction, & Mining Machinery 12 1.1 8.3 2.4
3332 Industrial Machinery Mfg. 8 0.7 3.4 1.2
3333 Commercial & Service Industrial Machinery 3 0.3 1.4 0.5
3334 HVAC & Commercial Refrig. Equipment 218 15.4 58.9 21.9
3335 Metalworking Machinery 19 1.4 4.0 1.9
3336 Turbine & Power Transmission Equip. 10 1.0 7.1 2.1
3339 Other Machinery Mfg. 22 1.9 9.0 3.2
3341 Computer & Peripheral Eq. Mfg. 29 5.5 24.5 10.9
3342 Communications Eq. Mfg. 20 2.4 9.8 3.8
3343 Audio & Video Eq. Mfg. 6 0.6 2.9 0.8
3344 Semiconductor & Comp. Mfg. 63 7.1 43.2 22.7
3345 Electronic Instrument Mfg. 30 3.1 12.1 4.8
3346 Magnetic Media Mfg. 9 1.3 4.9 2.1
3351 Electric Lighting Eq. Mfg. 16 1.4 5.9 2.0
3352 Household Appliance Mfg. 23 1.9 12.4 3.3
3353 Electrical Equipment 30 2.9 12.6 4.4
3359 Other Electrical Eq. & Comp. Mfg. 37 3.2 16.5 5.5
3361 Motor Vehicle Mfg. 38 4.3 75.7 6.5
3362 Motor Vehicle Body & Trailer Mfg. 23 1.5 7.3 1.5
3363 Motor Vehicle Parts Mfg. 123 9.4 64.2 9.6
3364 Aerospace Product & Parts Mfg. 6 0.7 2.9 0.7
3365 Railroad Rolling Mfg. 2 0.2 1.2 0.2
3366 Ship & Boat Building 13 0.8 3.8 0.9
3369 Other Transportation Eq. Mfg. 12 0.9 8.7 1.5
3371 Household & Institutional Furniture Mfg. 118 5.7 19.8 8.1
3372 Office Furniture & Fixtures Mfg. 6 0.3 1.6 0.6
3379 Other Furniture Related Mfg. 18 1.0 5.0 2.0
3391 Medical Eq. & Supplies Mfg. 108 9.1 28.1 18.0
3399 Other Misc. Mfg. 99 7.1 25.9 13.6
Total in Manufacturing 4,769 388.7 3,458.5 924.7
US Economic Impacts of Existing Natural Gas Pipeline Operation & Maintenance Spending in
2015 by 4-digit Mfg. sector