The Dynamics of Global Water Futures: Driving Forces …€¦ · The Dynamics of Global Water...
116
The Dynamics of Global Water Futures: Driving Forces 2011–2050 Report on the Findings of Phase One of the UNESCO‐WWAP Water Scenarios Project to 2050 Catherine E. Cosgrove and William J. Cosgrove for the United Nations World Water Assessment Programme
Transcript of The Dynamics of Global Water Futures: Driving Forces …€¦ · The Dynamics of Global Water...

The Dynamics of Global Water Futures: Driving Forces 2011–2050 Report on the Findings of Phase One of the UNESCO‐WWAP Water Scenarios Project to 2050 Catherine E. Cosgrove and William J. Cosgrove for the United Nations World Water Assessment Programme

Global Drivers of Change 1
© 2011 UNESCO‐WWAP This is a draft report of the United Nations World Water Assessment Programme. Please do not copy or cite the report without the permission of UNESCOWWAP.
Foreword
Climate change and other factors external to water management (such as demography, technology, politics, societal
values, governance and law) are demonstrating accelerating trends or disruptions. Yet in spite of these challenges and
the increasing complexity of dealing with them, we know less and less about water resources and how they are being
used (WWAP, 2009b, figure 13.1). This creates new risks and uncertainties for water managers and for those who
determine the direction of water actions.
The fourth edition of the World Water Development Report, Managing Water under Uncertainty and Risk,
currently in preparation, will bring these issues to the forefront.
Also in response to this challenge, the United Nations World Water Assessment Programme has launched
two parallel initiatives: Indicators and Supporting Monitoring for the UN World Water Development Report, a project
to gather the data for use in indicators to facilitate the task of decision‐makers, and the World Water Scenarios
Project, a set of alternative futures of the world’s water and its use to 2050.
The World Water Scenarios Project was deemed necessary since the last set of global water scenarios dates
to 2000 (Cosgrove and Rijsberman, 2000), and more recent scenarios are sectoral and do not fully incorporate all
important external drivers of change. The approach for developing the new set of scenarios will be an iterative
process of building qualitative scenarios and constructing simulation models, in which a Scenario Focus Group
engages with scenario experts, stakeholders, data experts, modellers and decision‐makers. Contacts will be
maintained throughout the project with other organizations that may be doing scenario work in parallel.
Using Water Wisely: Global Drivers of Change presents a summary of the findings of the first phase of the
scenarios process: an analysis of the evolution of 10 major external forces (‘drivers’) that have direct and indirect
consequences for water managers.
Part One describes the World Water Scenarios Project phases and the approach for the drivers’ analysis. Part
Two highlights some of the key aspects of the current situation in each driver’s domain.
A list of possible future developments in each of the domains was extracted from research and submitted for
discussion and review through expert consultations to validate the degree of importance of the developments with
regards to scenarios on water use and availability to 2050 and to gain an informed opinion on the likelihood of such
developments occurring up to 2050. The results of these consultations are presented in Part Three. Part Four presents
a framework for the causal linkages between these driving forces and their impact on human well‐being, equity and
degree of poverty.

Global Drivers of Change 2
These findings show the possible range of future outcomes and the magnitude of the challenges we are
facing in each driver’s domain. The next phases of the World Water Scenarios Project will use these developments as
reference points to consider the combined impact of the drivers through cross‐sectoral qualitative and quantitative
analysis and modelling. The framework illustrating the causal linkages between these driving forces and their impact
on human well‐being, equity and degree of poverty is illustrated in Part Four.
As we move forward, the integrated picture that will result from the World Water Scenarios Project will play
an essential role in identifying coherent sets of policy and management actions aimed at moving towards the
sustainable development and use of water resources at the global, regional, national and subnational levels.
I would like particularly to express my appreciation to the researchers on the drivers1 and the expert
consultation participants whose contributions were the foundation for this report. I also wish to acknowledge Jerome
Glenn, Gilberto Gallopín, Gerald Golloway, Ted Gordon and Joana Talafré for their valuable input. Finally, my
gratitude to report authors Catherine Cosgrove and William Cosgrove (Phase 1 coordinator) for their excellent work in
bringing it all together.
I trust you will find this report informative and stimulating.
Olcay Unver
World Water Assessment Programme (WWAP) Coordinator
United Nations Educational, Scientific and Cultural Organization (UNESCO)
1 Agriculture: Hayato Kobayashi; Climate Change: John W. Young; Demography: Unisféra International Centre; Economics and Security:
Elizabeth Florescu; Ethics, Social and Cultural: Anita Kelleher; Governance: Jason Liszkiewicz; Infrastructure: Odette Gregory; Politics:
Unisféra International Centre; Technology: William Foster; Water Resources and Ecosystems: Martina Bertsch.

Global Drivers of Change 3
1 Background
1.1 World Water Assessment Programme Scenarios Project
The United Nations World Water Assessment Programme (WWAP) is undertaking a project that will explore
alternative futures of the world’s water and its use to 2050.
More than 10 years have passed since the last set of global water scenarios was developed under the
sponsorship of the World Water Council, during preparation of the World Water Vision (Cosgrove and Rijsberman,
2000).
Since then, technology and socio‐economic conditions in the world have altered dramatically, both within
and outside the water sector, and change continues to accelerate. New policy initiatives such as the Millennium
Development Goals (MDGs) have also since emerged. Scenarios being developed in other sectors provide new links to
explore, and new tools have become available to develop stronger scenarios reinforced by analysis through models at
the national and subnational levels.
The approach for developing the new set of scenarios will be similar to the method followed for the World
Water Vision: an iterative process of building qualitative scenarios and constructing simulation models, in which a
Scenario Focus Group (SFG) engages with scenario experts, stakeholders, data experts, modellers and decision‐
makers. Scenarios will be chosen to be useful to all decision‐makers, including those at subglobal levels that present
differing characteristics, such as in terms of the degree of law and order, financial systems or human and institutional
capacity. Contacts will be maintained throughout the three phases with other organizations who may be doing
scenario work in parallel – including the Fifth Assessment Report of the Intergovernmental Panel on Climate Change
(IPCC),2 the Environmental Assessments and Fifth Global Environmental Outlook of the United Nations Environment
Programme (UNEP)3 and the Environmental Outlook and Indicators updates of the Organisation for Economic Co‐
operation and Development (OECD).4
The project will run for about four years. It will have four principal phases:
• The process began with an in‐depth analysis (now complete) of the evolution of the major external forces
(‘drivers’) that have direct and indirect consequences for water managers and a discussion of existing
scenarios. This was done by conducting an analysis of the possible future evolution of principal drivers
2 For more information, visit http://www.ipcc.ch/ (accessed 28 June 2011). 3 For more information, visit http://www.unep.org/geo/ (accessed 28 June 2011). 4 For more information, visit http://www.oecd.org/department/0,3355,en_2649_34283_1_1_1_1_1,00.html (accessed 28 June 2011).
Global Drivers of Change 4
(including identification of linkages among them), taking account of the applicability of drivers depending on
major distinguishing characteristics of certain regions or groups of countries.
• Next a set of four scenarios (storylines of possible futures) and one vision of ‘Water for All’ in 2050 (storyline
of a preferred future) will be developed through qualitative and quantitative analysis (modelling), eventually
to be used as background material for the preparation of scenarios by local actors. These storylines, which
describe how selected primary drivers could interact as they evolve, will provide an understandable and
more transparent basis for scenario assumptions and a more interesting method for communicating the
substance of the scenarios than numerical data by themselves, and they represent the complex views of the
individual members of the stakeholders and expert groups, including those from countries sharing important
distinguishing characteristics.
To develop these storylines, an SFG representing important regions and groups of countries sharing common
issues will review the report of Phase 1 (analysis of the drivers of change). They will also be asked to describe
their concept of ‘Water for All’ in 2050. Based on this input, a group of experienced scenario development
specialists will provide outlines for the scenarios and vision. The SFG, with the support of some of the
scenario specialists, will then consider the proposed scenario outlines and give guidance on their
development before modelling is done and the scenarios developed further. This interactive process will
encourage communication and discussion between the SFG, scenario writers, data and sector experts, global
and subglobal modellers and stakeholders.
• In parallel and subsequently, scenarios will be developed for selected transboundary and country basins and
for some countries and states. In those cases, the global scenarios can serve as suggesting a general direction
and providing a perspective for the national and subnational scenarios. Such subglobal scenario exercises will
initially be carried out in a few selected countries and transboundary river basins where there is an effective
water management strategy or national water management plan, where data on water resource quality,
quantity and uses and on economic and social development are available to construct useful indicators and
where there is an expression of interest and a willingness to work with and contribute to the scenario
development process.
• The SFG will use the information gathered to review and adjust the global scenarios to take account of the
views of the future at the local level.
• Finally, the project will provide dissemination, outreach and training to strengthen the capacity of water
managers and professionals as well as people in other sectors at the local, national, transboundary and
regional levels to work cross‐sectorally on the issues raised by the scenarios. The materials and training will
also seek to inform political decision‐making and address risks and uncertainties linked to global changes.
Global Drivers of Change 5
1.2 Overview of the Phase One process: Identifying, reviewing and analyzing the drivers of
change
This report describes the process followed in the first phase of the project and its findings.
Work began by identifying the major external forces (‘drivers’) that should be reviewed in the scenarios
project. Scenario drivers are defined as follows (Alcamo and Gallopín, 2009):
[D]riving forces … represent the key factors, trends or processes which influence the situation, focal issue, or
decisions, and actually propel the system forward and determine the story’s outcome. Some of these forces
are invariant over all scenarios; that is, are to a large extent predetermined. Some of the driving forces may
represent critical uncertainties, the resolution of which fundamentally alter the course of events (Schwartz,
1991). Those drivers influence, but do not completely determine, the future. Thus, while the initial drivers are
the same in all scenarios, the trajectory of the system follows a different course in each of them.
A significant number of scenarios related to water at the global and other geographic scales were examined,
along with other global scenarios, to ascertain which drivers should be reviewed to understand how they might
evolve to 2050.
Ten drivers were identified for research of the literature describing the possible future of each domain. A list
of possible future developments in each of the domains was extracted from this research, taking into account
interlinkages with some of the other selected drivers.
The 10 drivers, which have varying influences and impacts in different regions of the world, are:
• Agriculture*
• Climate change and variability
• Demography
• Economy and security*
• Ethics, society and culture (includes questions of equity)*
• Governance and institutions (including the right to water)*
• Infrastructure
• Politics*
• Technology*
• Water resources, including groundwater and ecosystems
The list of possible future developments for each driver was submitted for discussion and review through
expert consultations. The objective of the expert consultations was to validate the degree of importance of the
developments with regards to scenarios on water use and availability to 2050 and to gain an informed opinion on the
likelihood of such developments occurring by then.

Global Drivers of Change 6
For the six more ‘controversial’ drivers (noted above by an asterisk), where the project team thought more
divergent opinions could arise, the Real Time Delphi (RTD) consultation approach was adopted since it is particularly
useful not only in producing consensus where possible but also in crystallizing reasons for disagreement.5 The experts
participating in the RTD consultations identified through discussion the most important events or developments and
the probability of their occurrence by 2020 and 2030. A report on the RTD consultations, providing a statistical
analysis of the results, is provided in Annex 1.
For the four other driver domains, a selected number of experts were invited individually to:
• review the list of developments;
• add missing possible developments of importance;
• rank the importance of the listed developments;
• and set time horizons for each development with regards to the earliest decade it might occur and the most
likely decade in which it might occur.
The process followed for the surveys is described in Annex 2, and an overall list of participants in the RTD
consultations and expert surveys is presented in Annex 3.
This report provides a summary of the key findings of these consultations. Part Two presents some of the
highlights of the current situation in each of the drivers’ domains. Part Three describes the most important and most
likely developments occurring within these forces of global change, based on the analysis of responses to the RTD
consultations and expert surveys.
It is important to keep in mind that these developments and their assessments cannot be considered as the
final independent compendium from which scenarios can be developed. The scenarios will draw upon qualitative and
quantitative analyses of the possible interactions between all these driving forces and developments. The iterative
and cross‐sectoral nature of the scenarios process will lead to the identification of other developments in addition to
these, and both probable and less probable developments will ultimately be incorporated into the storylines.
The suggested timelines provided by the experts during the RTD consultations and expert surveys provide
possible reference points for chains of events – in reality some may happen sooner, some later, some not at all.
The objective of presenting these findings is to understand the possible range of future outcomes and the
magnitude of the challenges the world is facing across all drivers in order to build more robustness in decision‐
making.
5 Invented by the Millennium Project, Real‐Time Delphi is a modernized online version of the Delphi process developed at the RAND
Corporation in the late 1950s to elicit and synthesize expert opinions about a central topic. The RTD’s on‐line questionnaire allows users
to modify their initial responses and comments to take into consideration other’s responses while preserving the notion of anonymity.
For a complete overview of the RTD process, including its history, description, strengths and weaknesses, see Gordon, 2009.

Global Drivers of Change 7
In conclusion, and in an introduction to the second phase of the project (the development of global water
scenarios to 2050), Part Four presents a framework that illustrates the causal linkages between these driving forces
and their impact on human well‐being, equity and degree of poverty.
2 Highlights of the current situation
This part presents just some of the highlights of the current situation in each of the drivers’ domains so as to gain a
better overview of the drivers’ starting points before focusing on their possible evolution in Part Three. The relevance
of these drivers to the situation of water use and quality in regions around the world varies, and these distinctions will
be made more apparent in the full scenarios development process (Phase Two). The research for these references,
unless otherwise indicated, dates from early 2010.
The present situation of water in the world is comprehensively monitored and reported on by the World
Water Assessment Programme. The third edition of the UN World Water Development Report (WWAP, 2009b) and
information on the fourth edition’s structure and production process may be found at
http://www.unesco.org/water/wwap/wwdr/index.shtml.
Highlights are presented by driver domain in the following order:
• Climate change and variability
• Water resources, including groundwater and ecosystems
• Infrastructure
• Agriculture
• Technology
• Demography
• Economy and security
• Governance and institutions
• Politics
• Ethics, society and culture
2.1 Climate change and variability
The IPCC defines climate change as ‘a change in the state of the climate that can be identified (e.g., by using statistical
tests) by changes in the mean and/or the variability of its properties, and that persists for an extended period,
typically decades or longer. Climate change may be due to natural internal processes or external forcings, or to
persistent anthropogenic changes in the composition of the atmosphere or in land use’ (IPCC, 2007a, p. 78).
The IPCC Fourth Assessment Report noted a 100‐year linear trend (1906–2005) increase of 0.74 [0.56–0.92]°C,
and this increase is widespread over the globe (IPCC, 2007b, p. 2). Some of the salient attributes of the changes in
Global Drivers of Change 8
climate are the altered frequencies and intensities of extreme weather. It is expected that these, together with sea
level rise, will have adverse effects for the most part on natural and human systems (IPCC, 2007b, p. 12).
It is the observed increase in anthropogenic greenhouse gas concentrations (defined as ‘emissions of
greenhouse gases, greenhouse gas precursors, and aerosols associated with human activities, including the burning of
fossil fuels, deforestation, land‐use changes, livestock, fertilisation, etc’) (IPCC, 2007a, p. 78) that very likely are
responsible for the observed increase in global average temperatures since the second half of the twentieth century
(IPCC, 2007b, p. 5).
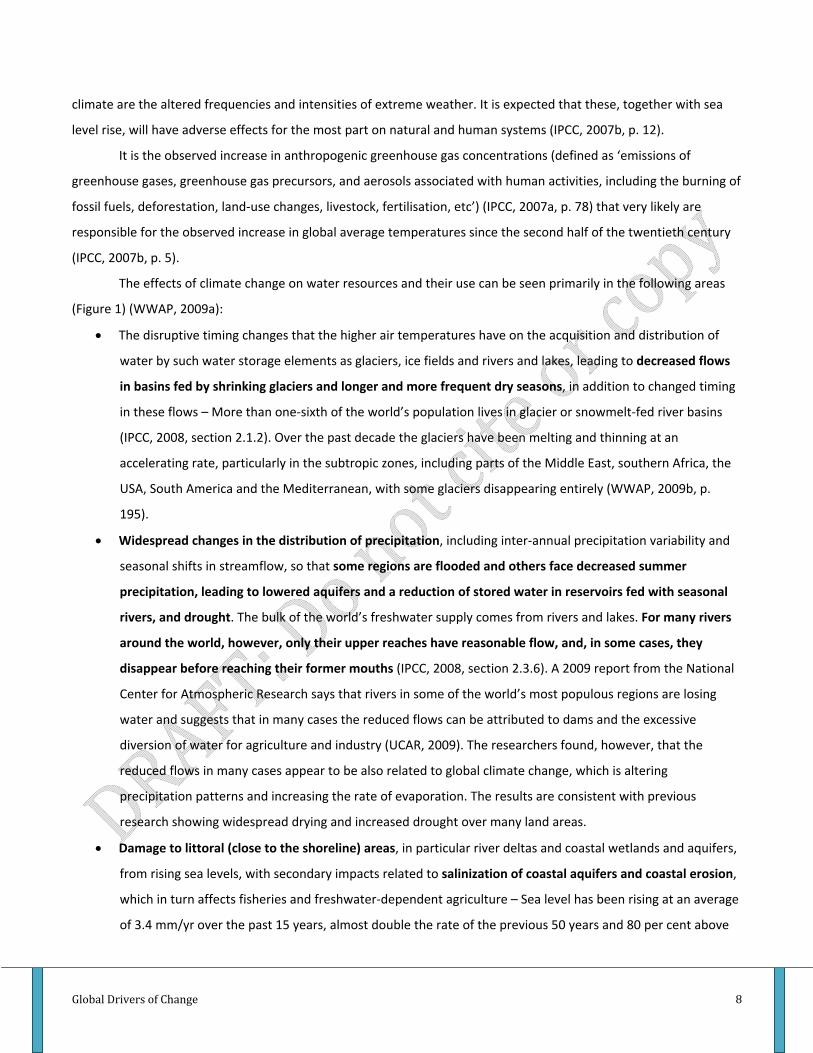
The effects of climate change on water resources and their use can be seen primarily in the following areas
(Figure 1) (WWAP, 2009a):
• The disruptive timing changes that the higher air temperatures have on the acquisition and distribution of
water by such water storage elements as glaciers, ice fields and rivers and lakes, leading to decreased flows
in basins fed by shrinking glaciers and longer and more frequent dry seasons, in addition to changed timing
in these flows – More than one‐sixth of the world’s population lives in glacier or snowmelt‐fed river basins
(IPCC, 2008, section 2.1.2). Over the past decade the glaciers have been melting and thinning at an
accelerating rate, particularly in the subtropic zones, including parts of the Middle East, southern Africa, the
USA, South America and the Mediterranean, with some glaciers disappearing entirely (WWAP, 2009b, p.
195).
• Widespread changes in the distribution of precipitation, including inter‐annual precipitation variability and
seasonal shifts in streamflow, so that some regions are flooded and others face decreased summer
precipitation, leading to lowered aquifers and a reduction of stored water in reservoirs fed with seasonal
rivers, and drought. The bulk of the world’s freshwater supply comes from rivers and lakes. For many rivers
around the world, however, only their upper reaches have reasonable flow, and, in some cases, they
disappear before reaching their former mouths (IPCC, 2008, section 2.3.6). A 2009 report from the National
Center for Atmospheric Research says that rivers in some of the world’s most populous regions are losing
water and suggests that in many cases the reduced flows can be attributed to dams and the excessive
diversion of water for agriculture and industry (UCAR, 2009). The researchers found, however, that the
reduced flows in many cases appear to be also related to global climate change, which is altering
precipitation patterns and increasing the rate of evaporation. The results are consistent with previous
research showing widespread drying and increased drought over many land areas.
• Damage to littoral (close to the shoreline) areas, in particular river deltas and coastal wetlands and aquifers,
from rising sea levels, with secondary impacts related to salinization of coastal aquifers and coastal erosion,
which in turn affects fisheries and freshwater‐dependent agriculture – Sea level has been rising at an average
of 3.4 mm/yr over the past 15 years, almost double the rate of the previous 50 years and 80 per cent above

Global Drivers of Change 9
past IPCC predictions (Allison et al., 2009). This is consistent with a doubling of ocean input from melting ice
worldwide, augmented by thermal expansion (Allison et al., 2009).
• Lengthening of the growing season and increased irrigation water usage; increased use of water to replace
evaporative losses and to satisfy human needs in warmer weather.
Figure 1 Examples of current vulnerabilities of freshwater resources and their management; in the background, a water
stress map based on WaterGAP
Source: Alcamo et al., 2003; IPCC, 2008, p. 9.
Higher temperatures and changes in flow can damage the quality of all freshwater sources (IPCC, 2008,
section 4.4.3):
• Lower flow levels reduce water’s dilution capacity, resulting in a higher pollutant concentration.
• Increased water flows create fluvial erosion, displacing and transporting diverse compounds from the soil to
water resources; they also can lead to an increased presence of pathogens as well as increased turbidity and
nutrient loading.
• Warmer water temperatures, combined with higher phosphorus concentrations in lakes and reservoirs,
promote algal blooms that can affect water quality, with the risk of possible toxic effects to humans, livestock
and wildlife. Higher water temperatures also increase the capacity of volatile and semivolatile pollutants to
transfer from water and wastewater into the atmosphere.

Global Drivers of Change 10
Climate change can also affect the function and operation of existing water infrastructure, from
hydropower to structural flood defences and drainage and irrigation systems (IPCC, 2008, p. 4).
2.2 Water resources
The total volume of water on the earth in its liquid, solid and vapour forms has been the same since the formation of
the planet. The total rainfall on the earth’s land surfaces amounts to 110,000 km3. It returns to the atmosphere via
evaporation and evapo‐transpiration. Rain replenishes blue water sources (rivers, lakes, etc.,) and green water
sources (soil moisture) (Molden, 2007).
Less than 3 per cent of global total water resources is represented by fresh water, and less than 1 per cent of
that (less than 0.01 per cent of total water) occurs in the earth’s liquid surface fresh water. The remainder represents
ice caps or groundwater (Mayers et al., 2009).
Although the global volume of stored groundwater is poorly known, estimates range from 15.3 million to 60
million km3, including 8–10 million km3 of fresh water (Margat, 2008). Groundwater has become a significant source
of water for human consumption, supplying nearly half of the world’s drinking water (WWAP, 2009b) and also
representing approximately 43 per cent of all water used in irrigation (Siebert et al., 2010).
The small fraction of liquid surface fresh water hosts an extraordinary level of biodiversity, supported through
a range of freshwater ecosystem types: running waters, standing waters and areas of transient water availability.
Freshwater ecosystems include permanent and temporary rivers and streams; permanent lakes and reservoirs;
seasonal lakes, marshes and swamps, including floodplains; forested, alpine and tundra wetlands; springs and oases;
and groundwater systems and geothermal wetlands (Mayers et al., 2009).
While climate change will have an important impact on water quality and quantity (see previous section), it is
the forces and processes generated by human activities that are creating the greatest pressures (WWAP, 2009b, p.
14). Agriculture and land use change, construction and management of reservoirs, pollutant emissions and water and
wastewater treatment have a critical influence on water resources in terms of both quantity and quality (IPCC, 2008,
p. 8).
The principal drivers of these pressures are the result of demographics and the increasing consumption that
comes with rising per capita incomes (WWAP, 2009b, p. 14). In fact, rapid population growth has led to a tripling of
water withdrawals over the last 50 years (WWAP, 2009c, p. 8). Of the total water withdrawn for human uses,
withdrawals for agriculture represent 70 per cent, those for industry 20 per cent, and those for municipal use about
10 per cent (Shiklomanov, 1999).
Water stress is defined as having less than 1,000 m3 per capita per year (based on long‐term average runoff),
since this volume is usually more than is required in a basin for domestic, industrial and agricultural water uses (IPCC,
2008, p. 8). It is estimated that the population living in water‐stressed basins ranges from 1.4 billion to 2.1 billion
(IPCC, 2008, p. 8). This includes populations throughout northern Africa, the Mediterranean region, the Middle East,

Global Drivers of Change 11
the Near East, southern Asia, northern China, Australia, the USA, Mexico, north‐eastern Brazil and the west coast of
South America.
Drought is defined as a sustained and regionally extensive occurrence of below average natural water
availability (Van Lanen et al., 2009). More intense droughts, affecting more people and linked to higher temperatures
and decreased precipitation, have been observed in the twenty‐first century (Zhang et al., 2007). It has been
estimated that since the beginning of this century the land surface affected by drought increased from 1 to 3 per
cent for extreme droughts, from 5 to 10 per cent for severe droughts, and from 20 to 28 per cent for moderate
droughts (Burke et al., 2006).
In conditions of water stress, water resources considered as ‘renewable’ can be drawn upon beyond their
‘renewable’ threshold, rendering the resource unsustainable. This is already the case for West Asia and North
Africa (where withdrawals as a percentage of internal renewable water resources have exceeded 75 per cent;
Figure 2); southern Asia and the Caucasus and Central Asia have nearly reached 60 per cent, the threshold signalling
water scarcity (UN, 2011a, p. 52).
Water quality is affected by chemical, microbiological and thermal pollution (Carr and Neary, 2008; Mayers
et al., 2009; UNEP, 2010a):
• Chemical contamination can occur as a result of excess nutrients, acidification, salinity, heavy metals and
other trace elements, persistent organic pollutants and changes in sediment loads.
• Microbiological contaminants, bacteria, viruses and protozoa in water pose one of the leading global human
health hazards.
• Altering natural water temperature cycles can impair biological functions (e.g. spawning, growth patterns
and migration) and can affect metabolic rates in aquatic organisms, leading to long‐term population declines.

Global Drivers of Change 12
Figure 2 Surface water and groundwater withdrawal as a percentage of internal renewable water resources, taking into
consideration official treaties between countries, around 2005
Source: UN, 2011a, p. 52.
Multiple contaminants often combine synergistically to cause amplified, or different, impacts than the
cumulative effects of pollutants considered separately (UNEP, 2010a).
Continued input of contaminants can ultimately exceed an ecosystem’s resilience, leading to dramatic and
irreversible losses. Groundwater systems are particularly vulnerable freshwater resources: once contaminated, they
are difficult and costly to clean.
Pollution and degradation of water quality are growing risks, despite improvements in some regions
(WWAP, 2009c, p. 11):
• Eutrophication, mainly due to high phosphorus and nitrogen loads in water, is the most prevalent water
quality problem globally, substantially impairing the beneficial uses of water. The riverine transport of
inorganic nitrogen and phosphorus has increased severalfold over the last 150–200 years.
• In developing countries, the share of sewage discharged without being treated is above 80 per cent,
polluting rivers, lakes and coastal areas.
• Heavily polluting industries may be disappearing from high‐income countries but they are moving to
emerging market economies.
• Natural arsenic pollution of drinking water is emerging as a global threat on all continents: up to 140 million
people may be affected in 70 countries.
• According to some estimates, less than 20 per cent of the world’s drainage basins exhibit nearly pristine
water quality.
• The degradation of lakes, rivers, marshes and groundwater is more rapid than that of other ecosystems
(MA, 2005).
Wetlands provide ecosystem services, including food, fresh water and fuel, in addition to fulfilling vital roles
in carbon storage, pollution control and protection from natural hazards, such as floods and storms (IUCN, 2011).
One estimate of the total economic value of the world’s wetlands (a global wetland area of 12.8 million
km2) cited by the Ramsar Convention was in the order of US$70 billion per year (WWF, 2004). From 1900 to 1990,
more than half of the world’s wetlands disappeared (Barbier, 1993).
It is estimated that 126,000 described species rely on freshwater habitats: this includes species of fishes,
molluscs, reptiles, insects, plants and mammals (IUCN, n.d.). This number could in fact be closer to more than 1
million with the inclusion of undescribed species (IUCN, n.d.). In many freshwater groups of species, species richness

Global Drivers of Change 13
in relation to location of habitat is extremely high (IUCN, n.d.) – this means that there is a high proportion of animals
and plants found nowhere else in the world. Freshwater species populations were reduced by 50 per cent on
average between 1970 and 2005, a sharper decline than for other major regional or global biotic communities
(WWAP, 2009c, p. 10).
Recent global assessments of the wetland species considered threatened stand as follows: 17 per cent of
wetland birds, 38 per cent of freshwater‐dependent mammals, 33 per cent of freshwater fish, 26 per cent of
freshwater amphibians, 72 per cent of freshwater turtles, 86 per cent of marine turtles, 43 per cent of crocodilians
and 27 per cent of coral reef‐building species (Ramsar, 2010).
The causes leading to wetland biodiversity loss are habitat change (including drainage and infilling for
agriculture or construction), climate change, pollution, overexploitation of resources (e.g. overfishing) and the spread
of invasive ‘alien’ (non‐native) species (Ramsar, 2010). Unintentional introduction of exotic or invasive alien species is
considered by some to be the primary cause of biodiversity loss due to their ability to outcompete native species for
water, food, space and other resources (Circuna et al., 2004).
Land degradation of large areas of croplands, grasslands, woodlands and forests negatively affects the
availability and quality of water resources, posing risks to critical ecosystem functions and increasing vulnerability to
climate change. It is now estimated that almost 2 billion ha of land worldwide – equivalent to twice the land area of
China – are seriously degraded, some irreversibly (FAO, 2008a).
Communities living in drylands represent 35 per cent of the world’s population, yet those in developing
countries are ranked among both the world’s poorest and its fastest growing populations (Zelaya, 2009).
2.3 Infrastructure
Water infrastructure serves multiple needs, in both large industrial and small domestic spheres. This happens
formally when the needs are factored into the design of the system (like a dam built for hydropower and irrigation).
And, perhaps more often, it happens informally when unauthorized end‐users create their own modifications to
single‐use systems for their own, often unmet, water needs (extending the irrigated land area beyond the area agreed
for irrigation, digging illegal bore holes to tap groundwater sources, siphoning water from existing pipelines for
purposes other than those intended, using irrigation canals for sewage disposal, etc.) (van Koppen et al., 2006).
The world is on track to meet the MDG target for sustainable access to safe drinking water. It is estimated
that between 1990 and 2008, some 723 million people in rural areas and 1.1 billion people in urban areas gained
access to an improved drinking water source (UN, 2011a, p. 4). Eastern Asia’s drinking water coverage increased from
69 per cent in 1990 to 86 per cent in 2008 (UN, 2011a, p. 4). Although coverage in sub‐Saharan Africa nearly doubled
from 252 million in 1990 to 492 million in 2008 (UN, 2011a, p. 4), the coverage level was only at 60 per cent at that
point (UN, 2011a, p. 54).

Global Drivers of Change 14
Progress has been uneven though, with coverage lagging behind that of cities and towns in all regions of the
world (UN, 2011a, p. 5). In 2008, an estimated 743 million rural dwellers and 141 million urbanites relied on
unimproved sources for their daily drinking water needs. An urban dweller in sub‐Saharan Africa is 1.8 times more
likely than a rural inhabitant to use an improved drinking water source (UN, 2011a, p. 54).
The world is currently not on track to meet the MDG sanitation target: in 2008, over 2.6 billion people lacked
access to flush toilets or other forms of improved sanitation (UN, 2011a, p. 5). Improvements in sanitation have
disproportionately benefited the better‐off, as seen in tri‐country analysis in Southern Asia, which showed that the
coverage for the poorest 40 per cent of households hardly increased between 1995 and 2008 (UN, 2011a, p. 5).
In 2008, it was estimated that 1.1 billion people practiced open defecation, leading to serious health risks,
particularly among the poor who are more exposed to the dangers of inadequate waste disposal (UN, 2011a, p. 55).
At the current rate of progress towards improved sanitation, it will take until 2049 to provide coverage to 77 per cent
of the global population (UN, 2011a, p. 55).
Constraints to providing access to drinking water and sanitation in developing countries include the
following (WHO, 2010a):
• low priority for both official development assistance (ODA) and domestic allocations when compared with
other social sectors
• difficulty in targeting the poorest and most unserved populations
• lack of clearly defined policies with regards to sanitation in particular
• difficulty establishing clear roles and responsibilities for the different institutions involved
• for some countries, inability to absorb the current level of aid
• unpredictability of longer‐term funding
• human resource capacity
• difficulties setting aside adequate funds for recurrent costs, including salary and replacement parts as well as
essential operating inputs (energy, transportation, etc.)
• lack of multi‐stakeholder involvement
• difficulties aligning a multitude of fragmented donor initiatives with government processes
Improving access through household investment is a considerable challenge when almost two in three
people who lack access to safe drinking water survive on less than US$2 a day and more than 660 million people
without adequate sanitation live on less than US$2 a day. Yet typically the ratio of household to government
investment in basic sanitation is 10 to 1 (WWAP, 2009c, p. 8).

Global Drivers of Change 15
Financing issues for continued maintenance does not only concern developing countries. In the United
States, for example, the American Society of Civil Engineers forecasts a funding gap of US$108.6 billion over five years
for drinking water and wastewater infrastructure system improvements and operations (ASCE, 2009).
Challenges posed in the delivery of public sector water supply and sanitation in the developing world are
often linked to low motivation, poor management, inadequate cost recovery and political interference (WWAP,
2009b, p. 105).
Water use is a key component of energy development and use, whether directly for cooling and energy
production or passively as the reservoirs built for energy production and other purposes lead to the evaporation of
significant amounts of water (WWAP, 2009b, p. 116).
Energy is a key component of water transportation and treatment, accounting for 60–80 per cent of water
transportation and treatment costs and 14 per cent of total water utility costs (WWAP, 2009b, p. 117).
Hydropower has shaped water infrastructure in many parts of the world. When managed appropriately for
multiple uses, hydro plants can allow for flow regulation and flood management, water for irrigation and drinking
water supply during dry seasons and rapid response to grid demand fluctuations due to peak demands (WWAP,
2009b, p. 118).
Hydropower is the most important source of commercial renewable energy worldwide, supplying about 20
per cent of the world’s electricity. It is the most economical, and it is an increasingly popular source of clean energy in
a context of the pressures to transition towards a green economy (WWAP, 2009b, p. 118) . Although hydropower
generation can require significant quantities of water, these are returned to the river after passing through turbines;
substantial losses do, however, occur through evaporation of reservoirs (WWAP, 2009b, p. 118).
Challenges stymieing hydropower development include the following (WWAP, 2009b, pp. 118 and 119):
• in developed countries, little remaining spatial and geophysical potential
• in both developed and developing countries, lack of investment capacity and, perhaps more important, the
social and environmental impacts of large dams and the controversy surrounding them; this includes the lack
of regulation of hydropower dam releases to optimize downstream uses and to minimize the negative
impacts on aquatic ecosystems
Hydropower is not the only driver of dam construction: the development of waterways for transport lies
behind many large‐scale river transformations. Although inland navigation is often considered to be the least
polluting, cost‐effective means of transportation, improved river transportation has often been the objective of
building dams and dykes and dredging rivers. Of 230 major world rivers, some 60 per cent are now considered to be
seriously or moderately fragmented by these transformations (WWAP, 2009b, p. 119). In many instances, the

Global Drivers of Change 16
transformation of river courses has become irreversible, with negative impacts on vulnerable groups and ecosystems
(WWAP, 2009b, p. 121).
Conservation of water, retrofitting of existing hydropower dams, better planning for dam siting and operation
to secure environmental flows, improved water management and custodianship of water storage opportunities
(including those provided by nature‐like wetlands and aquifers and also rainwater harvesting) have been offered as
methods to build storage capacity for projected increases in future populations, to minimize current negative
outcomes from established dam storage facilities and to maximize economic, environmental and social benefits (IPCC,
2008; MA, 2005; Narain et al., 2005; UN‐Water, 2010).
Sizeable outlays are required for repairing, strengthening or modifying older dams. Although rehabilitation
and decommissioning costs are site‐specific, rehabilitating or decommissioning existing infrastructure can entail
enormous costs. The decision often depends on whether the cost of maintaining the dam exceeds its expected future
economic and financial benefits. Decommissioning a dam may make sense in cases where it has outlived its purpose,
where it is old and unsafe, where sedimentation is high or where river flows need to be maintained for fisheries and
other ecosystems (WWAP, 2009b, p. 59).
2.4 Agriculture
Agriculture is the largest use of water. Today, the production of food and other agricultural products takes some 70
per cent of the freshwater withdrawals from rivers and groundwater, or roughly 3,100 billion m3. The withdrawals
stand to increase to 4,500 billion m3 by 2030 if water efficiency gains are not instituted (WEF, 2011).
Some 925 million people in the world were undernourished in 2010 (FAO, n.d.a). The MDG target of halving
the proportion of people suffering from hunger is likely to be met overall in the regions of Southeast Asia, Eastern
Asia and Latin America and the Caribbean, albeit with strong disparities between countries in these regions. Sub‐
Saharan Africa is not on track to meet the target (UN, 2011a, p. 12).
Food prices hit an all‐time high in February 2011 according to the Food Price Index of the Food and
Agriculture Organization (FAO), compared with the 2002–04 benchmark (Figure 3).

Global Drivers of Change 17
Figure 3 FAO Food Price Index, 1990–2011 (7 Juky 2011).
Source: FAO, n.d.b.
In a trend that had lasted until very recently, improvements in agriculture known as the Green Revolution led
to substantial improvements in global food security through higher and more stable food production and a 30‐year
decline in food prices in most countries (WWAP, 2009c, p. 9).
Agriculture‐driven changes in land use, land cover and irrigation have made substantial modifications to the
global hydrological cycle with regards to both water quality and water quantity (Gordon et al., 2010). Extensive use of
fertilizer and agrochemicals has also led to severe pollution, causing health and environmental hazards (WWAP,
2009b, p. 44).
By far the most important driver in water use during the coming decades will be the increase and changes in
global food demand due to population growth and changes in diet (WWAP, 2009b, p. 14). Several food‐importing
countries, including China, South Korea, Saudi Arabia and the United Arab Emirates, have started buying or leasing
land in developing countries, particularly in sub‐Saharan Africa, to improve their food security, provoking a debate on
ethical issues relating to food and water security (Braun and Meinzen‐Dick, 2009).
Economic growth combined with increased individual wealth lead to a shift from predominantly starch‐based
diets to those centred on meat and dairy, which are more water‐consumptive. According to the FAO, this dietary shift
has had the greatest impact on water consumption over the past 30 years and is likely to continue well into the

Global Drivers of Change 18
middle of the twenty‐first century (FAO, 2006). According to some estimates, meat production requires 8–10 times
more water than cereal production (WWAP, 2009c, p. 9).
Rainfed agriculture covers roughly 80 per cent of agricultural land worldwide (Rockström et al., 2007).
Although this is generally associated with low yield and high on‐farm water losses, rainfed croplands meet about 60
per cent of the food and nutritional needs of the world’s population and are the backbone of marginal or subsistence
farmers (Rockström et al., 2007). The relatively low productivity of this form of agriculture and the large gaps
between actual and attainable yields in many parts of the world suggest a large untapped potential for production
increases. In order to unlock the potential in rainfed agriculture, however, rainfall‐related risks need to be reduced
(Rockström et al., 2007).
Rainfed agriculture is generally known to be far more sustainable than irrigated agriculture, which is often
associated with waterlogging and soil salinization, but uncontrolled expansion of rainfed farming and land
conversions from forests, rangelands and protected areas also is environmentally costly and ecologically unacceptable
(Richards, 1990). The key challenge is to reduce water‐related risks posed by high rainfall variability rather than
coping with an absolute lack of water. There is generally enough rainfall to double and often even quadruple yields in
rainfed farming systems, even in water‐constrained regions (Rockström et al., 2007).
Investment in water storage will be increasingly critical, with climate change leading to greater uncertainties
in rainfed agriculture and reduced glacial runoff (World Bank, 2007).
Irrigated agriculture covers 275 million hectares – about 20 per cent of cultivated land – and accounts for 40
per cent of global food production (WWAP, 2009c, p. 9).
Irrigation has ensured an adequate global food supply and raised millions of people out of poverty, especially
in Asia in the last decades (Faurès et al., 2007). In addition to its direct benefit of increased productivity, irrigation
offers a number of secondary benefits, such as increased productivity of rural labour and promotion of local agro‐
enterprises. The overall multiplier effect of irrigation on the economy has been estimated at 2.5–4, with the largest
positive impacts on poverty and livelihoods (Faurès et al., 2007).
Many of irrigation’s negative environmental effects arise from withdrawal, storage and diversion from natural
aquatic ecosystems and the resultant changes to the natural pattern and timing of hydrological flows (Falkenmark et
al., 2007). Rivers have in many instances become disconnected from their floodplains and from downstream estuaries
and wetlands – with, in some instances, total and irreversible wetland loss. Wetland water quality has deteriorated,
especially in areas under high‐intensity irrigation (MA, 2005). The water transfer and storage induced by irrigation

Global Drivers of Change 19
also led to the introduction and proliferation of invasive species, such as aquatic weeds, in both water management
systems and natural wetlands.
Current irrigated cropping systems require the greatest share of water in most countries, and with an
expected increase of 14 per cent in demand in the next 30 years, adaptation of these systems to this increase is
crucial and will require variability and flexibility (UNCCD, n.d.b). Some alternatives for adaptation include:
• changes to land use and cropping patterns
• crops that are drought‐resistant and require less water
• no‐tillage (the practice of leaving residue of the previous season’s crops on farmland, increasing water
infiltration while reducing evaporation as well as wind and water erosion)
• soil fertilization techniques such as biochar (UNCCD, n.d.b)
Improving water productivity can play an important role in reducing increase in demand for agricultural
water (Molden et al., 2007). Water productivity is the ratio of the net benefits from crop, forestry, fishery, livestock
and mixed agricultural systems to the amount of water used to produce those benefits (Molden et al., 2007).
With no improvements in land and water productivity, global water consumption for agriculture will need to
increase by 70–90 per cent by 2050 (Molden et al., 2007). However, with improvements in the productivity of both
rainfed and irrigated agriculture resulting from research and technology transfer at national and international levels,
an optimistic yet plausible estimate is for a reduced 20–25 per cent increase in demand for agricultural water by 2050
(Molden et al., 2007).
Focusing only on reducing losses in irrigation when seeking to improve water productivity will not likely have
a significant impact on water use, since large irrigation schemes often serve many other informal purposes (such as
providing water for drinking, bathing, swimming, fishing and livestock). Management thus needs to focus on multiple
use strategies (WWAP, 2009b, p. 115).
Productivity could be improved through better overall design and a better match between technologies,
management and institutional arrangements, as well as through:
• at the irrigation system level: waterlevel, flow control and storage management within surface irrigation
systems at all scales
• on the farm: storage, reuse, waterlifting (manual and mechanical) and precision application technologies such
as overhead sprinklers and localized irrigation
• across sectors: multiple‐use systems in rural areas and urban agriculture with wastewater (WWAP, 2009b, p.
115)
Fertilizers and pesticides played a key role in the Green Revolution, along with irrigation and high‐yielding
varieties of maize, wheat and rice (WWAP, 2009b, p. 44). Nitrogen runoff from the fertilizer applied to farm fields, as

Global Drivers of Change 20
well as the manure generated from the intensive livestock farming, has severely damaged river and marine
ecosystem, leading to algal blooms, fish kills, habitat degradation and bacteria proliferations that endanger human
health (WWAP, 2009b, p. 138). One recent study suggested that organic farming could lead to greater yield as well as
better environmental outcomes than fertilizer‐based farming practices (UNCTAD and UNEP, 2008).
Another driver influencing agricultural development is government agricultural subsidies. Agricultural
subsidies in developed and developing countries alike can take many forms, but a common feature is an economic
transfer, often in direct cash form, from governments to farmers (Lingard, 2002). These transfers may take the form
of an input subsidy (e.g. for inorganic fertilizers or pesticides or energy for pumping groundwater) or can make up the
difference between the actual market price for farm output and a higher guaranteed price. Subsidies shield sectors or
products from international competition, but by artificially reducing the costs of production, agricultural subsidies
encourage wasteful use of resources, including water, and also encourage overproduction (Lingard, 2002). Decisions
to remove or reduce them would lead to improved efficiency, environmental quality and economic cost savings
(Lingard, 2002). Offering support and complementary policies internalizing social and environmental externalities
while removing subsidies would allow for an optimization of the economic system (Lingard, 2002).
With more than 45 per cent of the population in less developed regions now urban (UNDESA, 2009c),
proximity to urban markets is an important advantage in hot climates where refrigerated transport and storage are
limited (Qadir et al., 2007). Food losses in the field between planting and harvesting could be as high as 20–40 per
cent of the potential harvest in developing countries due to factors such as pests, pathogens and the lack of adequate
infrastructure (Nellemann et al., 2009).
Urban agriculture will have an important role to play in meeting the demand for food of urban populations,
while wastewater management is critical in avoiding significant health and environmental consequences that may
accompany this demand (Qadir et al., 2007). Using wastewater for agriculture can also reduce the sector’s freshwater
requirements (Qadir et al., 2010). Farmers in urban and peri‐urban areas of many developing countries often have no
other choice than to use wastewater (Qadir et al., 2010). Urban wastewater is often mixed with untreated industrial
waste, constituting a significant risk to farmers and the consumers of their produce (WWAP, 2009b, p. 141).
Fish is an increasing source of protein in diets around the world. It was estimated that the average global
per capita consumption of fish in 2007 was 17.1 kg, representing 16.1 per cent of all animal protein intake and 6.2 per
cent of total protein intake globally (FAO, 2010).
According to FAO, the global total production of fish, crustaceans and molluscs is on the rise and reached 142
million tonnes in 2008. While capture production has maintained a level of around 90 million tonnes since 2001,
aquaculture production increased at an average annual growth rate of 6.2 per cent – from 38.9 million tonnes in 2003
to 52.5 million tonnes in 2008. The value of aquaculture production worldwide for 2008 was estimated at US$98.4
billion (FAO, 2009a).

Global Drivers of Change 21
The maximum potential of wild capture fisheries from the world’s oceans has probably been reached (FAO,
2008b). UNEP warns that 30 per cent of fish stocks have already collapsed (i.e. are at less than 10 per cent of their
former potential yield), and virtually all fisheries risk running out of commercially viable specimens by 2050 (UNEP,
2010b).
Inland fisheries play a key part in livelihood strategies at the household level. They provide both direct and
indirect employment to about 100 million people, mostly in developing countries (WWAP, 2009b, p. 121). Inland
fisheries also constitute a safety net activity for the poor through catch and trade. These estimates do not include
temporary fishing activities, which engage hundreds of millions of people, mostly in inland areas (WWAP, 2009b, p.
121).
Aquaculture has provided improved food security in many developing countries, especially in Asia, through its
ability to produce low‐value freshwater species destined mainly for domestic consumption (WWAP, 2009b, p. 122).
However, effluent from fish pens, including antibiotics, pollutes the surrounding waters, and escaped fish can
transmit diseases to wild stocks and disturb local marine and freshwater ecosystems (Delgado et al., 2003). Hundreds
of thousands of hectares of mangrove forests – offering critical ecosystem services such as filtering nutrients,
cleansing water and protecting ecosystems from floods and storms – have been destroyed by coastal aquaculture
development, especially shrimp farming (Delgado et al., 2003).
2.5 Technology
Information, communication and technological challenges and innovations have an impact on water management and
productivity.
There are large disparities in terms of the amount of hydrological information available to decision‐makers in
different parts of the world (WWAP, 2009b, p. 226). In many river basins, local decision‐makers do not know exactly
how much water is available and the risks to its future (Xu and Singh, 2004).
Information and communications technology can help overcome this problem. However, hydrological data
are shared little, given issues related largely to limited physical access to data and policy and security concerns, the
absence of agreed sharing protocols and commercial considerations. This complicates projects that would have to
build on shared datasets for scientific and applications‐oriented purposes, including seasonal regional hydrologic
outlooks, forecasting, disaster prevention and warning and integrated water resources management in transboundary
basins (WWAP, 2009b, p. xxv).
When data are available, difficulties can arise around accuracy and comparability (WWAP, 2009b, p. 228).
In addition, the water management field is characterized by a diffused decision‐making process that spans
from farmers to regions, from municipal suppliers to countries and from country scale to global scale (WWAP, 2009b).
Decision‐makers need information from scientists that, according to Jacobs (2002), is:
• relevant to answering the specific policy question

Global Drivers of Change 22
• readily accessible and understandable
• acceptable in terms of accuracy and trustworthiness
• compatible and usable in the specific decision‐making context
• provided in a timely fashion
A considerable number of water technologies merit attention because they hold the prospect of increasing
the amount of water for drinking, agriculture and manufacturing or of allowing more efficient use of water.
Water conservation technologies, for example, are slowly becoming more prevalent and can help reduce
water use. These include low‐flow sensored faucets, low‐flow showerheads, pressure‐reducing valves, horizontal‐axis
clothes washers, water‐efficient dishwashers, low‐flush tank toilets, low‐flush flushometer toilets, low‐flow urinals
and waterless urinals (DOE, 2002).
Grey water recycling and reclamation techniques increase the usage of reclaimed water from industrial and
municipal sources. These can have significant impacts on the ability to reduce water stress (WWAP, 2009b, p. 142). In
fact, the greatest number of patents for monitoring environmental impacts between 1978 and 2002 was granted for
water pollution treatment, attesting to the importance of information and communications technology innovations in
the sustainable management of water resources (WWAP, 2009c, p. 4).
No single method of desalination stands out as the best, since the selection of the optimal desalination
process is based on site‐specific conditions, such as the salt content of the water, economics, the quality of water
needed by the end user and local engineering experience and skills (Cooley et al., 2006, p, 13). In 2005, about 46 per
cent of the world’s desalination capacity used the reverse osmosis method, in which salt water is forced through a
membrane, with the salt remaining on the upstream side of the membrane; 40 per cent of the desalination capacity
came from thermal processes that use heat to distil fresh water from seawater or brackish water (Cooley et al., p. 14).
The salt brine resulting from the desalination process can also contain other chemical pollutants, making safe disposal
of this effluent a challenge (Cooley et al., p. 6). Since desalination processes are energy‐dependent, it is projected that
the future cost of desalinated water will be more closely linked than other sources of water to variations in energy
prices (Cooley et al., p. 5).
Remote sensing (Huang et al., 2005; Kao et al., 2009) subdivides light spectra into bands sensors to form
multispectral images. Such images may be used to detect leakage of canals as well as from water storage locations,
the types and health of crops, insect infestation, etc. The sensors may be placed on the ground, in the air or in
satellites. This existing technology is being developed further for agricultural application in terms of resolution and
precision.
Probabilistic modelling may not adequately substitute accurate field measurements, but experience in this
technique has progressed to the point that some data can now be successfully generated with models (WWAP,
Global Drivers of Change 23
2009b, p. 261). Modelling can also be of benefit in understanding risks related to insect infestation and agriculture
production. Additionally, models mapping insect infestation (USFS, n.d.) and agriculture production (Marques et al.,
2005) can be of benefit in understanding risks associated with water resources. The opportunities provided by
technologies based on satellite remote sensing and modelling are however constrained by the ability to ground truth
and validate the information (WWAP, 2009b, p. xxv).
Precision farming uses information technology to monitor crops and field conditions and to guide seed and
agricultural chemical application. Real‐time kinematic global positioning systems allow a tractor to position itself with
an accuracy of 2 cm, thus reducing inefficiencies stemming from overlapping seed applications while improving fuel
use (Cookson, 2010). By using satellite data to determine soil conditions and plant development, precision farming
can lower the production cost by fine‐tuning seeding, fertilizer, chemical and water use and potentially increase
production (Cookson, 2010).
Nanotechnology – using nanofiltration technology, nanomaterials and nano particles in the areas of
desalination, water purification and wastewater treatment and using nanosensors to monitor – shows particular
promise for water resources management (WWAP, 2009b, p. 45). The rate of nanotechnology development is
increasing, as measured by the number of publications and patents in this field. This is in part due to the social,
economic and scientific significance of such developments as well as the explosive growth in transdisciplinary
research (Liu et al., 2009).
Rapid growth aeroponics allows plants to grow considerable root systems without soil and with far less
water than traditionally considered necessary for plant growth (NASA, 2006).
The development of salt‐tolerant agriculture could reduce food insecurity (FAO, 2002). Currently, only about
1 per cent of plant species can grow and reproduce in coastal land areas and inland saline sites (Rozema and Flowers,
2008). There is a potential for developing many salt‐adapted plants – known as halophytes – and the speed at which
they could be produced could be enhanced by biotechnology. Saline crops could be used for human food
consumption and as fodder for animals as well as for biofuel (Rozema and Flowers, 2008; see also Hendricks and
Bushnell, 2009).
The production of meat without animals would reduce the amount of land, water and other resources that
otherwise goes towards raising livestock. Meat cultured from cells has been accomplished but is yet some distance
from commercialization, since the technical challenges of tissue engineering are still very expensive (Bartholet, 2011).
2.6 Demography
In 2010 the world population was 6.9 billion, with about 82 per cent of the people living in developing countries.6
According to the medium variant of the United Nations 2010 Revision of the World Population Prospects, the
6 Unless indicated otherwise, all projections in this section are from UNDESA, 2011a.

Global Drivers of Change 24
population is projected to surpass 9.3 billion by 2050, with 86 per cent living in currently less developed regions
(UNDESA, 2011b). And 70 per cent of the world will be living in urban areas (Ringler et al., 2010).
The medium variant projection for less developed regions is for a population increase from 5.66 billion in
2010 to 7.99 billion in 2050.7 Least developed countries, in particular, will more than double in population in this
scenario, increasing from 832 million in 2010 to 1.73 billion in 2050. In the more developed regions, population will
increase slightly from 1.24 billion in 2010 to 1.3 billion in 2050.
The working age population (25–59 years of age) worldwide in 2010 was at an all‐time high of 3.08 billion:
605 million in the more developed regions and 2.47 billion in the less developed ones. According to the medium
variant scenario of the 2010 Revision, in less developed regions the working age population will increase by close to
450 million in the next decade and reach nearly 3.6 billion in 2050 – justifying the critical importance of supporting
employment creation in these regions.
Employment levels in advanced economies are now only estimated to return to pre‐financial‐crisis levels by
2015. In emerging and developing countries, job levels are expected to reach pre‐crisis levels in 2011; the incidence of
underemployment and involuntary part‐time employment is increasing in several developing countries (ILO, 2010).
This does not include the 8 million additional jobs needed yearly to meet the growing workforce.
The world population is ageing. Globally, the number of persons age 60 years or over is expected to increase
more than 2.5 times between 2010 (759 million) and 2050 (2 billion). In less developed regions, this demographic will
more than triple, from 491 million (or 8.7 per cent of the population) to 1.6 billion (20 per cent of the total
population).
Elderly people may be just as vulnerable as children to epidemics of malaria and diarrhoeal diseases
(Bypass, 2008), and they have the highest mortality due to heatwaves (WHO, 2005). An increasing proportion of this
population will be living with dementia – projected for 2040 to reach 811 million, 71 per cent of whom will be in
developing countries (Ferri et al., 2005). The disability weight for dementia is estimated to be higher than almost any
7 The terms ‘less developed regions’ and ‘least developed countries’ refer to the statistical groupings used by the UN Department for
Economic and Social Affairs Population Division in the 2010 Revision online database. They are defined in the 2008 Revision Highlights
(UNDESA, 2009b) as follows:
Less developed regions comprise all regions of Africa, Asia (excluding Japan) and Latin America and the Caribbean, as well as Melanesia,
Micronesia and Polynesia. The designation ‘more developed’ and ‘less developed’ regions are intended for statistical convenience and do
not necessarily express a judgment about the stage reached by a particular country or area in the development process.
The group of least developed countries currently comprises 49 countries: Afghanistan, Angola, Bangladesh, Benin, Bhutan, Burkina Faso,
Burundi, Cambodia, Central African Republic, Chad, Comoros, Democratic Republic of the Congo, Djibouti, Equatorial Guinea, Eritrea,
Ethiopia, Gambia, Guinea, Guinea‐Bissau, Haiti, Kiribati, Lao People’s Democratic Republic, Lesotho, Liberia, Madagascar, Malawi,
Maldives, Mali, Mauritania, Mozambique, Myanmar, Nepal, Niger, Rwanda, Samoa, São Tomé and Príncipe, Senegal, Sierra Leone,
Solomon Islands, Somalia, Sudan, Timor‐Leste, Togo, Tuvalu, Uganda, United Republic of Tanzania, Vanuatu, Yemen and Zambia.

Global Drivers of Change 25
health condition apart from spinal cord injury and terminal cancer, thus constituting a considerable burden in terms
of resources and a challenge to mobility in crisis situations (Ferri et al., 2005). The overall shift in the old‐age
dependency ratio (the increase in the number of old‐age persons versus persons contributing to the economy) will
also pose significant challenges for the traditional welfare state (Christensen et al., 2009).
Small variations in fertility have considerable impact on population size over the long run (UNDESA, 2011b).
The fertility level in the medium variant projection is foreseen to decline from 2.52 children per woman in 2005–10 to
2.17 children in 2045–50. Realization of this projection is contingent on the continued declines in countries that still
have fertility rates above replacement level (that is, countries where women have, on average, more than one
daughter) and on an increase in fertility rates in the countries that have below‐replacement‐level fertility. This in turn
is based on the assumption of increased access to family planning and modern contraceptive methods. If fertility
were to remain half a child per woman above the levels estimated in the medium variant, the world population would
reach 10.6 billion in 2050 (high variant). The low variant, in which fertility remains half a child below that of the
medium, projects a population of 8.1 billion in 2050. Thus even with low fertility levels, population growth is
inevitable to 2050 (UNDESA, 2009a).
In fact, progress on access to family planning and modern contraceptive methods slowed in almost all regions
between 2000 and 2008 (UN, 2011a, p. 33). Aid for family planning as a proportion of total aid to health declined
sharply between 2000 (8.2 per cent) and 2008 (3.2 per cent) (UN, 2010b). In 42 of the 49 least developed countries,
donor funding for reproductive health per woman has dropped by more than 50 per cent since the mid‐1990s,
leading to shortages in supplies and services (UNDESA, 2010).
Global life expectancy at birth is projected to increase from 68 years in 2050–10 to 76 years in 2045–50. A
considerable gap will still remain in 2050 between the life expectancy in more developed regions (82.7 years) and less
developed ones (74.4 years). The least developed countries, including the 27 highly affected by HIV/AIDS, are
experiencing higher mortality rates, and their life expectancy is expected to remain low, at 69 years in 2045–50
(compared with 57 years in 2005–10). Key childhood health interventions such as in malaria and HIV control and
measles immunizations have led to a decrease in child deaths from 12.5 million in 1990 to 8.8 million in 2008. This is
still not enough, however, to meet the MDG target of reducing the 1990 under‐five child mortality rate by two‐thirds
by 2015 (UN, 2010b).
Many issues affecting life expectancy at birth are related to access to safe drinking water and sanitation.
Lack of safe drinking water, sanitation and proper hygiene directly affects the development of infectious diseases,
including diarrhoea, schistosomiasis and malaria (Rosegrant et al., 2010). Malnutrition is caused both by reduced food
production due to water shortages and by a lack of access to safe drinking water, particularly in sub‐Saharan Africa
(Rosegrant et al., 2010). Access to safe drinking water is thus important in preventing childhood malnutrition in
particular (WHO, 2008, cited in Rosegrant et al., 2010). Half of all childhood deaths in sub‐Saharan Africa are
associated with being underweight, and the children who do survive have a higher probability of suffering from

Global Drivers of Change 26
chronic illness and disability and of reduced physical and intellectual productivity (Pelleter et al., 2004, cited in Ringler
et al., 2010).
According to the World Health Organization, half of the hospital patients in the developing world are
suffering from poor sanitation and diseases associated with water (WHO, 2010b). These include, according to Gleick
(2002):
• waterborne diseases caused by the ingestion of water contaminated by human or animal faeces or urine
containing pathogenic bacteria or viruses; includes cholera, typhoid, amoebic and bacillary dysentery and
other diarrhoeal diseases
• water‐washed diseases caused by poor personal hygiene and skin or eye contact with contaminated water;
includes scabies, trachoma and flea, lice and tick‐borne diseases
• water‐based diseases caused by parasites found in intermediate organisms living in contaminated water;
includes dracunculiasis, schistosomiasis and other helminths
• water‐related diseases caused by insect vectors, especially mosquitoes, that breed in water; includes
dengue, filariasis, malaria, onchocerciasis, trypanosomiasis and yellow fever
Malaria is a risk for 50 per cent of the world’s population. In 2008, it was estimated that there were 243
million cases, leading to 863,000 deaths, 89 per cent of which were in Africa. Greater increases in funding (from less
than US$100 million in 2003 to US$1.5 billion in 2009) and attention towards malaria as well as more effective
intervention strategies such as artemisinin‐based therapies have shown results. Funding is still far short, however, of
the US$6 billion needed in 2010 alone globally for global malaria control (UN, 2010b).
A final aspect of population dynamics that is leading to increased pressures on freshwater resources
through increased need for water and increased pollution is migration (WWAP, 2009b, p. 45). The number of
migrants worldwide is now estimated at 192 million, up from 176 million in 2000 (WWAP, 2009c, p. 3). Eighteen of
the world’s 27 megacities – those with at least 10 million people – are in coastal areas, which are considered to be
facing the most significant migration pressures (WWAP, 2009c, p. 3).
Nearly 43 million people were displaced as of the end of 2010 because of conflict and persecution. This
represents about half a million more than in 2009 and is the highest number since the mid‐1990s. Some 15.4
million of these are refugees, including 4.8 million people from Palestine (UN, 2001, p. 15). Excluding the Palestinian
refugees, who are under the mandate of the United Nations Relief and Works Agency, it has been estimated that 7.2
million refugees spread across 24 countries are confined to camps and other settlements for many years with no
solution in sight – the highest number since 2001 (UN, 2011a, p. 15).
Climate change may have a significant impact on these numbers in the future, since a 10 meter rise in sea
level could displace more than 600 million people (Speidel et al., 2009). The overall number of people vulnerable to

Global Drivers of Change 27
flood disasters worldwide is expected to increase to 2 billion by 2050 as a result of climate change, deforestation,
rising sea levels and population growth in flood‐prone lands (Adikari and Yoshitani, 2009).
2.7 Economy and security
Economy
The gross world product is expected to grow about 4.5 per cent in 2011 and 2012, with advanced economies
expected to expand by about 2.5 per cent and emerging and developing economies by 6.5 per cent (IMF, 2011, p.
xvii). This variation in growth is a reflection of the shift to come in the core balance of economic power, with Brazil,
China, India and the Russian Federation, based on a Goldman Sachs forecast, expected to overtake the combined
economic strength of the Group of Eight (G‐8) by 2032 (WWAP, 2009b, p. xx). The current focus in these emerging
economies is on ensuring that robust demand will not lead to overheating (IMF, 2011, p. xvii).
In advanced economies, concerns that the post‐crisis diminishment of fiscal policy from public to private
might induce a ‘double‐dip’ recession are waning, even if financial conditions are still unusually fragile. The financial
consolidations and entitlement reforms that would place fiscal positions on sustainable medium‐term paths have yet
to be fully addressed (IMF, 2011, p. xvii).
Developing economies are witnessing fast and sustainable growth (IMF, 2011, p. xvii). It is considered that
there is sufficient momentum to sustain the progress needed to reach the MDG global target of halving, between
1990 and 2015, the proportion of people whose income is less than US$1 a day (UN, 2011a, p. 6), even if rising food
and commodity prices are a growing concern and a source of tension (IMF, 2011, p. xvii).
For many, economic globalization was supposed to be beneficial for all – with higher standards of living and
greater access to economic opportunities (Stiglitz, 2007, p. 4). In fact, there are increasing concerns over the
corporate and financial stronghold that has defined the globalization agenda to date – such domination can lead to
corporations setting the rules and ultimately controlling even seeds and water (Faruqui, 2003). Concerns over
industry concentration and corruption have been considered legitimate, and this is true in the water sector as well,
where the two largest water firms control 70 per cent of the international private market (Faruqui, 2003).
World energy demand is projected to continue increasing through 2035, albeit limited to an increase of 36
per cent by then if the recent government commitments in Copenhagen are acted upon. In this scenario, non‐OECD
countries – led by China, where demand would surge by 75 per cent – would account for almost all the increase (IEA,
2010b). Oil would continue to be the dominant fuel source in the energy mix – although with a diminished share – as
natural gas increases 44 per cent and nuclear power 2 per cent (IEA, 2010a).

Global Drivers of Change 28
The scenario also projects a fourfold increase in biofuels (IEA, 2010a), with potentially important impacts on
water quality and availability (WWAP, 2009c, p. 1). Although assessing the impact of bioenergy production is
particularly complex, it is estimated to have caused 70–75 per cent of the rise in the global prices of some food stocks,
including about 70 per cent of the increase in maize prices (WWAP, 2009c, p. 5).
At the same time, vast amounts of energy are needed for water extraction, treatment and distribution.
Research indicates that the most water‐efficient energy sources are natural gas and synthetic fuels obtained through
coal gasification techniques; geothermal and hydroelectric are more efficient than nuclear power plants, while
ethanol and biodiesel are the least water‐efficient (Younos et al., 2009).
Economic development without sustainable management practices for limiting the impact of wasteful
consumption and unsustainable resource use has had a devastating impact on the world’s ecosystems and water
resources; it has been estimated that we would need about three planet earths to sustain a global population
achieving the current lifestyle of the average European or North American (Wacknagel and Rees, 1996). The value of
ecosystem services is estimated at double the gross world product, with the role of freshwater ecosystems in
purifying water and assimilating wastes evaluated to more than US$400 billion (UN, 2010c).
Improving infrastructure and transforming wastewater from a major health and environmental hazard into
a resource of fresh water is an emerging key challenge (UNEP, 2010c). It is also an economic opportunity for the next
few decades (UNEP, 2010c) , since investments in safe drinking water and sanitation benefit economic growth. The
World Health Organization has estimated a return of between US$3 and US$34 for each US$1 invested in these
improvements, depending on the region and the technology (WWAP, 2009c, p. 3). Lack of investment, on the other
hand, translates into economic loss. Lack of access to safe water and basic sanitation in Africa has been estimated to
cost the region US$28.4 billion a year, or about 5 per cent of its gross domestic product (GDP) (WWAP, 2009c, p. 3).
Although the growth of international trade has aggravated water stress in some countries, it has reduced it in
others through flows of ‘virtual water’ – water embedded in products and used in their production, particularly in the
form of imported agricultural commodities (WWAP, 2009b, p. xx).The global volume of virtual water flows in
commodities is 1,625 billion cubic metres a year, accounting for about 40 per cent of total water consumption. About
80 per cent of these virtual water flows relate to agricultural products trade and the remainder to industrial products
trade (WWAP, 2009c, p. 4).
Pressure is also increasing for bulk water exports, which already exist on a small scale – current trade
agreements such as the North American Free Trade Agreement (NAFTA) and the World Trade Organization restrict
the use of the precautionary principle (Faruqui, 2003). Thus, under existing international trade rules, if the Canadian
government proposed an outright ban on bulk water export for environmental reasons, it risks a trade challenge from
the other NAFTA signatories (Grant, 2008).
Climate change mitigation and adaptation preparedness is also becoming an increasingly important
economic factor. Between 2000 and 2006, water‐related disasters around the world reportedly affected over 1.5
Global Drivers of Change 29
billion people, killed more than 290,000 people and caused over US$422 billion in damages (Adikari and Yoshitani,
2009). Looking to the future, by 2050 extreme weather could reduce the gross world product by 1 per cent, and
climate change would have a yearly global economic cost of at least 5 per cent, according to the Stern Review of
(Stern, 2006). This cost could increase to more than 20 per cent should more‐extreme climate scenarios occur
(WWAP, 2009c, p. 6). Although climate change affects the entire planet, the poor are the most affected, often losing
livelihoods, while not having the economic possibilities to plan for alternative solutions (UNFCCC, 2010).
Over the next decade, ‘business interruption insurance coverage’ for climate change–related events will
become routine and a decisive factor for companies – both business and insurance – for continuing activity (CFR,
2006).
Businesses, communities and governments around the world will need adaptation plans to increase resilience
against the damages caused by climate change as well as to reduce the long‐term costs of climate‐related impacts
(Pew Centers, n.d.). Additional investments to adapt to climate change in developing countries were estimated by the
secretariat of the United Nations Framework Convention on Climate Change to range between US$28 billion and
US$67 billion a year and as high as US$100 billion a year several decades from now (WWAP, 2009c, p. 6). New
investments for water supply infrastructure in particular in 2030 have been estimated at US$11 billion, 85 per cent of
which would be needed in developing countries (WWAP, 2009c, p. 6).
One avenue for reconciling economic development with equity and sustainability is through the creation of
‘ethical markets’, based on socially responsible investing (Henderson, 2007). A ‘green economy’ has the potential to
create millions of jobs, greatly needed for the 500 million young people who will be entering the global workforce
over the next 10 years (UNEP, 2008). There are, however, concerns that the new concept of a green economy could
also be a path in which protectionist trends could be reinforced, with further exacerbation of international
inequalities (UNCSD, 2011).
New indicators for measuring sustainable economic progress, which would value uncompensated services
and goods as well as the value and deterioration of ecosystems, include the Calvert‐Henderson Quality‐of‐Life
Indicators (Calvert‐Henderson, n.d.), the Happy Planet Index (NEF, n.d.), the Genuine Progress Indicator (Pembina
Institute, n.d.), the Global Footprint (Global Footprint Network, n.d.) and the State of the Future Index (Millennium
Project, n.d.).
Security
More than 1.5 billion people live in countries affected by repeated cycles of political and criminal violence (World
Bank, 2011). A shift has occurred from traditional security threats based on conventional war between and within
countries to concerns over organized crime, trafficking, civil unrest and terrorism (World Bank, 2011).
In addition:

Global Drivers of Change 30
• Conflicts are not isolated events – over the last decade 90 per cent of civil wars took place in countries that
had already known a civil war in the last 30 years.
• New forms of conflict can occur even after previous conflicts are solved – countries such as El Salvador and
Guatemala negotiated successful political and peace agreements after violent political conflicts but are now
dealing with high levels of violent crime.
• Different forms of violence are linked to each other, such as organized crime and political violence;
international ideological movements can make inroads using local grievances.
• When social, economic or political change lags behind expectations, grievances can transform into pressing
demands for change, escalating the risks for violent conflict (World Bank, 2011, pp. 4 and 5).
The impacts are also felt outside of the conflict’s geographical borders:
• It is estimated that Tanzania loses 0.7 per cent of its GDP annually for each neighbour in conflict.
• The number of refugees and internally displaced persons has tripled in the last 30 years.
• Neighbouring countries host close to 75 per cent of the world’s refugees.
• In a study of 18 West European countries, each transnational terrorist incident reduced the country’s
economic growth by an additional 0.4 per cent annually – even considering that more than 80 per cent of
fatalities from terrorist attacks over the last decade were in non‐Western targets (World Bank, 2011, p. 5).
Factors related to natural resources and/or environmental degradation have led to at least 18 violent
conflicts since 1990. Over 40 per cent of intra‐state wars are linked to the exploitation of natural resources (UNEP,
2009).
Water and food scarcity are likely to further weaken already failing governments, fostering the conditions
for internal conflicts, extremism and movement toward increased authoritarianism and radical ideologies (CNA
Corporation, 2007) . A study of rainfall shocks in sub‐Saharan Africa noted that there is an increased likelihood of civil
conflict following years of poor rainfall (World Bank, 2011). In Afghanistan, military observers report that poverty
induced by water scarcity increases conflict: since the opium poppy is a drought‐resistant plant, it is easier for poor
farmers to cultivate it in the dry areas, consequently supporting the illegal heroin trade and local warlords (Rollins et
al., 2010).
Of the top 20 failing states, 17 have high population growth rates and almost half depend on UN food aid
(Brown, 2009). In fact, not one of the countries considered to be low‐income fragile or conflict‐affected has yet to
achieve any of the MDGs (World Bank, 2011). A child in a fragile or conflict‐affected state has twice the likelihood of
lacking access to improved water as a child in another developing country (World Bank, 2011, p. 62).

Global Drivers of Change 31
Climate change will only continue to exacerbate these threats, as noted in United Nations Security Council
Presidential Statement of July 2011 (UN, 2011b) : ‘The Security Council expresses its concern that possible adverse
effects of climate change may, in the long run, aggravate certain existing threats to international peace and security.’
Although in recent years water resources were more likely to be an instrument of multinational cooperation
for regional peace than something that triggers violent conflict (Wolf et al., 2006), some observers warn that more
than 50 countries around the world might face water disputes unless adequate measures are soon taken to improve
water management (Global Policy Forum, n.d.). Strengthening the legitimacy of institutions and governance will also
be critical to break the cycles of conflict by providing security, justice and employment to citizens (World Bank, 2011,
p. 2).
2.8 Governance and institutions
Water governance operates within a set of policy and legal frameworks at the local/national, regional transboundary
and global levels that must all support sound management goals (WWAP, 2009b, p. 49).
Generally speaking, at all levels of governance both bottom‐up contributions by water users and top‐down
interventions and commitment by government should be mutually reinforcing and are essential for the success of
water sector reforms (Luzi, 2010). The principles of integrated water resources management – which seeks to
coordinate the management of water, land and related resources in a way that equitably balances economic and
social welfare while ensuring the sustainability of vital ecosystems and the environment – can also contribute to
water sector reforms and sustainability (Global Water Partnership, 2009).
The allocation of shared water resources and their benefits is not yet governed by internationally accepted
and adopted criteria. At the international level, water rights allocation factors can include international treaties,
customary law (based either on hydrography – i.e. from where a river or aquifer originates and the amount of that
territory that falls within a certain state – or on chronology – i.e. who has been using the water the longest) and
economics (valuing from a social planning perspective or market‐based approach among competing users).8
Local, subnational and national
In many parts of the world, the foundations for water security – which, according to the United Nations Committee
on Economic, Social and Cultural Rights, include the provision of sufficient, safe, acceptable physically accessible and
affordable water for domestic use – are widely absent (UNDP, 2006, p. 9). However, recognition is progressing, as
more than 90 countries have included a right to water in their constitutions or have framed the right explicitly or
implicitly within national legislation (UNDP, 2006, p. 63). Despite the depth of institutional rules and norms, equity in
8 The 1997 Convention on the Law of the Non‐Navigational Uses of International Watercourses, which has yet to enter into force, does
provide a framework, even if it does not offer the specificity necessary for unequivocal allocations (Wolf, 1999).

Global Drivers of Change 32
water use has been difficult to protect – an outcome that should figure prominently in any public policy debate
(UNDP, 2006, p. 180).
Regulations, when poorly designed, can be disproportionately burdensome in relation to the policy goal they
intend to underpin: in Nepal, for example, hydropower developers have to deal with 32 types of acts during project
development (Gangol, 2009, pp. 71–72). The larger problem in developing countries lies in the implementation and
enforcement of policies, mainly due to the lack of government capabilities, intention and commitment and the
scarcity of financial and skilled human resources (Seppala, 2002). Water allocation priority does not always reflect
economic development priority: in Bangladesh, the National Water Policy gives irrigation a relatively low priority, yet
rice cultivation is the single most important activity in the economy (Chowdhury, 2010).
Some jurisdictions have elaborated long‐term water management plans, such as the Valley of Mexico Water
Resources Sustainability Program, which provides for the construction of water treatment plants in the Valley of
Mexico to treat 100 per cent of the wastewaters of municipalities by 2020 (CONAGUA, n.d.) and Bangladesh’s
National Water Management Plan for the period up to 2025 (Chowdhury, 2010).
Customary law, which often involves tight controls on water use, with structured water rights balancing
claims based on inheritance, social need and sustainability, can enhance governance. However, customary law is not
in itself a guarantee of equity – customary landholders often use their position in the community to circumvent
formal rules and perpetuate their privileged access to land (UNDP, 2006, p. 185).
Several recent and varied approaches to the challenges of water governance around the world have been
deemed successful:
• Decentralization and democratization have occurred in Ceará Brazil. An assembly of 180 user groups
consisting of industry, commercial farmers and rural labour unions and cooperatives elects a committee of
representatives for oversight, has an independent technical advisory body and has a publicly owned river
basin agency (UNDP, 2006, pp. 154–55).
• In Peru and Bolivia, a demand‐driven, community management model, coupled with access to spare parts
and some technical expertise, has come a long way towards unravelling the puzzle of how best to design and
implement rural water supply programs in developing countries (Whittington et al., 2009).
• In Sukhomajri, India, solving issues of downstream water quality and the silting up of the lake supplying water
to the city of Chandigarh demanded an approach that went beyond a traditional, narrower concept of water
resources management. The solution included taking into consideration land management practices in the
denuded hillsides upstream and supplying irrigation to the farmers trying to subsist there (Global Water
Partnership, 2009).
• In Europe, the European Union (EU) Water Framework Directive (WFD) represents a new vision and approach
for the management of water resources that seeks to protect and restore the ecological and physical

Global Drivers of Change 33
functions of water bodies as well as their overall quality. Article 14 of the WFD calls for publicly available
information about the status of water as well as consultation and public engagement in the process of
identifying and implementing appropriate actions (Watson et al., 2009).
Corruption is a major challenge to water governance, is not exclusive to any particular type of government
and can be found at every point along the water delivery chain (UNDP, 2006). It is estimated to increase the cost of
achieving the MDG on water and sanitation by US$48 billion (Transparency International, 2011, p. 285). Lack of
accountability and corruption harm the poor in particular by favouring people with political connections and those
who can pay money for bribes (UNDP, 2006, p. 189).
Regional transboundary
Transboundary waters are those physically shared between two or more countries. Transboundary water
management can raise important practical and political issues (Loures et al., 2010). Some scholars suggest that
conflict is likely when states construct hydrological infrastructure without proper coordination and consultation. Such
coordination and cooperation is likely on issues of joint management, quality and economic development (Yoffe et al.,
2003).
There are 276 international basins, representing 60 per cent of global river flows. These basins serve 40 per
cent of the world’s population and cross the territories of 145 countries (Loures et al., 2010). In these basins,
unilateral development measures that have transboundary impacts in neighbouring countries or that foreclose the
right of other riparians to gain access to their fair share of the water source may lead to interstate conflict,
environmental degradation and sub‐optimal water management and development. It is thus crucial that countries
cooperate on the sustainable and equitable management of transboundary waters within the framework of adequate
governance mechanisms (Loures et al., 2010).
Joint bodies and river basin organizations have increasingly been evolving governance mechanisms to meet
regional needs, resulting in nested governance arrangements (Tarlock and Wouters, 2009). There are 300
international freshwater agreements (UNEP, 2002); more than 200 of these are treaties signed in the last 50 years
(Wolf et al., 2003). Few transboundary aquifer systems are covered by an international agreement specifically
designed to deal with groundwater, and only 36 transboundary aquifer systems located within river basins have
treaties containing specific provisions for groundwater, making the development of innovative institutions to govern
these commonly held resources paramount (Lopez‐Gunn and Jarvis, 2009).
Thus with only 40 per cent of the world’s international watercourses governed by cooperative management
frameworks, the majority of the transboundary water resources in the world have insufficient legal protection. Even
when a management agreement is in place, it may be only partial or inadequate, and all states in the basin may not
be party to the existing agreement (Loures et al., 2010).

Global Drivers of Change 34
Thirty years of rigorous study, codification and progressive development by international bodies such as the
UN International Law Commission led to the adoption in 1997 of the UN Watercourses Convention. The framework is
founded on the notions of equity, reasonableness and full participation of watercourse states. It clearly defines the
right of all riparian states to an equitable and reasonable use of shared waters, including an obligation to manage the
resource cooperatively and comprehensively. For example, it requires mandatory disclosure in order that all riparian
states have the necessary information to establish what is an equitable share of the resource (Tarlock and Wouters,
2009). The Convention requires 35 ratifications to enter into force, yet as of July 2011 only 24 countries have ratified
it, although the process has gained momentum in recent years (UN, 2011c).
In an attempt to foresee the impacts of climate change, it has been proposed that attention and support be
offered to subregions with fragile riparian states. Agreements could be shifted from precise volumes to percentages
(given the potential for reduced flow), and benefit‐sharing agreements from expanded basin development could be
designed to benefit all riparians. The existence of cross‐border or subregional water management agreements could
allay regional tensions whether flow rates actually diminish or not (World Bank, 2011).
Other global cooperation and global policy initiatives
International conventions and multilateral agreements related to water management include the following:
• the Convention on Wetlands of International Importance, called the Ramsar Convention, an
intergovernmental treaty that provides the framework for national action and international cooperation for
the conservation and wise use of wetlands and their resources (Ramsar Convention, n.d.)
• the United Nations Framework Convention on Climate Change and the Kyoto Protocol, an international and
legally binding agreement to reduce greenhouse gas emissions worldwide (UNFCCC, n.d.)
• the United Nations Convention to Combat Desertification (UNCCD, n.d.a)
• the Convention on Biological Diversity, addressing all aspects of biological diversity: genetic resources,
species and ecosystems (UNCBD, n.d.)
As presented in the UN Secretary General’s Report: ‘The adoption of the Millennium Declaration in 2000 by
189 States Members of the United Nations, 147 of which were represented by their Head of State, was a defining
moment for global cooperation in the twenty‐first century. The Declaration captured previously agreed goals on
international development, and gave birth to the concrete and measurable development objectives known as the
MDGs. Spurred by the Declaration, leaders from both developed and developing countries committed to achieve
these interwoven goals by 2015’ (United Nations, 2010a).
The beginning of the Millennium was also critical with regards to the culmination of international
cooperation efforts in the water domain specifically, as described by Wouters et al. (2009, p. 103):
Global Drivers of Change 35
At the second World Water Forum convened at The Hague in March 2000, the Ministerial Declaration entitled
‘Water Security in the Twenty‐First Century’ listed seven ‘main challenges’ to achieving water security: (1)
meeting basic needs; (2) securing food supply; (3) protecting ecosystems; (4) sharing water resources; (5)
managing risks; (6) valuing water; and (7) governing water wisely. This declaration was the first inter‐
governmental, high‐level pronouncement on the term ‘water security,’ and it builds on a large number of
global water initiatives, beginning with the 1977 Mar Del Plata conference and including, inter alia, the 1992
Dublin Principles, Chapter 18 of Agenda 21, the World Summit on Sustainable Development, the Millennium
Development Goals, and the ongoing World Water Forums convened by the World Water Council. In fact, the
global focus on water continues to grow, with the United Nations having some twenty‐four agencies involved
with water‐related issues, a newly created UN‐Water, and the leadership of several non‐governmental
organizations, including the World Economic Forum and the Global Water Partnership.
The most recent developments include the July 2010 United Nations General Assembly adoption of a
resolution recognizing ‘the right to safe and clean drinking water and sanitation as a human right that is essential for
the full enjoyment of life and all human rights’ (UNGA, 2010a). In September 2010 the Human Rights Council affirmed
this recognition and clarified that the right is derived from the right to an adequate standard of living (UNGA, 2010b).
In March 2011, the Council extended the mandate of the Independent Expert on the issue of human rights obligations
related to access to safe drinking water and sanitation and changed its title to Special Rapporteur on the human right
to safe drinking water and sanitation (UNGA, 2011; UNOHCHR, n.d.).
2.9 Politics
Group – or political – decision‐making involves filtering information through individual and group priorities,
experiences, worldviews and cultural archetypes (Glenn et al., 2008a, p. 49; Holland et al., 1989, p. 16) – with the re‐
filtering based on tacit or explicit decision‐making criteria (Glenn et al., 2008a, p. 49; Saint‐Onge and Armstrong,
2004; see also Saint‐Onge, 2004).
A major challenge to sustainable decision‐making is when society maintains its focus on the most
immediate, visible, short‐term needs (Dahle, 1999, pp. 46, 50). It is easy to name a few of the usual systematic
impediments to anticipating warning signals and taking corrective action: pressure for action coming from opposition
leaders, lobbies and 24‐hour media and politicians wanting to show tangible quick results on issues in view of an
upcoming election (Chi, 2008, p. 10).
Issues that can seem critical to political survival (and thus put at the forefront for discussion) are not
necessarily those that are objectively the most important (Mackie and Hogwood, 1984, p. 305). Some politicians will
defer paying ‘political prices’ for as long as possible. In the case of water systems, the price of implementing
economically and environmentally sound policies may be so extreme that they might involve the loss of political

Global Drivers of Change 36
power. Inordinate political courage may be required of a political leader in a country that has always believed itself to
be ‘water secure’ to take required water‐related decisions (Allan, 2001).
Chronic water scarcity triggers the interaction of old ethnic and religious conflicts, civil unrest, terrorism and
crime (Ohlsson, 1995, p. 23) and it weakens the political legitimacy of governments, leading to social instability and
possibly to failed states (Solomon, 2010, p. 371). Climate‐induced hunger has caused ancient civilizations to collapse
(Fagan, 2009, p. 298). Social instability and violence are already prevalent in the most water‐deprived regions, in
countries such as Chad, Sudan, Somalia, Yemen, Iraq and Afghanistan (humanitarian crises, epidemics, corruption,
failed states) – this happens to be where 20 per cent of humanity lacks access to sufficient clean fresh water for
consumption and 40 per cent lack access to adequate sanitation (Solomon, 2010, p. 4).
Participatory processes are evolving. Public participation, including in a transboundary context, is critical to
mediate between competing interests with regards to water, to understand local customs and values, customary law
and water management practices and to learn other ways in which humans relate to water (Cosgrove, 2010; Sule,
2005).
Democracies that arise without prior economic development – sometimes because they are imposed by
former colonial powers or international organizations – tend not to last (Barro, 1999). Democracy has been found to
be empirically positively related to an improved standard of living (per capita GDP), the importance of the middle
class, and primary school attainment; a gap between male and female primary schooling has been found to have a
negative correlation (Barro, 1999).
Through their participation, women can play a crucial role in political reform, broadening initial coalitions
and representing the needs of wider groups of citizens. The Wunlit tribal summit in 1999, which led to the end of
hostilities between the Dinka and Nuer peoples, was organized by southern Sudanese women in the New Sudan
Council of Churches. The Wunlit Covenant led to agreements on water, fishing and grazing land‐sharing rights, which
had been central points of disagreement (World Bank, 2011).
The global share of women in parliaments reached an all‐time high of 19 per cent in 2010 – a gain of 67 per
cent since 1995, when 11 per cent of parliamentarians worldwide were women (UN, 2010b, p. 25). The presence of
women in the executive branches of government is progressing more slowly: on average, women hold 16 per cent of
ministerial posts, and only 30 countries have more than 30 per cent women ministers (UN, 2010b, p. 25). Quota
arrangements and other affirmative action measures taken by political parties continue to be key predictors of
progress for women, as is the system of proportional representation (rather than majority/plurality systems) (UN,
2010b, p. 25).
Over 2.3 billion people live in societies where fundamental political rights and civil liberties are not respected
(Freedom House, n.d.). Only one in six people live in countries with a free press, and the numbers are generally in
decline (Freedom House, n.d.).

Global Drivers of Change 37
Yet the free flow of communication is key to democracy’s survival in a context of globalization. The speed
and scale at which decisions must now be made have surpassed the capacity of purely electoral systems to manage
effectively (Florini, 2003, p. 16). Some observers suggest we are in the midst of a transition to the planetary phase of
civilization, where emerging political, economic and communications features are, respectively, global governance,
globalization of the world economy and the information revolution (Raskin et al., 2002, p. 50).
Communications and information can facilitate improved decision‐making. Cloud computing, knowledge
visualization and a variety of decision support software are increasingly available at falling prices. Vast peer‐reviewed
data banks are being interconnected so that composites of data from many sources can present the best facts
available for a given decision. Such systems can foster collective intelligence and an emergent new capacity in
decision‐making (Glenn et al., 2010, p. 28). There are an increasing number of international, transinstitutional large
scientific research projects such as the International Geosphere–Biosphere Programme (IGBP, n.d.) and the
International Human Dimensions Programme on Global Environmental Change (IHDP, n.d.).
Another aspect of global cooperation is official development assistance. Donors at the Gleneagles G‐8
Summit and the UN World Summit in 2005 made a commitment to an increase in ODA. Based on expectations of
future incomes, these pledges – combined with other commitments – would have lifted total ODA from US$80 billion
in 2004 to US$130 billion in 2010 (at constant 2004 prices). To fill the growing financing gaps in developing countries,
G‐20 leaders agreed on April 2, 2009 to support a tripling of resources for the International Monetary Fund (IMF) to
US$750 billion. They also supported an increase in multilateral development bank lending of US$100 billion to a total
of US$300 billion over the next three years (World Bank, 2009).
However, the economic slowdown put pressure on government budgets in developed countries, and the
World Bank/IMF Global Monitoring Report 2009 stated that the global financial crisis was imperilling attainment of
the 2015 MDGs and creating an emergency for development (World Bank, 2009). While the majority of the initial
commitments remained in force, some large donors reduced or postponed the pledges they made for 2010. Only five
donor countries reached the UN target for official aid in 2009 (UN, 2010b, pp. 66–67). An unintentional effect of the
multilateral campaign for clean drinking and sanitary water has been to divert increased investment away from also
badly needed food production infrastructure (Solomon, 2010, p. 485). The Paris Declaration (2005) and the Accra
Agenda for Action (2008) were adopted with the intent to improve aid effectiveness (OECD, n.d.).
There has been a shift in world economic and political influence. The USA, the world’s largest debtor,
controls 17 per cent of the votes at the IMF, while China, the world’s largest creditor (and now the second largest
economy), controls only 3.66 per cent (Henderson, 2009). Emerging countries now trade more between each other
than with developed countries. Thus in 2009 China became Brazil’s leading customer, purchasing more than 15 per
cent of all Brazilian exports – ahead of the United States (almost 11 per cent) (Santiso, 2010). This may have an impact
on development policy: at the UN Security Council, in the past China along with Russia has resisted expanding the
Western doctrine of humanitarian intervention (Bosco, 2009, p. 254).

Global Drivers of Change 38
Many multinational bodies have been increasingly active for over a decade. The role of North Atlantic Treaty
Organization in the Balkans, the EU force that deployed in eastern Congo in 2003, the Organization for Security and
Cooperation in Europe, the G‐8 on MDGs, the role of the Economic Community of West African States in Sierra Leone,
the African Union created in 2002, the New Partnership for Africa’s Development (which seeks to create continent‐
wide standards for economic and political reform) and the Organization of American States are among them (Traub,
2006, p. 403).
Foresight has been suggested as a key to improving political decision‐making capacity, since it can offer an
improved understanding of change, opportunities, challenges and perspectives; it can present an opportunity to build
common ground through an exchange of knowledge and information; and it can support participatory political
decision‐making (Chi, 1991, p. 47; Desruelle, 2008, slide 14).
For example, Florida’s Century Commission held a Congress on the Future of Water in 2008, leading to
unanimous recommendations on reinstating state funding mechanisms for alternative water supply development and
water quality improvement, developing regional partnerships and cooperative approaches and facilitating legal and
financial statutes to allow for the adoption of water conservation best practices (Collins Center for Public Policy,
2008).
However, liberal democracy should not be seen as automatically a necessary precursor to future‐generations‐
oriented political systems (Inayatullah, 1999, p. 117).
The lack of foresight in government processes is clearly reflected, for example, in the gaps between current
infrastructure needs and investment levels. Globally, the World Water Vision estimated annual investment
requirements at US$180 billion a year for 25 years, for a total of US$4.5 trillion. Current levels of investment were
evaluated in the World Water Vision as being around US$70–80 billion a year, with the traditional public sector
contributing about US$50 billion a year (Cosgrove and Rijsberman, 2000). As another example, the rates at which
groundwater is withdrawn exceed the rates at which nature replenishes the stocks in many areas and countries
(Sahagian et al., 1994).
2.10 Ethics, society and culture
Ethical, social and cultural drivers are at the heart of the human family’s interaction with the natural environment.
They consist of human beliefs, values, thoughts, perceptions, knowledge, decisions, behaviours and demands on and
use of water.
Ethical behaviour presumes a moral society in which the ‘haves’ and the ‘have nots’ have equality in
opportunity. Ethical issues appear at many places in the complex global water system and are woven through its
interconnected elements, as well as in other systems such as food production, energy, politics, economy, industry,
climate, ecology and sociocultural aspects (Holling et al., 2002).
Global Drivers of Change 39
Culture can be viewed as a system of symbolic meanings and beliefs, of explicit values and implicit codes,
which structure the world and give us a way of orienting ourselves within it. Culture is adaptive and evolves as it
interacts with other determinants of social perception and action (Cocks, 2003; Sen, 2009). Over the past three
decades in particular, rapid advances in travel, information and communications technologies have facilitated these
interactions, exposing once‐remote peoples to new cultural influences that are disturbing patterns of behaviour that
historically might have taken several generations to change (Cocks, 2003; Galtung, 2004; Huntington, 1996;
Skrzeszewski, 2002; Triandis, 2009).
Prominent intercultural scholars concur that the relationship to nature, and therefore water, is one of the
key dimensions of culture in which there are considerable differences in beliefs and values (Hall and Hall, 1990;
Hofstede, 1980; Kluckholn and Strodbeck, 1961; Trompenaars and Hampden‐Turner, 2001). In some cultures water is
a highly valued spiritual element, symbolizing purity, life and renewal and strongly associated with identity and place
(CAN WA, 2009; Ingram et al., 2008) while in other cultures water is perceived as an endless resource or a commodity
that can be bought and sold (Narain, n.d.). This diversity of uses for water as well as of values and beliefs associated
with it in various parts of the world suggests the potential for an exacerbation of water conflicts in the near future as
water scarcity becomes more widespread (WWAP, 2006).
Water plays an essential role in helping to eradicate poverty, especially in the 50 least developed countries,
34 of which are in Africa (Marks, 2007). With greater climate variability, the rising demand for water for agriculture
and other uses is likely to deepen current inequalities in access to water to the detriment of the poor, particularly
women and marginal groups (Komnenic et al., 2009; Mayers et al., 2009). If equitable social transformation does not
occur, many will continue to be excluded from the mainstream economy and marginalized, leading to increased social
tensions (Raskin et al., 2002).
A rights‐based approach to community development, as distinct from an aid‐based approach, educates
people about their rights and entitlements and empowers them to achieve those rights. Rights‐based development
includes accountability, empowerment, participation, non‐discrimination and attention to vulnerable groups.9 If
people are to assume responsibilities that come with rights to water, they will need access to detailed knowledge of
its distribution, availability, variability, environmental contribution and current and possible future uses as well as
information on the impacts of human actions on water’s quantity and quality (Marks, 2007, p. 189).
Public participation, supported by adequate policies and mechanisms that enable access to information and
justice, is critical to understanding local customs and water management practices and to learn other ways in which
humans relate to water. Public participation is a growing trend in Western cultures, a social norm in many indigenous
societies and an aspiration in non‐democratic nations (Cosgrove, 2010; Sule, 2005; UNDP, 2007).
9 See http://hrbaportal.org/?page_id=2127.
Global Drivers of Change 40
In India communities have shown that they can be effective implementers of water and sanitation programs
and have contributed to reducing costs by up to 20 per cent of what the programs would have cost if run by the
government alone (Ghosh, 2007). The Royal Thai Government has incorporated integrated water resources
management into its national policy by giving priority to people’s participation in identifying problems, policy‐making,
planning and implementation (Marks, 2007, p. 165). Despite these positive developments and an array of
international statements recognizing the need for public participation in water resource decisions and management –
from the 1992 Agenda 21 to the 2002 World Summit on Sustainable Development – the translation of commitment
into practice still lacks substantial understanding of local contexts and complex relationships between different
stakeholders (Ahmed, 2006).
Ethical debate is now further complicated by the inclusion of the rights of future generations and other life
forms (Shiva, 2009). From the perspectives of intergenerational equity and living non‐human consumers of water,
some commentators are asking how much water is needed for other species of the planet and what must be
conserved for future generations (Marks, 2007).
According to some, signals are appearing of an emerging global consciousness and growing awareness of the
interconnectedness of living systems: a reawakening to the knowledge that we are an integral part of nature (Capra,
2002; Cosgrove, 2010; Hunt, 2004; Shiva, 2002; Suzuki and Dressel, 1999). The beginnings of a global civil society hold
the promise of a strong social platform to counterbalance the historical dominance of political and economic systems
of governance and to effect the transformation required for human survival in the twenty‐first century (Baker and
Chandler, 2005; Bennis, 2006; Eisler, 1991; Gidley, 2007; Kaldoor, 2003; Kelleher, 2009; Laszlo, 2008; Risse et al.,
1999; Sandel, 1996).
One of the primary challenges in raising global awareness is that water, as an issue, is in certain respects
not a global problem. It is a series of local and regional challenges complicated by multiple, interdependent issues. It
will be very difficult to address these myriad issues without people understanding this global water web (I.B.M.
Corporation, 2009).
Storytelling is one of the few human traits that are universal across cultures and throughout history (Hsu,
2008). It also has the ability to influence our beliefs and decisions. The re‐emergence of storytelling as an art, a means
of communication and a potential means for societal transformation is being realized in developed nations,
corporations and governments and has the potential to reawaken human water consciousness (Eisler, 1995;
Inayatullah, 2002; Kelleher, 2010; Snowden, 2005; Wheatley, 2009). The Internet, mobile phones, language
translation, radio and television are converging to provide the human family with the means to unite to share stories,
experiences and the knowledge gained from interacting with local water (Glenn et al., 2009; Raskin et al., 2002).
P2P (peer to peer) communications are gaining in popularity as people become more aware of the
unreliability of information on the Internet (Bauwens, 2005) and as trust in large organizations diminishes. The
awareness stemming from increased communications will be paramount to finding a sustainable pathway to

Global Drivers of Change 41
development, since history shows that the fate of our industrial civilization depends on our awareness of global
warming and on unprecedented levels of cooperation and commitment to create a self‐sustaining world (Fagan,
2009, pp. 310–11).
Studies show that conventional engineering approaches to water‐related education are being augmented
with more flexible trial‐and‐error techniques, user participation, two‐way learning and multidisciplinary collaborative
learning in order to create innovative solutions suited to complex systems and to empower impoverished
communities to achieve their own development goals (Marquardt, 2000, p. 233; Marsick, 1998; Murphy et al., 2009).
Education in wealthier nations to counter overconsumption, waste and prevailing resource‐intensive development
patterns is equally important (Slaughter, 2009).
One quarter of humanity, 1.7 billion people worldwide, now belong to the ‘global consumer class’, having
adopting the diets, transportation systems and lifestyles that were once mostly limited to the rich nations of Europe,
North America and Japan. China, India and other developing countries are home to growing numbers of these
consumers. While the consumer class thrives, 2.8 billion people on the planet struggle to survive on less than US$2 a
day (Worldwatch Institute, 2004).
Consumerism can be defined as ‘a cultural pattern that leads people to find meaning, contentment, and
acceptance primarily through the consumption of goods and services’ (Worldwatch Institute, 2010, p. 8). While this
takes different forms in different cultures, consumerism leads people everywhere to associate high consumption
levels with well‐being and success. Such consumption, even at relatively basic levels, is not sustainable (Worldwatch
Institute, 2010). Environmentalists, consumer advocates, economists and policy‐makers have, however, been making
efforts to help consumers curb consumption and to offer creative solutions for products that continue to meet
consumer needs with less environmental impact (Worldwatch Institute, n.d.).
In a planetary civilization, transnational corporations have become one of the new actors in global systems
(Kelleher, 2005). Enlightened self‐interest and continued consumer pressure on corporations to be good citizens –
socially, economically and ecologically – has led to the development of private sector water initiatives with the
potential to make a difference in tackling water challenges (India Water Portal, 2010; UN, 2008; WBCSD, 2006).
Yet many citizens are concerned at the prospect of corporations becoming indirectly involved in global
governance, given the potential of their role either to be progressive or to act in their own self‐interest (Bakan, 2004;
Kelleher, 2009; Korten, 2001; Shiva, 2009). In the field of water regulation, some observers call for an overhaul of
regulatory agencies and tools to strengthen communities’ abilities to control corporate water takings and to
participate in decision‐making (Marks, 2007, p. 73). It is not just water withdrawals people are concerned about.
Corporate ownership of water is abhorrent to many people who believe that water cannot be owned – as it is within
us, around us and intimately interconnected in so many ways with human life. Yet some argue that a well‐regulated
market‐based allocation system for water, complete with a pricing regime, can contribute to sorting out the global
water crisis and ensure conservation (Barlow, 2007, p. 21). Water stewardship schemes or voluntary certification

Global Drivers of Change 42
programs aim to create global standards, assessment processes and branding that will recognize conscientious water
users (SIWI, 2009).
3 Important, probable and ‘wild card’ developments
3.1 Analysis of responses to RTDs and surveys
As described in Part 1, a list of possible future developments was extracted from research of the literature describing
the possible future of each domain, while taking into account interlinkages with some of the other selected drivers.
The list of possible future developments for each driver was submitted for discussion and review through
expert consultations, with the objectives of validating the degree of importance of the developments with regards to
scenarios on water use and availability through 2050 and of gaining an informed opinion on the likelihood of such
developments occurring up to 2050.
Six areas where the project team thought more divergent opinions could arise were the subject of RTD
consultations among experts in each of the fields. These experts evaluated the completeness and accuracy of the
reports and identified through discussion the most important events or developments, the likelihood of their
happening and when they might occur. A number of experts in the other four driver domains (Infrastructure, Water
Resources, Demography and Climate) were surveyed with a request that they add any important possible
development they thought was missing and rank the importance and set time horizons for the driver. Thus the
process made it possible to rank the possible developments under each driver according to the importance given to
them by the experts.
This section highlights the most important and probable developments and, when applicable, their relation to
other survey findings.
The top five most important and top five most probable developments (falling within the margin of error of
10 per cent of the highest) are listed in Annex 4. The complete lists of developments and their rankings by importance
and probability in the RTDs and the surveys can be found on the WWAP website
(http://www.unesco.org/new/en/natural‐sciences/environment/water/wwap/global‐water‐scenarios).
It is important to keep in mind that these developments and their assessments cannot be considered as the
final independent compendium from which scenarios can be developed. The scenarios will draw upon qualitative and
quantitative analyses of the possible interactions between all of these driving forces and developments. The iterative
and cross‐sectoral nature of the scenarios process will lead to the identification of other developments in addition
to these, and both probable and less probable developments will ultimately be incorporated into the storylines.
3.2 Individual driving forces

Global Drivers of Change 43
3.2.1 Most important and most likely future developments: Water resources, including groundwater and
ecosystems
Variability of quantity and quality in the water sources and supply systems is a necessary basis for all studies of
strategy, planning, design, operation and management of water resources systems. This is a well‐studied area of
hydrological expertise, but practically every study encounters increasingly severe difficulties in procuring reliable
information. This calls for continuous efforts to maintain and strengthen monitoring and analysis systems and
institutions, especially in view of greatly reduced investment in many countries. Groundwater remains, by its very
nature, an area with less information and higher uncertainties than surface waters, while its importance as a source is
ever increasing. Tools and models for studying groundwater have developed significantly in the last decades, but their
usefulness depends on the reliability of the input data (WWAP, 2009b).
Expert survey participants ranked water productivity in agriculture as the most important development.
Water productivity for food production increased about 100 per cent between 1961 and 2001; participants estimated
most likely that it could increase another 100 per cent by 2040. That globally rainfed agriculture could yield an
average of 3.5T/ha of grain was also seen as most likely occurring around 2040. These developments are treated in
greater depth under the agriculture driver described in the following pages.
Second in importance, participants assessed that the percentage of land area subject to droughts could
increase by at least 50 per cent, 40 per cent and 30 per cent for extreme, severe and moderate droughts respectively
by the 2040s. The occurrence of droughts is determined largely by changes in sea surface temperatures, especially in
the tropics, through changes in atmospheric circulation and precipitation. In the past three decades, droughts have
become more widespread, more intense and more persistent due to decreased precipitation over land and rising
temperatures, resulting in enhanced evapotranspiration and drying (Bates et al., 2008).
Developments related to water availability appeared among the most likely to occur before 2050.
Participants considered it likely that global water withdrawals could increase by 5 per cent from 2000 before 2020,
and that by 2030 there could be a 10 per cent reduction in annual mean streamflows in most of the populated areas
of the world. Participants estimated that by the beginning of the 2030s, groundwater recharge rates could be reduced
by 20 per cent in areas already suffering from water stress in 2010. Perhaps in adaptation to this context, participants
considered that by 2020 global agricultural trade could contain ‘virtual water’ equivalent to 20 per cent of the total
water withdrawn globally for food production. However, agricultural expansion and urban development could cause a
further 15 per cent loss to global grassland and forest area in the 2020s (compared with 2010).
The Comprehensive Assessment of Water Management for Agriculture (IWMI, 2007) summarizes emerging
trends in the agricultural water sector. Global food trade and consequent flows of virtual water (embodied in food
exports) offer prospects for better national food security and relieving water stress. The changing climate affects
temperatures and precipitation patterns, most often severely affecting tropical areas. Irrigators dependent on snow
melt are even more vulnerable to changes in river flows. Urbanization increases demand for water, generates more

Global Drivers of Change 44
wastewater and alters demands for agricultural products. Higher energy prices increase the costs of pumping water,
applying fertilizers and transporting products, with implications for access to water and irrigation. Hydropower
generation and agriculture compete for water resources. Greater reliance on bioenergy affects the production and
prices of food crops and increases the amount of water used by agriculture (IWMI, 2007).
Perceptions about water are changing, as water professionals and policymakers realize the need to optimize
the use of both blue and green water,10 and they are paying more attention to environmental flows and integrated
approaches to water management (IWMI, 2007).Yet solutions to monitor and manage water availability were not
viewed as occurring in the short term. Conjunctive management of groundwater and surface water nearly
everywhere was seen as mostly likely to occur in the 2040s, as was the management of withdrawals from aquifers so
that they do not exceed the mean recharge rates of the previous decade.
Among the more comprehensive regional tools being developed, a new computational model of the
Paraguay‐Paraná river basin (in South America) is being designed to help local governments, farmers and ranchers
understand the factors that lead to water scarcity and impurity, make conservation‐friendly decisions about future
land‐use projects, assess how landscape planning, water and soil conservation can improve water quality and sustain
biodiversity downstream.
Also viewed as most likely by the 2020s, the Pacific Decadal, El Niño‐Southern and North Atlantic Oscillations
become understood and included in climate forecasting models. The recognition of the context of nonstationary
climates and hydrologic and anthropogenic forcing in all water management planning and operations was viewed was
most likely by the beginning of the 2030s.
Desalination is not seen as a likely solution to water availability before the end of the 2040s. That
desalination could produce 25 per cent of the drinking water for cities was seen as most likely by the end of the
2040s, but that it could produce 5 per cent of water used for food production was considered most likely only by mid‐
century. The slow adoption rate of desalination technologies is also reflected in the responses to the Delphi
consultations on Agriculture, Economics and Technology (discussed further under the technology driver in the
following pages).
Although the state of the ecosystem, including water and land resources, is often seen to be determined by
the other drivers, it also can act as a constraint on the development of the other forces.
The loss of species diversity was viewed as both important and most likely to occur by the beginning of the
2030s. Rates of habitat destruction and species extinction are higher than they have ever been in the history of
humanity (McNeill 2000). Participants assessed that the diversity of freshwater biological species could be
significantly reduced as early as the beginning of the 2020s, as most likely by 2030, due to higher temperatures,
reduced flows, atmospheric carbon dioxide and increased nitrogen caused by climate change. The extinction rate by
10 Blue water is surface water and groundwater. Green water is rainwater stored in the soil as soil moisture.

Global Drivers of Change 45
2030 could be five times higher for freshwater animals than for terrestrial species. Organisms adapted to extreme
environmental variability could also increasingly dominate ecosystems by the beginning of that decade. The event
“Appropriate countermeasures to limit biodiversity and loss are in place and reduce the rate of loss by 50 per cent”
was viewed most likely to occur by the beginning of the 2040s. The presence and spread of waterborne invasive alien
species is viewed as not being brought under control before 2050.
Rising concern for environmental sustainability increases pressure to provide water to maintain ecosystems.
Serious degradation of water quality in many water sources coupled with rising standards of quality for water used in
all sectors increases the uncertainty of protecting natural water sources and the feasibility of better and cheaper
water and wastewater treatment technologies (Richter et al., 2003, p. 206).
3.2.2 Most important and most likely future developments: Infrastructure
In nearly all regions, ageing water infrastructure, lack of data and deteriorating monitoring of the state of
infrastructure represent a major risk for the future.
Participants viewed access to potable water and to appropriate sanitation facilities as the most important
developments. It is viewed as most likely that 90 per cent of the global population will have reasonable access to a
reliable source of safe potable water by the beginning of the 2040s. Possibly contributing to this appraisal is the
participants’ estimate that the routine use of nanofilters in over 30 countries in the treatment of potable water was
most likely to happen by the beginning of the 2030s. This is similar to the time horizon provided in the Technology
survey for the rollout of this technology: participants assigned a probability of about 75 per cent that economically
viable nanotechnology (such as carbon nanotubes) could yield new and effective membranes and catalysts useful in
desalination and pollution control by 2030.
It was viewed as most likely that 90 per cent of the global population having reasonable access to appropriate
sanitation facilities would only occur towards the end of the 2040s.
Second in importance was the annual inspection of all dams and dykes over 50 years old and all those with
significant risks from hazards for structural soundness; this development was seen as most likely to begin in the
2030s. This is relevant even in the United States, where, for example, 65 per cent of dams will be 50 years old or more
by 2019 (USACE, n.d.).
The development of emergency evacuation plans with clear implementation responsibility for these dams
and dykes was also considered most likely to occur in the 2030s. This is all the more relevant since increased siltation
of dams due to climate change and deforestation could shorten by 30 per cent the estimated remaining lifetime of a
significant number of large dams: this development was also viewed as important and as most likely within the same
timeframe as the previous developments. The experts indicated, however, that linkage of this development to climate
change specifically is questionable. In any case, it has been noted that all systems will require attention due to
increasing climate variability and other impacts of climate change.

Global Drivers of Change 46
Investments in infrastructure were ranked next in importance. It was considered most likely that income for
water services (tariffs, taxes and transfers) could cover all operating costs and depreciation of infrastructure only at
the beginning of the 2040s, at the same time as the write‐off of the external debt of low income countries, freeing
funds for investment in water infrastructure. This is perhaps why the upgrade of nearly all water and wastewater
treatment plants at 10 year intervals to meet new standards for potable water and wastewater effluents was not
viewed as most likely before 2050. Metering or identifying nearly all water uses was not viewed as most likely before
the 2040s.
Inland navigation needs were seen to continue to influence river operations and flow allocations: this
development was assessed as the earliest likelihood of occurrence among the developments considered, beginning by
the turn of the next decade. National water planning taking into account the need to provide appropriate
environmental flows in the regulation of water infrastructure came second in timing and was viewed as taking place
in the 2020s.
Technology developments came third when considering the most likely timeline of events. That robots could
remotely and reliably mend underground pipes in at least 10 countries was viewed as most likely by the beginning of
the 2030s, as was the use of chemical, biological, radiological and nuclear sensor networks to monitor hazardous
incidents in water systems. For example, a five‐year $US17.6 million public‐private partnership project is under way at
the University California at Irvine to develop a prototype remote robot that goes beyond pipe inspection to apply
carbon fiber reinforcement inside water transmission pipes, allowing trenchless repair and rehabilitation, even in
smaller pipes, as much as 11 times faster than human crews (Jones, 2010).
Participants also estimated that remote sensing technologies and global positioning systems (GPS) could be
used by the 2030s to supplement other technologies to identify, map and explore underground infrastructure whose
location was unknown or forgotten.
3.2.3 Most important and most likely future developments: Climate change and variability
Climate change will affect the hydrological cycle and hence the availability of water for its users. It is expected that
extreme water‐related events, such as floods and droughts, will occur more frequently and with greater intensity
(IPCC, 2007b). For these events, as for the hydrological cycle as a whole, extrapolations using historical data are no
longer valid. Thus future conditions, including future emissions, are increasingly difficult to predict. This increases our
level of uncertainty about the future. Furthermore, the spatial resolution of global climate change models is relatively
coarse, which makes it difficult to convert them into the more detailed scale upon which water managers operate.
This difficulty is compounded by the fact that we simply do not have these projections available at the ‘jurisdictional’
level (state and local) or at the river basin level, where much of the water resources planning takes place (WWAP,
2009b).

Global Drivers of Change 47
The most important developments for this driver are related to water availability. Survey participants
estimated that the number of people at risk from water stress could reach 1.7 billion before 2030 (before 2020 at the
earliest) and 2 billion by the beginning of the 2030s. That this number could reach 3.2 billion was not seen as most
likely before 2050. This is roughly consistent with, though possibly slightly ahead of, the IPCC Special Report on
Emissions Scenarios.
Also of importance was the development that delta land vulnerable to serious flooding could expand by 50
per cent, which was viewed as most likely to occur by the beginning of the 2040s. This is concurrent with a 2005 study
that estimated that by 2050, more than 1 million people will be directly affected by sea level rise in the Ganges‐
Brahmaputra‐Meghna delta in Bangladesh, in the Mekong delta in Vietnam and in the Nile delta in Egypt (Ericson et
al., 2005).
These events could have a significant impact on agriculture. Interannual freshwater shortages combined with
flooding were viewed as most likely reducing total global crop yields by 10 per cent by the 2040s.
The next most important development for the majority of participants was that a worldwide rise in living
standards and population increase could greatly increase the demand for energy, causing a 20 per cent increase in
GHG emissions. This was considered most likely to occur by the beginning of the 2030s. Alternative energy
technologies and solutions were seen most likely to emerge more significantly around this time. Participants
considered that battery‐powered electric cars could have a 30 per cent share of the world automobile market by the
2030s, that wind power could meet 20 per cent of world electricity demand towards the end of that decade, that 30
per cent of the world power consumption could possibly be connected to ‘smart’ power grids by 2040 and that
hydrogen fuel cells could power 20 per cent of the world automobile market in the 2040s. However, participants
considered it would most likely be beyond 2050 before carbon capture and storage could be in use in 50 per cent of
all new fossil power plants, with existing plants being retrofitted or closed. The IPCC Special Report's estimate was
that by 2050, around 20–40 per cent of global fuel carbon dioxide (CO2) emissions could be technically suitable for
capture, including 30–60 per cent of power generation (IPCC, 2005). The report also assessed that carbon capture and
storage systems begin to significantly take hold when prices reach about US$25–30/tCO2. (For the reasons the market
has not worked as planned in Europe, see Barata, 2010.) In contrast, some have warned that 2030 is the absolute
deadline for the cessation of emitting greenhouse gases from coal if we are to avoid a catastrophic tipping point
(Hansen et al., 2008).
Participants expect that a strong, effective universally binding international agreement to combat climate
change could be in place by 2040; this was viewed as an event of high importance.
The development with the earliest likelihood of occurring is an extensive well‐planned and financed
multinational campaign to support public education on the facts, causes, effects and costs of climate change, by the
beginning of the 2020s. What remains to be seen is whether this will affect the current ‘culture of consumption’ and
Global Drivers of Change 48
lead to greater changes in behaviour than the minor acts of conservation being seen now, such as turning off lights
when they are not in use (Worldwatch Institute, 2010).
Increased public information and knowledge transfer about climate‐related issues are seen most likely to
occur after this. For example, indisputable global precipitation and temperature changes could be reported publicly in
the 2020s, with effective international coordination in place covering activities in climate analysis, mitigation and
adaptation and continual exchange of related up‐to‐date data, knowledge and experience by the 2030s.
The 2030s are also viewed as the most likely decade for funding for climate change adaptation to be
integrated into funding of adaptive water management and considered a priority by water‐reliant socio‐economic
sectors.
3.2.4 Most important and most likely future developments: Agriculture
In the RTD exercise on Agriculture, the experts felt that the most important development would be increasing water
withdrawals. The probability11 that withdrawals could increase from the current approximately 3,100 billion m3 to
4,500 billion m3 was viewed at close to half in 2020, increasing to about 60 per cent by 2030. This is consistent with
the increase projected in the business‐as‐usual scenario of the 2030 Water Resources Group (2009). There are several
regions in the world where the availability of water in these volumes is physically not possible. In other regions, the
significant investment in storage infrastructure that would be required is economically not possible for many
countries (WWAP, 2009b).
It is thus not surprising that emphasis in the ranking of important developments was placed on efforts to
increase water productivity (‘more crop per drop’), through both seed modification and improvements in farming
techniques. Water productivity in grain production was expected to triple in some developing countries, with an
almost two‐thirds probability by 2020.
To achieve this increase, the introduction of new plant strains with improved productivity per unit of water
was viewed as highly important, with a likelihood of more than 50 per cent by 2020. Also considered likely was the
distribution of genetically modified seeds at affordable prices for rural farmers in the poorest countries particularly
affected by the negative impacts of climate change and variability. Improvements to farming techniques could include
the following: adaptation to climate variability by changing practices in the timing of seeding seasons and in the
selection of varieties and plants (probability of one‐half by 2020); the expansion and routine use of precision farming
in many developing countries, including the use of GPS and multi‐spectral satellite scanners (probability of more than
40 per cent by 2030); and investments in infrastructure to improve rainwater collection and storage systems
(probability of three‐quarters by 2030).
Participants felt that less than half of the gap between supply and demand for agricultural water would be
filled by conventional means (improvements in water productivity and conservation) and that the rest would come 11 A probability of 1 is viewed as completely certain to occur and one of 0 is certain not to occur.

Global Drivers of Change 49
from nontraditional approaches (such as desalination).This was seen as having a 33 per cent probability of happening
by 2020 and 40 per cent by 2030.
According to participants, water quality will continue to remain an issue, particularly in the short term. The
practice of using untreated wastewater for irrigation despite the health risks is considered to continue to 2020
(probability of almost three‐quarters), although decreasing to two‐thirds probability by 2030. This is perhaps why the
valuing and managing environmental services to improve the quality of agricultural water were seen of highest
importance and highly likely by 2030 (80 per cent probability, even if the limited number of responses to this
development allow for a greater margin of error). This would contribute to lowering the chances of industrial
chemical contamination entering domestic wastewater and natural streams, such as the reported case of metallic
iron from wastewater being transferred to cows’ milk near the Musi River in India (Minhas and Samra, 2004).
Increased efforts to reduce food losses due to spoilage in the field, in storage and in transportation, with
concomitant savings in water usage, were seen as having an important impact and a probability of two‐thirds by
2030.
Participants estimated that the development of aquaculture will have taken hold by 2030, producing as much
food as the fishing of the oceans and lakes (three‐quarters probability). Aquaculture may provide adaptation
possibilities for other sectors, for example, where coastal agriculture becomes nonviable due to sea level rise (FAO,
2009).
Deforestation was ranked the second most important in the series of potential future developments. Regions
might seek to increase their agricultural areas by continuing to expand deforestation, although more slowly (assigned
a three‐fifths probability by 2030).
In fact, participants considered that agricultural croplands could expand more than 20 per cent, particularly in
Latin America and Africa (probability of three‐fifths in 2020 and of two‐thirds in 2030). This development was viewed
as more likely than slowing the expansion of agricultural lands as a result of ecological concerns, which was given a
probability of about 25 per cent by 2020 and about 33 per cent by 2030. A recent contribution to combating
desertification is the UN Convention to Combat Desertification’s initiative to Assess the Economics of Desertification,
Land Degradation and Drought (DLDD) and thus to make the economic side of DLDD an integral part of policy
strategies and decision‐making (UNCCD, 2011).
The continued expansion of deforestation was also viewed more likely than algal‐based biofuels replacing
those from terrestrial plants (one‐quarter probability in 2020 and two‐fifths by 203012). One could conclude from
these assessments that such deforestation will more than likely continue to take place.
In contrast, more than 3 per cent of food supply in urban areas could be satisfied by farming on vacant lots
(about 80 per cent by 2030).
12 The limited number of responses to this development and those following imply a greater margin of error.

Global Drivers of Change 50
Looking at the most probable developments, respondents saw a probability of three‐quarters that fertilizer
prices will continue to track energy prices and of four‐fifths that this trend will continue until 2030. As energy prices
are expected to continue rising, the conclusion would be that the cost of produce will also continue to rise. Thus, the
development and use of high nitrogen‐use efficiency seed varieties was seen as highly important and also highly
probable (four‐fifths probability in 2020). The precision farming techniques mentioned earlier will also help optimize
the use of fertilizer. Also strongly influencing food prices is the possible transformation of multinational business
corporations into effective global monopolies (probability of over two‐thirds in 2020, even if the limited number of
responses to this development allow for a greater margin of error; also mentioned in the Economy and Security
survey with a probability of just under two‐thirds in 2020).
3.2.5 Most important and most likely future developments: Technology
Participants in the RTD exercise gave the highest importance to the use by the largest water consumers of products
to conserve water: pressure‐reducing valves, horizontal‐axis clothes washers, water‐efficient dishwashers, grey‐water
recycling systems, low‐flush tank toilets, low‐flow or waterless urinals. They assigned a probability of about one‐half
that 1 billion consumers could be participating by 2020 and of about three‐quarters that they would do so by 2030.
This is also the most probable technological development.
Second in importance was the possibility that technologies for water desalination in large volumes could
become so inexpensive that nearly all people within 100 miles of coastlines could have potable water to meet their
needs. The group only saw a one‐fifth probability of this occurring by 2020, though doubling to more than two‐fifths
by 2030 (participants in the Ethics survey attributed a less than one‐half probability for 2030). This was linked to the
third most important technological development: that economically viable nanotechnology (such as carbon
nanotubes) could yield new and effective membranes and catalysts useful in desalination and pollution control (e.g.
removing heavy metal and other dissolved pollutants from water). Participants assigned a probability of slightly less
than one‐half that this could occur by 2020, increasing to almost three‐quarters in 2030. This is similar to the results
obtained in the Infrastructure survey, where participants estimated that the routine use of nanofilters in over 30
countries in the treatment of potable water was most likely to happen by the beginning of the 2030s.
The lower probabilities of actual use by these dates probably reflect the respondents’ appreciation of the
delays in adopting and building systems with the new technology, with subsequent reductions in cost. So far, the
greatest cost reductions have come from improvements in reverse osmosis technology; other innovations conducive
to reducing costs include the development of inexpensive corrosion‐resistant heat‐transfer surfaces using offpeak
energy produced by baseload plants, cogeneration of electricity and thermal energy and co‐location of desalination
and energy plants (Cooley et al., 2006). However, the objective of reducing costs by 50 per cent in 2020 poses a
significant challenge, and radical new technologies or developments in materials and energy costs would probably
need to occur in order to meet this goal (Cooley et al., 2006). Other critical gaps still need to be overcome with

Global Drivers of Change 51
regards to nanotechnology. The rate of nanotechnology emergence is outpacing the ability to test and provide
thorough life‐cycle analysis. Gaps in understanding the environmental impacts and nanotoxicity are aspects of the
technology that are not well understood (Khanna et al., 2008).
This appreciation of delays in developing and rolling out new tools and technologies are reflected in six other
developments, which were all ranked with similar relatively high probabilities. The ability to measure and publish an
annual global water footprint was assigned a probability of more than one‐half by 2020 and of just under three‐
quarters by 2030. This development was also viewed as probable in the Ethics survey (three‐fifths probability by
2030) and in the Economy survey (four‐fifths probability by 2030).
The second high‐probability development was the rapid spread and doubling of use of evaporation control
technologies, and the third development was the use by agriculturists of affordable technology to capture real‐time
data on their crops and soil moisture to make informed decisions on efficient watering schedules. These were given
the same probability and were also rated with high importance.
Also related to increases in the efficiency of land and water use and with similar probabilities are the ability of
weather forecasting models to give accurate predictions two weeks in advance and the widespread adoption of
rainwater harvesting, combined with new simple and cheap ways of purifying the collected water. That the
functioning and operation of water infrastructure, such as for leakage from dams and canals, could be continuously
and globally monitored by satellites was given a probability of one‐half by 2020 and of two‐thirds by 2030.
3.2.6 Most important and most likely future developments: Demography
Population dynamics, including growth, age distribution, urbanization and migration, lead to increased pressures on
freshwater resources through increased need for water and increased pollution (WWAP, 2009b).
It is perhaps no surprise that overall world population size would figure as the most important issue for
developments in this section. Experts felt that the world population could reach 7.9 billion by 2034 and that it could
reach 9.15 billion at the beginning of the decade of the 2050s and 10.46 billion beyond 2050. This seems to be in
keeping with the UN Population Division’s 2010 Revision medium variant, which estimated a population of 9.3 billion
by 2050 (UNDESA, 2011b).
Overall, population growth could overwhelm past gains in water and sanitation accessibility (WWAP, 2009b).
Participants considered that by the 2030s, the population growth in the majority of developing countries could reduce
the percentage of those with improved access to water supply and sanitation achieved since 1990 by 10 per cent.
Global population growth also poses significant challenges when combined with increasing consumer
lifestyles and diet upgrading, and it could lead to the destabilization of global systems (Caldwell, 2004) – after all,
even at income levels that could be considered subsistence by some (US$5,000–6,000 purchasing power parity per
person a year), people are already consuming at levels that are unsustainable (Worldwatch Institute, 2010). In fact,
Global Drivers of Change 52
environmental degradation does not grow in direct proportion to population size but rather disproportionately faster
due to feedbacks, thresholds and synergies (Harte, 2007).
Fertility rates in less developed regions, according to participants, would drop from 2.73 children currently
to 2.05 by the turn of the 2050s.
One development influencing fertility in least developed countries in particular is women’s levels of
education and employment (Caldwell, 2004). Participants considered that by the 2030s, the rise in women’s
education levels and employment in a majority of least developed countries could cause a significant decline of
fertility levels.
Efforts to reduce mortality in least developed countries were considered in the series of developments with
earliest likelihood. In the group of 58 countries for which HIV/AIDS prevalence is above 1 per cent and/or whose HIV
population exceeds 500,000, the majority could achieve antiretroviral treatment coverage for those living with
HIV/AIDS of 60 per cent or more by the 2020s. This is the same decade in which the number of interventions to
prevent mother‐to‐child transmission of HIV in these countries reaches an average of 60 per cent. The coverage level
for both interventions was 36 per cent in 2007.
According to participants, the combined global deaths per year from diarrhoeal diseases and malaria could
decrease to 1.54 million or less before 2030 (compared with 2.53 million in 2008) and to 710,000 or less before 2040.
According to the literature, if current initiatives were to remain in place, meeting these projections assumes that
increased prosperity health improvements will follow the same patterns as in developed countries (WHO, 2007), but
the projections do not take into account the possibly dramatic impacts of climate change and ecosystem degradation
(WHO, 2003; Campbell‐Lendrum et al., 2005).
The infant mortality rate was seen as likely to drop. The average estimated mortality rate in 2005–10 in less
developed countries was 78 deaths per 1,000 live births; by 2030 the rate was projected to drop in 60 developing
countries to 45 deaths per 1,000 live births. Expected successes in overcoming these challenges could explain why
participants assigned the 2040s as the decade by which all developing countries have a life expectancy of 70 years or
more.
Increased life expectancy could generate additional incentive to accumulate savings and pension rights,
leading to longer education and greater workforce participation of women and thus to lower fertility rates (Demeny,
2004), in turn reducing the pressure on ecosystem resources. Increased life expectancy with reduced morbidity could
create wealth for communities, since healthy older individuals generally remain productive in society and can provide
intergenerational transfers of knowledge, and they generally accumulate more wealth than those beset with illness
(Olshansky, 2004).
Developing countries will have less time to adjust to the reality of ageing than developed countries do, and
they will have to do so at lower levels of socio‐economic development (UNDESA, 2002).

Global Drivers of Change 53
Developments that could diminish longevity were seen as quite possible: by the 2030s, participants
considered that the worsening of the epidemiological environment with regards to the spread of pandemics, re‐
emerging pathogens and the evolution of drug‐resistant diseases or delayed impacts of obesity could prevent the
average world life expectancy from growing above 75.5 years. Participants viewed growth in urban population as
second in importance. Some 70 per cent of the world population was viewed most likely to become urban by the end
of the 2030s. The proportion of the world population living in slums was considered most likely to decrease only to 25
per cent by the end of the 2040s, from 33 per cent today.
Fewer than 35 per cent of cities in developing countries have their wastewater treated, and between one‐
third and one‐half of solid waste generated by cities in low and middle‐income countries is not collected (UN‐
HABITAT, 2009). The natural risks facing the 10 most populous cities in the world include being located on earthquake
faults (8 out of the 10) and vulnerability to destructive storms (9 of the 10), to floods (8 of the 10) and to storm surges
(6 of the 10). In this context, urban planning could play a significant role in protecting critical water and sanitation
infrastructure, which in turn could improve response and reconstruction capacity after natural disasters (UN‐
HABITAT, 2009).
The proportion of world population living in coastal areas could reach 75 per cent in the 2030s, increasing
from 60 per cent in 2010. The number of migrants due to the impacts of climate change was viewed as most likely
reaching 250 million in the 2040s. Migration following natural disasters and conflict‐based events is often principally
to coastal urban areas, including large peri‐urban slums with little or no access to basic services and with increased
risk exposure to disease and epidemics (WHO, 2003; WWAP, 2009b). One participant commented that failures in
satisfactorily feeding a population could also be expected to generate large migrant flows.
Human migration has been considered an even more significant driver of environmental change than
population growth, with the most important migratory impacts occurring at natural boundaries: ‘[when transition]
from humid to dry lands repeatedly provoke desertification. Migrations from flatlands to sloping lands often led to
faster soil erosion. Migrations into forest zones brought deforestation’ (McNeill, 2000).
3.2.7 Most important and most likely future developments: Economy and security
The development of highest importance as seen by participants in the RTD on the economy and security was the
demand for water in developing countries increasing by 50 per cent over today's levels. Participants saw a three‐
quarters probability of this happening by 2020, with a probability of five‐sixths in 2030. This would reinforce the
issues raised by those who reviewed agricultural developments.
Another development of importance is that over 40 per cent of world countries could experience severe
freshwater scarcity by 2020 – also viewed as highly likely, with a probability of about 80 per cent. These would mostly
be low income countries or regions in sub‐Saharan Africa and Asia. In fact, the number of people living on less than
US$1.25 a day coincides approximately with the number of those without access to safe drinking water (WWAP,

Global Drivers of Change 54
2009b). Water scarcity could trigger and perpetuate poverty and inequality. Countries that had low incomes but also
access to adequate safe water and sanitation had an average GDP growth of 3.7 per cent over the past 25 years, while
countries in the same category but with limited access to water grew only 0.1 per cent per year (Orr et al., 2009).
In terms of security, conflicts over water are usually triggered by conflicting interests over water use by
different groups – private, business, public, governmental or a combination of these – and they carry the potential to
increase civil unrest or political tension between and within conflict‐prone nations, regions with high environmental
vulnerability or states subject to failure. Since conflict and environmental degradation exacerbate each other, unless
there is adequate intervention their scope and spectrum might expand (Gleick, 2008). Human security, in its broader
conception, includes meeting the basic needs for food, water, health, livelihoods and a place to live (WWAP, 2009b).
Thus, it is no surprise that two developments related to food security were ranked as important. The first is
the possibility that food prices could rise globally by at least 30 per cent compared with 2010, which was attributed a
probability of one‐half by 2020 and of about 60 per cent by 2030. That price increases could be strongly influenced by
the transformation of multinational agribusiness corporations into effective global monopolies was seen as having a
likelihood of just under two‐thirds by 2020 and of three‐fifths in 2030 (and this received a similar probability of just
over two‐thirds in 2020 in the Agriculture survey).
Most probable (and second in importance) was the possibility that unequal access to water will create new
economic polarities. Participants gave this development probabilities of about 80 per cent in 2020 and 90 per cent in
2030. Implications of water scarcity in some industries are extremely far‐reaching, with potentially large disruptive
economic and social consequences. For example, 11 of the world’s 14 largest semi‐conductor factories are in the Asia‐
Pacific region, where water security is becoming crucial. ‘Peak water’ will increase costs related to business activity
and could create operational disruptions with associated financial losses, threatening further economic development
(Morrison et al., 2009).
In some cases, business activity might interfere with a population’s access to water to meet basic needs or
violate environmental restrictions, and therefore the business might face operational licence problems and increased
costs related to water or wastewater treatment, as well as anger from the local population (Morrison et al., 2009).
Direct economic impacts considered important by participants were the possibility that over 50 million people could
lose their livelihoods due to water scarcity (more than a two‐thirds probability in 2020 and in 2030), that lack of water
could force businesses to move and thus increase poverty in those regions (probability of two‐thirds by 2030) and
that lack fo water could lead to a reduction in planned electricity generation in 10 per cent of plants worldwide
(probability of slightly less than three‐fifths by 2030) . Such economic polarities could ultimately increase dangers of
social and political unrest and consequent conflict.
That a water footprint measure will be available and published widely on an annual basis and be more
important as a measure of assessment was viewed as highly likely. Participants felt there is a probability of more than
two‐thirds that this could happen by 2020 and of four‐fifths by 2030. (This same development was assigned a

Global Drivers of Change 55
probability of three‐fifths in 2030 by respondents of the Ethics survey and three‐quarters in 2030 in the Technology
survey responses.) Such a tool would provide useful information to decision‐makers by revealing critical links between
water resources and economic activity. This increased awareness may lead to measures to improve water
productivity in water‐stressed environments and to reduce the polluting‐side effects of production, which also affect
water quality and quantity (WWAP, 2009b).
It is perhaps for this reason that participants found it important that water gain centre stage in climate
change adaptation strategies and ‘green credits’ policies, although they only assigned it a probability of slightly more
than two‐fifths by 2020 and three‐fifths by 2030. The latter often have benefited both the environment and
industries’ operational effectiveness: an integrated approach improving water and energy efficiency demonstrated
savings of US$3 million at one single industrial information technology plant while increasing output by 33 per cent
(Morrison et al., 2009).
That several types of cost‐effective desalination or other technologies could be widely available and increase
safe water supply by 20 per cent globally was given a probability of slightly more than half by 2020, rising to more
than three quarters by 2030. This is similar to findings in the Technology survey, where participants assigned a
probability of almost three‐quarters to economically viable nanotechnology (such as carbon nanotubes) yielding new
and effective membranes and catalysts useful in desalination and pollution control (e.g. removing heavy metal and
other dissolved pollutants from water) by 2030. Participants in the Infrastructure survey also gave this time horizon
when estimating that the routine use of nanofilters in over 30 countries in the treatment of potable water was most
likely to happen by the beginning of the 2030s.
Also highly probable and of importance was the prevention of waterborne diseases through the development
of inexpensive prophylactic measures, which was assigned a probability of three‐fifths in 2020 and three‐quarters by
2030.
3.2.8 Most important and most likely future developments: Governance
Failure of urban water supply infrastructure occurring in many cities is seen as most important by respondents to the
RTD. They assigned a probability of three‐fifths to it happening in more than two dozen major cities by 2020 and
about three‐quarters to it happening by 2030. That this item appears so high in a review on governance indicates that
the respondents felt urban water system governance is badly in need of attention.
The development of online forums on water issues (including local government and civil society), ensuring
symmetry of consistent and objective information between user, provider and policy‐maker, was ranked second in
importance. Participants saw a probability of slightly more than one‐half of this happening in 75 per cent of the world
by 2020 and of more than two‐thirds that it could happen by 2030. Networked coordination at the national level to
share information and best practices between local water agencies was also viewed as highly important. Participants
assigned a probability of more than two‐fifths that this could be achieved in at least 95 per cent of countries by 2020
Global Drivers of Change 56
and of three‐fifths that it could be achieved by 2030. Equally probable and viewed as highly important is the global
sharing of water quality information for all countries through the United Nations Global Environment Monitoring
System Water Programme, with a probability of happening of one‐half by 2020 and more than three‐fifths by 2030.
The system currently uses 3,000 monitoring stations in 106 countries to determine the water quality around the
world. It seeks to be the leading provider of data and information on the state and trends of global inland water
quality required for their sustainable management, to support global environmental assessments and decision‐
making processes.
Clearly, public consultation and information sharing are considered by the group as key factors with a fair
degree of likelihood. Participants viewed as important that mechanisms be developed to incorporate this
information into formal decision‐making processes, and, although likely, they considered it may take some time.
That comprehensive decision‐making tools for identifying the best technologies or approaches to meet
water, sanitation and hygiene needs would be used worldwide was assigned a probability of less than two‐fifths by
2020 and less than three‐fifths by 2030. Official incorporation of water footprint reporting and reduction into
government policy‐making and sustainable development strategies in at least 90 per cent of countries was given a
probability of less than one‐third in 2020 and slightly more than 40 per cent by 2030. The low probabilities attributed
to this last development in particular may reflect the additional time required to embed a new measure in decision‐
making processes on such a wide scale, since the publication of the annual water footprint itself was viewed as much
more likely in the surveys related to Ethics (three‐fifths probability in 2030), Technology (three‐quarters probability in
2030) and Economy (four‐fifths probability in 2030).
With regards to water governance at the national level, participants considered important the possibility that
water resources be formally declared state property. This development in 85 per cent of countries was given slightly
more than a one‐third probability of happening in 2020 and less than half in 2030. Brazil, Ghana, Indonesia, South
Africa, Sri Lanka, Tanzania and Thailand have already adopted such legislation.
Reflecting the lack of attention to groundwater in the past, the adoption of an international convention
specifically dedicated to transboundary groundwater was considered highly important. Yet, while respondents
thought it important, the probability they assigned within the time period – about two‐fifths by 2020 and a bit less
than three‐fifths by 2030 – probably reflects the reality of the delays in ratification of the 1997 United Nations
Convention on Non‐Navigational Uses of International Watercourses, which by July 2011 had received 24
ratifications (UN, 2011c). The probability that this convention could get the 35 ratifications needed to enter into force
was estimated at more than two‐thirds by 2020 and almost nine‐tenths by 2030. The subsequent implementation of
protocols on shared watercourses for all world regions was given a probability of one‐half by 2020 and two‐thirds by
2030.

Global Drivers of Change 57
3.2.9 Most important and most likely future developments: Politics
The group of those who responded to the RTD on politics had similar views on the importance of establishing and
following transparency and participation procedures in matters of water governance. However, they saw a
probability that this could happen in at least 120 countries by 2020 as only a bit more than one‐quarter, or about one‐
third by 2030.
Transparency International (2008) has described participation as a key mechanism in reducing undue
influence in the water sector, leading to an added pro‐poor focus on spending, increased water access for small
landholders, further checks and balances in auditing, water pollution mapping and performance monitoring of water
utilities.
One reason for ineffective community participation and lack of influence in decision‐making is the lack of
coordination and of a mutually agreed water strategy at the national, regional and local levels. Participants assigned
a probability of more than two‐thirds that this would continue in 2020. It is perhaps also for this reason that shifting
to decentralized decision‐making with appropriate transfer of authority and resources to the decision‐making level
that best corresponds to the scale of the problems being addressed, sometimes called ‘nested levels of governance’,
was assigned a probability of only one‐third by 2030. Given the difficulties associated with shifts in governance, it is
perhaps not surprising that a greater likelihood was placed on most governments attempting to shape public opinion
on a large scale using social marketing to gain popular support for water policies and encourage appropriate water
use (probability of two‐thirds in 2030).
Participants also saw as highly important the number of people living in insecure or unstable countries that
run a significant risk of collapse. There were 2 billion living in these conditions in 2010 according to the Failed States
Index (Foreign Policy, 2010). That this could be reduced to less than 1 billion people was viewed as unlikely, with a
one‐quarter probability it would happen by 2020 and only slightly higher than one‐quarter by 2030. As noted earlier,
water (and related food and energy) scarcity could have a major negative impact on achieving this objective: political
security and food security often go hand in hand – and in those cases it is often impossible to operate relief
programmes (Brown, 2008).
In fact, respondents saw a much greater likelihood that social instability and violence could spread to most
states faced with chronic water scarcity (probability in 2020=about one‐half; in 2030=almost three‐fifths). By
assigning a probability of only one‐third to the decrease in major armed conflicts from 14 in 2010 to only a handful in
2030, participants seem to rather conclude that these conflicts will remain part of the socio‐political landscape in the
years to come. In the aftermath of these crises, establishing local water institutions and practices (such as village
mirabs in rural Afghanistan and eastern Iran) could be a building block to restore peace in failing states – though only
attributed a probability of one‐half by 2030 – since successful peaceful resolution of differences over water allocation
can initiate a positive spiral whereby a number of other ingrained conflict patterns could start to dissolve (Ohlsson,
1995).
Global Drivers of Change 58
Issues related to global cooperation overall and funding of sustainable development were equally viewed as
important in the outcome of water scenarios to 2050. A global collective intelligence system tracking the sharing of
Science and Technology around the world by 2030 was assigned a probability just under two‐thirds.
International assistance shifting away from global cooperative projects to projects that adhere to diversified
national interests, based on principles of non‐intervention and respect for state sovereignty, was given a probability
of only slightly more than two‐fifths by 2030. This leaves this outcome open for speculation. Also uncertain, with the
probability of one‐half, is the initiation of a series of reforms to international corporate law to force multinational
companies to address their liabilities, such as damages to the environment. The adoption of mechanisms to fund
global public goods and maintain ecosystems was not viewed as very likely by 2030, with a probability of less than
one‐third. Such mechanisms could include the partial funding of global public goods such as health, education,
environmental restoration and peacekeeping through the taxation of global negative externalities (such as arms,
pollution, destabilizing financial flows). They could also include revenues collected from the management of global
resources (fishing rights, deep‐sea mining, carbon emission permits) as well as the establishment of an effective
market mechanism that fully integrates the economic costs of maintaining sustainable water and other
environmental ecosystems into wealth creation processes (Stiglitz, 2007).
The fourth theme of importance that emerged relates to governments’ ability to adapt decision‐making
processes to become more participatory and to include longer‐term impacts and systems analysis in their
considerations. Respondents saw that resistance within government and from vested interests could keep
governments from becoming more participatory, flexible and transparent, leading to further mistrust and/or
increased activism. They judged the probability of this development happening in at least 100 countries at about 75
per cent by 2020. The ability of the public sector to cope with the increasing complexity of our world hinges for some
on its ability to become innovative, flexible and participatory in its approach, since solving problems will depend on
coordinating the actions of many players and involving them in the creation of the solutions (Gill et al., 2010).
In contrast to their view on governments’ resistance to change, participants viewed almost as likely – with a
probability of more than two‐thirds in 2020 and three‐quarters in 2030 – that most people would come to agreement
that there is interconnectedness among living systems. Viewing human activity through the lens of whole systems
thinking, including the environment, is paramount to ensuring sustainable human well‐being and the perpetuity of
the ecosystem services (MA, 2005). It can also lead to practical solutions that fall outside the traditional ‘waterbox’, a
concept described in the third World Water Development Report (WWAP, 2009b), such as decision‐makers
acknowledging that building a road passable in all weather all year round to let farmers get their produce to market
will enable them in turn to move from subsistence to commercial agriculture. Participants in the Ethics survey were
less optimistic as to the likelihood of the recognition of the interconnectedness among living systems, assigning it a
probability of less than two‐fifths in 2030.

Global Drivers of Change 59
Thus, it would seem that there is the possibility that while the population at large might eventually agree on
what should be done, participants feel that governments as presently constituted would be unable to respond. This
seems to be reflected in the probability of only one‐third by 2030 assigned to the adoption of integrity/anti‐
corruption pacts for all public procurement processes or contractual requirements in at least 100 countries.
Similarly, relatively low probabilities were assigned to participation, such as adapting government structures to allow
civil society to actively participate in policy design and service delivery (probability of less than one‐half by 2030) or
establishing mechanisms in more than 20 countries providing for independent inquiry with public participation on
major development proposals and legislation that affect future generations (probability of one‐half by 2030). The
evaluation of the probability of these last two developments probably reflects the fact that active participation would
require a shift in leadership culture and the ability to successfully communicate among groups with different
mindsets.
Respondents were also asked to judge the likelihood that more than 60 per cent of the world's population
would live in countries where fundamental rights and civil liberties are respected, an increase from less than half of
the world’s population in 2009. They saw a probability of two‐fifths of this occurring by 2030.
Yet there is some uncertainty regarding the likelihood of the widespread adoption of foresight in
governments as a tool to improve decision‐making by countering the constant preoccupation with the immediate.
That foresight functions become a routine part of national governments in 120 countries was assigned a probability of
less than three‐fifths by 2030, and that civil servants of most countries are routinely trained in foresight and decision‐
making was given a probability of two‐fifths by 2030.
There are already 25 government futures strategy units around the world, including 11 in developing
countries (Glenn et al., 2008b). Other approaches include long‐term state, regional and local planning mechanisms
that coordinate long‐term policy goals, often with performance indicators to improve traditional planning practices
and ensure a focus of action (Chi, 1991). This is the case of Brazil, where a Ministry of Strategic Issues was established
in 2007, merging the Institute of Applied Economic Research founded in 1964 and the Nucleo de Ações Estratégicas
(Strategic Action Unit), for a combined staff of 800. Its mandate is to create long‐range plans for 2022 (the two‐
hundredth anniversary of Brazilian independence), which have been recently published under the name Plano Brazil
2022 (SAE Brazil, n.d.). In addition to updating statistical data and analyses concerning macroeconomic and social
trends for strategic development of public policies and supervising work towards achieving the MDGs in Brazil, the
new Secretariat is also focusing on sustainable development for the Amazon, education and political participation as
key drivers for the future (Glenn et al., 2008b).
Information‐sharing platforms for government foresight practitioners can flourish, such as Africa’s Foresight
for Development, an interactive, participatory platform that aggregates, consolidates, stores and promotes foresight
knowledge and practice for Africa in the public domain. It aims to be an authoritative, interactive resource and
networking community of foresight practitioners, researchers, consumers or users and general enthusiasts (FFD, n.d.).

Global Drivers of Change 60
The uncertainty regarding the trend of using foresight in government decision‐making may be heightened by
observable trends towards societies’ priorities shifting more strongly to immediate and local issues, as a result of,
for example, high rates of unemployment, fear of ecosystem collapse or terrorism (probability of more than two‐
thirds by 2030). This could lead to staff in units being diverted by crisis management at the expense of their original
role or to a lack of funding (House of Commons, 2007) and could also limit commissions soliciting wide public
participation, since futures commissions can require a significant commitment of human and physical resources, as
well as support from key sponsors (Bezold, 2006).
3.2.10 Most important and most likely future developments: Ethics and Culture
The group responding to the RTD on ethics and culture saw the following as the most important development: ‘In
addressing human values, most people would agree that the present has an obligation to preserve opportunities for
the future’ (as opposed to governments who have agreed but have been mostly unable to put the principle into
action). This for them was also the most likely development, with a probability of it happening of two‐thirds by 2020
and three‐quarters by 2030. If applied – and not only given a formal nod – this development could lead to a shift in
world view for individuals and communities, who may find themselves questioning the short‐term interests of
business as usual approaches. This development is related to recognition of the interconnectedness of living systems,
to which participants assigned a probability of only less than two‐fifths. Participants in the Politics survey were more
optimistic, assigning this a probability of three‐quarters by 2030. Such shifts in public perceptions could provide
opportunities for improved water management if they were to occur.
The deepening of current inequalities in access to water in poor countries caused by increasing water
scarcity was ranked second in importance by this group, and they assigned this development a probability of two‐
thirds by 2020 and a bit less than three‐quarters by 2030. That these water inequalities could contribute in turn to an
increase in the gap between the rich and poor in more than a dozen countries was given a probability of more than
two‐thirds by 2030.
Creating the means for poor people to derive an income from water – for example, water points, irrigation
and food production – or the means to trade for water could be a key factor in lifting them out of poverty (Cotula et
al., 2006; Mayers et al., 2009). However, while the provision of water for drinking and irrigation is often assumed to
alleviate poverty, gender and water literature suggests that the transition to irrigation has increased the work
responsibilities of women and children (Harris, 2008), further illustrating the complexity of water‐related issues.
Participants saw the probability of inexpensive desalination technologies becoming so widely available by
2030 that nearly all people within 100 miles of coastlines would have water for their needs – thus eliminating conflicts
over water supply and use – as relatively low (probability of less than one‐half by 2030; participants in the Technology
survey gave an even lower two‐fifths probability). Such technologies would have had the impact of allowing most
users around the world to use as much water as developed nations currently, with the behavioural impact of humans

Global Drivers of Change 61
still rejecting a change in attitude towards water in the face of a perceived inexhaustible supply. This non‐realization
leads the world either to require the equivalent of five planets to fulfil our needs or to adopt ‘a sustainable paradigm
that says we all have a responsibility’ (Shiva, 2009).
Access to clean water being regarded by most countries in the world as a basic human right was considered
almost equally important. The panel regarded this as more likely than not: over more than one‐half likelihood in 2020
and more than two‐thirds in 2030. And participants assigned a probability of three‐fifths to 75 per cent or more of
nations formally ratifying international protocols recognizing water as a basic human need by 2030.
Another important series of developments for participants was the global sharing of knowledge on water‐
related issues. Participants assigned a probability of two‐thirds to the creation by 2030 of an online ‘water situation
room’ or global repository of collective intelligence on water.
The annual publication of a global water footprint measure was seen to have a likelihood of about 60 per
cent by 2030. (This was given a greater probability in the Technology survey, at three‐quarters by 2030, and in the
Economics survey, at about 80 per cent by 2030.) By indicating the water use of consumers and producers that spans
space and time, the water footprint allows these players to become potential change agents for good water
governance (Hoekstra et al., 2011).
The emergence of collaborative international research and development effort on the ethical uses of water
was given a probability of more than three‐fifths by 2020 and more than two‐thirds by 2030. The creation in 1999 of a
Sub‐Commission on the Ethics of Freshwater Use by UNESCO’s World Commission on Ethics of Science and
Technology was a significant initiative in this domain. It was followed shortly thereafter in 2001 by the establishment
of the Global Research and Ethical Network Embracing Water, whose mission is ‘to promote engagement in the
ethical issues involved in the sustainable use and equitable sharing of fresh water resources at all levels and in the
handling of and response to waterrelated emergencies and disasters’ (Brelet, 2004).
A greater understanding of how some cultures and communities respond to water and food insecurity better
than others may be useful for building capacity and resilience (Hadley and Wutich, 2009). A greater understanding of
water from different perspectives would include the involvement of women in decision‐making; since they usually are
responsible for providing water for the family in developing countries, this would ensure a greater degree of local
knowledge being available before decisions are taken and thus help avoid unintended consequences (WWAP, 2009b).
Such collaboration on ethical uses of water might result in countries developing a common ethical code in
addressing water issues, but participants viewed this as less likely, having a probability of two‐fifths of happening by
2030.
Global Drivers of Change 62
4 Responding to the challenges
It is clear that assessments of importance and estimates of when events would happen could well be different if the
composition of the groups of experts responding were different. The Focus Group participating in scenario
development will have access to the raw data of the RTD and survey exercises and will make its own selection of the
most important drivers and events. These may be further refined as the interactions between drivers are examined
qualitatively and through modelling.
Water managers know about existing and potential vulnerabilities within the systems in which they operate.
The uncertainties related to climate change, and the increased variability that comes with it, increase the risks
inherent in developing and maintaining sustainable water management systems.
Water management has to address two fundamental categories of uncertainty. The first is related to water
supply, which is dependent on the geophysical parameters that dictate water availability (precipitation, runoff,
infiltration, etc.) as well as on the impacts of human activities that affect the natural flow of water (e.g. how land use
affects storm water runoff) and water quality. Conventional analysis of historical data coupled with stochastic analysis
until now has provided a fairly good basis for examining extremes and sensitivities, robustness, resilience and
reliability under past climate variability. For water managers, this is the starting point for any realistic analysis, and
these kinds of analyses are being done routinely in most managed systems.
The second category of uncertainties relates to variability and the rate of growth in water demands. The
number and intricacy of choices seem to be growing beyond leaders’ abilities to analyze and make decisions. For
example, unforeseeable trends in the rising demand for all goods and services, including energy, affect water in some
way through production, transport or disposal. This creates new uncertainties and associated risks for water
managers.
Technological development can sometimes help, but this is not necessarily always the case. On the one hand,
the speed and relevance of new scientific discoveries and the development of technologies can provide the means to
meet water challenges. On the other hand, narrowly targeted technological development that does not take into
account impacts on water can exacerbate existing risks (e.g. the first generation of biofuel technology).
Thus the accelerating importance of forces outside the control of water managers will shape both the
challenges they face and the financial and institutional resources they will have available to meet them. The
acceleration of change reduces the time between recognizing the need to make a decision and completing all the
steps to make the right decision at the right time. Those ‘outside the water box’ who will make the decisions that
determine the conditions for water management are faced with the uncertainty of how these forces will evolve.
The multiplicity of drivers and the complex interactions between them is illustrated by Figure 4 (Gallopín,
2011).

Global Drivers of Change 63
Technologywaterenergy
Politics&Governance(incl. Security)
Water resources
Wellbeing,povertyequity
Population size&growth (water needs/demand)
Waterstresssustainability
Ecosystems&Land Use
(incl. Agriculture)
Economy(incl. Water
Infrastructure)
Climate change
Value changes(lifestyles & consumption patternssolidarity)
WATER CONSUMPTION & WITHDRAWAL
Figure 4 Key drivers and causal links affecting water stress and sustainability and human well‐being
Source: Gallopín, 2011.
Scenarios are a tool for generating desirable and plausible futures. It is important to emphasize that scenarios
are not projections, forecasts or predictions. Rather, they are stories about the future with a logical plot and narrative
governing the manner in which events unfold (Schwartz, 1991). Scenarios usually include images of the future –
snapshots of the major features of interest at various points in time – and an account of the causal flow of events
leading from the present (or the base situation) to such future conditions (Gallopín, 2011).
Since there are a myriad of drivers that determine the future situation it is rarely possible to consider all of
them simultaneously. Consequently, scenario analysis concentrates on a modest number of drivers, assesses their
combined influence on the variables of interest that characterize the future (e.g. population growth and distribution,
size of agriculture, amount of water used, etc.). Sensitivity analysis with respect to the drivers that were not included
explicitly is used to confirm the validity of the scenarios. These ‘projections’ are then used in evaluation of policy and
planning responses, so as to maximize benefits and/or minimize losses in getting to the desired state, using
‘backcasting’, which proceeds from the desired future backwards to the current situation to identify the most
effective means for moving from ‘now’ to the desired future.
Considering that the major focus of the World Water Scenarios is the future of water availability in terms of
its impacts on human well‐being (including the health of the ecosystems on which it also depends), some of the

Global Drivers of Change 64
principal causal links to be considered in building the logic (or plot) of the scenarios can already be tentatively
identified. As shown in Figure 4, in the last instance, water stress and sustainability (top oval) are a function of the
water resources available and of water withdrawal and consumption. In turn, both resources and consumption are
variables that depend on many factors; only the factors and links that are more relevant for the water scenarios are
shown here. (All drivers are to some extent interlinked; thus Figure 4 is clearly a prioritized simplification made for the
purpose of clarity.)
Human well‐being (middle oval) and water are two central criteria to assess the desirability of the scenarios.
The main drivers are arranged in the figure in a sequence from top to bottom showing the direct drivers (top row of
boxes) that directly impinge upon water stress and sustainability and the indirect drivers (bottom row of boxes) that
exert their effect mostly through their impacts upon the direct drivers. The arrows indicate causal influences between
factors. Note that in some cases there is reciprocal (feedback) causality between them, indicated by an arrow with
two blue heads (Gallopín, 2011).
Water managers can only inform their decisions and manage with the tools they have available. For them to
do so, information regarding the drivers must be developed as close as possible to the geographic scale at which they
work – thus conducting an iterative World Water Scenarios process involving the global, regional and local levels is
critical to developing the scalability and types of information needed at all levels of decision‐making.
The next phase of the Scenarios Project will develop scenarios and scenario‐development tools that can be
used by decision‐makers with the help of water managers.
References Adikari, Y. and Yoshitani, J. 2009. Global Trends in Water‐Related Disasters: An Insight for Policymakers. A World Water Development
Report 3 Side Publication. Paris, UNESCO. Available at http://www.unwater.org/downloads/181793E.pdf
Ahmed, S. 2006. Flowing upstream: negotiating gender and equity in water policy and institutional practice in India. M. Laybourne and A.
Gaynor (eds), Water: Histories, Cultures, Ecologies. Perth, University of Western Australia Press.
Alcamo, J. and Gallopín, G. 2009. Building a 2nd Generation of World Water Scenarios. World Water Assessment Programme Side
Publications Series. Paris, UNESCO. Available at http://unesdoc.unesco.org/images/0018/001817/181796e.pdf
Alcamo, J., Döll, P., Henrichs, T., Kaspar, F., Lehner, B., Rösch, T. and Siebert, S. 2003. Development and testing of the WaterGAP 2 global
model of water use and availability. Hydrological Sciences Journal, Vol. 48, pp. 317–38.
Allan, T. 2001. The Middle East Water Question – Hydropolitics and the Global Economy. London, I.B. Tauris & Co. Ltd.
Allison, I., Bindoff, N. L., Bindschadler, R. A., Cox, P. M., de Noblet, N., England, M. H., Francis, J. E., Somerville, N., Steffen, K., Steig, E. J.,
Visbeck, M. and Weaver, A. J. 2009. The Copenhagen Diagnosis, 2009: Updating the World on the Latest Climate Science. Sydney,
Australia, University of New South Wales Climate Change Research Centre. Available at
http://www.ccrc.unsw.edu.au/Copenhagen/Copenhagen_Diagnosis_LOW.pdf
Global Drivers of Change 65
ASCE (American Society for Civil Engineers). 2009. America’s 2009 Report Card for Infrastructure. Reston, Va., ASCE. Available at
http://www.infrastructurereportcard.org/sites/default/files/RC2009_full_report.pdf
Bakan, J. 2004. The Corporation, New York, Free Press.
Baker, G. and Chandler, D. 2005. Global Civil Society and the Future of World Politics. Global Civil Society: Contested Futures. London,
Routledge.
Barata, P. M. 2010. Emissions trading schemes and the future of the carbon economy. In Environment at the Crossroads: Aiming for a
Sustainable Future. Manchester, UK, Fondação Calouste Gulbenkian. Carcanet.
Barbier, E. B. 1993. Sustainable use of wetlands: valuing tropical wetland benefits—economic methodologies and applications. The
Geographical Journal, Vol. 159, pp. 22–32.
Barlow, M. 2007. Our Water Commons: Toward a New Freshwater Narrative. Onthecommons.org, the commons. Ottawa, The Council of
Canadians.
Barro, R. J. 1999. Determinants of democracy. The Journal of Political Economy, Vol. 107, No. 6, Part 2: Symposium on the Economic
Analysis of Social Behavior in Honor of Gary S. Becker, pp. S158–83. Available at http://nrs.harvard.edu/urn‐
3:HUL.InstRepos:3451297
Bartholet, J. 2011. When will scientists grow meat in a petri dish? Scientific American. May 17. Available at
http://www.scientificamerican.com/article.cfm?id=inside‐the‐meat‐lab
Bauwens, M. 2005. P2p and Human Evolution: Peer to Peer as the Premise of a New Mode of Civilisation. Available at
http://noosphere.cc/P2P2bi.htm
Bennis, P. 2006. Challenging Empire: How People Governments and the U.N. Defy U.S Power. Northampton, Mass., Olive Branch Press.
Bezold, C. 2006. Anticipatory democracy revisited. Mika Mannermaa, Jim Dator and Paula Tiihonen (eds), Democracy and Futures.
Parliament of Finland Committee for the Future.
Bosco, D. L. 2009. Five to Rule Them All: The UN Security Council and the Making of the Modern World. New York, Oxford University Press.
Braun, V. J. and Meinzen‐Dick, R. 2009. “Land Grabbing” by Foreign Investors in Developing Countries: Risks and Opportunities. IFPRI
Policy Brief 13. Washington, DC, International Food Policy Research Institute (IFPRI).
Brelet, C. 2004. Best Ethical Practice in Water Use. World Commission on the Ethics of Scientific Knowledge and Technology. Paris,
UNESCO.
Brown, L. R. 2008. Plan B 3.0 – Mobilizing to Save Civilization. New York W. W. Norton & Company.
———. 2009. Plan B 4.0 by the numbers – Data highlights on selling our future. Washington, DC, Earth Policy Institute. Available at
http://www.earth‐policy.org/index.php?/press_room/C68/pb4_ch1_datarelease
Burke, E. J., Brown, S. J. and Christidis, N. 2006. Modeling the recent evolution of global drought and projections for the twenty‐First
century with the Hadley Centre Climate Model. Journal of Hydrometeorology, Vol. 7, No. 5, pp. 1113–25.
Byass, P. 2008. Towards a global agenda on ageing. Global Health Action. DOI: 10.3402/gha.v1i0.1908. Available at
http://www.ncbi.nlm.nih.gov/pmc/articles/PMC2779918
Caldwell, J. C. 2004. The implications of the United Nations long‐range population projections. United Nations Department of Economic
and Social Affairs, Population Division, World Population to 2300, Part Two. New York, United Nations, pp. 112–22.
Calvert‐Henderson. n.d. Calvert‐Henderson Quality of Life Indicators. Available at http://www.calvert‐henderson.com

Global Drivers of Change 66
Campbell‐Lendrum, D., Kovats, R. S., Mcmichael, A. J., Corvalan, C., Menne, B. and Pruss‐Ustun, A. 2005. The Global Burden of Disease due
to Climate Change: Quantifying the Benefits of Stabilization for Human Health. Abstract of paper presented at Avoiding
Dangerous Climate Change – International Symposium on the Stabilization of Greenhouse Gas Emissions, Hadley Centre, Exeter
UK, February. Available at http://www.stabilisation2005.com/39_Sari_Kovats.pdf
CAN WA (Community Arts Network Western Australia). 2009. Captain Cool Gudia, The Monster and the Girl: The Story of the Rock Hole
Long Pipe Project. Perth, Australia, CAN WA.
Capra, F. 2002. The Hidden Connections: Integrating the Biological Cognitive and Social Dimensions of Life into a Science of Sustainability.
New York, Harper Collins.
Carr, G. M. and Neary, J. P. 2008. Water Quality for Ecosystem and Human Health, 2nd ed. Burlington, Canada, United Nations
Environment Programme, Global Environment Monitoring System. Available at
http://www.gemswater.org/publications/pdfs/water_quality_human_health.pdf
CFR (Council on Foreign Relations). 2006. Climate Security: Risks and Opportunities for the Global Economy. New York, CFR. Available at
http://www.cfr.org/publication/11511/climate_security.html
Chi, K. S. 1991. Foresight activities in state government. Futures Research Quarterly, Winter.
———. 2008. State Governance Transformation: Why and How. Lexington, Ky., Council of State Governments.
Chowdhury, N. T. 2010. Water management in Bangladesh: an analytical review. Water Policy, Vol. 12, No.1, pp. 32–51.
Christensen, K., Doblhammer, G., Rau, R. and Vaupel, J. W. 2009. Ageing populations: the challenge ahead. Lancet. 3 October.
Ciruna, K. A., Meyerson, L. A. and Gutierrez, A. 2004. The Ecological and Socio‐economic Impacts of Invasive Alien Species in Inland Water
Ecosystems. Report to the Convention on Biological Diversity on behalf of the Global Invasive Species Programme, Washington,
DC.
CNA Corporation. 2007. National Security and the Threat of Climate Change. Alexandria, Va., CNA Corporation. Available at
http://securityandclimate.cna.org/report/National per cent20Security per cent20and per cent20the per cent20Threat per
cent20of per cent20Climate per cent20Change.pdf
Cocks, D. 2003. Deep Futures: Our Prospects for Survival. Sydney, University of New South Wales Press.
Collins Center for Public Policy. 2008. Century Commission Water Congress 2008. Available at
http://www.collinscenter.org/?page=WaterCongressHome
CONAGUA (National Water Commission, Government of Mexico). n.d. The CONAGUA in Action. Available at
http://www.conagua.gob.mx/english07/publications/Conagua%20in%20action%20carta%20cor.pdf
Cookson, C. 2010. Food science: rewards of precision farming. Financial Times, January 26. Available at
http://www.ft.com/cms/s/0/ad6e3492‐0a00‐11df‐8b23‐00144feabdc0.html#axzz1Sb4Es86w
Cooley, H., Gleick, P. and Wolff, G. 2006. Desalination with a Grain of Salt: A California Perspective. Oakland, Calif., Pacific Institute for
Studies in Development, Environment, and Security. Available at http://www.pacinst.org/reports/desalination/index.htm
Cosgrove, W. J. 2010. Public Participation to Promote Water Ethics and Transparency. Work In Draft. Unpublished.
Cosgrove, W. J. and Rijsberman, F. R. 2000. World Water Vision: Making Water Everybody’s Business. London, Earthscan Publications.
Available at http://www.worldwatercouncil.org/index.php?id=946&L=0target per cent3D_bla
Global Drivers of Change 67
Cotula, L., Hesse, C., Sylla, O., Thébaud, B., Vogt, G. and Vogt, K. 2006. Land and Water Rights in the Sahel: Tenure Challenges of
Improving Access to Water for Agriculture. London, International Institute for Environment and Development.
Dahle, K. 1999. Towards responsibility for future generations: five possible strategies for transformation. Tae‐Chang Kim and James A.
Dator (eds), Co‐Creating a Public Philosophy for Future Generations. Praeger.
Delgado, C. L., Wada, N., Rosegrant, M. W., Meijer, S. and Ahmed, M. 2003. Outlook for Fish to 2020: Meeting Global Demand.
Washington DC, International Food Policy Research Institute. Available at
http://www.ifpri.org/sites/default/files/pubs/pubs/fpr/pr15.pdf
Demeny, P. 2004. Population futures for the next three hundred years: soft landing or surprises to come? United Nations Department of
Economic and Social Affairs, Population Division, World Population to 2300, Part Two. New York, United Nations, pp. 137–44.
Desruelle, P. 2008. Insights from the FORLEARN mutual learning process. Séminaire Pour une Demarche de Prospective Stratégique au
Luxembourg? Luxembourg, 23 January, PPT presentation.
DOE (U.S. Department of Energy), 2002. Domestic Water Conservation Technologies. Office of Energy Efficiency and Renewable Energy,
Federal Energy Management Program Federal Technology Alerts, October. Available at
http://www1.eere.energy.gov/femp/pdfs/22799.pdf
Eisler, R. 1991. Cultural evolution: social shifts and phase changes. E. Laszlo (ed.), The New Evolutionary Paradigm. New York, Gordon and
Breach.
———. 1995. The Chalice and the Blade. New York, Harper Collins.
Ericson, J. P., Vorosmarty, C. J., Dingman, S. L., Ward, L. G. and Meybeck, M. 2005. Effective sea‐level rise and deltas: causes of change
and human dimension implications. Global and Planetary Change, Vol. 50, pp. 63–82.
Fagan, B. 2009. Floods, Famines and Emperors – El Niño and the Fate of Civilizations (Tenth Anniversary Edition). New York, Basic Books.
Falkenmark, M. et al. 2007. Agriculture, water, and ecosystems: avoiding the costs of going too far. Molden, op. cit., pp. 233–76.
FAO (Food and Agriculture Organization). 2002. World Agriculture: Towards 2015/2030 – Summary Report. Rome. Available at
http://www.fao.org/documents/pub_dett.asp?pub_id=67338&lang=en
———. 2006. World Agriculture: Towards 2030/2050. Prospects for Food, Nutrition, Agriculture and Major Commodity Groups. Global
Perspective Studies Unit, Rome.
———. 2008a. Sustainable Land Management Fact Sheet. Rome. Available at http://www.fao.org/docrep/010/ai559e/ai559e00.htm
(Accessed 17 July 2011.)
———. 2008b. The State of World Fisheries and Aquaculture. Rome.
———. 2009. Climate Change Implications for Fisheries and Aquaculture. Rome.
———. 2010. Fishery and Aquaculture Statistics. 2008 Yearbook. Rome. Available at http://www.fao.org/docrep/013/i1890t/i1890t.pdf.
———. n.d.a. Hunger Portal. Available at www.fao.org/hunger (Accessed 17 July 2011.)
———. n.d.b. World Food Situation. Available at http://www.fao.org/worldfoodsituation/wfs‐home/foodpricesindex/en/ (Accessed 17
July 2011.)
Faruqui, N. 2003. Balancing between the eternal yesterday and the eternal tomorrow. Caroline Figueres, Cecilia Tortajada, Johan
Rockstrom (eds), Rethinking Water Management: Innovative Approaches to Contemporary Issues. London, Earthscan. Available at
http://www.idrc.ca/uploads/user‐S/10638196231EconomicGlobalisation__IDRC.doc

Global Drivers of Change 68
Faurès, J. M. et al. 2007. Reinventing irrigation. Molden, op. cit., pp. 353–94.
Ferri, C. P., Prince, M., Brayne, C., Brodaty, H., Fratiglioni, L., Ganguli, M., Hall, K., Hasegawa, K., Hendrie, H., Huang, Y., Jorm, A., Mathers,
C., Menezes, P., Rimmer, E., Scazufca, M. and Alzheimer’s Disease International. 2005. Global prevalence of dementia: a Delphi
consensus study. Lancet, 17 December, pp. 2112–17.
FFD (Foresight For Development). n.d. Available at http://www.foresightfordevelopment.org/2 (Accessed 25 August 2010.)
Florini, A. 2003. The Coming Democracy. Washington, DC, Island Press.
Foreign Policy, 2010. 2010 Failed State Index. Available at
http://www.foreignpolicy.com/articles/2010/06/21/the_failed_states_index_2010
Freedom House. Freedom in the World 2010. Available at http://www.freedomhouse.org/template.cfm?page=505
Gallopín, G. C. 2011. Using Water Wisely: Five Stylized World Water Scenarios (in Review). Paris, World Water Assessment Programme,
UNESCO.
Galtung, J. 2004. Imagining global democracy. Development and Change, Vol. 35, p. 1073.
Gangol, P. 2009. Hydro Power 2009 4th International Hydropower Convention: Hydropower for Progress of Nepal. Hydro Nepal: Journal
of Water, Energy and Environment, No. 5, pp. 71–73.
Ghosh, G. 2007. Marks, W. E. (ed.), Water Voices from Around the World, Edgartown, Mass., William E Marks Inc., p. 83.
Gidley, J. 2007. The evolution of consciousness as a planetary imperative: an integration of integral views. Integral Review: A
Transdisciplinary and Transcultural Journal for New Thought, Research and Praxis, Vol. 5, pp. 4–226.
Gill, D., Pride, S., Gilbert, H. and Norman, R. 2010. The Future State. Institute of Policy Studies Working Paper 10/08. Institute of Policy
Studies, School of Government, Victoria University of Wellington, Wellington NZ.
Gleick, P. H. 2002. Dirty Water: Estimated Deaths from Water‐Related Diseases 2000–2020. Oakland, Calif., Pacific Institute for Studies in
Development, Environment and Security. Available at
http:/www.pacinst.org/reports/water_related_deaths/water_related_deaths_report.pdf
———. 2008. The World’s Water 2008–2009. The Biennial Report on Freshwater Resources. Washington, DC, Island Press.
Glenn, J., Dator, J. and Gordon, T. 2008a. Does futures research help decisionmaking? two views., J. C. Glenn, T. J. Gordon and E. Florescu
(eds), 2008 State of the Future, accompanying CD, Appendix M3: Background on Futures Research, Washington, DC, The
Millennium Project; Available at http://www.futures.hawaii.edu/dator/futures/Foresightgl.pdf
Glenn, J. C., Gordon, T. J. and Florescu, E. 2008b. 2008 State of the Future, Chapter 4: Government future strategy units and some
potentials for international strategic coordination. Washington, DC, The Millennium Project.
———. 2009. 2009 State of the Future. Washington, DC, The Millennium Project.
———. 2010. 2010 State of the Future. Washington DC, The Millennium Project.
Global Footprint Network. n.d. Home page available at http://www.footprintnetwork.org/en/index.php/GFN/
Global Policy Forum. n.d. Water in Conflict. Available at http://www.globalpolicy.org/the‐dark‐side‐of‐natural‐resources/water‐in‐
conflict.html
Global Water Partnership. 2009. Lessons from Integrated Water Resources Management in Practice. Policy Brief #9. Stockholm, Global
Water Partnership. Available at http://www.gwptoolbox.org/images/stories/gwplibrary/policy/pb_9_english.pdf

Global Drivers of Change 69
Gordon, J., Finlayson, F. M. and Falkenmark, M. 2010. Managing water in agriculture for food production and other ecosystem services.
Agricultural Water Management, Vol. 97, pp. 512–19.
Gordon, T. J. 2009. The Real‐time Delphi method. J. C. Glenn and T. J. Gordon (eds), Futures Research Methodology—Version 3.0.
Washington, DC, The Millennium Project. Excerpt available at http://www.millennium‐project.org/millennium/RTD‐method.pdf
Grant, J. K. 2008. Against the flow: institutions and Canada’s water‐export debate. M. Sproule‐Jones, C. Johns and B. T. Heinmiller (eds),
Canadian Water Politics – Conflicts and Institutions. Montreal, McGill‐Queen’s University Press.
Hadley, C. and Wutich, A. 2009. Experience‐based measures of food and water security: biocultural approaches to grounded measures of
insecurity. Human Organization, Vol. 68, pp. 451–60.
Hall, E. T. and Hall, M. R. 1990. Understanding Cultural Differences. Yarmouth, Maine, Intercultural Press.
Hansen, J. et al. 2008. Target atmospheric CO2: where should humanity aim? Open Atmospheric Science Journal, Vol. 2, pp. 217–31.
Harris, L. M. 2008. Water rich, resource poor: intersections of gender, poverty, and vulnerability in newly irrigated areas of southeastern
Turkey. World Development, Vol. 36, pp. 2643–62.
Harte. 2007. Cited in Speidel, J. J., Weiss, D. C., Ethelston, S. A. and Gilbert, S. M. 2009. Population policies, programmes and the
environment. Philosophical Transactions of the Royal Society B, Vol. 364, pp. 3049–65.
Henderson, H. 2007. Ethical Markets: Growing the Green Economy. White River Junction, Vt., Chelsea Green.
———. 2009. More advice for summiteers on reforming the global casino. Emergency Congress – From Crisis to a Just and Sustainable
World Economy, London, February. Available at http://www.hazelhenderson.com/recentPapers/advice_for_summiteers.html
Hendricks, R. C. and Bushnell, D.M. 2009. Halophytes, Algae, and Bacteria Food and Fuel Feedstocks. Cleveland, Ohio, NASA Glenn
Research Center. Available at http://gltrs.grc.nasa.gov/reports/2009/TM‐2009‐215294.pdf
Hoekstra, A., Chapagain, A., Aldaya, M. and Mekonnen, M. 2011. The Water Footprint Assessment Manual: Setting the Global Standard.
London, Earthscan. Available at http://www.waterfootprint.org/downloads/TheWaterFootprintAssessmentManual.pdf
Hofstede, G. 1980. Culture’s Consequences: International Differences in Work‐Related Values. Beverley Hills, Calif., Sage Publications Inc.
Holland, J., Holyoak, K., Nisbett, R. and Thagard, P. 1989. Induction: Processes of Inference, Learning, and Discovery. Cambridge, Mass.,
The MIT Press.
Holling, C. S., Gunderson, L. H. and Ludwig, D. 2002. In search of a theory of adaptive change. L. H. Gunderson and C. S. Holling (eds),
Panarchy: Understanding Transformations in Human and Natural Systems. Washington, DC, Island Press.
House of Commons. 2007. Governing the Future: Second Report of Session 2006‐07, Volume 1, Public Administration Select Committee.
London: The Stationery Office.
Hsu, J. 2008. The secrets of storytelling. Scientific American Mind, Vol. 19, No. 4.
Huang, Y., Fipps, G., Maas, S. and Fletcher, R. 2005. Airborne Multispectral Remote Sensing Imaging for Detecting Irrigation Canal Leaks in
the Lower Rio Grande Valley. 20th Biennial Workshop on Aerial Photography, Videography, and High Resolution Digital Imagery
for Resource Assessment, October 4–6, Weslaco, Tex. Available at http://idea.tamu.edu/documents/YanboHuang.pdf
Hunt, C. E. 2004. Thirsty Planet: Strategies for Sustainable Water Management. London, Zed Books.
Huntington, S. P. 1996. The Clash of Civilisations and the Remaking of World Order. London, Simon and Schuster.

Global Drivers of Change 70
IBM Corporation. 2009. Water: A Global Innovation Outlook Report. Available at Error! Hyperlink reference not
valid.http://www.ibm.com/gio.
IEA (International Energy Agency). 2010a. World Energy Outlook 2010 Factsheet – How Green Will the Energy Future Be? Paris, IEA/OECD.
Available at http://www.iea.org/weo/docs/weo2010/factsheets.pdf
———. 2010b. World Energy Outlook 2010. Presentation to the Press. London, 9 November. Available at
http://www.worldenergyoutlook.org/docs/weo2010/weo2010_london_nov9.pdf
IGBP (International Geosphere–Biosphere Programme). n.d. Home page available at http://igbp.sv.internetborder.se/ (Accessed 23
August 2010.)
IHDP (International Human Dimensions Programme on Global Environmental Change). n.d. Home page available at
http://www.ihdp.unu.edu/ (Accessed 23 August 2010.)
ILO (International Labour Office). 2010. World of Work Report 2010: From One Crisis to the Next? Geneva, ILO. Available at
http://www.ilo.org/wcmsp5/groups/public/‐‐‐dgreports/‐‐‐dcomm/documents/publication/wcms_145078.pdf
IMF (International Monetary Fund). 2011. World Economic Outlook: Tensions from the Two‐Speed Recovery: Unemployment,
Commodities, and Capital Flows. Washington, DC, IMF. Available at
http://www.imf.org/external/pubs/ft/weo/2011/01/pdf/text.pdf
Inayatullah, S. 1999. Leadership, evil and future generations. Tae‐Chang Kim and James A. Dator (eds), Co‐Creating a Public Philosophy for
Future Generations, Praeger.
———. 2002. Causal layered analysis: poststructuralism as method. Available at
http://www.metafuture.org/Articles/CausalLayeredAnalysis.htm
India Water Portal. 2010. CSR Activities in Water Harvesting and Watershed Interventions. Available at
http://www.indiawaterportal.org/node/6867
IPCC (Intergovernmental Panel on Climate Change). 2005. Carbon Dioxide Capture and Storage. Summary for Policymakers. IPCC Special
Report. Geneva, IPCC. Available at http://www.ipcc.ch/pdf/special‐reports/srccs/srccs_summaryforpolicymakers.pdf
———. 2007a. Annex II: glossary of synthesis report. A. P. M. Baede, (ed.), IPCC Fourth Assessment Report: Climate Change 2007:
Synthesis Report. Geneva, IPCC. Available at http://www.ipcc.ch/pdf/assessment‐report/ar4/syr/ar4_syr_appendix.pdf
———. 2007b. Climate Change 2007: Synthesis Report: Summary for Policymakers. Geneva, IPCC. Available at
http://www.ipcc.ch/pdf/assessment‐report/ar4/syr/ar4_syr_spm.pdf
———. 2008. Climate Change and Water. Technical Paper of the Intergovernmental Panel on Climate Change. Geneva, IPCC. Available at
http://www.ipcc.ch/pdf/technical‐papers/climate‐change‐water‐en.pdf
IUCN (International Union for Conservation of Nature). n.d. Freshwater Biodiversity Unit home page. Available at
http://www.iucn.org/about/work/programmes/species/our_work/about_freshwater/ (Accessed 11 July 2011.)
———. 2011. World Wetlands Day – Healthy Forests, Healthy Wetlands. Available at
http://www.iucn.org/about/union/commissions/wcpa/wcpa_focus/?6866/World‐Wetlands‐Day‐‐Healthy‐forests‐healthy‐
wetlands (Accessed 11 July 2011.)
Jacobs, K. 2002. Connecting Science, Policy, and Decisionmaking: A Handbook for Researchers and Science Agencies, Washington, DC,
Office of Global Programs, National Oceanic and Atmospheric Administration.

Global Drivers of Change 71
Jones, J. 2010. Researchers seek to automate pipeline repair. Civil Engineering, Vol. 80, No. 5, p. 44.
Kaldoor, M. 2003. Global Civil Society: An Answer to War. Cambridge, U.K., Polity.
Kao, H. M., Ren, H., Lee, C. S., Chang, C. P., Yen, J. Y. and Lin, T. H. 2009. Determination of shallow water depth using optical satellite
images. International Journal of Remote Sensing, Vol. 30, No. 23, pp. 6241–60.
Kelleher, A. 2005. Corporations and global governance: a multi‐cultural futures perspective. Journal of Futures Studies, Vol. 10, pp. 49–62.
———. 2009. Global governance: from neoliberalism to a planetary civilisation. Social Alternatives, Vol. 28, pp. 42–47.
———. 2010. Water forever: the foresight story. Article in draft.
Khanna, V., Bakshi, B. R. and Lee, J. L. 2008. Carbon nanofiber production: life cycle energy consumption and environmental impact.
Journal of Industrial Ecology, Vol. 12, No. 3, pp. 394–410.
Kluckholn, C. and Strodbeck, F. 1961. Variations in Value Orientations. Evanston, Ill., Row, Peterson.
Komnenic, V., Ahlers, R. and Zaag, P. V. D. 2009. Assessing the usefulness of the water poverty index by applying it to a special case: can
one be water poor with high levels of access? Physics and Chemistry of the Earth, Vol. 34, pp. 219–24.
Korten, D. C. 2001. When Corporations Rule the World. San Francisco, Berrett‐Koehler Publishers.
Laszlo, E. 2008. Quantum Shift in the Global Brain: How the New Scientific Reality Can Change Us and Our World. Rochester, Vt., Inner
Traditions.
Lingard, J. 2002. Agricultural subsidies and environmental change (sample article). Encyclopedia of Global Environmental Change.
Hoboken, N.J., John Wiley & Sons, Ltd. Available at http://www.wiley.com/legacy/wileychi/egec/pdf/GB403‐W.PDF
Liu, X., Zhang, P., Li, X., Chen, H., Dang, Y., Larson, C., Roco, M. C. and Wang, X. 2009. Trends for nanotechnology development in China,
Russia, and India. Journal of Nanoparticle Research, Vol. 11, No. 8, pp. 1845–66.
Lopez‐Gunn, E. and Jarvis, W. T. 2009. Groundwater governance and the Law of the Hidden Sea. Water Policy, Vol. 11, No. 6, pp. 742–62.
Loures, F., Rieu‐Clarke A. and Vercambre M. L. 2010. Everything You Need to Know about the UN Watercourses Convention. Gland,
Switzerland, WWF. Available at
http://wwf.panda.org/what_we_do/how_we_work/policy/conventions/water_conventions/un_watercourses_convention
Luzi, S. 2010. Driving forces and patterns of water policy making in Egypt. Water Policy, Vol. 12, No. 1, pp. 92–113.
MA (Millennium Ecosystem Assessment). 2005. Ecosystem and Human Well‐being: Wetlands and Water Synthesis. Washington, DC,
World Resources Institute.
Mackie, T. T. and Hogwood, B. 1984. Decision Arenas in Executive Decision Making: Cabinet Committees in Comparative Perspective.
British Journal of Political Science, Vol. 14, No. 3, pp. 285–312.
Margat, J. 2008. Les Eaux Souterraines dans le Monde. Paris, BRGM Éditions/UNESCO‐PHI.
Marks, W. E. (ed.). 2007. Water Voices from Around the World. Edgartown, Mass., William E Marks Inc.
Marquardt, M. J. 2000. Action learning and leadership. The Learning Organization, Vol. 7, No. 5, pp. 233–41.
Marques, G. F., Lund, J. R. and Howitt, R. E. 2005. Modeling irrigated agricultural production and water use decisions under water supply
uncertainty. Water Resources Research, Vol. 41, W08423, doi:10.1029/2005WR004048.
Marsick, V. 1998. Transformative learning from experience in the knowledge era. Daedalus, Vol. 127, pp. 119–37.
Global Drivers of Change 72
Mayers, J., Batchelor, C., Bond, I., Hope, R. A., Morrison, E. and Wheeler, B. 2009. Water Ecosystem Services and Poverty under Climate
Change: Key Issues and Research Priorities. Natural Resource Issues No. 17. London, International Institute for Environment and
Development.
McNeill, J. R. 2000. Something New Under the Sun: An Environmental History of the Twentieth‐century World. New York, W.W. Norton &
Company, Inc.
Millennium Project. n.d. State of the Future Index (SOFI). Available at http://www.millennium‐project.org/millennium/SOFI.html
Minhas, P. S. and Samra, J. S. 2004. Wastewater Use in Peri‐urban Agriculture: Impacts and Opportunities. Karnal, India: Central Soil
Salinity Research Institute.
Molden, D. (ed.). 2007. Water for Food, Water for Life: A Comprehensive Assessment of Water Management in Agriculture. London:
Earthscan and Colombo, Sri Lanka: International Water Management Institute.
Molden, D. et al., 2007. Pathways for increasing agricultural water productivity. Molden, op. cit., pp. 279–310.
Morrison, J., Morikawa, M., Murphy, M. and Schulte, P. 2009. Water Scarcity & Climate Change: Growing Risks for Businesses & Investors.
Boston, Ceres.
Murphy, H. M., Mcbean, E. A. and Farahbakhsh, K. 2009. Appropriate technology – A comprehensive approach for water and sanitation in
the developing world. Technology in Society, Vol. 31, pp. 158–67.
Narain, S. n.d. Bottled Water Costs Us the Earth. New Delhi, Centre for Science and Environment. Available at
http://www.cseindia.org/node/694
Narain, P., Khan, M. A., and Singh, G. 2005. Potential for Water Conservation and Harvesting against Drought in Rajasthan, India. Working
Paper 104, Drought Series Paper 7. Colombo, Sri Lanka, International Water Management Institute.
NASA (National Aeronautics and Space Administration). Progressive plant growing has business blooming. Spinoff 2006. Washington, DC,
NASA, pp. 64–67. Available at http://www.nasa.gov/pdf/164449main_spinoff_06.pdf
NEF. n.d. The (Un)Happy Planet Index 2.0. Available at http://www.happyplanetindex.org/
Nellemann, C., MacDevette, M., Manders, T., Eickhout, B., Svihus, B., Prins, A. G. and Kaltenborn, B. P. (eds). 2009. The Environmental
Food Crisis – The Environment’s Role in Averting Future Food Crises. A UNEP rapid response assessment. Nairobi, United Nations
Environment Programme and GRID‐Arendal.
OECD (Organisation for Economic Co‐operation and Development). n.d. Paris Declaration and Accra Agenda for Action. Available at
http://www.oecd.org/document/18/0,3343,en_2649_3236398_35401554_1_1_1_1,00.html
Ohlsson, L. 1995. The role of water and the origins of conflict. L. Ohlsson (ed.), Hydropolitics. London, Zed Books Ltd.
Olshansky, S. J. 2004. The future of human life expectancy. United Nations Department of Economic and Social Affairs, Population
Division, World Population to 2300, Part Two. New York, United Nations, pp. 159–64.
Orr, S., Cartright, A. and Tickner, D. 2009. Understanding Water Risks – A Primer on the Consequences of Water Scarcity for Government
and Business. WWF Water Security Series 4. Godalming, U.K., World Wildlife Fund‐UK.
Pembina Institute. n.d. Genuine Progress Indicator. Available at http://www.pembina.org/economics/gpi
Pew Center on Global Climate Change and the Pew Center on the States. n.d. Climate Change 101: Preparing for a Warming World.
Arlington, Va, Pew Center. Available at http://www.pewclimate.org/docUploads/Adaptation_0.pdf
Qadir, M. et al., 2007. Agricultural use of marginal‐quality water: opportunities and challenges. Molden, op. cit., pp. 425–57.
Global Drivers of Change 73
Qadir, M., Wichelns, D., Raschid‐Sally, L., McCornick, P. G., Drechsel, P., Bahri, A. and Minhas, P. S. 2010. The challenges of wastewater
irrigation in developing countries. Agricultural Water Management, Vol. 97, No. 4, pp. 561–68.
Ramsar (Ramsar Convention on Wetlands). 2010. Reservoirs of Biodiversity. Factsheet 6. Available at
http://www.ramsar.org/pdf/info/services_06_e.pdf (Accessed 11 July 2011.)
———. n.d. Home page available at http://www.ramsar.org/cda/en/ramsar‐home/main/ramsar/1_4000_0__
Raskin, P., Banuri, T., Gallopín, G., Gutman, P., Hammond, A., Kates, R. and Swart, R. 2002. Great Transition: The Promise and Lure of the
Times Ahead. Boston, Stockholm Environment Institute.
Richards, J. F. 1990. Land transformation. B. L. Turner (ed.), The Earth as Transformed by Human Action. New York, Cambridge University
Press with Clark University.
Richter, B., Mathews, R., Harrison, D. and Wigington, R. 2003. Ecologically sustainable water management: managing river flows for
ecological integrity. Ecological Applications, Vol. 13, No. 1, pp. 206–24.
Ringler, C., Bryan, E., Biswas, A., and Cline, S. A. 2010. Water and food security under global change. C. Ringler, A. K. Biswas and S. Cline
(eds), Global Change: Impacts on Water and Food Security. Berlin, Springer‐Verlag, pp. 3–15.
Risse, T., Ropp, S. and Sikkink, K. 1999. The Power of Human Rights: International Norms and Domestic Change. Cambridge, U.K.,
Cambridge University Press.
Rockström, J. et al. 2007. Managing water in rainfed agriculture. Molden, op. cit. pp. 315–52.
Rollins, J., Wyler, L. S. and Rosen, S. 2010. International Terrorism and Transnational Crime: Security Threats, U.S. Policy, and
Considerations for Congress. Washington, DC, Congressional Research Service.
Rosegrant, M. W., Cline, S. A. and Valmonte‐Santos, R. A. 2010. Global water and food security: megatrends and emerging issues. C.
Ringler, A. K. Biswas and S. Cline (eds), Global Change: Impacts on Water and Food Security, Berlin, Springer‐Verlag, pp. 17–47.
Rozema, J. and Flowers, T. 2008. Crops for a salinized world. Science, Vol. 322, No. 5907, pp. 1478–80.
SAE Brazil, n.d. Plano Brazil 2022. Available at http://www.sae.gov.br/brasil2022/ (Accessed 25 August 2010.)
Sahagian, D., Schwartz, F. W. and Jacobs, D. K. 1994. Direct anthropogenic contributions to sea level rise in the twentieth century. Nature,
No. 367, pp. 54–56.
Saint‐Onge, H., 2004. Building the Conductive Organization…The Key Propositions. ICM Gathering, San Francisco. Available at
http://www.saintongealliance.com/ConductiveOrg(sept2004).pdf
Saint‐Onge, H. and Armstrong, C. 2004. The Conductive Organization: Building Beyond Sustainability. Butterworth‐Heinemann.
Sandel, M. J. 1996. America’s search for a new public philosophy. The Atlantic Monthly, Vol. 277, No. 3, pp. 57–74.
Santiso, J. 2010. Emerging Markets: The End of an Artificial Category? The Globalist.com, 23 July. Available at
http://www.theglobalist.com/storyid.aspx?StoryId=8399
Schwartz, P. 1991. The Art of the Long View. New York, Doubleday Business.
Sen, A. 2006. Identity and Violence: The Illusion of Destiny. London, Penguin Allen Lane.
Seppala, O. T. 2002. Effective water and sanitation policy reform implementation: need for systemic approach and stakeholder
participation. Water Policy, Vol. 4, No. 4, pp. 367–88.
Global Drivers of Change 74
Shiklomanov, I. A. 1999. World Water Resources at the Beginning of the 21st Century. Prepared for the International Hydrological
Programme, UNESCO, St. Petersburg, Russian Federation. Available at http://webworld.unesco.org/water/ihp/db/shiklomanov/
Shiva, V. 2002. The Principles of Water Democracy. Water Wars: Privatization, Pollution, and Profit. Cambridge, Mass., South End Press.
———. 2009. Soil not oil. Alternatives Journal, Vol. 35, pp. 19–21.
Siebert, S., Burke, J., Faures, J. M., Frenken, K., Hoogeveen, J., Döll, P. and Portman, F. T. 2010. Groundwater use for irrigation – a global
inventory. Hydrology and Earth System Sciences, Vol. 14, pp. 1863–80.
SIWI (Stockholm International Water Institute). 2009. Overarching Conclusions 2009: Responding to Global Changes: Accessing Water for
the Common Good. Stockholm. Available at
http://www.worldwaterweek.org/documents/Resources/Synthesis/Overarching_Conclusions_2009.pdf
Skrzeszewski, S. 2002. Global Republics – a Meta‐Model for Global Governance. Bethesda, Md., World Futures Society.
Slaughter, R. 2009. Beyond The Threshold – Overviews of 14 Climate Change Related Works. Brisbane, Australia. Available at
http://richardslaughter.com.au/wp‐content/uploads/2009/04/Threshold_Overviews.pdf
Snowden, D. J. 2005. Narrative patterns: the perils and possibilities of using story in organisations. Knowledge Management, Vol. 4, No.
10.
Solomon, S. 2010. Water – The Epic Struggle for Wealth, Power and Civilization. New York, HarperCollins Publishers.
Speidel, J. J., Weiss, D. C., Ethelston, S. A. and Gilbert, S. M. 2009. Population policies, programmes and the environment. Philosophical
Transactions of the Royal Society B, Vol. 364, pp. 3049–65.
Stern, N. 2006. The Economics of Climate Change: The Stern Review. Cambridge, U.K., Cambridge University Press.
Stiglitz, J. 2007. Making Globalization Work. New York, W. W. Norton & Company.
Sule, S. 2005. 1000 Year‐Old Tradition Keeps Them Together. World Prout Assembly. Available at
http://www.worldproutassembly.org/archives/2005/07/1000_yearold_tr.html
Suzuki, D. and Dressel, H. 1999. From Naked Ape to Superspecies : A Personal Perspective on Humanity and the Global Eco‐Crisis. St
Leonards, Australia, Allen & Unwin.
Tarlock, D. and Wouters, P. 2009. Reframing the water security dialogue. Journal of Water Law, Vol. 20, pp. 53–60.
Transparency International. 2008. Global Corruption Report 2008: Corruption in the Water Sector. Cambridge, U.K., Cambridge University
Press. Available at http://www.transparency.org/publications/gcr/gcr_2008
———. 2011. Global Corruption Report: Climate Change. London, Earthscan. Available at
http://www.transparency.org/publications/gcr/gcr_climate_change2
Traub, J. 2006. The Best Intentions: Kofi Annan and the UN in the Era of American World Power. New York, Farrar, Straus and Giroux.
Triandis, H. C. 2009. The Ibadan Conference and Beyond: Online Readings in Psychology and Culture, Unit 17, Chapter 2. Ibadan, Nigeria.
Trompenaars, F. and Hampden‐Turner, C. 2001. Riding the Waves of Culture. London, Brearly Publishing.
2030 Water Resources Group. 2009. Charting Our Water Future: Economic Frameworks to Inform Decision‐making. Washington, DC,
McKinsey & Company.

Global Drivers of Change 75
UCAR (University Corporation for Atmospheric Research). 2009. Water levels dropping in some major rivers as global climate changes.
Press Release. Boulder, Colo. Available at http://www2.ucar.edu/news/854/water‐levels‐dropping‐some‐major‐rivers‐global‐
climate‐changes
UNGA. 2010a. Resolution Adopted by the General Assembly: 64/292 The Human Right to Water and Sanitation. New York, 3 August.
———. 2010b. Resolution Adopted by the Human Rights Council: Human Rights and Access to Safe Drinking Water and Sanitation. 6
October.
———. 2011. Resolution Adopted by the Human Rights Council: The Human Right to Safe‐Drinking Water and Sanitation. New York, 8
April.
UN (United Nations). 2008. The C.E.O Water Mandate, United Nations Global Compact. Available at
http://www.unglobalcompact.org/issues/environment/ceo_water_mandate/
———. 2010a. Keeping the Promise: A Forward‐Looking Review to Promote an Agreed Action Agenda to Achieve the Millennium
Development Goals by 2015. Report of the Secretary General. A/64/665. 12 February. New York, UN. Available at
http://www.ilo.org/public/english/bureau/pardev/download/mdg/a‐64‐665‐keepingthepromise_mdgs_2010.pdf
———. 2010b. The Millennium Development Goals Report 2010. New York, UN. Available at
http://www.un.org/millenniumgoals/pdf/MDG per cent20Report per cent202010 per cent20En per cent20r15 per cent20‐low per
cent20res per cent2020100615 per cent20‐.pdf
———. 2010c. Statement on Water Quality. World Water Day, March 22. New York, UN. Available at
http://www.unwater.org/downloads/unw_wwd_statement1.pdf
———. 2011a. The Millennium Development Goals Report 2011. New York, UN.
———. 2011b. United Nations Security Council Presidential Statement. S/PRST/2011/15. July 20. New York, UN. Available at
http://www.un.org/News/Press/docs/2011/sc10332.doc.htm
———. 2011c. United Nations Treaties Collection Website, Status of the Convention on the Law of the Non‐Navigational Uses of
International Watercourses as of 07‐24‐2011.
http://treaties.un.org/Pages/ViewDetails.aspx?src=UNTSONLINE&tabid=2&mtdsg_no=XXVII‐
12&chapter=27&lang=en#Participants (Accessed 27 July 2011.)
UNCBD (United Nations Convention on Biological Diversity). n.d. Home page available at http://www.cbd.int
UNCCD (United Nations Convention to Combat Desertification). 2011. Measuring the Value of Land: The Economics of Desertification,
Land Degradation and Drought. Bonn, UNCCD. Available at http://www.unccd.int/knowledge/docs/ATT4J7FE.pdf
———. n.d.a. Home page available at http://www.unccd.int/main.php
———. n.d.b. Water Scarcity and Desertification. Thematic fact sheet series No. 2. Bonn, UNCCD. Available at
http://www.unccd.int/documents/Desertificationandwater.pdf
UNCSD (United Nations Commission on Sustainable Development). 2011. Summary of The Transition to a Green Economy: Benefits,
Challenges and Risks from a Sustainable Development Perspective. Report by a Panel of Experts to Second Preparatory Committee
Meeting for United Nations Conference on Sustainable Development. Available at
http://www.uncsd2012.org/rio20/content/documents/Transition per cent20to per cent20a per cent20Green per
cent20Economy_summary.pdf

Global Drivers of Change 76
UNCTAD and UNEP (United Nations Conference on Trade and Development and United Nations Environment Programme). 2008. Organic
Agriculture and Food Security in Africa. New York, United Nations.
UNDESA (United Nations Department of Economic and Social Affairs). 2002. World Population Ageing: 1950–2050. New York, UNDESA.
Available at http://www.un.org/esa/population/publications/worldageing19502050/
———. 2009a. World Population Prospects, The 2008 Revision – Executive Summary. New York, UNDESA.
———. 2009b. World Population Prospects, The 2008 Revision – Highlights. New York, UNDESA. Available at
http://www.un.org/esa/population/publications/wpp2008/wpp2008_highlights.pdf
———. 2009c. World Urbanization Prospects: The 2009 Revision. File 2: Percentage of Population Residing in Urban Areas by Major Area,
Region and Country, 1950–2050. New York, UNDESA.
———. 2010. Population Facts, No. 2010/5. New York, UNDESA. Available at
http://www.un.org/esa/population/publications/popfacts/popfacts_2010‐5.pdf
———. 2011a. World Population Prospects: The 2010 Revision. File 1: Total population (both sexes combined) by five‐year age group,
major area, region and country, 1950–2100 (thousands). New York, UNDESA. Available at http://esa.un.org/unpd/wpp/index.htm
———. 2011b. World population to reach 10 billion by 2100 if fertility in all countries converges to replacement level. 2010 Revision of
the World Population Prospects Press Release. New York, UNDESA. Available at http://esa.un.org/unpd/wpp/Other‐
Information/Press_Release_WPP2010.pdf
UNDP (United Nations Development Programme). 2006. Human Development Report 2006 – Beyond Scarcity: Power, Poverty and the
Global Water Crisis. New York, Palgrave MacMillan. Available at http://hdr.undp.org/hdr2006/pdfs/report/HDR06‐complete.pdf
———. 2007. Water Governance Facility. New York, UNDP. Available at www.watergovernance.org/
UNEP (United Nations Environment Programme). 2002. Atlas of International Freshwater Agreements. Nairobi, UNEP.
http://www.transboundarywaters.orst.edu/publications/atlas/Available at
http://www.transboundarywaters.orst.edu/publications/atlas/
———. 2008. Green Jobs: Towards Decent Work in a Sustainable, Low‐Carbon World. Nairobi, UNEP. Available at
http://www.ilo.org/wcmsp5/groups/public/@dgreports/@dcomm/documents/publication/wcms_098503.pdf
———. 2009. From Conflict to Peacebuilding – the Role of Natural Resources and the Environment. Nairobi, UNEP. Available at
http://www.unep.org/publications/search/pub_details_s.asp?ID=3998
———. 2010a. Clearing the Waters: A Focus on Water Quality Solutions. Nairobi, UNEP. Available at
http://www.unep.org/PDF/Clearing_the_Waters.pdf
———. 2010b. Green Economy Report: A Preview. New York, UNEP.
———. 2010c. Sick Water? The Central Role of Wastewater Management in Sustainable Development. Nairobi, UNEP.
http://www.grida.no/_res/site/file/publications/sickwater/SickWater_screen.pdf
UNFCCC (United Nations Framework Convention on Climate Change). 2010. Fact Sheet: The Need for Adaptation. Bonn, UNFCCC.
Available at http://unfccc.int/files/press/application/pdf/adaptation_fact_sheet.pdf
———. n.d. Home page available at http://unfccc.int/2860.php
UN HABITAT (United Nations Human Settlements Programme). 2009. Planning Sustainable Cities: Policy Directions – Global Report on
Human Settlements 2009. London, Earthscan.

Global Drivers of Change 77
UNOHCHR (United Nations Office of the High Commissioner for Human Rights). Overview. Available at
http://www.ohchr.org/EN/Issues/WaterAndSanitation/SRWater/Pages/Overview.aspx (Accessed 24 July 2011.)
UN‐Water. 2010. Climate Change Adaptation: The Pivotal Role of Water. Policy Brief. New York, UN‐Water. Available at
http://www.unwater.org/downloads/unw_ccpol_web.pdf (Accessed 13 June 2010.)
USACE (United States Army Corps of Engineers). n.d. National Inventory of Dams: Dams by Completion Date. Washington, DC, USACE.
Available at http://geo.usace.army.mil/pgis/f?p=397:5:1276257431043277::NO (Accessed 27 July 2011.)
USFS (US Forest Service). n.d. Probabilistic Risk Models for Multiple Disturbances: An Example of Forest Insects And Wildfires – Project
Abstract. Prineville, Ore., USFS Western Wildland Environmental Threat Assessment Center. Available at
http://www.fs.fed.us/wwetac/projects/preisler.html
van Koppen, B., Moriarty, P. and Boelee, E. 2006. Multiple‐Use Water Services to Advance the Millennium Development Goals. Colombo,
Sri Lanka: International Water Management Institute. Available at
http://www.iwmi.cgiar.org/Publications/IWMI_Research_Reports/PDF/pub098/RR98.pdf
Van Lanen, H. A. J., Kundzewicz, Z. W., Tallaksen, L. M., Hisdal, H., Fendeková, M. and Prudhomme, C. 2009. Indices for Different Types of
Droughts and Floods at Different Scales. Water and Global Change (WATCH) Integrated Project, European Commission Sixth
Framework Programme, Global Change and Ecosystems Thematic Priority Area. WATCH Technical Report No.11. Wallingford,
U.K., Centre for Ecology & Hydrology.
Wackernagel, M. and Rees, W. E., 1996. Our Ecological Footprint: Reducing Human Impact on the Earth. Gabriola Island, Canada, New
Society Publishing.
Watson, N., Deeming, H. and Treffny, R. 2009. Beyond bureaucracy? Assessing institutional change in the governance of water in England.
Water Alternatives, Vol. 2, No. 3, pp. 448–60. Available at http://www.water‐
alternatives.org/index.php?option=com_content&task=view&id=79&Itemid=1
WBCSD (World Business Council for Sustainable Development). 2006. Business in the World of Water: WBCSD Water Scenarios to 2025.
Geneva, WBCSD.
WEF (World Economic Forum). 2011. Global Risks 2011: Sixth Edition. Geneva, WEF. Available at http://riskreport.weforum.org/global‐
risks‐2011.pdf (Accessed 17 July 2011.)
Wheatley, M. J. 2009. Turning to One Another: Simple Conversations to Restore Hope to the Future. San Francisco, Berrett‐Koehler
Publishers.
Whiteley, J. M., Ingram, H., and Perry, R. W. 2008. Water, Place and Equity. Cambridge, Mass., The MIT Press, 2008.
Whittington, D. et al. 2009. How well is the demand‐driven, community management model for rural water supply systems doing?
Evidence from Bolivia, Peru and Ghana. Water Policy, Vol. 11, No. 6, pp. 696–718.
WHO (World Health Organization). 2003. Emerging Issues in Water and Infectious Disease. Geneva, WHO. Available at Error! Hyperlink
reference not valid.http://www.who.int/water_sanitation_health/emerging/emerging.pdf
———. 2005. Ecosystems and Human Well‐Being: Health Synthesis – A Report of the Millennium Ecosystem Assessment. Geneva, WHO.
———. 2007. A Safer Future: Global Public Health Security in the 21st Century – World Health Report 2007. Geneva, WHO.
———. 2010a. UN‐Water Global Annual Assessment of Sanitation and Drinking‐Water (GLAAS) 2010. Geneva, WHO. Available at
http://www.who.int/water_sanitation_health/publications/UN‐Water_GLAAS_2010_Report.pdf

Global Drivers of Change 78
———. 2010b. World Water Week. Home page. Available at
http://www.who.int/mediacentre/events/meetings/2010/world_water_week/en/index.html (Accessed 30 August 2010.)
Wolf, A. T. 1999. Criteria for equitable allocations: The heart of international water conflict. Natural Resources Forum, Vol. 23, No. 1, pp.
3–30.
Wolf, A. T., Yoffe, S. B. and Giordano, M. 2003. International waters: identifying basins at risk. Water Policy, Vol. 5, No. 1, pp. 29–60.
Wolf, A. T., Kramer, A., Carius, A. and Dabelko, G. 2006. Water Can Be a Pathway to Peace, Not War. Navigating Peace Series No.1.
Washington DC, Woodrow Wilson International Center for Scholars. Available at
http://www.wilsoncenter.org/sites/default/files/NavigatingPeaceIssue1.pdf
World Bank. 2007. World Development Report 2008: Agriculture for Development. Washington, DC, The World Bank. Available at
http://econ.worldbank.org/WBSITE/EXTERNAL/EXTDEC/EXTRESEARCH/EXTWDRS/EXTWDR2008/0,,menuPK:2795178~pagePK:641
67702~piPK:64167676~theSitePK:2795143,00.html
———. 2009. Global Monitoring Report 2009: A Development Emergency. Washington, DC, The World Bank.
———. 2011. World Development Report 2011: Conflict, Security and Development. Washington, DC, The World Bank. Available at
http://wdr2011.worldbank.org/fulltext
Worldwatch Institute. 2004. State of the World 2004: Special Focus: The Consumer Society. New York, W. W. Norton & Company.
——. 2010. State of the World 2010: Transforming Cultures from Consumerism to Sustainability. New York, W. W. Norton & Company.
———. n.d. The State of Consumption Today, Website. Available at http://www.worldwatch.org/node/810
Wouters, P., Vinogradov, S. and Magsig, B. 2009. Water security, hydrosolidarity and international law: a river runs through it ... Yearbook
of International Environmental Law, Vol. 19, pp. 97–134. Available at http://yielaw.oxfordjournals.org/content/19/1/97.full.pdf
WWAP (World Water Assessment Programme). 2006. World Water Development Report 2: Water: A Shared Responsibility. Paris/New
York, UNESCO/Berghahn Books.
———. 2009a. Climate Change and Water – An Overview from the World Water Development Report 3: Water in a Changing World. Paris,
UNESCO‐WWAP. Available at http://unesdoc.unesco.org/images/0018/001863/186318e.pdf
———. 2009b. World Water Development Report 3: Water in a Changing World. Paris/London, UNESCO/Earthscan. Available at
http://www.unesco.org/water/wwap/wwdr/wwdr3/
———. 2009c. World Water Development Report 3: Water in a Changing World – Facts & Figures. Paris, UNESCO. Available at
http://www.unesco.org/water/wwap/wwdr/wwdr3/pdf/WWDR3_Facts_and_Figures.pdf
WWF (World Wide Fund for Nature International). 2004. Living Waters: Conserving the Source of Life – The Economic Values of the
World’s Wetlands. Gland, Switzerland/Amsterdam, WWF. Available at
http://www.unwater.org/downloads/wetlandsbrochurefinal.pdf
Xu, C‐Y. and Singh, V. P. 2004. Review on regional water resources assessment under stationary and changing climate. Water Resources
Management, Vol. 18, No. 6, pp. 591–612.
Yoffe, S., Wolf, A. T. and Giordano, M. 2003. Conflict and cooperation over international freshwater resources: indicators of basins at risk.
Journal of the American Water Resources Association, Vol. 10, pp. 1109–26.

Global Drivers of Change 79
Younos, T., Hill, R. and Poole, H. 2009. Water Dependency of Energy Production and Power Generation Systems. Blacksburg, Va., Virginia
Water Resources Research Center. Available at http://www.circleofblue.org/waternews/wp‐
content/uploads/2010/08/water_dependency_of_energy.pdf
Zelaya, S. A. 2009. Partnership Building in Drylands under the Climate Change Policy Framework. Copenhagen, United Nations Convention
to Combat Desertification. Available at http://www.unccd.int/publicinfo/unfccc/docs/UNCCD.pdf
Zhang, X., Zwiers, F. W., Hegerl, G. C., Lambert, F. H., Gillett, N. P., Solomon, S., Stott, P. A. and Nozawa, T. 2007. Detection of human
influence on twentieth‐century precipitation trends. Nature, No.. 448, pp. 461–65.

Global Drivers of Change 80
ANNEX 1
Report on Studies of Future Developments Important to World
Water A Series of Five Real Time Delphi Studies Performed by The Millennium Project for the United Nations World Water Assessment Programme
3 October 2010
1 Introduction and summary
The UNESCO World Water Assessment Programme (WWAP) is developing a new set of global water scenarios. As
described in Section 1 of Using Water Wisely: Global Drivers of Change, the first step of the scenarios process was to
conduct an in‐depth analysis of the evolution of the major external forces (‘drivers’) that have direct and indirect
consequences for water managers and a discussion of existing scenarios. This was done by conducting an analysis of
the possible future evolution of principal drivers (including identification of linkages among them). Overall, 10 drivers
were identified for research of the literature describing the possible future of each domain. A list of possible future
developments in each of the domains was extracted from this research, taking into account interlinkages with some
of the other selected drivers.
The list of possible future developments for each driver was submitted for discussion and review through
expert consultations. The objective of the expert consultations was to validate the degree of importance of the
developments with regards to scenarios on water use and availability to 2050 and to gain an informed opinion on the
likelihood of such developments occurring by then.
For the six more ‘controversial’ drivers, where the project team thought more divergent opinions could arise
(Technology; Economy and security; Agriculture; Ethics; Politics and governance), the Real Time Delphi (RTD)
consultation approach was adopted since it is particularly useful not only in producing consensus where possible but
also in crystallizing reasons for disagreement.
This RTD consultation was conducted by the Millennium Project for WWAP. The experts participating in the
RTD consultations identified through discussion the most important events or developments and the probability of

Global Drivers of Change 81
their occurrence by 2020 and 2030. This is the report on the RTD consultations, providing a statistical analysis of the
results.
The first four of these studies ran in parallel from June 1 to July 18, 2010 and the last ran from August 27
through September 30, 2010. This report summarizes the results of all five RTDs. The body of the report deals with an
overview of the work and Appendices A–E (available at the WWAP website: http://www.unesco.org/new/en/natural‐
sciences/environment/water/wwap/global‐water‐scenarios) focus on the specific studies.
Over 200 experts in the selected domains were invited to participate;13 145 people signed in and about 120
provided at least one answer to the questions. Over 9,000 answers were generated.
The instructions to the respondents stated:
You may omit any question(s) you wish and you do not have to complete the entire questionnaire in one visit;
you can return as many times as you want to continue and/or edit your previous answers. At your return you
will see your previous answers as well as those of the group. Please answer only those questions about which
you feel comfortable; leaving sections blank is acceptable. The process is confidential to those participating
and the WWAP administrators. Your answers will remain anonymous although your name will be listed as a
participant in the study. You are encouraged to return often, but please plan to complete your input before
2010‐09‐30.
At the conclusion of the consultation a report will be prepared by WWAP summarizing the level of consensus
concerning the developments, the range of views expressed in the REASONS sections, and any additional
comments, suggestions, and inputs. This report will serve in the development of the new world water
scenarios set.
2 Number of responses
The numbers of people who answered at least one question in the five studies, and the total number of answers they
provided, were as follows:
Domain Number who signed in
Number who answered
Questions answered
Technology and Water 39 33 2,382 Economics, Security and Water 33 23 1,725 Agriculture and Water 16 14 885 Ethics and Water 22 22 1,985 Politics and Governance and Water 46 31 2,135
Total 156 122 9,210
The following figure shows the number of people who signed while the studies were under way.
13 The exact number is unknown since the experts were asked to invite colleagues to participate as well.

Global Drivers of Change 82
Number of Signed-in
0
5
10
15
20
25
30
35
40
45
50
1 3 5 7 9 11 13 15 17 19 21 23 25 27 29 31 33 35 37 39 41 43 45 47
Days after invitation sent
TechEthics
EconagricPoli&Gov
The figure shows an “uptick” of responses in the final few days of the studies. This apparently occurred for
several reasons: the Administrator sent several reminders to persons who had been invited but had not responed, to
people who signed in but had not provided an answer and to people who had already answered the invitation. This
last class was an invitation to revisit and revise their prior responses. Also, all invitees were asked to invite well‐
informed colleagues to participate, and there may have been an expanding ‘daisy chain’ effect.
The next figure shows the number of people who provided at least one answer to the studies.
It is not unusual in studies of this sort to see a gap between the number of people who have signed in and the
number who actually provided an answer. This difference arises for several reasons: for example, people may sign in
and intend to answer the questionnaire at some later date but fail to return, or the nature of the questionnaire could
discourage some potential respondents.
Generally, the total number of answers increased sharply after a reminder invitation was sent.

Global Drivers of Change 83
Number of Answers
0
500
1000
1500
2000
2500
1 3 5 7 9 11 13 15 17 19 21 23 25 27 29 31 33 35 37 39 41 43 45 47
Days after invitation sent
TechEthicsEconAgricPoli&Gov
The questionnaires asked for three types of judgments:
First, as shown on the screen shot below (from the governance questionnaire), respondents were asked for
their judgements about future developments: the probability of occurrence by 2020, the probability of occurrence by
2030 and the overall importance to the future scenarios.
Second, in the first four RTDs (technology, economics, security, agriculture and ethics), several questions
were devoted to variables, and respondents were asked to provide their judgments about the best and worst future
values of the variables and their relative importance. The four studies had identical questions about the variables.
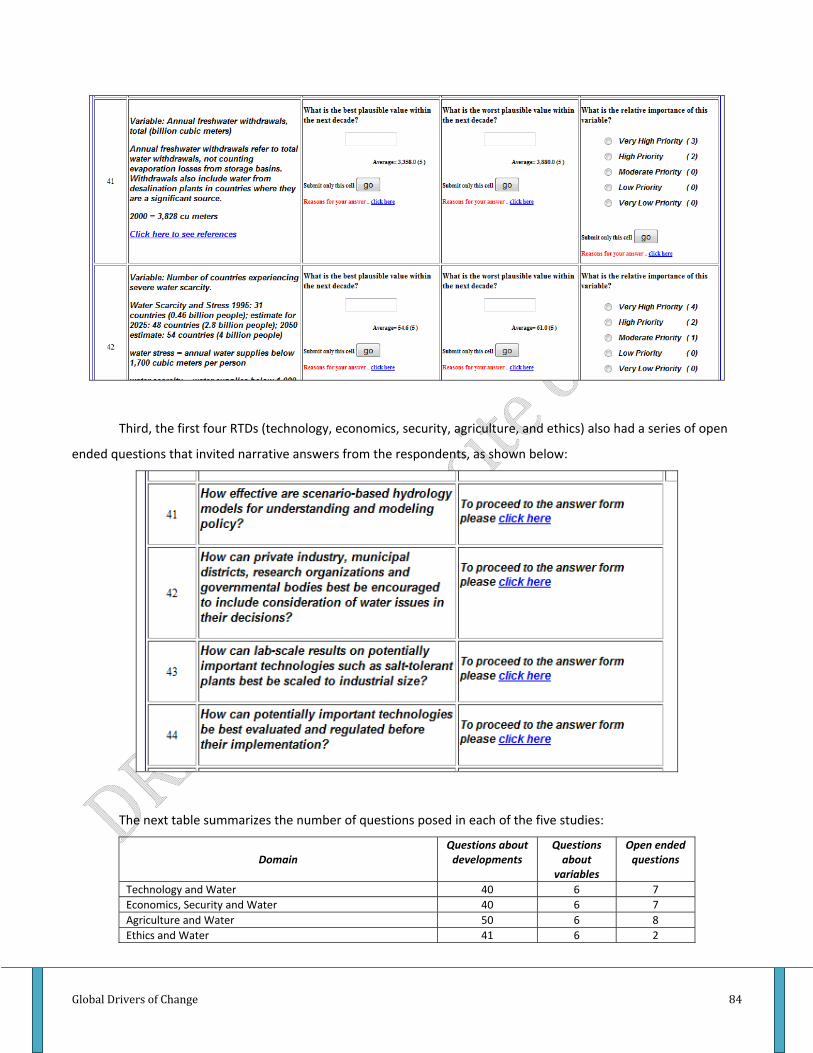
Global Drivers of Change 84
Third, the first four RTDs (technology, economics, security, agriculture, and ethics) also had a series of open
ended questions that invited narrative answers from the respondents, as shown below:
The next table summarizes the number of questions posed in each of the five studies:
Domain Questions about developments
Questions about
variables
Open ended questions
Technology and Water 40 6 7 Economics, Security and Water 40 6 7 Agriculture and Water 50 6 8 Ethics and Water 41 6 2

Global Drivers of Change 85
Politics and Governance and Water 56 0 0
Respondents identified themselves as residing in a particular region of the world and as having expertise in
one of a number of different disciplines; each respondent could select one discipline and one region of the world. The
following figures show the demographics of all who registered.
Reginal demographics
Middle East6%
North America27%
Australia and New Zealand
4%
Latin america10%
Asia8%
Europe39%
Sub-Saharan Africa6%
Sectoral demographics
Energy6%
Security1%
Politics10%
Environment26%
Academia10%
Business and Trade
6%
Economics12%
Health3%
Other26%
3 Summary of numerical responses
The Appendices to this report present average answers for all of the numerical questions as well as the distribution of
those responses. The table below lists only the items viewed as most important by the respondents (above 8.5 in
importance on a scale of 0 to 10). This forms a good checklist for the scenarios.

Global Drivers of Change 86
Items that have a grey background represent the input of fewer than four respondents. The items with a
yellow background indicate a relative lack of agreement.
Study Prob 2020
Prob 2030
Import Development
agr 80 50 10 14. Seed varieties of high nitrogen‐use efficiency are developed and used.
agr 53 87 10 46. Environmental services are valued and managed to improve the quality of agricultural water.
agr 46.43 58.33 9.86 1. Withdrawals for agriculture increase from 3,100 billion m3 to 4,500 billion m3 in 2030.
econ 75.29 85.24 9.7 2. Demand for water in developing countries increases by 50% over today's.
tech 50.65 76.74 9.65
30. One billion of the largest water consumers use products designed to conserve water, including pressure‐reducing valves, horizontal‐axis clothes washers, water‐efficient dishwashers, grey water recycling systems, low‐flush tank toilets, low‐flow urinals, and waterless urinals.
econ 80 86.47 9.47 14. Unequal access to water creates new economic polarities.
pol&gov 62.22 75.56 9.44 54. Failure of urban water supply infrastructure occurs in more than two dozen major cities (and underscores the need for upgrading of water systems).
agr 26.11 36.25 9.43 5. Expansion of agricultural lands is slowed significantly by ecological concerns.
pol&gov 51.88 70.63 9.38 52. Online forums on water issues including local government and civil society are developed in 75% of the world, reducing the asymmetry of information between user, provider and policy‐maker.
agr 59.38 58.33 9.38 22. The slowing pace of deforestation continues (1990‐2000: 16 million ha lost; 2000‐2010 13 million ha lost).
econ 77.21 74.11 9.32 3. Over 40% of world countries experience severe freshwater scarcity. (scarcity = water supplies drop below 1,000 cubic meters per person per year)
econ 55.23 76.92 9.25 22 Several types of cost‐effective desalination or other technologies are widely available and increase safe water supply by 20% globally.
agr 38.57 33.33 9.25 2. Less than half of the gap between supply and demand for agricultural water is filled by conventional means (improvements in water productivity and conservation); the rest comes from non‐traditional approaches (such as desalination).
agr 62.78 71.11 9.25 18. Water productivity in grain triples in some developing countries (e.g. China today produces 1 kg wheat and corn/cubic meter of water; Ethiopia, 0.1 to 0.2 kg/cubic meter.)
agr 55 50 9.25 19. New plant strains are introduced that have improved productivity per unit of water as their goal.
agr 53.89 65 9.14 17. Large scale efforts are initiated in many developed countries to reduce food losses due to spoilage in the field, in storage and in transportation, with concomitant savings in water usage.
pol&gov 27.35 34.90 9.14 8. Transparency and participation procedures are established and followed in matters of water governance in at least 120 countries.
pol&gov 45.50 60.50 9.13 43. Networked coordination at the national level to share information and best practices between local water agencies is achieved in at least 95% of countries.
agr 73.18 64.5 9.13 16. Use of untreated waste water for irrigation continues in many developing countries despite the health risks.
tech 22.36 44.4 9.12 12. Technologies for water desalination in large volumes become so inexpensive that nearly all people within 100 miles of coastlines have water for their needs.
pol&gov 42.08 54.17 9.11 38. An international convention specifically dedicated to groundwater is negotiated.
pol&gov 24.73 28.20 9.09 16. Less than 1 billion people live in insecure or unstable countries that run a significant risk of collapse (compared to 2 billion in 2010 according to the Failed States Index).
pol&gov 49.38 56.56 9.08 18. Social instability and violence spread to most states faced with chronic water scarcity.

Global Drivers of Change 87
Study Prob 2020
Prob 2030
Import Development
ethics 65.56 74.72 9.05 4. In addressing human values, most people would agree that the present has an obligation to preserve opportunities for the future.
econ 70 71.05 9 4. Over 50 million people lose their livelihoods due to water scarcity.
econ 44.92 63.33 9 25. Water gains center stage in climate change adaptation strategies and 'green credits' policies.
econ 44.42 56.67 9 26. Water availability becomes a serious consideration in electricity generation; lack of water results in reduction below planned generation levels sometime during the year at 10% of all plants.
agr 49.22 55 9 3. The potential for increasing yields from rainfed farming is realized by adaptation to climate variability (changed seeding season, or varieties or plants).
agr 58.33 63.57 9 4. Agricultural croplands expand more than 20%, particularly in Latin America and Africa.
agr 27.5 44 9 15. Large scale and routine use of precision farming expands in many developing countries (including the use of robot GPS steered tractors and the use of multi‐spectral satellite scanners to determine soil condition, and fertilizer requirements).
agr 40 80 9 37. Some cities satisfy 3% or more of food supply by farming on vacant lots.
agr 60 75 9 40. GM seeds are developed and distributed at prices that are affordable to rural farmers in the poorest countries that are particularly affected by negative impacts caused by climate change and variability.
agr 70 75 9 41. Multinational agribusiness corporations become effective global monopolies, strongly influencing food prices.
agr 26.25 45 9 47. Algal‐based biofuels largely replace those from terrestrial plants, including palm trees, soy, and sugar cane.
agr 35 75 9 50. Aquaculture produces as much food as fishing of the oceans and lakes.
pol&gov 41.79 52.14 9.00 17. Establishing local water institutions and practices (such as the village mirabs in Afghanistan) has become one of the building blocks to restore peace in failing states.
pol&gov 37.50 57.78 9.00 50. Worldwide use of comprehensive decision‐making tools for identifying the best technologies or approaches to meet water, sanitation, and hygiene needs.
tech 44.58 71.83 8.92 15. Economically viable nanotechnology (such as carbon nanotubes) yields new and effective membranes and catalysts useful in desalination and pollution control (e.g. removing heavy metal and other dissolved pollutants from water).
econ 60.38 73.46 8.92 30. Inexpensive prophylactic measures that prevent water borne diseases are developed.
pol&gov 73.65 77.29 8.92 9. Resistance within government and from vested interests keeps governments from become more participatory, flexible and transparent in at least 100 countries, leading to further mistrust and/or increased activism.
pol&gov 30.77 44.62 8.92 44. Water footprint reporting and reduction becomes officially part of government policymaking and sustainable development strategy in at least 90% of countries.
tech 54.42 74.38 8.91 20. Rainwater harvesting is practiced widely and new simple and cheap ways of purifying the collected water become available.
pol&gov 28.18 33.18 8.89 31. State sovereignty has shifted to 'nested levels of governance': decentralized decision‐making with appropriate transfer of authority and resources to the decision‐making level that best corresponds to the scale of the problems being addressed.
ethics 66.33 72 8.87 14. Increasing scarcity deepens current inequalities in access to water in poor countries.
econ 50.43 58.43 8.86 19. Food prices (in constant dollars) rise globally by at least 30% compared to 2010.
agr 57.22 74 8.86 6. Investments in infrastructure improve the production potential of rainfed farming, by, for example, improving rain‐water collection and storage systems.
pol&gov 37.50 47.50 8.82 46. Water resources formally declared a state property in 85% of countries.
pol&gov 52.50 66.67 8.80
37. The UN Watercourses Convention is implemented with Regional Protocols on Shared Watercourses established for all world regions, (thus providing a regional framework for water management and cooperation by the states, exchange of data and information, notification of planned development measures and transboundary environmental assessments.

Global Drivers of Change 88
Study Prob 2020
Prob 2030
Import Development
tech 53.6 74.08 8.80 4. Agriculturists using an affordable technology capture real‐time data about their crops and soil moisture to make informed decisions on efficient watering schedules.
econ 70.45 83.18 8.80 40. Availability of a water footprint measure, published widely on an annual basis (e.g. in 2030, the ecological footprint is expected to be around 2 planets Earth)
agr 31.25 58 8.80 35. Farming takes place in most major cities (e.g. vertical farming: dirt‐free multi‐level greenhouses that utilize hydroponics, use of vacant lots, etc.) for food and fuel.
Pol&gov 47.73 63.18 8.78 51. The United Nations Global Environment Monitoring System (GEMS) Water Programme encompasses all world countries and maintains an on‐line data base of water quality around the world. (It now uses 3,000 monitoring stations in 100 countries)
econ 63.08 59.31 8.77 20. Multinational agribusiness corporations become effective global monopolies, strongly influencing food prices.
ethics 56.31 68.33 8.76 1. Access to clean water is regarded by most countries in the world as a basic human right.
pol&gov 70.00 88.00 8.75 36. The 1997 United Nations Convention on Non‐Navigational Uses of International Watercourses gets the 35 ratifications to enter into force. (by mid‐2010, it received 19 ratifications)
pol&gov 40.64 49.29 8.73 35. A series of reforms to international corporate law now forces multinational companies to address their liabilities, such as damages to the environment.
pol&gov 48.27 58.05 8.72 1. Foresight functions are a routine part of national governments in 120 countries.
ethics 47.14 58.29 8.69 15. Water‐related anti‐poverty strategies are used in at least 30 countries, including for example, employment of poor people at water points, in irrigation, and food production.
econ 58 65.33 8.67 10. Lack of water forces business to move, increasing poverty in those regions (e.g. India).
tech 54.29 70.71 8.65 5. Evaporation control technologies spread widely; their use doubles.
pol&gov 44.71 52.67 8.65
3. The need to consider future generations in development and in legislation is generally accepted: mechanisms are established in more than 20 countries to provide for independent inquiry with public participation on major development proposals and legislation that may impact future generations.
pol&gov 22.27 28.18 8.63
27. The provision of global public goods such as health, education, environmental restoration and peacekeeping are partially financed by taxing global negative externalities (arms, pollution, destabilizing financial flows) and/or by revenues from the management of global resources (fishing rights, deep‐sea mining, carbon emission permits).
agr 47.78 59.38 8.63 8. Creation of a "farmers without borders" to train farmers, particularly in poor countries, in new techniques and, for example, how to grow halophyte plants.
Pol&gov 67.93 64.53 8.62 12. Lack of coordination and of mutually agreed water strategy at the national, regional and local levels result in ineffective community participation and lack of influence in decision‐making.
ethics 38.61 50.83 8.61 12. Educational curricula in most countries change to discourage over‐consumption and waste.
econ 39.00 59.25 8.60 23. A cost‐effective and practical technology is found for water transportation from abundant areas to needy areas.
econ 54.11 57.56 8.53 1. Continuous fast economic growth of developing and emerging economies while developed economies experience slow or negative growth (resulting, for example, in changed economic and political polarity).
ethics 37.39 52.33 8.53 10. Great increase in public participation in decisions affecting water pricing and distribution, including particularly women and indigenous people,
pol&gov 39.70 47.25 8.53 7. The majority of government structures allow for civil society to actively participate in policy design and service delivery.
pol&gov 52.69 55.00 8.50 34. Globalization has led to a rise in protectionist sentiment as a result of increased inequality and lower standards of living for the majority of the population around the world.
econ 50.27 69.55 8.50 27. Water productivity in the industrial sector increases by at least 50%.
ethics 26.33 36.67 8.50 11. Most people in the world display an awareness of the interconnectedness of living systems.
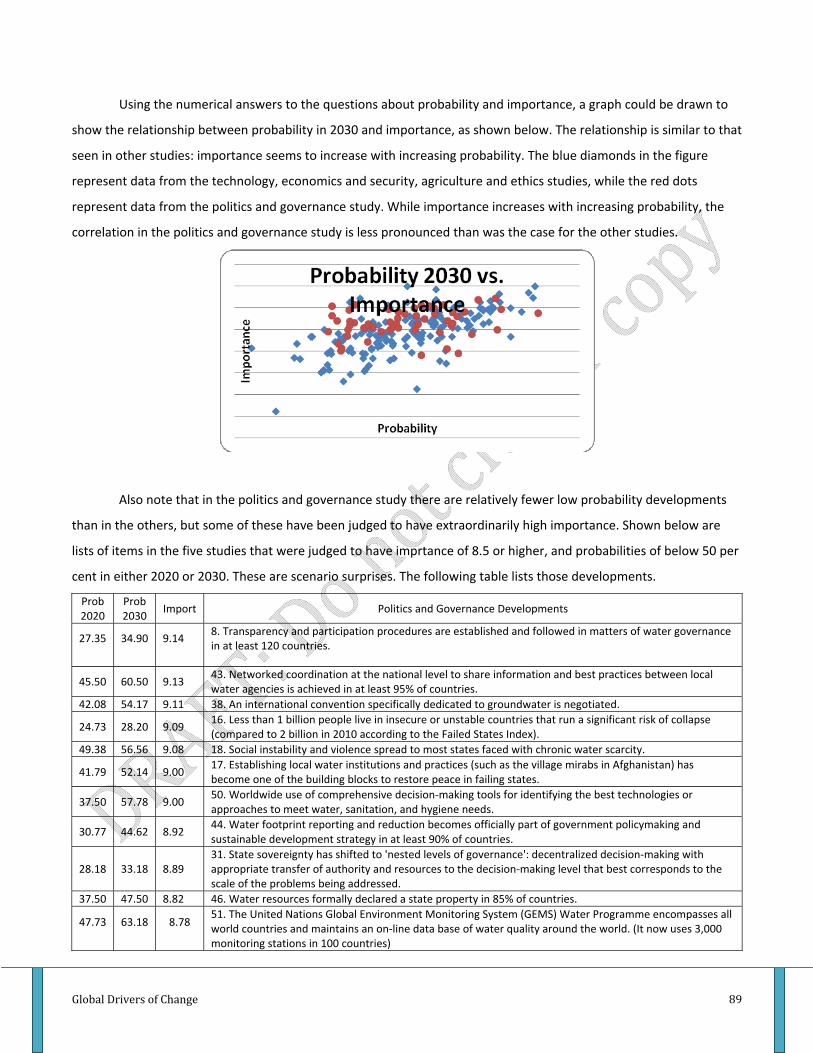
Global Drivers of Change 89
Using the numerical answers to the questions about probability and importance, a graph could be drawn to
show the relationship between probability in 2030 and importance, as shown below. The relationship is similar to that
seen in other studies: importance seems to increase with increasing probability. The blue diamonds in the figure
represent data from the technology, economics and security, agriculture and ethics studies, while the red dots
represent data from the politics and governance study. While importance increases with increasing probability, the
correlation in the politics and governance study is less pronounced than was the case for the other studies.
Also note that in the politics and governance study there are relatively fewer low probability developments
than in the others, but some of these have been judged to have extraordinarily high importance. Shown below are
lists of items in the five studies that were judged to have imprtance of 8.5 or higher, and probabilities of below 50 per
cent in either 2020 or 2030. These are scenario surprises. The following table lists those developments.
Prob 2020
Prob 2030
Import Politics and Governance Developments
27.35 34.90 9.14 8. Transparency and participation procedures are established and followed in matters of water governance in at least 120 countries.
45.50 60.50 9.13 43. Networked coordination at the national level to share information and best practices between local water agencies is achieved in at least 95% of countries.
42.08 54.17 9.11 38. An international convention specifically dedicated to groundwater is negotiated.
24.73 28.20 9.09 16. Less than 1 billion people live in insecure or unstable countries that run a significant risk of collapse (compared to 2 billion in 2010 according to the Failed States Index).
49.38 56.56 9.08 18. Social instability and violence spread to most states faced with chronic water scarcity.
41.79 52.14 9.00 17. Establishing local water institutions and practices (such as the village mirabs in Afghanistan) has become one of the building blocks to restore peace in failing states.
37.50 57.78 9.00 50. Worldwide use of comprehensive decision‐making tools for identifying the best technologies or approaches to meet water, sanitation, and hygiene needs.
30.77 44.62 8.92 44. Water footprint reporting and reduction becomes officially part of government policymaking and sustainable development strategy in at least 90% of countries.
28.18 33.18 8.89 31. State sovereignty has shifted to 'nested levels of governance': decentralized decision‐making with appropriate transfer of authority and resources to the decision‐making level that best corresponds to the scale of the problems being addressed.
37.50 47.50 8.82 46. Water resources formally declared a state property in 85% of countries.
47.73 63.18 8.78 51. The United Nations Global Environment Monitoring System (GEMS) Water Programme encompasses all world countries and maintains an on‐line data base of water quality around the world. (It now uses 3,000 monitoring stations in 100 countries)

Global Drivers of Change 90
40.64 49.29 8.73 35. A series of reforms to international corporate law now forces multinational companies to address their liabilities, such as damages to the environment.
48.27 58.05 8.72 1. Foresight functions are a routine part of national governments in 120 countries.
44.71 52.67 8.65 3. The need to consider future generations in development and in legislation is generally accepted: mechanisms are established in more than 20 countries to provide for independent inquiry with public participation on major development proposals and legislation that may impact future generations.
22.27 28.18 8.63
27. The provision of global public goods such as health, education, environmental restoration and peacekeeping are partially financed by taxing global negative externalities (arms, pollution, destabilizing financial flows) and/or by revenues from the management of global resources (fishing rights, deep‐sea mining, carbon emission permits).
39.70 47.25 8.53 7. The majority of government structures allow for civil society to actively participate in policy design and service delivery.
Prob 2020
Prob 2030
Import Technology Developments
22.36 44.4 9.12 12. Technologies for water desalination in large volumes become so inexpensive that nearly all people within 100 miles of coastlines have water for their needs.
44.58 71.83 8.92 15. Economically viable nanotechnology (such as carbon nanotubes) yields new and effective membranes and catalysts useful in desalination and pollution control (e.g. removing heavy metal and other dissolved pollutants from water).
Prob 2020
Prob 2030
Import Economics and Security Developments
44.92 63.33 9.00 25. Water gains center stage in climate change adaptation strategies and 'green credits' policies.
44.42 56.67 9.00 26. Water availability becomes a serious consideration in electricity generation; lack of water results in reduction below planned generation levels sometime during the year at 10% of all plants.
39.00 59.25 8.60 23. A cost‐effective and practical technology is found for water transportation from abundant areas to needy areas.
Prob 2020
Prob 2030
Import Agriculture Developments
46.43 58.33 9.86 1. Withdrawals for agriculture increase from 3,100 billion m3 to 4,500 billion m3 in 2030.
26.11 36.25 9.43 5. Expansion of agricultural lands is slowed significantly by ecological concerns.
38.57 33.33 9.25 2. Less than half of the gap between supply and demand for agricultural water is filled by conventional means (improvements in water productivity and conservation); the rest comes from non‐traditional approaches (such as desalination).
49.22 55 9.00 3. The potential for increasing yields from rainfed farming is realized by adaptation to climate variability (changed seeding season, or varieties or plants).
27.5 44 9.00 15. Large scale and routine use of precision farming expands in many developing countries (including the use of robot GPS steered tractors and the use of multi‐spectral satellite scanners to determine soil condition, and fertilizer requirements).
40 80 9.00 37. Some cities satisfy 3% or more of food supply by farming on vacant lots.
26.25 45 9.00 47. Algal‐based biofuels largely replace those from terrestrial plants, including palm trees, soy, and sugar cane.
35 75 9.00 50. Aquaculture produces as much food as fishing of the oceans and lakes.
31.25 58 8.80 35. Farming takes place in most major cities (e.g. vertical farming: dirt‐free multi‐level greenhouses that utilize hydroponics, use of vacant lots, etc.) for food and fuel.
47.78 59.38 8.63 8. Creation of a "farmers without borders" to train farmers, particularly in poor countries, in new techniques and, for example, how to grow halophyte plants.

Global Drivers of Change 91
Prob 2020
Prob 2030
Import Ethics Developments
47.14 58.29 8.69 15. Water‐related anti‐poverty strategies are used in at least 30 countries, including for example, employment of poor people at water points, in irrigation, and food production.
38.61 50.83 8.61 12. Educational curricula in most countries change to discourage over‐consumption and waste.
37.39 52.33 8.53 10. Great increase in public participation in decisions affecting water pricing and distribution, including particularly women and indigenous people,
26.33 36.67 8.50 11. Most people in the world display an awareness of the interconnectedness of living systems.
4 Reasons for responses
The repondents were encouraged to provide reasons for their answers and to comment on reasons provided by
others. Many reasons, some quite lengthy, were provided. The reasons for the large differences among the studies
are not clear.
Study Number of Reasons
Technology 146 Econ‐Security 43 Agriculture 51 Ethics 338 Politics and Governance 135
The full reports provide the verbatim reasons given by respondents, but to give a flavour of the material,
consider these quotes:
On the question of a new technology for transport of water from abundant areas to needy areas: The most
obvious "new Technologies" are cheaper pipes, drag reduction/ reduced pumping power and cheaper GREEN
Energy. All should be available in some fashion by 2020 if we seriously worked this.
On the question of deep penetrating radar of the sort developed by NASA for Mars exploration being routinely
used to find deep terrestrial water deposits: Already there is a need to forecast agricultural production risks.
FAO is commissioning studies to have early warning systems that indicate risks based on this information. So
it is highly likely that this type of system will be developed in a period of 10 year.
On technologies for inexpensive water desalination in large volumes: Absolutely needed for drinking water.
Not needed for food/ fodder/ biofuels/ petrochemical feed stock if/as switch to Halophytes where can
irrigate with saline/ salt water on deserts.
On the matter of geo‐engineering: One low‐tech method that is underutilized is carbon sequestration in soil
systems. Carbon waste materials without long‐term hazardous components (metals) should be soil‐farmed.
Carbon addtions to soil improve tilth, water‐holding capacity and decrease runoff and erosion. Soil
Global Drivers of Change 92
decomposition results in a much slower release of greenhouse gases because the limiting factor for the
biological breakdown is usually another basic element, often nitrogen.
Question: How can lab‐scale results on potentially important technologies such as salt‐tolerant plants best be
scaled to industrial size?
Answer: Salt‐tolerant crops have to develop a track record on ROI. Without the economics information readily
available early adopters will only involve those who have no other alternatives.
On the availability of a water footprint measure: The 2008 Living Planet Report, WWF's periodic update on
the state of the world's ecosystems published every 2 years, included the water footprint analysis by country.
Also, the OPEN: EU project, which is a two year, EU 7th Framework Programme for Research and
Technological Development (FP7) funded project, brings together the Ecological, Carbon and Water Footprint
indicators through the same trade model. This will enable a calculation of each of these indicators for the
whole of the EU‐27 using sophisticated multi‐regional input‐output analysis.
On “virtual water” trade: In a business as usual scenario the global water saving would be 34% (336.8
km3/year) (over the period 1997‐2001) according to Yang and Zehnder (2008) and about 22% (352 km3/year)
(average over the period 1997–2001) in line with Hoekstra and Chapagain (2008). Currently, virtual water
flows are mainly subordinated to world trade rules. WTO policies affect agricultural policies, and these in turn
affect irrigation water use. It is therefore worthwhile further exploring the possibility of incorporating water
sustainability considerations into international trade regulations. In the future, virtual‐water trade knowledge
could be incorporated into international trade regulations in order to increase global water‐use efficiency and
achieve a sustainable water management at a global level.
Question: How can corporations or some groups of interest be prevented from taking control over water
(similarly to oil)?
Response: 100% decentralised control over water by village councils and cooperation at hubli, block, district
region, watershed, sub‐basin, basin level from the bottom up to manage decisions. Effective enforcement
powers for gram sabhas. Effective local government Panchayati Raj Institutions that are controlled by the
people not be vested interests. Effective support from central government and proper legal system without
delays. Better green tribunal system and better pollution control authorities.
On the use of salt tolerant varieties: Salt‐tolerant agriculture has a significant role to play in the future
agricultural production systems, but cannot see this happening now or even in the next decade. The reasons
are that the progress is slow both in terms of improving germplasm of field crops for enhanced salt tolerance
Global Drivers of Change 93
as well as using halophytes as food/feed crops or their domestication at a large scale. The scientists had been
looking for breakthroughs in improving salt tolerance of conventional crops for the last three decades, but the
success is limited. Other major issues are marketing and market‐value of the halophytes and supporting
government policies encouraging the use of salt‐tolerant germplasm.
On the creation of a “water situation room”: Water is a local good. Water policies must adapt themselves to
local situations. If the "Water Situation Room" would respectfully observe this variety, it would be an
excellent idea. On the contrary, if the Water Situation Room tries to impose some unique bureaucratic
approach, it would be a duty to fighting against.
On the ethical uses of water: Perhaps the first significant action on the ethics of fresh water uses was the
creation in 1998 by the COMMISSION ON THE ETHICS SCIENCE AND TECHNOLOGY of a working group on THE
ETHICS OF FRESHWATER USES.A series of thirteen monographs on the topic has been produced by UNESCO
and were already presented in the THIRD WORLD WATER FORUM (Kyoto 2003) A good number of
publications have been published afterwards. For example the book WATERETHICS (Taylor & Francis) that was
presented in the FIFTH WORLD WATER FORUM (Istanbul 2009).
On the possibility that corruption may increase: Corruption likes darkness. Water business has been pointed
out as corrupted in many countries during the past decades. Cheating is harder from now up: new
regulations, controls and general mistrust make corruption much more difficult than before. Fake business in
the field of water management will continue but at a lower scale. Corrupters and corruted people would
prefer new activities as waste management, virtual studies or the communication market for example.
On the importance of having foresight functions routinely part of national governments in 120 countries:
Without a significant improvement in the capacity of foresight as a theory and practice there is little reason to
expect or desire a greater presence in government. Furthermore the implicit notion that better prescience by
governments is a desirable thing seems to me to be misplaced and rather dangerous. Governments that are
certain of the future are prone to authoritarian solutions. Any really different integration of "futures thinking"
into collective choices will need to be much more ambient and founded on a different paradigmatic basis
than current ways of using the future.
Civil servants in the future will need to work quite differently with citizens in order to get consensus (or
acquiescence) and co‐operation on local issues that have national or global impact. The ability to use and
apply foresight processes to engage communities and move issues forward will be critically important

Global Drivers of Change 94
On the probability that by 2030 large scale attempts by most governments to shape public opinion use social
marketing to gain popular support for water policies and encourage appropriate water use: By 2030
significant water system adjustments would need to (be) underway. Social marketing approaches would
either have been successful prior to this and no longer needed, or harder instruments would be need to make
adjustments at this point.
On the probability that by 2020 transparency and participation procedures are established and followed in
matters of water governance in at least 120 countries: The drive towards economic, ethical and
environmental transparency has been gaining strength over the last decade ‐ boosted by the potential offered
by increased cheap data capacities and the distributive mechansism of the "new estate" (social media
environment) Combined with real time sensor data,it will be harder for surface dishonesty and corruption to
go undetected. The risk however is corrupted control or manipulation of data sets themselves.
On the probability that by 2020 an international organization with enforcement and management power
specifically dedicated to water is established. (It would also consolidate or coordinate the present over 26
international programs and organizations dealing with water issues.): poorly framed ‐ there are two separate
questions here i) more effective oversight and coordination of the existing 26 agencies (relatively likely and
importand) ii) establishment of an overarching agency with management authority (extremely unlikely and
not very important).
On the probability that water footprint reporting and reduction becomes officially part of government
policymaking and sustainable development strategy in at least 90% of countries: The traditional water policy
approach has always been supply and producer oriented. The water footprint concept has been introduced to
have a demand and consumer oriented indicator as well (Hoekstra, 2003). This approach shifts the previous
emphasis on supply towards demand management, where demand management is not limited to promoting
water use efficiency at field level but extended to wise water governance in supply chains as a whole, thus
also addressing trade and consumption patterns. This asks for a rethinking of the existing model of water use
with adaptations implying social, political and cultural changes that result in a significant reduction in water
demand. Furthermore, it is becoming increasingly important to put freshwater issues in a global context
(ibid.). Local water depletion and pollution are often closely tied to the structure of the global economy. With
increasing trade between nations and continents, water is more frequently used to produce exported goods.
International trade in commodities implies long‐distance transfers of water in virtual form, where virtual
water is understood as the volume of water that has been used to produce a commodity and that is thus
virtually embedded in it (Allan, 1998). Knowledge about the virtual‐water flows entering and leaving a country
can cast a completely new light on the actual water scarcity of a country. Along these lines, virtual water flow
Global Drivers of Change 95
analysis in relation to agricultural commodity trade is very useful to investigate the extent to which a revision
of trade agreements at regional and global level can improve the water balance. National water statistics,
national water plan and river basin plans Traditionally countries formulate national water plans by looking
how to satisfy water users. Even though countries nowadays consider options to reduce water demand in
addition to options to increase supply, they generally do not include the global dimension of water
management (Hoekstra et al., 2009). In this way they do not explicitly consider options to save water through
import of water‐intensive products. In addition, by looking only at water use in (their) own country, most
governments have a blind spot to the issue of sustainability of national consumption. As a matter of fact
many countries have significantly externalized their water footprint without looking whether the imported
products are related to water depletion or pollution in the producing countries. Governments can and should
engage with consumers and businesses to work towards sustainable consumer products. Making national
water footprint accounting a standard component in national water statistics would provide a stronger
information basis to formulate a national water plan and river basin plans that are coherent with national
policies with respect to the environment, agriculture, energy, trade, foreign affairs and development
cooperation. Hoekstra, A.Y., Chapagain, A.K., Aldaya, M.M. and Mekonnen, M.M. (2009) Water footprint
manual: State of the art 2009, Water Footprint Network, Enschede, the Netherlands.
http://www.waterfootprint.org/downloads/WaterFootprintManual2009.pdf
On the encouragement of migration of people to cities with less than 500,000 in order to address water
management and reduce large cities' infrastructure problems: This matter is relevant even now due to large
cities’ infrastructure problems. However, the opposite trend is being observed at the present ‐ people are
rushing to the largest cities. This trend is evident in countries where people in small towns have low incomes
and little work. And this is due to the lack of talented and qualified people in small towns and some natural
factors. It will be very difficult to change the situation. The crisis of large cities should become very serious so
that people started to leave them.
On establishing escrow systems for funding future water system needs, rather than pay as you go: Water and
waste water service costs should include a capital fund element so that recurring maintenance can be funded,
such as major breaks, as well as accumulate some funding for expansion. Bonded debt will always be required
in most cases for expansion. Debt repayment needs to be covered. Funds should be able to reserve income
and not have it transferred to other government funds. Water and waste water should be self‐sufficient
based on fees. The private sector requires a profit above and beyond this. Wise public management can
achieve this, but only if there is economic independence for water/waste water agencies.

Global Drivers of Change 96
5 Distribution of opinions
The Appendixes (available online at http://www.unesco.org/new/en/natural‐
sciences/environment/water/wwap/global‐water‐scenarios) contain a question‐by‐question presentation of the
spread of response; the analysis groups the responses into quintiles. The sample below illustrates responses to one
question that show high agreement, and another that shows lack of agrement; both examples are drawn from the
politics and governance study.
• Q17 is development 17, probability by 2030: Establishing local water institutions and practices (such as the
village mirabs in Afghanistan) has become one of the building blocks to restore peace in failing states.
• Q52 is development 52, probability by 2020: Online forums on water issues including local government and
civil society are developed in 75% of the world, reducing the asymmetry of information between user,
provider, and policy‐maker.
6 Concluding remarks
The respondents were given the opportunity to add comments at the end of the questionnaire to suggest additional
developments or to comment on the study itself. There were several:
• Supply‐side oriented: Certain trends are projected from the present situation and these are the ways in which
they may be met. Greater emphasis on the demand and how that can be managed may be constructive in
that increasing the awareness of the consumers to the problems caused to the water resource by certain of
the agricultural practices would encourage a change in consumer attitude.
• Integrate with other sectors of the social economic system: The scenarios envisaged appear not to question
the projections for global population growth which is one of the root causes of having to grow more food
than has been grown in the past. Successfully addressing this would, at least in part, reduce the need to find
new resources and enable implementation of a more easily sustainable growth trajectory.
Global Drivers of Change 97
• Effective control of the effluents from non‐consumptive uses such as urban waste water (question 16
addresses part of this) will make more water available for use elsewhere, including the agricultural sector.
• We all suffer from time poverty ‐ would have loved a further extended time frame to answer.
• Many questions conflated several different elements, each of which alone would have generated a different
response ‐ so not sure of the value of the "composite figure" response.
• Would have been useful to have some terms defined specifically in relation to each question ‐ suggest there
will be some widely varying interpretations of some questions. Would have like to read more comments from
fellow respondents about their thinking behind their scoring. Given the close interrelations between water
and energy production, it might have been useful to have some questions about energy politics and
governance and the impacts on water politics and governance.
• Would welcome the opportunity to add to & further refine some of my answers in the light of more definition
& unbundling of questions.
• A lot of the questionnaire reflects poorly understood concepts and a poorly defined problem statement. To
be useful, it needs a lot more refining!
• I appreciate the opportunity to participate. I'd like to get the results of this in some form and would be happy
to continue to participate.
• Elements missing: ‐ economics, budget and finance drive political decisions (along with financial
intermediation: the lack of this led to our most recent economic crisis)
• More questions about Science and Technology advances for water use. Special feedback from Mexico: 1.
There is a new project for producing drinking water at a very low cost. 2. The consumption of water costs in
Mexico has recently highly increased. 2. Since 12 years ago the National Water Commission has convinced
the Secretary of Education to incorporate in the curricula for teaching at schools the importance of saving
water and how to do it. 3. The Federal Commission for Energy has been promoting since many years ago, also
how to save energy. 4. The consumption of energy costs in Mexico have considerably increased in the
present year.
• PROBLEMS. 1. Every time I clicked for sending my answer, the program sends me back to the beginning. This
problem of going back and forth takes too much time.
• I have the impression that we discuss a lot of non‐essential matters, and many issues of primary importance
are not paid attention to. In the presented questionnaire there is no integral concept for solving the issue of
water governance. In order to make the discussion more fruitful I think it would be more expedient to
prepare brief information first, and then discuss the following matters:
1. To define water use problems which humankind faces nowadays as clear as possible, to indicate the
regions where such problems have acute character.
Global Drivers of Change 98
2. To define the main problems of water use which humankind could face in the following 10‐20 years, to
indicate regions.
3. To define (clear up) main reasons that lead to water scarcity despite the fact that the volume of water,
circulating on the planet, remains practically unchanged.
4. To propose and discuss possible ways of solving these problems in technical, organizational and financial
terms.
5. To define main obstacles that hinder problem solving and emerge both on local and international level, to
offer ways of eliminating those obstacles.
6. To define those functions that UNESCO and international organizations could exercise in order to
contribute to water governance issue solving today and in the future.
• Thank You for the opportunity to participate. Regards.
• Solutions need to move beyond regulatory worldviews.

Global Drivers of Change 99
ANNEX 2
Survey Design Information for Surveys on Water Resources, Infrastructure, Climate Change and Demography
The surveys were conducted using the SurveyMonkey platform.
Experts were asked to enter:
1. their name
2. their e‐mail
They were then asked, for each development, to:
3. identify the earliest decade that it would be possible for each to occur. Answer options included: No
Opinion, 2011‐2020, 2021‐2030, 2031‐2040, 2041‐2050, Beyond 2050, Never.
4. the most likely decade for the development to occur. Answer options included: No Opinion, 2011‐2020,
2021‐2030, 2031‐2040, 2041‐2050, Beyond 2050, Never; and
5. the relative importance of the event/development. Answer options included: 1(Much less important), 2,
3(Important), 4, 5(Very Important)
Experts were also asked to:
6. add in the final boxes any other related events or developments related to the driver that they believed
could influence the future trajectory of water use and availability in 2050.
For the purposes of compiling the results:
• The answers with No Opinion were not included in the averages.
• The averages regarding the earliest decade and most likely decade were calculated using the decade mid‐
point to calculate the average. ‘Beyond 2050’ and ‘Never’ were treated as 2056.
Additional developments entered and rated by the individual participants as well as those found in the
closing comments were incorporated into the complete list of developments found online at
http://www.unesco.org/new/en/natural‐sciences/environment/water/wwap/global‐water‐scenarios. A list of the
most probable and most important developments can be found in Annex 4.

Global Drivers of Change 100
ANNEX 3
Participants
Water resources
Berntell, Anders
Coates, David
Farrell, Tracy
Mays, Larry W.
Molden, David
Postel, Sandra L.
Ritzema, Dr.Ir. Henk
Roos, Maurice
Unver, Olcay
Infrastructure
Berga, Luis
Bhatt, Mihir R.
Fatma Abdel Rahman Attia
Keller, Andrew
McCartney, Matthew
Palmieri, Alessandro
Pandit, Chetan
Plusquellec, Herve
Smits, Stef
Somlyody, Laszlo
Climate change
Döll, Petra
Miller, Kathleen
Milly, PCD
Mortsch, Linda
Oki, Taikan
Räisänen, Jouni
Şen, Zekâi
Tubiello, Francesco Nicola
van Schaik, Henk
Agriculture
Bai, Ying
Bogardi, Janos
Cordeiro, José
Fraiture, Charlotte de
Gaponenko, Nadezhda
Gerbens‐Leenes, Winnie
Gerten, Dieter
Gieseke, Tim
Maestu, Josefina
Mitchell, Stephen
Njima, Mercy
Qadir, Manzoor
Rezavirdinejad, Vahid
Wilderer, Peter
Technology
Axler, Richard
Bushnell, Dennis
Chapagain, Ashok Kumar
Cooke, Jeanette
Cordeiro, José
Daranyi, Vincent
Dell, David
Fernandez, Jorge
Gaponenko, Nadezhda
Ghadiri, Rouhollah
Giovenzana, Chiara
Gooijer, George de
Green, Sargeant
Grobicki, Ania
Gutierrez, Miguel Angel
Haas, Charles
Hutch, David
Jungclaus, Jan
Kearns, Allen
Khosropanahi, Arash
Klöve, Björn
Margarita, Valentina
Mohando, Agustina
Motlagh, Vahid V.

Global Drivers of Change 1
Mugetti, Ana Cristina
Oroz, Miguel
Pehkonen, Simo
Rebolledo‐Mendez, Jovan David
Rickerby, David
Rijsberman, Frank
Shannon, Mark
Timmermans, Jos
Wilderer, Peter
Demography
Birg, Herwig
Diop, Salif
Falkenmark, Malin
Faures, Jean‐Marc
Fontanella, Lara
Gillespie, Duff
Gráda, Cormac Ó
Hughes, Barry
Jaspers, Dirk
Jin, Zhouying
Wang, Rusong
Weston, Mark
Economy and security
Axler, Richard
Cordeiro, José
Emem, Andrew
Galietti, Francesco
Gaponenko, Nadezhda
Graves, John
Grujicic, Sasha Aleksandar
Gutierrez, Miguel Angel
Kumar, Ritesh
Martinez Aldaya, Maite
Myronuk, Kathryn
Pop, Adrian
Rebolledo‐Mendez, Jovan David
Rives, Eugenie
Salame, Lena
Sharan, Anandi
Stigson, Peter
Stonyer, Heather
Verma, Shilp
Wilderer, Peter
Wolbring, Gregor
Zabala, Raquel
Zhouying, Jin
Governance and
politics
Allan, John Anthony
Bardsley, Sarah
Boelens, Rutgerd
Bushnell, Dennis
Christoffel, Tom
Cordeiro, José
Coumba, Sylla
Desaint, Claire
Donovan, Nancy
Florescu, Elizabeth
Gaillard‐Picher, Danielle
Gieseke, Tim
Girgis, Ayman
Gooijer, George de
Gordon, Theodore
Gould, Steve
Green, Sargeant
Grey, David
Grobicki, Ania
Idiatullin, Anvar
Ivanova, Maria
Kerdany, Aly
Kim, Sangsik
Maestu, Josefina
Magsig, Bjørn‐Oliver
Mantzanakis, Stavros
Martinez Aldaya, Maite
Michael, Vancutsem
Miller, Riel
Mitchell, Stephen
Muller, Mike
Myers, Doug
Olavarrieta, Concepcion
Pelchat, Christiane
Pop, Adrian
Pride, Stephanie
Rickerby, David
Rosenzweig, Lee
Saulnier, Pierre
Smith, Jack
Soroka, Leah
Timmermans, Jos
Wouters, Patricia
Zhouying, Jin
Ethics
Alzubi, Ibrahim

Global Drivers of Change 2
Anderson, Erika
Ayotte, David
Bai, Ying
Bell, Wendell
Boelens, Rutgerd
Chamberlain, Gary
Cordeiro, José
Ezechieli, Eric
Gaponenko, Nadezhda
Gooijer, George de
Howe, Charles
Kelleher, Anita
Llamas, M. Ramon
Mitchell, Stephen
Santiago, Bilinkis
Sclarsic, Sarah
Teniere‐Buchot, Pierre
Wilderer, Peter
Wolbring, Gregor
Wong, Julielynn
Zabala, Raquel

Global Drivers of Change 1
ANNEX 4
List of Top Five Developments by Domain, Combined by Importance and
Probability with 10% Margin
1 Water resources
Importance:
• Water productivity for food production increased about 100% between 1961 and 2001. This is the date by which it has
increased another 100%. (Importance: 4.9/5; Most Likely Decade to Occur (average year, with decade midpoint used to
calculate average): 2039)
• Globally rainfed agriculture has average yields of 3.5T/hectare of grain. (Importance: 4.8/5; Most Likely Decade to Occur
(average year, with decade midpoint used to calculate average): 2041)
• The percentage of land area subject to droughts increases by at least 50%, 40% and 30% for extreme, severe and moderate
drought respectively. (Importance: 4.6/5; Most Likely Decade to Occur (average year, with decade midpoint used to calculate
average): 2045)
• Extinction rates for freshwater species are five times higher for freshwater animals than for terrestrial species. (Importance:
4.5/5; Most Likely Decade to Occur (average year, with decade midpoint used to calculate average): 2031)
• Compared to global grassland and forest area in 2010, a further 15% is lost through expansion of agriculture and urban
development. (Importance: 4.4/5; Most Likely Decade to Occur (average year, with decade midpoint used to calculate average):
2027) [Note: ranks fourth earliest most likely below]
Importance – Falling within the margin (the highest importance was 4.9, thus all those 4.4 or higher):
• No additional developments
Probability – Most Likely Decade to Occur:
• Total global water withdrawals increase by 5% from 2000. ((Importance: 2.8/5; Most Likely Decade to Occur (average year, with
decade midpoint used to calculate average): 2017)
• Global agricultural trade contains virtual water equivalent to 20% of the total water withdrawn globallyfor food production.
(Importance: 3/5; Most Likely Decade to Occur (average year, with decade midpoint used to calculate average): 2018)

Global Drivers of Change 2
• Pacific Decadal, El Nino/Southern, and North Atlantic Oscillations are understood and included in climate forecasting models.
(Importance: 3.2/5; Most Likely Decade to Occur (average year, with decade midpoint used to calculate average): 2020)
• Compared to global grassland and forest area in 2010, a further 15% is lost through expansion of agriculture and urban
development. (Importance: 4.4/5; Most Likely Decade to Occur (average year, with decade midpoint used to calculate average):
2027) [Note: ranks fifth most important above]
• In most of the populated areas of the world there is a 10% reduction in annual mean stream flows. (Importance: 4/5; Most
Likely Decade to Occur (average year, with decade midpoint used to calculate average): 2029)
Probability – Most Likely Decade to Occur – Falling within the margin (earliest was 2017 on a 50 year span,
so all those by 2022):
• No additional developments
2 Infrastructure
Importance:
• 90% of the global population has reasonable access to a reliable source of safe potable water. (Importance: 5/5; Most Likely
Decade to Occur (average year, with decade midpoint used to calculate average): 2041)
• All dams and dikes over 50 years old and all those with significant risks from hazards are inspected annually for structural
soundness. (Importance: 4.8/5; Most Likely Decade to Occur (average year, with decade midpoint used to calculate average):
2036)
• 90 % of the global population has reasonable access to appropriate sanitation facilities. (Importance: 4.7/5; Most Likely Decade
to Occur (average year, with decade midpoint used to calculate average): 2048)
• Increased siltation of the dams due to climate change and deforestation has shortened by 30% the estimated remaining lifetime
of a significant number of large dams. (Importance: 4.6/5; Most Likely Decade to Occur (average year, with decade midpoint
used to calculate average): 2032) [Note: also ranks fourth earliest most likely below]
• External debt of low‐income countries is written off, freeing funds for investment in water infrastructure. (Importance: 4.6/5;
Most Likely Decade to Occur (average year, with decade midpoint used to calculate average): 2040)
Importance – Falling within the margin (the highest importance was 5, thus all those 4.5 or higher):
• Nearly all water uses are metered or identified. (Importance: 4.5/5; Most Likely Decade to Occur (average year, with decade
midpoint used to calculate average): 2046)
Probability – Most Likely Decade to Occur:
• Inland navigation needs continues to influence river operations and flow allocations. (Importance: 2.6/5; Most Likely Decade to
Occur (average year, with decade midpoint used to calculate average): 2022)
• National water planning will take into account the need to provide appropriate environmental flows in the regulation of water
infrastructure. (Importance: 3/5; Most Likely Decade to Occur (average year, with decade midpoint used to calculate average):
2028)

Global Drivers of Change 3
• Robots remotely and reliably mend underground pipes in at least ten countries. (Importance: 3.3/5; Most Likely Decade to
Occur (average year, with decade midpoint used to calculate average): 2031)
• Increased siltation of the dams due to climate change and deforestation has shortened by 30% the estimated remaining lifetime
of a significant number of large dams. (Importance: 4.6/5; Most Likely Decade to Occur (average year, with decade midpoint
used to calculate average): 2032) [Note: also ranks most important above]
• Remote sensing technologies and GPS are used to supplement other technologies to identify, map and explore underground
infrastructure whose location was unknown or forgotten. (Importance: 2.8/5; Most Likely Decade to Occur (average year, with
decade midpoint used to calculate average): 2032)
Probability – Most Likely Decade to Occur – Falling within the margin (earliest was 2022 on a 50 year span,
so all those by 2027):
• No additional developments
3 Climate change
Importance:
• The number of people at risk from water stress (less than 1200 m³/capita) is 1.7 billion. (Importance: 4.8/5; Most Likely Decade
to Occur (average year, with decade midpoint used to calculate average): 2028) [Note: also ranked third earliest most likely to
occur, below]
• The number of people at risk from water stress (less than 1200 m³/capita) is 2.0 billion. (Importance: 4.8/5; Most Likely Decade
to Occur (average year, with decade midpoint used to calculate average): 2033) [Note: also ranked 5th earliest most likely to
occur, below]
• Inter‐annual freshwater shortages combined with flooding reduce total global crop yields by 10%. (Importance: 4.7/5; Most
Likely Decade to Occur (average year, with decade midpoint used to calculate average): 2043)
• Worldwide rise in living standards and population increase greatly increases the demand for energy causing a 20% increase in
GHG emissions. (Importance: 4.6/5; Most Likely Decade to Occur (average year, with decade midpoint used to calculate
average): 2030) [Note: also ranked 4th earliest most likely to occur, below]
• Delta land vulnerable to serious flooding expands by 50%. (Importance: 4.6/5; Most Likely Decade to Occur (average year, with
decade midpoint used to calculate average): 2043)
Importance – Falling within the margin (the highest importance was 4.8, thus all those 4.3 or higher):
• A strong, effective, universally binding international agreement to combat climate change is in place. (Importance: 4.4/5; Most
Likely Decade to Occur (average year, with decade midpoint used to calculate average): 2040)
• Wind power generates 20% of the world electricity demand. (Importance: 4.3/5; Most Likely Decade to Occur (average year,
with decade midpoint used to calculate average): 2038)

Global Drivers of Change 4
Probability – Most Likely Decade to Occur:
• An extensive well‐planned and financed multi‐national campaign is launched supporting public education on the facts, causes,
effects and costs of climate change. (Importance: 3.4/5; Most Likely Decade to Occur (average year, with decade midpoint used
to calculate average): 2021)
• Indisputable global precipitation and temperature changes are reported publicly. (Importance: 4/5; Most Likely Decade to
Occur (average year, with decade midpoint used to calculate average): 2027)
• The number of people at risk from water stress (less than 1200 m³/capita) is 1.7 billion. (Importance: 4.8/5; Most Likely Decade
to Occur (average year, with decade midpoint used to calculate average): 2028) [Note: also 1st in importance above]
• Worldwide rise in living standards and population increase greatly increases the demand for energy causing a 20% increase in
GHG emissions. (Importance: 4.6/5; Most Likely Decade to Occur (average year, with decade midpoint used to calculate
average): 2030) [Note: also ranked 4th in importance above]
• The number of people at risk from water stress (less than 1200 m³/capita) is 2.0 billion. (Importance: 4.8/5; Most Likely Decade
to Occur (average year, with decade midpoint used to calculate average): 2033) [Note: also ranked 3rd in importance above]
Probability – Most Likely Decade to Occur – Falling within the margin (earliest was 2021 on a 50 year span,
so all those by 2026):
• No additional developments
4 Agriculture **Developments marked with an asterisk below have a low number of respondents
Importance:
• **Environmental services are valued and managed to improve the quality of agricultural water (**3 respondents ranked
importance of 10/10; Probability 2020=53%(3 respondents); in 2030=87%(2 respondents) [note: also would rank 1st in
probability below]
• **Seed varieties of high nitrogen‐use efficiency are developed and used (**only 1 respondent, rated importance of 10/10; 2
respondents for 2020 probability=80%; 2 respondents for 2030 probability=50%) [note:also would rank 2nd in probability below]
• Withdrawals for agriculture increase from 3,100 billion m3 to 4,500 billion m3 in 2030. (Importance: 9.86/10; Probability: 2020
= 46%; 2030 = 58%)
• Expansion of agricultural lands is slowed significantly by ecological concerns. (Importance: 9.43/10; Probability: 2020=26%;
2030=36%)
• The slowing pace of deforestation continues (1990‐2000: 16 million ha lost; 2000‐2010: 13 million ha lost). (Importance:
9.38/10; Probability: 2020 = 59%; 2030 = 58%)
Importance – Falling within the margin (the highest importance was 9.86, thus all those 8.86 or higher):
• Water productivity in grain triples in some developing countries (e.g. China today produces 1 kg wheat and corn/cubic meter of
water; Ethiopia, 0.1 to 0.2 kg/cubic meter.) (Importance: 9.25/10; Probability: in 2020=63%; in 2030=71%) [note: also falls
within margin of most probable]

Global Drivers of Change 5
• Less than half of the gap between supply and demand for agricultural water is filled by conventional means (improvements in
water productivity and conservation); the rest comes from non‐traditional approaches (such as desalination). (Importance:
9.25/10; Probability: 2020=39%; 2030=33%)
• **New plant strains are introduced that have improved productivity per unit of water as their goal. (Importance: 9.25/10 (4
respondents); Probability: 2020=55% (4 respondents); 2030=50% (**3 respondents)
• Large scale efforts are initiated in many developed countries to reduce food losses due to spoilage in the field, in storage and in
transportation, with concomitant savings in water usage. (Importance: 9.14/10; Probability: 2020=54%; 2030=65%)
• Use of untreated waste water for irrigation continues in many developing countries despite the health risks. (Importance:
9.13/10; Probability: 2020=73%; 2030=64%) [note: also falls within margin of most probable]
• The potential for increasing yields from rainfed farming is realized by adaptation to climate variability (changed seeding season,
or varieties or plants). (Importance: 9/10; Probability: 2020=49%; 2030=55%)
• Agricultural croplands expand more than 20%, particularly in Latin America and Africa. (Importance: 9/10; Probability:
2020=58%; 2030=64%)
• Large scale and routine use of precision farming expands in many developing countries (including the use of robot GPS steered
tractors and the use of multi‐spectral satellite scanners to determine soil condition, and fertilizer requirements). (Importance:
9/10; Probability: 2020=27%; 2030=44%)
• **Algal‐based biofuels largely replace those from terrestrial plants, including palm trees, soy and sugar cane (3 respondents
rated Importance, at 9/10; Probability: in 2020=26.25(4 respondents); in 2030=45% (3 respondents)
Most important variables (using same margin of importance as above, thus 8.86 or higher):
• **Variable: Improved access to potable water sources (% of population with access) (2 respondents ranked importance, at
9.5/10; percent in 2020=92.5(2 respondents); in 2030=70(1 respondent)
• **Variable: Percent of water ‘saved’ through virtual water trade between nations (considering the potential need of water for
producing the respective food/goods) (3 respondents ranked importance, at 9/10; percent in 2020=30%; percent in
2030=31.67(3 respondents)
• **Variable: Annual freshwater withdrawals, total (billion cubic meters) (1 respondent ranked importance, at 9/10; value in
2020=4200(1 respondent); in 2030=5000(1 respondent)
• **Variable: Number of countries experiencing severe water scarcity (1 respondent ranked importance, at 9/10; number in
2020=50(1 respondent); number in 2030=70(1 respondent)
Probability:
• Nitrogen fertilizer prices continue to track energy prices (Importance: 7.67/10; Probability: 2020=75%; 2030 = 80%)
• **Some cities satisfy 3% of more of food supply by farming on vacant lots (2 respondents rated an Importance: 9/10, Probability:
in 2020=40% (2 respondents); in 2030=80% (2 respondents) [note: also would rank within margin of importance above]
• **GM seeds are developed and distributed at prices that are affordable to rural farmers in the poorest countries that are
particularly affected by the negative impacts caused by climate change and variability (**One respondent ranked an Importance
of 9/10; Probability: in 2020=60%(2 respondents); in 2030=75%(one respondent) [note: also would fall within margin of
importance above]

Global Drivers of Change 6
• **Multinational agribusiness corporations become effective global monopolies, strongly influencing food prices (**2
respondents ranked an importance of 9/10; Probability: in 2020=70%(3 respondents); in 2030=75%(2 respondents)) [note: also
falls within margin of importance above]
• **Aquaculture produces as much food as fishing of the oceans and lakes (Importance: 9/10; Probability 2020=35%(3
respondents); 2030=75%) [note: also falls within margin of importance above]
• Investments in infrastructure improve production potential of rainfed farming,
e.g. improving rainwater collection & storage systems. (Importance: 8.86/10; Probability: 2020 = 57%; 2030 = 74%) [note: also
falls within margin of most important]
Probability – Falling within the margin (highest was 80%, so all those 70% or higher):
• The additional developments falling within the margin are already listed under those falling within margin of Importance
5 Technology
Importance:
• One billion of the largest water consumers use products to conserve water: pressure‐reducing valves, horizontal‐axis clothes
washers, water‐efficient dishwashers, grey‐water recycling systems, low‐flush tank toilets, low‐flow or waterless urinals.
(Importance: 9.65/10; Probability: 2020 = 51%; 2030 = 77%) [Note: is also the most probable Tech development]
• Technologies for water desalination in large volumes become so inexpensive that nearly all people within 100 miles of
coastlines have water for their needs. (Importance: 9.12/10; Probability: 2020 = 22%; 2030 = 44%)
• Economically viable nanotechnology (such as carbon nanotubes) yields new and effective membranes and catalysts useful in
desalination and pollution control (e.g. removing heavy metal and other dissolved pollutants from water). (Importance:
8.92/10; Probability: 2020=45%; 2030=72%) [note: also falls within margin of most probable]
Importance – Falling within the margin (the highest importance was 9.65, thus all those 8.65 or higher):
• Agriculturists using an affordable technology capture real‐time data about their crops and soil moisture to make informed
decisions on efficient watering schedules. (Importance: 8.80/10; Probability: 2020=54%; 2030=74%) [note: also falls within
margin of most probable]
• Evaporation control technologies spread widely; their use doubles. (Importance: 8.65/10; Probability: 2020=54%; 2030=71%)
[note: also falls within margin of most probable]
Most important variables (using same margin of importance as above: 8.65 or more):
• Variable: Number of countries experiencing severe water scarcity. (Importance: 9.92/10; Number of countries in 2020=43;
Number of countries in 2030=69)
• Variable: Improved access to potable water sources (% of population with access) (Importance: 9.86/10; Percentage in
2020=83%; Percentage in 2030=76%)
• Variable: Percentage of water for industrial use. (Importance: 8.92/10; Percentage in 2020=23%; Percentage in 2030=35%)

Global Drivers of Change 7
Probability:
• Rainwater harvesting is practiced widely and new simple and cheap ways of purifying the collected water become available.
(Importance: 8.91/10; Probability: 2020 = 54%; 2030 = 74%) [note: also falls within margin of most important]
• Agriculturists use affordable technology to capture real‐time data on their crops and soil moisture, to make informed decisions
on efficient watering schedules. (Importance: 8.80/10 ; Probability: 2020 = 54%; 2030 = 74%) [note: also falls within margin of
most important]
Probability – Falling within the margin (highest was 77%, so all those 67% or higher):
• Availability of a water footprint measure, published widely on an annual basis (e.g. in 2030, the ecological footprint is expected
to be around 2 planets Earth) (Importance: 8.35/10; Probability: 2020=54%; 2030=74%)
• Weather forecasting models are able to give accurate predictions 2 weeks in advance. (Importance: 8.25/10; Probability:
2020=54%; 2030=72%)
• Satellites continuously monitor globally the functioning and operation of water infrastructure (e.g. leakage from dams and
canals). (Importance: 8.08/10; Probability: 2020=49%; 2030=67%)
6 Demography
Importance:
• Decade by which world population reaches 10.46 billion (Importance: 4.3/5; Most Likely Decade to Occur (average year, with
decade midpoint used to calculate average): 2056)
• Decade by which 70% of the world population is urban. (Importance: 4.3/5; Most Likely Decade to Occur (average year, with
decade midpoint used to calculate average): 2039)
• Decade by which the average fertility level in the less developed regions reaches 2.05 (UN 2008 Revision medium variant;
average estimated fertility level for 2005‐2010 in these countries is 2.73) (Importance: 4.2/5; Most Likely Decade to Occur
(average year, with decade midpoint used to calculate average): 2052)
• Decade by which world population reaches 9.15 billion (Importance: 4.1/5; Most Likely Decade to Occur (average year, with
decade midpoint used to calculate average): 2053)
• Decade by which world population reaches 7.9 billion (Importance: 4/5; Most Likely Decade to Occur (average year, with
decade midpoint used to calculate average): 2034)
Importance – Falling within the margin (the highest importance was 4.3, thus all those 3.8 or higher):
• Decade by which the average fertility level in the less developed regions reaches 2.53 (UN 2008 Revision high variant; average
estimated fertility level for 2005‐ 2010 in these countries is 2.73). (Importance: 3.9/5; Most Likely Decade to Occur (average
year, with decade midpoint used to calculate average): 2032) [Note: ranked 5th earliest most likely to occur, below]
Probability – Most Likely Decade to Occur:
• In the group of 58 countries for whom HIV/AIDS prevalence is above 1% and/or whose HIV population exceeds 500,000, decade
by which the majority reach antiretroviral treatment coverage for those living with HIV/AIDS of 60% or more (estimated

Global Drivers of Change 8
average in 2007 is 36 per cent) (Importance: 2.8/5; Most Likely Decade to Occur (average year, with decade midpoint used to
calculate average): 2026)
• In the group of 58 countries for whom HIV/AIDS prevalence is above 1% and/or whose HIV population exceeds 500,000, decade
by which the number of interventions to prevent mother‐to‐child transmission of HIV reaches an average of 60% (estimated
average in 2007 is 36 per cent) (Importance: 2.8/5; Most Likely Decade to Occur (average year, with decade midpoint used to
calculate average): 2026)
• Decade by which there are less than 60 developing countries with an under‐five mortality rate of 45 deaths or higher per 1,000
live births (average estimated rate for 2005‐2010 in less developed countries is 78). (Importance: 3/5; Most Likely Decade to
Occur (average year, with decade midpoint used to calculate average): 2029)
• Decade by which the combined global deaths per year from diarrhoeal diseases and malaria decrease to 1.54 million or less.
(Combined global deaths from diarrhoeal diseases and malaria in 2008 were 2.53 million.) (Importance: 3/5; Most Likely Decade
to Occur (average year, with decade midpoint used to calculate average): 2029)
• Decade by which the average fertility level in the less developed regions reaches 2.53 (UN 2008 Revision high variant; average
estimated fertility level for 2005‐ 2010 in these countries is 2.73). (Importance: 3.9/5; Most Likely Decade to Occur (average
year, with decade midpoint used to calculate average): 2032) [Note: also falls within margin of most important above]
Probability – Most Likely Decade to Occur – Falling within the margin (earliest was 2026 on a 50 year span,
so all those by 2031):
• No additional developments
7 Economy and security
Importance:
• Demand for water in developing countries increases by 50% over today's
(Importance: 9.7/10; Probability: 2020 = 75%; 2030 = 85%) [note: 2nd most probable]
• Unequal access to water creates new economic polaritie
(Importance: 9.47/10; Probability: 2020 = 80%; 2030 = 86% ) [note: 1st most probable]
• Over 40% of world countries experience severe freshwater scarcity
(scarcity = water supplies drop below 1,000 cubic meters per person per year) (Importance: 9.32/10; Probability: 2020 = 77%;
2030 = 74%) [note: 3rd most probable]
Importance – Falling within the margin (the highest importance was 9.7, thus all those 8.7 or higher):
• Over 50 million people lose their livelihoods due to water scarcity. (Importance: 9/10; Probability: 2020 = 70%; 2030 = 71%)
• Water gains center stage in climate change adaptation strategies and 'green credits' policies. (Importance: 9/10; Probability:
2020=45%; 2030=63%)
• Water availability becomes a serious consideration in electricity generation; lack of water results in reduction below planned
generation levels sometime during the year at 10% of all plants. (Importance: 9/10; Probability: 2020=44%; 2030=57%)
• Inexpensive prophylactic measures that prevent water borne diseases are developed. (Importance: 8.92/10; Probability:
2020=60%; 2030=73%)

Global Drivers of Change 9
• Food prices (in constant dollars) rise globally by at least 30% compared to 2010. (Importance: 8.86/10; Probability: 2020=50%;
2030=58%)
• Multinational agribusiness corporations become effective global monopolies, strongly influencing food prices. (Importance:
8.77/10; Probability: 2020=63%; 2030=59%)
• Lack of water forces business to move, increasing poverty in those regions (e.g. India). (Importance: 8.67/10; Probability:
2020=58%; 2030=65%)
Most important variables (using same margin of importance as above: 8.7 or more):
• Variable: Annual freshwater withdrawals, total (billion cubic meters) (Importance: 9.6/10; total withdrawals in 2020=3,358; in
2030=3,880)
• Variable: Improved access to potable water sources (% of population with access) (Importance: 9.38/10; Percentage in
2020=87%; Percentage in 2030=94%)
• Variable: Number of countries experiencing severe water scarcity. (Importance: 9.25/10; number in 2020=54; in 2030=59)
• Variable: Percentage of water for industrial use. (Importance: 8.88/10; Percentage in 2020=34%; Percentage in 2030=37%)
Probability:
• Availability of a water footprint measure, published widely on an annual basis (e.g. in 2030, the ecological footprint is expected
to be around 2 planets Earth) (Importance: 8.8/10; Probability: 2020=70%; 2030=83%) [note: also falls within margin of most
important]
• Over 40% of world countries experience severe freshwater scarcity
(scarcity = water supplies drop below 1,000 cubic meters per person per year) (Importance: 9.32/10; Probability: 2020 = 77%;
2030 = 74%) [note: 3rd most important]
• Several types of cost‐effective desalination or other technologies are widely available and increase safe water supply by 20%
globally (Importance: 9.25/10; Probability: 2020=55%; 2030= 77%) [note: also falls within margin of most important]
Probability – Falling within the margin (highest was 86%, so all those 76% or higher):
• No additional developments
8 Governance
Importance:
• Failure of urban water supply infrastructure occurs in more than two dozen major cities (and underscores the need for
upgrading of water systems). (Importance: 9.44/10; Probability: 2020=62%; 2030=76%) [Note: 2nd most probable development]
• Online forums on water issues including local government and civil society are developed in 75% of the world, reducing the
asymmetry of information between user, provider and policy‐maker. (Importance: 9.38/10; Probability: 2020=52%; 2030= 71%)
[Note: also 3rd most probable development]
• Networked coordination at the national level to share information and best practices between local water agencies is achieved
in at least 95% of countries. (Importance: 9.13/10; Probability: 2020=45%; 2030=60%)

Global Drivers of Change 10
• An international convention specifically dedicated to groundwater is negotiated. (Importance: 9.11/10; Probability: 2020=42%;
2030= 54%)
Importance – Falling within the margin (the highest importance was 9.44, thus all those 8.44 or higher):
• Worldwide use of comprehensive decision‐making tools for identifying the best technologies or approaches to meet water,
sanitation, and hygiene needs. (Importance: 9/10; Probability: 2020=37%; 2030=58%)
• Waterfootprint reporting and reduction becomes officially part of government policymaking and sustainable development
strategy in at least 90% of countries. (Importance: 8.92/10; Probability: 2020=31%; 2030=45%)
• Water resources formally declared a state property in 85% of countries. (Importance: 8.82/10; Probability: 2020=37%;
2030=47%)
• The UN Watercourses Convention is implemented with Regional Protocols on Shared Watercourses established for all world
regions, (thus providing a regional framework for water management and cooperation by the states, exchange of data and
information, notification of planned development measures and transboundary environmental assessments. (Importance:
8.8/10; Probability: 2020=52%; 2030=67%)
• The United Nations Global Environment Monitoring System (GEMS) Water Programme encompasses all world countries and
maintains an on‐line data base of water quality around the world. (It now uses 3,000 monitoring stations in 100 countries)
(Importance : 8.78/10; Probability : 2020=48%; 2030=63%)
Probability:
• The 1997 United Nations Convention on Non‐Navigational Uses of International Watercourses gets the 35 ratifications to enter
into force. (by mid‐2010, it received 19 ratifications) (Importance: 8.75/10; Probability: 2020 = 70%; 2030=88%) [note: also falls
within margin of most important]
Probability – Falling within the margin (highest was 88%, so all those 78% or higher):
• No additional developments fall within the margin
9 Politics
Importance:
• Transparency and participation procedures are established and followed in matters of water governance in at least 120
countries. (Importance: 9.14/10; Probability: 2020=27%; 2030=35%)
• Less than 1 billion people live in insecure or unstable countries that run a significant risk of collapse (compared to 2 billion in
2010 according to the Failed States Index). (Importance: 9.09/10; Probability: 2020=25%; 2030=28%)
• Social instability and violence spread to most states faced with chronic water scarcity. (Importance: 9.08/10; Probability:
2020=49%; 2030=57%)
Importance – Falling within the margin (the highest importance was 9.14, thus all those 8.14 or higher):
• Establishing local water institutions and practices (such as the village mirabs in Afghanistan) has become one of the building
blocks to restore peace in failing states. (Importance: 9/10; Probability: 2020=42%; 2030=52%)

Global Drivers of Change 11
• State sovereignty has shifted to 'nested levels of governance': decentralized decision‐making with appropriate transfer of
authority and resources to the decision‐making level that best corresponds to the scale of the problems being addressed.
(Importance: 8.89/10; Probability: 2020=28%; 2030=33%)
• A series of reforms to international corporate law now forces multinational companies to address their liabilities, such as
damages to the environment. (Importance: 8.73/10; Probability: 2020=41%; 2030=49%)
• Foresight functions are a routine part of national governments in 120 countries. (Importance: 8.72/10; Probability: 2020=48%;
2030=58%)
• The need to consider future generations in development and in legislation is generally accepted: mechanisms are established in
more than 20 countries to provide for independent inquiry with public participation on major development proposals and
legislation that may impact future generations. (Importance: 8.65/10; Probability: 2020=45%; 2030=53%)
• The provision of global public goods such as health, education, environmental restoration and peacekeeping are partially
financed by taxing global negative externalities (arms, pollution, destabilizing financial flows) and/or by revenues from the
management of global resources (fishing rights, deep‐sea mining, carbon emission permits). (Importance: 8.63/10; Probability:
2020=22%; 2030=28%)
• Lack of coordination and of mutually agreed water strategy at the national, regional and local levels result in ineffective
community participation and lack of influence in decision‐making. (Importance: 8.62/10; Probability: 2020=68%; 2030=65%)
[note: also falls within margin of most probable]
• The majority of government structures allow for civil society to actively participate in policy design and service delivery.
(Importance: 8.53/10; Probability: 2020=40%; 2030=47%)
• Globalization has led to a rise in protectionist sentiment as a result of increased inequality and lower standards of living for the
majority of the population around the world. (Importance: 8.5/10; Probability: 2020=53%; 2030=55%)
• An effective market mechanism has been developed and implemented that fully integrates pricing of the economic costs of
maintaining sustainable water and other environmental ecosystems into wealth creation processes. (Importance: 8.4/10;
Probability: 2020=21%; 2030=30%)
• The average number of major armed conflicts (with 1,000 or more deaths) has been reduced to a handful (there were 14
conflicts in 2010). (Importance: 8.38/10; Probability: 2020=31%; 2030=33%)
• International assistance shifts away from global cooperative projects to projects that adhere to diversified national interests,
based on principles of non‐intervention and respect for state sovereignty. (Importance: 8.33/10; Probability: 2020=40%;
2030=45%)
• Governments of at least 100 countries have entered into integrity/anti‐corruption pacts for all public procurement processes or
contractual requirements. (Importance: 8.31/10; Probability: 2020=29%; 2030=35%)
• A global collective intelligence system tracks Science and Technology information and cooperation around the world.
(Importance: 8.27/10; Probability: 2020=51%; 2030=63%)
• Civil servants of most countries are routinely trained in foresight and in decision‐making. (Importance: 8.24/10; Probability:
2020=31%; 2030=39%)
• More than 60% of the world's population lives in countries where fundamental rights and civil liberties are respected
(compared to 46% in 2009). (Importance: 8.2/10; Probability: 2020=32%; 2030=39%)
• Large scale attempts by most governments to shape public opinion use social marketing to gain popular support for water
policies and encourage appropriate water use. (Importance: 8.2/10; Probability: 2020=56%; 2030=63%)

Global Drivers of Change 12
Probability:
• Resistance within government and from vested interests keeps governments from becoming more participatory, flexible and
transparent in at least 100 countries, leading to further mistrust and/or increased activism (Importance: 8.92/10; Probability:
2020=74%; 2030=77%) [note: also falls within margin of most important]
• Most people agree that there is an interconnectedness among living systems. (Importance: 8/10; Probability: 2020=69%;
2030=76%)
Probability – Falling within the margin (highest was 77%, so all those 67% or higher):
• There are observable trends towards societies' priorities shifting more strongly to immediate and local issues, as a result of, for
example, high rates of unemployment, fear of ecosystem collapse or terrorism. (Importance: 7.78/10; Probability: 2020=65%;
2030=69%)
• Also see above
10 Ethics
Importance:
• In addressing human values, most people would agree that the present has an obligation to preserve opportunities for the
future. (Importance: 9.05/10; Probability: 2020 = 66%; 2030 = 75%) [also 1st most probable development]
• Increasing scarcity deepens current inequalities in access to water in poor countries. (Importance: 8.87/10; Probability: 2020 =
66%; 2030 = 72%) [note: also falls within margin of most probable]
• Access to clean water is regarded by most countries in the world as a basic human right (Importance: 8.76/10; Probability: 2020
= 56%; 2030 = 68%) [also 3rd most probable development]
• Water‐related anti‐poverty strategies are used in at least 30 countries, including for example, employment of poor people at
water points, in irrigation, and food production (Importance: 8.69/10; Probability: 2020 = 47%; 2030 = 58%)
Importance – Falling within the margin (the highest importance was 9.05, thus all those 8.05 or higher):
• Educational curricula in most countries change to discourage over‐consumption and waste. (Importance: 8.61/10; Probability:
2020=39%; 2030=51%)
• Great increase in public participation in decisions affecting water pricing and distribution, including particularly women and
indigenous people. (Importance: 8.53/10; Probability: 2020=37%; 2030=52%)
• Most people in the world display an awareness of the interconnectedness of living systems. (Importance: 8.5/10; Probability:
2020=26%; 2030=37%)
• Studies of water availability and usage almost always include consideration of societal values, interest groups, and cultural
norms. (Importance: 8.41/10; Probability: 2020=56%; 2030=67%) [note: also falls within margin of most probable]
• Availability of a water footprint measure, published widely on an annual basis (e.g. in 2030, the ecological footprint is expected
to be around 2 planets Earth) (Importance: 8.25/10; Probability: 2020=47%; 2030=58%)
• Creation of an online "Water Situation Room", as a repository of collective intelligence on water. (Importance: 8.20/10;
Probability: in 2020=53%; 2030=68%) [note: also falls within margin of most probable]

Global Drivers of Change 13
• Water pricing used in most countries to create incentives for efficient water use. (Importance: 8.17/10; 2020=47%; 2030=61%)
• Most countries in the world adopt a common code of ethics in addressing water issues. (Importance: 8.15/10; Probability:
2020=29%; 2030=39%)
• Strategies designed to mitigate the effects of climate change generally include policies that will improve access to water and
water use. (Importance: 8.13/10; Probability: 2020=59%; 2030=63%)
• The gap between rich and poor increases within a dozen or more countries, at least partially as a result of water scarcity.
(Importance: 8.08/10; Probability: 2020=59%; 2030=63%)
• International protocols signed by 75% or more of the nations of the world formally recognize water as a basic human need.
(Importance: 8.07/10; Probability: 2020=44%; 2030=60%)
• Technologies for water desalination in large volumes become so inexpensive that nearly all people within 100 miles of
coastlines have water for their needs (resulting, for example, in elimination of value conflict over water supply and use).
(Importance: 8.07/10; Probability: 2020=32%; 2030=46%)
Most important variables (using same margin of importance as above, thus 8.05 or higher):
• Variable: Number of countries experiencing severe water scarcity. (Importance: 8.85/10; Number in 2020=37; in 2030=47)
• Variable: Annual freshwater withdrawals, total (billion cubic meters) (Importance: 8.42/10; Withdrawals in 2020=2,288; in
2030=3,255)
• Variable: Improved access to potable water sources (% of population with access) (Importance: 8.09/10; Percentage in
2020=91%; 2030=84%)
• Variable: Percentage of water for industrial use. (Importance: 8.08/10; Percentage in 2020=22%; 2030=28%)
Probability:
• Emergence of collaborative international R&D on the ethical uses of water (Importance: 7.94/10; Probability: 2020 = 63%; 2030
= 69%)
Probability – Falling within the margin (highest was 75%, so all those 65% or higher):
• The additional developments falling within the margin are already listed under those of Importance and falling within margin of
Importance