The designations employed and the presentation of … designations employed and the presentation of...
84
Transcript of The designations employed and the presentation of … designations employed and the presentation of...

The designations employed and the presentation of material in this information product do not imply the expression of any opinion whatsoever on the part of the Food and Agriculture Organization of the United Nations concerning the legal or development status of any country, territory, city or area or of its authorities, or concerning the delimitation of its frontiers or boundaries. The mention of specific companies or products of manufacturers, whether or not these have been patented, does not imply that these have been endorsed or recommended by the Food and Agriculture Organization of the United Nations in preference to others of a similar nature that are not mentioned.
The views expressed in this publication are those of the author(s) and do not necessarily reflect the views of the Food and Agriculture Organization of the United Nations.
All rights reserved. Reproduction and dissemination of material in this information product for educational or other non-commercial purposes are authorized without any prior written permission from the copyright holders provided the source is fully acknowledged. Reproduction of material in this information product for resale or other commercial purposes is prohibited without written permission of the copyright holders.
Applications for such permission should be addressed to:
ChiefElectronic Publishing Policy and Support BranchCommunication DivisionFAOViale delle Terme di Caracalla, 00153 Rome, Italyor by e-mail to: [email protected]
Citation of this report should use the following: Townshend, J.R., Latham, J., Arino, O., Balstad, R., Belward, A., Conant, R., Elvidge, C., Feuquay, J., El Hadani, D., Herold, M., Janetos, A., Justice, C.O., Liu Jiyuan, Loveland, T., Nachtergaele, F., Ojima, D., Maiden, M., Palazzo, F., Schmullius, C., Sessa, R., Singh, A., Tschirley, J. and Yamamoto, H. 2008. Integrated Global Observations of the Land: an IGOS-P Theme. IGOL Report No. 8, GTOS 54.
Photographs supplied by John Townshend. They may be reproduced without permission for non-commercial purposes.
© F A O 2 0 0 8

INTEGRATED GLOBAL OBSERVATIONS OF THE LAND
An IGOS-P Theme
Townshend, J.R., Latham, J., Arino, O., Balstad, R., Belward, A., Conant, R., Elvidge, C., Feuquay, J., El Hadani, D., Herold, M., Janetos, A., Justice, C.O., Liu Jiyuan, Loveland, T., Nachtergaele, F., Ojima, D.,
Maiden, M., Palazzo, F., Schmullius, C., Sessa, R., Singh, A., Tschirley, J. and Yamamoto, H.
IGOL Report No. 8
GTOS 54
IGOL Sponsors

PREFACE
The Integrated Global Observing Strategy (IGOS) is a strategic planning process initiated by a partnership of international organizations that are concerned with the observational component of global environmental change issues. It links research, long-term monitoring and operational programmes, bringing together the producers of global observations and the users that require them to identify products needed, gaps in observations, and mechanisms to respond to the needs of the science and policy communities. Its principal objectives are to address how well user requirements are being satisfied by the existing observation systems, and how they could be met more effectively in the future through better integration and optimization of satellite, airborne and in situ observation systems.
The IGOS partners comprise of the Global Observing Systems (GOS), the International Organizations that sponsor the Global Observing Systems, the Committee on Earth Observation Satellites (CEOS), and International Global Change Science and Rese-arch programmes.
The IGOS Partners recognise that a comprehensive global earth observing system is best achieved through a stepwise process focused on practical results. The IGOS Themes allow for the definition and development of a global strategy for the observation of selected environmental issues that are of common interest to the IGOS Partners and to user groups. IGOS currently has the following themes: Atmospheric Chemistry, Carbon Cycle, Coastal zone and Coral Reef Sub-theme, Cryosphere, Geohazards, Land, Ocean and the Water Cycle.
The IGOS Land Theme was initially proposed in November 2003 on the recognition that IGOS-P had not yet considered many observational needs relating to many aspects of the land, such as sustainable economic development, natural resources management, conservation and biodiversity. The theme was approved by the IGOS Partners at their 11th Plenary, in Rome, Italy, in May 2004 and a Theme Team was formed. The development of the theme was achieved with the support of the Cooperazione Italiana (Government of Italy);European Space Agency (ESA); the Food and Agriculture Organization of the United Nations (FAO); the Global Terrestrial Observing System (GTOS); the National Remote Sensing Center of China (Ministry of Science and Technology); the United Nations Environment Programme (UNEP); and the United States Geological Survey (USGS). The final draft report was submitted and approved by the IGOS Partnership in November 2007.
Barbara Ryan Walter ErdelenUSGS UNESCOIGOS-P co-chair IGOS-P co-chair
Further information on IGOS can be obtained from: www.igospartners.org
The Land Theme report is available from: www.fao.org/gtos/igol
Inquiries to the IGOS Land theme can be sent to: [email protected]
III

ACKNOWLEDGEMENTS
The support of the following sponsors is gratefully acknowledged: Cooperazione Italiana (Government of Italy); the European Space Agency (ESA); the Food and Agriculture Organization of the United Nations (FAO); the Global Terrestrial Observing System (GTOS); the National Remote Sensing Center of China (Ministry of Science and Technology); the United Nations Environment Programme (UNEP), and the United States Geological Survey (USGS). In addition the theme team would like to thank the numerous experts who provided contributions and comments to the different sections of the theme report.
IV

CONTENTS
EXECUTIVE SUMMARY VII
1 INTRODUCTION 1
2 THE NEEDS FOR IGOL 3 2.1 Agriculture 3
2.2 Forestry 3 2.3 Land degradation 3 2.4 Ecosystem goods and services 4
2.5 Biodiversity and conservation 4 2.6 Human health 4
2.7 Water resource management 4 2.8 Disasters 5 2.9 Energy 5 2.10 Urbanization: sustainable human settlement 5 2.11 Climate Change 5
3 STAKEHOLDERS FOR GLOBAL LAND OBSERVATIONS 7 3.1 Governmental stakeholders 7
3.2 International initiatives 7 3.3 NGOs 8 3.4 Science 8 3.5 General public 8 3.6 Private sector 8 3.7 Engagement of stakeholders 8
4 PRODUCTS AND OBSERVABLES 11 4.1 Land cover 11 4.2 Land use, land use change 14 4.3 Forests 16 4.4 Biophysical properties relating to ecosystem dynamics 17 4.5 Fire 20 4.6 Biodiversity and conservation 23 4.7 Agriculture 25 4.8 Soils 28 4.9 Human settlements and socio-economic data 30 4.10 Water availability and use 32 4.11 Topography 34
5 INTEGRATION ISSUES 37
5.1 Validation and Quality Assessment 37 5.2 Data fusion for analysis and modelling 38 5.3 Data assimilation 39
V
IgosL A N D
6 DATA DELIVERY 40 6.1 Data and product access 40 6.2 Data and information delivery systems 42
7 CAPACITY BUILDING 45 7.1 Background 45 7.2 Principles 45 7.3 Elements of capacity building 45 7.4 Principal actions needed 45
8 RELATION OF IGOL TO OTHER THEMES 49
9 IMPLEMENTATION 51 9.1 Strategy 51 9.2 Mapping of IGOL recommendations to GEO tasks 51
10 CONCLUDING COMMENTS 57 10.1 Remote sensing observations 57 10.2 Central role of land cover products 58 10.3 Socio-economic products 58 10.4 In situ observations 58 10.5 Importance of validation 58 10.6 Key role of improved classification schemes 58 10.7 Delivering observations and products 58 10.8 Data policies 58 10.9 Capacity building 58 10.10 New application areas 59 10.11 IGOL and GEOSS 59
REFERENCES 61
ACRONYMS 65
PARTECIPANTS IN THE IGOL THEME 69
VI

EXECUTIVE SUMMARY
Successful, sustainable use of natural resources will be crucially dependent on the continuous assessment and monitoring of the status of land resources, how those resources are being used, and the impacts of resource use on future resource availability.
This report outlines the observational requirements for a large range of uses including agriculture, forestry, land degradation, ecosystem goods and services, biodiversity and conservation, human health, water resource management, disasters, energy, urbanization and sustainable human settlement (section 2). Important aspects of land observations, such as those relating to climate change, have appeared in other IGOS-P reports and these are not duplicated in this report.
To satisfy these needs there is considerable overlap in the types of observations needed by different users (section 3) and hence assessment of the needs for enhanced observations is discussed under types of observations (section 4).
Recommendations are limited to observations that are needed at a global scale or observations needed locally that benefit from global-scale observations, that have been articulated by the IGOS Partners, that are spatially explicit disaggregated data products rather than country or sub-country units and where there is a realistic chance of any recommendations being implemented within the next 10 years.
Section 4 shows that significant effort will be needed both to maintain current remote sensing capabilities and to provide many needed enhancements to meet user requirements. Some capabilities in the immediate future will likely be inferior to current ones. Land cover products are recognized as having a central role for all applications. Enhancement of several global socio-economic data sets is urgently needed. Many crucial products remain inadequate because of their reliance on inadequate in situ observations. Improved integration of in situ and remote sensing observations would be of great benefit, notably for agricultural and forestry applications.
A significance of a series of integrative issues, including validation and quality assessment data fusion for analysis and modeling and data assimilation, are highlighted (section 5). The need to improve the delivery of data and information products is highlighted in section 6: one of the most important barriers to overcome is restrictive data policies. The vital needs for capacity building are discussed in section 7. In sections 8 and 9 the relation of the recommendations to other IGOS-P reports and to the burgeoning Global Earth Observing System of Systems are outlined. The latter will be crucial for success in the implementation of IGOL. Many of IGOL’s recommendations are already being tackled by GEO. Finally in chapter 10 a summary of recommendations is provided.
VII

1 INTRODUCTION
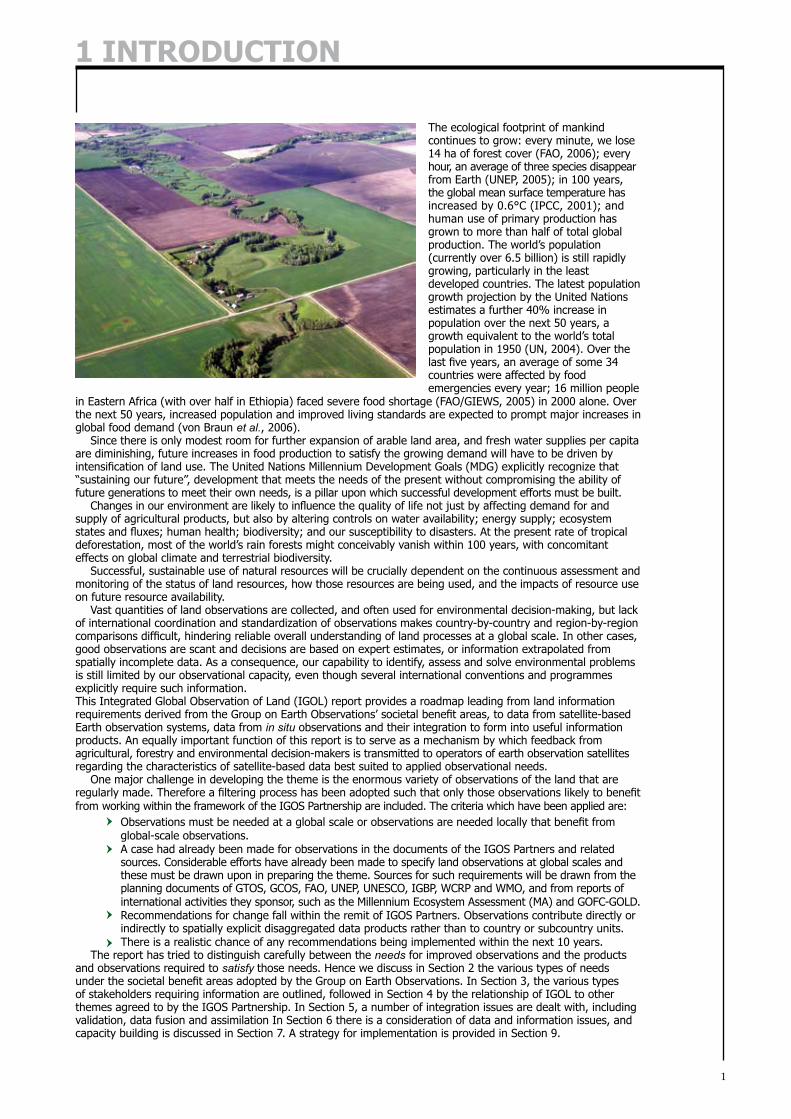
The ecological footprint of mankind continues to grow: every minute, we lose 14 ha of forest cover (FAO, 2006); every hour, an average of three species disappear from Earth (UNEP, 2005); in 100 years, the global mean surface temperature has increased by 0.6°C (IPCC, 2001); and human use of primary production has grown to more than half of total global production. The world’s population (currently over 6.5 billion) is still rapidly growing, particularly in the least developed countries. The latest population growth projection by the United Nations estimates a further 40% increase in population over the next 50 years, a growth equivalent to the world’s total population in 1950 (UN, 2004). Over the last five years, an average of some 34 countries were affected by food emergencies every year; 16 million people
in Eastern Africa (with over half in Ethiopia) faced severe food shortage (FAO/GIEWS, 2005) in 2000 alone. Over the next 50 years, increased population and improved living standards are expected to prompt major increases in global food demand (von Braun et al., 2006).
Since there is only modest room for further expansion of arable land area, and fresh water supplies per capita are diminishing, future increases in food production to satisfy the growing demand will have to be driven by intensification of land use. The United Nations Millennium Development Goals (MDG) explicitly recognize that “sustaining our future”, development that meets the needs of the present without compromising the ability of future generations to meet their own needs, is a pillar upon which successful development efforts must be built.
Changes in our environment are likely to influence the quality of life not just by affecting demand for and supply of agricultural products, but also by altering controls on water availability; energy supply; ecosystem states and fluxes; human health; biodiversity; and our susceptibility to disasters. At the present rate of tropical deforestation, most of the world’s rain forests might conceivably vanish within 100 years, with concomitant effects on global climate and terrestrial biodiversity.
Successful, sustainable use of natural resources will be crucially dependent on the continuous assessment and monitoring of the status of land resources, how those resources are being used, and the impacts of resource use on future resource availability.
Vast quantities of land observations are collected, and often used for environmental decision-making, but lack of international coordination and standardization of observations makes country-by-country and region-by-region comparisons difficult, hindering reliable overall understanding of land processes at a global scale. In other cases, good observations are scant and decisions are based on expert estimates, or information extrapolated from spatially incomplete data. As a consequence, our capability to identify, assess and solve environmental problems is still limited by our observational capacity, even though several international conventions and programmes explicitly require such information. This Integrated Global Observation of Land (IGOL) report provides a roadmap leading from land information requirements derived from the Group on Earth Observations’ societal benefit areas, to data from satellite-based Earth observation systems, data from in situ observations and their integration to form into useful information products. An equally important function of this report is to serve as a mechanism by which feedback from agricultural, forestry and environmental decision-makers is transmitted to operators of earth observation satellites regarding the characteristics of satellite-based data best suited to applied observational needs.
One major challenge in developing the theme is the enormous variety of observations of the land that are regularly made. Therefore a filtering process has been adopted such that only those observations likely to benefit from working within the framework of the IGOS Partnership are included. The criteria which have been applied are:
Observations must be needed at a global scale or observations are needed locally that � benefit from global-scale observations.A case had already been made for observations in the documents of the IGOS Partners and related �sources. Considerable efforts have already been made to specify land observations at global scales and these must be drawn upon in preparing the theme. Sources for such requirements will be drawn from the planning documents of GTOS, GCOS, FAO, UNEP, UNESCO, IGBP, WCRP and WMO, and from reports of international activities they sponsor, such as the Millennium Ecosystem Assessment (MA) and GOFC-GOLD. Recommendations for change fall within the remit of IGOS Partners. Observations contribute directly or �indirectly to spatially explicit disaggregated data products rather than to country or subcountry units. There is a realistic chance of any recommendations being implemented within the next 10 years. �
The report has tried to distinguish carefully between the needs for improved observations and the products and observations required to satisfy those needs. Hence we discuss in Section 2 the various types of needs under the societal benefit areas adopted by the Group on Earth Observations. In Section 3, the various types of stakeholders requiring information are outlined, followed in Section 4 by the relationship of IGOL to other themes agreed to by the IGOS Partnership. In Section 5, a number of integration issues are dealt with, including validation, data fusion and assimilation In Section 6 there is a consideration of data and information issues, and capacity building is discussed in Section 7. A strategy for implementation is provided in Section 9.
1


2 THE NEED FOR IGOL
2.1 AgricultureMatching food production with the needs of an increasing population, while protecting land and water resources, is a growing challenge for agriculture. Sound knowledge of the areas under major agricultural crops at country level is indispensable to support major policy decisions concerning sustainable development planning and food security. Accurate information on the area of land used for different types of agriculture, combined with forecasts concerning yields, helps policy-makers and planners provide farmers in developed and developing nations with the potential for a reasonable standard of living and consumers with secure and safe food supplies at fair prices, whilst protecting our environment by avoiding overexploitation of soil and water resources or avoiding unnecessary conversions of natural ecosystems to agriculture.
Observations are needed in support of four different aspects of agricultural monitoring: the collection of agricultural statistics at the national and sub-national level; the monitoring of major food crops and crop production; the forecasting or early warning of harvest shortfalls, for example due to drought, pests or excessive rain; and for long-term monitoring of changes in the extent and productivity of agricultural lands, and thus their sustainability. For official development aid planning purposes, two additional elements of information are needed: land tenure and ownership maps; and land availability and suitability maps. Long-term monitoring of trends in production and distribution can contribute to questions concerning agricultural sustainability. Information derived from Earth observations can help reduce risk and increase productivity and efficiency at a range of scales from global to the farm unit level. The primary goal of agricultural monitoring systems is to provide information to support decision-making, leading to improved agricultural management and production and food security.
Food security early warning systems, such as the FAO Food Security Global Information and Early Warning System (GIEWS) and the USAID Famine Early Warning System (FEWS), enable early identification of developing countries likely to be affected by large-scale failures of food crops. Monitoring the growing conditions of selected food crops in major crop producing countries facilitates accurate forecasting of agricultural product supplies.
2.2 ForestryIn 1992, the United Nations Conference on Environment and Development (UNCED) focused the world’s attention on the alarming state of environmental degradation caused by growing population pressures and short-sighted development strategies. The UNCED Action Plan, “Agenda 21”, noted that even the basic information on forests, such as the area and type of forests, is not reliable in many countries, and recommended the global periodic assessment of forest resources. These concerns have been further emphasized in the Kyoto Protocol to the United Nations Framework Convention on Climate Change (UNFCCC).
The provision of reliable and timely information on forest cover and its changes by use of remote sensing from Earth observation satellites can support sustainable forest management and policy, and can strengthen environmental protection. Spatially explicit information on forest change helps judge the effectiveness of forest protection and conservation projects, helps determine compliance with negotiated terms of commercial timber concessions (including issues associated with illegal logging and non-timber forest products), will help in the collection of national forest cover statistics for use in national resource planning and management, and provide significant support for national reporting under many chapters of the greenhouse gas (GHG) inventories called for by the UNFCCC (especially those linked to agriculture, grasslands, wetlands and forestry). Such data provides a neutral basis for the verification of carbon trading linked to afforestation, reforestation and, eventually, also avoided-deforestation projects. Enhanced forest observations using satellite remote sensing can aid in early identification of areas with forest cover change, either from natural causes or man-made activities, and can enable more accurate forecasting of the trends of such changes anywhere in the world, regardless of their accessibility or political circumstances.
2.3 Land degradationClimate warming, changing rainfall patterns and agricultural intensification (both agrarian and pastoral) in arid, semi-arid and subhumid dry zones are resulting in deterioration of soil characteristics, depletion of surface water and groundwater resources, reduction of land productivity, loss of biodiversity, soil erosion, food shortages, increased poverty and forced migration of populations in affected areas. Observations of the land can map changes to the boundaries of degrading areas by monitoring changes to the biophysical characteristics of the surface - such as changes in brightness and photosynthetic activity - as well as the location and condition of key resources, such as seasonal waterbodies, pastureland, fuelwood and agricultural land. This information is of immediate value to farmers and range managers attempting to deal with land degradation whilst maintaining crop production and rangeland
3

IgosL A N D
productivity. It is also critical information for governments attempting to implement programmes to combat desertification in their countries or regions. Systematic global land observations concerning land degradation zones, rates and dynamics are clearly needed by the Parties to the United Nations Convention to Combat Desertification (UNCCD) to help them in formulating appropriate policy responses.
2.4 Ecosystem goods and servicesHuman well-being is directly dependent upon ecosystems for provision of food, water, fibre, fuel and other biological products, for regulation of disease and water supply, for pollination and waste treatment, and for enriching human existence through recreation and inspiration. Land observations are critical for the sustainable management of our ecosystems and the services they provide. Knowledge about the location, amount and condition of resource stocks in water surface-storage units and in agricultural, forest and grazing land ecosystems are very important for natural resource decision-making. Observations that enable assessment of the propensity of ecosystems to continue to provide services are at least as important. Fundamental to monitoring changes in ecosystem services are such prime variables such as land cover change, but it is clear that many of the services also require intensive sets of in situ observations at sites and in networks that carry out long-term terrestrial ecosystem monitoring.
2.5 Biodiversity and conservationThe Millennium Ecosystem Assessment (UNEP, 2005) revealed major declines in biodiversity. Protected areas are one of the primary means for preserving biodiversity and natural environments while providing vital services and goods that support peoples’ livelihoods. Such areas have important intrinsic values as representative of the world’s wilderness and as repositories of outstanding areas of living richness (Chape et al., 2003). Much progress has been made in establishing protected areas across the globe, so that they currently cover 12% of the Earth’s surface. Despite the seemingly large proportion of the Earth’s surface designated as protected areas, there are great concerns about the adequacy of existing measures for maintaining these critical ecosystems (Dudley et al., 1999). Some protected areas may just be “paper” parks because they are not suitably demarcated. Others may not be effectively protected due to lack of adequate financial support or legal power (Terborgh and van Schaik, 2002). Among the major threats are poaching, hunting, logging, urbanization, agriculture, mining and road construction (Dugelby and Libby, 1998; Terborgh and van Schaik, 2002). Effective and timely monitoring of changes in the land cover within and along the borders of designated protected areas is thus needed to judge their effectiveness in protecting and conserving the regions as planned. Reliable global land observations tuned to biodiversity indicators will be of considerable value to the Parties to the UN Convention on Biological Diversity (CBD) and the World Heritage Convention (WHC) in helping them develop, implement and reach the Conventions’ goals.
2.6 Human healthHuman health is decidedly influenced by the terrestrial environment through any failure to supply adequate food, shortage of potable water, and by its impact on diseases and their transmission. Disease transmission is often controlled by vectors like rodents and mosquitoes, whose distribution, in turn, is influenced by land variables. Disease vectors are often most common in transition zones between vegetation types, such as between forest and grassland, or within riparian formations, and increased patchiness of the landscape in many cases favours disease-vector pests. Land cover and land use observations are thus important for targeting disease treatments and also for optimizing efforts to eradicate disease vectors.
2.7 Water resource managementThe volume of water in surface-storage units (permanent and ephemeral lakes, reservoirs, rivers and wetlands) is determined by atmospheric (precipitation, evaporation-energy) and hydrologic conditions (surface-water recharge, discharge and groundwater tables) and critically by water use by humans. The availability of fresh water plays a crucial role in food production and food security, and therefore all too often human security, as it is already a documented source of conflict. Water resources control grazing patterns and crop irrigation. Irrigated land covers about 20% of the cropland, but contributes about 40% of total food production (Eliasson et al., 2005). Irrigated agriculture accounts for about 70% of all fresh water consumption worldwide, and more than 80% in developing countries. In many parts of the world, lakes and rivers are key parts of national and transboundary transport and communications infrastructure, as well as providing a key source of food through fishing and aquaculture. In order to obtain improved quantitative and qualitative information on irrigated land and available water resources, data on their spatial distribution and change over time are essential. Information on changes in the level, area and even location of water surface-storage units will be of direct use in both short- and long-term planning; planning not only for agriculture and aquaculture production, but also for security, for human and animal migrations and for long-term climate change adaptation strategies.
4

2 THE NEED FOR IGOL
2.8 DisastersThe need for observations to support the ability to forecast and mitigate disasters has been considered extensively in the reports of the Geohazards, Water Cycle, and Coastal Themes. In addition, the increasing importance of wildland fires is noted, especially those near the urban interface. In addition to up-to-date weather observations, observations of vegetation condition and fuel loading, sediment discharges, stream flow and topography would enhance the ability to forecast and manage wildland fires and their aftermath. Land use, land cover and water use also influence land subsidence and landslide potential. Better information about land use and land cover in relationship to topography could help identify potential disaster areas. Land cover is also a critical factor in determining flood risk within major river systems, and up-to-date information on land cover can play an important part in immediate assessments of relief requirements in the aftermath of major events, such as the 2004 Indian Ocean tsunami.
2.9 EnergyBio-energy from fuelwood, crop residues, biofuel crops, etc., has long been crucial and is increasingly being relied upon as a renewable energy resource. Land observations are necessary for assessment of biofuel production and production expansion, and for environmentally sustainable production of biofuels. Efficient siting and impact assessments for wind-power and hydropower generation also rely upon land observations. Oil and gas exploration and extraction, refining and transport also rely upon accurate information about land cover and use, soils and topography.
2.10 Urbanization: sustainable human settlementThis societal benefit area is not included within the GEO plan but represents a vital area of societal benefit, since urban areas are increasingly where the human population resides: according to UN predictions, by 2030, 60% of the world’s population will live in cities (UNCHS, 2001). Although urban areas occupy only about 3% of the Earth’s surface, their impact on surrounding rural areas is also rapidly increasing. Urbanization not only concentrates people (and therefore concentrates demand for all the social and economic services they require), it also creates hot spots for energy consumption, for natural resource consumption and for emissions of pollutants and greenhouse gases, as well as acting as nodes linking communications and transport infrastructure – themselves all too often a source of pressure on the surrounding environment.
2.11 Climate ChangeClimate determines the distribution of natural vegetation, so changes in vegetation provide a way to monitor climate change. Land cover changes also occur because of changes in land management practices and land use (e.g. agricultural intensification or forest clearance for cropland). Changes in land cover force climate by modifying water and energy exchanges with the atmosphere, and by changing greenhouse gas and aerosol sources and sinks. Global land observations are used in climate, carbon and ecosystem models that provide predictions and scenarios for use by the Parties negotiating development of the UNFCCC, and reporting of observations of land variables have to be made by Parties to this convention in order to document their own overall contribution to changes in the Earth’s atmospheric constituents, including greenhouse gas concentrations. Many of the key terrestrial requirements have already been discussed in the Carbon Theme (Ciais et al., 2006) and in the GCOS plans for Essential Climate Variables (GCOS, 2006), and hence this document will not duplicate discussion of those requirements.
5


3 STAKEHOLDERS FOR GLOBAL LAND OBSERVATION
Stakeholders across the eleven key domains identified in Section 2, where global land observations are needed, can be grouped into six broad categories:
national, regional or local � governments who need the information to assist in the development and implementation of their policies concerning each of the domains who need the infor mation to help them meet mandatory reporting requirements resulting from such policies;
international initiatives helping �countries � develop and fund programmes linked to all eleven �domains, who need the information �for the development of their policies �and operational strategies and to �direct the utilization of their �resources; �
non-governmental organizations � (NGOs), who are either lobbying for particular policy directions or who are directly acting in the various domains; �scientists and research teams, who need the information to improve understanding of the processes and �reduce uncertainties associated with each of the domains;the individual citizen, who should be able to access understandable, reliable information on global environmental �trends, andthe private sector, which requires the information, or generates the information, to help them either �partner or directly service the previous five categories.
3.1 Governmental stakeholdersGovernment, whether at regional, national or local levels, is key to the policy-driven use of global land observations, since governmental departments set the policy agenda. They programme funding cycles to advance these policy agendas and identify and implement specific projects associated with them. They also usually monitor the progress of such projects and often perform some level of post-project evaluation. Land observations play a role at all stages, with the particular nature of the governmental intervention determining the form this takes, e.g. trends that set a particular policy priority; maps of pre-project conditions that help establish base-lines for a project; statistics documenting rates of change during the lifetime of the project; through to reports and environmental profiles, which confirm that the project’s goals have been met. As part of the policy-setting agenda, governments have also generated a second stakeholder role for themselves, namely that of having to generate land observation information as a result of their own policy agendas. For example, almost all countries of the world established and signed the UNFCCC at the Rio Summit in 1992, with the policy objective of reducing global warming and coping with whatever temperature increases are inevitable. As a direct result, these same governments are now obliged to report various items of information related to land observations to the UNFCCC Secretariat. The UNFCCC is only one of many such Multilateral Environmental Agreements generating reporting obligations.
Governments are also a key stakeholder, as it is government-funded agencies (Space Agencies, Environmental Protection Agencies, Hydrology Services and the like) that provide much of the nascent capacity for global land observations - capacity from Earth observing satellites and in situ measurements alike.
3.2 International initiativesKey international stakeholders include organizations that make up the United Nations System. FAO, UNDP, UNEP, UNESCO and WMO, inter alia, facilitate and promote international cooperation in order to promote respect for human rights, protect the environment, fight disease and reduce poverty. Their work involves setting standards for observations, coordinating observing networks, gathering and collating information, and, of course, analysing the results. As well as a source of observations, the UN organizations are a significant user; global land observations, whenever available, are already used to help them develop their policy positions and their operational strategies, especially helping direct the use of investments for development purposes, such as the Global Environment Facility (GEF), UNDP grants and World Bank programmes.
Furthermore, selected UN System organizations, alongside the Intergovernmental Oceanographic Commission and International Council for Science, sponsor the Global Climate Observing Systems (GCOS), Global Ocean Observing System (GOOS) and Global Terrestrial Observing System (GTOS). These three bodies are also important stakeholders as they provide advice on needs, gaps and future developments of observations as required by the UN System, the multilateral environmental agreements (UNFCCC, CBD, etc.) and associated scientific entities, such as the Intergovernmental Panel on Climate Change (IPCC), and key entities such as the World Conservation Union (IUCN).
7

IgosL A N D
3.3 NGOsGlobal NGOs, such as World Resources International, Conservation International, Birdlife International and the Rainforest Foundation, and more localized entities are stakeholders that use global land observations to bring additional voices to the policy table, and who implement many projects and actions on the ground. Policy formulation, project planning, execution and evaluation in the non-governmental world also rely on accurate information.
3.4 ScienceGlobal land observations are vital to improved scientific understanding of key biogeochemical cycles, for further scientific development of climate (and weather) models, and to establish scientifically based “certainties”, such as agreeing on global rates of deforestation, biodiversity loss and rates of desertification. Scientific requirements for terrestrial observations have long been articulated, especially at the international level, by the International Geosphere-Biosphere Programme (IGBP), the International Human Dimensions Programme (IHDP), Diversitas, the World Climate Research Programme (WCRP) and the Global Land Project (GLP) (GLP, 2005). Profound changes are occurring in the strategic direction of global environmental research for the next decade, with more emphasis on issues of societal concern, more emphasis on regional scales, emphasis not only on climate change but also on many other aspects of global change, such as human-induced land cover and land use change, and a scientific focus on coupled human-environmental systems. The scientific community also develops innovative new approaches to the collection and dissemination of global land observations, and thus, as a stakeholder, the scientific community is both a user of global land observations and a vital developer and producer of such observations.
3.5 General publicThe general public has an interest in many aspects of global environmental change and, indeed, political developments reflect this. Although regional (European) in scope, the United Nations Economic Commission for Europe Convention on Access to Information, Public Participation in Decision-making and Access to Justice in Environmental Matters (The Aarhus Convention) codifies the citizen’s participation in environmental issues and provides a legal framework for access to information on the environment held by public authorities. Through these sorts of “access” initiatives the citizen becomes a de facto stakeholder in any global land observing strategy.
3.6 Private sectorThe private sector has an established role in implementing government, NGO and internationally funded environmental monitoring programmes. Its involvement is in everything from satellite manufacture and operation to data collection, processing, analysis, education and training. This firmly estabilishes the private sector as a stakeholder.
3.7 Engagement of stakeholdersEarly involvement of stakeholders and users of land observations is essential for effective development of applications of land observations from space. In particular, end users should define their geo-information requirements, including the types of information, their levels or scales, timeframe, accuracy and the formats of final products. The usual way of engaging the key stakeholders in active participation in the formulation and implementation of satellite remote sensing data applications projects and other related initiatives is through their membership in the advisory boards established for such initiatives. Their involvement in decision-making process will ensure that they understand the benefits to be obtained from the effective application of Earth observation technology to sustainable development and management of land and water resources, and become its early users.
8


4 PRODUCTS AND OBSERVABLES
On the basis of the needs articulated in Section 2 and the requirements of serving the range of stakeholders outlined in Section 3, the following main classes of observations can be recognized:
Land cover, �Land use, �Biophysical properties � relating to ecosystem dynamics, �Biodiversity, �Agriculture, �Forestry, �Soils, �Human settlements and �socio-economic data, �Water availability and use, and �Topography. �
Note that specific needs of terrestrial stakeholders often require multiple
observations so there is no simple one-to-one match between user requirements, the domains identified in Section 2 and sets of observations.
4.1 Land coverLand cover refers to the observed biophysical characteristics of the Earth’s surface. This definition of land cover is fundamental, and land cover should not be confused with land use, as happens in many existing classifications and legends. Land cover is not only important in its own right, but is also vital in the estimation of many other terrestrial characteristics, such as land use, and properties relating to biodiversity, conservation and many other ecosystem services. Land cover information is also important to policy and decision-makers relative to changes in land cover areas and conditions associated with key ecosystem services. In addition, land cover information provides critical information on hydrological and atmospheric drivers associated with biophysical properties related to various land cover types.
4.1.1 Observation needs and technical requirementsThere are numerous local, national and even regional land cover products, though most of these are not regularly updated. At a global scale, there is no true operational programme, though several research groups have created global land cover products. Estimation of land cover change is even less well developed. There is therefore a critical requirement to move from research to operational monitoring capabilities for land cover, with operational data and product suites that are better defined, flexible and openly available. Related implementation requirements include (Townshend and Brady, 2006):
coordinated and consistent land cover data acquisition, both � from satellite and in situ observations;polar orbiters that will provide data on the current extent of various land covers, with known and �reported validation estimates;coordination of various international satellite assets for land cover monitoring at both mid �(similar to Landsat) and moderate resolution (similar to MODIS);a focal point for international inquiries for both raw data and derived products through online data and �information systems;standardized mapping and derivation land mapping products; �harmonization and synergy of existing land cover maps; �rigorous validation of map products using internationally agreed procedures; �improved match between data, data products and user needs, i.e. ensure adequacy and advocacy to �serve international conventions; analysis, understanding and modelling of land change and spatial-temporal change processes, and �a supportive data policy, especially as it relates to costs and copyright. �
Two main classes of products have been identified (Ahern et al., 1999): those with moderate resolutions of 250 m–1 km, and those with mid resolutions from 10 to 50 m, sometimes known as Landsat-class observations. The former set of observations provides data at resolutions at least adequate for most modelling purposes, and they can also be used to flag the location of the most significant areas of land cover change. However, for reliable quantitative monitoring of change, the finer set of resolutions are usually needed. There are situations where even finer resolutions are needed, for example Kyoto-implementation is based on 0.05 ha units, and urban areas require ultra-fine-resolutions of <1 m. However, these are not true global, wall-to-wall, requirements.
11
IgosL A N D
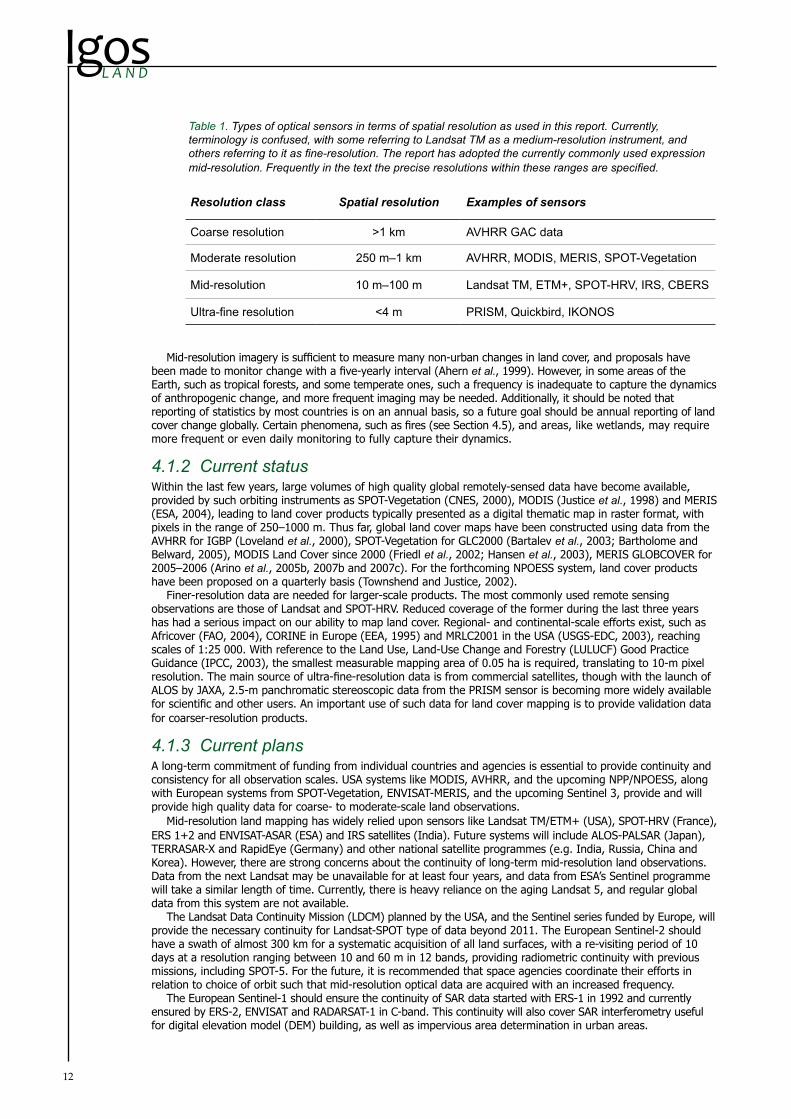
Table 1. Types of optical sensors in terms of spatial resolution as used in this report. Currently, terminology is confused, with some referring to Landsat TM as a medium-resolution instrument, and others referring to it as fine-resolution. The report has adopted the currently commonly used expression mid-resolution. Frequently in the text the precise resolutions within these ranges are specified.
Mid-resolution imagery is sufficient to measure many non-urban changes in land cover, and proposals have been made to monitor change with a five-yearly interval (Ahern et al., 1999). However, in some areas of the Earth, such as tropical forests, and some temperate ones, such a frequency is inadequate to capture the dynamics of anthropogenic change, and more frequent imaging may be needed. Additionally, it should be noted that reporting of statistics by most countries is on an annual basis, so a future goal should be annual reporting of land cover change globally. Certain phenomena, such as fires (see Section 4.5), and areas, like wetlands, may require more frequent or even daily monitoring to fully capture their dynamics.
4.1.2 Current statusWithin the last few years, large volumes of high quality global remotely-sensed data have become available, provided by such orbiting instruments as SPOT-Vegetation (CNES, 2000), MODIS (Justice et al., 1998) and MERIS (ESA, 2004), leading to land cover products typically presented as a digital thematic map in raster format, with pixels in the range of 250–1000 m. Thus far, global land cover maps have been constructed using data from the AVHRR for IGBP (Loveland et al., 2000), SPOT-Vegetation for GLC2000 (Bartalev et al., 2003; Bartholome and Belward, 2005), MODIS Land Cover since 2000 (Friedl et al., 2002; Hansen et al., 2003), MERIS GLOBCOVER for 2005–2006 (Arino et al., 2005b, 2007b and 2007c). For the forthcoming NPOESS system, land cover products have been proposed on a quarterly basis (Townshend and Justice, 2002).
Finer-resolution data are needed for larger-scale products. The most commonly used remote sensing observations are those of Landsat and SPOT-HRV. Reduced coverage of the former during the last three years has had a serious impact on our ability to map land cover. Regional- and continental-scale efforts exist, such as Africover (FAO, 2004), CORINE in Europe (EEA, 1995) and MRLC2001 in the USA (USGS-EDC, 2003), reaching scales of 1:25 000. With reference to the Land Use, Land-Use Change and Forestry (LULUCF) Good Practice Guidance (IPCC, 2003), the smallest measurable mapping area of 0.05 ha is required, translating to 10-m pixel resolution. The main source of ultra-fine-resolution data is from commercial satellites, though with the launch of ALOS by JAXA, 2.5-m panchromatic stereoscopic data from the PRISM sensor is becoming more widely available for scientific and other users. An important use of such data for land cover mapping is to provide validation data for coarser-resolution products.
4.1.3 Current plans A long-term commitment of funding from individual countries and agencies is essential to provide continuity and consistency for all observation scales. USA systems like MODIS, AVHRR, and the upcoming NPP/NPOESS, along with European systems from SPOT-Vegetation, ENVISAT-MERIS, and the upcoming Sentinel 3, provide and will provide high quality data for coarse- to moderate-scale land observations.
Mid-resolution land mapping has widely relied upon sensors like Landsat TM/ETM+ (USA), SPOT-HRV (France), ERS 1+2 and ENVISAT-ASAR (ESA) and IRS satellites (India). Future systems will include ALOS-PALSAR (Japan), TERRASAR-X and RapidEye (Germany) and other national satellite programmes (e.g. India, Russia, China and Korea). However, there are strong concerns about the continuity of long-term mid-resolution land observations. Data from the next Landsat may be unavailable for at least four years, and data from ESA’s Sentinel programme will take a similar length of time. Currently, there is heavy reliance on the aging Landsat 5, and regular global data from this system are not available.
The Landsat Data Continuity Mission (LDCM) planned by the USA, and the Sentinel series funded by Europe, will provide the necessary continuity for Landsat-SPOT type of data beyond 2011. The European Sentinel-2 should have a swath of almost 300 km for a systematic acquisition of all land surfaces, with a re-visiting period of 10 days at a resolution ranging between 10 and 60 m in 12 bands, providing radiometric continuity with previous missions, including SPOT-5. For the future, it is recommended that space agencies coordinate their efforts in relation to choice of orbit such that mid-resolution optical data are acquired with an increased frequency.
The European Sentinel-1 should ensure the continuity of SAR data started with ERS-1 in 1992 and currently ensured by ERS-2, ENVISAT and RADARSAT-1 in C-band. This continuity will also cover SAR interferometry useful for digital elevation model (DEM) building, as well as impervious area determination in urban areas.
Resolution class Spatial resolution Examples of sensors
Coarse resolution >1 km AVHRR GAC data
Moderate resolution 250 m–1 km AVHRR, MODIS, MERIS, SPOT-Vegetation
Mid-resolution 10 m–100 m Landsat TM, ETM+, SPOT-HRV, IRS, CBERS
Ultra-fine resolution <4 m PRISM, Quickbird, IKONOS
12

4 PRODUCTS AND OBSERVABLES
4.1.4 Major gaps and necessary enhancements One of the key issues for many types of observations is in ensuring that acquisition strategies are optimized in time and space. An example is the Long-term Acquisition Plan (LTAP) of Landsat 7 (Arvidson et al., 2001), which ensured for the first time in the 25-year history of this programme that global, seasonal coverage with mid-resolution data were collected. The expected interruption of satellite remote sensing from Landsat ETM and SPOT series data will have adverse effects on the study of land cover dynamics. The main advantage was the combination of 30-m ground resolution with large area image scenes (170x185 km). Most land cover maps at 1:50 000 scale were based on TM/ETM data. It is therefore recommended to minimize the interruption of mid-resolution-type remote sensing coverage. In the medium term, until the new assets described below become available, it is recommended that space agencies coordinate mid-resolution acquisitions so that an approximation to the Long-term Acquisition Plan of Landsat is duplicated.
Radar sensors have particular value for monitoring land cover in areas with very high cloud amounts: a SAR with L-band frequency is particularly suitable for monitoring tropical forests, due to its sensitivity to above ground biomass. One key issue that deserves attention is the coordinated acquisition of data from radar systems and optical systems for the purpose of land cover monitoring. It is clear that, because of high levels of cloud cover, many areas can only be observed very infrequently using optical data. The location of such areas should be used to help define the acquisition strategy for radars so that regular global monitoring of land cover can be achieved.
The main obstacle to interoperability among existing land cover databases has been the lack of an internationally accepted land cover classification system. The Land Cover Classification System - LCCS (Di Gregorio and Jansen, 2000; Di Gregorio, 2005), which has been successfully used by several land cover projects at global, regional and country levels and adopted by the former LUCC project and the current Global Land Project, should be adopted as the classification standard for land cover mapping.
Calibration and validation issues related to fine-scale in situ observations to verify coarser-scale satellite mapping remain a challenge. Greater effort is needed to provide coordinated and more standardized information of in situ observations. International cooperation is needed to make such data accessible and usable in an international context. Strahler et al. (2006) have provided an outline of the procedures needed to validate moderate-resolution land cover products.
4.1.5 Product-specific critical issues The European initiative Global Monitoring for the Environment and Security (GMES), which is the European contribution to GEO, is currently scaling up three services based on institutional requirements that use land cover information at a certain stage of the service. These three ESA projects are GMES Service Element (GSE) Land, GSE Forest Monitoring, and GSE Flood and Fire. These projects have been running since 2003 and are delivering operational services to European users. A fourth GSE project, Global Monitoring for Food and Security (GMFS), focuses initially on African countries. In addition, the European Commission is putting in place the first elements of a GMES Land fast-track service. In the initial phase, this will concentrate on Europe, generating a new version of the CORINE land cover map, which will include a very-high-resolution (1 m) urban layer. This builds on the pre-operational land cover monitoring services implemented by the EC’s GEOLAND project (Evans, 2005).
The following are regarded as the highest product-specific priorities relating to land cover. These formed a key component of the terrestrial section of the GCOS Implementation Plan, which has been endorsed by the Parties to UNFCCC, and has been adopted by GEO as part of the GEOSS implementation plan concerning climate change.
Commit to continuous 10 to 30-m-resolution optical satellite systems with data acquisition � strategies at least equivalent to the Landsat 7 mission for land cover data, as an essential component of an integrated and operational terrestrial observation strategy.Develop an � in situ reference network and apply CEOS-Cal-Val Working Group validation protocols for land cover.Generate annual products documenting global land-cover characteristics at resolutions betwe � en 250 m and 1 km, according to internationally agreed standards and accompanied by statistical descriptions of the maps’ accuracy. Generate maps documenting global land cover at resolutions between 10 m and 30 m at � least every five years, according to internationally agreed standards and accompanied by statistical descriptions of the maps’ accuracy (as noted above, more frequent imaging is required regionally); a longer-term goal should be annual monitoring.Ensure delivery of information to users in an appropriate format. �
4.1.6 Principal recommendationsDevelop acquisition strategies for land cover data that optimize coverage in time and � space.Minimize interruption of � mid-resolution (30-m) data.Ensure future continuity of � mid-resolution multispectral and SAR L-band data.Coordinate radar and optical data acquisition so that radar data can be used for regular, � global monitoring of land cover.Agree upon an internationally accepted land cover classification system. �Coordinate international collection of � in situ data for calibration and validation efforts.
13

IgosL A N D
4.2 Land use, land use change Land use is defined as the arrangements, activities and inputs people undertake within a land cover type to augment, enhance, change or maintain it (GLP, 2005). Land use is distinct from land cover in that specific use characteristics are associated within a land use category, whereas a land cover may be used for a variety of activities or purposes. Characteristics related to the intensity, extent and duration of land use activities provide additional information to distinguish various properties associated with a land use. This information provides an indication of the impact on land surface properties, biophysical and biogeochemical fluxes, and linkages to ecosystem services. Land use characterization is needed for evaluation of land resource productivity (wood production, crop production, etc.), decision-making associated with land management options, and for implementation of policy.
The Global Land Project identifies the key needs for Land Use products (GLP 2005):“There is an urgent need for land use maps, especially at global and regional scales. Currently, most global mapping products are land cover classifications, with land use categories limited to cropland, pasture and urban. Land use information is needed to document the extent and intensity of anthropogenic activities on the land, including cropping systems, irrigation, fertilisation, crop yields and livestock density. Although available at the administrative level, such data are not always compatible between different countries, and are not always in a spatially explicit format suitable for ecosystem modelling. Data harmonisation and gridding are therefore often required.”
4.2.1 Observation needs and technical requirementsLand use is not always readily apparent from visual inspection and can change quickly, so monitoring land use is more challenging than monitoring land cover. Several sources of optical remotely sensed data (mid-resolution broad area coverage, such as those from Landsat, IRS, ResourceSat, CBERS and DMC satellites, and ultra-fine-resolution such as Ikonos, Quickbird, Orbview and Eros) have been used routinely to characterize selected aspects of land use. However, many aspects of land use are not amenable to remote detection. For example, a comprehensive understanding of agricultural land use requires information on management inputs, including the technologies used, the timing of interventions, the products and services generated, the location and spatial extent of different land uses, as well as the socio-economic context. However, multispectral data does allow discrimination between many crop types, and ultra-fine-resolution data allows land use types, such as olive plantations, to be identified.
It is evident from the above requirements that in situ observations are essential to fully characterize agricultural land use. However, in situ surveys are costly. Thus, depending on the particular development issue being tackled, the spatial extent of the area of interest and budgetary constraints, the information from less-costly remotely sensed imagery are used to complement limited in situ observations.
These practical considerations strongly suggest that an emerging area of interest and opportunity for IGOL is the development of cost-effective survey designs involving combinations of remotely sensed and in situ measurements to meet the information requirements of national development issues (including obtaining reliable agricultural land-use statistics) at various scales and covering all types of land use (i.e. integrated land-use surveys).
4.2.2 Current statusComprehensive well validated global land use maps are currently unavailable. Many products purporting to depict land use in fact show land cover. Key land use characteristics have been mapped, such as cropland extent, grazing land in built-up land, and the distribution of major crops extent for the early 1990s by the Center for Sustainability and the Environment at the University of Wisconsin, USA. A digital global map of irrigated areas is available through the University of Kassel, Germany, which was developed with contributions from FAO (AQUASTAT) in raster format with a resolution of 0.5°x0.5° and the percentage of each 0.5°x0.5° cell that was equipped for irrigation in 1995 (George and Nachtergaele, 2002).
At a country level, many countries carry out annual and periodic national agricultural surveys (including decennial agricultural censuses) and FAO, as part of its mandate, collects agricultural data, including land use data, from all countries, though for many developing countries the accuracy can be relatively low.
There is no definitive universally accepted land use classification. The Land Cover Classification System (LCCS) (Di Gregorio, 2005) has been increasingly widely adopted.
Overall very few global databases containing land-use information exist. Currently available maps suffer a number of shortcomings, including a limited number of classes, non-standard definitions, and insufficient information on management aspects. Similarly, comprehensive land use maps with national coverage do not exist for most developing countries.
4.2.3 Current plans Current plans to generate improved global land use maps remain fragmented and there are apparently no funded activities to provide improved global land use products. Within developed countries, land use maps are frequently produced (George and Nachtergaele, 2002). Notable regional efforts for the developing world include Africover (Di Gregorio and Jansen, 2000; Di Gregorio, 2005) providing maps, mainly for East Africa. Plans to carry out similar work in West Africa are underway. However, building consistent or harmonized global data sets by compiling separate national data sets requires prior development of a land use correlation system. International organizations and other entities should support the development and validation of such a system.
14

4 PRODUCTS AND OBSERVABLES
Two other institutes redistribute FAOSTAT national production figures into 5-minute grid cells by using land cover and Global Agro-Ecological Zones (GAEZ) information, which allows associating suitable biophysical conditions for specific crops with crop distribution in each cell. The International Food Policy Research Institute (IFPRI) has produced a beta version that gives for each grid cell the presence of the twenty most important crops. The International Institute for Applied Systems Analysis (IIASA) has produced for each grid “cell” a distribution of seven land use classes: forests, pasture, open water, rainfed cropland, irrigated cropland, barren land and urban land. This database was due to be released before the end of 2007 as part of GAEZ-2007. Further details on agricultural land use monitoring are provided in Section 4.7.2.1.
Spatially explicit information on land use changes related to forests will be gathered for FAO’s next global Forest Resources Assessment, to be completed in 2010. This is planned to involve the establishment of permanent sample plots at each 1° x 1° latitude x longitude intersection, the interpretation of Landsat and other remote sensing imagery for each of these for different points in time (1975, 1990, 2000 & 2005), supplemented by auxiliary information (including local knowledge and information from field sampling) in order to transform the first-step land cover classification into a land use classification. Special emphasis will be placed on land use change processes related to forests.
4.2.4 Major gaps and necessary improvements The extent to which spatially explicit information on land use can be provided remains unclear because of the relatively coarse level of aggregation at which land use can at present be reliably inferred from remotely sensed imagery. The frequency with which land use needs to be monitored in order to assess land use change will vary depending on local conditions. Some designated-use areas (e.g. ‘protected areas’) may change slowly and land use information for such a location need only be updated at relatively long intervals. However, in other jurisdictions, where enforcement is ineffective and protected areas may be subject to ‘unauthorized’ land uses, monitoring of change on a relatively frequent basis would be a necessary pre-requisite for corrective action.
Some small-scale global applications require maps with only broad land use characterization. For example the upper-level classes specified in the IPCC good practice guidelines (‘the basis for the consistent representation of land areas’) include only forest land, cropland, range or pastureland, wetland, settlements and other land (IPCC, 2003). These classes may be reliably inferred from satellite imagery. Information needs may therefore be met using data from existing observation systems, several of which were cited earlier. Potential major constraints, if high spatial detail is required, are the cost and time for image interpretation. In general, such small-scale global maps should be updated every five years, or more frequently in regions of rapid land use change.
As stated earlier, for applications at national to sub-national scales requiring information on land management aspects, both remotely sensed and in situ observations are necessary. For cases where only statistical estimates of the various land uses or of land use changes are needed, these could be met using appropriate sampling strategies. In this regard, high-resolution (<1 m) imagery would be needed to support the in situ operations (field orientation, data collection, planning, etc.). As for global applications, a desirable frequency for repeating observations is five years, except in zones of rapid land use change.
The following are the preliminary steps needed to create a global land use data base: A widely acceptable legend needs to be agreed upon. LCCS provides a useful start, but � efforts need to be directed towards gaining consensus on it from all stakeholders, including the various new burgeoning scientific activities of the GLP and those of the Earth System Science Partnership, including Global Environmental Change and Food Systems (GECAFS) and the Global Carbon Project (GCP). The legend should be relevant to viability of short- and long-term land uses, and also to land potential and sustainability. It is recommended that any legend needs to include a measure of intensity of land use. It should be noted that harmonization of land use classes from diverse sources remains very challenging (Jansen, 2005).Nearly all land on the planet is used in some way, but land use intensity remains low in � many areas. The land surface should therefore first be stratified into areas of low- and high-intensity use, based on published sources, with the use of widely available data sets, such as Landsat. The first would largely include intact forests and other forests subject to low-intensity use, desert areas and ice sheets.Within the areas of high-intensity use, the following readily observable categories should � be mapped using mid-resolution data (probably Landsat, given global coverage of free data): mechanized agriculture; pivot irrigation and other readily observable irrigation types; tropical plantations and areas deforested for agriculture and husbandry; urban areas; and infrastructure (including roads, dams and powerlines).Use ancillary information available at subcountry levels on crop production, livestock � densities and fertilizer use to refine land use discrimination using the spatially explicit information to spatialize the information.Using the above, identify residual areas where land use characterization has not been possible � and develop an approach based on finer-resolution data and in situ knowledge.
4.2.5 Product-specific critical issues Filling gaps in available land-use information and addressing issues of data discontinuity and lack of standardization among existing data are of high priority, especially for regional- or global-scale assessments. Similar land use data are often collected, but for different reasons, making inter-comparison challenging, time consuming, or even impossible. Moving towards broad data collection and uniform collection and processing standards - for both remotely sensed and in situ data, would lower data barriers to broader-scale assessments and improve transparency of documentation and certification for international agreements. In addition, fruitful exchange of land use data requires clear descriptions of methods, implicit assumptions and database limitations.
15
IgosL A N D
4.2.6 Principal recommendationsDevelop a widely accepted land use classification system that is relevant to viability of short- and � long-term land uses and also to land potential and sustainability, and stratified by low and high land use intensity.For intensively used areas, map at 1:500 000 scale mechanized agriculture, pivot irrigation, � tropical plantations, areas deforested and urban areas. Integrate remotely sensed and � in situ information to map crop production, livestock densities and fertilizer use.
4.3 ForestsForest observations include measures of the extent, characteristics and condition of lands with at least 10% tree cover, based on the FAO definition of forests. The main users of remote sensed forest mapping and monitoring products at the global and regional levels are international organizations (both intergovernmental and non-governmental) involved in climate change studies, environmental protection and biodiversity, including United Nations bodies such as the UN Regional Economic and Social Commissions, FAO, UNDP, UNEP, WMO and UNESCO, as well as the World Bank and Regional International Development Banks. Forest observations are the basis for biomass carbon stock assessments for the Kyoto Protocol of the UNFCCC; conservation compliance assessments for CBD; bio-energy production, use and forecasting; and wildland fire susceptibility (see Section 4.5). Enhancing and operationalizing forest observations are essential for several international activities, for facilitating coordinated international forest monitoring and management, and strengthening environmental protection at the global scale (Ahern et al., 1999; Townshend and Brady, 2006).
4.3.1 Observation needs and technical requirementsImportant forest observables include forest location, extent, species composition, production, health and vitality. Equally important are the environmental and socio-economic functions of forests and their legal status. Repeated observations of each of these variables are often required. Global data on forest cover and changes in the extent and characteristics of forest cover, forest type, biomass stocks and forest biophysical characteristics are directly observed or based upon satellite remote sensing. Use of remotely sensed data supported by ground-based observations is the only practicable way to monitor deforestation at the national scale (DeFries et al., 2006) for compliance with international agreements like the UNFCCC. Limited access to mid- to moderate-resolution forest cover information is a key constraint in the development of national-scale forest carbon inventories. Data sources exist with which to determine 1990s-vintage baseline soil C stocks, but such products have not been generated. In many cases, forest data products are derived or modelled by integrating multiple sources of information. Integration of disparate sources of data to generate information on forest health, forest vitality, forest biomass and forest carbon exchange productivity require coordinated data collection and data compatibility. Indicators of forest canopy cover and biomass stocks require development of new and improved allometric relationships with canopy observables.
4.3.2 Current statusAn international collaborative global rainforest and boreal forest mapping project has been based on Japanese JERS-1 SAR remote sensing data. The resulting digital database and image mosaics (at 100 m, 500 m and 1 km resolutions) provide information on forest cover and wetlands in the mid-1990s. The Tropical Ecosystems Environment Observations by Satellites (TREES) project, a joint project of the European Commission and the European Space Agency, produced digital database and maps of tropical forests with three land cover classes: dense forest(>70%), fragmented forest (40–70%) and non-forest. The mapping was based on NOAA-AVHRR-LAC 1-km-image data recorded in the 1990s. The AVHRR data were supplemented by the medium-resolution SAR image data from ERS-1 & 2, and multispectral data from SPOT and Landsat in sample areas.
The GOFC-GOLD project, which was initiated by the Committee on Earth Observation Satellites (CEOS), is implemented in the framework of the Global Terrestrial Observing System (GTOS) (Townshend and Brady, 2006). Its overall objective is to improve the quality and availability of information on forest cover and forest fires, at regional and global scales. The GOFC-GOLD methodology is based on global forest mapping and monitoring by satellite remote sensing with low-resolution data (1 km and 100–250 m) and validation of results in sample areas with medium-resolution data (30–10 m) (Ahern et al., 1999). It includes development of forest cover and forest fires databases at national and regional levels, a meta-database at global level, modelling of trends in forest cover change, and identification of “hot spots” when change exceeds the predicted rate.
4.3.3 Satellite-based observationsThe latest generation of satellite remote sensing systems with improved parameters for land cover mapping and monitoring, including the MODIS remote sensing systems in sensor payloads of Terra and Aqua Earth observation satellites, have greatly enhanced forest mapping and monitoring at global and regional (continental) scales. One of the greatest benefits of remote sensing from Earth observation satellites in forestry is the early identification of areas with forest cover change, due either to natural causes (e.g. burnt areas, insect damage, wind damage) or to man-made activities (e.g. conversion to other land uses, clear-cuts, detection of illegal logging activities, defoliation due to industrial pollution), and forecasting the trends of such changes anywhere in the world, regardless of their accessibility or political circumstances. While the multispectral remote sensing data are the main inputs for forest mapping and monitoring, SAR data are increasingly used for change monitoring in areas
16

4 PRODUCTS AND OBSERVABLES
with frequent cloud cover, such as in humid tropical zones, because they can be recorded by both day and night, in all weather conditions.
The growing range of Earth observation satellites with optical and radar remote sensing systems, improved spatial and spectral resolution of satellite images, and higher frequency of coverage have greatly enhanced the operational use of satellite remote sensing in forest mapping and monitoring. For example, the multispectral, moderate-resolution (250 m–1 km) image data from the TERRA and AQUA MODIS remote sensing systems, which have been available since 2000, are compatible with forest cover mapping at global and regional scales. Radarsat-2 (C-band) and ALOS-PALSAR (L-band), launched in 2006, will be particularly useful for monitoring of tropical forests, where reliable information on forest cover changes is difficult to obtain because of cloud cover.
Satellite multispectral remote sensing systems with moderate (10–30 m) ground resolution are the main source of remote sensing data for forest mapping and monitoring at country level. The likely interruption of coverage with the TM/ETM-type of remote sensing system is a major concern. It has been the main source of mid-resolution data used for forest mapping and provided the best cost-benefit usage.
The usefulness of satellite remote sensing for forest mapping and change monitoring is greatly enhanced if it is based on a multistage concept. Such a concept is similar to that of a statistical sampling design and follows the golden surveying rule: “From general to particular”. Moderate-resolution (250 m–1 km) multispectral remotely sensed data provide synoptic overviews and broad stratification of land cover over large areas. Mid-resolution (10–30 m) multispectral remote sensing data are used for forest cover classification and delineation of forest disturbances (clear cuts, burnt areas, etc.). Very- and ultra-fine-resolution (<10 m) remotely sensed data or field surveys are used for validation of mapping and monitoring results in sample areas.
Light Detection and Ranging (LIDAR) systems capable of mapping vertical distributions of forests could improve estimates of canopy height and biomass.
4.3.4 In situ observationsFAO conducts periodic assessments of the state of the world’s forests, their changes and trends, producing statistics and analyses that give a global synopsis of forest resources. The last such assessment covered the period 2000–2005 (FRA-2005). It was based on harmonized national forest inventories supplemented with information from medium-resolution multispectral remote sensing data in sample areas. The main results are country-level tabular data on forest area (tree cover >10%, forest area >0.5 ha, tree height at maturity >5 m) and change. The next assessment, planned for 2010 (FRA-2010), should be a systematic, global sample of more than 10 000 locations, to be coupled with a remote sensing-based assessment of the spatial distribution of forests.
4.3.5 Major gaps and necessary enhancements As for land cover, an important issue for forest cover is ensuring the continuity of mid-resolution data necessary for generating regional forest cover products. Agreement on forest canopy observations related to various metrics of forest health and degradation would facilitate interoperability of parallel forest degradation assessments, enhancing availability of regional data. Global forest cover products require coordinated acquisition of multispectral scanner data, with L-band SAR data for mapping forest cover in cloudy areas. International initiatives such as GOFC-GOLD should continue to coordinate the identification of forest cover needs of the diverse stakeholders.
Better information about forest canopy structure would advance efforts to document forest health, forest degradation and forest ecosystem function. The use of lasers from aircraft shows considerable potential for these observations. Research into LIDAR and multi-angular optical remote sensing shows promise and should continue to be pursued.
4.3.6 Principal recommendationsMinimize interruption of mid-resolution (30 m) data. �Coordinate radar and optical data acquisition so that radar data can be used for regular, global � monitoring of forest cover.Agree upon an internationally accepted forest canopy classification system. �Support continued research into developing operational forest structural observation � systems.Sustain efforts to compile historical remotely sensed data for regional forest cover change � databases.
4.4 Biophysical properties relating to ecosystem dynamicsDirect observations of the changes in ecosystem characteristics associated with states (i.e. biomass pools) and fluxes (i.e. material exchanges associate with harvest, aerosols, erosion and gaseous emissions) are observed at multiple scales, from in situ to remote sensing observations. These observations are applicable to all ecosystems, from terrestrial to freshwater systems, from human-dominated to natural ecosystems (for instance urban, forest, grassland, savannah, wetland and aquatic ecosystem types). Spatial and temporal characteristics associated with ecosystem pattern and development are also being affected by human activities and climate change, so that fragmentation of ecosystems and changes in the pattern of succession are being altered.
A special class of observations is associated with ecosystem services. These can be derived from integration of a number of observations of ecosystem properties and human activities. These services include provisioning, supporting and regulating services associated with natural and human-dominated systems. For instance, provisioning of food production can be derived from the association of land cover with land use and levels of
17

IgosL A N D
productivity; regulating water quality can be derived from integrating land and water use, intensity of human activities, characteristic of land cover fragmentation and availability of water resources; and supporting of soil fertility can be deduced from intensity of land use, soil physical-chemical properties, nutrient and organic matter management, and stability of landscapes.
4.4.1 Observation needs and technical requirementsKey observations related to the state of ecosystems include:
species composition; �vegetation structure, height and age; �net primary productivity; �net ecosystem productivity; �spatial pattern of ecosystems; �biomass estimates of vegetation, soils and anthropogenic stocks of C and N, and �spatial patterns associated with a mixture of land cover types (landscape pattern, fragmentation, �integrity, coherence, etc.).
In addition, temporal observations provide a way to estimate seasonal dynamics or phenology of ecosystem properties from which productivity can be inferred, disturbance events associated, periodicity of inundation, frequency (e.g. seasonal and inter-annual manipulations) of large-scale human modification of ecosystem structure, and ecosystem recovery and age from disturbance can be characterized.
Many aspects of ecosystem dynamics are not directly observable and need to be estimated by integrating various in situ, survey and remotely sensed information, and observations to derive these products. Data-model fusion is needed to estimate these derived products from remotely sensed data coupled with in situ observations to provide estimates of ecosystem dynamics useful for agricultural needs (e.g. forestry, cropland and rangeland productivity), vegetation recovery and succession, and exchanges of key vertical and lateral fluxes.
4.4.2 Current status4.4.2.1 Remote sensing
The growing range of Earth observation satellites with optical and radar remote sensing systems, improved spatial and spectral resolution of satellite images and higher frequency of coverage have greatly enhanced the operational use of satellite remote sensing for estimating biophysical properties. For example, the multispectral, moderate-resolution (250 m–1 km) image data from the TERRA and AQUA MODIS remote sensing systems, which have been available since 2000, or SPOT-VEGETATION, (A)ATSR or MERIS are increasingly used for estimation of biophysical properties (Running et al., 2004; Plummer et al., 2007). New satellite SAR systems, the ALOS-PALSAR (L-band), launched in January 2006, and Radarsat 2 (C-band), launched in 2007, will be particularly useful for monitoring of tropical forests, where reliable information on forest cover changes is difficult to obtain because of clouds.
Vegetation monitoring data are operationally available on a global scale based on NDVI, Leaf Area Index (LAI) and Fraction of Photosynthetically Active Radiation (FPAR), with ground resolution of 250 m to 1 km (Running et al., 2004; Gobron et al., 2006a). Multispectral remote sensing data are the main inputs for forest and other land system change mapping and monitoring, and SAR data are increasingly used for ecosystem characterization and change monitoring in areas with frequent cloud cover, such as in humid tropical zones, because they can be recorded day-and-night, in all weather conditions.
4.4.2.2 In situ observationsCurrent networks of inventory, biological census and flux data associated with regular collection of repeated sampling (forest or crop census data) and recent continuous point sampling (e.g. FLUXNET) provide enhanced measurements of ecosystem processes related to information important for forest or grazing land management, net primary productivity and net ecosystem productivity, nutrient status, and long-term ecosystem and landscape dynamics (Gobron et al., 2006b). Most countries with significant forest industry have information from which key forest parameters can be estimated, within constraints such as those mentioned above. In practice, more accurate and reliable biomass estimates may be made if the inventory is based on a sample of plots re-measured at regular intervals, rather than re-mapping (usually from aerial photographs) with limited field sampling, particularly if the sampled sites vary between the inventories.
4.4.3 Major gaps and necessary enhancements 4.4.3.1 Remote sensing
The use of moderate-resolution high temporal frequency multispectral sensors such as MODIS and MERIS has shown their ability to estimate several key biophysical properties, but their moderate resolution is too coarse to resolve individual landscape elements, especially in managed ecosystems. To overcome this, the remote sensing of biophysical observations needs enhancements. A remote sensing capability with mid-spatial-resolution data with the spectral properties and temporal resolution of moderate-resolution instruments will ultimately be required for such applications.
Key to documenting forest structure and advancing understanding of the functioning of many ecosystems is information on the vertical arrangement of components of the canopy. Active optical technologies also show considerable potential for this key variable as does the use of lasers from aircraft. Continued development of these
18

4 PRODUCTS AND OBSERVABLES
technologies to allow deployment on a satellite of a canopy lidar is strongly encouraged. Multi-angular optical remote sensing systems, such as MISR, are also showing great potential for extraction of information concerning canopy heterogeneity (Diner et al., 2005). The saturation of radar backscatter alone at higher levels of biomass is a known limitation of these radar technologies. However, advanced SAR technologies, i.e. integration of multi-temporal observations (Kurvonen et al., 1999), interferometric SAR using C-, L- and P-bands (e.g. Santoro et al., 2002; Askne et al., 2003; Wagner et al., 2003) and very high frequency SAR, though limited to airborne sensors (Fransson et al., 2000), have proven further potential for forest biomass mapping up to at least 200 m3/ha (Santoro et al., 2002, 2006).
The full advantage of SAR remote sensing (i.e. cloud-free global coverage) should be ensured through providing appropriate satellite observations. These include the long-term continuity and global availability of existing SAR data records in C- and L-bands, including interferometric capabilities, the establishment of combined short- (X- and C- band) and long-wave (L- and P-band) radar observations in multiple polarizations (including cross-polarized or full-polarized) and in interferometric mode. Such data are of particular importance for forest mapping (structure, height, biomass) and timely agricultural monitoring. There is a strong need for better synergistic use of SAR data products with passive and active optical remote sensing approaches in the context of vegetation monitoring.
4.4.3.2 In situ observationsDevelopment of standards for in situ observations and data exchange and a common data protocol for reporting in situ observations of ecosystem properties and dynamics across a gradient of human-affected ecosystems are needed for regional to global integration and interpolation of inventory data, census data and other socio-economic information. More generally, detailed characterizations of emissions are required, for both anthropogenic sources (e.g. from fossil and bio-fuels) and natural ones for multiple species (e.g. source isotopic or stoichiometric ratios for fuels and for terrestrial ecosystem sites) if these are to be used as additional constraints of inversions. Specific information is required on the timing and location of the emissions, their measurement uncertainties and, where gridded or generalized data are provided, the horizontal resolution and covariances of the uncertainties are needed. More spatially and temporally detailed emission data products should also be prepared based on statistical reports within countries.
Enhanced observations of ecosystem dynamics associated with vegetation and faunal changes are needed from long-term observations. Disturbance events associated with insect and disease outbreaks, storm, droughts and other events causing structural and flux changes need enhanced measurements of ecosystem characteristics.
TEMS, the Terrestrial Ecosystem Monitoring Sites database, is an international directory of sites (named T.Sites) and networks that carry out long-term, terrestrial in situ monitoring and research activities, and is operated by GTOS. The site provides information about sites but provides no direct access to data sets themselves. TEMS has recently completed an agreement with EcoPort RSA aimed at demonstrating the potentiality of a close collaboration between the two systems. EcoPort is a ‘wiki’-like database containing inter-disciplinary information about biodiversity. Individuals can add information, such as pictures, documents, links to the “entity” (record) of interest, and contribute in this way to create knowledge by integrating data in a communal database.
The International Long Term Ecological Research (ILTER) project consists of networks of scientists engaged in long-term, site-based ecological and socio-economic research. Its mission is to improve understanding of global ecosystems and inform solutions to current and future environmental problems. ILTER’s ten-year goals are to:
Foster and promote collaboration and coordination among ecological researchers and research networks �at local, regional and global scales.Improve comparability of long-term ecological data from sites around the world, and facilitate exchange �and preservation of this data.Deliver scientific information to scientists, policy-makers, and the public, and develop ecosystem �management best practices to meet the needs of decision-makers at multiple levels.Facilitate education of the next generation of long-term scientists. �
These laudable goals are not surprisingly taking a substantial time to realize.ILTER was based on the US Long Term Ecological Research Network. Plans are now under way to develop the
National Ecological Observatory Network (NEON), which is a continental-scale research instrument consisting of geographically distributed infrastructure, networked via state-of-the-art communications. It is hoped that funding will support cutting-edge lab and field instrumentation, site-based experimental infrastructure, natural history archive facilities and computational, analytical and modelling capabilities, linked via a computational network.
It is intended that NEON will transform ecological research by enabling studies on major environmental challenges at regional to continental scales. Scientists and engineers will be able to use NEON to conduct real-time ecological studies spanning all levels of biological organization and temporal and geographical scales. Data from standard measurements made using NEON will be publicly available.The high costs of its implementation mean that it is currently an unlikely model to introduce into developing countries.
4.4.3.3 Model improvementGiven the independent nature (not fitted against flux data) and the simplicity of the MODIS-GPP model, its overall performance in predicting Gross Primary Production (GPP) is remarkable under normal conditions (r2
between 0.7 and 0.95) (Running et al., 2004). The assimilated meteorology does not capture all day-to-day variation, but matches the local tower data well on an eight-day scale. However, at certain sites, the meteorological bias influences estimates of GPP significantly. Furthermore, there is potential for considerable improvements in the
19

IgosL A N D
GPP algorithm by better accounting for soil drought effects, by reducing the radiation-use efficiency under high-radiation conditions, and by introducing more geo-biological variability. It has been shown that these parts of the MODIS-GPP algorithm can be re-parameterized using eddy covariance data, so the synergistic use of MODIS and C Flux data will improve the ability of a global terrestrial observation system.
Processes in terrestrial ecosystems exhibit high variability in time and space, and their local to regional impact is of interest for a variety of policy and economic reasons. Furthermore, from the perspective of the global carbon cycle, we are interested in ecosystems’ aggregate impact on the atmosphere. Spatial variability is high enough that measurements alone cannot provide adequate estimates of fluxes (or changes in stocks) over large regions, implying that models must be used in the interpolation of local observations.Yet, without regional “wall-to-wall” observations, such models cannot be convincingly evaluated because of incomplete sampling associated with in situ measurements. Spatial or gridded in situ data sets are therefore needed for several reasons: as input to models, as constraints for model dynamics and parameterizations, and for verification of model results. Issues related to data fusion and data scaling methods need to be dealt with in model calculations so that a transparent methodology is available for review, ease of updating, and assessment of uncertainties or error analysis.
4.4.4 Principal recommendationsGlobal fraction of Absorbed Photosynthetically Active Radiation (fAPAR) products from 1997 onwards have been generated by space agencies and other data providers (ESA, NASA, JRC, etc.). These products are typically available at a spatial resolution of 1–2 km on a daily, weekly or monthly basis. Finer-resolution products, at 250–300 m can be generated but are not available operationally on a global and sustained basis. The latter would offer significant improvements in terms of national or regional-scale reporting on the terrestrial carbon sink, or as one input in the generation of land cover maps. The higher-resolution products are also easier to compare with the point measurements made at reference sites.
Space agencies and data providers should continue to generate gridded fAPAR and LAI. �Available archives of fAPAR and LAI should be reprocessed to generate and deliver global, � coherent and internationally agreed values.Further efforts should also be made to re-analyse the historical archives of NOAA’s AVHRR � instrument, ensuring the long-term consistency of the product with current estimates throughout the entire period. CEOS Working Group on Calibration/Validation should continue to lead international � benchmarking, product intercomparison and validation exercises including fAPAR and LAI. These efforts should take full advantage of existing networks of reference sites for in situ measurements whenever possible.
4.5 FireThe need exists for reliable consistent information on fires, since fire changes the surface cover type and properties, and releases trace gases and particulate matter into the atmosphere, affecting ecosystem functioning and composition, hydrologic processes, atmospheric chemistry, air quality and climate (Ahern et al., 2001). Fire is an important ecosystem disturbance with varying return frequencies, resulting in land cover alteration and change on multiple time scales. Fire is a widely used land management tool in tropical, temperate and boreal regions, and is an indicator of land use change and human activity (Mollicone et al., 2006). Fire is used for clearing and preparing agricultural land, maintaining pastures, hunting and removing crop residues. Fire can also have adverse impacts on human health, livelihoods and economies. Wildfires have become increasingly a significant hazard at the suburban-wildland interface.
Fire observations are needed by land and environmental managers, including those organizations responsible for the management of protected areas; global change researchers; and for national and international assessments. Observations provide information at various stages in the evolution of fire events; for fire early warning of fire-prone conditions, for early fire detection, tactical and strategic fire management, post-fire assessment and monitoring the impacts of fire events and fire management policies.Satellite-derived fire information can be used for improved fire and land management. Near-real-time images of fire occurrence in a variety of formats are available through the MODIS Rapid Response system (Justice et al., 2002). Hotspots derived by A(A)TSR observations since 1995 are posted in near-real-time by ESA and in the World Fire Atlas (Arino, Plummer and Defrenne, 2005a; Arino, Casadio and Plummer, 2007a), to date providing information to more than 1000 registered users (Plummer et al., 2007).
Requirements for fire observations have been developed at the international level by the GOFC-GOLD Fire Implementation Team (URL: gofc-fire.umd.edu). Long-term fire monitoring with consistent data records is needed to study how fire regimes are changing as a function of climate and changing land use and fire policies. One of the primary goals of fire monitoring systems is to provide information to support decision-making, leading to improved fire management, reducing hazards and the negative impacts of fire on the environment. For fire fighting purposes, emphasis must be given to the timeliness of delivery of observations. The CEOS Disaster Management Support Group specified the need for data to be received within 15 minutes of fire detection (Dull and Lee, 2001), a requirement that can only be met by continuous monitoring by an ultra- and very-fine geostationary capability, or by aircraft or unmanned aerial vehicles, in areas where fire has already broken out. This is clearly a goal for developed countries with fire fighting capabilities, but for countries with large tracts of territory where fire management is either not feasible or only targeted at key valuable resources, the delivery requirements are less stringent.
20

4 PRODUCTS AND OBSERVABLES
4.5.1 Observation needs and technical requirements4.5.1.1 Satellite observation needs
Satellite observation needs for fire can be divided into three types: pre-fire early warning; active fire detection; and post-fire monitoring.
Fire early warningFire early warning requires a combination of recent weather data and information on vegetation composition and condition. Weather data are obtained from a combination of satellite observations and data from in situ weather stations, often through data assimilation models. Timely weather information and temporally composited vegetation indices providing information on the condition of vegetation are used to develop fire danger indices. To determine fire danger, information is also needed on the amount of vegetation available for burning (i.e. fuel load). At the crudest level, an average value for fuel load obtained from the literature of sample ground measurements can be assigned to a given land cover type. In a more sophisticated approach, fuel load can be modelled using a dynamic vegetation model, with inputs of vegetation type, rainfall and satellite data. Time-series satellite vegetation indices at 500 m–1 km provide input for both early warning and vegetation modelling. Some models use satellite-estimated fAPAR and LAI products to help calculate above-ground production, which is allocated into fuel components. Improved characterization of fuels is anticipated from structural information obtained from vegetation canopy lidars.
Active fire detectionSatellite data from the middle and shortwave infrared are used to identify burning or active fires from their surrounding conditions (Giglio et al., 2003). Moderate-resolution polar orbiters orbiting twice daily currently provide sub-pixel detection (<1 km) of active fires. Geostationary data with coarse resolutions (>1 km) provide a more frequent half-hourly sampling of the diurnal cycle of fire activity. The channels used for fire detection need to be capable of detecting flaming fires at 750 Kelvin without saturation. Mid-spatial-resolution sensors (<30 m) provide the means for a more complete characterization of fires and the validation of moderate-resolution fire detections. Recent development in active fire detection have included calculation of Fire Radiative Power (FRP), which is related to biomass consumed (Wooster et al., 2005).
Burned areaFollowing fire, the ground surface conditions are changed, vegetation is burned off and charred material and ash often remain. The resultant fire scars can be mapped from space using optical and infrared sensors. In some regions the fire scars persist for a number of years, whereas in others the char is blown away, or the recently burned field is ploughed or perennial grasses sprout within a few days of the burn, making automated mapping of the fire-affected area difficult. For national mapping of burned area or regional fire emissions modelling, maps of monthly burned area, accumulated during the year, are adequate. Such burned area mapping is currently performed using data from the near-IR and SWIR parts of the spectrum at 500 m–1 km. For rapid post-burn assessment of fire impact in ecologically sensitive areas, mid-resolution data (10–30 m) are needed within 48 hours of the fire to assess fire extent, severity and ecosystem and hydrological impact.
National fire statisticsMost developed countries compile annual statistics on fire extent and distribution. The public availability of these data is varied. Traditionally these statistics are derived from field-based reports or aerial surveys. Recently, some countries have utilized satellite methods to acquire fire statistics over large areas, e.g. in Russia and Canada (Lee et al., 2002). There is no standard approach to the compilation of national fire statistics and the results from different countries are variable in their accuracy. National statistics are gathered and redistributed by the Global Fire Monitoring Center, Freiburg, Germany (see www.fire.uni-freiburg.de/). The global ATSR data go back to 1995 and provide a consistent source of night-time fire observations. However, since the diurnal fire cycle is at a minimum at night, this record will very much represent a limited sample of the true fire activity. The U.S. Air Force Defense Meteorological Satellite Program (DMSP) Operational Linescan System (OLS) can also detect fires at night via low light imaging in the visible wavelength region.
There are a number of efforts in Europe to develop global burned-area products. A global burned-area product has been developed from AVHRR 8 km (1981–1999) data by the EC JRC, Ispra, Italy (Carmona-Moreno et al., 2005). The product has significant limitations for scientific use, due to inaccuracies in detection resulting from the aggregation of the GAC data and calibration-consistency issues. Regional 1 km AVHRR burned area data sets have been generated, but not on a systematic basis or with validation. Two global burned area products were developed for the year 2000: the GBA2000 product from SPOT-VEGETATION data (Tansey et al., 2005) and the GLOBSCAR product from ESA ATSR data. Systematic inter-comparison of these products shows major inconsistencies at regional and continental levels (Korontzi et al., 2004; Boschetti, Bocchi and Brivio, 2007). A current effort, as part of the ESA GLOBCARBON project, is developing burned area from a 10-year time series of ATSR and VEGETATION data built on GLOBSCAR and GBA2000. Within ESA’s GLOBCARBON (Plummer et al., 2005) daily observations from VEGETATION, MERIS, ATSR-2 and AATSR data are used to cover a 10-year timeframe from 1998 to 2007. The MODIS burned area product is starting to provide a global multiyear record of monthly burned area. Preliminary validation results show that at least 85% of the total burned area is mapped by the MODIS automated algorithm (Roy et al., 2005a).
21
IgosL A N D
4.5.3 Major gaps and necessary enhancements4.5.3.1 Developing a Global Geostationary Satellite Fire Network
Geostationary data provide the best opportunity for capturing the diurnal cycle of fire activity (Prins et al., 2001). Although geostationary satellites cover most of the World, not all geostationary imagers provide fire information. Geostationary systems with middle infrared sensors are being developed with higher spatial resolutions and thus become increasingly attractive for active fire detection. Through the international GOFC-GOLD programme there is an initiative to coordinate a global network of geostationary satellites, providing active fire detection with a 15-30 minute frequency (Prins et al., 2004.). This initiative requires the support of the operational space agencies and weather services responsible for the geostationary satellite systems.
4.5.3.2 Moderate-resolution fire data continuityFire detection and burned area mapping from the AVHRR operational imager were greatly improved by the MODIS instruments. The experimental MODIS imagers on NASA AQUA and TERRA will be replaced by the NPP VIIRS in 2009, providing the start of a new operational satellite programme, NPOESS. The active fire detection and characterization capability of the VIIRS will be seriously affected by a lower saturation level of the 11-micron band than MODIS and on-board data aggregation, thus affecting product continuity. It is recommended that fire detection is undertaken prior to pixel aggregation and that Fire Radiative Power be included as part of the VIIRS Fire Environmental Data Record. For the future, the US Integrated Program Office needs to raise the saturation level of its middle thermal infrared 11-micron sensor to enable fire detection and characterization without saturation on the next build of the VIIRS instrument.
As discussed above, MODIS, SPOT Vegetation, AATSR and MERIS all provide moderate-resolution data that can be used for burned area mapping. However, a consistent validated, global, long-term record of burned area is still needed. It is critical that products generated from these systems are fully validated to CEOS Land Validation Stage 3. A coordinated international effort is needed for the validation of the global burned area products, using the CEOS Burned Area Validation Protocol established by the CEOS Land Product Validation Working Group. The monthly and near-real-time burned area products generated from the current research instruments need to be transitioned to the operational polar imagers for long-term data provision.
4.5.3.3 Mid-resolution data availability for fire monitoringMid-resolution data are used for post-fire assessment and the validation of moderate-resolution products. A data gap has occurred for mid-resolution data due to the malfunction of the Landsat 7 Scan Line Corrector (SLC).
Landsat was the only system providing systematic global acquisition of mid-resolution data. There are a number of mid-resolution systems in orbit that could be coordinated to provide observations within 48 hours of large or hazardous fire events for current and post-fire assessment. Future mid-resolution imaging systems (<20 m) need to be designed to include active fire observation and characterization (including FRP) capabilities.
4.5.3.4 Improved access to fire data and informationCurrently, there are a number of obstacles to the use of satellite data for fire management. The primary obstacle is the cost and availability of mid-resolution imagery. Near-real-time data of active fires and burnt areas are needed by the fire management community. Web-based Geographical Information Systems (GIS) systems greatly facilitate access to and use of the fire data products and such enhancements in delivery are needed in the current operational data systems to increase access to and use of the satellite fire data. Standardization in the compilation and open access to the reporting of national fire statistics are also needed.
4.5.3.5 Principal recommendationsCoordinate an international network of geostationary imagers providing global active � fire detection every 15 to 30 minutes, and make these data available in near-real-time for fire alert and management. Modify the NPOESS VIIRS sensor for the non-saturated detection and characteriza � tion of active fires. Monthly and near-real-time burned area products should be included in the operational product suite from NPOESS. Reprocess the AVHRR archive held by NOAA and NASA, with correction for known defi � ciencies in sensor calibration, and also for known directional and atmospheric problems. Support a coordinated international effort to validate the current and future global burned � area products to CEOS Land Validation Stage 3. GOFC-GOLD Regional Networks provide an opportunity for expert product validation. Coordinate and target acquisition of data from the international mid-resolution assets � to provide mid-resolution imagery (<20 m) of large and hazardous fire events within 48 hours of the event. The data need to be affordable and easily accessible by the international fire management and research community. Future mid-resolution systems should include the capability for active fire detection.Enhance the access to and utility of fire products, through the use of near-real-time delive � ry systems and Web-based GIS.Implement standardization of national fire data collection and reporting and promote open � access to these data. These data should be spatially explicit and georeferenced.Initiate an international programme on Global Fire Early Warning, integrating satellite and � in situ fire weather data.
22

4 PRODUCTS AND OBSERVABLES
4.6 Biodiversity and conservationThe CBD goal, endorsed at the World Summit on Sustainable Development (WSSD) (UN, 2002), is to significantly reduce the current rate of loss of biological diversity by 2010. Decision VII/30 of the CBD and the Millennium Development Goals (MDG) lays out specific biodiversity indicators and measurements needed to achieve conservation and development targets. The biodiversity data requirements deal primarily with the abundance and richness of wild species of plants and animals, their habitat, and threats to their habitat. The loss of biodiversity has implications that become regional, and in some cases global, in scale. Endemic plants and animals have, by definition, very restricted ranges, while other species may have dispersal and migration patterns that are nearly global. As a result, a global framework for monitoring is essential. The major biodiversity data needs are in situ, but need to be supplemented with remote sensing-based data to monitor changes in the distribution and status of ecosystems (e.g. Achard et al., 2002; Strand et al., 2007).
4.6.1 Observation needs and technical requirementsBiodiversity observations address the GEO societal benefit on conservation and biodiversity. The required data contribute to understanding trends in local to global biodiversity, e.g. changes in ecosystems and species abundance and distribution, and in addressing the fundamental threats to biodiversity, such as land change eroding habitat quality, population pressures on natural habitats, invasive species, trade in threatened plants and animals, and climate change (Balmford et al., 2005).
A special IGOL meeting on biodiversity Earth observation requirements, held in November 2005 in Washington DC, USA (Janetos and Townshend, 2005), resulted in the identification of numerous data sets that are essential for either creating additional biodiversity-specific data sets or for understanding biodiversity status. Several of the specific data sets serve multiple purposes and are identified elsewhere in this report. These include DEM, vegetation structure, land cover change and land cover fragmentation, land use, ecosystem classifications, soils and land degradation. The following sections identify the biodiversity-specific in situ, remote sensing observation and products, and finally modelled data needs.
4.6.1.1 In situ observationsAlthough many important data are still lacking at the global scale in terms of change in extent of habitat types, many of the most challenging biodiversity data needs will require in situ collection strategies (Balmford et al., 2003). These include:
Initiate an international programme on Global Fire Early Warning, integrating satellite and � in situ fire weather data.Trends in species abundance and richness by location � . Longitudinal species databases needed to understand population dynamics as a function of land change or other threats are rare. One of the few examples is the Breeding Bird Surveys conducted in North America and Europe, for which field-based observation of species by location are needed. Locations and distributions of threatened or endangered species. � This is needed in order to understand global priorities for conservation action to protect and manage critical habitats. Publicizing specific locations of threatened or endangered species in some cases should be controlled in order to avoid illegal poaching or destruction.Protected areas extent and conservation status. � A global geospatial database of protected areas with attributes describing the level of protection provided by each conservation holding is maintained and being updated by the UNEP World Conservation Monitoring Centre, and is able to provide information on the level of habitat protection available within ecosystems (www.unep-wcmc.org/). Currently, 12.5 percent of the global terrestrial area is protected at some level, but the specific location and status of habitat of many protected areas is uncertain. However, these efforts are often limited by the availability of data at the national level on protected area distribution and level of protection.Protected areas status. � Regular mid-resolution mapping of human disturbances within protected area boundaries and their buffer zones would allow threats to biodiversity to be identified in those areas set aside for biodiversity conservation. Combining these data with the active fire products outlined above in Section 4.5 would provide a near-real-time indicator of any major pressure on protected areas.
4.6.1.2 Remote sensing data and product needs Data needs
The key role of 30-m optical data was stressed as continuing the thirty-year record largely provided by Landsat, along with more frequent moderate-resolution images (250–500 m). Very-high-resolution (less than 5 meters) cloud-free imagery at low cost is needed for rapid response in key areas. One of the challenges for the conservation community is that in many key regions of the Earth, there is extremely rapid land cover and land use change, whose consequences for biodiversity are often large. The overall structural diversity of the landscape’s dominant vegetation is also extremely important for determining the diversity of animals and plants that depend on it for habitat. Direct measures or proxies for structural diversity would be extraordinarily difficult to derive from most imagery; however, it is well-known that lidars have the potential to make direct measures of structural diversity through the derivation of canopy profiles from their returns. Seasonal monitoring of freshwater distribution and flow is required. A 30-m global topographic data set derived from remote sensing was regarded as of the highest priority.
23
IgosL A N D
Product needsA long-term record of land-cover change and fragmentation at 30-m resolution is needed, along with land use and land use change products at a comparable resolution. Ecosystems and ecological regions data, and ultimately maps, are needed to provide information on trends in ecosystems and land use, and to support a framework and context for assessing broader biodiversity trends. Both mid- and moderate-resolution imagery are needed, together with geospatial information on other environmental variables, such as soils, topography and infrastructure. The data sets and maps must be designed for monitoring trends and overall ecosystem health and sustainability. A first step is to establish international standards and definitions for ecosystems. Teder et al. (2007) have recently contributed to this goal.
Habitat maps prepared from high-resolution images must provide the basic floristic and physiognomic characteristics needed for species distribution models. The data needed include trends in land cover, land use, biophysical conditions, fragmentation and other ecosystem variables. Invasive-species maps showing the loca-tions and spread characteristics of specific invasive species are needed. Ultra-fine-resolution, multispectral and hyper-spectral observations are most suitable.
4.6.1.3 Modelled data needsA suite of measures describing habitat patterns are needed to understand fragmentation, landscape patch size and other metrics that relate to habitat condition. Habitat maps showing the trends described earlier are key inputs to this work.
Trends in species distributions, linked with habitat, are needed to model species ranges, and to evaluate carrying capacities for individual species. This will require a variety of ecosystem-specific models in which habitat maps and species occurrence data are combined to identify trends in species distribution and abundance. A comparison of species distributions and habitat protection status will lead to identification of conservation gaps and the identification of the types of ecological conditions (e.g. habitats) that require additional protection.
The combination of land cover and protected areas maps will permit the identifying of fragmentation and encroachments, using remote sensing for the purpose of assessing the effectiveness of protected areas status in meeting conservation goals. An important part of this is the periodic assessment of the rates of encroachment into protected areas (e.g. Laurance et al., 2002).
4.6.2 Current plansCBD and WHC will continue to be a strong driver for improving biodiversity data sets, and the requirements of the Conventions should be considered when planning biodiversity data developments. Other organizations that have programmes underway that contribute to the biodiversity data needs include:
UNEP’s World Conservation Monitoring Centre is maintaining the World Database on Pro � tected Areas on behalf of the World Commission on Protected Areas, and coordinating the “2010 Biodiversity Indicators Partnership”, delivering the full range of biodiversity indicators associated with the 2010 biodiversity target, in addition to producing a range of ecosystem and species assessment products (www.unep-wcmc.org). The World Conservation Union (IUCN) Species Survival Commission is continuing to moni � tor trends in threatened species (Red List Index) (www.iucn.org/ssc).The Global Biodiversity Information Facility (GBIF) is serving as a catalyst for digitizing � and making available local specimen distribution data (www.gbif.org). DIVERSITAS is developing frameworks for international research, promotes standard � methods, facilitates construction of global databases, and synthesizes and integrates biodiversity activities. Key topical interests of DIVERSITAS include observing, monitoring and assessing biodiversity levels, understanding ecosystem functioning, and developing knowledge that guides policy and decision-making (www.diversitas-international.org).The RAMSAR Convention Secretariat is exploiting outputs from the � GLOBEWETLAND project as input to their technical documentation.
4.6.3 Major gaps and necessary enhancements The current availability of biodiversity information is deficient in both content and characteristics, particularly as regards to consistent measurement of trends (Royal Society, 2003). Regarding specific observation needs, there is an urgent need to use remote sensing to provide information on trends in land cover and habitat types, and mid-resolution imagery to document unauthorized land uses in protected areas. Other needs include:
While global maps of biomes and ecoregions exist, and are helpful in understanding broad � ecosystem characteristics and threats, information on specific plant and animal species is too often limited in time, geographical extent and consistency. It is recommended that the conservation community adopts a consensus ecosystem classification hierarchy and map product.Additional resources are required for maintaining updated information in the World Data � base of Protected Areas.Comparability of existing data collections is often affected by taxonomic inconsisten � cies. Efforts, such as the Integrated Taxonomic Information System (ITIS) established by several North America agencies, are narrowing the taxonomic divide in one part of the globe, and is linking to the international efforts of Species 2000, which aims to document all known species of organisms on Earth as the baseline data set for studies of global biodiversity.
24

4 PRODUCTS AND OBSERVABLES
Biodiversity information too often does not include the essential location coordinates needed � to understand biodiversity in a geospatial context, or that of time-series data, essential for the understanding of trends and the effectiveness of interventions. Georeferenced socio-economic observations are needed to understand causes and conse � quences of biodiversity losses.
4.6.4 Product-specific critical issuesMany national agencies and IUCN, GBIF and DIVERSITAS have species data management and distribution policies that should be consulted.
4.6.5 Principal recommendationsUpdate the world database of protected areas. �Ensure availability and comparability of existing data collections. �Georeference all new socio-economic observations. �Enhance availability of 30 m global topography, which play a critically important role in � both correction of imagery data and in habitat delineation, and as model input data.Ensure delivery of very-high-resolution cloud-free imagery at low cost for rapid respon � se in key areas, with ability to monitor cloudy areas for illegal logging, road-building in sensitive areas, and so forth. Maintain continuity of the long-term seasonal record of land cover change and fragmen � tation at 30 m resolution. A key attribute, or derived characteristic of such a land cover product, would be the derivation of disturbance patterns and frequencies.Develop a long-term record of critical land use characteristics, at a spatial scale that is com � mensurate with the land cover change product, but that includes additional information on the human use of land resources, such as crop type, at sufficient spatial resolution to identify small-scale land-holders (ca. 0.5 ha). Generate seasonal freshwater distribution and flow data products sufficient to detect � irrigation schemes. Improve models for predicting species distributions in existing landscapes and develop � better guidelines for their use by the scientific community and conservation organizations. Organize observational data from � in situ research sites in order to develop a validation database for existing products of relevance to biodiversity issues. Adopt a consensus ecosystem classification hierarchy and map product that describes how � systems are mapped, how to add detail, and how to extend the classification scheme to all ecosystems (including human-dominated systems).
4.7 Agriculture1
A global agricultural observing system would enable the following seven results:mapping and monitoring of changes in agricultural type and distribution; �global monitoring of agricultural production, facilitating reduction of risk and increased productivity at a �range of scales;monitoring of changes in irrigated areas; �accurate and timely national agricultural statistical reporting; �accurate forecasting of shortfalls in crop production and food supply; �effective early warning of famine, enabling timely mobilization of an international respon � se in food aid, andreliable and broadly accepted 5-, 10- and 20-year projections of food demand and supply as � a function of changing demographics, markets, agricultural practices and climate.
The diverse nature of agricultural practices and the need for timely delivery of information for decision-making places some unique requirements on agricultural observing systems. The distribution of field size and rapid changes in crop condition require both a mid-spacial resolution and a frequent revisit time, combined with near-real-time delivery for the satellite observations.
4.7.1 Observation needs and technical requirementsGeneral requirements for mapping agricultural land and monitoring change in extent are described in the land cover and the land use sections. For agriculture, measurements from optical sensors (visible, NIR, SWIR) provide the primary input data to map and characterize crop area, crop type and crop condition. For global-scale mapping and monitoring, products derived from daily, moderate-resolution (ca. 100–500 m) sensors can be used. For regional-scale studies and agricultural areas with small or poorly defined fields, monitoring is undertaken with higher-spatial-resolution (10–30 m) satellite data. Crop type discrimination and mapping is commonly performed using a combination of multispectral and multitemporal analyses. Targeted imaging of local crop conditions can be undertaken using very-fine-spatial-resolution data (1–3 m), currently available from commercial satellites.
Mapping and monitoring of wetland rice, irrigated areas, water impoundments and areas with persistent cloud can benefit from the use of microwave data (Blaes et al., 2005.). Multitemporal, moderate-resolution, tandem SAR data can be used to provide detection of crop emergence and estimation of acreage. Monitoring of
251 This section is a condensed version of the full IGOL report on agriculture (IGOL, 2006).

IgosL A N D
plant water regimes and deficits may be undertaken using SWIR and thermal data (Fensholt and Sandholt, 2003).The determination of soil moisture is being investigated using thermal and microwave data. The monitoring of reservoir heights can be done using radar altimeters and snow amount can be determined using optical, thermal and microwave data to provide information on agricultural water supply in irrigated areas (Cretaux and Birkett, 2006). Flooding of agricultural lands can be monitored using visible, infrared and microwave data. Remotely sensed data from thermal and microwave sensors are also used to estimate rainfall. Monitoring of agricultural residue fires and the occurrence of slash-and-burn agriculture is undertaken with high-saturation sensors in the middle and thermal infrared. Monitoring of crop phenology and condition is undertaken using various vegetation indices, formed from time-series data from multiple channels, requiring good pixel geolocation and band-to-band registration. Anomalies in the vegetation signal associated, for example, with agricultural drought or insect infestations, can be identified using comparative analysis of time-series data from previous growing seasons, which requires a consistent and well calibrated data record (Anyamba et al., 2005).
Remotely sensed data, when combined with mechanistic models, meteorological information and other auxiliary information, enable estimation of crop yield and forecasting of production. Remotely sensed data can also be used to optimize the parameter set and improve the performance of process-based crop models at regional and national scales, using data assimilation techniques. Food insecurity monitoring and famine early warning are undertaken using a combination of satellite, meteorological, in situ and survey data, coupled with socio-economic indicators. Spatially explicit modelling of future scenarios of agricultural demand or production is undertaken at global and regional scales with inputs of climate, economic and demographic projections.
4.7.2 Current status4.7.2.1 Agricultural statistical reporting and in situ observations
In situ and survey data are collected in support of global, regional and national agricultural monitoring systems, providing information on area planted, germination rates, crop type and condition, crop yield, crop residue and fertilizer application. In situ data are also collected for river discharge and reservoir, lake and well levels. Nationally and regionally, socio-economic data are collected routinely on farming practices, market prices, crop production and production for economic purposes. Additionally, a larger suite of data on popula-tion, food supply, health, markets and nutrition are collected locally in support of specific regional famine early warning programmes.
Data in FAOSTAT are aggregated at the country level. Specific global data sets related to land use include those on primary crops, agricultural area, arable and permanent crops, arable land, permanent pasture, forest and fuelwood, non-arable and non-permanent, irrigated areas, agricultural machinery, fertilizers and pesticides, production and agricultural machinery. Subsets of data from FAOSTAT are available at other sites, notably that of the World Resources Institute.
AgroMaps is a global spatial database of agricultural land use statistics aggregated by sub-national administrative districts, which identifies crop yields, extents and production figures for the major crops. However, the AgroMaps database is not comprehensive, but continuous upgrades are undertaken by FAO in partnership with SAGE and IFPRI2. Livestock densities are available globally in a 3 arc minute grid data set (FAO, 2007).
Weather observations, and in particular rainfall data from meteorological stations, play an important role in crop monitoring. In general, in developing countries the network of stations is in decline, and for some agricultural regions additional observations are needed. For some stations, data are still recorded on paper and there is an urgent need for digital archives to be developed for all stations. Alternative approaches of community involvement in making observations and low-cost technologies for increasing the density of rain gauge stations have been demonstrated in India.
4.7.2.2 Satellite-based monitoring systemsForecasting of major food crop production in selected countries worldwide has been operational since the mid-1980s, with the objectives of supporting food security in developing countries and providing information to the global market of agricultural crops. A number of programmes utilize satellite observations for global agricultural monitoring, traditionally relying upon coarse-resolution (8 km) data from the NOAA AVHRR, and more recently on moderate-resolution (250 m–1 km) data, for example from MODIS, SPOT-vegetation and MERIS.
Routinely generated global or regional, temporal (8-, 10- or 16-day) composite data sets of vegetation indices are augmented with higher-resolution (30 m) data on a sampling frame or to monitor representative areas at critical periods in the growing season. Daily near-real-time data at 250 m or targeted mid-resolution (ca. 30 m) data are used to image disaster areas (Justice et al., 2002). Global to regional maps of crop type and change are being generated experimentally from time series of moderate-resolution (250 m) data. Regional and local maps of crop type and change are generated using single or multiple mid-resolution data collected at critical times in the growing season. The comparative paucity of satellite-based microwave sensors has limited the use of these data, but promising results have been demonstrated using ERS 1 & 2, ENVISAT ASAR, and RADARSAT for rice crop acreage and yield estimates. The global monitoring of reservoir height and lake levels is already being undertaken by ESA and NASA/USDA/UMD using radar altimetry.
The utility of spaceborne, hyperspectral imaging is currently being evaluated for crop diagnosis (pest, disease and stress) using data, for example, from EO1 Hyperion (e.g. Datt et al., 2003). Similarly, mid-resolution thermal data, for example from ASTER, are being evaluated for estimation of soil moisture; however, initial findings indicate that the full potential of these capabilities for agricultural monitoring will require high-temporal-resolution data.
26
4 PRODUCTS AND OBSERVABLES
4.7.2.3 Model output Data assimilation techniques are enabling the provision of global precipitation grids from a combination of satellite and ground-based measurements in near real time. In the research domain, radiative transfer models are being coupled with crop growth models to improve the models and fully utilize the physical quantities derived from the satellite data. A number of crop production forecasting models are based on integration of data relevant to assessment of crop conditions, such as remote sensing, climate, rainfall and its frequency during growing season, extent of irrigation schemes, state of land degradation, agronomic inputs, and historical crop yields. These models are for the most part experimental, and require additional research and development for operational use.
4.7.3 Current plans With the planned missions of NPOESS VIIRS, with spatial resolutions at 375 and 750 m, the prospect for the ongoing provision of operational moderate-resolution data over the next decade is ensured from the USA. It should be noted that this falls a little short of the 100–300 m (visible to SWIR) requirement for crop mask and agricultural vegetation monitoring (IGOL, 2006). There is no such plan for the operational transition of the CNES SPOT-Vegetation instrument, which currently is used extensively for agricultural monitoring. However, a number of other moderate-resolution systems are planned by Japan, ISRO, EUMETSAT and ESA. Attention needs to be given to ensuring data product continuity and quality, requiring instrument inter-calibration and product inter-comparison. Data continuity between instruments can be greatly enhanced by a consistent central wavelength and bandwidth for the core Visible–SWIR vegetation monitoring bands.
4.7.4 Major gaps and necessary enhancements For agricultural monitoring, a continuous mid-resolution data record is needed, providing multiple cloud-free observations each year. This is currently the largest gap for agricultural observations. Problems with Landsat 7 have created a critical gap in global mid-resolution observations for the agricultural monitoring community, and a replacement and improvement of the functionality of Landsat 7 for agricultural monitoring is urgently needed. In the short-term, coordinated acquisition from other on-orbit mid-resolution assets such as Landsat 5, IRS, SPOT, ASTER, EO1, AwiFS and CBERS could help fill this data gap. For agricultural purposes, systematic acquisition and near-real-time delivery of mid-resolution data are needed at critical periods in the growing season. In the mid-term (3 to 5 years), a mid-resolution system is needed that will provide 5–10-day cloud-free coverage of all agricultural areas. Such a system is technically feasible and could be facilitated by international cooperation. These should also be equitable, with consistent data and pricing policies: data should be provided in standardized formats, facilitating inter-use. Provision of orthorectified products would facilitate data inter-use. Operational status is urgently needed for mid-resolution systems with planned instrument replacement, to avoid future breaks in coverage.
There are no globally recognized standards for in situ or survey data collection, although Global positioning system (GPS) technology is used increasingly for more precise location. Different groups collect these data using different methods, and benefit would be derived from increased standardization of data collection and increased data sharing. In general, these data are not made accessible outside of the project for which they are collected. In some cases, high-impact, low-cost improvements, such as access to the Internet, would greatly improve data access. In other cases, increased coordination and capacity building for data collection and dissemination are needed.
With respect to the desired improvements to microwave satellite systems, the tandem-like operation of two satellites with C and L band, HH+HV polarization, a 300 km swath and 10–20 m resolution, with a temporal resolution of 10–15 days, would be well suited for crop monitoring. This would allow the use of both intensity and coherence measurements, allowing monitoring of cropping activities.
4.7.4.1 In situ and survey dataIncreased standardization of collection and improved quality and availability of in situ agronomic variables is needed at the sub-national level. An assessment is needed as to where effort is required in this regard, and what initiatives could be taken at the international level. For understanding regional trends in agriculture there is a need for improved, spatially-explicit survey data on agricultural technologies, practices, land use and ownership (e.g. land tenure, collectivization, clan or family ownership, government or corporate land ownership) and processes of transferring land ownership for single or multiple or overlapping purposes and the public appropriation of land.
4.7.5 Product-specific critical issuesContinued provision of vegetation index, crop yield indicators, crop area, crop type, vegetation stress and fire products are needed at moderate resolution (250 m–1 km). A globally reliable crop mask is a high priority. All products intended for operational use should be validated with known accuracies. In particular, methods for crop area estimation should be improved and products validated. A moderate-resolution product detecting change in agricultural area on an annual basis would guide mid-resolution mapping of change in agricultural extent.
There is also a need for increased availability of gridded (5 km) precipitation estimate products (with 30-minute accumulations) from assimilation of satellite and in situ data and associated derived products and indicators relating to crop water balance and drought.
Improvements are needed in the modelling of crop yield, and satellite information on sowing and emergence date is needed to initiate the models. LAI and fAPAR are needed at the crop level for adjusting the models. Once validated and tested, the models should be move from research to operational. Reliable three-month weather forecasts are needed for use in agricultural decision-making.
27

IgosL A N D
The potentially rapid and dramatic changes in crop condition means that agricultural monitoring has specific needs from the observing systems with respect to timeliness of data delivery. Near-real-time data is needed, in addition to summaries on a 5–10-day basis. With the increased access to the Internet, open and rapid access to data is now feasible. A community-wide effort is needed to improve access to the data that are current being collected. The creation of an agricultural data-sharing network is needed to improve the timely dissemination of satellite, in situ, survey data and model outputs. The shared data would conform to agreed data format standards and quality. Attention is required to ensuring partners in the network have access to the Internet.
4.7.6 Principal recommendationsStandardize collection and dissemination of annual national statistical and other � in situ data.Enhance rain gauge data collection networks and lower barriers to timely data access. �Improve seasonal climate prediction accuracy. �Provide mid-resolution (10–20 m), cloud-free coverage with a 5- to 10-day return period. �Ensure continuity of moderate-resolution (1 km; 100–300 m) observations. �Improve targeting and reduce costs of ultra-fine-resolution (1–3 m) imagery. �Improve spatial resolution, targeting and height accuracy of radar altimetry, and operatio � nalize data collection.Provide near-real-time access to regularly collected microwave data (10–30 m) that can be �fused with data from optical systems.
4.8 Soils Soil is a central component of land ecosystems, and one that influences agricultural and forest productivity, ecosystem states and fluxes, biodiversity, water quantity and quality, and human health and settlements. Soils are extremely diverse, and their status, health and potential for sustainable use depends on local terrain, hydrology, vegetation and geology, as well as on current and past land use and management practices. Soil characteristics comprise basic information necessary for making good land use and land management decisions. International environmental conventions, such as the United Nations Convention to Combat Desertification (UNCCD), CBD and the UNFCCC and its Kyoto Protocol all rely upon accurate global soil observations.
4.8.1 Observation needs and technical requirementsSoil type, texture, salinity, erodibility, nutrient and organic matter content and water-holding capacity are the basis upon which decisions about land use and management are made, and from which higher-level soil characteristics, including soil fertility, yield potential, carbon storage potential, water supply, sediment yield, erodibility and agricultural suitability mapping are derived. Since multiple soil observations are crucial inputs to models that simulate crop growth, calculate anticipated yields and water balance, assess the environmental impact of different land use practices and identify major agricultural potentials and constraints, various soil observations for any given map unit must be of the same vintage and available at the same resolution. Obviously, enhanced resolution and accuracy will lead to more accurate assessments, but most primary soil observations are based on field sampling, which is very labour intensive.
4.8.2 Current statusGlobal soil resource information exists at 1:5 million scale in paper map and digital format in the digital FAO/UNESCO Soil Map of the World. This map links to global and regional databases of soil properties, problem soils and fertility capability classifications. The SOTER (SO for Soil, TER for Terrain) programme was initiated to consistently map areas with distinctive landform, morphology, slope, parent material and soil patterns at 1:1 million scale (FAO, 1995). SOTER was originally intended to be worldwide in scope, but has not been fully implemented. The recent release of the moderate-resolution SRTM DEM (with 90-m resolution) has made it possible to generate SOTER terrain units globally and efforts continue to link with soil databases. Georeferenced and quality-controlled soil profile information is limited to about 6000 profiles worldwide, though the quality and quantity of the soil information gathered varies greatly from country to country.
4.8.3 Current plans In 1998, the International Union of Soil Science (IUSS) endorsed a new international soil correlation system: the World Reference Base for Soil Resources (FAO, 1998). It is hoped that development of this unique international soil correlation system, endorsed by all soil scientists, has now solved the problem of geographically inconsistent soil taxonomies, although with current levels of resource allocation it will probably take years for the system to be fully adopted everywhere. The main challenge for developing countries will be the sophisticated analyses (volcanic glass content, total reserve in bases, etc.) required to identify certain diagnostic horizons and properties and to classify the soils accurately.
Under a major update of the Global Agro-Ecological Zone (GAEZ) study (Fischer et al., 2002), FAO
28

4 PRODUCTS AND OBSERVABLES
and IIASA, with other partners, released in 2008 a harmonized World Soil Database to bring together all existing SOTER studies, including the European Soil Database, which includes Northern Eurasia, and the most recent Chinese Soil Map, with the gaps being filled by the FAO/UNESCO Soil Map of the World. Another initiative was launched by Columbia University in December 2006, which, with other partner,s would undertake a similar exercise.
4.8.4 Major gaps and necessary enhancements The status of regional and global soil profile databases is unsatisfactory given the relatively limited quantity of data present. Because of the emphasis on analytical laboratory data rather than morphological descriptors, many soil profile databases fail to reflect soil reality, and are often aimed at a single specific field of application.
The number of “controlled” georeferenced soil profiles in the public domain is extremely limited (1100), and the verified georeferenced soil profiles are inadequate for many soil types. In general, most developing countries have scattered soil surveys, only partly correlated with one another and of variable age and quality. But tracking the coverage and quality of the many ad hoc surveys is not easy. The methods for soil chemical and physical analyses vary worldwide, and results obtained are often difficult to correlate. For instance, most of Eastern Europe, the former USSR and China use analytical methods that differ from those used in other countries, making it difficult to compare characteristics such as soil texture or organic matter content.
A final problem with the soil profile databases is that no accepted standard for the storage of these data exists. Although generally the FAO Guidelines for Soil Profile Description or the USDA Soil Survey Manual are well accepted guidelines internationally, each country has developed local variants (linguistic or otherwise). The soil classification used largely determines the units identified on the map, and this has hampered the development of a universal framework to store soil data.
The following are necessary to fill the above mentioned gaps and to generate improved soil observations:harmonized, small-scale (1:1 million) soil resource information on a global scale; �completion of a global soil and terrain database, and, in particular, information in West � Africa and Southeast Asia is needed; quality-controlled, georeferenced soil profile information collection should be vastly expan � ded, particularly in areas where none or very little of this information has become available (e.g. China and the countries of the Former Soviet Union); analytical and procedural decisions should be the purview of single body (most logically IUSS), with binding �decisions for all organizations involved with soil classification, mapping and soil analytical methods, andinterpretations of soil data need to be improved to become more accessible and intelligible � to non-soil scientists.
4.8.5 Product-specific critical issuesProblems of data access need to be addressed, potentially through international political � agreements such as those that can be arbitrated by the World Trade Organization and which guarantee intellectual property rights.Access to soil information in some areas is increasingly restricted, which hampers research � and is counter-productive to the beneficial applications of this information. The problem is particularly serious in Europe, but is quickly spreading to tropical countries.
4.8.6 Principal recommendationsDevelop a harmonized, small-scale (1:1 million) soil resource and terrain (SOTER) database � on a global scale.Expand quality-controlled, georeferenced soil profile information collection, particularly � in areas where none or very little of this information has become available (especially in China and the Former Soviet Union).Encourage a single body (most logically the IUSS) to develop analytical and procedural � standard methods that are binding for all organizations involved with soil classification, mapping, and analyses.Make interpretations of soil data more accessible and intelligible to non-soil scientists. �
4.9 Human settlements and socio-economic data Human beings tend to cluster in spatially limited habitats occupying less than 5 percent of the world’s land area. Today, more than half of the world’s population lives in urban areas, with the most rapid increases occurring in the developing countries of Asia and Africa. Latin America is already highly urbanized, and in Europe, North America and Japan, 80 percent or more of the population lives in urban areas. Worldwide, the trend is for increasing numbers of people to concentrate in settlements and for the settlements to expand at their perimeters. Sprawl on the urban fringe and exurban development are two of the more conspicuous signs of urban change, but structural change permeates urban areas through continuous processes of intensification of use, decay and development, and aging urban infrastructures are undergoing continuous replacement and change. Thus, urban areas are in a constant state of flux that reflects both growing urban populations and the evolution of urbanizing technologies. Significant populations live outside urban areas, having a dispersed character, which makes estimation of population density difficult.
Settlements and infrastructure are indicative of intensification of resource use, not only in the immediate area but also in the surroundings. Activities associated with settlements and other human infrastructural developments often affect the surrounding air, water, land and biotic resources. These effects have both social and Earth System implications, due to trends in human well-being and to the status of the biophysical, biogeochemical and biodiversity of the areas affected by settlement and associated infrastructure.
29

IgosL A N D
Human settlement can be viewed on a continuum ranging from largely unsettled wilderness areas at one extreme, to dense urban settlement at the other. Although they are relatively unexploited for urban areas, remote sensing approaches are by far the most systematic means for collecting spatial information on human settlements. Not surprisingly, much socio-economic data (such as GDP or birth rates) cannot be directly obtained with remote sensing data, but remote sensing products can be integrated with socio-economic data from other sources. For example, enumeration or survey data for administrative areas such as countries, provinces or municipalities can be integrated with spatial data from remote sensing. In addition, remote sensing data can be used as proxies for socio-economic phenomena (Hay et al., 2005). Thus surveys, censuses and other conventional sources of socio-economic data remain essential in understanding global socio-economic patterns and trends, but they become more useful when combined with remote sensing data.
Global remote sensing of human settlements can significantly improve decision-making in a number of application areas, including:
spatial modelling of population variables such as population and settlement density � (both urban and rural), land use patterns, civil infrastructure, and some types of economic activity (e.g. Toenges-Schuller et al., 2006); improved modelling of the flow of food, water, energy and disease vectors, and their �consequences for natural systems, including ecosystem and planetary metabolism; the location and density of infrastructure for use in hydrologic modelling, flood prediction, � the assessment of land use and land use change, analysing human impacts on biodiversity, and threats to public heath; monitoring, management and mitigation of natural disasters; �urban planning and more effective location decisions and development of support infra � structure, andspatial modelling of atmospheric emissions associated with fossil fuel consumption and � other anthropogenic activities.
There are many other types of socio-economic data that require improvement discussed in the sections on biodiversity, agriculture and water. There are also many other types of observations that are beyond the scope of IGOL at this stage.
4.9.1 Observation needs and technical requirementsThe environmental, management and policy applications described above have a substantial overlap in their remote sensing product requirements. Thus, a suite of product types can be defined that satisfy multiple user communities. Below is a listing of a basic product suite for human settlements. Because of the rapid growth in human settlements worldwide, these key data sets would ideally be updated on a regular and frequent basis to measure rates of change and identify where the most rapid change is taking place. These products include:
depiction of the geographical “footprints” of human settlements of all sizes, including � the outline of the developed areas, specific estimates of constructed area and volume (based on building heights), which should be updated at or near an annual increment to measure growth rates; associated biophysical and biogeochemical properties of these built environments; �location and extent of rural and exurban population patterns; �objective identification of classes of intra-urban land use, such as mixed urban land use or � largely residential, commercial or industrial areas, the distribution of urban vegetation, and open lands within urban areas; vectors for streets, roads and intra-urban transport, and �measures of phenomena that influence economic activity, such as the extent of the energy �infrastructure, including electric power grids, vulnerability to natural disasters such as floods, and threats to public health.
4.9.2 Current statusAn essential requirement for understanding anthropogenic impacts on land is population data. At the global scale, there are two major sources of gridded population data: the Gridded Population of the World (GPW) data set (http://sedac.ciesin.org/gpw/) and Landscan2. Each has certain strengths. GPW, produced at CIESIN, Columbia University, is made up of over 400 000 population observations and provides georeferenced quadrilateral grids at 2.5 arc minute resolution. Data come from 232 countries and input data are updated at regular intervals. In addition to population, the data set provides population density and sub-national administrative boundary maps at country, continental and global levels. Landscan, produced at Oak Ridge National Laboratory, is a modelled database that is constructed of fewer total population observations than GPW, usually at the provincial level. The data are modelled, based on access to roads, land cover characteristics, urban density and night-time lights. Whereas GPW is based on residential population, Landscan attempts to delineate ambient population movements, including diurnal population movement, although this is not calculated by time of day. GPW provides better fine-grained data on population location, while Landscan provides better data on populations at risk.
Infrastructure, including road vectors, can be mapped with ultra-fine-spatial-resolution (~1 m-resolution) satellite imagery. The vertical structure of urban cores can be derived from ultra-fine-spatial-resolution
302 Details at: www.fao.org/landandwater/agll/agromaps/interactive/index.jsp

4 PRODUCTS AND OBSERVABLES
stereo imagery (e.g. the JAXA PRISM). Mid-resolution systems, such as SPOT and Landsat, offer the potential for global data collection on an annual basis. Such data have been used effectively for mapping urban areas and tracking growth in local settings.
Synthetic aperture radar (SAR) systems have substantial capabilities that could be used for global mapping and monitoring of human settlements. However, there are few ongoing programmes to produce regular spatial databases of human settlements from these sources. Examples have been demonstrated by the ESA DUP project URBEX. ESA GMES projects GUS and SAGE consolidated production of urban expansion maps (scales: 1:10 000 to 1:25 000) and soil-sealing maps (scales 1:25 000 to 1:100 000), with updates every 3 to 5 years based on EO data, which are now generated over selected European regions and urban functional areas by ESA GSELand (www.esa.int/esaLP/SEMSQU5DIAE_LPgmes_0.html). NASA’s Shuttle Radar Topography Mission (SRTM) is an example of an archived data source that is known to have substantial potential for derivation of a global map of urban areas. In early 2006, JAXA launched the PALSAR (Phased Array type L-band Synthetic Aperture Radar) capable of collecting useful urban observations.
An alternative approach to global mapping and monitoring of human settlements is through the detection of nocturnal lighting. NOAA’s National Geophysical Data Center has successfully made annual maps of human settlements at 1 km resolution using low light imaging data from the Operational Linescan System (OLS) flown on the U.S. Air Force Defense Meteorological Satellite Program (DMSP). The data have been widely used in applications requiring geographical locations of human settlements and spatial distribution of economic activity at a kilometre scale (Amaral et al., 2005; Ebener et al., 2005; Sutton et al., 2006.) However, its coarse spatial resolution (2.7 km) and a lack of radiometric calibration limit the applications that the DMSP lights can address. Moreover, although light sources provide good proxies for most large urban settlements, the smaller settlements of poor countries are not fully electrified and significant portions of these settlements may lie below the detection threshold of the sensor. In addition, investigators have encountered ambiguities in the interpretation of changes found in the DMSP time series because the system records light in only a single spectral band. These data have been combined with gridded population data at various time periods in CIESIN’s global map of urban settlement extents (CIESIN, 2000).
4.9.3 Current plans The Visible/Infrared Imager/Radiometer Suite (VIIRS) and its day/night band (DNB) planned for the National Polar-orbiting Operational Environmental Satellite System (NPOESS) represents an improved instrument to measure nocturnal lighting. The NPOESS VIIRS instrument will provide low-light imaging data with improved spatial resolution of 742 m, wider dynamic range, higher quantization, on-board calibration and simultaneous observation with a broader suite of bands for improved cloud and fire discrimination over the OLS. While the VIIRS will acquire improved night-time lighting data, it is not optimal for this application. In particular, VIIRS low-light imaging spatial resolution will be too coarse to permit the observation of key night-time lighting features within human settlements, and the spectral band to be used for the low-light imaging is not tailored for night-time lighting.
4.9.4 Major gaps and necessary enhancementsA number of satellite remote sensing systems collect data relevant to the global mapping and monitoring of human settlements. Ongoing international collaboration is needed to produce consistent global maps of human settlements using multiple sources. A multi-stage approach could be adopted to reduce the extent of data collection and processing of data from ultra-fine-spatial-resolution systems. For instance, coarse-resolution night-time lights could be used to define the collection plans for higher-spatial-resolution systems. Key to the value of any effort for global mapping of human settlements is timely product generation and distribution. In general, updates are required on an annual basis, with a distribution latency of a year or less.
Currently, our inability to acquire sufficient ultra-fine-spatial-resolution satellite imagery restricts our capability to fully exploit the data. There is also a need for improvements in the algorithms for automated extraction of required products from ultra-fine-spatial-resolution sources. This includes the need for extraction of the outlines for constructed features (streets and roads, buildings, parking lots, etc.), the extraction of building heights from stereo imagery, and vectors for streets and roads.
Earth observation satellite sensors have traditionally been designed for observation of environmental variables such as clouds, sea surface temperature, vegetation and topography. Much less attention has been given to designing sensors and processing capability for the unique remote sensing observables associated with human settlements. We have identified four major opportunities for improved satellite observations of human settlements.
Development of improved methods for measuring building heights. Stereo-optical imagery � is the standard here, but other sensing methods such as lidar and microwave should be considered. Building height data would improve the modelling of parameters such as population density and modelling atmospheric transport. Modelling the spatial distribution of fossil fuel emissions could be improved through di � rect detection and monitoring of thermal and short-wave infrared (SWIR) emissions from combustion point sources. With hyperspectral data it is in some cases possible to identify the composition of the atmospheric emissions. The capability to detect point sources of hydrocarbon combustion in urban areas has been demonstrated with both night-time Landsat and airborne hyperspectral data. An as yet untapped area with great potential as an indicator of the spatial distribution of � economic activity is the remote sensing of radio and microwave emissions from communication devices, appliances and power lines. The current and planned systems for low-light imaging (DMSP-OLS and VIIRS) have too � coarse a spatial resolution to adequately delineate intra-urban classes and measurement of annual growth increments.
31

IgosL A N D
Colour camera imagery from the International Space Station indicates that it would be possible to design a satellite sensor dedicated to moderate-resolution (30–100 m resolution) detection of night-time lights. If the detection limits were low enough, such a system could detect night-time lights spanning from sparse rural settings to the cores of urban centres.
4.9.5 Principal recommendationsDevise a classification scheme for built environments, settlements and infrastructure � developments.Enhance abilities to use ultra-fine-spatial-resolution data. �Improve methods for measuring building heights. �Model spatial distribution of fossil fuel emission. �Develop the capability to map the distribution and intensity of radio and microwave emis � sion patterns as an indicator of economic activity and income levels. Provide enhanced spatial resolution and multiple spectral bands from low-light imagery. �
4.10 Water availability and useWater data products represent the quantity, quality and extent of water resources. Water products deal with wetlands, lakes, reservoirs, canals, wells, dams, streams, estuaries and groundwater. They are required for a wide range of applications, including agriculture, forestry, municipal and industrial water supply, disaster assessment (e.g. drought and flooding), public health issues including exposure to pollutants and contaminants and the presence and spread of infectious and vector-borne diseases, ecosystem health, and many more.
Water supply and quality observations are both local and regional and require a combination of in situ instrumentation (e.g. stream gauges) and satellite observations. Factors affecting water quality and quantity are often the result of events and practices significant distances from the areas of need. As a result, water variables must be geospatially coupled, often with watershed frameworks. Due to the obvious importance of water availability and use, data collection programmes exist in most parts of the world. There are significant differences in the density and frequency of in situ measurements, which leads to regional deficiencies in data availability. The way forward must consist of both increasing the density and quality of in situ programmes (e.g. stream gauging, chemical and biological sampling, water clarity measures), satellite observations of water use and extent, and use of models for assessments.
4.10.1 Observation needs and technical requirementsMany of the water observations requirements needed to address IGOL topics are identified in the 2003 report of the Global Water Cycle Theme Team report entitled “A Global Water Cycle Theme for the IGOS Partnership” (IGOS, 2004). To meet the water variables needed by IGOL, close cooperation and joint planning with the IGOS Global Water Cycle Theme activities should be pursued.
The following sections outline observation, in situ and modelled product needs that are not included in the water cycle plan. For completeness, those water data needs are identified, as are those observations, in situ variables and modelled data needs specified in other sections of this report, such as DEMs, land cover, land use and soils, that must be available in order to produce a number of the required water products.
4.10.1.1 Observation needs and technical requirementsObservation products relate to water supply (surface and groundwater), water use and water quality. Water supply products describe the extent, quantity and delivery of water. Precipitation, evaporation and evapotranspiration, and snow depth observations are specified as observation priorities in the IGOS Water Cycle report (IGOS, 2004). IGOL interests require spatially-explicit observations; those requirements must be communicated to water cycle data planners. In addition, DEM, land use, land cover and soils data sets described in other sections of this report are needed to produce water availability and use assessments.
IGOL-provided water availability and use observation needs include:S � urface water type, extent, and change: Mid-resolution imagery is needed to categorize and map the extent of wetlands, lakes and streams. Water bodies should be categorized according to ecological and hydrological processes.W � ater infrastructure: Dams, canals and other infrastructure elements must be mapped using a combination of high- and very-high-resolution satellite images.L � ake levels: A lake elevation monitoring system will permit understanding hydrologic variability associated with human use, climate change and other activities, and can be used to estimate water supply. A first step is to determine a sample of lakes that are sensitive to environmental change or are vital for human survival. The Global Climate Observing System’s Global Terrestrial Network on Lakes (GTN-L) has identified the 150 key lakes for climate studies. Radar altimetry measurements are a source of lake elevation data. Although there is no current global data archiving capability established, around 1000 lakes have been monitored by Topex/Poseidon (1992–2006) and Jason-1 (2001–to date). The ESA River and Lakes project provides time-histories of river and lake height measurements worldwide, and, in addition, river and lake heights over Africa are provided in near-real-time at: http://earth.esa.int/riverandlake/.Vegetation index time series � : Global moderate-resolution data are needed to produce weekly to 14-day vegetation index products that can be used to identify vegetation stress and to quantify drought severity.
32

4 PRODUCTS AND OBSERVABLES
A � n irrigated area water use observation product is needed every two years. Because irrigation uses such a large proportion of the available global water supply, frequent global maps derived from moderate-resolution remotely sensed data are needed. Mid-resolution irrigated-area maps are required on at least a decadal basis.Monitoring of the � thermal properties of soils can provide useful input in relation to their energy balance, soil moisture, evapotranspiration and hence irrigation water needs (Anderson et al., 2007).A � sedimentation and deposition observation product is needed to assess the transport of sediments. Mid-resolution remote sensing techniques should be used to map and estimate the quantity of sedimentation into water bodies. Land cover derived from remote sensing is also needed to identify erosion sources.
4.10.1.2 In situ observation needsThe primary in situ products are measurements of water quantity and quality. In both cases, automation in data collection and use of satellite communications can rapidly telemeter measurements to central locations. Many in situ needs, including stream flow rates, stream volume, groundwater capacity and extent, and water quality measures, are specified in the IGOS water report. Additional water data requirements needed by IGOL include:
Water rights data dealing with the use of water is needed to understand the potential � basin-wide availability of water for both economic uses and to ensure provision of water for natural systems.Nutrient contents and eutrophication levels: Levels of nitrogen and phosphorous are needed � to determine eutrophication levels and to identify hazardous conditions that threaten the health of aquatic ecosystems. Water clarity and sedimentation: � In situ measure of Secchi disc depths (the maximum depth from which an observer on a boat is able to see the reflected light of a standard white disc) or equivalent are needed to monitor water quality and sedimentation rates associated with land use practices and natural erosion.
While water clarity and eutrophication measures come mainly from field sources, hyperspectral imaging has the potential to provide equivalent measures in a spatially explicate context, enabling more efficient and timely clarity and eutrophication assessments to be made (Minghelli-Roman et al., 2003).
4.10.1.3 Modelled product needsA series of modelled products is needed, most of which derive from the previous observation and in situ products. The IGOS water report (IGOS, 2004) includes modelled assessments of climate change, water hazards including flooding and drought, and human health. These areas are also very important for IGOL requirements.
A major modelling initiative is the development of watershed-based water-use models that estimate the per-sector demands balanced by the available water supply. The key elements of the catchment-use models should include water demand (i.e. the integration of municipal and industrial water needs, irrigation and other agricultural uses and water needs for natural systems), and data on water availability from all sources. The goal is a global catchment-based database of water sources, surpluses and deficits.
To achieve this, model development dealing with the following topics must be initiated in order to produce the catchment water availability model:
ecosystem plant water requirements, including both terrestrial and aquatic components of ecosystems; �water requirements associated with critical sectors, such as municipal and industrial water, irrigation and �other consumptive uses will be closely linked to land use, andcatchment variables, including catchment delineation and extent, stream networks, stream order and flow �lengths, to be developed from appropriate DEMs; and impacts of climate change on land variables.
Progressive improvements in the mapping of the distribution of irrigated areas has been achieved through cooperative efforts between the Center for Environmental Systems Research, University of Kassel, Germany, with the Land and Water Development Division of FAO: the latest version has a resolution of 5 minutes (9.25 km at the equator).
4.10.2 Current plansA number of initiatives are underway that can contribute to the definition, coordination and development of management of water availability and use products. The following is an incomplete set of potential water product partners:
GEMS Water, compiling data on lakes and rivers water quality. �Global Runoff Data Center, compiling stream gauge data (http://grdc.bafg.de). �UNESCO and the International Hydrological Programme provides multidisciplinary sup � port for addressing regional and national water needs (http://typo38.unesco.org/index.php?id=240). FAO addresses water availability by country; also irrigated area estimates �(www.wca-infonet.org/; www.fao.org/nr/water/aquastat/gis/index.stm).
The World Hydrological Cycle Observing System (WHYCOS) of the World Meteorological Organization (WMO) has a goal to improve the basic in situ observation activities, and strengthen international cooperation and promoting free exchange of data in the field of hydrology. WMO also plays a key role in setting international water-related data collection standards.
4.10.3 Major gaps and necessary enhancementsContinuity of global mid-resolution remote sensing is essential for meeting water availability and use needs. The testing and implementation of hyperspectral imaging to measure water clarity and eutrophication is another improvement. Perhaps the most significant development that must be addressed within the context of the IGOL water availability and use data needs is the establishment of the watershed water use model. This will require integration of data from across IGOL and the IGOS global water cycle initiative.
33

IgosL A N D
The further development of global irrigated lands data will be challenging, but will require a commitment to analyse both high- and moderate-resolution remotely sensed data to document the seasonality and intensity of irrigation. This effort should be coordinated with the IGOL land use and land cover data development activities.
4.10.4 Principal recommendationsEnsure continuity of mid-resolution (10–30 m) remotely sensed data. �Test and implement methods to use hyperspectral imaging to measure water clarity. �Enhance methods to model water use and demand on the watershed scale. �Map irrigated land area using high- and moderate-resolution remotely sensed data. �
4.11 TopographyA vast range of land-related applications need height information, as highlighted in this report and also by other IGOS themes such as Geohazards, Water and Cryosphere3. Topographic information derives from ground or remotely acquired data processed with different procedures, depending on the original acquisition device (tying to existing geodetic networks, correcting for acquisition times and local errors, reconstructing geometric/geophysical properties of the acquisitions, interpolating, etc.). This explains why formats in which topographic information might be expressed can range from height points to contour lines, to TINs, to grids, etc. This section will focus on Digital Elevation Models (DEM), which is the generic term for a representation of heights on a regular grid. Within this category, two subcategories may be identified depending on the type of surface represented: Digital Terrain Model (DTM, a “bare-earth” DEM which refers to the heights of underlying Earth) or Digital Surface Model (DSM, a “top-of-canopy” or “top of buildings” DEM). Availability of information related to both surfaces allows computation of relative heights, and therefore volumes, and is of particular interest to urban applications.
Currently available global topographic data sets have relatively coarse resolutions (90 m to 1 km) and were derived from spaceborne observations (SRTM), from ground observations (GTOPO30) or from a mixture of ground, airborne and satellite observations (GLOBE or ACE, the latter resulting from the combination of spaceborne altimeter data with GTOPO inputs). Finer-resolution data sets already exist, for instance acquired by SRTM (C band at 30-m resolution), but they have not been released worldwide. DEMs derived from the DLR/ASI X-band radar onboard SRTM (30 m resolution) also exist, but they do not uniformly cover the Earth.
4.11.1 Observation needs and technical requirementsMany calls have been made for improved topographic maps of the world, such as the “Global Map” at a scale of 1:1 million proposed by the International Steering Committee for Global Mapping, with an effective resolution of 1 km. Standards dealing with quality and accuracy of topographic data sets already exist (e.g. DTED-2 defined from NIMA (now NGA) has a post spacing of 1 arc second - approximately 30 m), and a global topographic data set with such resolution would be welcomed by the IGOL community. This would in fact provide natural resources managers and decision-makers, modellers and scientists with information well suited to their standard scale of work. In addition, many local topographic data sets might be improved by such global data sets, as has already happened in the past for regional DEMs, when global ACE helped in correcting discrepancies. If this data set can not be released, then other sources for the creation of a 30-m spacing data set, such as the use of ASTER data, should be explored.
It has to be noted, however, that in areas with little topographic variation, such as coastal zones and flood plain areas, there is a need for topographic information with much higher resolution (of the order of 1 m), because of the impact of small topographic variations on the likelihood of flooding.
Besides resolution and accuracy issues, temporal requirements for updates and delivery may vary. “Recent” information is requested from the modelling, planning and management communities (e.g. floodplain management, environmental and microclimate studies), whereas “up-to-date” information, instantaneously delivered, is necessary for disaster and relief management, mapping for humanitarian aid or market-related applications. Products directly derived from topographic data sets are relevant for hydrologic parameters extraction and soil information systems, as well as for geomorphological analysis.
In addition, a key issue for all the land sub-themes is the additional benefit offered by availability of distributed and accurate topographic information. This enables orthorectification of remotely sensed data, hence facilitating geographical intercomparison of various data sets and the creation of products that do not need additional processing for ingestion in GIS or for data fusion.
4.11.2 Current statusCurrent spaceborne sources of information rely on techniques exploiting optical as well as radar sensors. The principal characteristic of all such techniques is that they tend to provide information about the top-of-canopy surface, and additional processing work and data might be needed to derive information about bare-earth heights. The key advantages reside in the repeatability of systematic observations (to generate up-to-date data sets) and the independence of acquisitions from ground conditions (such as political or accessibility issues). Currently flying optical sensors for high-resolution stereo-mapping (posting of less than 10 m) include SPOT5 or IKONOS, which are extremely expensive, and PRISM onboard ALOS, the availability of which may be linked to data policy issues. The key limitation of optical sensors (including also ASTER) derives from cloud cover, which may drastically affect availability of up-to-date information in tropical and subtropical areas. Radar data acquired by ERS, J-ERS1, Radarsat-1, SRTM, Envisat or ALOS, can also provide DEMs, exploiting different techniques. In the case of InSAR, performances depend on geometry constraints, surface conditions or atmospheric artefacts. In addition,
343 See details at: http://ioc.unesco.org/igospartners/docsTHEM.htm

4 PRODUCTS AND OBSERVABLES
C-, and especially L-band, measurements refer to an average surface defined by the first centimetre of ground (or canopy), not to the top surface itself. The global SRTM data at 90 m spacing is available only for 80% of the land surface, its geographical coverage extending from 60° N to 56° S.
At the same time, ground-based observations may provide data for DTM (especially when based on ground surveys, e.g. levelling or GPS) or DSM (when based on airborne data sets such as radar or optical stereo-pairs or Lidar). The main issues in the case of ground-based observations reside in the cost of ground surveys and maintenance of networks, as well as accessibility and weather conditions.
4.11.3 Current plansRadarsat-2, launched in late 2007, will collect very-fine- to mid-resolution C-band SAR data. Spaceborne acquisi-tions of X-band data are available from Terrasar-X, and will be available from the CosmoSkymed satellite constella-tions.
4.11.4 Necessary improvements and major gapsThere is a need to extend the coverage of the existing 90-m SRTM data sets, such as integrating it with other existing data sets (e.g. SPOT-5 or ERS acquisitions in Tandem mode). A major gap then remains is the lack of publicly available medium-scale global data. SRTM data exist at a suitable resolution over 80% of the land areas, but US data policy constraints limit their availability.
For areas of low topography, such as coastal zones and flood plains, there is a need for topographic information with much higher resolution (in the order of 1 m). Local, high quality, standardized topographic information should be made available to facilitate validation efforts for global data sets.
In addition, to facilitate the combination of elevation data from different sources and to incorporate the elevation data into other information and products, a common geodetic reference frame is required. The adoption and implementation of a global datum based on the ITRF (or WGS 84) is probably needed.
One of the important uses of topographic data is to allow the orthorectification of satellite data as was undertaken for the Landsat GeoCover products. For data fusion and activities such as change detection this is extremely beneficial. It is recommended that all medium- and finer-resolution remote sensing data be routinely made available as orthorectified products.
4.11.5 Product-specific critical issuesThe SRTM data base is only openly available for the USA at 30-m horizontal resolution, but exists for all areas for which there is SRTM coverage (58 degrees N and 60 degrees south). It is recommended that these extremely valuable data be made openly available for all areas. If not, other sources (e.g. ASTER) to derive such a data set should be explored.
4.11.6 Principal recommendationsImprove global coverage of 90-m SRTM data sets (possibly by integration with SPOT-5 or ERS �acquisitions in tandem mode).Ensure public availability of the 30-m spacing DEM. �Provide very high-resolution (1 m) topographic information for low and flood-prone areas. �Distribute data using a common geodetic reference frame. �Provide terrestrial remote sensing data in an orthorectified form insofar as possible. �
35


5 INTEGRATION ISSUES
5.1 Validation and Quality Assessment5.1.1 PrinciplesIncreasingly, satellite-derived products are constructed to represent geophysical parameters. As these products are more frequently used in operational and scientific environments, it is important to understand the accuracy with which they represent the particular phenomenon. The accuracy should be determined by comparison with independent data sets with known and higher accuracies. The process by which these comparisons are made is called “validation”. Validation activities are most effective when they involve those with an intimate knowledge of the product’s input data and algorithms. Further, validation results can also lead to algorithm and product improvements. It is therefore more efficient and logical that validation responsibility lies with the data producer.
In this regard, funding for validation should always be included by the agency responsible for generating the product. There are several overarching principles that will help ensure the maximum utility of validation activities.
First, the overall objective should be “user-focused”. The accuracy statements associated with the �product should provide the user with sufficient information to justify using the product and assess the impact on the intended use. Second, transparency and collaboration will promote rigour and integrity. Data used for validation should �be made available so that the results are both reproducible and verifiable. Third, sensors change over time, algorithms are often modified, and user needs evolve. Given these �realities, although an intensive validation activity is needed when the product is first generated, a validation strategy is also needed as a continuing process throughout the life time of the product.Fourth, with the time and effort needed to implement a programme of validation, both producers and �users should anticipate incremental validation results. It is important that validation results are subjected to peer review and are published in the open, and �preferably refereed, literature. It is expected that unvalidated (Beta) products will be distributed for community evaluation while in the process of being validated. Inter-comparison with other products of unknown accuracy as part of the evaluation can provide an early and useful indication of congruency and helps build confidence, but does not constitute validation. True validation can start at just a handful of sites. However, continued work should attempt to further the validation progression by expanding to a more widely distributed set of sites representative of the range of conditions encountered. Ultimately, a rigorous and statistically robust validation requires a statistical sample that represents global conditions and variability.
5.1.2 Current status The CEOS Working group on Calibration and Validation was established in 1984 with an emphasis on instrument calibration. CEOS has defined validation as ‘‘the process of assessing by independent means the quality of the data products derived from the system outputs’’ (Justice et al., 2000). In 1999, with the recognition of the need for international validation coordination, the Land Product Validation (LPV) Working Group was established. Currently the LPV has coordination initiatives underway for land cover, vegetation continuous fields, albedo, fire, LAI and surface temperature (http://lpvs.gsfc.nasa.gov/).
Accuracy assessment of land cover products has been undertaken for the last three decades, providing information on class and overall accuracy, starting with individual or local imagery and progressing to global, multi-temporal products. With the increase in computing capacity, it has become feasible for individual scientists to generate and distribute global products. The availability of the same global products from multiple sources emphasizes the need for validation standards. In this context, harmonization and validation are parallel efforts towards interoperability, product synergy and improved usability of land cover products (Herold et al., 2006a). Understanding comparative map product accuracies is essential to build user confidence for applying a particular product.
Global product validation requires evaluation of accuracy over the range of conditions for which it is provided. In some cases, different agencies or researchers generate the same product from similar or different data sets. Validation of satellite imagery is commonly undertaken using a product of known accuracy, generated at a finer spatial resolution, providing a more precise representation of the land surface. For field-collected data to be used in validation, it is important to consider questions of the scale of measurement. With the costs associated with field data collection and ultra-fine-spatial-resolution imagery, there are advantages to be gained from international cooperation in global and regional validation efforts. However, such collaboration and a distributed approach to validation requires the establishment of standards and validation protocols. The first such cooperation was associated with the land cover product generated under the auspices of IGBP-DIS (Loveland et al., 2000). A stratified random sample was undertaken, and international cooperation provided interpretation of high-resolution global images. Another example is the Global Land Cover 2000 product (Mayaux et al., 2006). The joint experiences have been
37

IgosL A N D
recently compiled into a consensus land cover validation protocol and reporting standards, and a hierarchy for validation (Strahler et al., 2006).
The following validation stages should be recognized for products (Morisette et al., 2002):Stage 1 Validation: product accuracy has been estimated using a small number of independent �measurements obtained from selected locations and time periods. Validation assessed locally under a limited range of geographical conditions for a limited period of time.Stage 2 Validation: product accuracy has been assessed over a widely distributed set of locations and �time periods. Validation assessed over a significant range of geographical conditions and for multiple time periods and seasons.Stage 3 Validation: product accuracy has been assessed and the uncertainties in the product well established �via independent measurements in a systematic and statistically robust way representing global conditions. Validation assessed over the full range of global conditions for all time periods.
GOFC-GOLD has been promoting international cooperation for the validation of global products through its regional networks (e.g. Justice et al., 1999; Roy et al., 2005b; Brady and Naydenov, 2006). Roy et al. (2005a) developed a consensus protocol for the validation of moderate-resolution burnt area products. Community participation in validation has the added advantage of developing a user community closely familiar with the product accuracy.
5.1.3 Major gaps and necessary enhancementsIn the near term, there are a number of activities that will contribute to international cooperation on product validation. The CEOS LPV will continue to help develop, document and promote community protocols and standards for land product validation. GOFC-GOLD and the CEOS LPV team have started to develop a joint land cover harmonization and validation initiative (Herold et al., 2006a). A conceptual system for operational land cover validation has been developed including an establishment and operational phase. The implementation relies on the contribution of a number of key international partners taking responsibility for different components of the system (Herold et al., 2006b). The political framework and the organizations for international cooperation, as well as methodological resources, exist to implement validation as part of operational land cover observations. However, previous efforts have suffered from a lack of funding since resources for validation and harmonization have not been properly allocated during initial project or programme development.
ESA and NASA should continue to cooperate on global land cover, utilizing the GOFC-GOLD regional networks. In the longer term, the CEOS LPV should establish a core set of calibration and validation sites that can be used to assess products from individual sensors as well as the growing time-series from multiple sensors. GOFC-GOLD should continue to maintain communication with user communities to establish how to relay accuracy information, how accurate the products need to be, and how close current and planned efforts are to meeting those needs.
5.1.4 Principal recommendationsAny land product that is being developed in the framework of GEOSS must be validated and the �associated accuracy assessment provided.Validation results and the associated validation data sets should be made openly available and results �should be published in the open literature.Validation activities should continue through the life of the sensor and product. �Results can be developed incrementally, but for critical climate data records, the ultimate goal is to have �validation results across a statistically valid, globally representative sample.The Space Agencies should support the CEOS LPV Working Group in its efforts to realize efficiencies and �establish protocols for coordinated international land product validation.CEOS LPV should engage the user community in its validation activities, and. in particular, validation �should involve the regional networks of scientists such as those participating in GOFC-GOLD, IGBP-START and other networks that may evolve from GEOSS.
5.2 Data fusion for analysis and modelling Data fusion is the process of integrating data from different sources, and often of a different nature, to increase the quality of information over that contained in individual data sources alone (Pohl and van Genderen, 1998). The aim of data fusion is to derive an unambiguous data product that integrates the richness and complexity of disparate data from different sources. It may involve the integration of multiple sensor observations (collected by remote sensing or in situ) or the integration of single sensor observations collected over space or time, for instance to fill in or replace missing data. The challenge of data fusion is to efficiently and effectively integrate those data, which can be of different types, collected from different platforms with different orbital geometry, and having different spectral, temporal and spatial resolutions.
The focus in the framework of this IGOL report is given to multiple-source data integration, which represents a major challenge, given the fact that observations are often captured by different devices, each having its own characteristics in terms of properties measured, temporal frequency and size of the sampled observable. Data fusion frequently requires development of new analytical methods to integrate disparate data and sources of uncertainty, for which detailed, specific analytical methods have already been carefully developed.
5.2.1 Observation requirementsAccurate geospatial data alignment is the foundation for all data fusion activities, therefore orthorectified, systematically produced products are needed. Careful quality control of input and output data, analysis of data product sensitivity to parameters and structure of algorithm, and independent checks on the data product behaviour, including validation against independent data of sufficient spatial and temporal resolution, are essential.
38

5 INTEGRATION ISSUES
5.2.2 Current statusData fusion has been used for improving land cover mapping, land use classification, forest attribute description, assessing urban land expansion and impacts on net primary productivity, describing spatial distribution of soils and soil salinity, soil moisture and soil erosion risk, and monitoring crop yield potential and documenting agricultural practices. For example, combining interferometric SAR data with other remotely sensed data can enhance characterization of forest biophysical variables. Similarly, both visible and radar data can be used to monitor crop condition, but fusing data from both sources collected at different times allows integration of disparate sources of information about crop condition.
5.2.3 Major gaps and necessary enhancementsProgress in data fusion activities is limited by incongruities of potentially compatible data, yet-to-be-developed methods for fusion of particular sources of data, and limited independent data for evaluating derived data sets. Data incompatibility will obviously be a problem for data collected in distinct places or time periods, but can also be a barrier if data cannot be accurately geo-coded, if data are not reliably collected, or if data distribution lags. The key requirement is therefore to produce and release orthorectified products, expressed in a common reference system.
The potential to adjust orbital synchrony (or asynchrony) to enhance the utility of data fusion products should be considered. Development of new data fusion products is contingent upon new research exploring the potential for fusion of new and existing data, and into new data fusion techniques; we strongly recommend supporting this type of research. We also recommend quality assessment and evaluation to document bias and variance, for instance by associating error-bars or quality assessment to each spaceborne-derived product.
5.2.4 Principal recommendationsEnsure that land products are orthorectified and expressed in a common reference system. �Support research into potential for new data fusion products and techniques. �Support efforts to carry out quality assessments of data fusion products. �
5.3 Data assimilation 5.3.1 Model-data synthesisModel-data synthesis is a family of techniques that enables integration of a model of a system with independent observational data about the system - and associated estimates of uncertainty for both - to arrive at the best possible match between model output and observations (Rodell et al., 2004). Model-data synthesis was originally developed to improve numerical weather forecasting by updating model parameters to best match observations. As for weather modelling, integrating model output and land observations, and weighting those data according to their uncertainties, means model-data synthesis for land applications is capable of producing better consistency across data sources, thus enhancing scientific credibility.
Data assimilation is one type of model-data synthesis that enables adjustment to model parameterizations in order to optimize model results to a known state of the system at a particular time and spatial domain. Data assimilation interpolation techniques can take fullest advantage of models to fill gaps in observations, given synoptic observation of a state or flux and the necessary drivers. Data assimilation can be used to integrate synoptic observations and modelling applications, providing insight into land system processes associated with biophysical and human-derived changes. Data assimilation has been extensively used to generate better constrained estimates of carbon fluxes from terrestrial ecosystems by integrating remotely sensed observations with in situ flux data or other ancillary data. For example, regional carbon budgets can be generated using bottom-up ecosystem modelling or top-down atmospheric CO2 concentration data. Data assimilation enables information transfers between these two observation systems to derive the best carbon budget solution. Data assimilation also acts as a framework to better integrate uncertainties and errors associated with either the model or the observation system. Data assimilation techniques are extremely powerful, though computer intensive, due to the optimization routines associated with error reduction. New techniques involving Markov-chain Monte Carlo techniques are being adapted to statistically resolve parameter estimation within a set of observations (Hargreaves and Annan, 2002).
Several different numerical data assimilation techniques have been developed, and results can be used either to adjust model parameters through model recalibration or to invert the model and optimize state variables. Data assimilation has been used to assess crop productivity and condition, for soil moisture monitoring, to estimate land and snow cover distribution, and to describe forest productivity, phenology and biophysical properties (e.g. Liang et al., 2004). The synoptic, repeatable and uniform natures of remotely sensed data make them particularly amenable to integration using model-data assimilation.
5.3.2 Major gaps and necessary enhancementsModel-data synthesis applications for land are relatively new. Most examples of successful model-data synthesis have been carried out on small plots with good sources of independent constraint data. For broader-scale model-data synthesis with land observations, major research challenges remain. The inherent spatial heterogeneity of the land surface alone dictates finer-resolution data to better constrain uncertainty, potentially leading to significant computation and interpretation challenges. The best observations for model-data synthesis are those with small measurement and representation errors. At a minimum, those uncertainties must be accurately characterized for the products to be ingested. Observations coincident with model output, at the same spatial scale and most directly comparable with model output will enable the most robust model-data syntheses.
5.3.3 Principal recommendationsSupport efforts to advance data assimilation methods for a wider range of land observations. �Ensure that calibration and validation efforts generate estimates of observational uncertainty. �Facilitate efforts to coordinate � in situ and remote observations to ensure compatibility between disparate data sources.
39


6 DATA DELIVERY
A grand challenge for land observation systems is to make land observation products and science relevant and accessible to a virtually unlimited potential user community. This must be done in ways that respect the policies of data originators and ensures confidentiality and sensitivity where appropriate. Open and unrestricted access, to the greatest extent possible, should be the ambition of data delivery systems for land observations.
6.1 Data and product accessThe ideal access strategy for land observations involves unrestricted and no-cost access to all data and products: all data providers are urged to establish open-access data policies. For clarification, such a data delivery system uses a comprehensive definition of data and products. These not only include observation, in situ, survey and other geospatial data sets, but also information products, reports, assessments, metadata and other forms of documentation.
Because land characteristics and processes are fundamentally place-based and collectively represent the geographical variability of the Earth, all archived land observation data will require some level of geo-coding in order to be gathered, combined, and used in environmental models. Standards for geo-coding, and implementation of appropriate data integration and analysis capabilities, should be an immediate priority so that the overall system capabilities support the necessary functions. The efforts
of the Open Geospatial Consortium (OGC) should be considered in the establishment of land observation data system geospatial analytical capabilities.
6.1.1 Data access policiesData access is limited by data use restrictions and charging for data. Access to land observation data can be restricted by copyright, privacy or national security or interest issues. For example, the highest quality global digital elevation model data are classified, and access is restricted. Higher-resolution data are necessary for activities like hydrologic modelling and land use planning. Strong encouragement and support should be given to efforts to lower barriers to access either by wholly enabling new access to existing data or developing data access systems that enable retention of some modicum of spatial uncertainty, anonymity or recognition, yet still maintain copyright, privacy or security standards.
Socio-economic and in situ inventory data are often restricted due to confidentiality concerns relating to individual privacy. Biodiversity data are often controlled due to either perceived or real threats to the survival of endangered species. In both cases, data aggregation or synthesis capabilities are necessary to respect the confidentiality of all data with real restrictions.
Data pricing policies create significant barriers for many types of observations and applications. Costs certainly restrict access to data. Like lowering other access barriers, lowering costs would increase use of land observation data. In many cases, costs are limited to those associated with distribution of a copy of the data to a user. Such minimal costs may be appropriate, but can still limit access. In cases where costs are higher, policies that promote access to the widest variety of users are to be preferred. Data users are bound to national data pricing policies, but should negotiate with programmes to make costs as low as possible. Implementation of the recommendations offered by GEOSS to make data as inexpensive as possible or at the marginal cost of reproduction is of high importance. Examples of the right directions for appropriate data cost policies are those of NASA, which makes most of its products freely available to all users, and of ESA, which, since 1999, provides worldwide access to its data for science and applications development at the cost of reproduction.The impact of eliminating charging for products can be seen in the cases of Landsat Geocover and CBERS products. For both products, the elimination of charging has led to more than an order of magnitude increase in downloads by users. It is unreasonable to expect data generators to provide no-cost customization of data sets for the special purposes of single customers. Payment for custom product generation is appropriate in any setting. However, costs associated with post-production processing (like extraction, subsampling, re-formatting, etc.) can be reduced through advancements in visualization software and creation of more refined products. Efforts to improve processing software development and to generate easily manipulated land data products should be supported.
6.1.2 Data documentation policiesSeveral of the challenges to land observation data access arise from the vast number of diverse observations collected at different scales and times. Data collection, authentication, calibration and quality assurance are necessary, but can be time-consuming and can significantly limit or delay access. For satellite remotely sensed data, efforts to generate validated products have greatly enhanced data access. At the same time, many attributes cannot be derived from remote sensing and must be collected in situ. However, in situ data collection is more labour intensive and geographically restricted, and seemingly similar in situ data may be collected for different
41
IgosL A N D
purposes in different places, may be aspatial, and are likely to be less uniform in space and time. Production of consistent, compreensive, validated data products from in situ data is a challenge and is probably a strong limitation to data accessibility and utility, potentially precluding some applications. Documentation and metadata are the necessary foundations upon which methods and software to integrate disparate data can be built. Efforts should be supported to assemble data from different sources, develop sound metadata, catalogue using these metadata, and collaboratively develop interoperable data products. We strongly support efforts to standardize, complete and clarify metadata documentation of all processing steps and associated estimates of uncertainty, which will enable broad, accurate and efficient use of land observations.
The growing need to address environmental and societal concerns demonstrates the need to minimize barriers to land observation data access and use. It is clear that lowering access barriers, including costs, will encourage collaboration and exchange, advancing development of data processing and enhancing data utility; thus we recommend that costs be kept to a minimum and access be open to all users.
6.1.3 Principal recommendationsEncourage lowering barriers to access, either by wholly enabling new access to existing data or by � developing data access systems that enable access while maintaining privacy and security standards.Encourage implementation of GEOSS recommendations to make data available at the � marginal cost of reproduction.Support research to develop methods and software to lower the cost of post-processing data � customization.
6.2 Data and information delivery systemsThe capabilities of land observation data delivery systems depend both on technology-based capabilities and programmatic functions, and the policies governing their operation. Paramount are data-sharing policies - the fundamental motivations of the delivery system. Delivery systems must provide support and incentives to generators of observations so that they are more forthcoming in their willingness to share their data.
The technology-based elements of land observation information systems should start with the formal identification and development of key nodes that make up a distributed land observation data and information system. This system must allow the community of users to catalogue, search, analyse and retrieve the data and information components critical to achieving their needs. A practical implementation strategy should consist of identifying the key data and information system functions and the centres that currently have capabilities and capacities that can substantively contribute to land observations.
An optimal land observation data delivery system will consist of a multilevel network of global and national data sets, Earth observation data, interpreted products, in situ data, survey data, a wide collection of information products related to societal relevant problems, and all supporting documentation that makes all of the data sets meaningful. This will require a distributed network of information systems that ensures rapid and open access to all holdings. Especially important is the establishment of a land observation data delivery system that reaches out to all types of users, with the kinds of data through to results that are needed to solve a problem.
An optimal system should consist of two levels, connected by clearinghouse capabilities. Level I will be a relatively small number of observation data providers. These organizations, largely consisting of space agencies, will provide access to processed satellite images (e.g. orthorectified imagery), and robust distribution capabilities. Level II consists of a specialized network of thematic data producers and investigative centres that provide everything from in situ and survey data to final products and information. Both levels and the distributed centres of each level must be connected via a clearinghouse capability that permits searching for products and other forms of results.
This system must include the ability to provide access to a wide range of disparate data types, including Earth observation data, other geospatial maps and statistics, and in situ data. It will also be necessary to provide the functionality needed for assessing and accessing data integrity, and also to provide functionality for distributed data analysis and integrity. Finally, long-term data archiving centres and data management protocols must be established that ensure that land observation data and information products can be used, re-used and stored as long-term records of the condition of the planet’s landscape.
Data dissemination capabilities should be transparent and embrace efforts underway by other organizations. For example, the CEOS Working Group on Information Systems and Services (WGISS) efforts to establish global network services should be shared with other data centres such as the GCOS global data centres, including the World Glacier Monitoring Service, the National Snow and Ice Data Center, and the Global Run-Off Data Centre.
6.2.1 Provide access to dataImprovements in data access are crucial if the full utilization of Earth observations and other required data are to be achieved. This means there have to be integrated systems across agencies for data query, data browsing, data ordering and data delivery. Data and information holdings exist in various forms and in many places, each with varying levels of capabilities. Connecting users to data is going to require a combination of technical and programmatic advancements. The technical issues that must be immediately addressed relate to Internet connectivity, data exchange protocols, ensuring adequate and equitable network transfers, and catalogue compatibility and interoperability. Programmes must focus on providing as open and unfettered access to data as is programmatically possible. Providing for wider and easier data and information access for users, assisting users to locate and utilize data, and enabling them to collaborate with other users, must all be key goals. Crediting incentives for data and information sharing, waiving of fees, copyrights and other use restrictions are particularly important in enhancing use.
42

6 DATA DELIVERY
The initial nodes of the data access system should rely on proven existing capabilities (e.g. the vast Earth observation archives of ESA, NASA and USGS; geospatial holdings of national mapping agencies; and inventory statistics of national natural resources agencies). Next, connecting secondary-level data holdings will be required. Finally, upgrading data and information connectivity linking smaller data centres and new users will also be needed. CEOS WGISS is pursuing the development of global data services for users of Earth observation information (including satellite and related data sets). While this effort is focused on wider use of Earth observation data, the result of this development should serve the broader goals of enhancing the utilization of land observations.
6.2.2 Functionality for assessing and documenting data integrityEffective use of land observation data holdings depends on data centres following community data standards, determining the accuracy, precision or other appropriate measures of uncertainty, and ensuring that all data and information are documented and meet minimum metadata standards. The Global Spatial Data Initiative (GSDI) forums on data and metadata standards should be considered as a land observation standard (Nebert, 2004). GSDI strives to foster spatial data infrastructures that support sustainable social, economic and environmental systems, integrated from local to global scales, and it promotes the informed and responsible use of geographical information and spatial technologies for the benefit of society - goals consistent with the needs for land observations.
There are considerable differences in the emphasis various data providers place on validation and calibration. Generally, the remote sensing land products producers have made much progress in including some type of accuracy assessment in mapping projects. It is important that accuracy assessments based on community standards be part of all data collection efforts.
When choosing between related, overlapping or seemingly similar data sets, it is essential that prospective data and information users have the knowledge to make wise choices. At a minimum, accurate, complete and timely metadata standards are vital to successful utilization of land observations.
6.2.3 Data mining and analytical capabilitiesEnhanced capacity to process, assemble and analyse observations from multiple sources is needed for the full range of land observation data, including satellite and in situ observations from National Resource Management agencies and international organizations. In the near future, as data archives grow in content and volume, it will become increasingly efficient to establish distributed data mining and analytical capabilities rather than to transfer all of the required data to a home workstation. Required functionality includes the provision of distributed capabilities for computing, data search, algorithm development, data caching and temporary storage, and cooperative tools. In addition, terrestrial monitoring will require extensive data mining in order to establish baseline conditions and detemine variations.
6.2.4 Distributed archiving and management systems Archived land observations will most probably remain distributed, with little centralization under any one agency. Land observation partners must act together to ensure long-term archiving and management of land observation data and information. Some actors, such as the USGS EROS, have well-established data archive management capabilities, but others with smaller holdings follow more ad hoc data archiving and management strategies. A minimum set of standards that ensures permanence and long-term access to the archives of data needed within the land observation community must be immediately established.
6.2.5 Principal recommendationsFoster collaboration for development of a distributed network of information systems that ensures � rapid and equal access to all holdings. Encourage establishment of a land observation data delivery system that provides the kinds of data �needed to solve problems. Ensure that land observation data and information products can be used, re-used and archived � as evidence of the condition of the planet’s landscape and change over time.Integrate systems for data query, data browsing, data ordering and data delivery across agen � cies. This will require addressing data exchange protocols, ensuring adequate and equitable network transfers, and catalogue compatibility and interoperability.Consider the Global Spatial Data Initiative forums on data and metadata standards as a land �observation standard. Strongly encourage implementation of accurate, complete and timely metadata standards. �Establish immediately a minimum set of standards that ensures permanence and long-term � access to the archives of land observation data.
43


7 CAPACITY BUILDING
7.1 Background Capacity building is a priority for all governments and organizations, and issues encompassing human, scientific, technological, organizational, institutional and resource capabilities should be core components of the mandate and work of IGOL.
The World Summit on Sustainable Development (WSSD) (UN, 2002) reconfirmed the priority of building capacity to assist developing countries to obtain their sustainable development goals. Over 35 references are made to capacity building in the WSSD Plan of Implementation. WSSD recommended providing financial resources to developing countries to meet their capacity needs for training, technical know-how and for strengthening national institutions. The issue of capacity building has become a major priority within the global environmental Conventions. However, the current capacity building efforts remain highly fragmented and uncoordinated.
7.2 PrinciplesThe contemporary view of capacity-building goes beyond the conventional perception of training. The central concerns are to manage change, to enhance coordination, to foster communication and to ensure that data and information are shared - these require a broad and holistic view of capacity development. The basic rationale for capacity building includes: closing the digital divide, fostering economic growth, enhancing social mobility, promoting equity, and spreading democracy in relation to access to information and participation in the decision-making process. Broad operational principles for effective capacity building includes ensuring national ownership and leadership, basing capacity building efforts on national priority issues, integrating capacity building in wider science and technology inputs to sustainable development efforts, promoting partnerships, accommodating the dynamic nature of capacity building and adopting a learning-by-doing approach.
7.3 Elements of capacity buildingWithin the context of land observations, generally speaking, capacity building encompasses the following:
D � evelopment of national research, monitoring and observations capacity, including training in observations, assessment and early warning;S � upport to national and regional institutions in data collection, analysis and monitoring of trends;A � ccess to scientific and technological information, including information on state-of-the-art technologies;E � ducation and awareness raising, including networking among universities with programmes of excellence in the field, and P � roduction and communication of data and information content that supports programmes and policies.
Land observation partners could contribute towards all of theses with various degrees of intensity and depending upon specific requirements of countries.
7.4 Principal actions neededCurrently there are a number of barriers related to collection of land-based observations in developing countries that need to be overcome. Some of the specific capacity building actions needed are:
Educational and enabling activities. �Training of more personnel, training of trainers in � in situ data collection, spaceborne imagery processing and interpretation and web mapping tools.Training in standardized land cover and ecosystem classification systems. �Fostering of twinning arrangements between appropriate North-South and South-South � institutions by sponsors of IGOL.Strengthening of capacities of selected universities in land observations. Provision of � standardized data collection and analysis manuals, high quality teaching and promotional materials, support to the development of distance learning modules.Facilitating adequate dialogue, by organizing workshops and development and dissemina � tion of outreach materials, etc., between decision-makers and technical personnel as most decision-makers are not aware of the potential benefits of such tools and technologies. Build upon the success of portals such as Google Earth and NASA World Wind.Mobilize resources. Assist in mobilizing financial resources to meet the high costs of equip � ment and maintenance, particularly for the African region. Also explore potential use of low cost technology, e.g. the US$ 100 laptops being developed by MIT. �
45

IgosL A N D
Assist in establishing communities of users by funding Internet-based discussion groups, � blogs and networks.Improve access to data, models and tool kits. �Disseminate information on best practices and case studies related to integration of data � sets from multiple sources for solving real-life problems.Space agencies, in cooperation with international organizations, should provide free, high � quality, cloud-free, orthorectified satellite data and ultra-fine-resolution DEMs at an affordable cost and preferably free to developing-country institutions. Research agencies, in partnership with international organizations, should provide access � to appropriate rapid mapping, modelling and decision support system (DSS) tools kits to users in developing countries.Advocate for integration of various information systems following common standards and � protocols for improved interoperability.Advocate for investments in establishing operational land cover monitoring capabilities � instead of ad hoc observation exercises.Advocate for improved Internet connectivity for research institutions and universities, in � collaboration with the private sector, for faster access to satellite observations and other derived products. Improve coordination and partnerships based in as far as possible on existing regional � networks.Provide a platform for interagency cooperation within each country. �Develop synergies with GEO and other capacity building efforts. �
A successful example aiming towards bridging existing gaps in collection and exploitation of satellite-based land information in Africa is provided by TIGER (www.tiger.esa.int), led by ESA in the framework of a CEOS initiative. GOFC-GOLD, with support from NASA (through START), CSA and the EC, amongst others has fostered the enhanced use of satellite products in several networks throughout the world (Brady and Naydenov, 2006).
It is recognized that many of these recommendations are common to the needs described in other themes. It is clear that a more coordinated approach to capacity building is needed for earth observations in general.
46

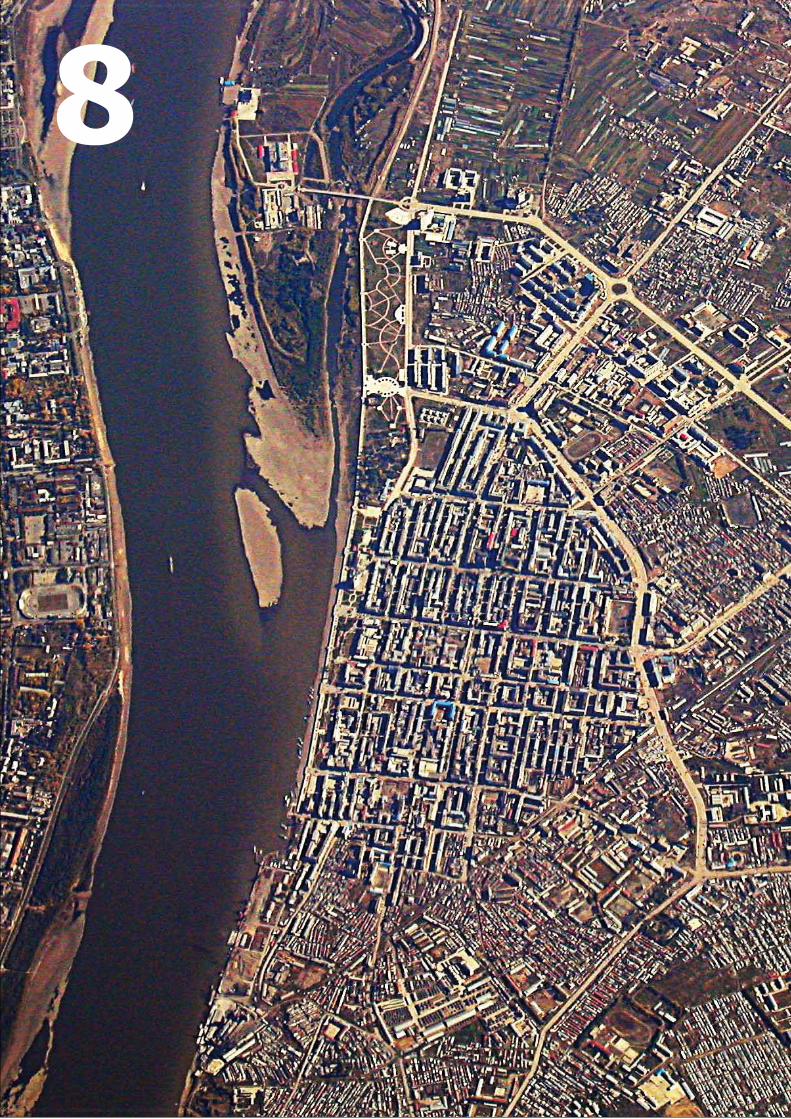

8 RELATION OF IGOL TO OTHER THEMES
Transfers of matter and energy and drivers of those fluxes tightly link the Land Theme’s observations with those of other IGOS-P Themes, such as Atmospheric Chemistry, Carbon, Coastal, Geohazards and Water. These tight linkages with other IGOS-P Themes amplify the importance of IGOL: land-based observations comprise important baseline data for many of the other IGOS-P Themes. Many observations evaluated in this Land Theme Report are also required by the other Themes:
Atmospheric Chemistry Theme:albedo for energy budgeting �(biophysical observations) �air pollutant emissions (human �settlements and � socio-economic data)heat sinks (water availability, �topography) �
Carbon Theme:vegetation status and activity (fire, biophysical observations, biodiversity) �fossil fuel emissions (human settlements and socio-economic data) �bio-fuel production (land use) �forest biomass inventories, harvests (land cover, biophysical observations) �soil carbon stocks (soils, land cover, land use) �lake, reservoir C stocks (water availability) �wetland extent (land cover) �
Geohazards Theme:digital elevation models (topography) �soil physical parameters (soils) �
Water Cycle Theme: soil moisture modelling (soils) �surface water storage (water availability and use) �wetland extent (land cover; water availability and use) �water quality (water availability and use) �
Cryosphere Theme:frozen soils (soils) �
The domain of the Land Theme Report was identified by attempting to limit overlap with observational domains of the other IGOS-P Themes:
Soil water content for drought and soil moisture monitoring were addressed in the Water Cycle Theme. CO2 stock and flux observations on land were addressed in the Carbon Theme. Frozen soils were not explicitly addressed in the Land Theme, but they will form a central component of
the Cryosphere Theme. Biodiversity in wetland and surface water systems was not singled out within Land Theme, but Land
Theme recommendations apply to wetland and surface water systems. Aquaculture was not addressed in the Land Theme. Several classes of Land Theme observations spatially overlap with Coastal observations.
Improving land observations to enhance societal benefits will rely upon observations and methods derived from other disciplines. Activities that promote interaction across disciplines and developing links across IGOS-P Themes will contribute to ensuring gaps are covered and redundancies minimized, while fostering coordination of observational priorities and diffusion of methods and applications across scientific communities.
49
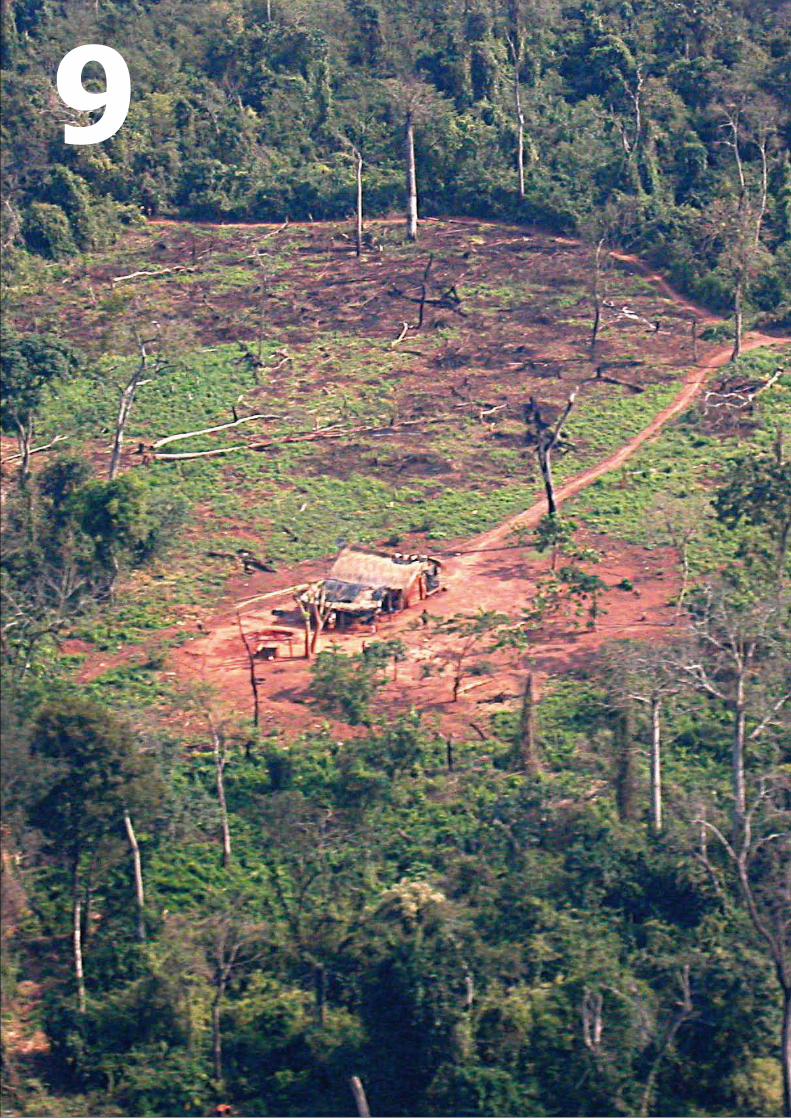

9 IMPLEMENTATION
9.1 StrategyImplementation of the recommendations of IGOL will be the responsibility of numerous international and national bodies. In the following Section (9.2), we highlight the main recommendations from this report and the body or bodies identified as responsible for them.
In terms of overall international coordination, the report is being completed at a time of considerable flux in roles and responsibilities. IGOL was set up under the framework of the IGOS Partnership and this report is formally submitted to that body. One of the main mechanisms for implementation in the framework of IGOS-P was to set up an Implementation Team, with one of the IGOS partners agreeing to chair the Team. It is fair to comment that this approach has had only mixed success, in large part because of the difficulty in capturing resources for the
coordination activity. We do not recommend that such a body be set up for IGOL, though, as noted below, we do recognize the need for oversight of progress in achieving the recommendations of IGOL.
Since the time that IGOL was created, an inter-governmental body, the Group on Earth Observations (GEO), has been set up with responsibilities for the implementation of a comprehensive Global Earth Observing System of Systems (GEOSS). It has defined an overall strategy (GEO, 2005) and a large number of tasks (GEO, 2007) several of which, if successfully implemented, will undoubtedly contribute to the goals of IGOL. Implementation of many of the coordination tasks recommended in this report are part of existing tasks or should form new tasks of GEO.
It is anticipated that CEOS will continue to play a central role with respect to coordination of space observations, either acting in its own right or through other bodies responsible for the coordination of implementation responding to tasks identified by GEO.
Notwithstanding the significance of these overarching bodies, many of the coordination responsibilities for terrestrial observations still lie with UN institutions, notably FAO, UNEP, UNESCO and WMO, and their subsidiary organizational entities.
In terms of the international coordination of terrestrial observations, GTOS has the broadest current remit. A consideration of its current scope and that of IGOL clearly shows that the latter is significantly broader in many respects, though with its burgeoning activities in biodiversity and conservation and in situ flux measurements the differences have been lessened. It is recommended that GTOS review the scope of activities of IGOL and consider expanding its role to better match the totality of terrestrial observations discussed in this document. One of the tasks of a re-scoped GTOS could be to monitor progress in the implementation of IGOL and advise the bodies responsible for implementation, as described in the next section, where progress is inadequate.
It is recommended that clear roles and responsibilities should be clearly defined and the ultimate responsibility and coordination of the implementation of IGOL should lie with the institutions identified and which have received the endorsement of all stakeholders concerned.
Since GEO is the principal body charged with coordination of implementation, we provide the mapping of IGOL recommendations to GEO tasks, highlighting any tasks identified by IGOL that are not in the current tasks. The GEO tasks identify those charged with the implementation.
9.2 Mapping of IGOL recommendations to GEO tasks Since GEO is the principal body charged with coordination of implementation, we provide the mapping of IGOL recommendations to GEO tasks highlighting any tasks identified by IGOL that are not in the current tasks. The GEO tasks (GEO, 2007) identify those charged with the implementation. Where no corresponding GEO Task is identified next to a recommendation, this indicates the need for an additional or enhanced GEO task.
9.2.1 Reports and meetings IGOL report (EC-06-05; US-06-03) Agricultural monitoring meeting, Rome 2006 (AG-06-01; AG-2yr-1) Biodiversity meeting, Washington 2005 (BI-06-02; BI-06-04)
9.2.2 Land cover (see Section 4.1) Develop acquisition strategies for land cover data that optimize coverage in time and space (AG-06-03;
related to AG-6yr-4). Minimize interruption of mid (30-m)-resolution data (AR-06-09). Ensure future continuity of Landsat-SPOT-type data (AR-06-09; EC-2yr-4; AG-2yr-6). Deploy a remote sensing system designed for land cover mapping at 1:250 000 scale that includes
51

IgosL A N D
a multispectral scanner with 50–100 m ground resolution and SAR with L-band frequency (10–50 m ground resolution) (AG-06-03).
Coordinate radar and optical data acquisition so that radar data can be used for regular, global monitoring of land cover (AR-06-02).
Agree upon an internationally accepted land cover classification system (related to EC-06-02, AG-06-04 and DA-06-04).
Coordinate international collection of in situ data for calibration and validation efforts (AR-06-02).
9.2.3 Land use (see Section 4.2) Develop a widely accepted land use classification system that is relevant to viability of short- and
long-term land uses and also to land potential and sustainability, and stratified by low-and high-land-use intensity (related to EC-06-02 and DA-06-04).
For intensively used areas, map (1:500 000 scale) mechanized agriculture, pivot irrigation, tropical plantations, areas deforested and urban areas (AG-06-06; AG-2yr-7; AG-10yr-3).
Integrate remotely sensed and in situ information to map crop production, livestock densities and fertilizer use (AG-06-05; AG-2yr-1; AG-10yr-4).
9.2.4 Forests (see Section 4.3) Minimize interruption of mid (30 m)-resolution data (AR-06-09; EC-2yr-4). Coordinate radar and optical data acquisition so that radar data can be used for regular, global monitoring
of forest cover (related to EC-06-04; AR-06-02; EC-2yr-8; EC-2yr-9). Agree upon an internationally accepted forest canopy classification system (EC-06-02; AG-06-04; EC-2-
yr-3; EC-2yr-5). Support continued research into developing operational forest structural observation systems (EC-2yr-6;
EC-2yr-5; AG-6yr-8). Sustain efforts to compile historical remotely sensed data for regional forest cover.
9.2.5 Biophysical properties relating to ecosystem dynamics (see Section 4.4) Ensure continued generation of gridded fAPAR and LAI (related to EC-6yr-5). Reprocess available archives of fAPAR and LAI to generate and deliver global, coherent and internationally
agreed values (related to EC-06-06, EC-6yr-5). Re-analyse the historical archives of NOAA’s AVHRR instrument, ensuring the long-term consistency of the
product with current estimates throughout the entire period (related to EC-06-06). CEOS Working Group on Calibration/Validation should continue to lead international benchmarking and
product intercomparison and validation exercises, including fAPAR and LAI. These efforts should take full advantage of existing networks of reference sites for in situ measurements whenever possible (related to DA-06-02).
9.2.6 Fire (see Section 4.5) Coordinate an international network of geostationary imagers, providing global active fire detection every
15–30 minutes, and make these data available in near-real-time for fire alert and management (AG-2yr-8). Modify the NPOESS VIIRS instruments for the non-saturated detection of active fires at 3.9 microns.
Monthly and near-real-time burned area products should be included in the operational product suite from NPOESS.
Support a coordinated international effort to validate the current and future global burned area products to CEOS Land Validation Stage 3. The GOFC-GOLD Regional Networks provide an opportunity for expert product validation (related to DA-06-02).
Coordinate and target acquisition of data from the international high-resolution assets to provide high-resolution imagery (<20 m) of large and hazardous fire events within 48 hours of the event. The data need to be affordable and easily accessible by the international fire management and research community. Future high-resolution systems should include the capability for active fire detection (related to DI-6yr-5, AG-2yr-8).
Enhance the access to and utility of their fire products, through the use of near-real-time delivery systems and Web-GIS (DI-06-13, AG-2yr-8).
Implement standardization of national fire data collection and reporting and promote open access to these data. These data should be spatially explicit and georeferenced.
Initiate an international programme on Global Fire Early Warning, integrating satellite and in situ fire weather data (DI-06-13).
9.2.7 Biodiversity and conservation (see Section 4.6) Update the world database of protected areas.
Ensure availability and comparability of existing data collections (BI-06-03; BI-06-05; BI-2yr-1; BI-2yr-4). Georeference all new socio-economic observations (related to AR-06-08 and related to BI-2yr-3). Enhance availability of 30 m global topography, which plays a critically important role in correction of
52
9 IMPLEMENTATION
imagery data, in habitat delineation and as model input data (AR-06-06). Ensure delivery of very-high-resolution cloud-free imagery at low cost for rapid response in key areas, with
ability to monitor cloudy areas for illegal logging, road-building in sensitive areas, and so forth. Maintain continuity of the long-term seasonal record of land cover change and fragmentation at 30 m
resolution. A key attribute, or derived characteristic, of such a land cover product would be the derivation of disturbance patterns and frequencies (AR-06-07; EC-2yr-4; AG-2yr-6).
Develop a long-term record of critical land use characteristics, at a spatial scale that is commensurate with the land cover change product, but that includes additional information on the human use of land resources, such as crop type, at sufficient spatial resolution to identify small-scale land-holders (ca. 0.5 ha) (AG-06-06; AG-2yr-7; AG-10yr-3).
Generate seasonal freshwater distribution and flow data products sufficient to detect irrigation schemes (related to WA-06-04).
Improve models for predicting species distributions on existing landscapes and develop better guidelines for their use by the scientific community and conservation organizations.
Organize observational data from in situ research sites in order to develop a validation database for existing products of relevance to biodiversity issues (BI-06-05; BI-2yr-4; BI-2yr-6).
Adopt a consensus ecosystem classification hierarchy and map product that describes how systems are mapped, how to add detail, and how to extend the classification scheme to all ecosystems (including human-dominated systems) (BI-06-01; EC-06-02; DA-06-04; EC-2yr-3; EC-6yr-1).
9.2.8 Agriculture (see Section 4.7) Standardize collection and dissemination of annual national statistical and other in situ data (related
to AG-06-07). Enhance the rain gauge data collection network and lower barriers to timely data access (related to AG-06-05; WA-2yr-1; WA-2yr-3). Improve seasonal climate prediction accuracy (related to AG-06-05; and to WA-10yr-4). Provide high-resolution (10–20 m), cloud free coverage with a 5–10 day return period. Ensure continuity of moderate-resolution (1 km, 100–300 m) observations. Improve targeting and reduce costs of hyperspatial (1–3 m) imagery (related to EC-2yr-7). Improve spatial resolution, targeting and height accuracy of radar altimetry, and operationalize data
collection (related to AR-06-06; and to CL-2yr-1). Provide near-real-time access to regularly collected microwave data (10–30 m) that can be fused with
data from optical systems.
9.2.9 Soils (see Section 4.8) Develop harmonized, small-scale (1:1 000 000) soil resource and terrain (SoTeR) database on a global
scale (AG-6yr-2). Expand quality-controlled, georeferenced soil profile information collection, particularly in areas where
none or very little of this information has become available (China, Former Soviet Union). Encourage a single body (most logically IUSS) to develop analytical and procedural standard
methods that are binding for all organizations involved with soil classification, mapping and analyses. Make interpretations of soil data more accessible and intelligible to non-soil scientists.
9.2.10 Human settlements and socio-economic data (see Section 4.9) Produce consistent global maps of human settlements on an annual basis using multiple data
sources (EC-10yr-2). Enhance ability to use high-spatial-resolution data (related to EC-2yr-7). Improve methods for measuring building heights. Model spatial distribution of fossil fuel emission (CL-2yr-13). Develop more robust methods to relate radio and microwave emission data to poverty and economic activity. Provide enhanced spatial resolution of low light imagery.
9.2.11 Water availability and use (see Section 4.10) Ensure continuity of high-resolution (10–30 m) remotely sensed data (AR-06-07; EC-2yr-4). Test and implement methods to use hyperspectral imaging to measure water clarity (related to WA-6yr-14). Enhance methods to model water use and demand at the catchment scale (WA-06-04). Map irrigated land area using high- and moderate-resolution remotely sensed data (AG-06-06; AG-2yr-7; AG-10yr-3).
9.2.12 Topography (see Section 4.11) Improve global coverage of 90-m SRTM data sets (possibly by integration with SPOT-5 or ERS
acquisitions in tandem mode) (AR-06-06; DI-2yr-2). Ensure public availability of medium-scale global topographic data sets (AR-06-06).
53

IgosL A N D
Provide high-resolution (1 m) topographic information for low and flood prone areas (DI-6yr-1). Distribute data using a common geodetic reference frame (DA-06-06).
9.2.13 Validation and Quality Assessment (see Section 5.1) Any land product that is being developed in the framework of GEOSS must be validated and the
associated accuracy assessment provided. Validation results and the associated validation data sets should be made openly available and results
should be published in the open literature. Validation activities should continue through the life of the sensor or product. Results can be developed incrementally, but for critical climate data records, the ultimate goal is to have
validation results across a statistically valid, globally representative sample. The Space Agencies should support the CEOS LPV working group in its efforts to realize efficiencies and
establish protocols for coordinated international land product validation (AR-06-01; DA-06-02). CEOS LPV subgroup should engage the user community in its validation activities; in particular, validation
should involve the regional networks of scientists participating in GOFC-GOLD, IGBP-START and other networks that may evolve from GEOSS (AR-06-01; EC-6yr-4).
9.2.14 Data fusion (see Section 5.2) Ensure that land products are orthorectified and expressed in a common reference system (related to
DA-06-04; DU-2yr-4). Support research of potential for new data fusion products and techniques (DA-06-03; HE-10yr-5; DU-2yr-2). Support efforts to carry out quality assessments of data fusion products (DA-06-03).
9.2.15 Data assimilation (see Section 5.3) Support efforts to advance data assimilation methods for a wider range of land observations (DA-06-03;
WA-2yr-10; WA-6yr-5; DU-2yr-2). Ensure that calibration and validation efforts strive to generate estimates of observational uncertainty
(related to DA-06-05). Facilitate efforts to coordinate in situ and remote observations to ensure compatibility between disparate
data sources (AR-06-02; HE-2yr-4; CL-10yr-1; EC-2yr-7; AG-10yr-4; DU-2yr-3).
9.2.16 Data and product access (see Section 6.1) Encourage the lowering of barriers to access, either by wholly enabling new access to existing data or
developing data access systems that enable access while maintaining privacy and security standards (DA-06-01; DA-06-07; DU-10yr-1).
Encourage implementation of GEOSS recommendations to make data available at the marginal cost of reproduction (DA-06-01).
Support research to develop methods and software to lower the cost of post-processing data customization (DA-06-08).
9.2.17 Data and information delivery (see Section 6.2) Foster collaboration for development of a distributed network of information systems that ensures rapid
and equal access to all holdings (AR-06-05; DA-06-04; DA-06-06; AR-06-01; DA-06-01; WA-2yr-13; EC-2yr-6; DU-2yr-3; DU-6yr-1; DSU-10yr-1; DSU-10yr-2).
Encourage establishment of a land observation data delivery systems tuned to the diverse needs of land user communities (US-06-01; DA-06-04; and related to US-06-02 and US-06-03; HE-2yr-3; DSU-2yr-2; DSU-10yr-1).
Ensure that land observation data and information products can be used, re-used and archived as evidence of the condition of the planet’s landscape and change over time (DA-06-05; DSU-10yr-2).
Integrate systems for data query, data browsing, data ordering and data delivery across agencies. This requires addressing data exchange protocols, ensuring adequate and equitable network transfers, and catalogue compatibility and interoperability (AR-06-05; DA-06-01; AR-06-01; WA-6yr-4; DU-2yr-3; DU-6-yr-1; AR-2yr-1; DSU-6yr-2; DSU-10yr-1).
Consider the Global Spatial Data Initiative forums on data and metadata standards as a land observation standard (DA-06-06; DU-2yr-4).
Strongly encourage implementation of accurate, complete and timely metadata standards (DA-06-04). Establish immediately a minimum set of standards that ensures permanence and long-term access to
the archives of land observation data (hinted at but not specified in DA-06-05; HE-2yr-9; DU-2yr-1).The very different approaches adopted towards capacity building in the IGOL Report and that of GEO militates against any simple mapping between the report’s recommendations and the various GEO tasks.
54


10 CONCLUDING COMMENTS
In this final section we summarize some of the cross-cutting issues of IGOL. The multiplicity and diversity of uses for land observations means that a complete integrated synthesis is neither possible nor wise.
Certain observations are unique to particular stakeholders and there is a need to refer to the main document for those. Also, requirements often differ in subtle ways. There are many calls for mid-resolution optical data: for some applications the needs are for data with spatial resolutions near to 10 m whereas for others 50 m data would suffice; for some needs, observations once every 16 days will provide adequate data sets, while other applications require much more frequent imaging. In responding to the needs of the land community, such critical differences have to be carefully
considered. In most cases, higher spatial and temporal resolutions meet most needs and can potentially provide the basis for deriving aggregated products at coarser resolutions.
10.1 Remote sensing observationsRemote sensing observations are called for in all parts of the report, to continue existing capabilities and to make incremental additions, while in some cases there are calls for new initiatives.
10.1.1 Critical observations needing to be continued These include mid (10–50 m)-resolution optical remote sensing. The Team has noted with concern the decline in availability of mid-resolution data, due to the problems with the Landsat ETM+. However the Team notes the increasing number of countries with systems providing mid-resolution data and hence the opportunity for the development of a distributed global observation capability.
In terms of moderate-resolution sensors (100 m–1 km), there appears to be a good chance of achieving continuity, but current plans for some sensors, such as VIIRS, will possibly mean some reductions in capabilities relative to current ones.
Several radars are now in orbit. The increasing value of their products calls for their continued deployment.
10.1.2 Crucial incremental additionsFor some purposes, mid-resolution data are collected with an adequate frequency, but for several purposes, such as several agricultural applications, more frequent, cloud-free observations are needed. Increasing the frequency of observations by coordination of existing and future assets is to be encouraged, as proposed in the CEOS Virtual Land Surface Imaging (LSI) Constellation. In the future, constellations with standard instrumentation designed specifically to provide high-temporal imaging are needed.
The use of Thermal IR data for energy balance and hydrological products is gaining ground, but we note that there are currently no plans to continue the observational capabilities of ASTER or ETM+.The inclusion of middle and thermal infrared sensors with fire detection capabilities on both mid- and moderate-resolution systems will help meet the needs of this growing community.
The increasing spatial resolution of Geostationary systems makes them suitable for land studies and applications where there is high temporal variability, such as in fire monitoring. Increased awareness of the growing needs of the land community is needed by the geostationary data providers, who traditionally serve just the meteorological community.
The complementarity of optical and microwave sensors has long been recognized. The report calls for better coordination of optical and microwave acquisition strategies, and data fusion tools to enhance their synergistic capabilities.
10.1.3 Critical new initiatives Increasing use of hyperspectral data from experimental missions such as EO-1 has led to a call for more observational assets and related research to improve products in areas as diverse as biodiversity, agriculture and water.
The third dimension of vegetation is important for many users. We note the improvements in estimation of biomass by both microwave and optical sensors. The wide use of laser technology to characterize vegetation structure currently from airborne sensors is noted, and space agencies are encouraged to develop spaceborne instruments for this purpose, expanding the coverage and repeatability of airborne systems.
Combined short- (X- and C-band) and long-wave (L- and P-band) radar observations in multiple polarizations (including cross-polarized or full-polarized) and in interferometric mode should greatly improve forest mapping in terms of structure, height and biomass, as well as improving timely agricultural monitoring.
57

IgosL A N D
10.2 Central role of land cover products Throughout this document, the need for reliable land cover products is repeatedly called for, in almost all sub-themes. Many such products have been developed for local, national and regional scales, and fine tuning them to sub-global needs is appropriate. However many good reasons for global products are identified in this report. At moderate resolutions, increasingly refined products have been created and will need to continue to be generated. At mid-resolutions, no such global products have been made. This is all the more remarkable given the availability of observations suitable for this purpose since 1972. The computational capacity to develop global products at fine resolutions is now available, and the data acquisition strategy and support for development of such products are strongly recommended.
10.3 Socio-economic productsThe importance of socio-economic variables is apparent in many of the sub-themes, including, but not limited to, land use, biodiversity and conservation, agriculture and human dimensions. We recognize that considerable effort and new initiatives will be needed to improve the availability of spatially explicit socio-economic data in a non-aggregated form for large parts of the World.
10.4 In situ observations In situ observations have been dealt with less comprehensively than remote sensing observations. Most in situ observations are collected for national or local needs and standardization of collection procedures is often not adhered to and there is often not a tradition of freely exchanging data. The need for improved in situ data collection occurs throughout the report and notably for biodiversity, agriculture, soils and fires.
In the report there are several calls for improved standardization of in situ data, such as for national fire data collection and reporting, and the adoption of international standards for much in situ data relevant to agriculture. Continuing efforts will be needed by the various terrestrial communities to make data available. For example, there is a call for improved data exchange standards for several biophysical variables to improve their availability.
In some fields, such as forestry and agriculture, there are significant benefits to be gained from a greater integration of in situ and satellite observations.
10.5 Importance of validationOne key place where in situ data and remote sensing come together is in product validation. The report stresses once again the importance of validating remote sensing-derived products, so that their value can be objectively tested and errors reliably estimated. Unvalidated products should not be distributed by agencies. Validation results should be made openly available and the associated validation data should be easily accessible.
10.6 Key role of improved classification schemes To turn observations into useful products requires agreement on the characteristics of such products. We note the call in several parts of the report for improvements in internationally agreed classification schemes, such as those for ecosystem hierarchies, and for those associated with land use and specifically for the built environment and associated infrastructure.
10.7 Delivering observations and products Users are obliged to obtain their data from a multiplicity of sources: from space agencies, from government departments, universities, research organizations, and, at times, from commercial organizations. While we recognize the desirability and strength of distributed data systems, we believe that providing more coordination in accessing these diverse sources, such as portals linking users to multiple related data sets, would greatly improve the take-up of data. Similarly, increased attention by data providers to metadata standards would greatly improve data inter-use.
10.8 Data policies A detailed discussion of the many different data policies for land data is beyond the scope of this report. We do stress the abundant empirical evidence that making data openly and freely available greatly increases its take-up and use. In particular, it reduces the financial obstacle that prevents poorer countries and institutions from using the data for resource management and decision support.
10.9 Capacity building Disparity in the understanding of what data are available and how to access, process and utilize them remains a major obstacle to broad uptake of the data, particularly in developing countries. The demand for capacity building in the use of land observations is high and comes primarily from the resource management community. Over the years, a number of centres have been established offering training related to the observing systems, and on-line tutorials have been developed. Procedures need to be put in place for updating these capabilities as
58

10 CONCLUDING COMMENTS
new observing systems come on line. In the developing world, there is wide variability in the capability to utilize the existing observing systems, and limited access to the full Internet is often an obstacle. Lateral transfer of technologies between countries within a region offers an opportunity to focus on appropriate technologies, suited to a particular environment or set of resource problems. The observing systems are encouraged to increase emphasis on capacity building to help realize the full potential of their data.
10.10 New application areas There are a number of new applications areas where land observations are starting to be used more extensively, e.g. carbon accounting, biodiversity assessments, human health, and the expanding urban environment. As these fields develop through increased research and development, there is a need to develop a process whereby new requirements can be integrated into the design of future systems. This will mean operational agencies expanding their user base beyond the traditional weather agencies.
10.11 IGOL and GEOSS There exist a number of land observing systems that are currently managed independently and are operating in an uncoordinated way. There would be considerable advantage in them being integrated into a small number of ‘system of systems’, which would increase data availability and use, ensure data continuity and reduce gaps caused by shortcomings in national programmes. Such systems come from an increasingly large number of countries.
IGOL has completed its report to the IGOS Partnership. There are several compelling arguments for retaining IGOL and its Theme Team, at least in the medium term. These are based, in particular, on the work of the successful Theme Team, whose members have considerable expertise and high international reputations in the field of terrestrial observations.
1. The scope of IGOL includes several areas (or sub-themes) where there is either an absence of international coordination mechanisms or the mechanisms are currently weakly developed. IGOL should provide the needed international coordination until other entities are able to fulfil these functions.
2. IGOL should ensure there is a comprehensive road map between its recommendations and GEO tasks, and assist in defining or refining GEO tasks where there is no task corresponding to an IGOL recommendation.
3. IGOL should provide advice on the implementation of GEO tasks involving terrestrial observations, to the GEO secretariat and organizations who have taken responsibility for implementation.
4. IGOL’s recommendations cross-cut many GEO tasks relating to the land. The IGOL Theme Team has the expertise and willingness to provide scientific guidance to ensure that the implementation of the many types of land observations retain coherence and compatibility.
In carrying out these actions every effort should be taken to ensure that IGOL does not duplicate any activities of other bodies working with GEO and who are concerned with the international coordination of land observations.
As currently envisaged, the Theme Team would act in a virtual mode with the large majority of interactions being carried out electronically.
All current members of the Theme Team are affiliated with or work for GEO’s Partners and Observers, and their organizations support the continuity of the IGOL Theme Team as outlined in this proposal.
Most of the recommendations of IGOL have already been clearly mapped to GEO tasks and are supportive of GEO, as shown in Section 9.2. In addition to the specific linkages with GEO referred to above, the GEO Secretariat is encouraged to nominate a specific point of contact with IGOL.
59


REFERENCES
Achard, F., Eva, H.D., Stibig, H.-J., Mayaux, P., Gallego, J., Richards, T. & Malingreau, J.-P. 2002. Determination of deforestation rates of the world’s humid tropical forests. Science, 297: 999–1002.
Ahern, F., Belward, A., Churchill, P., Davis, R., Janetos, A., Justice, C.O., Loveland, T., Malingreau, J.-P., Maiden, M., Skole, D., Taylor, V., Yasuoka, Y. & Zho, Z. 1999. A strategy for global observation of forest cover. GOFC-GOLD Report, No. 2. Available at www.fao.org/gtos/gofc-gold/docs/GOLD_2.pdf
Ahern, F.J., Goldammer, J.G. & Justice, C.O. 2001. Global and regional vegetation fire monitoring from space: planning a coordinated international effort. SPB Academic Publishing, The Hague, The Netherlands.
Amaral, S., Camara, G., Monteiro, A.M.V., Quintanilha, J.A. & Elvidge, C.D. 2005. Estimating population and energy consumption in Brazilian Amazonia using DMSP night-time satellite data. Computer, Environment and Urban Systems, 29: 179–195.
Anderson, M.C., Kustasa, W.P. & Norman, J.M. 2007. Upscaling flux observations from local to continental scales using thermal remote sensing. Agronomy Journal, 99: 240–254.
Anyamba, A., Tucker, J., Heute, A. & Boken, B. 2005. Monitoring drought using coarse-resolution polar-orbiting satellite data. pp. 57–78, in: V.K. Boken, A.P. Cracknell and R.L. Heathcote (editors). Monitoring and Predicting Agricultural Drought: A Global Study. Oxford University Press, New York, USA.
Arino, O., Plummer, S. & Defrenne, D. 2005a. Fire disturbance: the ten years time series of the ATSR World Fire Atlas. Proceedings of the MERIS (A)ATSR Workshop 2005. ESA SP-597.
Arino, O., Trebossen, H., Achard, F., Leroy, M., Brockman, C., Defourny, P., Witt, R., Latham, J., Schmullius, C., Plummer, S., Laur, H., Goryl, P. & Houghton, N. 2005b. The Globcover Initiative. Proceedings of the MERIS (A)ATSR Workshop 2005, ESA SP-597.
Arino, O., Casadio, S. & Plummer, S. 2007a. ATSR World Fire Atlas and its thousand users. Proceedings of the ENVISAT Symposium 2007. ESA SP-636.Arino, O., Leroy, M., Ranera, F., Gross, D., Bicheron, P., Nino, F., Brockmann, C., Defourny, P., Vancutsem, C., Achard, F., Durieux, L., Bourg, L., Di
Gregorio, A., Witt, R., Herold, M., Plummer, S., Weber, J.-L., Goryl, P. & Houghton, N. 2007b. GlobCover–A global land cover service with MERIS. Proceedings of the ENVISAT Symposium 200, ESA SP-636.
Arino, O., Gross, D., Ranera, F., Leroy, M., Bicheron, P., Brockman, C., Defourny, P., Vancutsem, C., Achard, F., Durieux, L., Bourg, L., Latham, J., Di Gregorio, A., Witt, R., Herold, M., Sambale, J., Plummer, S. & Weber, J.-L. 2007c. GlobCover: ESA service for Global Land Cover from MERIS. Geoscience and Remote Sensing Symposium, 2007. IGARSS 2007. IEEE International Page(s): 2412-2415 DOI 10.1109 /IGARSS.2007.4423328.
Arvidson, T., Gasch, J. & Goward, S.N. 2001. Landsat 7’s long-term acquisition plan - an innovative approach to building a global imagery archive. Remote Sensing of Environment, 78(1): 13–26.
Askne, J., Santoro, M., Smith, G. & Fransson, J.E.S. 2003. Multitemporal repeat-pass SAR interferometry of boreal forests. IEEE Transactions on Geoscience and Remote Sensing, 41(7): 1540–1550.
Balmford, A., Bennun, L., Brink, B.T., Cooper, D., Côté, I.M., Crane, P., Dobson, A., Dudley, N., Dutton, I., Green, R.E., Gregory, R.D., Harrison, J., Kennedy, E.T., Kremen, C., Leader-Williams, N., Lovejoy, T.E., Mace, G., May, R., Mayaux, P., Morling, P., Phillips, J., Redford, K., Ricketts, T.H., Rodriguez, J.P., Sanjayan, M., Schei, P.J., van Jaarsveld, A.S. & Walther, B.A. 2005. The Convention on Biological Diversity’s 2010 Target. Science, 307: 212–213.
Balmford, A., Green, R.E. & Jenkins, M. 2003. Measuring the changing state of nature. Trends in Ecology & Evolution, 18: 326–330.Bartalev, S.A., Belward, A.S., Erchov, D.V. & Isaev, A.S. 2003. A new SPOT4-VEGETATION derived land cover map of Northern Eurasia.
International Journal of Remote Sensing, 24(9): 1977–1982.Bartholome, E.M. & Belward, A.S. 2005. GLC2000: a new approach to global land cover mapping from Earth Observation data.
International Journal of Remote Sensing, 26: 1959–1977.Blaes, X., Vanhalle, L. & Defourny, P. 2005. Efficiency of crop identification based on optical and SAR image time series.
Remote Sensing of Environment, 96: 352–365.Boschetti, M., Bocchi, S. & Brivio, P. 2007. Assessment of pasture production in the Italian Alps using spectrometric and remote sensing information.
Agriculture, Ecosystems & Environment, 118(1–4): 267–272.Brady, M, & Naydenov, E. 2006. Report of the GOFC-GOLD Regional Networks Meeting, Jena, Germany, August 2006. GOFC-GOLD Report No. 29.
Available at: http://nofc.cfs.nrcan.gc.ca/gofc-gold/Report%20Series/GOLD_29.pdfCarmona-Moreno, C., Belward, A., Malingreau, J.-P., Hartley, A., Garcia-Alegre, M., Antonovskiy, M., Buchshtaber, V. & Pivovarov, V. 2005.
Characterising interannual variations in global fire calendar using data from Earth observing satellites. Global Change Biology, 11: 1537–1555.Ciais, Ph., Moore, B., Steffen, W., Hood, M., Quegan, S., Cihlar, J., Raupach, M., Rasool, I., Doney, S., Heinze, H., Sabine, C., Hibbard, K.,
Schulze, D., Heimann, ,M., Chédin, A., Monfray, P., Watson, A., LeQuéré, C., Tans, P., Dolman, H., Valentini, R., Arino, O., Townshend, J., Seufert, G., Field, C., Igrashi, T., Goodale, C., Nobre, A., Inoue, G., Crisp, D., Baldocchi, D., Tschirley, J., Denning, S., Cramer, W., Francey, R. & Wickland, D. 2006. A Strategy to Realize a Coordinated System of Integrated Global Carbon Cycle Observations, Integrated Global Carbon Observation Theme. IGOS Partnership.
CIESIN [Center for International Earth Science Information Network]. 2000. Gridded Population of the World (GPW), Version 2. CIESIN, Columbia University, USA. See: http://sedac.ciesin.org/plue/gpw
Cretaux, J.F. & Birkett, C. 2006. Lake studies from satellite radar altimetry. Comptes Rendues Geosciences, 338: 1098–1112.CNES [Centre national d’études spatiales]. 2000. SPOT-Vegetation Instrument. CNES. See: http://spot4.cnes.fr/spot4_gb/Datt, B., McVicar, T.R., Van Niel, T.G., Jupp, D.L.B. & Pearlman, J.S. 2003. Preprocessing EO-1 Hyperion hyperspectral data to support the
application of agricultural indexes. IEEE Transactions on Geoscience and Remote Sensing, 41(6): 1246–1259.DeFries, R., Asner, G.P. & Foley, J. 2006 A glimpse out the window: Landscapes, livelihoods, and the environment. Environment, 48(8): 22–36.Di Gregorio, A. 2005. Land Cover Classification System. Classification concepts and user manual. Software version 2. Revised version of Di
Gregorio & Jansen, 2000, q.v. [FAO] Environmental and Natural Resources Series, No. 8.Di Gregorio, A. & Jansen, L.J.M. 2000. Land Cover Classification System (LCCS). Classification concepts and user manual [for software version 1.0].
FAO Project GCP/RAF/287/ITA Africover. Food and Agriculture Organization of the United Nations, Rome, Italy. 179 p.Diner, D.J., Braswell, B.H., Davies, R., Gobron, N., Hu, J., Jin, Y., Kahn, R.A., Knyazikhin, Y., Loeb, N., Muller, J.-P., Nolin, A.W., Pinty, B., Schaaf,
C.B., Seiz, G. & Stroeve, J. 2005. The value of multiangle measurements for retrieving structurally and radiatively consistent properties of clouds, aerosols, and surfaces. Remote Sensing of Environment, 97: 495–518.
Dudley, N., Hockings, M. & Stolton, S. 1999. Measuring the effectiveness of protected areas management. pp. 249–257, in: S. Stolton and N. Dudley (editors). Partnerships for Protection: New Strategies for Planning and Management for Protected Areas. Earthscan, London, UK.
Dugelby, B. & Libby, M. 1998. Analyzing the social context at parks in peril sites. pp. 63–75, in: S.E. Anderson (editor). Parks in peril: people, politics, and protected areas. Island Press, Washington DC, USA.
Dull, C.W. & Lee, B. 2001. Satellite earth observation information requirements of the fire management community. pp. 19–33, in: F.J. Ahern, J. Goldammer and C.O. Justice (editors). Global and Regional Fire Monitoring from Space: planning a coordinated international cooperation. SPB Academic Publishing, The Hague, The Netherlands.
Ebener, S., Murray, C., Tandon, A. & Elvidge, C. 2005. From wealth to health: modelling the distribution of income per capita at the sub-national level using night-time lights imagery. International Journal of Health Geographics, 4: 5–11.
61

IgosL A N D
62
EEA [European Environmental Agency]. 1995. CORINE Land Cover, Part I: Methodology. European Environment Agency, 94 p. Available at: http://reports.eea.europa.eu/COR0-part1/en
Eliasson, A., Faurès, J.-M., Frenken, K. & Hoogeveen, J. 2005. Aquastat - Getting to grips with water information for agriculture IWG-Env, International Work Session on Water Statistics, Vienna, 20–22 June 2005. 12 p.
ESA [European Space Agency]. 2004. MERIS introduction. Available at http://envisat.esa.int/instruments/meris/Evans, N. 2005. Geoland project: Using satellite-derived data in spatial planning. Planning Practice & Research, 20(3): 353–354.FAO [Food and Agriculture Organization of the United Nations]. 1995. Global and national soils and terrain digital data procedures manual
(SOTER). World Soils Resources Report, No. 74. Rev. 1.FAO. 1998. World reference base for soil resources. World Soil Resources Report, No. 84.FAO. 2004. The Africover Initiative. FAO, Rome, Italy. See: www.africover.org/africover_initiative.htmFAO. 2006. Global Forest Resources Assessment 2005. FAO, Rome, Italy.FAO. 2007. Gridded livestock of the world. FAO, Rome, Italy. See: www.fao.org/ag/againfo/resources/en/glw/default.htmlFAO/GIEWS. 2005. Global Information and Early Warning System on Food and Agriculture: Foodcrops and Shortages, No. 2.
See: www.fao.org/docrep/008/J5649e/J5649e00.htmFensholt, R. & Sandholt, I. 2003. Derivation of a shortwave infrared water stress index from MODIS near- and shortwave infrared data in a
semiarid environment. Remote Sensing of Environment, 87: 111–121.Fischer, G., van Velthuizen, H., Shah, M. & Nachtergaele, F.O. 2002. Global Agroecological Assessment for Agriculture in the 21st Century:
Methodology and Results. RR-02-02. FAO, Rome, Italy, and IIASA, Laxenburg, Austria.Fransson, J.E.S., Walter, F. & Ulander, L.M.H. 2000. Estimation of forest parameters using VHF SAR data.
IEEE Transactions on Geoscience and Remote Sensing, 38(1): 720–727.Friedl, M.A., McIver, D.K., Hodges, J.C.F., Zhang, X., Muchoney, D., Strahler, A.H., Woodcock, C.E., Gopal, S., Schneider, A., Cooper, A., Baccini, A.,
Gao, F. & Schaaf, C. 2002. Global land cover from MODIS: Algorithms and early results. Remote Sensing of Environment, 83(1-2): 287–302.GCOS. 2006. Systematic observation requirements for satellite-based products for climate - Supplemental details to the satellite-based component
of the Implementation Plan for the Global Observing System for Climate in Support of the UNFCCC. GCOS Report, No. 107.GEO. 2005. The Global Earth Observation System of Systems (GEOSS) 10-Year Implementation Plan. (As adopted 16 February 2005).
See: www.earthobservations.org/docs/10-Year%20Implementation%20Plan.pdfGEO. 2007. GEO 2007–2009 Work Plan: Toward Convergence v.4. Group on Earth Observations.
See: www.earthobservations.org/docs/WP0709.v4.pdfGeorge, H. & Nachtergaele, F.O. 2002. Land use data. pp. 53–65, in: R. Tateishi and D. Hastings (editors). Global Environmental Databases:
Present Situation; Future Directions (Vol. 2). International Society for Photogrammetry and Remote Sensing, Hong Kong.Giglio, L., Descloitres, J., Justice, C.O. & Kaufman, Y. 2003. An enhanced contextual fire detection algorithm for MODIS.
Remote Sensing of Environment, 87: 273–282.GLP. 2005. Science Plan and Implementation Strategy. IGBP Report No. 53/IHDP Report No. 19. IGBP Secretariat, Stockholm. 64 p.Gobron, N., Pinty, B. Taberner, M. Mélin, F. Verstraete, M.M. & Widlowski, J.-L. 2006a. Monitoring the photosynthetic activity of vegetation from
remote sensing data. Advances in Space Research, 38: 2196–2202.Gobron, N., Pinty, B., Aussedat, O., Chen, J., Cohen, W.B., Fensholt, R., Gond, V., Hummerich, K.F., Lavergne, T., Mélin, F., Privette, J.L.,
Sandholt, I., Taberner, M., Turner, D.P., Verstraete, M.M. & Widlowski, J.-L. 2006b. Evaluation of fraction of absorbed photosynthetically active radiation products for different canopy radiation transfer regimes: Methodology and results using Joint Research Center products derived from SeaWiFS against ground-based estimations Journal of Geophysical Research-Atmospheres, 111(D13): Art. D13110.
Hargreaves, J. & Annan, J. 2002. Assimilation of paleo-data in a simple Earth system model. Climate Dynamics, 19: 371–381.Hansen, M.C., DeFries, R.S, Townshend, J.R.G., Carroll, M., Dimiceli, C. & Sohlberg, R. 2003. A global percent tree cover at a spatial resolution of
500 metres: first results of the MODIS vegetation continuous fields algorithm. Earth Interactions, 7: paper 10. 15 p.Hay, S.I., Noor, A.M., Nelson, A. & Tatem, A.J. 2005. The accuracy of human population maps for public health applications.
Tropical Medicine and International Health, 10(10): 1073–1086.Herold, M., Woodcock, C., Di Gregorio, A., Mayaux, P., Belward, A., Latham, J. & Schmullius, C.C. 2006a. A joint initiative for harmonization and
validation of land cover data sets. IEEE Transactions on Geoscience and Remote Sensing, 44(7): 1719–1727.Herold, M., Brady, M., Sambale, J. & Schmullius, C.C. 2006b. Report of the Land Cover Implementation Team Meeting, Jena, Germany, 23–24
March 2006. GOFC-GOLD Report No. 28. See: www.fao.org/gtos/gofc-gold/series.htmlIGOL. 2006. Agricultural Monitoring Meeting Convened for the Integrated Global Observations for Land (IGOL) Theme. Rome, Italy, 8–11 March
2006. See: www.fao.org/gtos/igol/docs/meeting-reports/ag-IGOL-meeting-report_v10.pdfIGOS. 2004. A Global Water Cycle Theme for the IGOS Partnership: Report of the Global Water Cycle Theme Team. See: www.gewex.org/
final_igos_watercycle.pdfIPCC [Intergovernmental Panel on Climate Change]. 2001. IPCC Third Assessment Report: Climate Change 2001. See: www.ipcc.ch/pub/reports.
htmIPCC. 2003. Good Practice Guidance for Land Use, Land-Use Change and Forestry.Janetos, A.C. & Townshend, J. 2005. Special meeting on observational priorities for conservation and biodiversity. Integrated Global Observations
of the Land (IGOL)–an IGOS-P Theme. H. John Heinz III Center for Science, Economics, and the Environment, Washington DC, USA, 3–4 November 2005. See: www.fao.org/gtos/igol/docs/meeting-reports/2nd-IGOL-meeting-report-draft-v2.pdf
Jansen, L.J.M. 2005. Harmonisation of land-use class sets to facilitate compatibility and comparability of data across space and time. Paper presented at 12th CEReS International Symposium, Chiba, Japan, 13–14 December 2005.
Justice, C.O., Vermote, E., Townshend, J.R.G., DeFries, R., Roy, D., Hall, D.K., Salomonson, V.V., Privette, J.L., Riggs, G., Strahler, A., Lucht, W., Myneni, R.B., Knyazikhin, Y., Running, S.W., Nemani, R.M. Wan, Z., Huete, A.R., van Leeuwen, W., Wolfe, R.E., Giglio, L., Muller, J.-P., Lewis, P. & Barnsley, M. 1998. The Moderate Resolution Imaging Spectroradiometer (MODIS): Land remote sensing for global change research. IEEE Transactions on Geoscience and Remote Sensing, 36(4): 1212–1227.
Justice, C., Ahern, F. & Freise, A. 1999. Regional networks for implementation of the GOFC project in the tropics. Washington, D.C., USA, 15–17 March 1999. GOFC-GOLD Report 5/START Report 4. See: www.fao.org/gtos/gofc-gold/docs/GOLD_5.pdf
Justice, C., Belward, A., Morisette, J., Lewis, P., Privette, J., & Baret, F. 2000. Developments in the ‘validation’ of satellite sensor products for the study of land surface. International Journal of Remote Sensing, 21(17): 3383–3390.
Justice, C.O., Giglio, L., Korontzi, S., Owens, J., Morisette, J.T., Roy, D., Descloitres, J., Alleaume, S., Petitcoline, F. & Kaufman, Y. 2002. The MODIS fire products. Remote Sensing of Environment, 83: 244–262. See: http://rapidfire.sci.gsfc.nasa.gov/
Korontzi, S., Roy, D.P., Justice, C.O. & Ward, D.E. 2004. Modelling and sensitivity analysis of fire emissions in southern Africa during SAFARI 2000. Remote Sensing of Environment, 92(3): 376–396.
Kurvonen, L., Pulliainen, J. & Hallikainen, M. 1999. Retrieval of biomass in boreal forests from multitemporal ERS-1 and JERS-1 SAR images. IEEE Transactions on Geoscience and Remote Sensing, 37: 198–205.

REFERENCES
Laurance, W.F., Lovejoy, T.E., Vasconcelos, H.L., Bruna, E.M., Didham, R.K., Stouffer, P.C., Gascon, C., Bierregaard, R.O., Laurance, S.G. & Sampaio, E. 2002. Ecosystem decay of Amazonian forest fragments: A 22-year investigation. Conservation Biology, 16(3): 605–618.
Lee, B.S., Alexander, M.E., Hawkes, B.C., Lynham, T.J., Stocks, B.J. & Englefield, P. 2002. Information systems in support of wildland fire management decision making in Canada. Computers and Electronics in Agriculture, 37: 185–198.
Liang, S., Fang, H., Hoogenboom, G., Teasdale, J.R. & Cavigelli, M.A. 2004. Estimation of crop yield at the regional scale from MODIS observations. Proceedings of International Geoscience and Remote Sensing Symposium, vol. 3: 1625–1628.
Loveland, T.R., Reed, B.C., Brown, J.F., Ohlen, D.O., Zhu, Z., Yang, L. & Merchant, J.W. 2000. Development of a global land cover characteristics database and IGBP DISCover from 1 km AVHRR data. International Journal of Remote Sensing, 21(6/7): 1303–1330.
Mayaux, P., Strahler, A., Eva, H., Herold, M., Shefali, A., Naumov, S., Dorado, A., Di Bella, C., Johansson, D., Ordoyne, C., Kopin, I., Boschetti, L. & Belward, A. 2006. Validation of the Global Land Cover 2000 map. IEEE Transactions on Geoscience and Remote Sensing, 44(7): 1728–1739.
Minghelli-Roman, A., Cauneau, F., Marni, S. & Petit, M. 2003. From hyperspectral satellite images to decision processes: a user-oriented approach. IGARSS ‘03 – Proceedings of the Geoscience and Remote Sensing Symposium, 2003. Vol. 4: 2386–2388.
Mollicone, D., Eva, H.D. & Achard, F. 2006. Human role in Russian wild fires. Nature, 440: 436–437.Morisette, J.T., Privette, J.L. & Justice, C.O. 2002. A framework for the validation of MODIS land products.
Remote Sensing of Environment, 83(1-2): 77–96.Nebert, D.D. 2004. Developing Spatial Data Infrastructures: The GSDI Cookbook Version 2.0. GSDI Association.Plummer, S., Arino, O., Fierens, F., Borstlap, G., Chen, J., Dedieu, G., Ranera, F. & Simon, M. 2005. The Globcarbon Initiative: multi-sensor
estimation of global biophysical products for global terrestrial carbon studies. Proceedings of the MERIS (A)ATSR Workshop 2005, ESA SP-597.Plummer, S., Arino, O., Ranera, F., Tansey, K., Chen, J., Dedieu, G., Eva, H., Piccolini, I., Borstlap, G., Beusen, B., Fierens, F., Heyns W.,
Benedetti R., Lacaze R., Garrigues, S., Quaife, T., De Kauwe, Quegan, S., Raupach, M., Briggs, P., Poulter, B., Bondeau, A., Rayner, P., Schultz, M., Gobron, N. & McCallum, I. 2007. An update on the GlobCarbon Initiative: multi-sensor estimation of global biophysical products for global terrestrial carbon studies. Proceedings of the ENVISAT Symposium 2007. ESA SP-636.
Pohl, C. & Van Genderen, J.L. 1998. Multisensor image fusion in remote sensing: concepts, methods and applications. International Journal of Remote Sensing, 19(5): 823–854.
Prins, E.M., Schmetz, J., Flynn, L.P., Hillger, D.W. & Feltz, J.M. 2001. An overview of diurnal active fire monitoring using a suite of international geostationary satellites. pp. 145–170, in: F.J. Ahern, J.G. Goldammer and C.O. Justice (editors). Global and Regional Vegetation Monitoring from Space: Planning a Coordinated International Effort. SPB Academic Publishing, The Hague, The Netherlands.
Prins, E., Govaerts, Y. & Justice, C.O. 2004. Report on the Joint GOFC-GOLD Fire and CEOS LPV Working Group Workshop on Global Geostationary Fire Monitoring Applications. EUMETSAT, Darmstadt, Germany, 23–25 March 2004. GOFC-GOLD Report No. 19. See: www.fao.org/gtos/gofc-gold/docs/GOLD_19.pdf
Rodell, M., Houser, P.R., Jambor, U., Gottschalck, J., Mitchell, K., Meng, C.-J., Arsenault, K., Cosgrove, B., Radakovich, J., Bosilovich, M., Entin J.K., Walker, J.P., Lohmann, D. & Toll, D. 2004. The Global Land Data Assimilation System. Bulletin of the American Meteorological Society, 85: 381–394.
Roy, D.P., Justice, C.O., Jin, Y. & Lewis, P.E. 2005a. Prototyping a global algorithm for systematic fire-affected area mapping using MODIS time series data. Remote Sensing of Environment, 97(2): 137–162.
Roy, D.P., Landmann, T., Le Roux, J.L., Gumbo, K., Makungwa, S., Dunham, K., Du Toit, R., Mhwandagara, K., Zacarias, A., Tacheba, B., Dube, O.P., Pereira, J.M.C., Mushove, P., Morisette, J.T., Santhana Vannan, S.K., Davies, D., Frost, P.G.H. & Justice, C.O. 2005b. The Southern Africa Fire Network (SAFNet) regional burnt-area product-validation protocol. International Journal of Remote Sensing, 26(19): 4265–4292.
Roy, D.P., Trigg, S.N., Bhima, R., Brockett, B., Dube, O., Frost, P., Govender, N., Landmann, T., Le Roux, J., Lepono, T., Macuacua, J., Mbow, C., Mhwandangara, K., Mosepele, B., Mutanga, O., Neo-Mahupeleng, G., Norman, M. & Virgilo, S. 2006. The utility of satellite fire product accuracy information - perspectives and recommendations from the southern Africa fire network. IEEE Transactions on Geoscience and Remote Sensing, 44: 1928–1930.
Royal Society. 2003. Measuring Biodiversity for Conservation. Policy Document 10/03. The Royal Society, London, UK.Running, S.W., Nemani, R.R., Heinsch, F.A., Zhao, M., Reeves, M. & Hashimoto, H. 2004. A continuous satellite-derived measure of global
terrestrial primary production. BioScience, 54: 548–560.Santoro, M., Askne, J., Smith, G. & Fransson, J.E.S. 2002. Stem volume retrieval in boreal forests with ERS-1/2 interferometry.
Remote Sensing of Environment, 81(1): 19–35.Santoro, M., Eriksson, L., Askne, J. & Schmullius, C. 2006. Assessment of stand-wise stem volume retrieval in boreal forest from JERS-1 L-band
SAR backscatter. International Journal of Remote Sensing, 27(16): 3425–3454.Strahler, A., Boschetti, L., Foody, G.M., Fiedl, M.A., Hansen, M.C., Herold, M., Mayaux, P., Morisette, J.T., Stehman, S.V. & Woodcock,
C. 2006. Global Land Cover Validation: CEOS-WGCV/GOFC-GOLD report. JRC Report Series. See: http://landval.gsfc.nasa.gov/pdf/GlobalLandCoverValidation.pdf
Strand, H., Höft, R., Strittholt, J., Miles, L., Horning, N., Fosnight, E. & Turner, W. 2007. Sourcebook on Remote Sensing and Biodiversity Indicators. Secretariat of the Convention on Biological Diversity, Montreal, Technical Series No. 32. 203 p.
Sutton, P.C., Cova, T.J. & Elvidge, C.D. 2006. Mapping “exurbia” in the conterminous United States using night-time satellite imagery. Geocarto International, 21(2): 39–45.
Tansey, K., Grégoire, J.-M., Binaghi, E., Boschetti, L., Brivio, P.A., Ershov, D., Flasse, S., Fraser, R., Graetz, D., Maggi, M., Peduzzi, P., Pereira, J.M.C., Silva, J.M.N., Sousa, A. & Stroppiana, D. 2005. A global inventory of burned areas at 1 km resolution for the year 2000 derived from SPOT VEGETATION data. Climatic Change, 67(2): 345–377.
Teder, T., Roosaluste, M., Zobel, K., Partel, M., Kolag, U. & Zobel, M. 2007. Monitoring of biological diversity: a common-ground approach. Conservation Biology, 21(2): 313–317.
Terborgh, J. & van Schaik, C. 2002. Why the world need parks. pp. 3–14, in: J. Terborgh, C. van Schaik, L. Davenport and M. Rao (editors). Making Parks Work. Island Press, Washington DC, USA.
Toenges-Schuller, N., Stein, O., Rohrer, F., Wahner, A., Richter, A., Burrows, J.P., Beirle, S., Wagner, T., Platt, U. & Elvidge, C.D. 2006. Global distribution pattern of anthropogenic nitrogen oxide emissions: Correlation analysis of satellite measurements and model calculations. Journal of Geophysical Research, 111: Art. D05312.
Townshend, J.R. & Brady, M.A. 2006. A revised strategy for GOFC-GOLD. GOFC-GOLD Report, No. 24.Townshend, J.R.G. & Justice, C.O. 2002. Towards operational monitoring of terrestrial systems by moderate-resolution remote sensing.
Remote Sensing of Environment, 83(1–2): 351–359.UN. 2002. Report of the World Summit on Sustainable Development. Johannesburg, South Africa, 26 August–4 September 2002 (UN Doc. A/
CONF.199/20).UN. 2004. World Population Prospects.UNCHS [United Nations Centre for Human Settlements - HABITAT]. 2001. The State of the World’s Cities 2001. UN, Nairobi, Kenya.UNEP [United Nations Environment Programme]. 2005. Millenium Ecosystem Assessment. See: www.maweb.org/en/index.aspx
63

IgosL A N D
USGS-EDC. 2003. Multi-Resolution Land Characteristics 2001 (MRLC2001). EROS Data Center, U.S. Geological Survey. See: http://edc.usgs.gov/products/satellite/mrlc2000.html
von Braun, J., Rosegrant, M.W., Pandya-Lorch, R., Cohen, M.J., Cline, S.A., Brown, M.A. & María Soledad Bos, M. 2005. New risks and opportunities for food security scenario analyses for 2015 and 2050 2020 Discussion Paper, No. 39. International Food Policy Research Institute (IFPRI), Washington DC, USA. Available at: www.ifpri.org/2020/dp/dp39/2020dp39.pdf
Wagner, W., Luckman, A., Vietmeier, J., Tansey, K., Baltzter, H., Schmullius, C., Davidson, M., Gaveau, D., Gluck, M., Le Toan, T., Quegan, S., Shvidenko, A., Wiesmann, A. & Yu, J.J. 2003. Large-scale mapping of boreal forest in SIBERIA using ERS tandem coherence and JERS backscatter data. Remote Sensing of Environment, 85: 125–144.
Wooster, M.J., Roberts, G., Perry, G. & Kaufman, Y.J. 2005. Retrieval of biomass combustion rates and totals from fire radiative power observations: Calibration relationships between biomass consumption and fire radiative energy release. Journal of Geophysical Research, 110: Art. D21111.
64

ACRONYMS
AATSR Advanced Along-Track Scanning Radiometer
ACE Atmospheric Chemistry Experiment or Aerosol Characterisation Experiment
AGPS Seed and Plant Genetic Resources Service (FAO)
ALOS Advanced Land Observing Satellite (JAXA)
ALOS-PALSAR Phased Array Type L-band Synthetic Aperture Radar of the Advanced Land Observing Satellite
AQUA-MODIS Moderate Resolution Imaging Spectroradiometer on the NASA Aqua satellite
AQUASTAT Information System on Water and Agriculture (FAO)
ASI Agenzia Spaziale Italiana (Italian Space Agency)
ASTER Advanced Spaceborne Thermal Emission and Reflection Radiometer
ATSR Along Track Scanning Radiometer
AVHRR Advanced Very High Resolution Radiometer
AVHRR GAC AVHRR Global Area Coverage
AwiFS Advanced Wide Field Sensor
BNU Beijing Normal University
CAAS Chinese Academy of Agricultural Sciences
CAS Chinese Acadamy of Sciences
CBD Convention on Biodiversity (UN)
CBERS China-Brazil Earth Resource Satellite
CEOS Committee on Earth Observation Satellites
CEOS LPV Committee on Earth Observation Satellites, Land Product Validation working group
CEOS WGISS Committee on Earth Observation Satellites, Working Group on Information Systems and Services
CESBIO Centre d'Etudes Spatiales de la BIOsphère
CIESIN The Center for International Earth Science Information Network
CNES Centre national d’études spatiales
COOS Coastal Ocean Observing Systems
Corine COoRdination of INformation on the Environment
CRTS Centre Royal de Télédétection Spatiale (Morocco)
CSA Canadian Space Agency
CSIR Council for Scientific and Industrial Research (South Africa)
DEM Digital Elevation Model
DLR Deutsches Zentrums für Luft- und Raumfahrt (Aerospace Research Center and Space Agency - Germany)
DMC Satellites Disaster Monitoring Constellation
DMSP OLS Defense Meteorological Satellite Program Operational Linescan System
DNB Day and Night Band
DSM Digital Surface Model
DSS Decision Support System
DTM Digital Terrain Model
DUP Data User Programme (ESA)
EDC DAAC EROS Data Center Distributed Active Archive Center
EEA European Environment Agency
EMBRAPA The Brazilian Agricultural Research Corporation
ENVISAT-ASAR Advanced Synthetic Aperture Radar of ENVISAT
ENVISAT MERIS Medium Resolution Imaging Spectrometer of ENVISAT
EO Earth Observations
EO1 Earth Observing Mission 1
EROS Earth Resources Observation Systems
ERS European Remote-Sensing satellite
ESA European Space Agency
ESA-FAO Agriculture and Development Economic Division (FAO)
EASF Food Security and Agriculture Projects Analysis Service (FAO)
ESSG Global Statistics Servive (FAO)
ESSP Earth System Science Partnership
65

IgosL A N D
ESTG Global lInformation and Early Warning system Service (FAO)
ETM+ Enhanced Thematic Mapper
EUMETSAT European Organisation for the Exploitation of Meteorological Satellites
FAO Food and Agriculture Organization of the United Nations
FAO/GIEWS Global Information and Early Warning System (FAO)
fAPAR Fraction of Absorbed Photosynthetically Active Radiation
FEWS Famine Early Warning System (USAID)
FOMR Forest Resources Development Service (FAO)
FPAR Fraction of Photosynthetically Active Radiation
FRA Global Forest Resources Assessment (FAO)
FRP Fire Radiative Power
GAC Global Area Coverage
GAEZ Global Agro-Ecological Zones
GBIF The Global Biodiversity Information Facility
GCOS Global Climate Observing System
GCP Global Carbon Project
GECAFS Global Environmental Change and Food Systems
GEF Global Environmental Facility
GEOSS Global Earth Observation System of Systems
GHG Greenhouse gas
GIEWS Global Information and Early Warning System (FAO)
GLC2000 Global Landcover Classification for the year 2000
GLOBSCAR ATSR Global Burned Forest Mapping
GLP Global Land Project
GMES Global Monitoring for Environment and Security
GMFS Global Monitoring for Food Security
GOES Geostationary Operational Environmental Satellites
GOFC-GOLD Global Observation of Forest and Land Cover Dynamics (GTOS)
GOOS Global Ocean Observing System
GPP Gross Primary Production
GPS Global Positioning System
GPW Gridded Population of the World
GSDI Global Spatial Data Infrastructure
GSE GMES Service Element
GTN-L Global Terrestrial Network on Lakes and reservoirs (GCOS/GTOS)
GTOPO Global Topography at 30 arc seconds (DEM)
GTOS Global Terrestrial Observing System
GUS GMES Urban Services
ICESAT Ice, Cloud,and land Elevation Satellite
IFPRI International Food Policy Research Institute
IGBP International Geosphere-Biosphere Programme
IGBP-DIS IGBP Data and Information System
IGBP-START IGBP System for Analysis, Research, and Training
IGOL Integrated Global Observation of Land
IGOS The Integrated Global Observing Strategy
IGSNRR Institute of Geographic Sciences and Natural Resources Research
IHDP International Human Dimensions Programme
IIASA International Institute for Applied Systems Analysis
IKI Space Research Institute (Russian Academy of Science, Moscow)
IKONOS Commercial earth observation satellite
ILTER The International Long Term Ecological Research [Network]
InSAR Interferometric Synthetic Aperture Radar
66

ACRONYMS
IPCC Intergovernmental Panel on Climate Change
IR infrared
IRS Indian Remote Sensing Satellite
IRSA-CAS Institute of Remote Sensing Applications - Chinese Academy of Sciences
ISRO Indian Space Research Organisation
ITIS Integrated Taxonomic Information System
ITRF International Terrestrial Reference Frame
IUCN World Conservation Union
IUSS International Union of Soil Sciences
JAXA Japan Aerospace Exploration Agency
JERS-1 Japanese Earth Resource Sensing satellite 1
JRC The Joint Research Centre of the European Commission
LAI Leaf Area Index
Landsat Land Remote Sensing Satellite
LCCS Land Cover Classification System
LDCM Landsat Data Continuity Mission
LIDAR Light Detection and Ranging
lidar Laser Imaging Detection and Ranging
LTAP Long Term Acquisition Plan for Landsat 7
LUCC Land-Use and Land-Cover Change
LULUCF Land Use, Land-Use Change and Forestry
MA Millenium Ecosystem Assessment
MDG Millennium Development Goal(s)
METOP Polar Orbiting Meteorological Satellites
MIR Mid-infrared
MISR Multi-angle Imaging SpectroRadiometer
MIT Massachusetts Institute of Technology.
MODIS Moderate-resolution Imaging Spectroradiometer
MRLC2001 Multi-Resolution Land Characteristics 2001
MSG METEOSAT Second Generation
NASA National Aeronautics and Space Administration
NDVI Normalized Difference Vegetation Index
NEON The National Ecological Observatory Network
NGA National Geospatial-Intelligence Agency
NGO non-governmental organization
NIMA National Imagery and Mapping Agency
NIR near-infrared
NOAA The National Oceanic and Atmospheric Administration
NPOESS The National Polar-orbiting Operational Environmental Satellite System
NPOESS-VIIRS The Visible Infrared Imager Radiometer Suite of NPOESS
NRCE Environment Assessment and Management Unit (FAO)
NREL National Renewable Energy Laboratory
NRLA Land Tenure and Management Unit (FAO)
NRSCC National Remote Sensing Center of China
OGC The Open Geospatial Consortium
OLS operational Linescan System (DMSP)
PALSAR Phased Array Type L-band Synthetic Aperture Radar
PRISM The Panchromatic Remote-sensing Instrument for Stereo Mapping (JAXA)
SAGE Stratospheric Aerosol & Gas Experiment
SAR Synthetic Aperture Radar
SLC Scan Line Corrector
SOTER The Soil and Terrain Digital Database
67

IgosL A N D
68
SPOT-HRV Satellite Pour l'Observation de la Terre - High Resolution Visible
SRTM Shuttle Radar Topographic Mission
SWIR Short-wavelength infrared
TEMS The Terrestrial Ecosystem Monitoring Sites database
TIN Triangulated irregular network
TIR Thermal Infrared
TM Thematic Mapper
TREES Tropical Ecosystems Environment Observations by Satellite
UN United Nations
UNCBD United Nations Convention on Biological Diversity
UNCCD United Nations Convention to Combat Desertification
UNCED United Nations Conference on Environment and Development
UNDP United Nations Development Programme
UNECE United Nations Economic Commission for Europe
UNEP United Nations Environment Programme
UNESCO United Nations Educational, Scientific and Cultural Organization
UNFCCC United Nations Framework Convention on Climate Change
URBEX Urban Expansion monitoring programme of ESA
USAID United States Agency for International Development
USDA United States Department of Agriculture
USDA/FAS United States Department of Agriculture / Foreign Agricultural Service
USGS US Geological Survey
VIIRS Visible/Infrared Imager/Radiometer Suite
WCMC World Conservation Monitoring Centre
WCPA World Commission on Protected Areas (IUCN)
WCRP World Climate Research Programme
WCS Wildlife Conservation Society
WGISS [CEOS] Working Group on Information Systems and Services
WGS 84 World Geodetic System 1984
WHYCOS World Hydrological Cycle Observing System
WMO World Meteorological Organization
WRI World Resources Institute
WSSD World Summit on Sustainable Development (UN)
WWF World Wildlife Fund
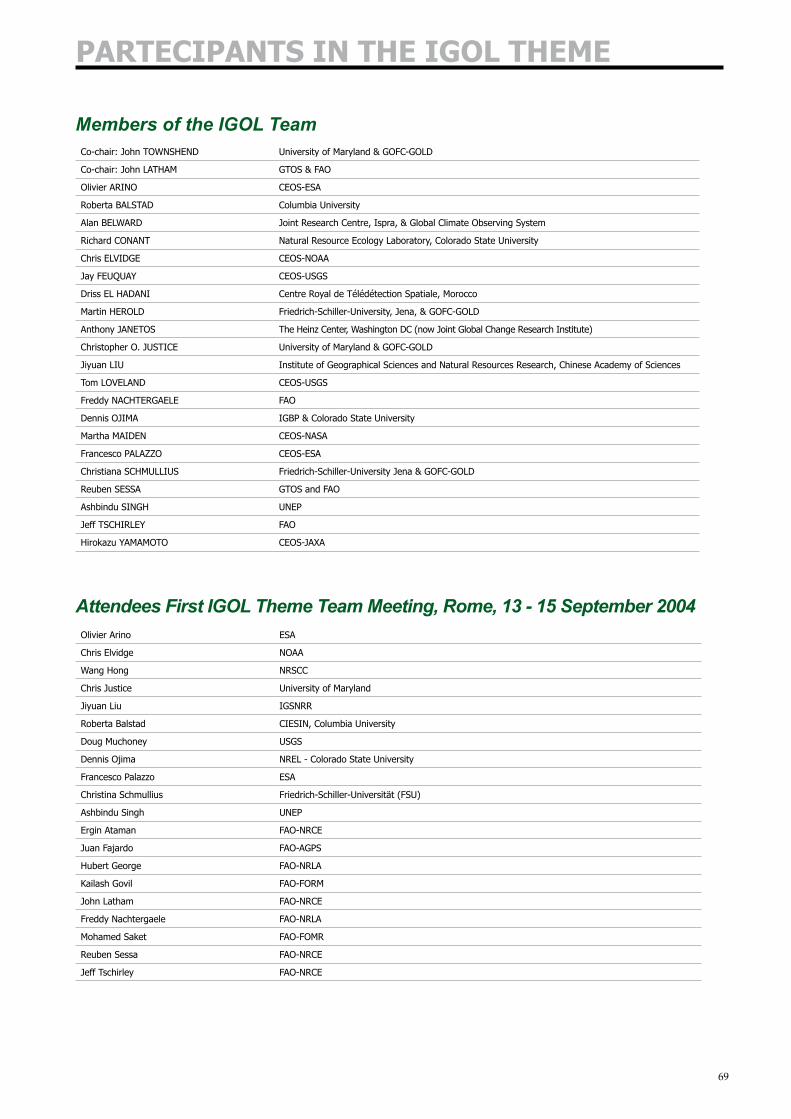
PARTECIPANTS IN THE IGOL THEME
Members of the IGOL TeamCo-chair: John TOWNSHEND University of Maryland & GOFC-GOLD
Co-chair: John LATHAM GTOS & FAO
Olivier ARINO CEOS-ESA
Roberta BALSTAD Columbia University
Alan BELWARD Joint Research Centre, Ispra, & Global Climate Observing System
Richard CONANT Natural Resource Ecology Laboratory, Colorado State University
Chris ELVIDGE CEOS-NOAA
Jay FEUQUAY CEOS-USGS
Driss EL HADANI Centre Royal de Télédétection Spatiale, Morocco
Martin HEROLD Friedrich-Schiller-University, Jena, & GOFC-GOLD
Anthony JANETOS The Heinz Center, Washington DC (now Joint Global Change Research Institute)
Christopher O. JUSTICE University of Maryland & GOFC-GOLD
Jiyuan LIU Institute of Geographical Sciences and Natural Resources Research, Chinese Academy of Sciences
Tom LOVELAND CEOS-USGS
Freddy NACHTERGAELE FAO
Dennis OJIMA IGBP & Colorado State University
Martha MAIDEN CEOS-NASA
Francesco PALAZZO CEOS-ESA
Christiana SCHMULLIUS Friedrich-Schiller-University Jena & GOFC-GOLD
Reuben SESSA GTOS and FAO
Ashbindu SINGH UNEP
Jeff TSCHIRLEY FAO
Hirokazu YAMAMOTO CEOS-JAXA
Attendees First IGOL Theme Team Meeting, Rome, 13 - 15 September 2004Olivier Arino ESA
Chris Elvidge NOAA
Wang Hong NRSCC
Chris Justice University of Maryland
Jiyuan Liu IGSNRR
Roberta Balstad CIESIN, Columbia University
Doug Muchoney USGS
Dennis Ojima NREL - Colorado State University
Francesco Palazzo ESA
Christina Schmullius Friedrich-Schiller-Universität (FSU)
Ashbindu Singh UNEP
Ergin Ataman FAO-NRCE
Juan Fajardo FAO-AGPS
Hubert George FAO-NRLA
Kailash Govil FAO-FORM
John Latham FAO-NRCE
Freddy Nachtergaele FAO-NRLA
Mohamed Saket FAO-FOMR
Reuben Sessa FAO-NRCE
Jeff Tschirley FAO-NRCE
69

IgosL A N D
Attendees Second IGOL Theme Team Meeting, Reston, Virginia, USA, 20 - 22 July 2005Co-Chair: John Townshend GOFC-GOLD
Co-Chair: John Latham GTOS
Olivier Arino ESA
Roberta Balstad CIESEN
Richard Conant Colorado State
Chris Elvidge NOAA
Jay Feuquay USGS
Driss El Hadani CRTS
Angas Hopkins FAO
Chris Justice GOFC-GOLD
Tom Loveland USGS
Martha Maiden NASA
Doug Muchoney USGS
Dennis Ojima IGBP
Francesco Palazzo ESA
Christina Schmullius GOFC-GOLD
Asbindu Singh UNEP
Hirokazu Yamamoto JAXA
Special meeting on observational priorities for conservation and biodiversity, Washington DC, USA, 3 - 4 November 2005John Townshend University of Maryland
Rich Conant Colorado State University
Lera Miles UNEP WCMC
Robert Hoft CBD Secretariat
Fred Stolle WRI
Doug Muchoney USGS
Roger Sayre USGS
Dennis Grossman NatureServe
Roberta Balstad Columbia University
Karl Didier WCS
John Musinsky Conservation International
Mark Steininger Conservation International
William Settle FAO-AGPP
Benjamin White University of Maryland
Michael Case WWF
Bob Scholes CSIR
Angas Hopkins FAO-NRCE
Tony Janetos Heinz Center
Woody Turner NASA
70
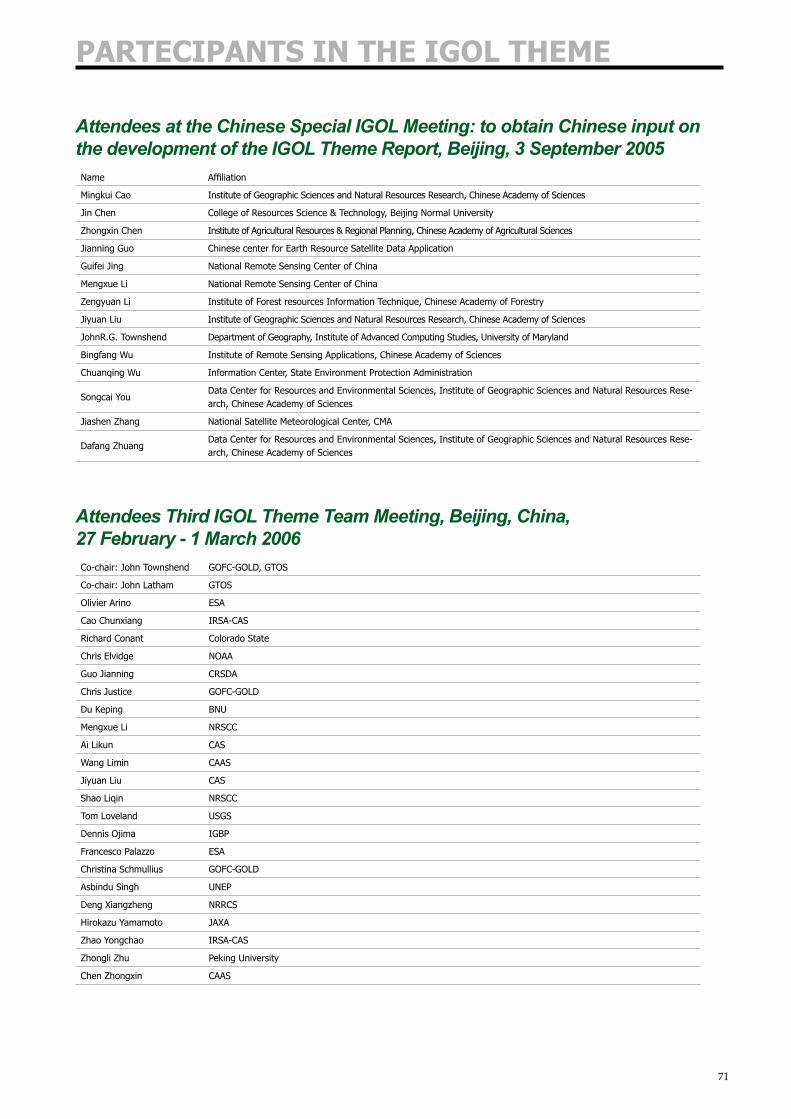
PARTECIPANTS IN THE IGOL THEME
Attendees at the Chinese Special IGOL Meeting: to obtain Chinese input on the development of the IGOL Theme Report, Beijing, 3 September 2005Name Affiliation
Mingkui Cao Institute of Geographic Sciences and Natural Resources Research, Chinese Academy of Sciences
Jin Chen College of Resources Science & Technology, Beijing Normal University
Zhongxin Chen Institute of Agricultural Resources & Regional Planning, Chinese Academy of Agricultural Sciences
Jianning Guo Chinese center for Earth Resource Satellite Data Application
Guifei Jing National Remote Sensing Center of China
Mengxue Li National Remote Sensing Center of China
Zengyuan Li Institute of Forest resources Information Technique, Chinese Academy of Forestry
Jiyuan Liu Institute of Geographic Sciences and Natural Resources Research, Chinese Academy of Sciences
JohnR.G. Townshend Department of Geography, Institute of Advanced Computing Studies, University of Maryland
Bingfang Wu Institute of Remote Sensing Applications, Chinese Academy of Sciences
Chuanqing Wu Information Center, State Environment Protection Administration
Songcai YouData Center for Resources and Environmental Sciences, Institute of Geographic Sciences and Natural Resources Rese-arch, Chinese Academy of Sciences
Jiashen Zhang National Satellite Meteorological Center, CMA
Dafang ZhuangData Center for Resources and Environmental Sciences, Institute of Geographic Sciences and Natural Resources Rese-arch, Chinese Academy of Sciences
Attendees Third IGOL Theme Team Meeting, Beijing, China, 27 February - 1 March 2006Co-chair: John Townshend GOFC-GOLD, GTOS
Co-chair: John Latham GTOS
Olivier Arino ESA
Cao Chunxiang IRSA-CAS
Richard Conant Colorado State
Chris Elvidge NOAA
Guo Jianning CRSDA
Chris Justice GOFC-GOLD
Du Keping BNU
Mengxue Li NRSCC
Ai Likun CAS
Wang Limin CAAS
Jiyuan Liu CAS
Shao Liqin NRSCC
Tom Loveland USGS
Dennis Ojima IGBP
Francesco Palazzo ESA
Christina Schmullius GOFC-GOLD
Asbindu Singh UNEP
Deng Xiangzheng NRRCS
Hirokazu Yamamoto JAXA
Zhao Yongchao IRSA-CAS
Zhongli Zhu Peking University
Chen Zhongxin CAAS
71

IgosL A N D
Participants in the Agricultural Monitoring Meeting convened for the Integrated Global Observations for Land (IGOL) Theme, Rome, Italy, 8 - 11 March 2006Co-chair: Chris Justice University of Maryland, USA
Co-chair: Henri Josserand FAO-ESTG
Assaf Anyamba NASA
Dominic Ballayan FAO-ESSG
Sergey Bartalev IKI
Inbal Becker-Reshef University of Maryland, USA
Patrice Bicheron CNES
Lieven Byderkerke GMFS
Elisabetta Carfagna University of Bologna
Zhongxin Chen CAAS
Richard Conant Colorado State University
Gerard Dedieu CESBIO
Pierre Defourny University of Louvain
Paola De Salvo WFP
Bradley Doorn USDA/FAS
Hugh Eva GEM-JRC
Gary Eilerts USAID
Thomas Gabriell FAO-FSAU
Hubert George FAO-NRLA
Francesco Holecz Sarmap
Jiyuan Liu CAS
Michel Massart MARS-FOOD
Evaristo Eduardo de Miranda EMBRAPA
Doug Muchoney USGS/GEOSS
Thierry Negre MARS-FOOD, JRC
Francesco Palazzo ESA
Prabhu Pingali FAO-ESA
Curt Reynolds USDA/FAS
Gabriel Senay EROS
Reuben Sessa FAO-NRCE
Edwin Sheffner NASA
Mark Smulders FAO-ESAF
Jim Verdin USGS
72