
THE DESIGN AND BEHAVIOUR OF CRUSH PILLARS ON · PDF fileiii CONTENTS 1. INTRODUCTION 1 2....
61
i Thesis Summary THE DESIGN AND BEHAVIOUR OF CRUSH PILLARS ON THE MERENSKY REEF MICHAEL DU PLESSIS
Transcript of THE DESIGN AND BEHAVIOUR OF CRUSH PILLARS ON · PDF fileiii CONTENTS 1. INTRODUCTION 1 2....

i
Thesis Summary
THE DESIGN AND BEHAVIOUR OF CRUSH PILLARS ON
THE MERENSKY REEF
MICHAEL DU PLESSIS

ii
ABSTRACT
Crush pillars are extensively used in the platinum mines of South Africa as part of the stope support in
intermediate depth tabular mining stopes. Crush pillar design should ensure that the pillars crush when
formed at the mining face. This behaviour is typically achieved when the pillars have a width to height ratio
of approximately 2:1. Once crushed, the residual stress state of the pillars provide a local support function.
However, in most cases effective pillar crushing is not achieved, resulting in pillar seismicity. As the area
produces approximately 70% of the world’s platinum group metals, it is critical that layouts and pillar design
are optimised to ensure safety and sustainable production. The objective of the research was to determine the
parameters which influence crush pillar behaviour. A limit equilibrium constitutive model was proposed to
investigate the behaviour of the pillars. The model, implemented in a displacement discontinuity boundary
element code provided insights into the stress evolution of a crush pillar. The results indicated that the stress
on the pillar depends on its position relative to the mining face, the effect of over-sized pillars, the impact of
geological structures, layout, rock mass parameters and mining depth.
An underground mining trial was conducted at Lonmin Platinum to quantify the behaviour of crush pillars.
This was the most comprehensive monitoring of these pillars ever conducted in the platinum industry. The
observed behaviour of the pillars agreed well with the findings of the measurements and the pillar fracturing
profiles obtained at various stages of the pillar forming cycle. A sequence and mode of pillar failure could be
identified. The results indicated that a pillar reaches a residual stress state when separated from the mining
face. The pillar also experiences a secondary reduction in stress when new pillars are formed. However, at
some point, the pillars experienced no further reduction in stress while the pillars continue to deform.
Ongoing convergence was also recorded after all mining was stopped.
A numerical model was used to back analyse the behaviour of the underground trial site which consisted of a
mined area of approximately 22 000 m2 containing 55 crush pillars. To date, no numerical modelling of a
mine-wide tabular layout, which explicitly included a large number of crush pillars, had been reported. This
work is therefore considered a major novel contribution to this field of research. Both the observed and
measured behaviour of the crush pillars in the trial site could be replicated by the model. The findings
validated the use of the limit equilibrium model implemented in a displacement discontinuity boundary
element code to simulate the behaviour of crush pillars on a large scale.
This work has the potential to significantly influence the mining industry on the application of crush pillars.
It could therefore increase safety and assist production in the platinum mines of South Africa.

iii
CONTENTS
1. INTRODUCTION 1
2. SIMULATION OF CRUSH PILLAR BEHAVIOUR 6
2.1. An overview of the TEXAN code 6
2.2. Formulation of the limit equilibrium model 7
2.3. Analytical solution for the average pillar stress (APS) of a failed 2D pillar 11
2.4. Simulating a crush pillar layout 12
2.5. Assessment of the derived analytical solution to determine the residual stress of a completely failed
pillar 20
3. UNDERGROUND TRIAL 21
3.1. Visual observations 26
3.2. Measurements 36
4. BACK ANALYSES OF THE UNDERGROUND TRIAL 48
5. CONCLUSION 55
6. REFERENCES 57
The main body of the thesis summary contains 9813 words.

1
1. INTRODUCTION
Mining practices are aimed at maximising the extraction of a particular orebody without compromising
safety. Crush pillar mining appears to be a method unique to South African hard rock mines. These pillar
systems are used in shallow and intermediate depth platinum stopes. It allows for a higher extraction than
what can typically be achieved with a conventional elastic non-yield pillar system. The pillar system must,
however, be used in conjunction with a regional pillar system. Crush pillar dimensions are generally selected
to give a width to height ratio (w:h) of approximately 2 (Ryder and Jager, 2002). This w:h ratio should
ensure that the pillars fail while being cut. Once the pillar has failed in a stable manner, the residual strength
of the pillar contributes to the support requirements by carrying the deadweight load to the height of the
uppermost parting on which separation is expected to occur (can be as much as 45 m above the reef). The
pillars therefore prevent the occurrence of large scale collapses (backbreaks). Closely spaced support
elements are typically used between rows of crush pillars to provide additional in-panel support.
Figure 1.1: Photograph of a crush pillar from a trial site on Lonmin.

2
A typical mining configuration for an in-stope pillar layout in a hard rock narrow tabular mine (stoping
width = 0.9 – 2 m) is shown in Figure 1.2. The pillars are separated in the direction of mining by a holing,
2 – 4 m wide. Inter-pillar spans vary between 20 – 35 m. An off-reef haulage links to the reef horizon via a
cross-cut and travelling way.
Figure 1.2: Example of an in-stope pillar layout (plan view) for narrow tabular reef mining. The
diagram indicates a down-dip split-panel layout as used in the trial mining section on Lonmin
(average dip of approximately 8⁰).
3
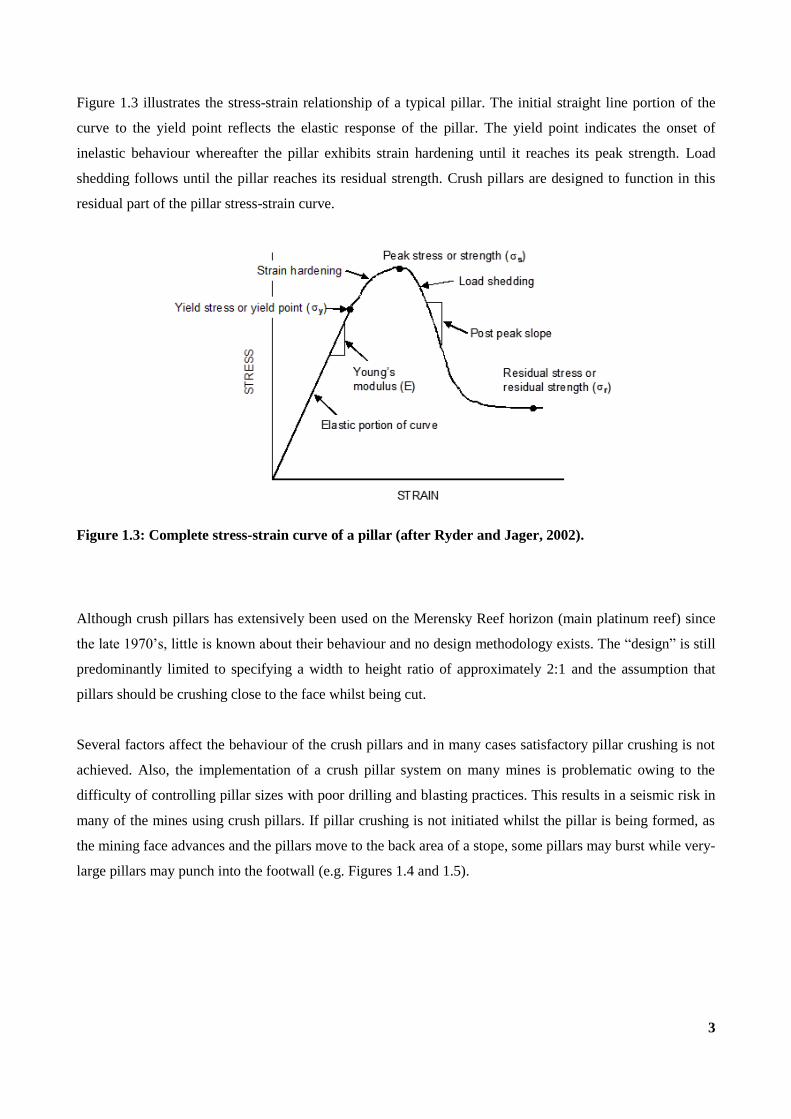
Figure 1.3 illustrates the stress-strain relationship of a typical pillar. The initial straight line portion of the
curve to the yield point reflects the elastic response of the pillar. The yield point indicates the onset of
inelastic behaviour whereafter the pillar exhibits strain hardening until it reaches its peak strength. Load
shedding follows until the pillar reaches its residual strength. Crush pillars are designed to function in this
residual part of the pillar stress-strain curve.
Figure 1.3: Complete stress-strain curve of a pillar (after Ryder and Jager, 2002).
Although crush pillars has extensively been used on the Merensky Reef horizon (main platinum reef) since
the late 1970’s, little is known about their behaviour and no design methodology exists. The “design” is still
predominantly limited to specifying a width to height ratio of approximately 2:1 and the assumption that
pillars should be crushing close to the face whilst being cut.
Several factors affect the behaviour of the crush pillars and in many cases satisfactory pillar crushing is not
achieved. Also, the implementation of a crush pillar system on many mines is problematic owing to the
difficulty of controlling pillar sizes with poor drilling and blasting practices. This results in a seismic risk in
many of the mines using crush pillars. If pillar crushing is not initiated whilst the pillar is being formed, as
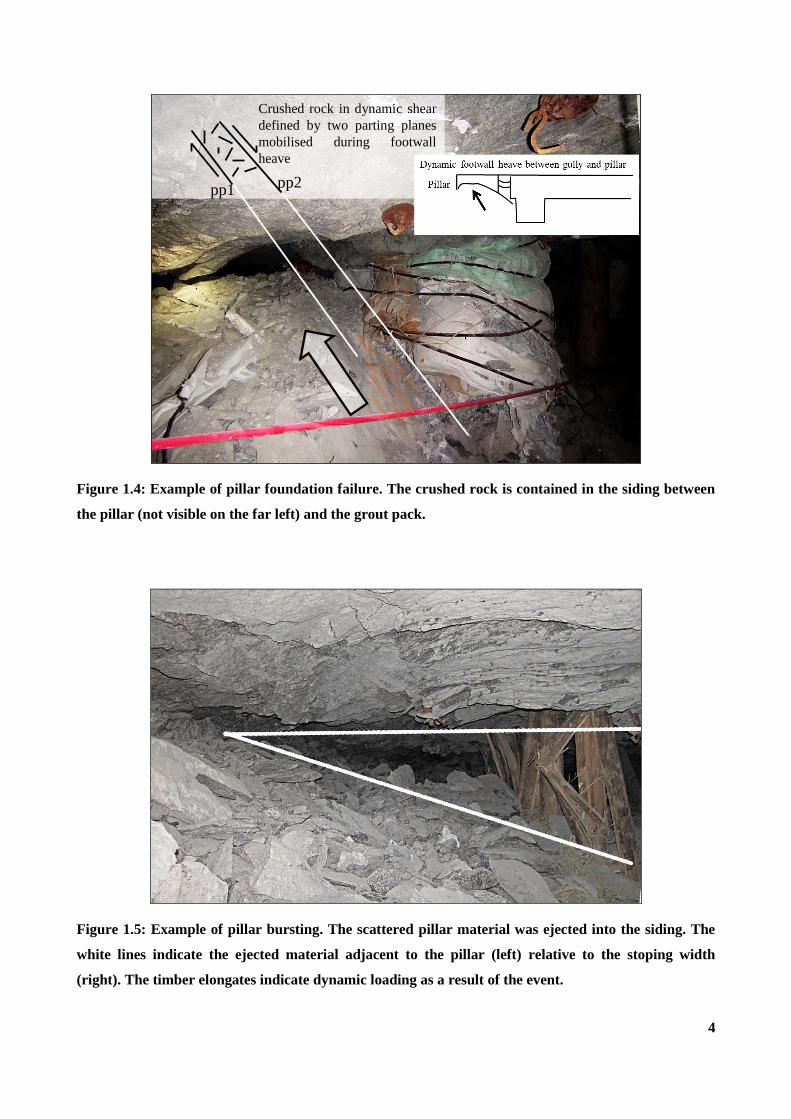
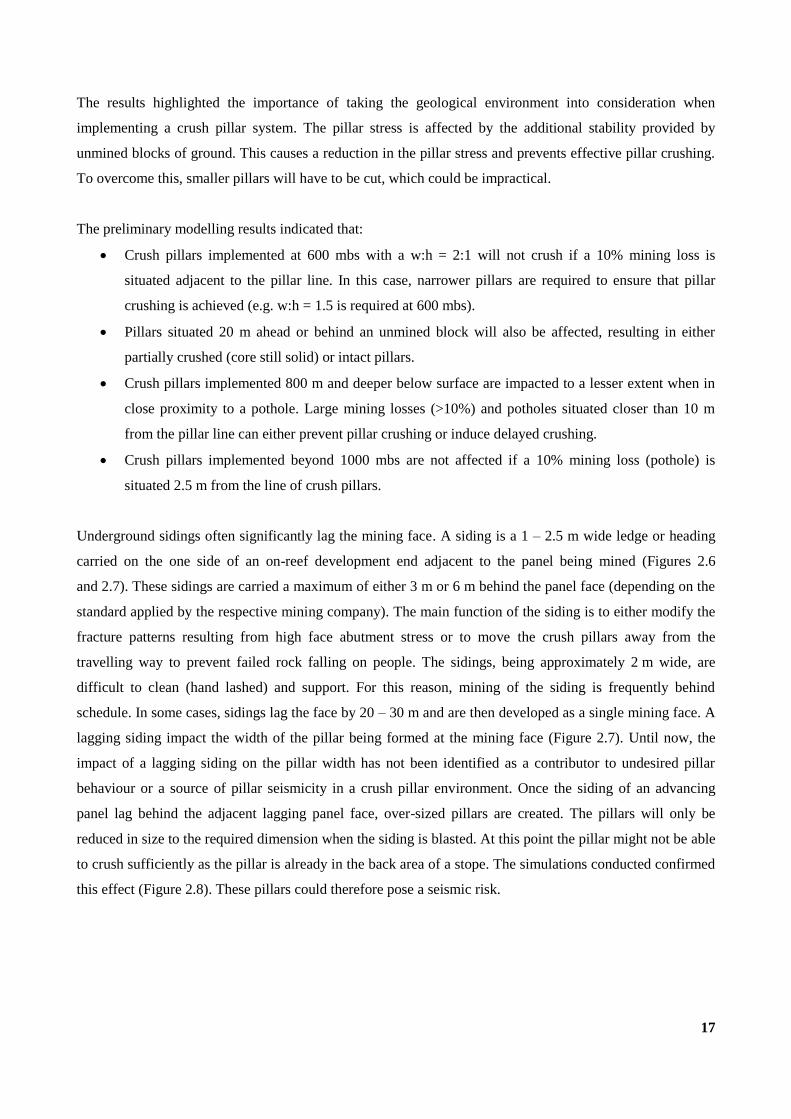
the mining face advances and the pillars move to the back area of a stope, some pillars may burst while very-
large pillars may punch into the footwall (e.g. Figures 1.4 and 1.5).
4
Crushed rock in dynamic shear
defined by two parting planes
mobilised during footwall
heave
pp2pp1
Figure 1.4: Example of pillar foundation failure. The crushed rock is contained in the siding between
the pillar (not visible on the far left) and the grout pack.
Figure 1.5: Example of pillar bursting. The scattered pillar material was ejected into the siding. The
white lines indicate the ejected material adjacent to the pillar (left) relative to the stoping width
(right). The timber elongates indicate dynamic loading as a result of the event.

5
The objective of this study is to address many of the shortcomings regarding the understanding of crush
pillar behaviour. It is necessary to understand how the pillars behave and to investigate the parameters which
will affect pillar crushing. On most operations where crush pillars are used, pillar crushing is not achieved.
Crush pillars are implemented at relatively shallow depths, the pillar dimensions have remained essentially
unchanged over many years and the impact of regional pillars and geological losses contributing to the
regional behaviour of the rock mass are overlooked. Furthermore, in many cases the pillar system is the
source of seismicity.
The study considered the risk of pillar instability and focussed on establishing design criteria with regard to
pillar size and stress, namely:
The effect of pillar width,
The impact of mining depth on pillar crushing,
Determining the peak crush pillar strength,
Determining the residual crush pillar strength,
Determining if and how convergence is related to pillar crushing,
The effect of oversized pillars,
The impact of geological and mining losses on pillar crushing.
The outcome of the research provided an improved understanding of the behaviour of crush pillars on the
Merensky Reef and the factors influencing the pillar behaviour. The pillar behaviour of other reef types is
considered beyond the scope of this study.

6
2. SIMULATION OF CRUSH PILLAR BEHAVIOUR
A major challenge in the design of pillar layouts is to integrate an appropriate representation of the pillar
failure behaviour with the overall analysis of the tabular mining stress distribution. As crush pillars consist
of crushed reef material, the detailed inelastic analysis of reef crushing behaviour is most appropriately
conducted by means of non-linear finite element or finite difference models. However, for tabular
excavation layouts, stress interactions in three dimensions can be efficiently represented using a boundary
element model based on displacement discontinuity elements.
Simplification to the problem is possible if the fractured reef material is known to be concentrated within or
close to the mining horizon and does not extend appreciably into the hangingwall or footwall regions. This
will often be the case when considering the design of crush pillars in shallow mining layouts. Various
strategies have been suggested to represent non-linear seam behaviour using limit equilibrium methods
(e.g. Brummer, 1987) or the so-called “enhanced” displacement discontinuity method (Yacoub and Curran,
1999) in which reef-parallel strain components are included in the set of unknown variables that are
evaluated on the reef horizon. In this study an analytic limit equilibrium model, similar to coal seam
deformation models introduced by Barron (1984), is employed to represent the behaviour of the reef material
in pillars. Malan and Napier (2006) did a preliminary evaluation of a similar model and demonstrated that it
is feasible to model pillar crushing. The original evaluation of this model is expanded on in this section.
Salamon (1992) introduced a refinement of the Barron model which he called the “enhanced confined core
concept” of pillar strength. The focus of the study is to illustrate the value of these limit equilibrium models
when implemented in boundary element codes, such as TEXAN, to represent the behaviour of the reef
material in the pillars.
2.1. An overview of the TEXAN code
In the displacement discontinuity boundary element method, mine layouts are approximated as irregular
shaped planar cracks (or slits) where the ‘width’ of the crack, corresponding to the excavation height, is
assumed to be negligible compared to the in-plane, lateral dimensions. The TEXAN (Tabular EXcavation
ANalyser) code (Napier and Malan, 2007) utilises a general revision of this approach in which triangular or
quadrilateral element shapes are introduced in conjunction with higher order variations of the displacement
discontinuity shape functions. This facilitates an accurate evaluation of detailed stress and displacement
components close to excavation surfaces and allow for the assessment of tabular layouts which includes a
large number of pillars.

7
2.2. Formulation of the limit equilibrium model
A pillar can be divided in a large number of vertical slices (Barron, 1984). The elastic stresses acting on the
pillar can be analysed and compared to an appropriate failure criterion. Once a slice has failed, its residual
stress is calculated. This is compared to the initial elastic stress of which the difference is transferred to the
remaining unfailed slices. The successive analysis of each slice determines the depth of the failed zone, the
final stress distribution, the pillar strength and for the case of failed pillars, the residual strength.
Malan and Napier (2006) illustrated the force equilibrium of a material “slice” of a fractured pillar as shown
in Figure 2.1. The slice of fractured material has a mining height H at a distance x from the stope face. The
slice is confined by reef-parallel and reef-normal stress components s and n respectively as well as by
shear tractions .
σs(x+Δx)
SolidMined
z
Pillar edge, x=0
σs(x)
x x+Δx
H
τ
σn(x+Δx/2)
Hangingwall
Footwall
Figure 2.1: Force equilibrium of an elementary material slice between two bounding surfaces (after
Malan and Napier, 2006).
It is assumed that the edge of the pillar is at x = 0 and that the seam-parallel stress component s is uniform
over the height of the pillar and increases as x increases. From Figure 2.1 it can be inferred that the
equilibrium force balance acting on the slice of height H and unit out of plane width requires that;
xxHxxH ss 2)()( (2.1)

8
Taking the limit Δx 0, equation (2.1) can be written in the form of the differential equation;
Hdx
d s 2 (2.2)
Equation (2.2) can be solved for s if a relationship exists between and s . This can be established by
making the following assumptions:
(a) Assume that is related to the surface-normal stress n by a frictional slip condition of the form:
n ;
where μ is the friction coefficient. (2.3)
(b) Assume that n is related to the average stress s by a failure relationship of the form:
sn mC ; where C and m are specified constants. (2.4)
Substituting equations (2.4) and (2.3) into equation (2.2) yields the required differential equation as follows:
)(2
s
s mCHdx
d
(2.5)
Equation (2.5) can be integrated directly if it is written in the separable form;
dx
HmC
d
s
s
2 (2.6)
Integrating equation (2.6) yields the solution to equation (2.5) in the form;
AH
mxmC s
2)ln( (2.7)
where A is a constant that can be determined by applying the boundary condition that the average horizontal
stress s is equal to an edge constraint stress p when x = 0. Hence, substituting σs = p and x = 0 in equation
(2.7) yields;
)ln( mpCA

9
The average horizontal stress is then recovered from equation (2.7) as a function of the distance x from the
edge of the pillar in the form;
mCHmxpmCs /)/2exp()/( (2.8)
The seam-normal stress component n can be obtained by substituting the expression for s given by
equation (2.8) into equation (2.4) to yield;
)/2exp()( HmxmpCn (2.9)
It is apparent from an examination of equations (2.8) and (2.9) that the solutions for s and n become
degenerate (have zero values) if both C and p are equal to zero. In order to proceed further with the
application of the simple limit equilibrium model some explicit assumptions has to be made concerning the
choice of suitable values for C and p. In the present approach, it is assumed that p = 0 and that the average
unconfined strength of the material C, at the edge of the pillar in the failed state is equal to Cb. The
parameter Cb is therefore equivalent to the residual unconfined strength of the crushed material (UCSb). This
assumption is tenable if the pillar is able to bear some vertical load at the unsupported edge x = 0.
Specifically, from equation (2.9), the vertical load is σn = Cb when x = 0. If the pillar edge is, in fact,
free-standing then this must be the case. However, it is apparent that the depth of the failed edge zone will be
very sensitive to the exact choice of Cb.
Setting p = 0 in equations (2.8) and (2.9) and defining:
Hm /2
yields the following expressions for the horizontal and vertical stress values in the edge region:
meC x
bs /)1( (2.10)
x
bn eC (2.11)
The simple stress model depicted in Figure 2.1 has been extended by Salamon (1992) to allow for an explicit
variation of the stress components xx , yy and xz as functions of both the edge distance coordinate x and
the vertical coordinate z between the floor and roof of the pillar region. It is assumed that the material

10
satisfies a limit equilibrium relationship between the maximum and minimum local principal stress
components 1 and 3 at each point (x,z) in the failed region that is of the form;
),(),( 31 zxmzx (2.12)
The values of the principal stress components 1 and 3 can be expressed as functions of the individual
stress components xx , yy and xz which are, in turn, defined in terms of the derivatives of an Airy stress
function, ),( zx that is assumed to have the form;
)](exp[),( zfaxsx (2.13)
Substituting these expressions into equation (2.12) allows the stress components to be solved in a closed but
rather complicated form (Salamon, 1992). From the assumed relationship (2.12), it is noted that this model
assumes that the cohesive strength, C = 0, and requires the specification of a non-zero confining stress, p, at
the edge of the pillar. No allowance is made for roof or floor foundation failure processes and all stress
components increase exponentially from the pillar edge. The added complexity of this extended limit
equilibrium model is not explored in the present approach.
As pointed out by Salamon et al (2003), a Mohr-Coulomb plasticity model without strain softening
behaviour is inadequate for simulating actual pillar behaviour where rapid load shedding or “bursting” may
occur. To address this shortcoming, it is assumed that initial failure in the seam or reef is controlled by the
additional relationship:
sn mC 00 (2.14)
where 0C and 0m represent the intact strength of the pillar material. Equation (2.14) is used as well to
determine implicitly the boundaries between the pillar intact core and the failed edge regions.

11
2.3. Analytical solution for the average pillar stress (APS) of a failed 2D pillar
Equation (2.11) predicts an exponential increase in the pillar stress away from the edge towards the centre of
the pillar. In this section this model is further explored by the author to determine the stress state of a
completely failed two-dimensional pillar. This model will further on be referred to as the Du Plessis model
in this study.
If the pillar width is w and if the pillar is completely failed, by assuming that the stress profile is symmetric
around the centre of the pillar, the average stress in the pillar (APS) is given by:
w
dxAPS
w
n
2
02
(2.15)
By substituting equation (2.11) into (2.15), it follows that:
1222/
2
0 wb
w
x
b
ew
C
w
dxeCAPS
(2.16)
Substituting Hm /2 into equation (2.16), the average pillar stress can be expressed as;
1H
mw
b emw
HCAPS
(2.17)
The form of equation (2.17) suggests that the average stress for a completely failed crush pillar can be
written compactly in the following dimensionless form;
1
e
C
APS
b
(2.18)
where the constant Hmw/ represents a non-dimensional parameter that is proportional to the width
to height ratio. In the limiting case when the width w becomes very small, 0 and bCAPS . This
indicates that some caution should be exercised in using the simple limit equilibrium model for very slender
failed pillars where w < H.

12
2.4. Simulating a crush pillar layout
The objective of this section was to use a representative model of the behaviour of crush pillars in a typical
layout. The limit equilibrium model implemented in the TEXAN displacement discontinuity boundary
element (DD) code provided a numerical modelling approach that could fulfil this requirement. This
provided insights into when pillars will crush, where they will crush relative to the mining face and why
some pillars can potentially burst.
Various parameters were assessed to establish the factors governing crush pillar behaviour. These included
rock mass parameters, mining depth (stress) and pillar geometric effects such as, pillar width, pillar height
and pillar length.
The simulated layout is shown in Figure 2.2. It consists of a 30 m x 70 m stope panel with a second panel
being mined in a sequential fashion adjacent to this first panel. The layout was simulated as eight mining
steps with 7 crush pillars being formed during this process. For the second panel, the size of each mining
step was 10 m and the sizes of the crush pillars were 4 m x 6 m. A 2 m mining height was used (w:h = 2:1).
The element sizes used were 0.5 m.
The parameters used for the simulations are shown in Table 2.1. These values were chosen arbitrarily. The
intent was to establish trends regarding the pillar behaviour even though the parameters selected may not
fully represent the underground environment. A sensitivity analyses was conducted to determine the effect
of each input parameter on the behaviour of the model and simulated pillars in the layout. The results
indicated that the choice of parameters gave qualitative agreement with observed crush pillar behaviour and
historic underground measurements.

13
(0,0)(30,0) (60,0)
(0,10)
(0,20)
(0,30)
(0,40)
(0,50)
(0,60)
(0,70)(30,70)
(30,10)
(30,20)
(30,30)
(30,40)
(30,50)
(30,60)
A
B
C
D
E
F
G
(60,70)(26,70)
(26,64) (30,64)
(26,60)
(26,50)
(26,40)
(26,30)
(26,20)
(26,10)
Mining direction
a a'Mining step 1
Mining step 2
Mining step 3
Mining step 4
Mining step 5
Mining step 6
Mining step 7
Mining step 8
b
b’
D
A
B
C
E
F
G
Figure 2.2: Idealised crush pillar layout simulated with the TEXAN code. This is a plan view of a
tabular layout.
Table 2.1: Parameters used for the crush pillar simulations.
General Parameters Value
Young's modulus 70 GPa
Poisson's ratio 0.25
Stress gradient 0.03 MPa/m
Depth (metres below surface) 600 mbs
Reef dip 0°
Crush model parameters Value
Intact material strength C0 5 MPa
Crushed material strength Cb 5 MPa
Intact slope m0 5
Residual slope mb 3
Bounding friction angle φ 35°
Seam height 2 m
Seam stiffness modulus 106 MPa/m

14
Various pillar sizes were simulated using the parameter set as indicated in Table 2.1. The effect of pillar
width is illustrated in Figure 2.3. Pillars with a width to height ratio greater than two will most likely not
crush. The wider pillars will either result in pillar crushing occurring in the back area, or not crushing at all.
Figure 2.4 compares the results of three different pillar layouts, each having a different pillar width. The
results are for section a – a’ through pillar D as indicated in Figure 2.2. The figure indicates the exponential
stress increase towards the centre of the pillar. This is a key attribute of the limit equilibrium model. In the
case of oversized pillars, this could lead to excessively high stresses in the core of wide pillars where a
crushed state is not achieved. The simulated results indicated that the core of the oversized pillars were still
intact. The stress profile for the w:h = 2:1 pillar is for step 5 and just before the pillar completely crushes and
moves to a residual state in step 6 (compare results to Figure 2.3 indicating the stress development as a result
of mining). In the back area the change in stress is lower compared to the pillar being formed at the face. In
the case over-sized pillars, this may lead to violent failure in the back area of a stope if the pillar becomes
more highly stressed. These pillars could potentially burst when fully loaded or punch into the footwall
resulting in excessive footwall heave (Jager and Ryder, 1999).
0
10
20
30
40
50
60
70
80
0 1 2 3 4 5 6 7 8 9
AP
S
(MP
a)
Mining Step
Effect of pillar width on crush behaviour
2x6 Pillars 3x6 Pillars 4x6 Pillars 5x6 Pillars 6x6 Pillars
Pillar D formed during this step
w:h = 1:1
w:h = 1.5:1
w:h = 2:1
w:h = 3:1
w:h = 2.5:1
Figure 2.3: Effect of pillar width on pillar performance (600 m below surface).

15
0
50
100
150
200
250V
erti
cal
stre
ss (
MP
a)
Section a - a'
Impact of pillar width on crush pillar behaviour
(600 mbs; 2 m mining height)
w:h = 1.5:1 w:h = 2:1 w:h = 3:1
6 m wide pillar edge
4 m wide pillar edge
3 m wide pillar edge
pillar edge
Figure 2.4: Simulated vertical stress along section a – a’ (See Figure 2.2) for pillars with different w:h
ratios.
The preliminary modelling results indicated the ability of the code to simulate crush pillar behaviour. This
allowed for the investigation of various parameters influencing the behaviour of crush pillars as found in
typical mine layouts. The impact of the rock and pillar properties, layout parameters, mining sequence and
the effect of off-reef structures in a layout could be investigated.
Design guidelines were derived from the preliminary analyses. The preliminary results based on the assumed
model parameters indicated that:
A crush pillar system should not be implemented at depths shallower than 600 m below
surface (mbs).
A maximum width to height ratio of 2:1 is required to ensure that the slender in-stope pillars crush at
the face whilst they are being cut.
If crush pillars are to be implemented at depths shallower than 600 mbs, the width of the pillars will
have to be reduced (e.g. w:h = 1.5 is required at 400 mbs). This might not be practical to implement
as pillar dimensions must also cater for out-of-line mining and blast effects. Furthermore the overall
behaviour of the pillars could still be effected by the influence of mining losses and geological
features. A minimum practical pillar width of 2 m will only crush at 600 mbs (w:h = 2:1).
Pillar length does not appear to have a significant impact on crush pillar behaviour for pillar width to
length ratios (w:l) of up to four.

16
The effect of unmined blocks of ground or geological losses on crush pillar behaviour, have up to now, not
been considered as factors prohibiting pillar crushing or inducing pillar seismicity. For this reason it was
included in the numerical analyses.
In the platinum mines, non-mineable blocks of ground are left in-situ where poor ground conditions prevail
or geological features (such as potholes) are intersected. A pothole can be described as an approximately
circular area where the reef slumps and pinches to such an extent that regular mining cannot be conducted.
Potholes at the Lonmin site vary in size from 5 - 420 m in diameter (Figure 2.5). Most of the pothole
diameters range between 20 - 100 m. The spans between adjacent potholes, in the majority of cases, are less
than 100 m.
Figure 2.5: Seismic survey indicating density of potholes along the Karee block (area ≈ 6 km x 6 km).
The potholes are indicated by the yellow circles.
To quantify the effect of a pothole or mining loss adjacent to a line of crush pillars, the idealised crush pillar
layout (Figure 2.2) was adjusted to take these losses into consideration. The unmined block was simulated as
a square block of which the dimensions [(Xm) x (Ym)] were governed by the percentage extraction locked
up by the block defining mining step 1 [e.g. Pothole area (10m x 10m) ≈ 5%]. Underground potholes or
mining losses may be present at various positions throughout a panel. Simulations were conducted to
determine the impact of this on crush pillar behaviour.
17
The results highlighted the importance of taking the geological environment into consideration when
implementing a crush pillar system. The pillar stress is affected by the additional stability provided by
unmined blocks of ground. This causes a reduction in the pillar stress and prevents effective pillar crushing.
To overcome this, smaller pillars will have to be cut, which could be impractical.
The preliminary modelling results indicated that:
Crush pillars implemented at 600 mbs with a w:h = 2:1 will not crush if a 10% mining loss is
situated adjacent to the pillar line. In this case, narrower pillars are required to ensure that pillar
crushing is achieved (e.g. w:h = 1.5 is required at 600 mbs).
Pillars situated 20 m ahead or behind an unmined block will also be affected, resulting in either
partially crushed (core still solid) or intact pillars.
Crush pillars implemented 800 m and deeper below surface are impacted to a lesser extent when in
close proximity to a pothole. Large mining losses (>10%) and potholes situated closer than 10 m
from the pillar line can either prevent pillar crushing or induce delayed crushing.
Crush pillars implemented beyond 1000 mbs are not affected if a 10% mining loss (pothole) is
situated 2.5 m from the line of crush pillars.
Underground sidings often significantly lag the mining face. A siding is a 1 – 2.5 m wide ledge or heading
carried on the one side of an on-reef development end adjacent to the panel being mined (Figures 2.6
and 2.7). These sidings are carried a maximum of either 3 m or 6 m behind the panel face (depending on the
standard applied by the respective mining company). The main function of the siding is to either modify the
fracture patterns resulting from high face abutment stress or to move the crush pillars away from the
travelling way to prevent failed rock falling on people. The sidings, being approximately 2 m wide, are
difficult to clean (hand lashed) and support. For this reason, mining of the siding is frequently behind
schedule. In some cases, sidings lag the face by 20 – 30 m and are then developed as a single mining face. A
lagging siding impact the width of the pillar being formed at the mining face (Figure 2.7). Until now, the
impact of a lagging siding on the pillar width has not been identified as a contributor to undesired pillar
behaviour or a source of pillar seismicity in a crush pillar environment. Once the siding of an advancing
panel lag behind the adjacent lagging panel face, over-sized pillars are created. The pillars will only be
reduced in size to the required dimension when the siding is blasted. At this point the pillar might not be able
to crush sufficiently as the pillar is already in the back area of a stope. The simulations conducted confirmed
this effect (Figure 2.8). These pillars could therefore pose a seismic risk.

18
Gully
Gully
Figure 2.6: Section view of a typical intermediate depth mining geometry with a crush pillar layout.
Sid
ing
Sid
ing
New pillar
being
formed
Good practice
Poor practice
No siding cut
Oversized pillars
Dip
Pre-developed
pillar holings
Sid
ing
PanelCrush pillars
Lagging siding
Advance direction
Gu
lly
Gu
lly
Figure 2.7: The impact of a significantly large lagging siding on crush pillar behaviour (plan view).

19
0
20
40
60
80
100
120
140
160
180
0 1 2 3 4 5 6 7 8 9 10
AP
S (
MP
a)
Mining step
Effect of siding
600 mbs 800 mbs 1000 mbs 1400 mbs
Pillar D
formed
Figure 2.8: The effect of a lagging siding on crush pillar behaviour (pillar D, Figure 2.2) at various
depths (w:h = 2). Note that the pillar does not crush and shed load compared to pillar D in Figure 2.3.

20
2.5. Assessment of the derived analytical solution to determine the residual stress of a
completely failed pillar
The analytical solution derived by the author provided an equally good fit to historic underground measured
pillar behaviour (Watson, 2010) when compared to both the Salamon (Salamon, 1992) and Barron
(Barron, 1984) solutions. The results are, however, very sensitive to the selection of the input parameters.
The derived analytical solution for the average pillar stress of a completely failed crush pillar was used to
investigate the behaviour of these pillars. The results of the numerical modelling were compared to the
analytical solution. The purpose of the analytical solutions would be to provide a first order estimate of
crush pillar dimensions. The analytical solution, however, provides a two-dimensional approximation
(infinitely long pillars). If very long pillars are simulated in TEXAN, the residual pillar stress of the failed
pillars is in better agreement with the analytical solution (Figure 2.9).
0
10
20
30
40
50
60
70
80
90
100
0 0.5 1 1.5 2 2.5 3 3.5 4
AP
Sre
s (
MP
a)
w:h ratio
Effect of pillar size on crush behaviour
(2m pillar height)(Comparison: short versus long pillars)
Simulated 2x6 Pillars Simulated 3x6 Pillars Simulated 4x6 Pillars
Sim 2x36 long pillar Sim 3x36 long pillar Sim 4x36 long pillar (800mbs)
Analytical solution (Du Plessis)
Figure 2.9: Results for the analytical solution of a completely crushed pillar (equation 2.17) and
numerical simulation for pillars with various width to height ratios (the same input parameters were
used for both methods of analyses). The figure also compares the residual pillar stress for short versus
long pillars simulated at 600 mbs.

21
3. UNDERGROUND TRIAL
An underground crush pillar trial site was established late 2012 on Lonmin’s K3 Shaft at a depth of
approximately 782 mbs. The objective of the trial was to obtain a better understanding of the pillar system
and the associated risks. The Merensky Reef, dipping at approximately 8 degrees, was mined at an average
mining height of approximately 1.3 m using conventional drill and blast techniques. A split down-dip layout
was used (Figure 1.2), mining from 23 to 24 level (800 mbs). Level spacings are approximately 180 m apart
on dip. Split dip panels (14 m face lengths) were mined either side of a centre-raise, resulting in a maximum
inter-pillar span of 31 m between lines of crush pillars. The pillars were situated in the middle of a “panel”
and away from other excavations (i.e. raise) which could possibly influence the pillar behaviour. The crush
pillars were planned to be 2 m wide and 4 m long (w:h of approximately 1.5).
LONMIN
Figure 3.1: Locality of Lonmin in relation to the Bushveld Complex.

22
Figure 3.2: Locality of Lonmin’s K3 operation.
The down-dip panels in the crush pillar trial site (Figure 3.3) were stopped against a bracket pillar which was
left along a 1.5 m strike orientated (E–W) reverse fault. No regional pillars were left in the trial section as
two large potholes were situated either side of the trial site. The area above the trial site was supported by
dip regional pillars which partially intersected the top portion of the trial area. Smaller potholes intersected
in the mining area provided additional regional stability. By the end of February 2015, only one active
mining panel remained in the trial site along which the final four crush pillars would be formed. Mining of
the trial site was completed by the end of May 2015.
Table 3.1: Parameters of the trial site.
Depth of mining (mbs) 782 - 800
Reef dip (deg) 8
Crush pillar width - planned (m) 2
Stoping width (m) 1.3
No. of pillars cut 55
Area mined (m2)
(arbitrarily chosen to include the entire crush pillar area) 22000

23
(0, 0) (200, 0)
(0, 133)
A
C
DIP (N)
31m panel span
Crush pillars
Planned
dimensions
2m (w) x 4 m (l)
Fault bracket pillar
Geological &
Mining losses
(Potholes)
Raise
Dip
Reg
ion
al p
illa
r
P1
P42
(W) (E)
Face
Mining
direction
P2
P37
P3
P4
1
2
3
4
5
6
7
8
9
10
11
12
13
14
16
17
18
19
20
24
23
22
25
26
27
28
29
30
31
32
33
34
35
36
38
39
40
41
42
43
44
45
46
47
48
49
50
51
52
53
Final mining section
Active mining panel
(instrumentation site)
Dip
Reg
ion
al p
illa
r
Footwall
heave
Figure 3.3: Plan view indicating the trial area. The existing crush pillars are shown in red and planned
pillars (P2, P3, P4) in green. The plan indicate the face positions during February 2015.
Of the 55 crush pillars cut, a range of actual width to height ratios were observed (Table 3.2). This was as a
result of poor pillar cutting discipline as well as layout restrictions. In the trial area, approximately 22000 m2
was mined. 87 Percent of the pillars had a w:h ratio of less than 2:1 and only seven pillars had w:h ratios
greater than 2:1 with the maximum pillar width being 3.1 m.
Table 3.2: Pillar w:h ratio distribution at the trial site.
w:h
ratio
Percentage of
pillars
<1 29%
1 - 1.5 36%
1.5 - 2 22%
>2 13%

24
Stress measurements conducted on K3 Shaft (Coetzer, 2003) at a depth of 820 mbs and in close proximity to
the crush pillar trial site, indicated that the major principal stress was orientated horizontally (E-W). The
measured virgin vertical stress (23.2 MPa) corresponds well with the calculated virgin vertical stress
(24.1 MPa) at the corresponding depth. The k-ratio (ratio of horizontal : vertical stress) is approximately 1.8.
σ3 (25 MPa)
σ1 (45 MPa)
σ2 (29 MPa)
EW
N
S
+Z
-Z
Figure 3.4: Virgin principal stress magnitudes and orientations from stress measurements conducted
at K3 shaft.
At K3 shaft, the middling to the top of the Bastard Merensky Reef varies between 10 m and 13 m
(Figure 3.5). The behaviour of the immediate hangingwall (HW1/HW2) is dominated by the overlying
Bastard Merensky Reef as a result of the weak parting along the top and bottom contacts. Consequently, the
hangingwall up to the Bastard Merensky Reef will act as deadweight on the support elements.
The upper Anorthosite series, which is found above the Bastard Merensky, is a competent zone. The support
requirements for the immediate hangingwall (HW1, HW2, HW3) and upper Anorthosite series are therefore
very different and must be catered for through the application of a crush and regional pillar system
respectively.
Rock strength measurements determined the strength of the footwall Mottled Anorthosite is the strongest
(236 MPa) compared to the reef (140 MPa), the hangingwall 1 Spotted Anorthosite (171 MPa) and
hangingwall 2, Mottled Anorthosite (158 MPa).

25
FW1
Mottled Anorthosite
Merensky Reef
HW1 / HW2
Spotted / Mottled
Anorthosite
HW3
Bastard Pyroxenite
Upper Anorthosite
Figure 3.5: Diagram indicating the hangingwall stratigraphy. The crush pillars are indicated by the
piles of broken rock.
The instrumentation programme during the trial was one of the most comprehensive monitoring exercises
ever conducted at a crush pillar site in South Africa. The measured behaviour was related to the pillar
condition as observed during the pillar forming cycle. This has not previously been recorded for crush
pillars. It provided parameters to benchmark the performance of the pillar system against and can be used in
future as a guide to identify acceptable pillar behaviour.

26
3.1. Visual observations
The condition of the pillars was visually assessed during underground visits. The objective was to determine
if the pillars were in a crushed state, if the pillars were crushing while being formed at the face and if blocks
of unmined ground (i.e. potholes) have an impact on the pillar behaviour.
Some of the general characteristics observed included:
The composition of the pillar, including the exposed hangingwall rock, influenced the pillar
behaviour.
The fracture intensity was greater on the side of the pillar which was exposed first.
Buckling of the fractured slabs was either along the top or the bottom of the pillar depending on the
mining sequence. Pillars which fractured towards the west (Figure 3.6a) had the fractured slabs
buckling closer to the footwall. In contrast, pillars which fractured towards the east (Figure 3.6b)
had the fractured slabs buckling closer to the hangingwall.
Pillars were observed to be partially fractured whilst being formed at the mining face (Figure 3.7).
This indicated that the stress was sufficiently high to initiate early pillar crushing.
Pillars that were completely failed contained fracture planes spaced approximately 30 - 50 mm apart
(Figures 3.9 and 3.18).
W E
Figure 3.6a: Pillar scaling towards the west (mined first).

27
W E
Figure 3.6b: Pillar scaling towards the east (mined first).
E-Face
Figure 3.7: Condition of pillar 37 whilst still part of the mining face. Refer to Figure 3.3 for the pillar
position.

28
In the underground trial section, a distinctive failure pattern and failure sequence was identified in the
pillars. Three modes of failure could be identified namely:
Spalling (scaling),
Buckling along failure or fracture planes,
The formation of conjugate failure planes (wedge-like structure).
In Figure 3.8 these various failure modes can be seen. Many of the crush pillars in the trial site had the
wedge-like structure forming where fractures intersected in approximately the centre of the pillar
(Figure 3.9).
Shearing of fractured slabs
along hangingwall
Migration of fractured slabs
Wedge
formation
Figure 3.8: Photograph of a crush pillar in the trial site. Visible in the photograph is the shearing of
the fractured slabs along the hangingwall as well as the wedge formation in the pillar.

29
E
Wedge
W
Figure 3.9: Up-dip view of pillar P1. Note the wedge-like structure visible where the fractures
intersect. Fractures clustered predominantly towards the east which was mined first.
During the extraction of the final mining section (Figure 3.3), three additional pillars were formed (P2, P3,
P4). Two of these pillars were extensively instrumented. The following figures indicate the face position at a
point in time relative to the pillar forming cycle. This was used as a reference to compare the observed
external changes of a pillar to the measured behaviour.

30
P4
position
P3
position
P2 position
P37
partially cut
P1
July 2013
Holing 1
position
Holing 3
position
Holing 2
position
Holing 4
position
Rai
se
E2C
East Panel
E3 West Panel E3 East Panel
Face permanently
stopped
Active mining
instrumentation panel
Spare mining
panel
Dip
Figure 3.10: Mining layout at the time when the trial site was temporarily stopped (July 2013).
P4
P3
P2
P37
P1
16 March
Rai
se
Dip
Active mining
instrumentation panel
Spare mining
panel
5m
Figure 3.11: Face position on 16 March 2015. Mining face aligned with pillar P2.

31
P4
P3
P2
P37
P1
14 April
Rai
se
Active mining
instrumentation panel
Spare mining
panel
Dip
5m
Figure 3.12: Face position on 14 April. Mining face aligned with pillar P3. Pillar P2 was now fully
formed.
P4
P3
P2
P37
P1
23 April
Rai
se
Active mining
instrumentation panel
Spare mining
panel
Dip
5m
Figure 3.13: Face position on 23 April. Mining face aligned with pillar P4. Pillar P3 was now fully
formed.

32
P4
P3
P2
P37
P1
6 May
Rai
se
Active mining
instrumentation panel
Spare mining
panel
Dip
5m
Figure 3.14: Face position on 6 May. Pillar P4 was now fully formed.
P4
P3
P2
P37
P1
Final
18 May
Rai
se
Dip
5m
Instrumentation panel
Mining direction
Figure 3.15: Face position on 18 May. All mining stopped.

33
The most prominent observations during the formation of the pillars in the final mining section were that;
fractures formed parallel to the surface of the exposed abutment approximately 9 m ahead of the lagging
face position. These fractures would increase as the lagging face advanced. By the time the face was aligned
with the pillar, the fracture planes were spaced approximately 30 – 50 mm apart along the outer metre of the
pillar (from the exposed surface of the pillar). These fractures would start to open (5 - 10 mm) as the pillar
was being formed. Little to no scaling or slabbing was visible along the side of the pillar which was exposed
by the advance of the lagging face. New fractures formed along this side of the pillar only when the pillar
was 3 - 7 m in the back area. In most cases these new fractures were spaced more than 100 mm apart and
extended to approximately half the pillar width. These fractures started to dilate when the pillar was
approximately 10 m in the back area. It did not result in any observed scaling or slabbing of the pillar
surface along this side of the pillar. Continued pillar deformation was observed until the pillar was
approximately 14 m in the back area.
From the observations, a failure mode could be identified. This is illustrated in Figures 3.16 and 3.17.
As a pillar is being cut, a “free face” is formed along the long axis of the pillar. Extension fractures
form parallel to the exposed “free-face” and extend into the hanging-and footwall (Figure 3.16a).
As new fractures form, previously formed fractures start to dilate (Figure 3.16b). The slabs defined
by the fracture planes buckle at approximately mid-height as the slabs are pushed outward. This is
observed as increased scaling towards the initially exposed side of the pillar (Figure 3.16c).
The slabs move up-or down relative to one-another as the slabs rotate outwards while the pillar
continues to dilate. The buckled slabs, in some instances, shear off along the hangingwall or along
low angled extension fractures. As extension fractures continue to open and the fractured slabs
migrate outwards, the confinement it provided is reduced. As a result more extension fractures are
formed (Figure 3.16d).
Where the extension fractures meet at approximately the centre of the pillar, the fractures and failure
surfaces interact and form a wedge-like structure (Figure 3.17). Similarly, should the panel to the
right be mined first the fracturing sequence will be concentrated towards the right side of the pillar.

34
a)
b)
c)
d)
Figure 3.16: Crush pillar fracturing sequence observed in the underground mining trial.

35
Wedge
Wedge
Mined secondMined first
Intact shearing
Figure 3.17: Crush pillar fracture pattern observed in failed pillars.
Mined first Mined second
Wedge and
failure plane
Figure 3.18: Failure patterns observed along the down-dip side of pillar 38 (1.5 m wide) illustrating
the representation in Figure 3.17.

36
3.2. Measurements
At the end of June 2013, mining in the trial area was stopped to enable the required instrumentation to be
installed and to control the future mining sequence. The mining layout at the time is shown in Figure 3.19.
Mining resumed at the end of February 2015. The approximately 20 month stoppage was predominantly as a
result of strike action in 2013 and 2014. Pillar P1, P2, P3 and P4 as indicated in the figures refer to the
instrumented pillars.
42
(0, 0) (200, 0)
(0, 133)
Active mining
panel
P2
P3
Step 1
Step 2
Step 3
Step 4
P4
P1
A
B
796 mbs
790 mbs
787 mbs
1
2
3
4
5
6
7
8
9
10
11
12
13
14
15
16
17
18
19
20
21
24
23
22
25
26
27
28
29
30
31
32
33
34
35
36
38
39
40
41
37
42
43
44
45
46
47
48
49
50
51
52
53
Step 5
DIP (N)
Spare panel
E3 W
panel
E2C E
panel
E3 E
panel
Final mining section
Footwall
heave
Figure 3.19: Plan view indicating the trial area and approximated pillar outlines. Pillars P2, P3 and P4
were formed during the mining of the final mining section as indicated by mining steps
(Step 1 - Step 5).
The majority of mining took place in the E3 West panel (active instrumentation panel). Various types of
instruments were used to achieve the desired objectives. Table 3.3 provides a summary of the instruments
used (number in brackets refers to the number of instruments used). Figure 3.20 represents the
instrumentation layout.

37
Table 3.3: Summary of the parameters measured and the equipment used.
Measurement Equipment
Pillar stress
CSIRO Hollow inclusion (HI) cell (3) and Compact
cononical-cone borehole overcore (CCBO) stress
measurements (2)
Convergence in the panel Continuous closure loggers (20), closure ride stations
(33) and visual observations (impact on support)
Convergence next to the pillar to measure
possible pillar deformation Closure loggers and closure ride stations
Closure as a result of potential hangingwall
separation along partings Hangingwall extensometers (5)
Pillar dilation Pillar extensometers (3), borehole camera surveys (3),
pillar off-sets via pegs
Pillar fracturing Borehole camera surveys, micro seismic probing (3
pillars), photogrammetry, visual observations
DIP (N)
P37
P2
P3
P4
P1
Closure Logger
Closure station
Pillar extensometer
CSIRO stress monitoring cell
Borehole camera survey
CCBO stress measurementActive mining panel
E2C E Panel E3 W Panel
Figure 3.20: Plan of the actual instrumentation installed at the trial site.

38
3.2.1 Pillar stress
The stress change measured conducted approximately 4 m above each pillar was analysed by comparing the
data to events corresponding to the various phases of the pillar forming cycle. Similar trends were identified
for the three instrumented pillars. The results have revealed new information regarding the behaviour of
crush pillars.
The data confirmed that a pillar reaches a residual state once the pillar is completely formed (holed). The
pillars also experienced secondary reductions in stress when new pillars were formed. This is illustrated by
the stress change measurement conducted above pillar P1 (Figure 3.21). The pillar was already completely
formed prior to the extraction of the final mining section. The absolute stress measurement conducted at the
end of 2014 indicated a vertical stress of 17.1 MPa. Underground, the pillar appeared to be in a crushed state
(Figure 3.6b). However, when mining resumed in February 2015 until mining stopped in May 2015, there
was another 10.58 MPa reduction in vertical stress. The most significant reductions appeared to coincide
with the formation of new pillars (red dots highlighted in the figure). This phenomenon is believed to be
associated with the transfer of stress to the newly formed pillars. This unloading phase has in the past
typically only been referred to as continued strain softening behaviour.
0
5
10
15
20
25
2014/12/27 2015/01/26 2015/02/25 2015/03/27 2015/04/26 2015/05/26
Ver
tica
l st
ress
(M
Pa
)
Time
Pillar P1 - Stress change measurement
Mining starts (28/2)
P2 holed (9/4)
Face at P2 (12/3)
Face along P2 (16 /3) one blast in
Face at P3 (15 /4)
P3 holed (18-22/4)
Figure 3.21: Pillar P1 stress change versus time. The pillar was completely formed when the strain cell
was installed.

39
The numerical model, used to back analyse the behaviour of the crush pillars in the trial section (refer to
Section 4), was used to simulate the stress value at the point of measurement above each pillar. The model
indicated a vertical stress of approximately 15 MPa (Figure 4.5) above pillar P1 (completely formed) for the
layout which existed at the time of the measurement. This agreed well with the measured 17.1 MPa
(Figure 3.21). Pillar P2 (Figure 3.22) demonstrated a reduction in vertical stress of 59.84 MPa, while for
pillar P3 an overall reduction of 22.75 MPa was recorded.
The stress change data confirmed that the baseline magnitude obtained above the anticipated position of
pillar P2 (18.2 MPa) was only relevant to the exact point of measurement. The model and stress change
measurements indicated that the baseline vertical stress magnitudes of pillar P2 and pillar P3 should have
been approximately 70 MPa (adjusted data in Figure 3.22) and 42 MPa respectively.
-60
-40
-20
0
20
40
60
80
2014/12/27 2015/01/26 2015/02/25 2015/03/27 2015/04/26 2015/05/26
Ver
tica
l st
ress
(M
Pa
)
Time
Pillar P2 - Stress change measurement
Adjusted data Original data
Mining starts (28/2)
Pillar not formed yet
Face 3 m behind pillar position
Pillar P2 formed (8/4)
Face aligned with P2 (16/3)
Face aligned with P3 (15/4)
Figure 3.22: Pillar P2 stress change versus time. Adjusted data incorporates the total reduction in
vertical stress. The strain cell was installed prior to the pillar being formed.
The continuous stress measurements indicated that:
As the advancing face approaches a pillar to the point where it is aligned with the new pillar
position, the pillar already experienced a significant reduction in vertical stress (23% - 64%).
40
Whilst the pillar is being formed and until it is holed by the advancing face, the pillar experiences
another reduction in vertical stress (28% - 41%). At this point the pillar reached its true residual state
(14.8 - 23.74 MPa).
As mining continues and new pillars are formed, the instrumented pillars continued to experience a
reduction in vertical stress (38% - 41%). This secondary reduction resulted in a residual pillar stress
of 6.5 - 17.4 MPa.
The measured change in vertical stress as a result of the secondary stress reductions occurred within
6 m of additional face advance (after the pillar had been formed).
Once the final pillar (P4) had been formed, there was no further change in vertical stress recorded
above the instrumented pillars. The pillars nevertheless continued to deform.

41
3.2.2 Pillar fracturing
Visually a pillar is considered failed when the outer surfaces of a pillar bulges as failed fractured material
dilates outward (scaling). It is generally assumed that even if the surrounding outer layers of a pillar are
heavily fractured and the pillar may have reached a residual state, the core of a pillar is still solid. In the past
this could only be investigated through the examination of holes drilled through a pillar. However, as
indicated in Figure 3.23, these holes quickly close up once a pillar starts to fail. Also, new holes cannot be
drilled through the fractured material. The inner portion of a pillar can therefore not be investigated.
Figure 3.23: Movement along the borehole drilled through pillar P3 from the western side. The hole
could only be used for one scan before it was obstructed by the movement of the fractured slabs.
A new seismic velocity process was developed by the company IMS (Institute of Mine Seismology) and
tested on the crush pillars in the trial site to determine the internal condition of the pillars. The process
involves installing sensors and hitting points around the perimeter of a pillar at mid height. This allowed a
two-dimensional horizontal plane passing through the entire pillar to be examined (Figure 3.24). The hitting
points (pegs) are repeatedly struck with a hammer that has a seismic sensor attached. The recorded
seismograms are used to determine the seismic travel time measured between the source and the respective
sensors. The pillar outline is established using the surveyed co-ordinates of the installed pegs. High seismic
velocities indicate zones of little or no fracturing. In contrast, low seismic velocities indicate zones of high
fracturing.
The intervals of the scans were set out to determine:
Fracture profile of the pillar before the pillar was formed (Stage 1); Baseline measurement.
Fracture profile of the pillar when it has just been formed (Stage 2).
Fracture profile of the pillar when in the back area (Stage 3).
An example of the result for pillar P3 is displayed in the subsequent figures.

42
a)
d)
c)
b)
Hitting points
Sensors
Figure 3.24: Pillar micro seismic profiling method to determine the degree of fracturing experienced
by a crush pillar (plan view).

43
The results indicated that the pillars experienced a significant overall reduction in seismic velocity once the
pillars were formed (Stage 2). This compared well with the underground observations which showed a
significant change in the pillar appearance at these times. Subsequent scans indicated that the pillars were
already reasonably fractured during the pillar forming stage and that the advancing face only caused some
damage to the eastern side of the pillar (lagging panel), although not visible along the exposed surface. The
fracture or weakness planes therefore already existed along which dilation was taking place whilst the pillar
was experiencing an unloading phase. The stress measurements confirmed that the pillars were already at a
residual state when the pillars were completely formed (Stage 2).
Pillar P3 Stage 1
Figure 3.25: Pillar P3 scan 1; pillar parallel with the face.

44
Pillar P3 Stage 2
Figure 3.26: Pillar P3 scan 2; pillar formed. The pillar is 3 m behind the face position.
Pillar P3 Stage 3
Figure 3.27: Pillar P3 scan 3. The pillar is 7 m behind the face position.

45
3.2.3 Convergence
Extensive convergence instrumentation was installed in the final mining section to understand the rock mass
deformation and pillar behaviour as a function of mining and pillar crushing. Figure 3.28 indicates the
approximate position of the closure stations.
Convergence was measured with both closure loggers and closure stations. All the continuous convergence
data had a similar profile. The events leading to changes in convergence could be related to events in the
mining cycle (pillar formation).
DIP (N)
Active mining panel
E2C E Panel E3 W Panel
E
D
C
B
A F
G
H
I
J123456
654321
123456
123456
123456
123456 654321
654321
654321
654321
28 Feb 15’
18 May 15’
P2
P3
P4
P1
P37
Figure 3.28: Layout of the closure stations in the final mining section.
Figure 3.29 illustrates the convergence measured in approximately the centre of the panel, in line with pillar
P2. The results indicate that the formation of pillar P2 and P4 caused an increase in convergence of 6 mm
and 3.5 mm respectively at this site. Similarly, the additional pillar deformation which continued to occur at
this site once all the pillars were formed caused 3.5 mm of additional convergence.

46
0.0
5.0
10.0
15.0
20.0
25.0
30.0
35.0
17/01/15 07/02/15 28/02/15 21/03/15 11/04/15 02/05/15 23/05/15 13/06/15 04/07/15
Co
nv
erg
ence
(m
m)
Date
Convergence measurement: Site C4
RockWatch Logger 1031L - Data Closure-station
1.11 mm/m 0.56 mm/m 0.34 - 0.68 mm/m
0.34 mm/m
Formation of pillars
P2 P3 P4 Additional mining
Figure 3.29: Convergence measured at site C4.
Measurements conducted close to the mining face (e.g. Row E and F) indicated that a significant part of the
convergence (approximately 15 mm) experienced in the stope occurred in the first 15 m behind the face
(Figure 3.30). The measurements also indicated that the deformation of newly formed pillars contributed to
the convergence experienced close to the stiff face abutment (e.g. P4). This demonstrates that pillar crushing
does contribute to the convergence experienced close to the face.
The results of the closure stations installed either side of instrumented pillars indicated that the side of the
pillar which was exposed first experienced the most convergence (related to fracturing sequence). The
maximum amount of additional convergence measured was 32 mm. This was adjacent to the west side of
pillar P2. The average rate of geometric convergence measured was 0.4 – 0.6 mm / m of advance. This could
differ in other crush pillar sites and will be influenced by mining depth and regional stability.

47
0
5
10
15
20
25
30
35
40
0 5 10 15 20 25 30 35
Co
nv
erg
ence
(m
m)
Face advance (m)
Convergence versus face advance (F4)
Measured convergence Adjusted convergence
2.33 mm/m
0.13 mm/m
0.12 mm/m0.2 mm/m
Estimated
adjustment
Figure 3.30: Convergence measured as a function of face advance at site F4 installed adjacent to pillar
P1. The estimated adjustment is to account for the convergence that occurs in the first 7 m behind the
face before the instruments were installed.

48
4. BACK ANALYSES OF THE UNDERGROUND TRIAL
A limit equilibrium model implemented in the DD code TEXAN, was used to simulated the behaviour of the
crush pillars. It is encouraging that the model appears to simulate the behaviour of the crush pillars observed
in the underground trial section. The layout of the trial section was approximated using straight line
polygons to enable the area to be easily discretised using triangular elements (Figure 4.1). The mining steps
considered:
Step 0: The layout with the face positions prior to the extraction of the final mining section.
Step 1 – 3: Formation of pillars P2, P3, P4.
Step 4 and 5: Additional mining conducted to the final stopped face positions.
The element sizes selected for the mining steps were 1 m and the pillars 0.5 m.
Step 0
Step 1
Step 2
Step 3
Step 4
Step 5
37
P2
P3
P4
45
Figure 4.1: Part of the meshing of the mined area, mining steps and pillars of interest.
Simulating the observed and measured behaviour experienced in the trial site was a significant challenge as
modelling of a mine-wide tabular layout, which explicitly included a large number of crush pillars, has not
been successfully performed in South Africa. The concept, initially tested by the author to determine the
appropriateness of the method, proved successful (Du Plessis and Malan, 2011).

49
The intact and crushed material residual strength are mostly responsible for the onset of pillar failure and the
residual stress state achieved by the model. Through successive cycles of parameter testing, the modelling
parameters selected provided results which closely resembled the observed underground pillar behaviour
(Table 4.1). Following this trial and error calibration of the model, both the observed and measured
behaviour of the crush pillars in the trial site could be replicated.
Due to the flat dipping reef (8 degrees), a dip of zero degrees was included in the model to simplify the
analysis. Also, the horizontal stress was assumed to be the same in both directions.
Table 4.1: Modelling parameters used for the back analysis.
Parameter Value
Young's Modulus (MPa) 70 000
Poisson’s ratio 0.25
Seam stiffness (MPa/m) 106
Dip (deg) 0
Mining depth (mbs) 782
Pillar height (m) 1.3
Vertical stress (MPa) 23.5
k-ratio 1.8
Intact material strength C0 (MPa) 630
Crushed material strength Cb (MPa) 20
Intact slope (m0) 8
Residual slope (mb) 1
Friction angle (deg) 50
As a comparison, two constitutive models were used to simulate the reef material. The first simulation was
for an elastic rock mass where the pillars were simulated as a “rigid” material that did not allow any failure
or deformation. For the second simulation, the limit equilibrium constitutive model was used. This model
allowed failure and load shedding of the pillars. Pillar P2 was selected to illustrate the evolution of pillar
stress during the pillar forming process. Figure 4.2 indicates the average pillar stress (average of all
collocation points within the pillar) for pillar P2 for each mining step for both the elastic and limit
equilibrium model.
The pillar was initially part of the solid mining face abutment (Figure 4.3). The pillar is partially formed
during mining step 1 and separated from the mining face during step 2.

50
0
50
100
150
200
250
300
350
400
450
500
0 1 2 3 4 5
AP
S (
MP
a)
Mining step
Average pillar stress - Pillar P2
Elastic Lim Equil
Figure 4.2: Average pillar stress for pillar P2; Elastic versus limit equilibrium model. The pillar is
holed in mining step 2.
Figure 4.4 considers a section a - a’ through pillar P2 (as indicated in Figure 4.3) and shows the evolution of
pillar stress during each mining step using the limit equilibrium model to simulate the crush pillar behaviour.
Step 0 considers the stress through the 2 m solid abutment at the pillar position.
Step 1 indicates the stress through the pillar while the pillar is formed at the mining face.
Step 2; the mining face advances and the pillar moves 6 m in to the back area.

51
Active mining
panel
P2
P3
Step 1
Step 2
Step 3
Step 4
P4
P1
37
Step 5
45
46
47
a a’
Spare panel
E3 W panel E3 E panel
Figure 4.3: Area indicating the final mining section extracted by mining steps 1 – 5.
0
100
200
300
400
500
600
147.5 148 148.5 149 149.5 150 150.5 151
Ver
tica
l st
ress
(M
Pa)
Coordinates (m)
Pillar stress - Pillar P2
Step 0 Step 1 Step 2
Figure 4.4: Development of pillar stress during the pillar formation cycle (pillar P2); section a – a’ in
Figure 4.3.

52
The results indicate:
Step 0: High abutment stress along the exposed edge of the pillar.
Step 1: Complete crushing of the outer 35 cm along the western side of the pillar. The pillar stress
increases from the outer edges towards the centre of the pillar resulting in the high peaks indicated
(57 cm from the western pillar edge). The core of the pillar, still presumably intact or in a partially
crushed state is at a lower stress.
Step 2: Complete failure of the pillar resulting in the residual state.
The behaviour predicted by the model for pillar P2 also coincides with the continuous stress measurement
and pillar fracturing profile for this pillar. In both cases, the results indicated that the pillar was at a residual
or failed state once the pillar was fully formed. The model therefore appears to be useful to simulate the
pillar behaviour.
The model was used to evaluate the stress condition measured above the pillars (e.g. Figure 4.5). The model
indicated a vertical stress of approximately 15 MPa above pillar P1 at the time of measurement which
compared well with the measured 17.1 MPa. Similarly the model could be used to estimate the baseline
vertical stress magnitudes above pillars P2 and P3.
2.30
11.58
18.96
27.55
19.94
12.31
2.82
0
5
10
15
20
25
30
35
135 140 145 150 155 160
Ver
tica
l st
ress
(M
Pa
)
Coordinates (m)
Vertical pillar stress (P1)
4m above reef
Measurement
Pillar
Figure 4.5: Predicted vertical stress profile through a section of pillar P1 at the approximate absolute
stress measurement position conducted 4 m above the reef.

53
An amount of convergence occurs close to the mining face before instruments can be installed (Figure 3.30).
The model was used to simulate the convergence at these locations (e.g. site F4). The objective was to
replicate the underground measurements and to understand the convergence profile. The model indicated
that most of the convergence occurred very close to the face (14.45 mm in the first 2 m immediately behind
the face). This is most likely a function of the limit equilibrium model which will also cause partial crushing
of the face abutment. The estimated convergence (15 mm) based on measurement agreed well with the
modelled prediction (13.95 mm). The model predicted a maximum convergence at the panel mid-spans of
approximately 31 mm.
0
5
10
15
20
25
30
35
0 5 10 15 20 25 30 35
Co
nv
erg
ence
(m
m)
Face advance (m)
Convergence versus face advance (F4)
(Measuered versus modelled results)
Measured convergence Modelled convergence
2.33 mm/m
0.13 mm/m
0.12 mm/m0.2 mm/m
2.6 mm/m
0.57 mm/m
0.36 mm/m0.18 mm/m
Step 0
Step 1
Step 2Step 3
0.08 mm/m
Step 4
Figure 4.6: Measured versus simulated convergence measured at site F4. The closure station was
aligned with pillar P1 and was installed 7.7 m behind the face, prior to mining the final section.
Figure 4.7 illustrates how the model approximates the measured convergence at site D1 adjacent to pillar P3.
This indicated that convergence alongside the pillars only started to occur once the pillars started to crush.
The underground observations identified continued pillar deformation occurring in the back area of the
stope. The measured convergence at the various sites also indicated ongoing convergence after mining had
stopped. The majority of the additional convergence can therefore be attributed to ongoing pillar
deformation.

54
0
5
10
15
20
25
30
35
0 5 10 15 20 25 30
Co
nv
erg
ence
(m
m)
Face advance (m)
Convergence: Site D1
Measured convergence Modelled convergence
Step 1
Step 2
Step 3 Step 4Step 5
P4 holing blasted
Figure 4.7: Measured versus modelled convergence measured at site D1 adjacent to pillar P3. The
pillar is formed in mining step 2 and holed in mining step 3.

55
5. CONCLUSION
As the South African platinum mines are increasing in depth, extraction ratios will decrease to unacceptable
levels unless a crush pillar system is considered. Crush pillars are designed to crush when formed at the
mining face. These failed pillars provide a local support function. However, some of the mines which
currently use crush pillars, experience unpredictable pillar behaviour. This is especially problematic in the
Merensky Reef (main platinum reef) and may result in pillar seismicity. With approximately 70% of the
world’s platinum group metals being produced from these mines, it is imperative to understand crush pillar
behaviour and the causes contributing to unpredictability to mitigate this risk.
The objective of the research was to determine the parameters which influence crush pillar behaviour to
prevent the risk of pillar instability. In this study, various new methods to examine the behaviour of crush
pillars were investigated. This resulted in an improved understanding of crush pillar behaviour.
A limit equilibrium model was identified as being able to simulate the behaviour of the pillars. As a novel
contribution, the author derived an analytical model based on this approach to estimate the average pillar
stress of a failed crush pillar. A limit equilibrium model implemented in the displacement discontinuity
boundary element code TEXAN, was used to simulate the behaviour of the crush pillars. From the study, a
set of design criteria could be derived as a guideline for the safe implementation of a crush pillar system. For
the first time, parameters contributing to pillar instability could be investigated. The presence of unmined
blocks of ground (geological losses, i.e. potholes) or poor mining layouts (i.e. oversized pillars), has up to
now, not been considered in any analyses to evaluate crush pillar behaviour.
The behaviour of the crush pillars in a trial site established by the author, provided parameters against which
the performance of future pillar systems can be benchmarked. From the observations at this site, the failure
mode of the crush pillars could be recorded and interpreted. This has never been systematically recorded for
crush pillars before and is an important research contribution. The instrumentation programme at this trial
site was one of the most comprehensive monitoring exercises ever conducted at a crush pillar site in South
Africa. The measured performance could be related to the pillar condition as observed during the pillar
forming cycle. The results have revealed new information regarding the behaviour of crush pillars.
Secondary unloading cycles, ongoing pillar dilation and continued convergence as a result of pillar
deformation were identified. Also, the internal condition of pillars could be determined with a new seismic
velocity process developed and tested on the crush pillars. The residual state of a crush pillar could therefore
be validated and related to events in the pillar forming cycle.

56
The numerical analysis of the underground trial site validated the use of a limit equilibrium model to
simulate the behaviour of crush pillars on a large scale. To date, no numerical modelling of a mine-wide
tabular layout, which explicitly included a large number of crush pillars, had been reported in South Africa.
This work is also a major contribution in this particular field. After the model was calibrated, both the
observed and measured behaviour of the crush pillars in the trial site could be replicated. The study
illustrated that the simulation of an idealised layout is nevertheless valuable compared to a large scale
underground layout. It is easy to set up and with little effort, trends can be established through consecutive
runs. Design guidelines derived from the preliminary modelling results were compared and could be verified
by observed behaviour and actual measurements in the trial mining site.
The research findings improved the industry’s understanding of crush pillar behaviour. The key outcomes
will guide mines on the safe implementation of a crush pillar system. This includes strategic considerations
such as; defining the depth at which a crush pillar system could be considered, the impact of geological
losses in an ore reserve on the pillar behaviour, the ideal pillar size required to ensure effective pillar
crushing and preferred stope layouts to avoid unpredictable pillar behaviour or the formation of oversized
pillars. This work therefore has the potential to have a significant impact on the profitability and
sustainability of the platinum industry in South Africa.

57
6. REFERENCES
Barron, K. (1984). An analytical approach to the design of coal pillars. CIM Bulletin, vol. 77, no 868, pp.
37–44.
Brummer, R.K. (1987). Modelling the non-linear behaviour of fractured seams in deep gold mines, In:
APCOM 87. Proceedings of the Twentieth International Symposium on the Applications of Computers and
Mathematics in the Mineral Industries. Volume 1: Mining, Johannesburg, SAIMM, pp. 21-32.
Canbulat, I., Grodner, N., Lightfoot, N., Ryder, J.A., Essrich, F., Dlokweni, A., Wilkinson, C., Krog,
and G. Prohaska, G. (2006). The determination of loading conditions for crush pillars and the performance
of crush pillars under dynamic loading. SIMRAC project SIM040302, Johannesburg.
Coetzer, S.J. (2003). Measurement of rock stress at Lonmin Platinum mines. CSIR consultancy report
issued by CSIR Miningtek, Johannesburg.
Du Plessis, M. and Malan, D.F. (2011). A new approach to simulate crush pillar behaviour in a tabular
layout. Proc. 12th ISRM congress, Beijing, China.
Jager, A.J. and Ryder, J.A. (1999). A handbook on Rock Engineering Practice for Tabular Hard Rock
mines. SIMRAC, Johannesburg.
Malan, D.F. and Napier, J.A.L. (2006). Practical application of the TEXAN code to solve pillar design
problems in tabular excavations. SANIRE 2006 Symposium - Facing the Challenges, Rustenburg, pp. 55-74.
Napier, J.A.L. and Malan, D.F. (2007). The computational analysis of shallow depth tabular mining
problems. J. South. Afr. Inst. Min. Metall., vol. 107, Nov 2007, pp. 725-742.
Ryder, J.A. and Jager, A.J. (2002). A textbook on Rock Mechanics for Tabular Hard Rock mines.
SIMRAC, Johannesburg.
Salamon, M.D.G. (1992). Strength and stability of coal pillars, Workshop on coal pillar mechanics and
design, US Bureau of the Interior. US Bureau of Mines, Santa Fe, USA.

58
Salamon, M.D.G., Badr, S., Mendoza, R. and Ozbay, M.U. (2003). Pillar Failure in deep coal seams:
numerical simulation. In Proceedings of the 10th Congress of the International Society for Rock Mechanics.
published by the South African Institute for Mining and Metallurgy, Johannesburg, pp. 1011-1018.
Watson, B.P. (2010). Rock Behaviour of the Bushveld Merensky Reef and the Design of Crush Pillars. PhD
thesis, School of Mining Engineering, University of the Witwatersrand, Johannesburg, South Africa.
Yacoub, T.E. and Curran, J.H. (1999). Analysis of post-peak pillar behaviour using the enhanced
displacement discontinuity method. In Proceedings of the 37th U.S. Rock Mechanics Symposium, Balkema,
pp. 169-176.