The Decline and Fall of Global Warming - Fraser Institute Decline and Fall of Global Warming 23 the...
16
21 The Decline and Fall of Global Warming P ATRICK J. MICHAELS Any argument for an expensive and potentially disruptive policy to reduce greenhouse-gas emissions based upon forecasts of glo- bal warming requires strong scientific backing. In the course of the last year, the requisite science largely disappeared. Yet, many nations—especially the European Union and the United States—continue to propose policies such as mandatory reduc- tions in greenhouse-gas emissions that are increasingly hard to justify in light of what is now known about greenhouse science. This paper details the scientific evolution of this issue. The global temperature history based upon measurements from satellites that became operational in 1979 (figure 1) leaves little doubt that a dramatic warming of the atmosphere is not oc- curring. While it is not a measure of ground temperatures, it faithfully reproduces global mean temperatures measured be- tween 5,000 feet and 30,000 feet by weather balloons. This his- tory shows a statistically significant net cooling when averaged over the 18.5 year period of record. As reported in the issue of New Scientist for July 19, 1997, “This is not what is predicted by the computerized climate models on which all estimates of
Transcript of The Decline and Fall of Global Warming - Fraser Institute Decline and Fall of Global Warming 23 the...

21
The Decline and Fall of Global Warming
PATRICK J. MICHAELS
Any argument for an expensive and potentially disruptive policyto reduce greenhouse-gas emissions based upon forecasts of glo-bal warming requires strong scientific backing. In the course ofthe last year, the requisite science largely disappeared. Yet, manynations—especially the European Union and the UnitedStates—continue to propose policies such as mandatory reduc-tions in greenhouse-gas emissions that are increasingly hard tojustify in light of what is now known about greenhouse science.This paper details the scientific evolution of this issue.
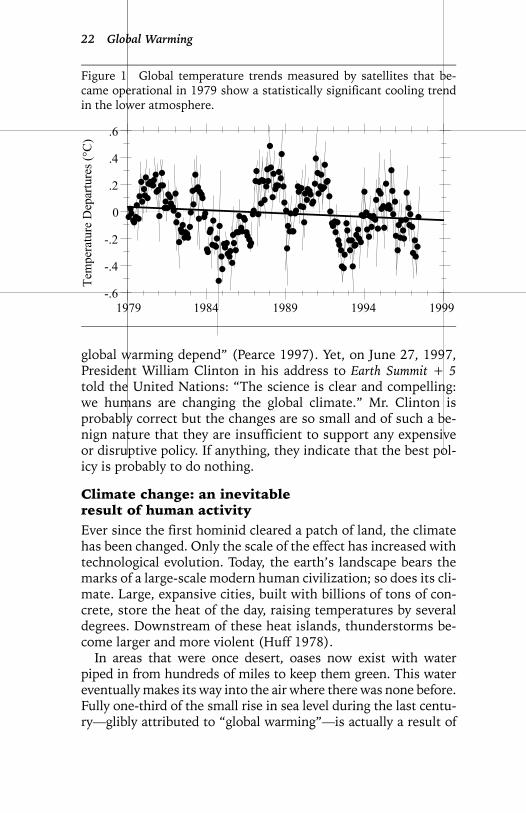
The global temperature history based upon measurementsfrom satellites that became operational in 1979 (figure 1) leaveslittle doubt that a dramatic warming of the atmosphere is not oc-curring. While it is not a measure of ground temperatures, itfaithfully reproduces global mean temperatures measured be-tween 5,000 feet and 30,000 feet by weather balloons. This his-tory shows a statistically significant net cooling when averagedover the 18.5 year period of record. As reported in the issue ofNew Scientist for July 19, 1997, “This is not what is predicted bythe computerized climate models on which all estimates of
22 Global Warming
global warming depend” (Pearce 1997). Yet, on June 27, 1997,President William Clinton in his address to Earth Summit + 5told the United Nations: “The science is clear and compelling:we humans are changing the global climate.” Mr. Clinton isprobably correct but the changes are so small and of such a be-nign nature that they are insufficient to support any expensiveor disruptive policy. If anything, they indicate that the best pol-icy is probably to do nothing.
Climate change: an inevitable result of human activityEver since the first hominid cleared a patch of land, the climatehas been changed. Only the scale of the effect has increased withtechnological evolution. Today, the earth’s landscape bears themarks of a large-scale modern human civilization; so does its cli-mate. Large, expansive cities, built with billions of tons of con-crete, store the heat of the day, raising temperatures by severaldegrees. Downstream of these heat islands, thunderstorms be-come larger and more violent (Huff 1978).
In areas that were once desert, oases now exist with waterpiped in from hundreds of miles to keep them green. This watereventually makes its way into the air where there was none before.Fully one-third of the small rise in sea level during the last centu-ry—glibly attributed to “global warming”—is actually a result of
.
-.6
-.4
-.2
0
.2
.4
.6
1979 1984 1989 1994 1999
Tem
pera
ture
Dep
artu
res (
°C)
Figure 1 Global temperature trends measured by satellites that be-came operational in 1979 show a statistically significant cooling trendin the lower atmosphere.

The Decline and Fall of Global Warming 23
the “dewatering” of continents by man’s activity (IPCC I1996).Huge areas of monocrop agriculture stretch across previously di-verse regions, changing the colour of the land, changing the mois-ture balance, changing the regional climate, and feedingincreasing billions of people an increasingly better diet.
These influences on the climate are mainly local, in most casesnot extending far past the reaches of the underlying landscapechange. Over the course of the last 150 years, however, humaninfluences on the climate have increased greatly. Primarilythrough the burning of fossils fuels for energy, we have alteredthe chemical make-up of the earth’s atmosphere. Carbon dioxideand other radiatively active gases, such as methane (from bovineflatulence and rice-paddy agriculture), and chlorofluorocarbonrefrigerants, have increased to the point where they may havesubtly changed the climate. The change has been inadvertent—anecessary result of human technological advancement.
These gases absorb infrared radiation emanating from the sur-face of the earth, which is warmed by solar heating. Since thesegases redirect (re-radiate) this energy, an increasing fractiongoes back down towards the surface of the earth as the concen-trations of these gases increase. This phenomenon is called thegreenhouse effect. Humans have very slightly enhanced this nat-ural process that keeps the surface of the planet some 33°Cwarmer than it otherwise would be.
The prime greenhouse gas in the atmosphere is water vapor,the concentration of which is determined by the planetary meantemperature. Over 30°C of the natural greenhouse effect resultsfrom water, and only about 1.5°C of the total of 33°C is causedby carbon dioxide, which is the primary greenhouse gas pro-duced by human activity.
The scientific ferment about climate change has never beenabout the question whether human beings could (or would)change climate. That is an inevitable consequence of knownphysics. But, the more important questions—how much and inwhat fashion—is clearly a matter of great debate. The facts thathave emerged in the last year, in spite of a public climate of fear,are very reassuring. How much? Relatively little. How? In a be-nign or perhaps even beneficial fashion.
BackgroundIn 1990, the first scientific assessment of the United Nations’Intergovernmental Panel on Climate Change (IPCC) stated that

24 Global Warming
“when the latest atmospheric models are run with the presentatmospheric concentrations of greenhouse gases, their simula-tion of climate is generally realistic on large scales” (IPCC 1990:xxviii).
This statement created considerable disagreement in the sci-entific community. As later shown by Mitchell et al. (1995), themost popular type of climate model referred to in the IPCC’sstatement as producing simulations that were “generally realis-tic” predicted that, by now, the earth’s temperature should havewarmed between 1.3°C and 2.3°C (the larger figure refers to thenorthern hemisphere), as a result of changes in greenhouse gas-es caused by human activity.
Clearly this has not been the case. Figure 2 shows the surfacetemperature history of the northern hemisphere, calculated fromland-based thermometers and published by the same United Na-tions’ panel. The warming in the record is about 0.6°C, or morethan three times less than what was predicted. At least half of thatwarming was prior to major changes in the greenhouse effect, i.e.,before 1945. Everything else being equal, then, the maximumcontribution of the enhanced greenhouse effect was 0.3°C.
Figure 2 The ground-based temperature history in the last 100 years(IPCC 1995) shows that at least half of the warming occurred beforeWorld War II. The large changes in the greenhouse effect occur in thepostwar period.
-.6
-.5
-.4
-.3
-.2
-.1
0
.1
.2
.3
.4
.5
1890 1900 1910 1920 1930 1940 1950 1960 1970 1980 1990 2000Year
Tem
pera
ture
Dep
artu
res (
°C)
1/3 Greenhouse enhancement 2/3 Greenhouse enhancement
The Decline and Fall of Global Warming 25
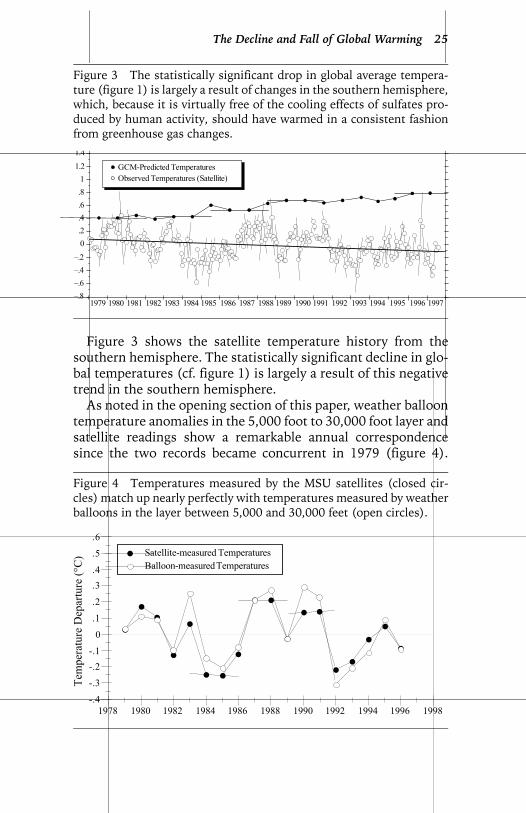
Figure 3 shows the satellite temperature history from thesouthern hemisphere. The statistically significant decline in glo-bal temperatures (cf. figure 1) is largely a result of this negativetrend in the southern hemisphere.
As noted in the opening section of this paper, weather balloontemperature anomalies in the 5,000 foot to 30,000 foot layer andsatellite readings show a remarkable annual correspondencesince the two records became concurrent in 1979 (figure 4).
–.8–.6–.4–.2
0.2.4.6.81
1.2
1.4SOUTHERN HEMISPHERE
1979 1980 1981 1982 1983 1984 1985 1986 1987 1988 1989 1990 1991 1992 1993 1994 1995
Observed Temperatures (Satellite)GCM-Predicted Temperatures
1996 1997
Figure 3 The statistically significant drop in global average tempera-ture (figure 1) is largely a result of changes in the southern hemisphere,which, because it is virtually free of the cooling effects of sulfates pro-duced by human activity, should have warmed in a consistent fashionfrom greenhouse gas changes.
Figure 4 Temperatures measured by the MSU satellites (closed cir-cles) match up nearly perfectly with temperatures measured by weatherballoons in the layer between 5,000 and 30,000 feet (open circles).
Balloon-measured TemperaturesSatellite-measured Temperatures
-.4
-.3
-.2-.1
0
.1
.2
.3
.4
.5
.6
1978 1980 1982 1984 1986 1988 1990 1992 1994 1996 1998
Tem
pera
ture
Dep
artu
re (°
C)

26 Global Warming
Through 1996, both showed no warming trend whatsoever.None of the three temperature histories (and they are the onlythree that exist), surface, satellite, or radiosondes (weather bal-loons) in the analogous level to the satellite, show any netwarming in the last decade (figure 5).
While there has been no overall warming in these records, re-gional patterns of warming are present. The pattern is particu-larly amplified when seasonal differences are examined. Thedifference in temperature trends (winter minus summer) in thesatellite data shows that the warming has been predominantlyoccurring in the coldest air masses—over Siberia in the winter-time (Figure 6). The IPCC data on surface temperatures, whichhas sufficient coverage since the mid-1940s over most of thenorthern hemisphere, shows a similar pattern of relative (winterminus summer) warming over a large part of northern Eurasiaand northwestern North America, which are the source regionsfor the coldest air masses (Figure 7).
Greenhouse theory is consistent with this observation, inas-much as the water vapor and carbon dioxide behave similarlyover a considerable portion of their absorption spectra, andthese air masses are virtually devoid of water vapor. Smallchanges in the absorption in these wavelengths have a logarith-mically decreasing effect on temperature as the carbon-dioxide
Figure 5 Surface, satellite-measured, and weather balloon records(5,000–30,000 ft) all show no warming in the last decade.
.
Weather Balloon-measured Temperatures
Surface (IPCC) TemperaturesSatellite-measured Temperatures
–.4
–.2
0
.2
.4
.6
1986 1988 1990 1992 1994 1996
Tem
pera
ture
Dep
artu
res (
°C)

The Decline and Fall of Global Warming 27
Figure 6 Winter warming minus summer warming in the satellite da-ta. The concentration in the mid-latitudes of the Northern Hemisphereshows that, in general, it is the coldest air masses that have changed.
Figure 7 Winter warming minus summer warming in the surface tem-perature record over the last 50 years. This clearly shows that the bulkof climate change is in the coldest air masses that most people experi-ence—in Siberia and northwestern North America.

28 Global Warming
concentration increases. In other words, the first increments ofeither water vapor or carbon dioxide to these very dry air massesresults in substantial warming. In general, warm air masses con-tain much more moisture, so they are not as sensitive to changesin the concentration of carbon dioxide.
Observations, therefore, confirm that what little, if any, green-house warming has occurred, is characterized by the following:
• according to the satellites, warming is not “global,” inas-much as there is a slight (but statistically significant) nega-tive trend
• according to ground-based thermometers and the satellites,the character of observed warming is a change in the coldestair masses.
These data undermine the IPCC’s 1990 statement about the cor-respondence between observed climate and what was predictedby climate models.
Five years later, the IPCC produced its second assessment ofclimate change (IPCC I 1996). It contains a remarkable sentencethat I have never seen quoted in the mainstream media:
When increases in greenhouse gases only are taken into ac-count . . . most [general circulation models] produce agreater mean warming than has been observed to date, un-less a lower climate sensitivity is used . . . There is growingevidence that increases in sulfate aerosols are partiallycounteracting the [warming] due to increases in green-house gases (IPCC I 1996: 295).
The new consensus might be paraphrased as follows: either it isnot going to warm up as much as earlier indicated or something,like sulfate aerosols, is hiding the warming.
Why observed warming was less than predicted: the sulfate hypothesisThe sulfate explanation for the lack of warming is simple in prin-ciple. The finely divided sulfate particles directly reflect away solarradiation and also serve to brighten existing clouds. They do notreside in the atmosphere for long, so their cooling is primarily inthe northern hemisphere, where almost all are produced by thecombustion of fossil fuel, which contains small amounts of sulfur.

The Decline and Fall of Global Warming 29
Recently, the sulfate hypothesis has been challenged. Hansenet al. (1995) reported that the direct cooling effect of sulfateswas too small to account for the lack of observed warming. Fur-ther, the magnitude of the indirect cooling (from cloud bright-ening) is highly speculative, as Hansen et al. (1997) argued thata “semi direct” heating of the lower atmosphere by aerosol ab-sorption may minimize the indirect cloud effect. Most recently,Hobbs (1997) reported that air samples from the eastern UnitedStates showed a predominance of soot (carbon), which shouldhave created a net warming, rather than sulfates, which shouldhave caused cooling.
Further, the internal inconsistency of the attempts to explainthe lack of planetary warming leads inexorably to the default ar-gument: the planetary surface temperature is simply not as re-sponsive to small changes in the natural greenhouse effect as itwas once thought (modeled) to be.
Without sulfate aerosols, modeling results indicate that theplanetary mean temperature should have risen between 1.3°Cand 2.3°C as a result of the greenhouse enhancement (Mitchell1995). The observed surface rise of 0.6°C in the last 100 yearsand the lack of any warming observed by the satellites demon-strate quite decidedly the lack of connection between observa-tions and forecasts.
The sulfate hypothesis has been prominently championed byWigley (1989), Hansen and Lacis (1990), Taylor and Penner(1994) and most recently by Santer et al. (1996). There are, how-ever, several problems with the models that they propose, nota-bly with the changes that they assume in warming radiation.
It is generally thought that human beings have increased theamount of radiation affecting the planetary surface by about 2.5watts per square meter (W/m2) as a result of the changes ingreenhouse gases. But Taylor and Penner (1994) used a positivegreenhouse change of 1.26 W/m2 or half of the known value of2.45. Further, they assume a cooling from sulfate aerosol of –0.9W/m2, which is much more than most other estimates. Thecombined net change (greenhouse warming + sulfate cooling)is only 0.3 W/m2, far less than any estimate used at the timethey published their model. Since then, the further reduced es-timates of sulfate cooling (Hanson et al. 1995, 1997; Hobbs1997) have made this model even more unrealistic.

30 Global Warming
Even if one allows this exaggerated estimate for the cooling ef-fect of sulfates, using a linear estimation of the temperaturechange when Taylor and Penner’s model is forced to use the ob-served changes in the greenhouse effect of 2.50 W/m2 yields anequilibrium warming solution that is clearly unrealistic (figure 8),especially over the Southern Ocean, where temperatures risenearly 10°C.
The study done by Santer et al. (1996), although it is often citedas the definitive evidence for the sulfate + greenhouse hypothe-sis, was especially controversial (Michaels and Knappenberger1996) because the portion of the troposphere that showed themost dramatic warming during the study period (1963–1987)wasfound to show no change whatsoever when the entire radiosonderecord (1958–1995) was used (figure 9).
It is instructive to use the recent lower estimates of sulfatecooling. Hobbs (1997) implies a global effect of approximately–0.25 W/m2, resulting in a net greenhouse-sulfate forcing upona model of approximately 2.25 W/m2 (2.50 minus 0.25).
Figure 8 Ultimate warming for today’s concentration of greenhousegases and sulfate aerosols calculated when the Taylor and Penner(1994) model is forced to use the observed changes in the greenhouseeffect. It is clear that this model simply predicts too much warming.

The Decline and Fall of Global Warming 31
It is generally assumed, based upon a series of empirical argu-ments, that the sensitivity of the planetary surface to green-house changes is about one degree (C) for every one watt changein the radiation affecting the surface. But the United Nations
Figure 9 Observed warming (°C) in Santer et al. (1996) from 1963 to1987 (top). The highlighted region in the Southern Hemisphere showsthe strong observed warming. The entire temperature history over thesame region from 1957 to 1995 shows no significant warming trend(bottom). However, the period that was chosen for study by Santer etal. (filled circles) warms dramatically.

32 Global Warming
1995 statement opens the possibility that this is wrong, when itsays that climate models for changes in the greenhouse effecttend to produce too much warming “unless a lower climate sen-sitivity is used.”
Assuming again that one-half of the observed warming(0.3°C) is from greenhouse changes, either the sensitivity togreenhouse changes is much lower than current estimates of1°C/W/m2 or the thermal lag of the ocean is enormously long;i.e. the 2.25 degrees of warming would take hundreds of yearsto appear. If that is the case, any policy attempt to mitigate orprevent global warming is simply futile.
Schlesinger and Jiang (1991) and others have argued that re-sponse times for ocean heating are fairly short, on the order of40 to 60 years. The relatively small observed warming that canbe ascribed to greenhouse changes would then yield a lower sen-sitivity (assuming a 1950 net greenhouse change of 30 percentof the total net: 0.3 × 2.2 = 0.66W/m2). At 1°C/W/m2 sensitiv-ity, this implies a warming of about 0.6°C plus nearly twice thatfor the increase since 1950, or a total of roughly 1.6°C for effec-tively doubling the natural carbon dioxide greenhouse effect.The implication is that, unless sulfate aerosols are exerting amuch greater effect than is now thought, the sensitivity is about25 percent of the previously accepted value. This would reducewarming projections for doubled concentrations of atmosphericcarbon dioxide from a mean ultimate value of nearly 4°C downto 1°C, assuming a continuation of small sulfate cooling.
It is interesting that this rather simple calculation is not ap-preciably different from the results from two recent general cir-culation models. Mitchell and Johns (1997) and the NationalCenter for Atmospheric Research (NCAR; described in Kerr1997) have new models that, when adjusted for the medianemission scenarios from IPCC (IPCC I 1996), produce 1.7°C(Mitchell and Johns) and 1.3°C (NCAR) of additional warmingto the year 2100.
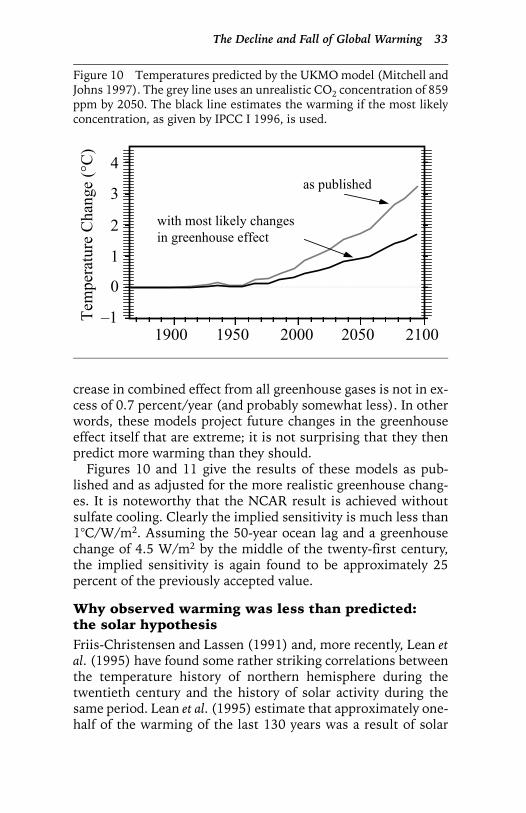
Unfortunately, neither of these results were published withrealistic changes in the greenhouse effect produced by humanactivity (readers may speculate as to why this might have oc-curred). Mitchell and Johns (1997) uses 859 ppm effective car-bon dioxide concentration by the year 2050, and NCARincreases the effective CO2 concentraton by 1 percent per year.IPCC (IPCC I 1996) gives the most likely value for the year 2050of approximately 604 ppm, and it is well known that the in-
The Decline and Fall of Global Warming 33
crease in combined effect from all greenhouse gases is not in ex-cess of 0.7 percent/year (and probably somewhat less). In otherwords, these models project future changes in the greenhouseeffect itself that are extreme; it is not surprising that they thenpredict more warming than they should.
Figures 10 and 11 give the results of these models as pub-lished and as adjusted for the more realistic greenhouse chang-es. It is noteworthy that the NCAR result is achieved withoutsulfate cooling. Clearly the implied sensitivity is much less than1°C/W/m2. Assuming the 50-year ocean lag and a greenhousechange of 4.5 W/m2 by the middle of the twenty-first century,the implied sensitivity is again found to be approximately 25percent of the previously accepted value.
Why observed warming was less than predicted: the solar hypothesisFriis-Christensen and Lassen (1991) and, more recently, Lean etal. (1995) have found some rather striking correlations betweenthe temperature history of northern hemisphere during thetwentieth century and the history of solar activity during thesame period. Lean et al. (1995) estimate that approximately one-half of the warming of the last 130 years was a result of solar
Figure 10 Temperatures predicted by the UKMO model (Mitchell andJohns 1997). The grey line uses an unrealistic CO2 concentration of 859ppm by 2050. The black line estimates the warming if the most likelyconcentration, as given by IPCC I 1996, is used.
–1
0
1
2
3
4
1900 1950 2000 2050 2100
Tem
pera
ture
Cha
nge
(°C
)
as published
with most likely changesin greenhouse effect

34 Global Warming
changes. In particular, much of the warming of the early twenti-eth century—prior to the greenhouse enhancement—appears tobe a product of the sun.
The solar argument also favours the concept of reduced sensi-tivity to greenhouse gases produced by human activity. It leavesthe same 0.3°C of warming in the last 100 years as a residual,possibly to be explained by greenhouse changes. This gives thesame low implied sensitivity and reduced estimates of overallwarming that are consistent with the lowest forecasts now beinggenerated by general circulatory models with realistic green-house changes.
ConclusionRemember IPCC’s statement in their recent (1995) volume asnoted above:
when increases in greenhouse gases only are taken into ac-count . . . most [general circulation models] produce a great-er mean warming than has been observed to date, unless a
Tem
pera
ture
Cha
nge
(°C
)
0
.5
1.0
1.5
2.0
2.5
–0.5
0 20 40 60 80 100 120Model Year
as published
with most likely changesin greenhouse effect
Figure 11 Temperatures predicted by the new NCAR model. Thedashed line increases effective CO2 by 1 percent per year but a more re-alistic increase is 0.7 percent per year. The solid line estimates the tem-peratures using the more realistic value. The nominal starting time isaround 1965.

The Decline and Fall of Global Warming 35
lower climate sensitivity is used . . . There is growing evi-dence that increases in sulfate aerosols are partially counter-acting the [warming] due to increases in greenhouse gases.
It is highly likely that attempts will continue to be made to ex-plain the lack of warming with some compensating emissionlike sulfate aerosol. In fact, it is also likely that there will be con-siderable resistance to the alternative explanation—that the sen-sitivity was simply overestimated. Nonetheless, the balance ofevidence suggests there is, at best, a very small human influenceon global climate. President Clinton was correct when statedthat humans change the climate. But the fact that the changesare very small, primarily in the coldest air, and likely to remainsmall, spells the end of the greenhouse scare—at least in a worldcontrolled by reason.
References
Friis-Christensen, E., and K. Lassen (1991). Length of the solar cycle:an indicator of solar activity closely associated with climate. Science254: 698–700.
Hansen, J.E., and A. A. Lacis (1990). Sun and dust versus greenhousegases: an assessment of their relative roles in global climatechange. Nature 346: 713–18.
Hansen J.E., M. Sato, and R. Ruedy (1995). Long-term changes of diur-nal temperature cycle: implications about mechanisms of globalclimate change. Atmos. Res. 37: 175–209.
——— (1997). Radiative forcing and climate response. J. Geophy. Res.102: 6831–64.
Hobbs, P.V. (1997). Interviewed in London Sunday Times, June 8, 1997.Hobbs, P.V., J.S. Reid, and R.A. Kotchenruther (1997). Direct radiative
forcing by smoke from biomass burning. Science 275: 1776–78.Huff, F.A. (1978). Radar analysis of urban effects on rainfall. Summary
of Metromex (vol. 2). Illinois State Water Survey Bulletin 63: 265–73.Intergovernmental Panel on Climate Change (IPCC) (1990). Climate
Change: The IPCC Scientific Assessment. Report prepared for IPCC byWorking Group I. John T. Houghton et al. (eds). Cambridge: Cam-bridge University Press.
Intergovernmental Panel on Climate Change, Working Group I (IPCC I)(1996). Climate Change 1995: The Science of Climate Change. Contri-bution of Working Group I to the Second Assessment Report of the

36 Global Warming
Intergovernmental Panel on Climate Change. John T. Houghton etal. (eds). Cambridge: Cambridge University Press.
Kerr, R.A. (1997). Model gets it right—without fudge factors. Science276: 1041.
Lean, J., Beer, J., and R. Bradley (1995). Reconstruction of solar irradi-ance since 1610: implications for climate change. Geo. Res. Lett. 22:3195–98.
Michaels, P.J., and P.C. Knappenberger (1996). Human effect on globalclimate? Nature 384: 522–23.
Mitchell, J.F.B., R.A. Davis, W.J. Ingram, and C.A. Senior (1995). Onsurface temperature, greenhouse gases, and aerosols: models andobservations. Journal of Climate 8: 2364–85.
Mitchell, J.F.B., and T. C. Johns (1997). On modification of globalwarming by sulfate aerosols. J. Climate 10: 245–66.
Pearce, F. (1997). Greenhouse wars. New Scientist 139: 38–44.Santer, B.D., K.E. Taylor, T.M.L.Wigley, T.C. Johns, P.D. Jones, D.S.
Karoly, J.F.B. Mitchell, A.H. Oort, J. E. Pennel, V. Ramaswamy,M.D. Schwartzkopf, R.J. Stouffer, and S. Tett (1996). A search forhuman influences on the thermal structure of the atmosphere. Na-ture 382: 39–45.
Schlesinger, M., and Jiang (1991). Revised projection of future green-house warming. Nature 350: 219–21.
Taylor, K.E., and J.E. Penner (1994). Response of the climate system toatmospheric aerosols and greenhouse gases. Nature 369: 734–37.
United States, Department of Energy (1993) and updates. Trends ’93: ACompendium of Data on Global Climate Change. Washington, DC: De-partment of Energy.
United States, Department of Energy (1993) and updates. Trends ’93: ACompendium of Data on Global Climate Change. Washington, DC: De-partment of Energy.
Wigley, T.M.L. (1989). Possible climate change due to SO2-derivedcloud condensation nuclei. Nature 339: 365–67.
Wigley, T.M.L., and S.C.B. Raper (1987). Thermal expansion of seawa-ter associated with global warming. Nature 330: 324–27.