
INF 123 SW ARCH, DIST SYS & INTEROP LECTURE 19 Prof. Crista Lopes.
The CRISTA-2 mission
K. U. Grossmann, D. Offermann, O. Gusev, J. Oberheide,1 M. Riese,2 and R. Spang3
Physics Department, University of Wuppertal, Wuppertal, Germany
Received 23 March 2001; revised 7 November 2001; accepted 10 November 2001; published 25 October 2002.
[1] The second mission of the CRyogenic Infrared Spectrometers and Telescopes for theAtmosphere (CRISTA) experiment took place in August 1997. The experiment was flownaboard the ASTROnomical Shuttle PAllet Satellite (ASTRO-SPAS) free-flying platformlaunched by the NASA space shuttle. CRISTA analyzes the infrared radiation emitted bytrace gases from the Earth limb in the altitude regime from the upper troposphere to thelower thermosphere. The main aim of CRISTA is to detect small-scale dynamicallyinduced structures in the distribution of trace constituents in the middle atmosphere. Theinstrument is therefore equipped with three telescopes that simultaneously collect theinfrared radiation from three different air volumes. The high spatial density of themeasurement grid obtained during the first CRISTA mission in November 1994, as well asthe latitudinal coverage, was considerably improved by making use of newly developedsatellite pointing and maneuvering capabilities. The altitude coverage was extended toinclude the upper troposphere where water vapor distributions are analyzed. Dynamicallyinduced features are observed in practically all trace gases and at various spatial scales.The smallest scales that could be analyzed on the basis of the CRISTA data set are wellbelow 100 km. Compared to the first mission, much more emphasis was laid onmeasurements in the upper mesosphere and lower thermosphere—this was possiblebecause of higher radiometric sensitivities in some channels. Atomic oxygen, carbondioxide, and ozone densities are derived in the upper mesosphere and lower thermosphere.The mission conditions allowed the study of polar stratospheric clouds (PSC) over theAntarctic and of polar mesospheric clouds (PMC) at high northern latitudes. For the firsttime, summer high latitude mesopause temperatures were retrieved from CO2 15-mmspectra using a nonlocal thermodynamic equilibrium model. The derived temperaturescompare well with a temperature climatology based on rocket soundings. INDEX TERMS:
0341 Atmospheric Composition and Structure: Middle atmosphere—constituent transport and chemistry
(3334); 0342 Atmospheric Composition and Structure: Middle atmosphere—energy deposition; 0350
Atmospheric Composition and Structure: Pressure, density, and temperature; 0394 Atmospheric Composition
and Structure: Instruments and techniques
Citation: Grossmann, K. U., D. Offermann, O. Gusev, J. Oberheide, M. Riese, and R. Spang, The CRISTA-2 mission, J. Geophys. Res.,
107(D23), 8173, doi:10.1029/2001JD000667, 2002.
1. Introduction
[2] For a long time most properties of the Earth’s middleatmosphere were characterized by zonal mean values or evenby spatial and temporal constants. Later it became evident onthe basis of experimental data that large scale planetarywaves modulate important stratospheric parameters, includ-ing temperature and ozone concentration [Drummond et al.,1980; Krueger et al., 1980; Gille and Russell III, 1984].
Experiments carried out from the ground, on balloons, or bysounding rockets frequently revealed atmospheric variabilityon much smaller scales and in practically all atmosphericparameters and at all altitudes. Some examples of suchstructures are found in the studies of Offermann [1987],Murphy et al. [1993], Pfister et al. [1993], and Thrane et al.[1994]. The observed small- and medium-scale structures aremostly due to dynamical processes. Quantitative knowledgeof winds, waves, or turbulence is of considerable interest, aspart of the trace gas and energy transport in the atmosphereoccurs via these processes [McIntyre and Palmer, 1983;Randel et al., 1993; Chen et al., 1994]. Previous develop-ment of measuring techniques has led to important improve-ments in simultaneous coverage of many trace gases, as wellas in measurement precision and accuracy. The spatial andtemporal measurement density has, however, not been aug-mented in a similar way [Grossmann, 2000]. As numer-ical models go to higher and higher spatial resolution, the
JOURNAL OF GEOPHYSICAL RESEARCH, VOL. 107, NO. D23, 8173, doi:10.1029/2001JD000667, 2002
1Now at High Altitude Observatory, National Center for AtmosphericResearch, Boulder, Colorado, USA.
2Now at Institute for Chemistry and Dynamics of the Geosphere,Institute I: Stratosphere, Research Center Julich, Julich, Germany.
3Now at Department of Physics and Astronomy, University of Leicester,Leicester, UK.
Copyright 2002 by the American Geophysical Union.0148-0227/02/2001JD000667
CRI 1 - 1

demand for high spatial density global information increases.Studies of middle atmospheric composition or dynamics on aglobal scale require satellite remote sensing measurements.Infrared or microwave sounders can sense the atmosphere atall local times, independent of solar illumination. Basicallytwo types of observation geometry are used. The limbsounders exhibit a good vertical resolution, on the order of1–2 km, but their horizontal data density is generally poorbecause it is limited by the separation of two successiveorbits. Nadir sounders in contrast have a very good horizon-tal resolution, which in some cases is combined with imagingor cross-track scanning, yielding a very dense data network.Their vertical resolution is, however, poor or even restrictedto total column measurements.[3] An important step toward improving the spatial data
density in all three dimensions, combined with good tem-poral resolution for a large number of trace gases, has beenachieved with the triple telescope sensor CRISTA (CRyo-genic Infrared Spectrometers and Telescopes for the Atmos-phere). CRISTA is a cryogenically cooled infrared limbsounding instrument optimized to measure trace gases inthe middle atmosphere on a dense horizontal grid. This isachieved by using three independent telescopes each fol-lowed by grating spectrometers for the midinfrared spectralregime. The three telescopes (called L, C, and R for left,center, and right, respectively) simultaneously sense threeatmospheric volumes separated by 18� in azimuth. The three
tracks of the CRISTA instrument are separated by about 650km at the tangent point in the stratosphere, in the case whenthe main axis of the instrument (which is the center telescopeviewing direction) lies in the orbital plane. The measurementgeometry is sketched in Figure 1. The distance between twoair volumes along the orbital flight direction is a function ofthe time needed to perform one altitude scan and is between200 and 600 km except for some special observation modes.[4] For its orbital measurements CRISTA is integrated in
the free-flying science platform ASTRO-SPAS (ASTRO-nomical Shuttle PAllet Satellite [Wattenbach and Moritz,1997]) which is launched and subsequently retrieved by theNASA space shuttle for short-lived exploratory missions.Jointly with the CRISTA infrared soundings, ultravioletspectra are measured by the Middle Atmosphere HighResolution Spectrograph Investigation (MAHRSI [Conwayet al., 1999]). MAHRSI is bore-sighted with the centralCRISTA telescope.[5] The first flight of CRISTA was part of the space
shuttle mission STS 66 together with the ATLAS-3 payload[Kaye and Miller, 1996] in November 1994. Details of thismission, as well as a description of the instrument, are foundin the work of Offermann et al. [1999]. The utility of thehigh data density obtained in the stratosphere and meso-sphere was demonstrated during this flight. Structures ofvarious scales, ranging from gravity waves to planetaryscale disturbances, were detected in a number of trace gases
Figure 1. The CRISTA measurement geometry.
CRI 1 - 2 GROSSMANN ET AL.: THE CRISTA-2 MISSION

and were published in a series of papers referenced byOffermann and Conway [1999]. Further results are found inthe studies of Eckermann and Preusse [1999], Edwards etal. [2000], Oberheide et al. [2000], Preusse et al. [2000],Riese et al. [2000, 2001], and Tan and Eckermann [2000].[6] A different situation is encountered at higher alti-
tudes. Most previous experimental efforts to measure tracegases have been devoted to the stratosphere so far. Littleexperimental data is available in the mesosphere and lowerthermosphere, since few satellite experiments have beendedicated to this regime. Many parameters and manyprocesses can be studied or are detected more easily at thehigher altitudes since atmospheric chemistry is much sim-pler than in the stratosphere. Global climate change due toenhanced greenhouse gases are probably observed withmuch higher amplitudes in the mesosphere than below[Beig, 2000]. Some indications of long-term trends havebeen found in the appearance frequency of polar meso-spheric clouds [Gadsden, 1997]. Although this altituderegime appears to be much simpler, a number of importantquestions remain open: these include the mesospheric ozonebudget and the high water vapor mixing ratios detected inthe vicinity of 70 km [Crutzen, 1997].The mesosphere canalso have a considerable influence on the underlying layersvia the so-called downward control principle [Haynes,1991]. The high-latitude, zonally symmetric modulationknown as the Arctic Oscillation (or Annular Mode) canpropagate downward from the mesosphere to the strato-sphere or even into the troposphere in some cases [Baldwinand Dunkerton, 1999, 2000]. A sufficiently well spatiallyresolved sounding of the mesosphere/lower thermosphere isthus very important for a future, more precise understandingof this region. A large part of the measurement time ofCRISTA-2 was therefore devoted to the mesosphere and thelower thermosphere and the radiometric sensitivity of therelevant channels was enhanced.
2. The CRISTA-2 Experiment
[7] CRISTA on ASTRO-SPAS (also-called CRISTA-SPAS-2) was launched on 7 August 1997, at 1441 UT byspace shuttle Discovery (mission STS 85) into its preplanned
300 km circular orbit with a 57� inclination. The ASTRO-SPAS satellite was released about 8 hours later for slightlyless than 9 days of free flight. The northernmost point of theorbit was reached at about 1500 UT corresponding to about1400 LST. Measurements were made between 8 August and16 August. During this period the orbital plane precessedonly by slightly more than 30�, so there was only a smallchange of about 2 hours in the local measurement times overthe entire mission. The individual local times at the sensedair volumes vary to some extent due to the attitude of thesatellite. The local times of the CRISTA center telescopetangent point for the complete mission are shown in Figure 2.The northern hemisphere was sensed essentially duringdaytime and the southern hemisphere during darkness. Midand low latitude data are confined to the morning andevening hours. CRISTA-2 encountered two extreme atmos-pheric conditions—the cold sunlit summer mesopause in thenorth and the cold stratospheric night near and over theAntarctic, characterized by observations of polar meso-spheric clouds (PMC) [Stevens et al., 2001] as well as ofpolar stratospheric clouds (PSC) [Spang et al., 2001]. Forthis second flight significant improvements were introducedto the instrument as well as the spacecraft, without changingthe instrumental concept [Grossmann and Offermann, 1999].As in the first mission, the MAHRSI experiment formed partof the scientific instrumentation of the ASTRO-SPAS.[8] The main changes on the instrument hardware side
are a replacement of the midinfrared Si:Ga detectors of thecenter telescope spectrometers (SCS and SCL) by Si:AsBIB detectors [Reynolds et al., 1989]. This increased thesignal-to-noise ratio for most channels. The instrumentperformance in the upper mesosphere and lower thermo-sphere was thus improved in the center telescope. A furtherchange was also made to the far-infrared spectrometer. Achannel was added to measure the atomic oxygen emissionline at 63 mm in the lower thermosphere; no absorbing filters
Figure 2. Distribution of the local times of the measuredair volumes during the mission.
Table 1. Channel Allocation
Number Species ChannelDesignationa
WavelengthCoverageb, mm
1 CH4, N2O, N2O5,CF4
SL1, SCS1, SR1 7.5–8.6 [9.7]
2 CO2, CO, O3 SCS2 4.18–4.81 [5.36]3 O3 SL3, SCS3, SR3 8.91–10.22 [11.32]4 NO, H2O SCS4, SR4 4.92–5.58 [6.13]5 HNO3, CFC12 SL4, SCS5, SR5 10.43–11.78 [12.88]6 T, O3, CFC11,
HNO3, ClONO2,CCl4
SL5, SCS6c, SR6 11.55–12.88 [13.98]
7 H2O, NO2 SL6, SCS7, SR7 6.07–6.73 [7.28]8 T, p SL8, SCS8, SR8 12.79–14.1 [15.2]
10 O3 SCL1 9.29–10.311 T, p SCL2 14.34–15.5812 O(3P), HF, H2O SCL3 59.0–65.013 N2O, CO2 SCL4 16.21–17.4214 O(3P), HF, H2O SCL5 60.1–66.115 H2O, HCl SCL6 65.0–70.91aSL, SR, SCS, SCL designate channels in the left, right, center short-
wavelength, and center long-wavelength spectrometers, respectively.bThe wavelength limits given in brackets are for every 4th or 6th scan in
the stratosphere or mesosphere modes, respectively.cTwo additional detectors are integrated in this channel: SCS6L and
SCS6R which are used in conjunction with the special observation mode‘‘staring’’ (Table 3) only.
GROSSMANN ET AL.: THE CRISTA-2 MISSION CRI 1 - 3
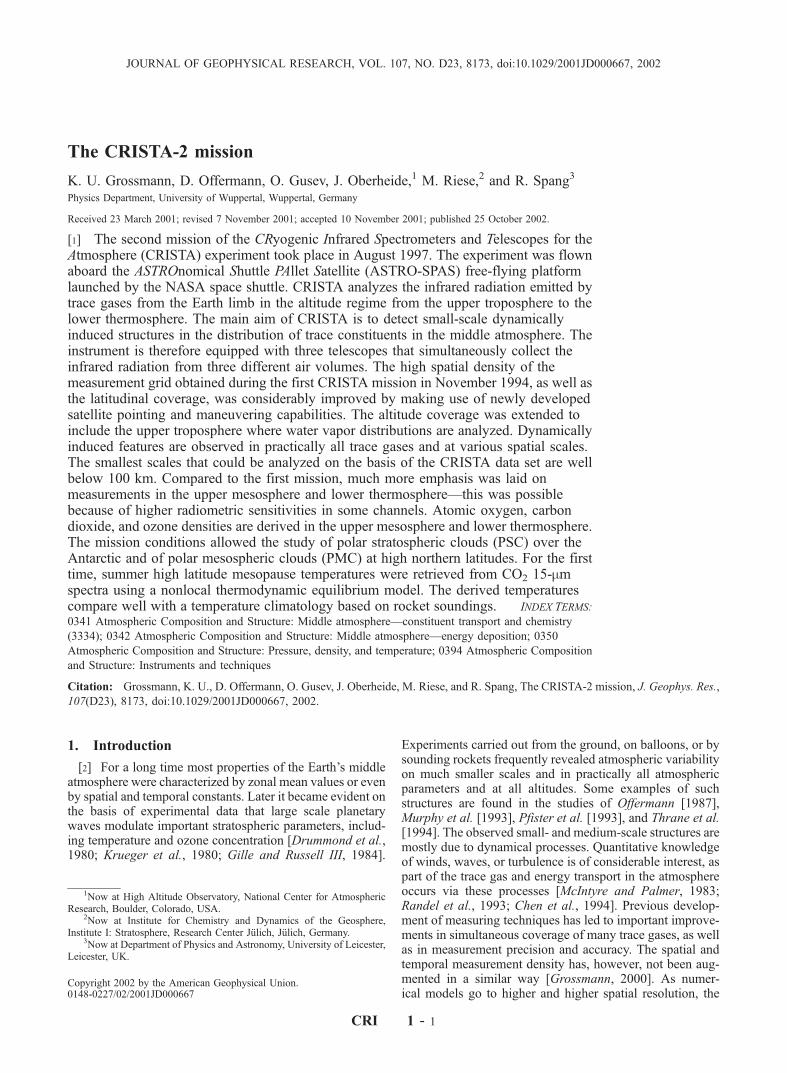
are necessary as the 63 mm line is the only emission ofimportance at these altitudes and in this wavelength region.The signal-to-noise ratio was thereby increased by a factorof 10 compared to the capabilities of CRISTA-1. The scanrange of each detector channel as used in CRISTA-2 and thespecies observed are summarized in Table 1. The altitudes atwhich trace gas densities and temperatures are (or will be)available from CRISTA-2 are shown schematically inFigure 3. In addition to the gases shown, emission featuresof HF, HCl, and HNO4 have been identified.[9] CRISTA was extensively calibrated before and after
the mission. The radiometric sensitivity was determinedusing a large cryogenic blackbody which fills the completefield of view of CRISTA. Its temperature could be variedfrom 10 K to 260 K, covering the large wavelength range ofCRISTA of 4–71 mm. During the course of the mission thetemperatures of the SCS and SCL detectors changed,respectively, from 3.35 to 3.60 K and 3.28 to 3.51 K. Allcalibrations were therefore done for a series of discretedetector temperatures within this range. During the missionthe relative sensitivity was monitored by viewing a black-ened spot located on the inside of the instrument cover. Thiswas done whenever the cover was closed. The absoluteradiometric calibrations before and after the mission agreedto better than ±1% for most channels. In some cases theagreement is less good, it reaches only ±4.3% for the shortwavelength BIB detectors (SCS2 and SCS4, Table 1). Therelative sensitivity variations seen during the mission aresimilar (mostly <1% and <4.5% at maximum).[10] In several cases the very high impedance photo-
conducting detectors in CRISTA show memory effects suchthat the instantaneous detector signal is influenced by thesignal history over some preceding period. These relaxationeffects vary between detectors and depend on the detectortemperature. They generally reach a few % during calibra-tion and in flight, but can be larger in extreme cases. Mucheffort was devoted to the characterization and quantificationof the relaxation effects during ground calibration. A specialcryogenic blackbody source was developed which allowedillumination of the detectors with pulses of a multitude ofradiation levels and of varying lengths. Based on these
measurements a correction model was developed [Ern etal., 2002] which was successfully applied to the CRISTA-1data set but which is still under development for CRISTA-2.To date, only a first-approximation correction has beenapplied to the CRISTA-2 data. The further effects of theapplication of the correction model are included in the pre-sent error estimates. The spectral resolution and the wave-length allocation was characterized by placing gasabsorption cells in the telescope beams. The final adjustmentof these parameters was made with the flight data from theatmosphere. The line of sight of the telescopes was measuredand aligned relative to both the ASTRO-SPAS attitudereference and the MAHRSI instrument. In the mission, theline of sight calibration was verified twice by pointingCRISTA toward Jupiter while measuring reference starpositions with the ASTRO-SPAS star camera.[11] A major advance was made in the performance of the
ASTRO-SPAS platform. The attitude of the satellite isderived from a star field camera and a gyro package incombination with a GPS (global positioning system) positiondetermination. The attitude is actively controlled via a cold-gas system. For the second CRISTA mission a new attitudecontrol software was available; this allowed the satellite to beslewed around the local vertical axis, while maintaining thefields of view of all three telescopes at the Earth’s limb. Theattitude timeline could be changed by ground commands innear real time. This capability facilitated a number ofobservational modes which considerably enhanced the sci-ence return from this mission, including the extension of thelatitudinal coverage to ±74�. Details are given below.[12] The CRISTA measurements cover altitudes from the
upper troposphere to the lower thermosphere. This largealtitude range is scanned in different scan modes whichconcentrate either on the troposphere/stratosphere or on themesosphere/lower thermosphere regions. The scan modes,their altitude coverage, the step width, and the time spent foreach mode are summarized in Table 2. Emissions from thelower thermosphere are almost exclusively analyzed bychannels of the center telescope spectrometers. During themesosphere/lower thermosphere scan modes the lateraltelescopes’ scan pattern is therefore limited in altitude inorder to optimize the data return.[13] Several special observation modes were carried out
by CRISTA-2 to test the instrument capabilities for possible
Figure 3. Gases analyzed by CRISTA-2.
Table 2. Standard Observation Modes
Mode Altitudes, km Altitudes, km TimeScan Step, km Scan Step, km
Center Telescope Lateral Telescope
S (stratosphere) 11–55 (SCS) 11–55 88 h 48 m31–75 (SCL)
�z = 2 �z = 2S–L (stratosphere-low) 7–55 (SCS) 7–55 9 h 25 m
27–75 (SCL)�z = 2 �z = 2
M (mesosphere) 40–130 (SCS) 15–105 60 h 27 m60–150 (SCL)�z = 2.15 �z = 2.15
T (thermosphere) 60–165 (SCS) 60–102 22 h 57 m80–185 (SCL)
�z = 2.5 �z = 1nadir 1 h 16 mcalibration/alignment 11 h 56 m
total 194 h 49 m
CRI 1 - 4 GROSSMANN ET AL.: THE CRISTA-2 MISSION
future experiments and for technical/calibration reasons.These special modes are listed in Table 3. In order toevaluate and to possibly improve the performance of therelaxation correction model for the detectors on the basis ofthe inflight data, the special observations ‘‘strat/vr’’, ‘‘meso/vr’’, and ‘‘relax’’ for the stratosphere, mesosphere, andthermosphere scan modes, respectively, were carried out.In these observations each altitude is observed using twospectral scans with different wavelength scan directions.The differences between the two spectra are due to the
temporal behavior of the detectors and should be eliminatedby means of the relaxation correction model. Such measure-ments were carried out for the stratosphere and mesospherescan modes. A different approach was used in the thermo-sphere for the far infrared wavelengths, since only onespectral feature (single line at 63 mm from atomic oxygen)is present; in this case the spectrometer scans were stoppedat the center of the emission line for some time (10 min) tocompare longtime constant radiation exposure of the detec-tor with the standard scan.[14] The calibration/alignment periods include radiomet-
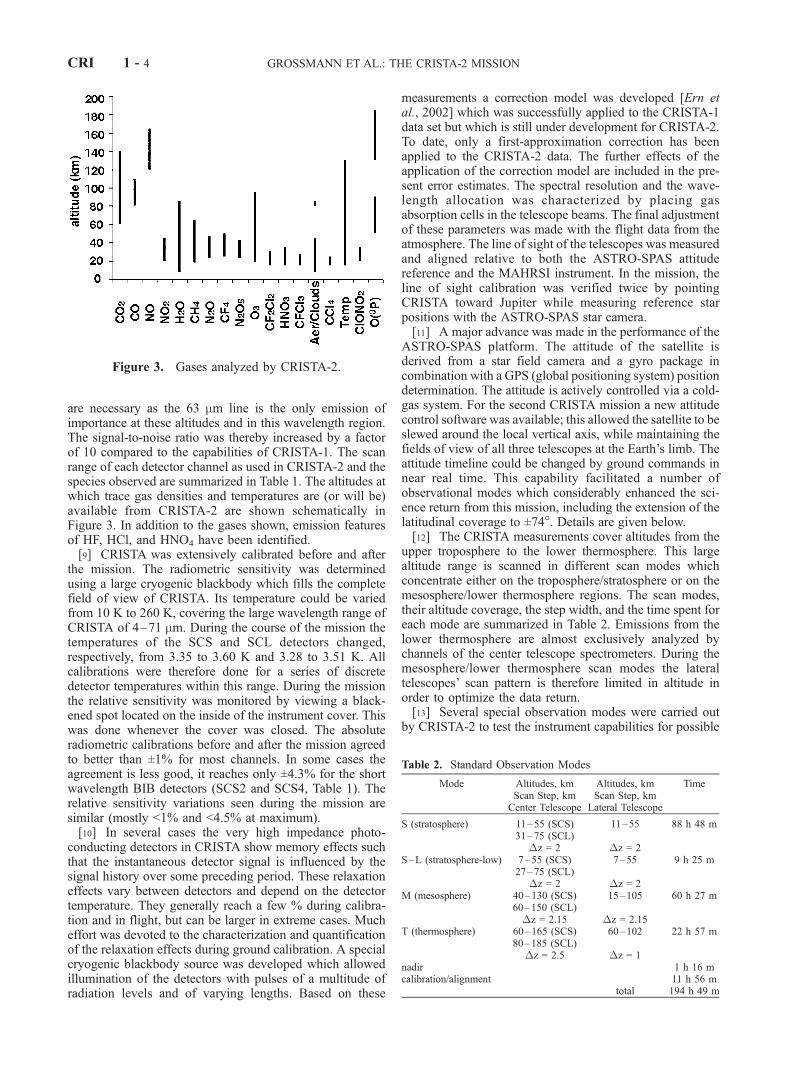
ric calibration using a target located in the CRISTA instru-ment cover, and line-of-sight verifications using Jupiter as atarget. The line-of-sight calibrations were performed twiceduring the mission (Figure 4). The radiometric calibrationswere performed whenever the instrument cover was closedin between alignment measurements and before and afterthe main data-taking period. In Figure 4 the CRISTAmission timeline is shown. At the beginning of the measure-ment period the mesosphere and thermosphere were sensed,followed by a 4-day period concentrating on the strato-sphere. The higher altitudes were observed again for the last2.5 days of the measurement period.
3. Observations: Stratosphere and UpperTroposphere
[15] The data conditioning and trace gas retrieval proce-dures are done in the same way and use the same algorithmsas for CRISTA-1 [Riese et al., 1999]. Of course the datareduction is still preliminary and less advanced than for the
Table 3. Special Observation Modes
Mode Altitudes Remarks
validation 11–67 (87, SCL) [km] during pointing at rocketprobes/balloons
nadir – standard scans, 1 orbitstrat/vr same as standard
stratosphere modes{S and S–L}
2 spectra on each altitudestep—one with increasing/one with decreasingwavelength
meso/vr same as standardmesosphere mode {M}
same as strat/vr
relax fixed 130 km fixed wavelegth (63 mm)staring fixed altitudes observation perpendicular
to orbit planeSCS = 30 [km]SR/SL = 17 [km]
therox same as thermosphere reduced spectral scan(63 mm line only)
coalignment alignment verificationbetween CRISTA andsatellite attitude control
slew of primary mirror andslew of ASTRO-SPAS,fixed wavelength
calibration calibration target oninstrument cover MDA
standard spectral scan
Figure 4. Mission timeline.
GROSSMANN ET AL.: THE CRISTA-2 MISSION CRI 1 - 5
first mission. The data from CRISTA-2 presented in thevarious papers of this volume are labeled V1 (version 1).Most of them can be accessed via the CRISTA homepage:http://www.crista.uni-wuppertal.de.[16] An example of the data from the stratospheric
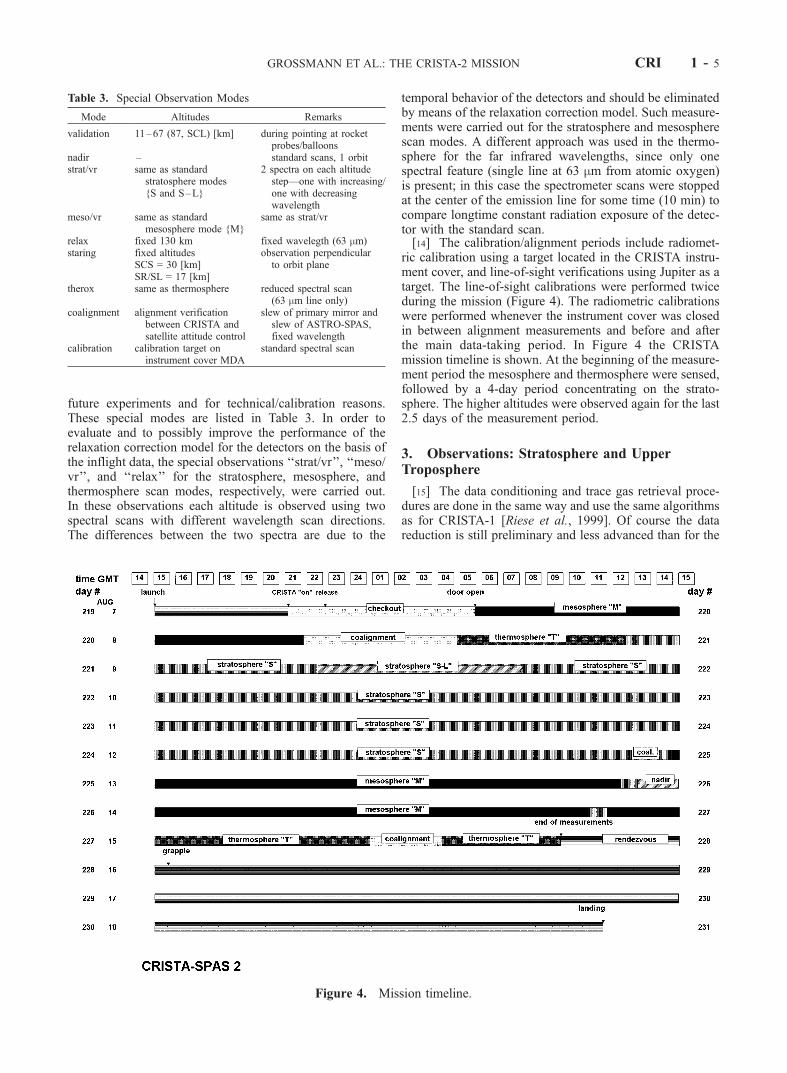
observations (Table 2) is shown in Figure 5. Ozone mixingratios measured on 10 August 1997 at an altitude of 31 kmare presented. The data in Figure 5 were recorded over aperiod of 24 hours. Each symbol represents one completealtitude scan of all gases measured by CRISTA. The tracksof the three telescopes are clearly seen. Figure 5 demon-strates the amount of soundings and the data density ofCRISTA obtained during one day only. Most of this dayCRISTA was operated in a standard observation geometry,the so-called ‘‘ping-pong’’ mode. In this attitude modeCRISTA-SPAS slews with constant angular velocity alter-nating clockwise and counterclockwise around the localvertical axis. The movements are synchronized with theorbit position such that the CRISTA center telescope viewsnorthwards (or more precisely at +72� from the orbit plane)at the northernmost point of each orbit, views backwards(i.e. within the orbital plane but at 180� to the velocityvector) while above the equator, and views southwards (at�72� from the orbital plane) at the southernmost point ofthe orbit. The ‘‘L’’ telescope is then oriented straight northat the high north orbital position of CRISTA and the ‘‘R’’telescope is oriented straight south at the respective point inthe southern hemisphere. As CRISTA is a limb viewing
experiment latitudes up to about ±74� are accessible in thestratosphere (Figure 5) although flying on a 57� orbit. Athigher altitudes the latitudinal coverage is slightly less.[17] In the northern summer hemisphere a gradual
decrease of the ozone mixing ratios from high concentrationsover the tropics to low values at polar latitudes is observed.The longitudinal variations are low as far as large scalestructures (i.e. larger than 1500 km) are concerned. In Figure6a the ozone concentrations at 31 km in the 40–50�Nlatitude band and averaged over 10� in longitude are plotted.The maximum variability is ±0.2 ppmv or less than 3%. Theprofile in Figure 6b shows the same quantity but for thesouthern hemisphere (40–50�S). Considerable large scalewave activity is seen with mixing ratio variations which arehigher by a factor of 10 compared to the northern hemisphere[Ward et al., 2000]. The accuracy of the derived mixingratios is 10% for the northern hemisphere profile and 9% forthe southern hemisphere profile. The statistical errors inFigure 6 are below 0.7% and therefore much lower thanthe observed fluctuations. The dynamical situation of thestratosphere was dominated by strong planetary wave activ-ity in the southern hemisphere [Gunther et al., 2002; Riese etal., 2002]. This shows up in form of streamers in the ozonedistribution of Figure 5. Similar structures and in a numberof trace gases were found by CRISTA-1 [Offermann et al.,1999]. Two streamers of ozone rich air can be identified. Onestreamer leaves the subtropics over the central pacific, leadsover the southern tip of South America, and then goes back
Figure 5. Ozone mixing ratios at 31 km altitude measured on one day.
CRI 1 - 6 GROSSMANN ET AL.: THE CRISTA-2 MISSION
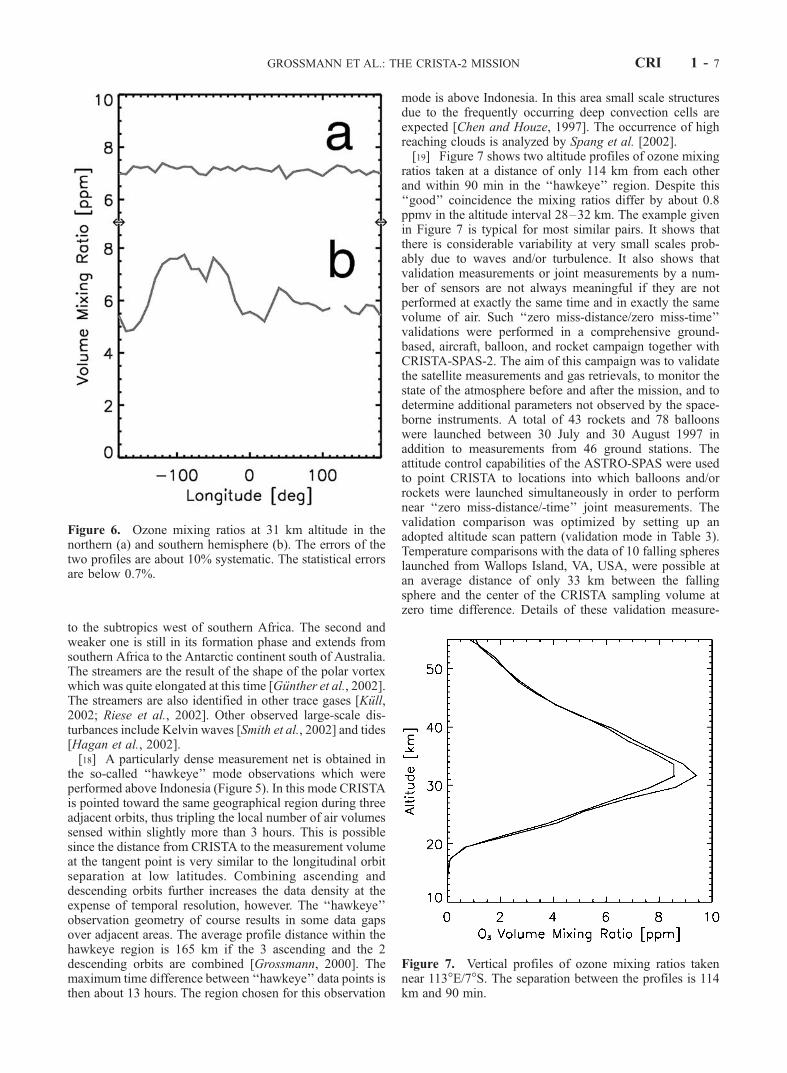
to the subtropics west of southern Africa. The second andweaker one is still in its formation phase and extends fromsouthern Africa to the Antarctic continent south of Australia.The streamers are the result of the shape of the polar vortexwhich was quite elongated at this time [Gunther et al., 2002].The streamers are also identified in other trace gases [Kull,2002; Riese et al., 2002]. Other observed large-scale dis-turbances include Kelvin waves [Smith et al., 2002] and tides[Hagan et al., 2002].[18] A particularly dense measurement net is obtained in
the so-called ‘‘hawkeye’’ mode observations which wereperformed above Indonesia (Figure 5). In this mode CRISTAis pointed toward the same geographical region during threeadjacent orbits, thus tripling the local number of air volumessensed within slightly more than 3 hours. This is possiblesince the distance from CRISTA to the measurement volumeat the tangent point is very similar to the longitudinal orbitseparation at low latitudes. Combining ascending anddescending orbits further increases the data density at theexpense of temporal resolution, however. The ‘‘hawkeye’’observation geometry of course results in some data gapsover adjacent areas. The average profile distance within thehawkeye region is 165 km if the 3 ascending and the 2descending orbits are combined [Grossmann, 2000]. Themaximum time difference between ‘‘hawkeye’’ data points isthen about 13 hours. The region chosen for this observation
mode is above Indonesia. In this area small scale structuresdue to the frequently occurring deep convection cells areexpected [Chen and Houze, 1997]. The occurrence of highreaching clouds is analyzed by Spang et al. [2002].[19] Figure 7 shows two altitude profiles of ozone mixing
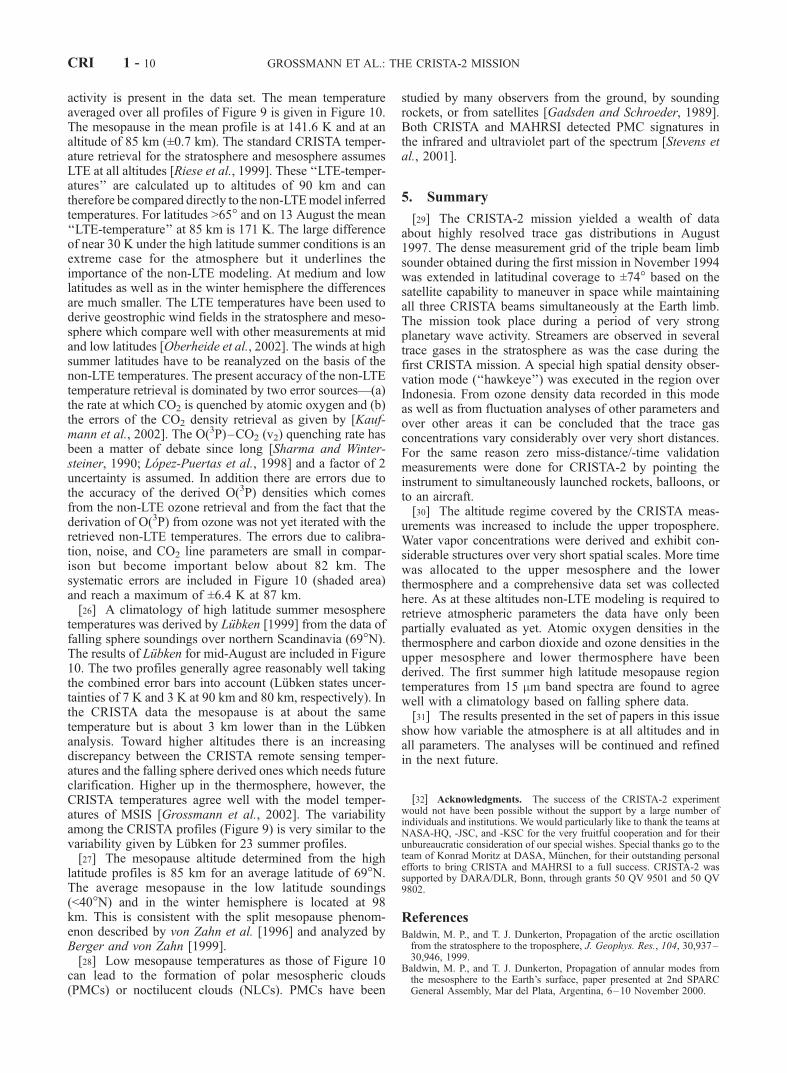
ratios taken at a distance of only 114 km from each otherand within 90 min in the ‘‘hawkeye’’ region. Despite this‘‘good’’ coincidence the mixing ratios differ by about 0.8ppmv in the altitude interval 28–32 km. The example givenin Figure 7 is typical for most similar pairs. It shows thatthere is considerable variability at very small scales prob-ably due to waves and/or turbulence. It also shows thatvalidation measurements or joint measurements by a num-ber of sensors are not always meaningful if they are notperformed at exactly the same time and in exactly the samevolume of air. Such ‘‘zero miss-distance/zero miss-time’’validations were performed in a comprehensive ground-based, aircraft, balloon, and rocket campaign together withCRISTA-SPAS-2. The aim of this campaign was to validatethe satellite measurements and gas retrievals, to monitor thestate of the atmosphere before and after the mission, and todetermine additional parameters not observed by the space-borne instruments. A total of 43 rockets and 78 balloonswere launched between 30 July and 30 August 1997 inaddition to measurements from 46 ground stations. Theattitude control capabilities of the ASTRO-SPAS were usedto point CRISTA to locations into which balloons and/orrockets were launched simultaneously in order to performnear ‘‘zero miss-distance/-time’’ joint measurements. Thevalidation comparison was optimized by setting up anadopted altitude scan pattern (validation mode in Table 3).Temperature comparisons with the data of 10 falling sphereslaunched from Wallops Island, VA, USA, were possible atan average distance of only 33 km between the fallingsphere and the center of the CRISTA sampling volume atzero time difference. Details of these validation measure-
Figure 6. Ozone mixing ratios at 31 km altitude in thenorthern (a) and southern hemisphere (b). The errors of thetwo profiles are about 10% systematic. The statistical errorsare below 0.7%.
Figure 7. Vertical profiles of ozone mixing ratios takennear 113�E/7�S. The separation between the profiles is 114km and 90 min.
GROSSMANN ET AL.: THE CRISTA-2 MISSION CRI 1 - 7

ments are given by [Lehmacher et al., 2000]. Measurementsin common volumes of air were also done by the MAHRSIinstrument jointly with a far infrared heterodyne receiver(THOMAS, Tera Hertz OHMeasurement Airborne Sounder)aboard the DLR Falcon aircraft which flew over centralEurope [Englert et al., 2000]. The two instruments observethe concentration of OH radicals at UV wavelengths(MAHRSI) and in the far infrared (THOMAS). The DLRaircraft also carried the Fast In-situ Stratospheric Hygrom-eter (FISH) instrument [Zoeger et al., 1999]. Upper tropo-spheric water vapour distributions and their spatial andtemporal variabilities are discussed by Offermann et al.[2002] together with the results from the FISH experiment.[20] Small-scale structures are observed in many param-
eters. Eidmann et al. [2002] analyze variabilities of ozoneconcentrations and temperatures at various scales down tobelow 100 km. Part of these variations are due to gravitywaves which can be extracted from the CRISTA temper-ature data [Preusse et al., 2002]. Very small spatial scalesare examined in a special ‘‘staring’’ mode. In this mode theCRISTA instrument views perpendicular to the orbit planeand no altitude scans are performed. Structures at thespectral scan rate of 1.3 s, translating to a spatial scale of11.3 km, can be studied. This mode was carried out overone orbit only. A second feature for the study of very smallscales is a special detector arrangement in the SCS6 channel(Table 1). This is the only SCS channel which is notequipped with a Si:As BIB detector but has 3 Si:Ga bulkdetectors arranged along the spectrometer exit slit. Each ofthese detectors (labeled SCS6, SCS6R, and SCS6L) viewsan atmospheric footprint about 6 km wide (as compared toabout 20 km for the other detectors of Table 1). Due tolimitations in the data conditioning electronics, the detectorsSCS6R and SCS6L could only be switched on for 5.3 hours,when channels SCS3 and SCS4 were turned off, whereasthe SCS6 detector operated continually. Furthermore, chan-nel SCS6L failed in orbit so that only one detector pair wasoperable. When observing in the staring mode the twodetectors view the same volume of air in less than 1 s.Comparison of the data from the two detectors then allowsvery small scale structures to be distinguished from noisepeaks or other nonatmospheric disturbances. Some data ofthis special mode have been analyzed to give wave numberspectra of the observed fluctuations [Eidmann et al., 2001].
4. Observations: Mesosphere/LowerThermosphere
[21] During CRISTA-2 a considerable amount of data wasgathered in the altitude regime of the upper mesosphere andlower thermosphere (Table 2, Figure 4). In the thermospherethe atomic oxygen fine structure transition 3P1 ! 3P2 at 63mm is observed up to about 185 km with the SCL spectrom-eter. The 63 mm emission is a single line and the oxygen finestructure levels are in local thermodynamic equilibrium(LTE) in the altitude regime considered here. The excitationenergy of the upper level (3P1) is very low (158 cm�1). Theemission therefore is only a weak function of the localtemperature and model temperatures can be used to derivedensities from the measured line intensities. Global atomicoxygen density distributions have been deduced for day andnight conditions between 130 km and 175 km and were
found about 40% lower [Grossmann et al., 2000] thanpredicted by the MSISE-90 model [Hedin, 1991]. Theselow oxygen concentrations may have been a result of therather quiet geophysical conditions near the solar minimum.The solar radio emission flux index (10.7 cm radio flux inunits of 10�22 Wm�2Hz�1) was between F10.7 = 79.6 andF10.7 = 84.2. The CRISTA-2 conditions are therefore quitesimilar to those of the first CRISTA flight in November 1994.Also the geomagnetic activity was rather moderate. The dailyaveraged Ap (linear planetary geomagnetic activity) indexvaried between 5 and 8 during most of the mission period andreached 11 and 16 on 13 and 14 August, respectively.[22] Molecular emissions in the upper mesosphere/lower
thermosphere include the 15 mm and the 4.3 mm CO2 v2-and v3-bands, the 9.6 mm ozone band, the thermospheric�v = 1 band of nitric oxide at 5.3 mm, and the 4.7 mm bandof carbon monoxide. Compared to CRISTA-1, the dataquality was considerably improved here due the use ofhighly sensitive Si:As BIB detectors in the center telescopemidinfrared channels. A spectrum of the SCS2 channel at analtitude of 90 km taken at 70.5�N is shown in Figure 8. Themain feature centered at about 2325 cm�1, is caused by thecombination of several solar pumped CO2 v3-hot-bands.The shoulders near 2370 cm�1 and near 2275 cm�1 arecaused by part of the fundamental bands of the main isotopeC12O16O16 and the C13O16O16 isotope, respectively. Atlower wave numbers (2080–2200 cm�1) the �v = 1vibration-rotation band of carbon monoxide (CO) is welldisplayed. The noise equivalent spectral radiance of thischannel is 1.9 � 10�11 Wcm�2sr�1(cm�1)�1. The spectralresolution is 5.5 cm�1.[23] The molecular emissions stem from energy levels
which are not in local thermodynamic equilibrium (non-LTE). Under these conditions the infrared radiation emittedby the molecules is no longer a function of the localtemperature alone. All relevant excitation and quenchingprocesses by collisional as well as by radiative interactionhave to be explicitly modeled [Gordiets et al., 1982; Dick-inson, 1984]. In the midinfrared domain of molecularvibration–rotation bands in general a huge number of differ-ent energy levels must be treated simultaneously. As aconsequence the computational effort is quite high. Further-more, many of the non-LTE model derived parameters (CO2,atomic oxygen, and ozone densities, kinetic temperatures,and radiation fields) are interlinked such that these param-eters have to be retrieved in a self consistent way. Thegeneral approach to the solution of this problem wasdescribed by Grossmann et al. [2002]. The non-LTE model[Kutepov et al., 1998] can be applied to the analysis of anumber of different non-LTE emissions. The specific appli-cations for the CO2 emissions are given by Ogibalov et al.[1998] and Shved et al. [1998] and for ozone by Manuilovaet al. [1998]. So far, CO2 and O3 densities were retrieved forboth CRISTA-1 and CRISTA-2. The CO2 densities are fordaytime and show considerable latitudinal and longitudinalvariations [Kaufmann et al., 2002]. De-mixing of CO2
begins at 75–80 km in contrast to current model predictionsbut in agreement with analyses by Lopez-Puertas et al.[2000]. Ozone densities were derived for day- and nighttimeup to above 90 km [Kaufmann et al., 2000]. These data showhigh ozone concentrations at the secondary ozone maximumin the lower thermosphere and a third local ozone maximum
CRI 1 - 8 GROSSMANN ET AL.: THE CRISTA-2 MISSION

near the high latitude terminator in the winter hemisphere[Marsh et al., 2001].[24] Atmospheric temperatures are usually derived from
the analysis of emissions in the CO2 v2-band (15 mm band)[Kennedy and Nordberg, 1967; Gille and House, 1971]. Inthe upper mesosphere, the difference between the LTE andthe non-LTE populations of the CO2 v2-levels which isequivalent to the difference between the kinetic and thevibrational temperatures, is not very large for high meso-pause temperatures. Lopez-Puertas et al. [1992] deduceddifferences of only a few K up to 100 km from ATMOS/Spacelab 3 observations at springtime midlatitudes. At lowtemperatures during high-latitude summer the differencesincrease considerably as temperature gradients in the atmos-
phere increase and nonlocal radiative pumping becomesmore effective [Ratkowski et al., 1994]. A test of a non-LTEmodel is therefore particularly meaningful under these lowtemperature conditions.[25] Temperature profiles (>300) derived from the spectra
of the SCL2 channel (Table 1) are shown in Figure 9. Allprofiles were taken at latitudes above 65�N during the meso-sphere modes (Table 2). Mesopause temperatures between130 and 155 K are inferred in most cases. Considerable wave
2100 2150 2200 2250 2300 2350 2400
Wavenumber, cm-1
1e-11
1e-10
1e-09
1e-08
Inte
nsi
ty, W
cm
-2 s
r-1 (
cm-1
)-1
Figure 8. Sample spectrum of channel SCS-2 at a tangent altitude of 90 km.
120 140 160 180 200 220 240
Temperature [K]
80
90
100
110
Alti
tude
[km
]
Figure 9. Temperature profiles (>300) taken at latitudesabove 65�N.
Figure 10. Mean temperature for latitudes >65�N andfrom the climatology of Lubken [1999]. The shaded areagives the error limits of the CRISTA derived temperatures.For details see text.
GROSSMANN ET AL.: THE CRISTA-2 MISSION CRI 1 - 9
activity is present in the data set. The mean temperatureaveraged over all profiles of Figure 9 is given in Figure 10.The mesopause in the mean profile is at 141.6 K and at analtitude of 85 km (±0.7 km). The standard CRISTA temper-ature retrieval for the stratosphere and mesosphere assumesLTE at all altitudes [Riese et al., 1999]. These ‘‘LTE-temper-atures’’ are calculated up to altitudes of 90 km and cantherefore be compared directly to the non-LTEmodel inferredtemperatures. For latitudes >65� and on 13 August the mean‘‘LTE-temperature’’ at 85 km is 171 K. The large differenceof near 30 K under the high latitude summer conditions is anextreme case for the atmosphere but it underlines theimportance of the non-LTE modeling. At medium and lowlatitudes as well as in the winter hemisphere the differencesare much smaller. The LTE temperatures have been used toderive geostrophic wind fields in the stratosphere and meso-sphere which compare well with other measurements at midand low latitudes [Oberheide et al., 2002]. The winds at highsummer latitudes have to be reanalyzed on the basis of thenon-LTE temperatures. The present accuracy of the non-LTEtemperature retrieval is dominated by two error sources—(a)the rate at which CO2 is quenched by atomic oxygen and (b)the errors of the CO2 density retrieval as given by [Kauf-mann et al., 2002]. The O(3P)–CO2 (v2) quenching rate hasbeen a matter of debate since long [Sharma and Winter-steiner, 1990; Lopez-Puertas et al., 1998] and a factor of 2uncertainty is assumed. In addition there are errors due tothe accuracy of the derived O(3P) densities which comesfrom the non-LTE ozone retrieval and from the fact that thederivation of O(3P) from ozone was not yet iterated with theretrieved non-LTE temperatures. The errors due to calibra-tion, noise, and CO2 line parameters are small in compar-ison but become important below about 82 km. Thesystematic errors are included in Figure 10 (shaded area)and reach a maximum of ±6.4 K at 87 km.[26] A climatology of high latitude summer mesosphere
temperatures was derived by Lubken [1999] from the data offalling sphere soundings over northern Scandinavia (69�N).The results of Lubken for mid-August are included in Figure10. The two profiles generally agree reasonably well takingthe combined error bars into account (Lubken states uncer-tainties of 7 K and 3 K at 90 km and 80 km, respectively). Inthe CRISTA data the mesopause is at about the sametemperature but is about 3 km lower than in the Lubkenanalysis. Toward higher altitudes there is an increasingdiscrepancy between the CRISTA remote sensing temper-atures and the falling sphere derived ones which needs futureclarification. Higher up in the thermosphere, however, theCRISTA temperatures agree well with the model temper-atures of MSIS [Grossmann et al., 2002]. The variabilityamong the CRISTA profiles (Figure 9) is very similar to thevariability given by Lubken for 23 summer profiles.[27] The mesopause altitude determined from the high
latitude profiles is 85 km for an average latitude of 69�N.The average mesopause in the low latitude soundings(<40�N) and in the winter hemisphere is located at 98km. This is consistent with the split mesopause phenom-enon described by von Zahn et al. [1996] and analyzed byBerger and von Zahn [1999].[28] Low mesopause temperatures as those of Figure 10
can lead to the formation of polar mesospheric clouds(PMCs) or noctilucent clouds (NLCs). PMCs have been
studied by many observers from the ground, by soundingrockets, or from satellites [Gadsden and Schroeder, 1989].Both CRISTA and MAHRSI detected PMC signatures inthe infrared and ultraviolet part of the spectrum [Stevens etal., 2001].
5. Summary
[29] The CRISTA-2 mission yielded a wealth of dataabout highly resolved trace gas distributions in August1997. The dense measurement grid of the triple beam limbsounder obtained during the first mission in November 1994was extended in latitudinal coverage to ±74� based on thesatellite capability to maneuver in space while maintainingall three CRISTA beams simultaneously at the Earth limb.The mission took place during a period of very strongplanetary wave activity. Streamers are observed in severaltrace gases in the stratosphere as was the case during thefirst CRISTA mission. A special high spatial density obser-vation mode (‘‘hawkeye’’) was executed in the region overIndonesia. From ozone density data recorded in this modeas well as from fluctuation analyses of other parameters andover other areas it can be concluded that the trace gasconcentrations vary considerably over very short distances.For the same reason zero miss-distance/-time validationmeasurements were done for CRISTA-2 by pointing theinstrument to simultaneously launched rockets, balloons, orto an aircraft.[30] The altitude regime covered by the CRISTA meas-
urements was increased to include the upper troposphere.Water vapor concentrations were derived and exhibit con-siderable structures over very short spatial scales. More timewas allocated to the upper mesosphere and the lowerthermosphere and a comprehensive data set was collectedhere. As at these altitudes non-LTE modeling is required toretrieve atmospheric parameters the data have only beenpartially evaluated as yet. Atomic oxygen densities in thethermosphere and carbon dioxide and ozone densities in theupper mesosphere and lower thermosphere have beenderived. The first summer high latitude mesopause regiontemperatures from 15 mm band spectra are found to agreewell with a climatology based on falling sphere data.[31] The results presented in the set of papers in this issue
show how variable the atmosphere is at all altitudes and inall parameters. The analyses will be continued and refinedin the next future.
[32] Acknowledgments. The success of the CRISTA-2 experimentwould not have been possible without the support by a large number ofindividuals and institutions. We would particularly like to thank the teams atNASA-HQ, -JSC, and -KSC for the very fruitful cooperation and for theirunbureaucratic consideration of our special wishes. Special thanks go to theteam of Konrad Moritz at DASA, Munchen, for their outstanding personalefforts to bring CRISTA and MAHRSI to a full success. CRISTA-2 wassupported by DARA/DLR, Bonn, through grants 50 QV 9501 and 50 QV9802.
ReferencesBaldwin, M. P., and T. J. Dunkerton, Propagation of the arctic oscillationfrom the stratosphere to the troposphere, J. Geophys. Res., 104, 30,937–30,946, 1999.
Baldwin, M. P., and T. J. Dunkerton, Propagation of annular modes fromthe mesosphere to the Earth’s surface, paper presented at 2nd SPARCGeneral Assembly, Mar del Plata, Argentina, 6–10 November 2000.
CRI 1 - 10 GROSSMANN ET AL.: THE CRISTA-2 MISSION

Beig, G., The relative importance of solar activity and anthropogenic in-fluences on the ion composition, temperature, and associated neutrals ofthe middle atmosphere, J. Geophys. Res., 105, 19,841–19,856, 2000.
Berger, U., and U. von Zahn, The two-level structure of the mesopause: Amodel study, J. Geophys. Res., 104, 22,083–22,093, 1999.
Chen, P., J. R. Holton, A. O’Neill, and R. Swinbank, Isentropic massexchange between the tropics and the extratropics in the stratosphere,J. Atmos. Sci., 51, 3006–3018, 1994.
Chen, S. S., and R. A. Houze Jr., Interannual variability of deep convectionover the tropical warm pool, J. Geophys. Res., 102, 25,783–25,796,1997.
Conway, R. R., M. H. Stevens, C. M. Brown, J. G. Cardon, S. E. Zasadil,and G. H. Mount, Middle Atmosphere High Resolution SpectrographInvestigation, J. Geophys. Res., 104, 16,327–16,348, 1999.
Crutzen, P., Mesospheric mysteries, Science, 277, 1951–1952, 1997.Dickinson, R. E., Infrared radiative cooling in the mesosphere and lowerthermosphere, J. Atmos. Terr. Phys., 46, 995–1008, 1984.
Drummond, J. R., J. T. Houghton, G. D. Peskett, C. D. Rodgers, M. J.Wale, J. Whitney, and E. J. Williamson, The stratospheric and meso-spheric sounder on Nimbus 7, Phil. Trans. R. Soc. London, Ser. A,296, 219–241, 1980.
Eckermann, S. D., and P. Preusse, Global measurements of stratosphericmountain waves from Space, Science, 286, 1534–1537, 1999.
Edwards, D. P., G. Zaragoza, M. Riese, and M. Lopez-Puertas, Evidence ofH2O non-local thermodynamic equilibrium emission near 6.4 mm asmeasured by CRISTA-1, J. Geophys. Res., 105, 29,003–29,022, 2000.
Eidmann, G., D. Offermann, and P. Preusse, Fluctuation power spectra inthe mid stratosphere at increased horizontal resolution, Adv. Space Res.,27, 1647–1652, 2001.
Eidmann, G., D. Offermann, B. Schaeler, M. Jarisch, and F. J. Schmidlin,Stratospheric variability of temperature and ozone as inferred from thesecond CRISTA mission, 1, Zonal means and local structures, J. Geo-phys. Res., 107, 10.1029/2001JD000721, 2002.
Englert, C. R., B. A. Schimpf, M. Birk, F. Schreier, R. R. Conway, M. H.Stevens, and M. E. Summers, THOMAS 2.5 THz measurements of mid-dle atmospheric OH: Comparison with MAHRSI observations and modelresults, in Atmospheric Science Across the Stratopause, edited by D. E.Siskind, S. D. Eckermann, and M. E. Summers, Geophys. Monogr., vol.103, pp. 305–310, 2000.
Ern, M., K. U. Grossmann, and D. Offermann, Detector signal relaxationsand their correction: The Si:Ga bulk detectors of the CRISTA instrument,Proc. SPIE Int. Soc. Opt. Eng., 4486, 111–121, 2002.
Gadsden, M., The secular change in noctilucent cloud occurrence: Study ofa 31-year sequence to clarify the causes, Adv. Space Res., 20, 2097–2100, 1997.
Gadsden, M., and W. Schroeder, Noctilucent Clouds, Physics and Chem-istry in Space Planetology, vol. 18, Springer-Verlag, New York, 1989.
Gille, J. C., and F. B. House, On the inversion of limb radiance measure-ments, 1, Temperature and thickness, J. Atmos. Sci., 28, 1427–1442,1971.
Gille, J. C., and J. M. Russell III, The limb infrared monitor of the strato-sphere: Experiment description, performance, and results, J. Geophys.Res., 89, 5125–5140, 1984.
Gordiets, B. F., Yu. N. Kulikov, M. N. Markov, and M. Ya. Marov, Numer-ical modeling of the thermospheric heat budget, J. Geophys. Res., 87,4504–4514, 1982.
Grossmann, K. U., Recent improvements in middle atmospheric remotesounding techniques: The CRISTA-SPAS experiment, in AtmosphericScience Across the Stratopause, edited by D. E. Siskind, S. D. Ecker-mann, and M. E. Summers, Geophys. Monogr., vol. 103, pp. 287–304,2000.
Grossmann, K. U., and D. Offermann, 2. Flug von CRISTA, Tech. Rep. 50QV 9501, Univ. Wuppertal, Wuppertal, Germany, 1999.
Grossmann, K. U., M. Kaufmann, and E. Gerstner, A global measurementof lower thermosphere atomic oxygen densities, Geophys. Res. Lett., 27,1387–1390, 2000.
Grossmann, K. U., O. Gusev, M. Kaufmann, and A. A. Kutepov, Atmo-spheric parameters retrieved from CRISTA measurements in the uppermesosphere and lower thermosphere, Proc. SPIE Int. Soc. Opt. Eng.,4539, 406–417, 2002.
Gunther, G., D. S. McKenna, and R. Spang, The meteorological conditionsof the stratosphere for the CRISTA/MAHRSI-2 campaign (July/August1997), J. Geophys. Res., 107, 10.1029/2001JD000692, in press, 2002.
Hagan, M. E., R. G. Roble, C. Hartsough, J. Oberheide, and M. Jarisch, Thedynamics of the middle atmosphere during CRISTA-2 as simulated bythe NCAR TIME-GCM, J. Geophys. Res., 107, 10.1029/2001JD000679,in press, 2002.
Haynes, P. H., On the ‘‘downward control’’ of extratropical diabatic circu-lation by eddy-induced mean zonal forces, J. Atmos. Sci., 48, 651–678,1991.
Hedin, A. E., Extension of the MSIS thermosphere model into the middleand lower atmosphere, J. Geophys. Res., 96, 1159–1172, 1991.
Kaufmann, M., R. R. Garcia, K. U. Grossmann, O. Gusev, L. Knuefing, andA. A. Kutepov, The global distribution of O3 in the mesosphere measuredby CRISTA, paper presented at 33rd COSPAR Scientific Assembly, War-saw, 16–23 July 2000.
Kaufmann, M., O. A. Gusev, K. U. Grossmann, R. G. Roble, M. E. Hagan,and C. Hartsough, The global distribution of CO2 densities in the uppermesosphere and lower thermosphere during CRISTA, J. Geophys. Res.,107, 10.1029/2001JD000704, in press, 2002.
Kaye, J. A., and T. L. Miller, The ATLAS series of shuttle missions,Geophys. Res. Lett., 23, 2285–2288, 1996.
Kennedy, J. S., and W. Nordberg, Circulation features of the stratospherederived from radiometric temperature measurements with the TIROS VIIsatellite, J. Atmos. Sci., 24, 711–719, 1967.
Krueger, A. J., B. Guenther, A. J. Fleig, D. F. Heath, E. Hilsenrath,R. McPeters, and C. Prabhakara, Satellite ozone measurements, Phil.Trans. R. Soc. London, Ser. A, 296, 191–204, 1980.
Kull, V., M. Riese, X. Tie, T. Wiemert, G. Eidmann, D. Offermann, andG. Brasseur, NOy partitioning and aerosol influences in the stratospheres,J. Geophys. Res., 107, doi:10.1029/2001JD001246, in press, 2002.
Kutepov, A. A., O. A. Gusev, and V. P. Ogibalov, Solution of the non-LTEproblem for molecular gas in planetary atmospheres: Superiority of ac-celerated lambda iteration, J. Quant. Spectrosc. Radiat. Transfer, 60,199–220, 1998.
Lehmacher, G. A., J. Oberheide, F. J. Schmidlin, and D. Offermann, Zeromiss time and zero miss distance experiments for validation of CRISTA 2temperatures, Adv. Space Res., 26, 965–969, 2000.
Lopez-Puertas, M., M. A. Lopez-Valverde, C. P. Rinsland, and M. R.Gunson, Analysis of the upper atmosphere CO2 (v2) vibrational tempera-tures retrieved from ATMOS/Spacelab 3 observations, J. Geophys. Res.,97, 2469–2478, 1992.
Lopez-Puertas, M., G. Zaragoza, and M. A. Lopez-Valverde, Non localthermodynamic equilibrium (LTE) atmospheric limb emission at 4.6mm 1. An update of the CO2 non-LTE radiative transfer model, J. Geo-phys. Res., 103, 8499–8513, 1998.
Lopez-Puertas, M., M. A. Lopez-Valverde, R. R. Garcia, and R. G. Roble,Review of CO2 and CO abundances in the middle atmosphere, in Atmo-spheric Science Across the Stratopause, edited by D. E. Siskind, S. D.Eckermann, and M. E. Summers, Geophys. Monogr., vol. 103, pp. 83–100, 2000.
Lubken, F.-J., Thermal structure of the arctic summer mesosphere, J. Geo-phys. Res., 104, 9135–9149, 1999.
Manuilova, R. O., et al., Modelling of non-LTE limb spectra of i.r. ozonebands for the MIPAS space experiment, J. Quant. Spectrosc. Radiat.Transfer, 59, 405–422, 1998.
Marsh, D. R., A. K. Smith, G. P. Brasseur, M. Kaufmann, and K. U.Grossmann, The existence of a tertiary ozone maximum in the high-latitude middle atmosphere, Geophys. Res. Lett., 28, 4531–4534,2001.
McIntyre, M. E., and T. N. Palmer, Breaking planetary waves in the strato-sphere, Nature, 305, 593–600, 1983.
Murphy, D. M., D. W. Fahey, M. H. Proffitt, S. C. Liu, K. R. Chan, C. S.Eubank, S. R. Kawa, and K. K. Kelly, Reactive nitrogen and its correla-tion with ozone in the lower stratosphere and the upper troposphere,J. Geophys. Res., 98, 8751–8773, 1993.
Oberheide, J., M. E. Hagan, W. E. Ward, M. Riese, and D. Offermann,Modeling the diurnal tide for the Cryogenic Infrared Spectrometers andTelescopes for the Atmosphere (CRISTA) 1 time period, J. Geophys.Res., 105, 24,917–24,929, 2000.
Oberheide, J., G. A. Lehmacher, D. Offermann, K. U. Grossmann, A. H.Manson, C. E. Meek, F. J. Schmidlin, W. Singer, P. Hoffmann, and R. A.Vincent, Geostrophic wind fields in the stratosphere and mesospherefrom satellite data, J. Geophys. Res., 107, 10.1029/2001JD000655, inpress, 2002.
Offermann, D., The MAP/GLOBUS campaign 1983: Introduction, Planet.Space Sci., 35, 515–524, 1987.
Offermann, D., and R. R. Conway, Preface: Middle atmosphere structuresmeasured by the CRISTA and MAHRSI experiements, J. Geophys. Res.,104, 16,309–16,310, 1999.
Offermann, D., K. U. Grossmann, P. Barthol, P. Knieling, M. Riese, andR. Trant, Cryogenic Infrared Spectrometers and Telescopes for the Atmo-sphere (CRISTA) experiment and middle atmosphere variability, J. Geo-phys. Res., 104, 16,311–16,325, 1999.
Offermann, D., B. Schaeler, M. Riese, M. Langfermann, M. Jarisch,G. Eidmann, C. Schiller, H. G. J. Smit, and W. G. Read, Water vaporat the tropopause during the CRISTA 2 mission, J. Geophys. Res., 107,10.1029/2001JD000700, in press, 2002.
Ogibalov, V. P., A. A. Kutepov, and G. M. Shved, Non-local thermody-namic equilibrium in CO2 in the middle atmosphere, 2, Populations in the
GROSSMANN ET AL.: THE CRISTA-2 MISSION CRI 1 - 11

v1 v2 mode manifold states, J. Atmos. Sol. Terr. Phys., 60, 315–329,1998.
Pfister, L., K. R. Chan, T. P. Bui, S. Bowen, M. Legg, B. Gary, K. Kelly,M. Proffitt, and W. Starr, Gravity waves generated by a tropical cycloneduring the STEP tropical field program: A case study, J. Geophys. Res.,98, 8611–8638, 1993.
Preusse, P., S. D. Eckermann, and D. Offermann, Comparison of globaldistributions of zonal-mean gravity wave variance inferred from differentsatellite instruments, Geophys. Res. Lett., 27, 3877–3880, 2000.
Preusse, P., A. Dornbrack, S. D. Eckermann, M. Riese, B. Schaeler,J. Bacmeister, D. Broutman, and K. U. Grossmann, Space based mea-surements of stratospheric mountain waves by CRISTA, 1, Sensitivity,method and a case study, J. Geophys. Res., 107, 10.1029/2001JD000699,in press, 2002.
Randel, W. J., J. C. Gille, A. E. Roche, J. B. Kumer, J. L. Mergenthaler,J. W. Waters, E. F. Fishbein, and W. A. Lahoz, Stratospheric transportfrom the tropics to middle latitudes by planetary-wave mixing, Nature,365, 533–535, 1993.
Ratkowski, A. J., R. H. Picard, J. R. Winick, K. U. Grossmann, D. Ho-mann, J. C. Ulwick, and A. J. Paboojian, Lower-thermospheric infra-redemissions from minor species during high-latitude twilight, 2, Analysis of15 mm emission and comparison with non-LTE models, J. Atmos. Sol.Terr. Phys., 56, 1899–1914, 1994.
Reynolds, D. B., D. H. Seib, S. B. Stetson, T. Herter, N. Rowlands, andJ. Schoenwald, Blocked impurity band hybrid infrared focal plane arraysfor astronomy, IEEE Trans. Nucl. Sci., 36, 857–862, 1989.
Riese, M., R. Spang, P. Preusse, M. Ern, M. Jarisch, D. Offermann, andK. U. Grossmann, Cryogenic Infrared Spectrometers and Telescopes forthe Atmosphere (CRISTA) data processing and atmospheric temperatureand trace gas retrieval, J. Geophys. Res., 104, 16,349–16,367, 1999.
Riese, M., V. Kull, X. Tie, G. Brasseur, D. Offermann, G. Lehmacher, andA. Franzen, Modeling of nitrogen species measured by CRISTA, Geo-phys. Res. Lett., 27, 2221–2224, 2000.
Riese, M., A. Franzen, X. Tie, and D. Offermann, Tracer structures in thesouthern hemisphere middle stratosphere observed by CRISTA-1, Adv.Space Res., 27, 1623–1628, 2001.
Riese, M., G. L. Manney, J. Oberheide, X. Tie, V. Kull, and D. Offermann,Stratospheric transport by planetary wave mixing as observed duringCRISTA 2, J. Geophys. Res., 107, 10.1029/2001JD000629, in press,2002.
Sharma, R. D., and P. P. Wintersteiner, Role of carbon dioxide in coolingplanetary thermospheres, Geophys. Res. Lett., 17, 2201–2204, 1990.
Shved, G. M., A. A. Kutepov, and V. P. Ogibalov, Non-local thermody-namic equilibrium in CO2 in the middle atmosphere, I, Input data and
populations of the v3 mode manifold states, J. Atmos. Sol. Terr. Phys., 60,289–314, 1998.
Smith, A. K., P. Preusse, and J. Oberheide, Middle atmosphere Kelvinwaves observed in CRISTA 1 and 2 temperature and trace species,J. Geophys. Res., 107, 10.1029/2001JD000577, in press, 2002.
Spang, R., M. Riese, and D. Offermann, CRISTA-2 observations of thesouth polar vortex in winter 1997: A new dataset for polar process stu-dies, Geophys. Res. Lett., 28, 3159–3162, 2001.
Spang, R., G. Eidmann, D. Offermann, P. Preusse, L. Pfister, and P.-H.Wang, CRISTA observations of cirrus clouds around the tropopause,J. Geophys. Res., 107, 10.1029/2001JD000698, in press, 2002.
Stevens, M. H., R. R. Conway, C. R. Englert, M. E. Summers, K. U.Grossmann, and O. A. Gusev, PMCs and the water frost point in theArctic summer mesosphere, Geophys. Res. Lett., 28, 4449–4452, 2001.
Tan, K. A., and S. Eckermann, Numerical simulations of mountain waves inthe middle atmosphere over the Southern Andes, in Atmospheric ScienceAcross the Stratopause, edited by D. E. Siskind, S. D. Eckermann, andM. E. Summers, Geophys. Monogr., vol. 103, pp. 311–318, 2000.
Thrane, E. V., T. A. Blix, U.-P. Hoppe, F. J. Lubken, W. Hillert, G. Leh-macher, and D. C. Fritts, A study of small-scale waves and turbulence inthe mesosphere using simultaneous in situ observations of neutral gas andplasma fluctuations, J. Atmos. Sol. Terr. Phys., 56, 1797–1808, 1994.
von Zahn, U., J. Hoffner, V. Eska, and M. Alpers, The mesopause altitude:Only two distinctive levels worldwide?, Geophys. Res. Lett., 23, 3231–3234, 1996.
Ward, W. E., J. Oberheide, M. Riese, P. Preusse, and D. Offermann, Pla-netary wave two signatures in CRISTA 2 ozone and temperature data, inAtmospheric Science Across the Stratopause, edited by D. E. Siskind,S. D. Eckermann, and M. E. Summers, Geophys. Monogr., vol. 103, pp.319–325, 2000.
Wattenbach, R., and K. Moritz, Astronomical Shuttle Pallet Satellite (AS-TRO-SPAS), Acta Astronaut., 40, 723–732, 1997.
Zoeger, M., et al., Fast in situ stratospheric hygrometers: A new family ofballoon-borne and airborne Lyman-a photofragment fluorescence hygro-meters, J. Geophys. Res., 104, 1807–1816, 1999.
�����������K. U. Grossmann, O. Gusev, J. Oberheide, D. Offermann, M. Riese, and
R. Spang, Department of Physics, University of Wuppertal, 42097Wuppertal, Germany. ([email protected])
CRI 1 - 12 GROSSMANN ET AL.: THE CRISTA-2 MISSION


![CASE REPORT Open Access A prominent crista terminalis ...€¦ · finding of a prominent crista terminalis can mimic a right atrial mass, such as a tumor or thrombus [2,3]. Atrial](https://static.fdocuments.us/doc/165x107/60914c5090def22b9158119d/case-report-open-access-a-prominent-crista-terminalis-finding-of-a-prominent.jpg)


