The CREDOS Project - Eurocontrol · The CREDOS Project Piloted wake vortex encounter simulator...
62
Page 1 The CREDOS Project Piloted wake vortex encounter simulator tests for departure D3-4 Abstract: Piloted simulator tests were carried out in order to study and assess the safety hazard imposed by wake vortices during departures. The tests were conducted in Hamburg at the A320 THOR simulator and in Berlin at the A330 full-flight simulator with several rated airline pilots. On one hand, objective parameters of the pilots response in wake vortex encounter conditions and resulting aircraft reactions were recorded and on the other hand the pilots subjective ratings of the encounter severity were documented. The hazard rating scale ranges from slight aircraft upsets with no pilot reaction required up to extreme disturbances with temporary loss of control. Test planning, accomplishment and the first steps of parameter correlation are discussed. Contract Number: AST5-CT-2006-030837 Proposal Number: 30837 Project Acronym: CREDOS Project Co-ordinator: EUROCONTROL Document Title: Piloted wake vortex encounter simulator tests for departure Deliverable Nr: D3-4 Delivery Date: SEP 2008 Responsible: S. Amelsberg Nature of Deliverable: R (Report) Dissemination level: PU (Public) File Id N°: CREDOS_315_TUB_DLV_D3-4_Piloted Simulator Tests_v1.pdf Status: Approved 1 Version: 1 2 Date: November 03, 2008 Approval Status Document Manager Verification Authority Project Approval TU Berlin, Airbus Airbus Project Management Committee S. Amelsberg, S. Kauertz S. Kauertz PMC Members Task Manager WP3 Leader 1 Status can be: draft, for approval, approved. Only approved deliverables may be sent to the EC. 2 The first version delivered to the EC should always be version 1 (any previous versions should be 0a, 0b etc). Any official update (either requested by the EC or proposed by the PMC will have subsequent numbering as required).
Transcript of The CREDOS Project - Eurocontrol · The CREDOS Project Piloted wake vortex encounter simulator...

Page 1
The CREDOS Project
Piloted wake vortex encounter simulator tests for departure
D3-4 Abstract: Piloted simulator tests were carried out in order to study and assess the safety hazard imposed by wake vortices during departures. The tests were conducted in Hamburg at the A320 THOR simulator and in Berlin at the A330 full-flight simulator with several rated airline pilots. On one hand, objective parameters of the pilots response in wake vortex encounter conditions and resulting aircraft reactions were recorded and on the other hand the pilots subjective ratings of the encounter severity were documented. The hazard rating scale ranges from slight aircraft upsets with no pilot reaction required up to extreme disturbances with temporary loss of control. Test planning, accomplishment and the first steps of parameter correlation are discussed. Contract Number: AST5-CT-2006-030837 Proposal Number: 30837
Project Acronym: CREDOS
Project Co-ordinator: EUROCONTROL
Document Title: Piloted wake vortex encounter simulator tests for departure Deliverable Nr: D3-4
Delivery Date: SEP 2008
Responsible: S. Amelsberg
Nature of Deliverable: R (Report) Dissemination level: PU (Public)
File Id N°: CREDOS_315_TUB_DLV_D3-4_Piloted Simulator Tests_v1.pdf
Status: Approved1 Version: 12 Date: November 03, 2008
Approval Status
Document Manager Verification Authority Project Approval
TU Berlin, Airbus Airbus Project Management Committee
S. Amelsberg, S. Kauertz S. Kauertz PMC Members
Task Manager WP3 Leader
1 Status can be: draft, for approval, approved. Only approved deliverables may be sent to the EC. 2 The first version delivered to the EC should always be version 1 (any previous versions should be 0a, 0b etc). Any official update (either requested by the EC or proposed by the PMC will have subsequent numbering as required).

Page 2
Authors Swantje Amelsberg, TU Berlin Sebastian Kauertz, Airbus Deutschland Edition history Edition Nº Date Authors Section Comment
0a 20 OCT 08 S. Amelsberg, S. Kauertz Initial version 1 03 NOV 08 S. Amelsberg, S. Kauertz Approved version

Page 3
GLOSSARY AIM Aerodynamic Interaction Model A/C Aircraft A/P, AP Auto Pilot A/THR, ATHR Auto Thrust AGL Above Ground Level ALT Altitude CAE CAE Electronics Ltd. CAVOK Ceiling & Visibility OK CDB Common Data Basis CofG, CG Center of Gravity CREDOS Crosswind Reduced Separations for Departure Operations CPT Captain CTS Computerized Test System DLR Deutsches Zentrum für Luft- und Raumfahrt EC European Commission FFS Full-Flight-Simulator FMS Flight Management System F/O, FO First Officer I/F Instructor Facility MAC Mean Aerodynamic Chord SIMEX Simulation Executive SRF Scientific Research Facility THOR Technical Simulator for Handling Qualities and Open Research UCL Université Catholique de Louvain WVD Wake Vortex Device ZFB Zentrum für Flugsimulation Berlin GmbH α angle of attack b wing span b0 (initial) vortex separation γ flight path angle, vertical inclination g gravitational acceleration H Height Δ difference Γ circulation (vortex strength) L lift Φ, Θ, Ψ Euler angles (roll, pitch, heading) m mass ρ air density r radius t time coordinate u, v, w wind speed VCAS calibrated airspeed x, y, z Cartesian coordinates * normalized parameters

Page 4
Table of Contents
1 EXECUTIVE SUMMARY .............................................................................................................................6
2 INTRODUCTION..........................................................................................................................................7
3 SIMULATION SOFTWARE IMPLEMENTATION .......................................................................................8 3.1 A320 BASIC FLIGHT SIMULATOR DESCRIPTION ............................................................................8
3.1.1 General .........................................................................................................................................8 3.1.2 Cockpit ..........................................................................................................................................9 3.1.3 Instruments, displays and control devices....................................................................................10 3.1.4 Visual system................................................................................................................................11 3.1.5 Sound system ...............................................................................................................................11 3.1.6 Simulation host computer .............................................................................................................11 3.1.7 Real-time simulation .....................................................................................................................12 3.1.8 Data recording ..............................................................................................................................12
3.2 A330 BASIC FLIGHT SIMULATOR DESCRIPTION ............................................................................13 3.2.1 Overview .......................................................................................................................................13 3.2.2 Cockpit and motion system...........................................................................................................13 3.2.3 Sound system ...............................................................................................................................14 3.2.4 Simulation computers ...................................................................................................................14 3.2.5 Simulation process architecture....................................................................................................15 3.2.6 Scheduling ....................................................................................................................................15 3.2.7 Banding.........................................................................................................................................16 3.2.8 Data recording ..............................................................................................................................16
3.3 EXTENSION OF WVE SUB-MODULES...............................................................................................17 3.4 WAKE VORTEX SETUP.......................................................................................................................17
3.4.1 Aerodynamic modeling .................................................................................................................17 3.4.2 Vortex positioning .........................................................................................................................18
4 ENCOUNTER SCENARIO DEFINITION...................................................................................................21 4.1 WAKESCENE DATA BASIS.................................................................................................................21 4.2 SCENARIOS FOR SIMULATION .........................................................................................................22
5 SIMULATOR FLIGHT TEST .....................................................................................................................24 5.1 SCHEDULING.......................................................................................................................................24 5.2 PILOT QUESTIONNAIRES...................................................................................................................25 5.3 TEST PROGRAMS...............................................................................................................................26 5.4 TEST PROCEDURE.............................................................................................................................26
5.4.1 Briefing..........................................................................................................................................26 5.4.2 Simulator start-up (A330 FFS)......................................................................................................27 5.4.3 Session start-up (A330 FFS) ........................................................................................................27 5.4.4 Test procedure..............................................................................................................................27 5.4.5 Simulator Shut-down (A330 FFS).................................................................................................28 5.4.6 Debriefing......................................................................................................................................28
6 SIMULATOR TEST EVALUATION...........................................................................................................29 6.1 QUALITATIVE OBSERVATIONS .........................................................................................................29
6.1.1 A320 THOR simulator...................................................................................................................29 6.1.2 A330 Full Flight Simulator.............................................................................................................30
6.2 DATA ANALYSIS OF RECORDED SIMULATOR DATA .....................................................................30 6.2.1 A320 THOR simulator...................................................................................................................30 6.2.2 A330 Full Flight Simulator.............................................................................................................36
6.3 DATA ANALYSIS OF QUESTIONNAIRES...........................................................................................40 6.3.1 A320 THOR simulator...................................................................................................................40 6.3.2 A330 Full Flight Simulator.............................................................................................................44
6.4 DISCUSSION OF RESULTS ................................................................................................................47 7 SUMMARY.................................................................................................................................................48

Page 5
8 REFERENCES...........................................................................................................................................49

Page 6
1 EXECUTIVE SUMMARY
Based on initial results of the wake encounter airspace simulation tool WakeScene-D, encounter conditions were defined for the piloted simulator tests. These tests are for qualitative evaluation of wake vortex encounters during take-off under crosswind conditions with reduced separations. Objective aircraft parameters as well as subjective evaluations by the pilots were recorded. The data is used to develop and validate a pilot model for subsequent offline simulations as well as criteria for assessment of the severity of wake encounters during take-off. Altogether fifteen simulator sessions with eleven pilots were carried out on the A330 full-flight simulator in Berlin and fourteen sessions with fourteen pilots on the THOR A320 simulator in Hamburg.
Page 7
2 INTRODUCTION
Subtask 3.1.5 “Piloted Simulator Test” of the CREDOS Work Package “Risk Modelling & Risk Assessment” has the objectives to deduce generalized pilot responses to wake vortex encounters, to collect pilot ratings on encounter severity, and to collect pilot comments on aircraft handling under such circumstances. The research community needs these results to better understand wake vortex encounter phenomena as well as to prepare safety guidelines for wake vortex encounters, to classify encounter severity for risk assessment of new flight procedures, and to develop and validate pilot models for offline simulations.
The Airbus A330 Full-Flight Simulator of "Zentrum für Flugsimulation Berlin" (ZFB), located at TU Berlin, Institute of Aeronautics and Astronautics, and the A320 THOR Simulator, located at Airbus Deutschland GmbH in Hamburg, have been modified to simulate dynamic aircraft response to wake vortex encounters during departure. In order to study and assess the safety hazard imposed by wake vortices several piloted simulation tests of wake vortex encounters were carried out. During the planned test activities, pilots flying manual departures experienced wake vortex encounters that varied in magnitude and character.
The A330 and A320 simulators are equipped with research components, allowing changes to the simulator software in order to perform scientific experiments. The basic simulator capabilities have been extended by a dedicated physical model of aircraft wake vortices. This allows highly realistic simulations of wake vortex encounters.
This Technical Note describes the necessary software adaptation for the piloted simulator tests with wake vortices during takeoff and departure. Test planning and test procedures will be described. The data analysis of the recorded data and some results will be presented.
As this work was performed in parallel in Hamburg on the A320 THOR flight simulator and in Berlin on the A330 full-flight simulator this report contains most of the chapters twice to contain the efforts at both locations.

Page 8
3 SIMULATION SOFTWARE IMPLEMENTATION
3.1 A320 BASIC FLIGHT SIMULATOR DESCRIPTION
3.1.1 General
The Flight Dynamics group of Airbus Deutschland GmbH operates a dedicated research and development flight simulator for piloted tests. This simulator is called THOR. The abbreviation THOR stands for “Technical Simulator for Handling Qualities and Open Research”. The simulator was put in operation in 1988 and is improved and updated continuously since then. It is not a certified training simulator that can be used for regular airline training however. Besides in-house work THOR has been used in previous EC-sponsored research projects like S-WAKE and I-WAKE.
THOR is a fixed-base simulator, with high-fidelity daylight visual system on a PC basis, a generic cockpit equipped with side-stick controls, programmable displays, fly-by-wire functions, etc.
The simulator can be used for different tasks such as stability and control investigations, handling quality assessment, assessment of new control devices and instruments, evaluation of flight control laws, investigations of critical flight conditions and failure case analysis.
A principle overview of the hardware architecture is given in Figure 3-1.
AuralSystem
VisualSystem
CockpitI/F
Generic Cockpit
Cockpitwith generic components
Instru-ments
Test DataAnalysis
Flight Simulation ComputerSystem
SimulationComputer
SoftwareDevelopment
Figure 3-1: General overview of THOR flight simulator architecture
The simulator has two main components:
1) Generic cockpit with:
• instruments and control devices,
• visual system,
• sound system,
• cockpit interface computer.
Page 9
2) Computer system:
• simulation computer,
• workstations and PCs for software development and test data analysis,
• systems test computers (not described here).
3.1.2 Cockpit
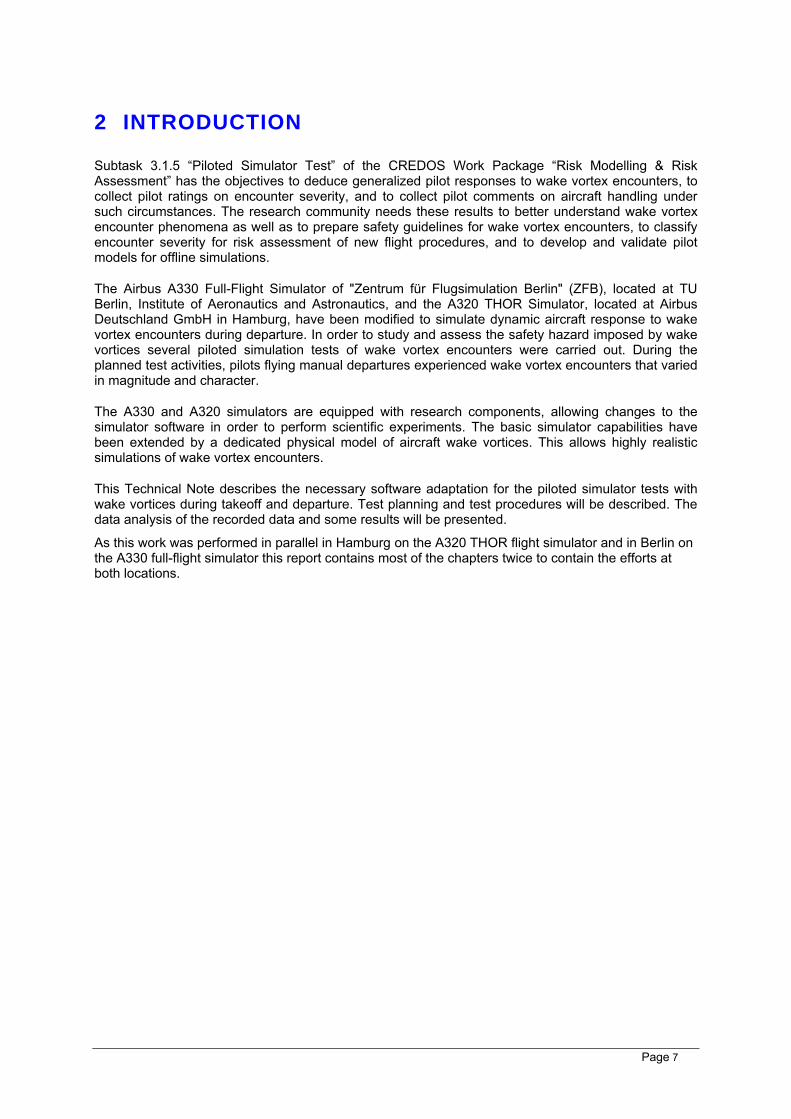
A view into the flight simulator cockpit is shown in Figure 3-2. The flight deck cabin has the size of a typical Airbus widebody cockpit. The equipment represents an Airbus-like flight deck: two-pilot operations, side sticks and electronic flight instruments of a modern fly-by-wire transport aircraft.
The cockpit is fixed based and mounted on a metal frame. It is accessible from the side and from underneath for maintenance and installation purposes.
Figure 3-2: THOR simulator flight deck
Behind the flight deck is an engineering station with sufficient space for a flight test engineer and for test observers, Figure 3-3. The engineering station has eight graphic terminals to control the simulation, to set simulation parameters such as atmospheric conditions (wind velocity, wind direction, atmospheric turbulence visibility, etc.), to introduce system failures such as engine failure, actuator failures etc. and to monitor the aircraft motion (on a 3D display) as well as all relevant simulation parameters.

Page 10
Figure 3-3: THOR engineering station
3.1.3 Instruments, displays and control devices
The generic cockpit is equipped with:
• CPT and F/O side sticks
• CPT and F/O rudder pedals
• pitch trim wheel
• rudder trim panel
• slat/flap lever
• airbrake lever
• landing gear lever
• parking brake lever
• CPT and F/O nose wheel steering handle
• throttle levers (incl. thrust reverse)
• FCU (Flight Control Unit)
• Head-Up-Display
• Overhead panel (generic, simulated on a 19” touch screen)
Instruments, displays and control devices are connected to the simulation computer via a Cockpit-Interface Computer. It is a CONCURRENT NH4401 based VME-Bus computer system that provides analogue, discrete, digital (ARINC-429) I/O.
The cockpit displays are six high-resolution colour TFT-LCDs:
• 2 Primary Flight Displays (PFD) (CPT and F/O identical),
• 2 Navigation Displays (ND) (CPT and F/O identical),
• 1 Systems Display (SD),
• 1 Warning Display (WD).
Page 11
Cockpit display images (Electronic Instrument System) are generated on four PCs. The pilots can switch between different display formats.
3.1.4 Visual system
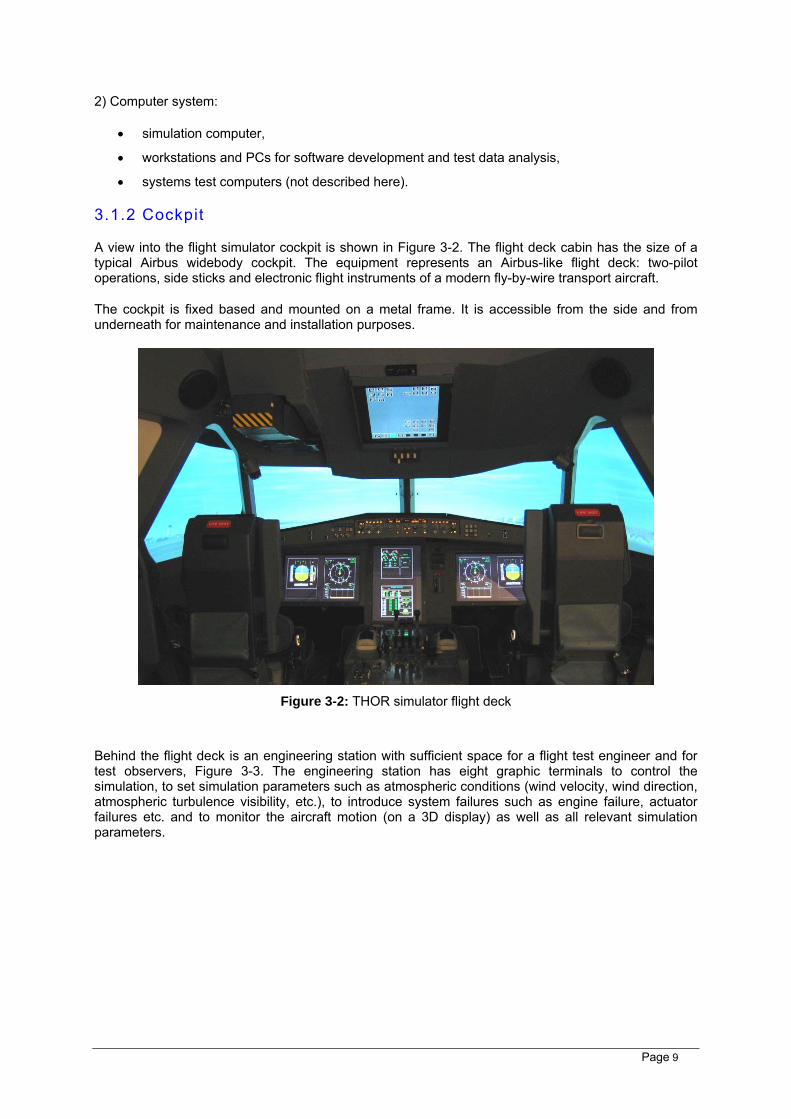
The visual system image generator is a PC system consisting of 3 PCs (1 PC per channel) coupled by Ethernet and using the OpenGL-based “PHILOSIM” software.
The projection system is a three channel system produced by SEOS with 150° x 40° field of view, using JVC projectors. An example outside view generated by the visual system (approach to Frankfurt/Main airport, RWY 25R) is given in Figure 3-4.
Figure 3-4: Outside view
3.1.5 Sound system
The sound simulation system is a 4 channel PC-based system with 6 loudspeakers in the cockpit. The system generates different types of sound, which can be activated by the simulation computer.
Available sounds include: aerodynamic noise, air condition noise, engine noise, rain, hail, ground contact of nose and main landing gear, landing gear in and out, and synthetic warning messages. Aural warnings (synthetic voices) such as "ten", "twenty", "one hundred", "minimum", "whoop whoop pull up", "terrain", "too low terrain", "too low", "too low gear", "too low flaps", "sink rate", "don't sink gear", "don't sink", "glide slope". Warning signals such as: single chime, repetitive chime, continuous repetitive chime, click, cavalry charge, cavalry chord, fire bell, whooler, cricket and kettle.
3.1.6 Simulation host computer
The simulation computer is a CONCURRENT iHawk 864. It is a multi-processor, real-time computer system with four Intel processors (1.4 GHz) and 2 GB RAM (global memory). Simulation data are exchanged between the CPUs via a shared memory. Data and programs are stored on multiple hard

Page 12
disks (7*36Gbyte). Multiple different tape drives are used to store and save data and programs. The RedHawk operating system is a Linux operating system.
The major part of simulation software is written in FORTRAN 77 and small parts are written in C. A typical simulation program runs on 2 processors plus a third processor if structural dynamics are added.
3.1.7 Real-t ime simulation
The aircraft simulation is a six-degree-of-freedom flight simulation program. It performs trim calculation and the dynamic simulation of the natural (uncontrolled) aircraft. It is modularly structured into aircraft dependent subroutines:
• aerodynamic model,
• engine model,
• control surface model,
and aircraft independent subroutines:
• landing gear model,
• atmosphere model (constant wind, turbulence, downbursts),
• 6-DOF dynamic equations (transformations with quaternion),
• radio navigation signals (VOR and ILS signals),
• sensor signals (inertial reference system, air data system, radio altimeter, etc).
Simulation programs are available for several different aircraft types. In the context of the CREDOS project an A320 simulation is used. The EFCS (Electronic Flight Control System) of the A320 is also simulated. The simulation capabilities include manual and automatic flight control laws (autopilot).
The THOR A320 simulation is also equipped with a dedicated wake encounter model. This allows realistically modelling the effect of a wake vortex on the aircraft’s dynamics and the flight instruments. Wake vortices can be introduced at geographically fixed locations, in time-dependent form (thus including decay and moving vortex systems) or as time-fixed, location-independent external disturbances to the flight dynamics (see also chapter 3.4).
3.1.8 Data recording
During the simulation it is possible to record up to 1024 variables for a period of 15 minutes with the simulation update frequency of 50 Hz. The data recording can be started and stopped with a switch located in the cockpit. The data is stored in memory during the simulation and written to harddisk after the simulation is aborted.
Selection of the appropriate variables to record allows adaptation to the current simulation purpose without having to record all available parameters. For wake vortex encounter investigations for example all vortex-related parameters like induced forces, moments, windspeeds and the aircraft position relative to the vortices can be recorded for later analysis.

Page 13
3.2 A330 BASIC FLIGHT SIMULATOR DESCRIPTION
3.2.1 Overview
Certified simulators are designed for airline pilot training and apprenticeship; only original components/instruments are used for the simulator cockpit. Beside the cockpit, diverse certified flight control computers are linked with the simulation.
The CAE A330/A340 full flight simulator operated by the Zentrum für Flugsimulation Berlin (ZFB) is approved for training and research. While the certified JAA STD 1A (D-1A-017) training software has its own dedicated host computer, research will be activated by switching the host computer to an additional research computer.
3.2.2 Cockpit and motion system
Fig. 3-1 shows the CAE A330/A340 full flight simulator cockpit operated by the Zentrum für Flugsimulation Berlin (ZFB). The flight deck consists of glass cockpit with six color CRT’s, three MCDUs, and sidestick and pedal controllers for both pilots. The force-characteristic of the sidestick and the rudder pedals is controlled by hydrostatic actuators and spring elements run by the digital control loading system. The visual system is a 150°x40° field of view state of the art visual system.
On the left hand side the instructor station is shown. The instructor station allows changing the general aircraft settings like A/C weight and centre of gravity (CofG), as well as weather conditions and malfunctions. Approximately 100 airport scenarios are selectable from the instructor station. These scenes are either derived from “real” databases – meaning that the visual shows details in the airports environment (realistic taxiways, realistic hangars, rivers, major obstacles) – or “generic” databases, showing the selected runway with a single taxiway and a generic terminal. The complete radio station environment is available for both kinds of airports.
Fig. 3-1: Cockpit A330/A340 TU Berlin
The series 500 digital motion system, manufactured by CAE Electronics Ltd., provides six degree of freedom motion and includes a comprehensive safety system, ensuring fail-safe protection for the flight compartment and for the occupants. The motion system generates realistic cues to the flight compartment using 6 servo actuators, supplied by a hydraulic power unit.

Page 14
The motion of the flight deck cabin is limited by the capabilities of the hydraulic system. Table 3-1 comprises the maximum displacements, accelerations, and velocities, for each degree of freedom which the motion system is able to produce.
Table 3-1: Motion system capabilities longitudinal lateral vertical roll pitch yaw
maximum displacement 2,84m 2,44m 1,70m ±28 ° +33,5°
-37,5° ±37,5°
maximum velocity ±0,18m/s ±0,18m/s ±0,60m/s ±24°/s ±24 °/s ±24°/s maximum
acceleration ±0,8g ±0,8g ±1,0g ±250°/s² ±250°/s² ±250°/s²
Fig. 3-2: External view of the A330/A340 full-flight simulator
3.2.3 Sound system
The sound system generates the sounds which are audible on the flight deck. About twenty different sounds and noises are simulated to cover all sound requirements on the ground, at take off, and during the flight and landing. Other special sounds are used for emergency scenarios such as engine malfunctions, crash, and impacts. Additionally, the Airbus-type alerts and voice call-outs are part of the standard training simulator.
3.2.4 Simulation computers
All computers used are of the IBM RS 6000-580 series and use AIX 3.2 (IBM-UNIX) as the operating system. In order to allow uninterrupted training, a second identical unit is available as a hot spare, in case the primary training host brakes down. These training computers are not available for research.
An Ethernet-switch provides the possibility to use the research computers instead of the training hosts. The Scientific Research Facility (SRF) host computer is of the identical make as the training
Page 15
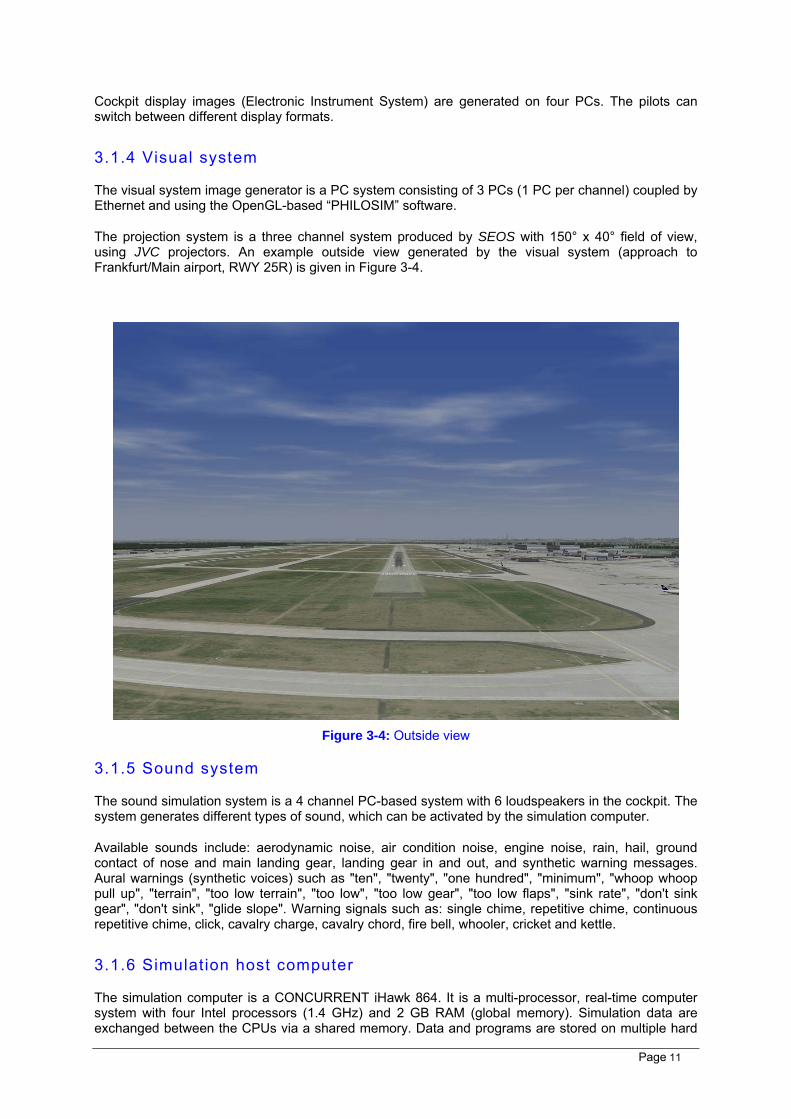
computers. A block diagram of the flight simulator is shown in Fig. 3-3.
The simulation refresh rate for all computers is 60 Hz. On all computers the CAE supplied SIMEX (SIMulation EXecutive) program is used to host the simulation file system; SIMEX is a high level supervisor program and allows easy configuration management.
Fig. 3-3: Full-flight simulator block diagram
3.2.5 Simulation process architecture
The A330 simulation consists of two separate numerical processes: a synchronous (sp0c0.exe) and an asynchronous process (ap0c0.exe). When the simulation binaries are loaded both processes are started and run concurrently. Also, the common block global variables within the Common Data Basis (CDB) are loaded during the start-up, the CDB allows a data exchange between both processes.
3.2.6 Scheduling
The scheduling between the two processes is done by a dedicated scheduler program; the base simulation iteration rate is 60 Hz. Both processes are scheduled as follows:
At first the complete synchronous process loop is processed. If a single loop of the synchronous process exceeds the time of 16msec the simulation terminates with an error. Since the synchronous process usually takes less than 16msec the remaining processor time can be used by the asynchronous process. The asynchronous process does not terminate one of its loops within this timeframe; instead it runs as long as there is time left, until the synchronous process commences its next loop. During the next cycle the asynchronous process commences at its last position.
Page 16
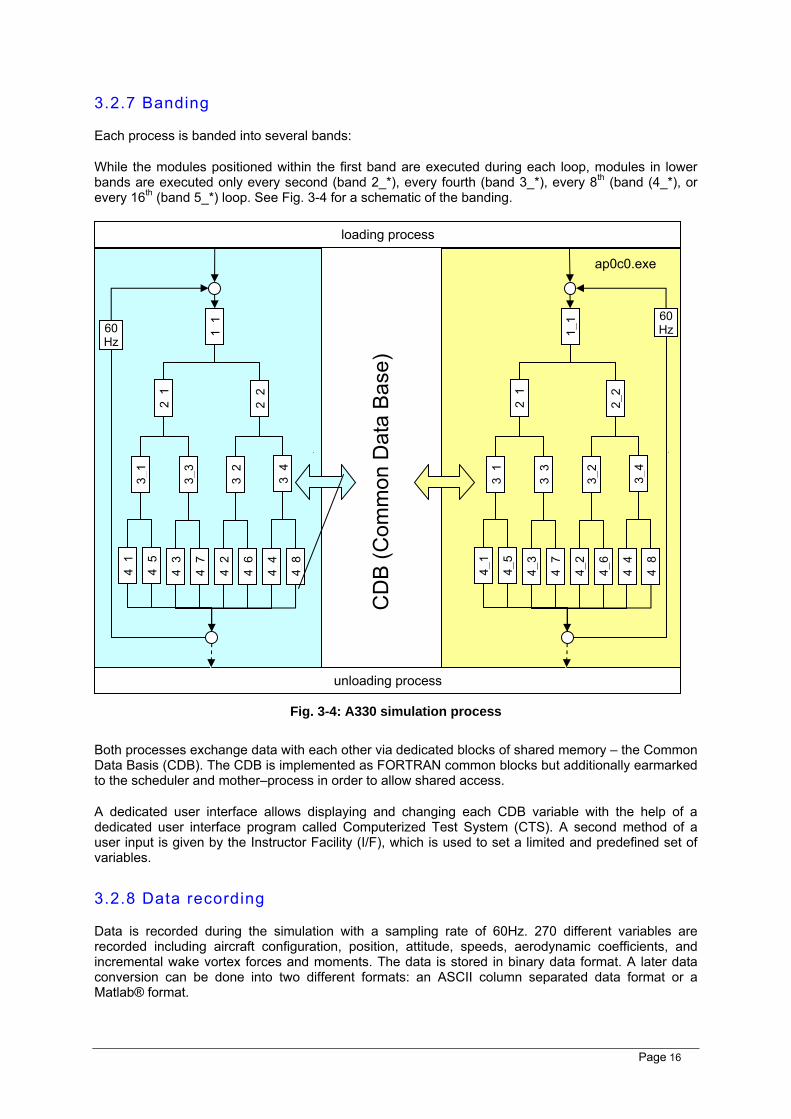
3.2.7 Banding
Each process is banded into several bands:
While the modules positioned within the first band are executed during each loop, modules in lower bands are executed only every second (band 2_*), every fourth (band 3_*), every 8th (band (4_*), or every 16th (band 5_*) loop. See Fig. 3-4 for a schematic of the banding.
Fig. 3-4: A330 simulation process
Both processes exchange data with each other via dedicated blocks of shared memory – the Common Data Basis (CDB). The CDB is implemented as FORTRAN common blocks but additionally earmarked to the scheduler and mother–process in order to allow shared access.
A dedicated user interface allows displaying and changing each CDB variable with the help of a dedicated user interface program called Computerized Test System (CTS). A second method of a user input is given by the Instructor Facility (I/F), which is used to set a limited and predefined set of variables.
3.2.8 Data recording
Data is recorded during the simulation with a sampling rate of 60Hz. 270 different variables are recorded including aircraft configuration, position, attitude, speeds, aerodynamic coefficients, and incremental wake vortex forces and moments. The data is stored in binary data format. A later data conversion can be done into two different formats: an ASCII column separated data format or a Matlab® format.
CD
B (C
omm
on D
ata
Bas
e)
sp0c0.exe
unloading process
loading process
60 Hz
2_1
1_1
2_2
3_1
3_2
3_3
3_4
4_1
4_2
4_3
4_4
4_5
4_7
4_6
4_8
ap0c0.exe
60 Hz
2_1
1_1
2_2
3_1
3_2
3_3
3_4
4_1
4_2
4_3
4_4
4_5
4_7
4_6
4_8

Page 17
3.3 EXTENSION OF WVE SUB-MODULES
A new configuration, CREDOS_01, was created based on a copy of the training software including an extension of the WVE software sub-modules. The description is related to the WVE software version on Dec. 6, 2006, and the common block with the last update on Sep. 16, 2006.
A FORTRAN 77 compiler is needed for the integration of the WVE software into the basic flight simulation software. The WVE subroutines exchange via common blocks only. Besides, both aerodynamic interaction models have their own common blocks in order to exchange data between their subroutines. The CREDOS_01 configuration works with the “lifting surface method” only. A detailed description of each WVE sub-modules and their interaction can be found in [ 2].
3.4 WAKE VORTEX SETUP
3.4.1 Aerodynamic modeling
The vortex model used in the simulator investigations is a simple analytical model of a straight, infinitely long vortex pair of equal and constant circulation, which remains fixed in space once it is activated in the simulation. It is also not transported by the constant wind in the simulation. This simple approach, without taking into account the vortex evolution during the encounter, is justified by the short duration of each wake encounter. During this time the vortex circulation or other properties do not change enough to make a noticeable difference in the aircraft reactions. A moving vortex would however only be more difficult to hit. It is also not the scope of these simulator tests to assess with which probability or in which distance for example a wake is encountered. This is the task of further investigations using WakeScene-D. Here solely the consequences of a possible wake encounter shall be investigated, in case one is happening.
The vortex-induced flow field is computed by using a Burnham-Hallock model for the velocity distribution of the vortices (see Figure 3-5). It needs a vortex circulation Γ and core radius rc as input. Additionally, to put together the combined flow field of a vortex pair, the vortex span bWV is required.
Figure 3-5: Induced velocity field of a vortex pair
The forces and moments acting on the aircraft when it encounters the wake are computed using an Aerodynamic Interaction Model (AIM) that is added to the base flight simulation. It evaluates the additional forces on the main aerodynamic surfaces of the aircraft due to the induced velocity components, and the resulting moments due to these forces. While in the A320 simulation a strip method was used as AIM (see Figure 3-6), the A330 simulator at TUB used a more elaborate Lifting

Page 18
Surface method to compute the forces. Earlier investigations however have shown that differences in the resulting forces and moments between both AIMs are minor.
The wake vortex modelling in both simulators has been developed and validated mainly within the EC-sponsored S-WAKE project (2000-2003).
Figure 3-6: Strip method as AIM for the A320 simulation
3.4.2 Vortex posit ioning
During the tests, the aircraft should encounter the vortices under several different encounter conditions (angles, heights etc.). The take-off phase however usually shows much more variation in the flight path than final approach or cruise, where piloted encounter investigations in earlier projects were conducted. Already a small variation in the rotation point during take-off or a slightly higher climb gradient would lead to considerable offsets at the location of the encounter. A vortex wake that is placed fixed in space prior to the take-off roll would be very hard if not impossible to hit.
To be able to hit the wake as good as possible under intended conditions, two techniques are possible which will be described in the following:
• Forced Encounters (as in forcing the aircraft to fly through the wake in front of it)
• Fixed Encounters (as in imposing fixed forces and moments on the aircraft, no matter what the actual flight path is)
3.4.2.1 Forced Encounters
During Forced Encounters the vortices were activated only shortly before the aircraft reached the intended encounter location. The encounter angles are defined as a Delta to the current flight path, and the vortices are then placed in front of the aircraft, relative to the projected flight path of the aircraft (see Figure 3-7). This means that if the actual flight path of the aircraft remains constant after vortex activation, the vortex wake will be hit exactly under the intended conditions. The more the flight path changes after vortex activation (due to control actions of the pilot or external disturbances), the more the actual encounter conditions will deviate.
The wake vortex encounter scenario is then defined by these parameters (Figure 3-7):

Page 19
• Vertical encounter angle WVγΔ (positive if approaching from the top),
• Lateral encounter angle WVψΔ (positive if approaching from the right),
• Vortex circulation Γ,
• Vortex span bWV,
• a WV reference line definition (WVRLDEF): +1=Left vortex, -1=Right vortex, 0=Center between vortices (this reference line is what the encountering aircraft is “aiming” for)
• Encounter altitude above ground level HEnc,
• Minimum distance to closest vortex at vortex activation Rmin
Figure 3-7: Departure encounter geometry
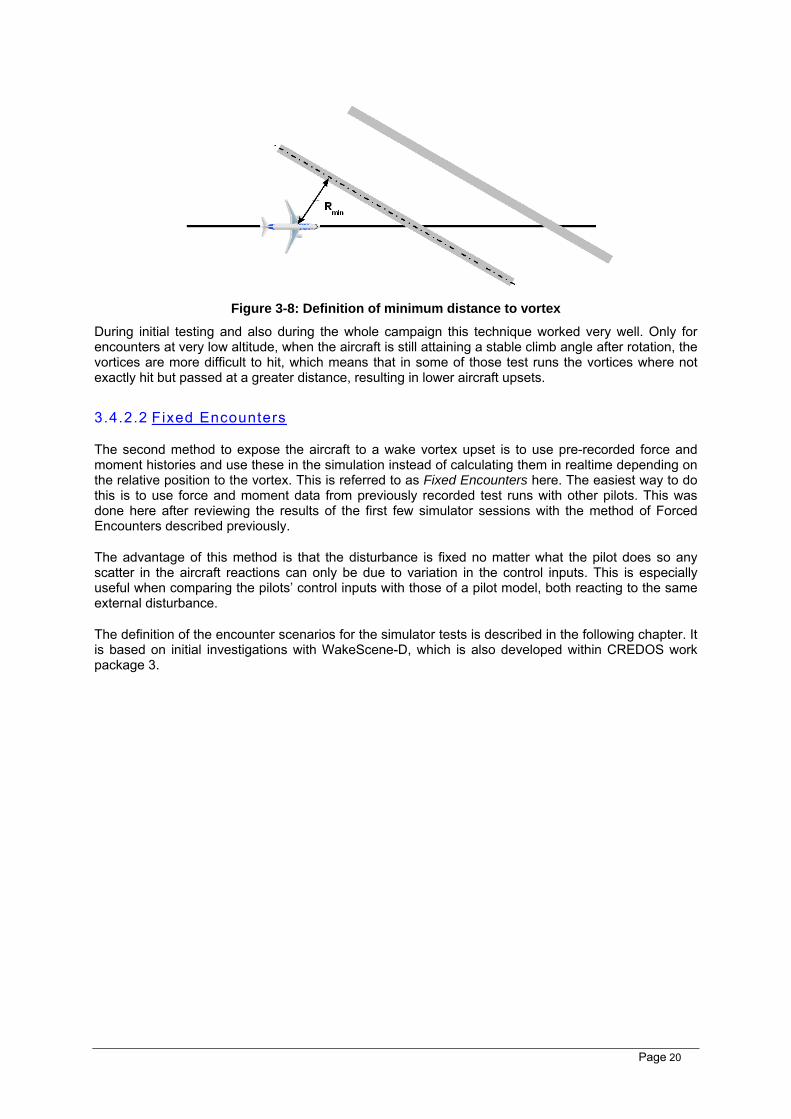
The vortex is also placed in such a way that the minimum distance between the closest vortex and the aircraft CG at the time of vortex activation has a certain predefined value (Figure 3-8). This together with the angles defines the position of the vortex pair in space. The distance has to be large enough that no forces or moments are felt in the cockpit at the instance of vortex activation, which could alert the pilot of the approaching vortex. This is additionally ensured by a fader that gradually fades in the computed vortex-induced forces and moments over a period of 3 seconds.
A characteristic of this method is that small deviations in the flight path can result in noticeably different aircraft reactions to the vortex, as the induced forces and moments are directly depending on the relative position of the aircraft to the vortex. So even the same encounter scenario will have slightly different outcomes in each run due to small variations in piloting.
Page 20
Figure 3-8: Definition of minimum distance to vortex
During initial testing and also during the whole campaign this technique worked very well. Only for encounters at very low altitude, when the aircraft is still attaining a stable climb angle after rotation, the vortices are more difficult to hit, which means that in some of those test runs the vortices where not exactly hit but passed at a greater distance, resulting in lower aircraft upsets.
3.4.2.2 Fixed Encounters
The second method to expose the aircraft to a wake vortex upset is to use pre-recorded force and moment histories and use these in the simulation instead of calculating them in realtime depending on the relative position to the vortex. This is referred to as Fixed Encounters here. The easiest way to do this is to use force and moment data from previously recorded test runs with other pilots. This was done here after reviewing the results of the first few simulator sessions with the method of Forced Encounters described previously.
The advantage of this method is that the disturbance is fixed no matter what the pilot does so any scatter in the aircraft reactions can only be due to variation in the control inputs. This is especially useful when comparing the pilots’ control inputs with those of a pilot model, both reacting to the same external disturbance.
The definition of the encounter scenarios for the simulator tests is described in the following chapter. It is based on initial investigations with WakeScene-D, which is also developed within CREDOS work package 3.

Page 21
4 ENCOUNTER SCENARIO DEFINITION
4.1 WAKESCENE DATA BASIS
The WakeScene-D software package (Wake Vortex Scenarios Simulation Package for Departure), developed in CREDOS subtask 3.1.2, is used for airspace simulations for takeoff and departure.
The combination of an aircraft trajectory model and a physical wake vortex evolution model allows realistic airport/airspace simulations. Aircraft traffic mix, meteorological and environmental conditions can be changed. Therefore WakeScene-D is able to estimate the probability of wake vortex encounters in different traffic and crosswind conditions using Monte Carlo simulation in a domain ranging from the runway until 3000 ft above ground.
This chapter describes the scenarios for the piloted simulator tests, prepared at the TU Berlin with the A330 FFS and in Hamburg at Airbus with the A320 simulator. The flown scenarios in the simulators are derived based on WakeScene-D results. Wake vortex encounter scenarios with a high probability of occurrence were chosen as a basis for the piloted simulator test. These probabilities were determined by WakeScene-D with assumptions of typical operational traffic mix and crosswind conditions above a certain level.
For meteorological parameters a one year simulation of realistic meteorological conditions was produced for the Frankfurt terminal area with the non-hydrostatic mesoscale weather forecast model system NOWVIV (NOWcasting Wake Vortex Impact Variables). The meteorological quantities comprise the wind direction and velocity, air density, virtual potential temperature, turbulence kinetic energy (TKE), eddy dissipation rate (EDR), and pressure. The vertical profiles of those quantities are separated by one nautical mile along the glide paths for approaches on the 07 and 25 runways. An output frequency of 10 minutes was selected.
Aircraft trajectories for a selection of aircraft types are provided by a validated parametric trajectory model which was developed in CREDOS subtask 3.1.1 and is described in [ 1]. The trajectory model considers:
• Different standard departure routes and runways
• Meteorological conditions including air temperature, density, pressure, wind direction and strength
• Aircraft types and combinations
• Aircraft takeoff weights
• Take off thrust mode – Take-Off Go Around (TOGA) thrust or Flex Take-Off thrust (reduced thrust rating)
• Start position on the runway
• Deviations from the theoretical planned departure route.
In the WakeScene-D Monte Carlo simulation the listed parameters were varied to identify critical wake vortex encounter scenarios. These factors are varied within defined boundaries and given probability distributions.
For wake vortex prediction there is a choice between the Probabilistic Two-Phase wake vortex decay and transport (P2P) model, in its deterministic version D2P, developed by DLR, and the Deterministic/Probabilistic Wake Vortex Model (DVM/PVM), developed by UCL. For the definition of simulator scenarios the D2P model was used. The validation of the wake vortex models for departing aircraft and the respective adaptations are described in CREDOS deliverable D2-5.

Page 22
4.2 SCENARIOS FOR SIMULATION
A number of different test cases were composed to cover the most probable encounter conditions during take-off. The encounter angles, altitudes and vortex spans chosen were based on results from the initial WakeScene-D calculations. They showed which range of values was most probable for each parameter. The vortex circulations from WakeScene-D identified encounters were however relatively low. Initial tests showed that those only caused light upsets in the simulators. As the intention of the tests was also to cover a broad range of wake encounter strengths from light to severe, the circulation was chosen higher for the tests. The values of between Γ=400-750 m²/s are therefore at the upper end of what can be expected under worst conditions today.
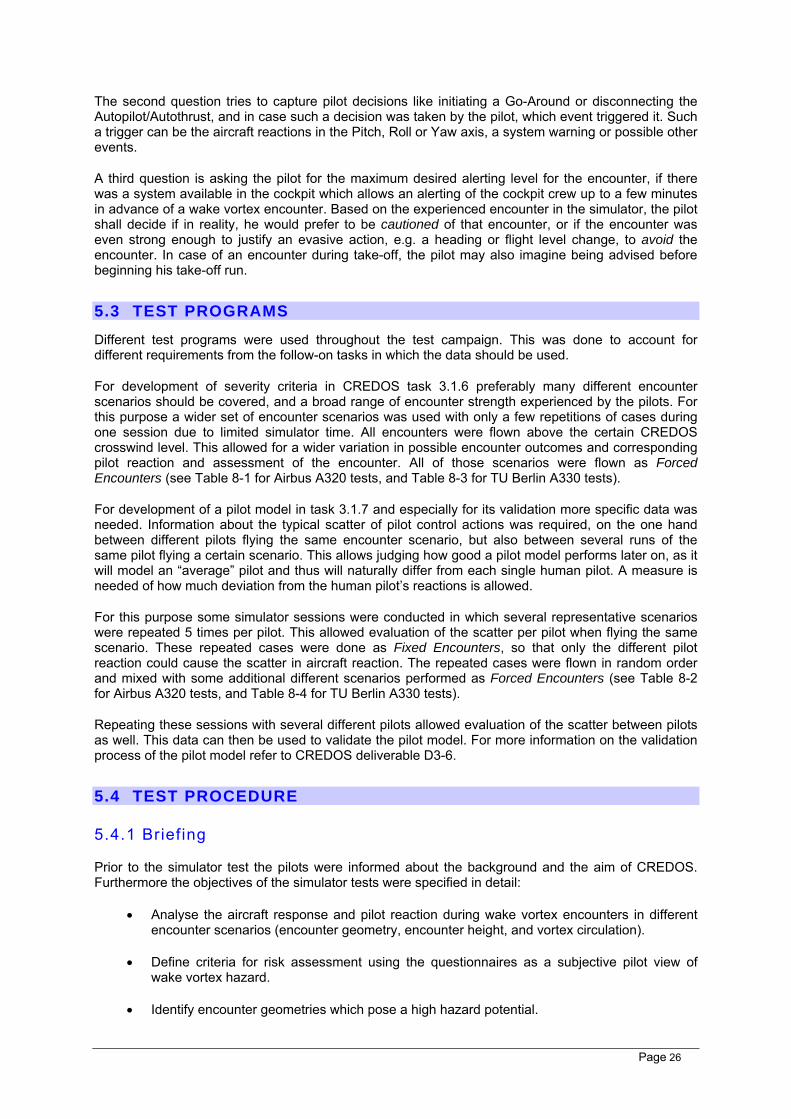
Five different altitude bands were chosen between shortly after rotation and acceleration/thrust reduction altitude. The vortices were engaged at altitudes of 33, 165, 656, 900 and 1100 ft above ground, resulting in encounter altitudes which were always up to several hundred feet higher, as the aircraft still had to approach the vortices. The actual encounter altitudes that were reached are shown in chapter 6.2.1.
Most departures were flown in manual flight in order to record the pilots actions on the controls. Some were however also flown in automatic flight with Autopilot (AP) engaged, whereas the Autopilot was activated about 3 seconds after lift-off (as early as the Flight Control System allowed). In these tests not only the reaction of the Autopilot to the wake encounter should be tested, but even more the reaction of the pilot when noticing a large deviation from the planned flight path during automatic flight.
The common scenario settings for tests in both simulators are shown in Table 4-1. A crosswind realistic for the CREDOS scenario has been set fixed for each test run. The aircraft specific settings are summarized in Table 4-2.
Table 4-1: Common scenario settings Scenery: Frankfurt/Main airport (FRA / EDDF)
Runway in use: 25R – 249°
SID: TOBAK2F
Crew: Single pilot operation from the left or right hand seat
Weather: Visibility: CAVOK
Wind: 190° / 10kt QNH 1013.5hPa Ceiling 0/8

Page 23
Table 4-2: Aircraft specific settings for simulator tests A320 THOR simulator (Airbus):
A/C type: A320-200
A/C weight: 66000 kg
CG: 25% MAC
Thrust rating: Flex 42
VRot: 137 kts (Flaps 2)
V2: 142 kts (Flaps 2)
A330 FFS (TUB):
A/C type: A330-300
A/C weight: 150000 kg
CG: 28% MAC
Thrust rating: Flex 62
VRot: 126 kts (Flaps 2)
V2: 133 kts (Flaps 2)
The different scenarios were then loaded into the simulation in random (but predefined) order during the test. Each of the test cases was used at least once during each test session. Some could usually be repeated within the available time. Each case flown with Autopilot was also flown at least once manually as well. Different test program were used which can be found in the Appendix, Table 8-1 - Table 8-4.
Page 24
5 SIMULATOR FLIGHT TEST
5.1 SCHEDULING
Each simulator session consisted of a 4 hour test block. A pilot briefing and debriefing was included with 30 minutes each, see also section 5.4. The test sessions in the A330 FFS had to be scheduled depending on availability of free slots, as the simulator is extensively used for regular airline training as well. Availability of the A320 THOR simulator was more flexible, and most of the sessions took place in the morning.
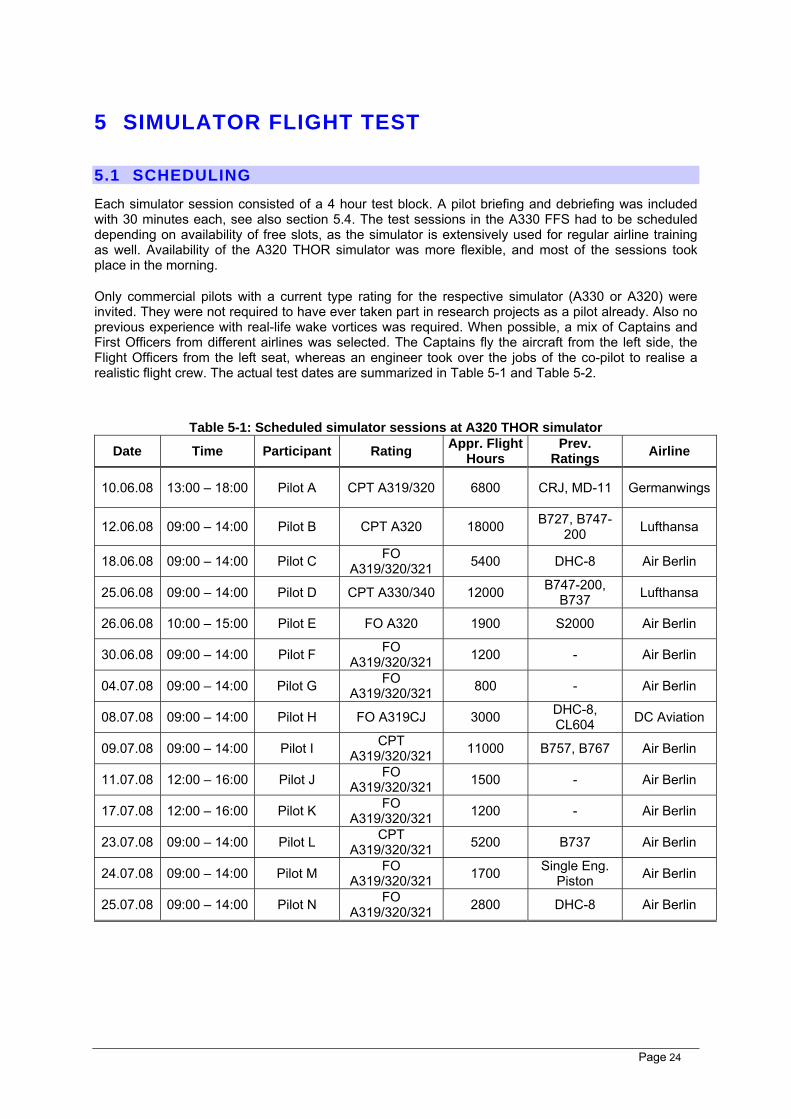
Only commercial pilots with a current type rating for the respective simulator (A330 or A320) were invited. They were not required to have ever taken part in research projects as a pilot already. Also no previous experience with real-life wake vortices was required. When possible, a mix of Captains and First Officers from different airlines was selected. The Captains fly the aircraft from the left side, the Flight Officers from the left seat, whereas an engineer took over the jobs of the co-pilot to realise a realistic flight crew. The actual test dates are summarized in Table 5-1 and Table 5-2.
Table 5-1: Scheduled simulator sessions at A320 THOR simulator
Date Time Participant Rating Appr. Flight Hours
Prev. Ratings Airline
10.06.08 13:00 – 18:00 Pilot A CPT A319/320 6800 CRJ, MD-11 Germanwings
12.06.08 09:00 – 14:00 Pilot B CPT A320 18000 B727, B747-200 Lufthansa
18.06.08 09:00 – 14:00 Pilot C FO A319/320/321 5400 DHC-8 Air Berlin
25.06.08 09:00 – 14:00 Pilot D CPT A330/340 12000 B747-200, B737 Lufthansa
26.06.08 10:00 – 15:00 Pilot E FO A320 1900 S2000 Air Berlin
30.06.08 09:00 – 14:00 Pilot F FO A319/320/321 1200 - Air Berlin
04.07.08 09:00 – 14:00 Pilot G FO A319/320/321 800 - Air Berlin
08.07.08 09:00 – 14:00 Pilot H FO A319CJ 3000 DHC-8, CL604 DC Aviation
09.07.08 09:00 – 14:00 Pilot I CPT A319/320/321 11000 B757, B767 Air Berlin
11.07.08 12:00 – 16:00 Pilot J FO A319/320/321 1500 - Air Berlin
17.07.08 12:00 – 16:00 Pilot K FO A319/320/321 1200 - Air Berlin
23.07.08 09:00 – 14:00 Pilot L CPT A319/320/321 5200 B737 Air Berlin
24.07.08 09:00 – 14:00 Pilot M FO A319/320/321 1700 Single Eng.
Piston Air Berlin
25.07.08 09:00 – 14:00 Pilot N FO A319/320/321 2800 DHC-8 Air Berlin
Page 25
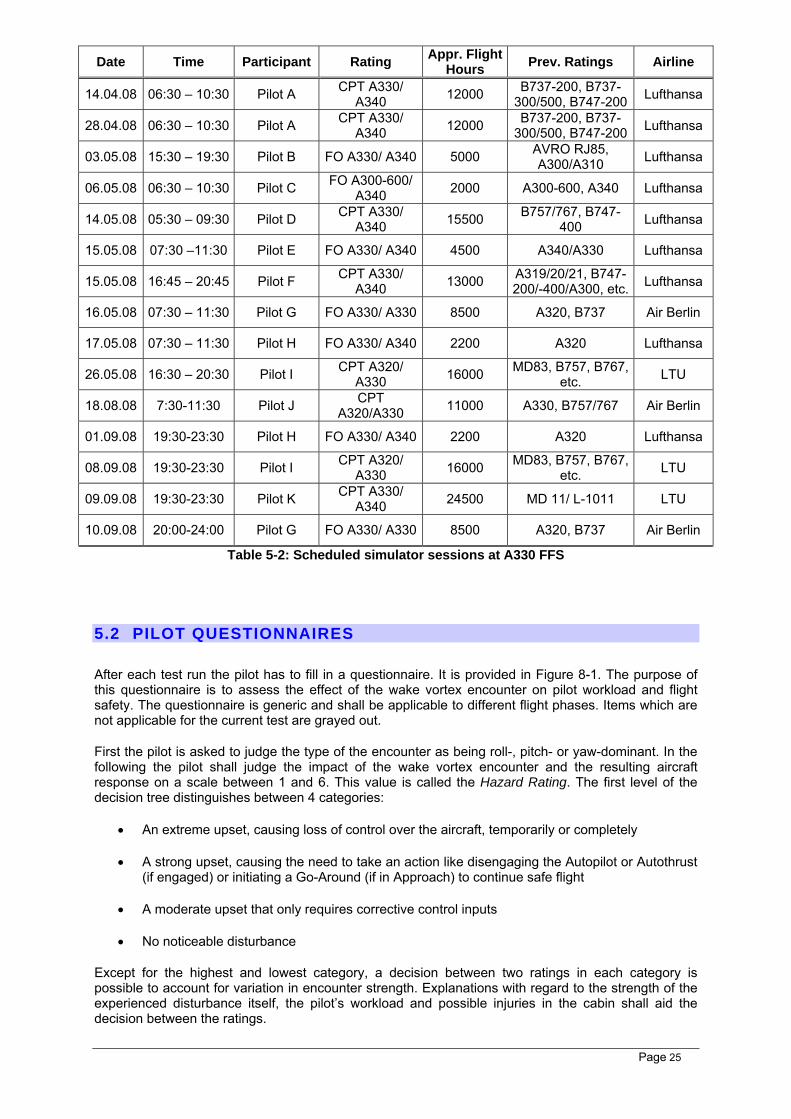
Table 5-2: Scheduled simulator sessions at A330 FFS
5.2 PILOT QUESTIONNAIRES
After each test run the pilot has to fill in a questionnaire. It is provided in Figure 8-1. The purpose of this questionnaire is to assess the effect of the wake vortex encounter on pilot workload and flight safety. The questionnaire is generic and shall be applicable to different flight phases. Items which are not applicable for the current test are grayed out.
First the pilot is asked to judge the type of the encounter as being roll-, pitch- or yaw-dominant. In the following the pilot shall judge the impact of the wake vortex encounter and the resulting aircraft response on a scale between 1 and 6. This value is called the Hazard Rating. The first level of the decision tree distinguishes between 4 categories:
• An extreme upset, causing loss of control over the aircraft, temporarily or completely
• A strong upset, causing the need to take an action like disengaging the Autopilot or Autothrust (if engaged) or initiating a Go-Around (if in Approach) to continue safe flight
• A moderate upset that only requires corrective control inputs
• No noticeable disturbance
Except for the highest and lowest category, a decision between two ratings in each category is possible to account for variation in encounter strength. Explanations with regard to the strength of the experienced disturbance itself, the pilot’s workload and possible injuries in the cabin shall aid the decision between the ratings.
Date Time Participant Rating Appr. Flight Hours Prev. Ratings Airline
14.04.08 06:30 – 10:30 Pilot A CPT A330/ A340 12000 B737-200, B737-
300/500, B747-200 Lufthansa
28.04.08 06:30 – 10:30 Pilot A CPT A330/ A340 12000 B737-200, B737-
300/500, B747-200 Lufthansa
03.05.08 15:30 – 19:30 Pilot B FO A330/ A340 5000 AVRO RJ85, A300/A310 Lufthansa
06.05.08 06:30 – 10:30 Pilot C FO A300-600/ A340 2000 A300-600, A340 Lufthansa
14.05.08 05:30 – 09:30 Pilot D CPT A330/ A340 15500 B757/767, B747-
400 Lufthansa
15.05.08 07:30 –11:30 Pilot E FO A330/ A340 4500 A340/A330 Lufthansa
15.05.08 16:45 – 20:45 Pilot F CPT A330/ A340 13000 A319/20/21, B747-
200/-400/A300, etc. Lufthansa
16.05.08 07:30 – 11:30 Pilot G FO A330/ A330 8500 A320, B737 Air Berlin
17.05.08 07:30 – 11:30 Pilot H FO A330/ A340 2200 A320 Lufthansa
26.05.08 16:30 – 20:30 Pilot I CPT A320/ A330 16000 MD83, B757, B767,
etc. LTU
18.08.08 7:30-11:30 Pilot J CPT A320/A330 11000 A330, B757/767 Air Berlin
01.09.08 19:30-23:30 Pilot H FO A330/ A340 2200 A320 Lufthansa
08.09.08 19:30-23:30 Pilot I CPT A320/ A330 16000 MD83, B757, B767,
etc. LTU
09.09.08 19:30-23:30 Pilot K CPT A330/ A340 24500 MD 11/ L-1011 LTU
10.09.08 20:00-24:00 Pilot G FO A330/ A330 8500 A320, B737 Air Berlin
Page 26
The second question tries to capture pilot decisions like initiating a Go-Around or disconnecting the Autopilot/Autothrust, and in case such a decision was taken by the pilot, which event triggered it. Such a trigger can be the aircraft reactions in the Pitch, Roll or Yaw axis, a system warning or possible other events.
A third question is asking the pilot for the maximum desired alerting level for the encounter, if there was a system available in the cockpit which allows an alerting of the cockpit crew up to a few minutes in advance of a wake vortex encounter. Based on the experienced encounter in the simulator, the pilot shall decide if in reality, he would prefer to be cautioned of that encounter, or if the encounter was even strong enough to justify an evasive action, e.g. a heading or flight level change, to avoid the encounter. In case of an encounter during take-off, the pilot may also imagine being advised before beginning his take-off run.
5.3 TEST PROGRAMS
Different test programs were used throughout the test campaign. This was done to account for different requirements from the follow-on tasks in which the data should be used.
For development of severity criteria in CREDOS task 3.1.6 preferably many different encounter scenarios should be covered, and a broad range of encounter strength experienced by the pilots. For this purpose a wider set of encounter scenarios was used with only a few repetitions of cases during one session due to limited simulator time. All encounters were flown above the certain CREDOS crosswind level. This allowed for a wider variation in possible encounter outcomes and corresponding pilot reaction and assessment of the encounter. All of those scenarios were flown as Forced Encounters (see Table 8-1 for Airbus A320 tests, and Table 8-3 for TU Berlin A330 tests).
For development of a pilot model in task 3.1.7 and especially for its validation more specific data was needed. Information about the typical scatter of pilot control actions was required, on the one hand between different pilots flying the same encounter scenario, but also between several runs of the same pilot flying a certain scenario. This allows judging how good a pilot model performs later on, as it will model an “average” pilot and thus will naturally differ from each single human pilot. A measure is needed of how much deviation from the human pilot’s reactions is allowed.
For this purpose some simulator sessions were conducted in which several representative scenarios were repeated 5 times per pilot. This allowed evaluation of the scatter per pilot when flying the same scenario. These repeated cases were done as Fixed Encounters, so that only the different pilot reaction could cause the scatter in aircraft reaction. The repeated cases were flown in random order and mixed with some additional different scenarios performed as Forced Encounters (see Table 8-2 for Airbus A320 tests, and Table 8-4 for TU Berlin A330 tests).
Repeating these sessions with several different pilots allowed evaluation of the scatter between pilots as well. This data can then be used to validate the pilot model. For more information on the validation process of the pilot model refer to CREDOS deliverable D3-6.
5.4 TEST PROCEDURE
5.4.1 Brief ing
Prior to the simulator test the pilots were informed about the background and the aim of CREDOS. Furthermore the objectives of the simulator tests were specified in detail:
• Analyse the aircraft response and pilot reaction during wake vortex encounters in different encounter scenarios (encounter geometry, encounter height, and vortex circulation).
• Define criteria for risk assessment using the questionnaires as a subjective pilot view of wake vortex hazard.
• Identify encounter geometries which pose a high hazard potential.

Page 27
• Develop and validate a mathematical pilot model using pilot reactions on all control elements in the cockpit.
Then the pilot was informed about the aircraft configuration, which was frozen for all tests, see also Table 8-5. Finally the test procedure and the questionnaires were explained to the pilot.
5.4.2 Simulator start-up (A330 FFS)
As the WV software adaptation cannot be controlled by the instructor station a notebook was prepared and connected to the flight simulation host computer via Ethernet. Simulator start-up encompasses all steps to set-up the notebook as a control workstation and loading the simulation itself. Loading the simulation takes up to 15 minutes. During that time the pilot could become familiar with the cockpit. Following the successful simulation loading the control forces system, motion system, and visual system are engaged.
5.4.3 Session start-up (A330 FFS)
Session start-up mainly includes all steps necessary to prepare the cockpit and setting the aircraft into its basic operational status. This includes entering the aircraft weight and CG data, initialising the FMS, starting the engines, and trimming the aircraft to the initial position.
Following the session start-up, the simulator is ready for piloted tests.
For the A320 THOR simulator no special start-up procedure is necessary.
5.4.4 Test procedure
Prior to beginning the test program, the pilot was given opportunity to familiarize with the simulator by flying a departure without any vortex disturbances. Then one or two departures with vortex encounters could be flown to show the pilot what he has to expect during the session, and also to give an opportunity to become familiar with the questionnaire.
After that around 40 wake vortex encounters could be flown in the available time. The test always began on the runway with the takeoff. A test run ended when the aircraft is stabilized/recovered and well on track again after hitting the wake vortex. This happened at the latest around 3000 ft above ground.
Each test began on runway 25R in take-off configuration. The majority of departures had to be flown manually; while a small fraction (5-10) were flown with auto pilot (AP), where the AP should be activated as early as possible after lift-off.
During the 40 departures, wake vortices appeared in different altitudes, with different vortex strength and different encounter geometries with respect to the flight path.
It was the pilot’s task to fly just as in daily operation. He should follow his standard departure procedure and keep in mind that passengers are on board. He should attentively monitor the aircraft reaction during the wake vortex encounter to assess his pilot workload for recovering the aircraft back to a stationary flight attitude. After all departures a questionnaire had to be filled in.
The session was closed after completion of all test cases. This step included confirmation of saved data.

Page 28
5.4.5 Simulator Shut-down (A330 FFS)
The simulator is shut down in reverse order of simulator start-up. First the aircraft has to be set to the runway the engines have to be deactivated and the cockpit has to reset to standard configuration. Motion and control force systems have to be unloaded prior to the simulation executables. The control workstation has to be disconnected and the simulator logbook has to be signed.
For the A320 THOR simulator no special shutdown procedure is necessary.
5.4.6 Debriefing
The pilot debriefing had two primary purposes. First of all, it is an opportunity for the pilot to comment on the overall session set-up, the questionnaires, and the timing. The second purpose is to gain additional insight into the pilot’s opinion regarding the test cases flown and the pilot’s opinion on the new procedures.
The following questions are asked to find potential for improvement for future piloted simulator tests:
• How realistic was the wake vortex simulation?
• How would you assess the simulator campaign accomplishment?
• What should be improved?
• Are the questionnaires easy and clear to understand?
• Further remarks?
• Have you had any experience with wake vortex encounters so far? If yes:
o In which flight phase, at what airport, and with which aircraft type?
o How severe was the upset (app. bank angle …)
o Was the event officially reported?
• Would you, in general, participate in further research projects?
Finally the debriefing is used to clarify formal things, like reimbursements for travel expenses and to fill out the pilot data sheet form (Figure 8-3). Also the opportunity was used to ask the pilot to fill out a questionnaire with general questions regarding operational working practice (Figure 8-2).
Page 29
6 SIMULATOR TEST EVALUATION
The objective of the data collection was to obtain the necessary data to both analyse the flown trajectories and to gain a subjective point of view from the pilots; to learn how they would assess the hazard of the wake vortex encounter situation directly afterwards. For this purpose the data collection is divided into two parts – subjective and objective data recording.
The purpose of the questionnaires is to assess the effect of the wake vortex encounter on subjective pilot workload and flight safety.
For the development of WVE severity criteria in WP 3.1.6 objective data from the simulation is recorded and can be correlated with the subjective data. For detailed information see also CREDOS deliverable D3-6. Furthermore the data will be used to develop and validate offline wake encounter pilot models for fast-time simulations. For details in this refer to CREDOS deliverable D3-7.
In this chapter some qualitative results from the tests shall be documented, as well as some initial results to show the quality of the data.
6.1 QUALITATIVE OBSERVATIONS
6.1.1 A320 THOR simulator
The simulator sessions conducted in the A320 simulator went very well and without major problems. The technique of vortex positioning as described in chapter 3.4.2, makes sure that the vortex is hit during the take-off phase, worked good and very reproducible.
Altogether 576 wake vortex encounters were flown in 14 simulator sessions with 14 different pilots (5 Captains, 9 First Officers).
Some observations made during the sessions include:
• The realism of the simulation was rated very good by all pilots, even without a motion system. Most pilots however would expect a difference in ratings between motion and non-motion simulators
• Pilots tend to give higher Hazard Ratings and/or a higher Alerting Level in Question 3 when the encounter is closer to the ground
• Stick inputs up to maximum deflection in both axes for a short time are not necessarily a “high workload”. One pilot mentioned an in-flight engine failure as “reference” for a high workload, as corrective inputs are necessary over an extended period of time
• Application of TOGA thrust due to the encounter occurred only very rarely (~1% of encounters)
• A “familiarization” with how to react to the vortices was felt by most pilots after the 40 encounters

Page 30
6.1.2 A330 Full Flight Simulator
Two simulator campaigns have been carried out in the A330 full-flight simulator at TU Berlin. The first campaign contained 10 sessions with 9 different pilots based on forced encounters. The second campaign included fixed encounters with 5 sessions. Three of the five pilots who had participated on the 1st campaign came a second time to fly the fixed encounter program.
The method for the wake vortex set up during departure, as described above in detail in chapter 3.4.2, was applied to the A330 simulator and worked very reproducibly.
In summary 691 wake vortex encounters were flown in 15 simulator sessions with 11 different pilots (6 Captains, 5 First Officers).
In the scope of the debriefing the following questions were asked. The summarized answers can be found below.
• Do you think the wake vortex simulation was realistic?
All pilots answered with YES
• How would you assess the practical application of the simulator tests?
Most of the pilots did not have any suggestions of improvement. One pilot said the program could be more diversified, e.g. flying takeoffs and landings in turns. Another pilot proposed to fly takeoffs also in direct or alternate law to see the difference in aircraft reaction.
• Is the questionnaire easy to understand?
This was affirmed by all pilots.
Except one all pilots had already experience with wake vortex encounters. Most of them happened in approach and cruise phases, a few of them during departure.
The other observations that have been made during the simulator sessions in Hamburg can be confirmed for the Berlin sessions as well.
6.2 DATA ANALYSIS OF RECORDED SIMULATOR DATA
6.2.1 A320 THOR simulator
In this chapter some initial results from the simulator tests are shown to assess the quality of the data. The extensive analysis of the data will be done in CREDOS tasks 3.1.6 and 3.1.7 and covered in the corresponding reports.
Figure 6-1 shows exemplarily the repeatability of the encounter altitudes from one simulator session in the A320 THOR simulator. The encounter is defined as the instant of maximum induced rolling moment on the aircraft. Obviously the highest variation occurs in the middle altitude band. This might be due to the nature of certain encounter scenarios in that altitude band, which showed more variation in the flight path through the wake then other scenarios. In this case for example, the encounters at a higher altitude in the blue curve all have a vertical encounter angle of Δγ=0°, which results in the aircraft being placed further away from the crossing point with the wake so that it respects the minimum initial distance (cp. Figure 3-7 and Figure 3-8). Therefore the aircraft is climbing further until it actually reaches the first vortex.
As it is assumed that encounter altitude does not have a major impact on pilot reactions and hazard ratings during take-off, for example because the ground is usually not in sight in that phase, the variation in altitudes does certainly not affect the quality of the results either. It gives however an indication of the repeatability of the chosen approach to engage the vortices in the aircrafts flight path.
Page 31
Figure 6-1: Actual encounter altitudes for the A320 simulator session on 09JUL08
The following Figure 6-2, Figure 6-3 and Figure 6-4 show repeatability of the aircraft reactions and the pilots stick inputs for 5 repeated runs of the same Fixed Encounter scenario from the simulator session of 30JUL08 (one pilot). In this case the aircraft dynamics as well as the pilot reaction are very well reproduced in each run. Additionally Figure 6-4 shows the Flight Director orders on the PFD, which were the main inputs for the pilot to judge the attitude of the aircraft. They are calculated from the actual bank or pitch angle minus the commanded attitude angle (which usually is bank angle Φ=0° and pitch angle Θ≈15-18° during take-off). They should correlate mainly with the bank and pitch angle curves, which they appear to do.

Page 32
Figure 6-2: A320 repeatability of aircraft reactions and pilot input in roll axis, Fixed Encounter,
ref. Table 8-2 case #6

Page 33
Figure 6-3: A320 repeatability of aircraft reactions and pilot input in pitch axis, Fixed
Encounter, ref. Table 8-2 case #6
Figure 6-4: A320 repeatability of Flight Director Roll and Pitch orders, Fixed Encounter, ref.
Table 8-2 case #6
Page 34
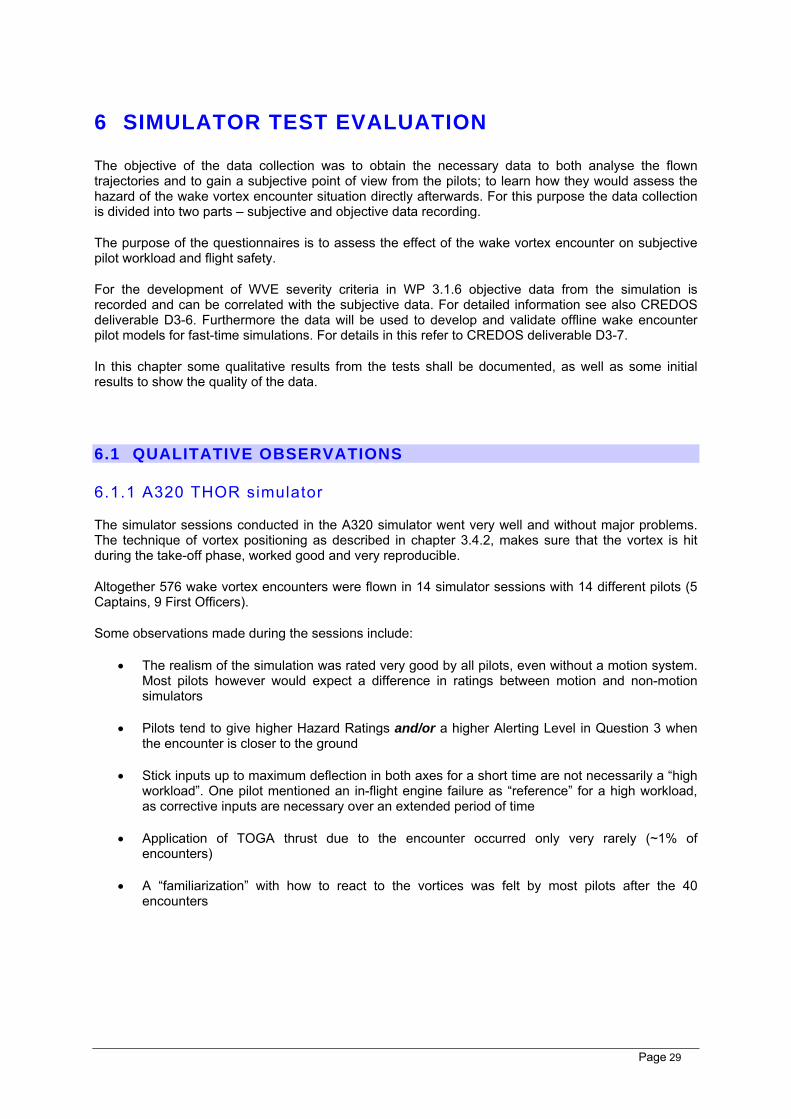
Figure 6-5, Figure 6-6 and Figure 6-7 show the repeatability for another case where variations between the different runs are higher. As can be seen here the roll control input of the pilot during the same encounter scenario (same forces and moments acting on the aircraft in each Run) varies considerably, while aircraft reactions also show more variation, but not quite as much. The subsequent analysis of the data with respect to pilot modelling has to take into account these effects.
Figure 6-5: A320 repeatability of aircraft reactions and pilot input in roll axis, Fixed Encounter,
ref. Table 8-2 case #14

Page 35
Figure 6-6: A320 repeatability of aircraft reactions and pilot input in pitch axis, Fixed
Encounter, Table 8-2 case #14
Figure 6-7: A320 repeatability of Flight Director Roll and Pitch orders, Fixed Encounter, Table
8-2 case #14

Page 36
6.2.2 A330 Full Flight Simulator
The same encounter geometries and initial wake vortex altitudes are used for the A330 FFS tests, as described above for the A320. Only the vortex circulations were adapted for the A330 as a follower to reach comparable aircraft reaction, see and compare Table 8-2 with Table 8-4.
The following
Figure 6-8 and Figure 6-9 show the aircraft reaction in terms of bank and pitch angle, roll and pitch rate as well as the pilot response expressed by the side stick pitch and roll deflection. Figure 6-10 illustrates the flight director order for the longitudinal and lateral aircraft axis. Initial simulator tests have shown that the Flight Director is the instrument that pilots mainly use to monitor the aircraft’s attitude during departure.
It has been shown that for the same Fixed Encounter scenarios flown by one pilot a high repeatability in aircraft reaction and side stick deflection can be reached. Whereas the spread in lateral aircraft axis of aircraft reaction and pilots answers is tighter than in longitudinal axis.
Figure 6-8: A330 repeatability of a/c reactions and pilot input in roll axis, Fixed Encounter, ref. Table 8-4 case #6

Page 37
Figure 6-9: A330 repeatability of a/c reactions and pilot pitch axis input, Fixed Encounter, ref.
Table 8-4 case #6
Figure 6-10: A330 repeatability of Flight Director Roll and Pitch orders, Fixed Encounter, ref.
Table 8-4 case #6

Page 38
The next figures show another fixed encounter scenario. Depending on the strength of the induced incremental forces, moments, and encounter geometry the pilot reaction and resulting aircraft reaction is more or less reproducible, as illustrated in Figure 6-11 and Figure 6-12. Figure 6-13 shows again the FD order which is given to the pilot via PFD.
The outcome for the comparison of all encounter cases was that lower forces and moments and lower encounter angles lead in general to higher spreads in pilot response and aircraft reaction.
The way through a wake vortex with high encounter angles is shorter. The pilot reaction does not vary that much in strong encounters, because a full side stick deflection is absolute needed to recover the aircraft. Therefore it can be summarized that strong encounters with high encounter angles provide more reproducible pilot and aircraft reactions.
Figure 6-11: A330 repeatability of a/c reactions and pilot input in roll axis, Fixed Encounter, ref.
Table 8-4 case #18

Page 39
Figure 6-12: A330 repeatability of a/c reactions and pilot pitch axis input, Fixed Encounter, ref.
Table 8-4 case #18
Figure 6-13: A330 repeatability of Flight Director Roll and Pitch orders, Fixed Encounter, ref.
Table 8-4 case #18
Page 40
6.3 DATA ANALYSIS OF QUESTIONNAIRES
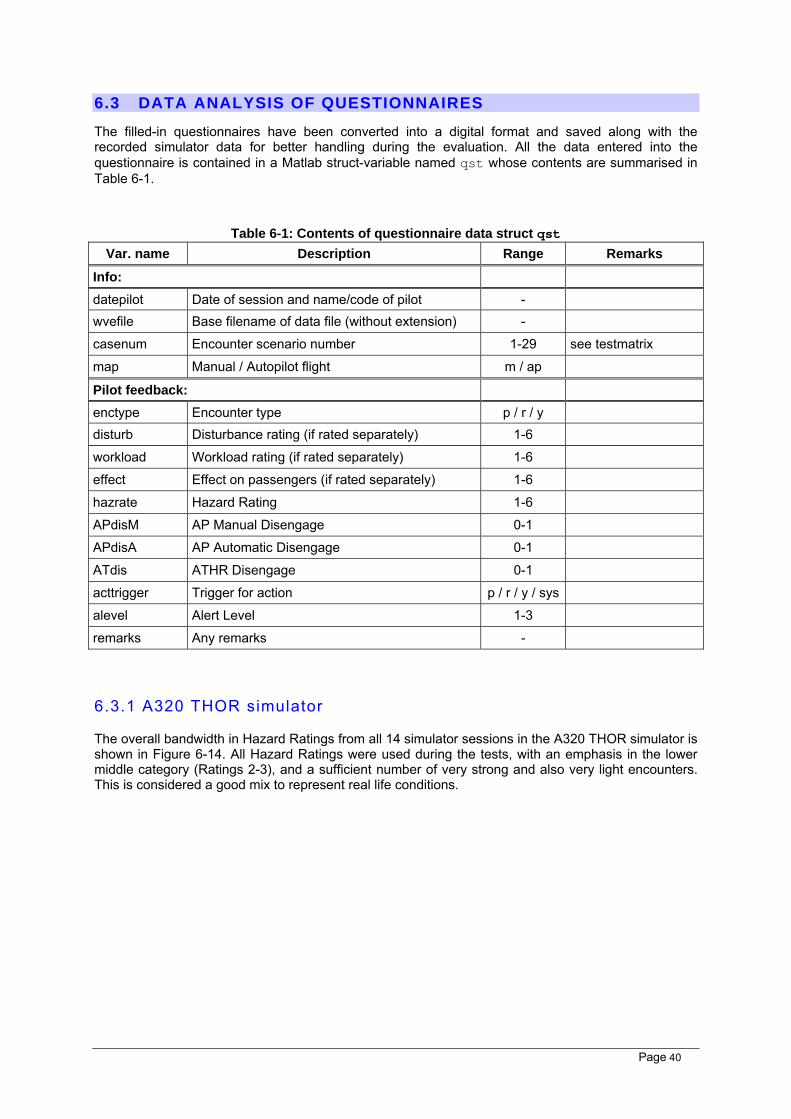
The filled-in questionnaires have been converted into a digital format and saved along with the recorded simulator data for better handling during the evaluation. All the data entered into the questionnaire is contained in a Matlab struct-variable named qst whose contents are summarised in Table 6-1.
Table 6-1: Contents of questionnaire data struct qst Var. name Description Range Remarks
Info:
datepilot Date of session and name/code of pilot - wvefile Base filename of data file (without extension) -
casenum Encounter scenario number 1-29 see testmatrix
map Manual / Autopilot flight m / ap
Pilot feedback:
enctype Encounter type p / r / y disturb Disturbance rating (if rated separately) 1-6
workload Workload rating (if rated separately) 1-6
effect Effect on passengers (if rated separately) 1-6
hazrate Hazard Rating 1-6
APdisM AP Manual Disengage 0-1
APdisA AP Automatic Disengage 0-1
ATdis ATHR Disengage 0-1
acttrigger Trigger for action p / r / y / sys
alevel Alert Level 1-3
remarks Any remarks -
6.3.1 A320 THOR simulator
The overall bandwidth in Hazard Ratings from all 14 simulator sessions in the A320 THOR simulator is shown in Figure 6-14. All Hazard Ratings were used during the tests, with an emphasis in the lower middle category (Ratings 2-3), and a sufficient number of very strong and also very light encounters. This is considered a good mix to represent real life conditions.

Page 41
Figure 6-14: A320 overall distribution of Hazard Ratings (576 encounters in total)
Figure 6-15 shows the Hazard Rating (HR) distribution split into the single test sessions i.e. pilots. It can be seen that the bandwidth of HRs differs between each pilot, as each individual has its own personal estimation on how strong or dangerous the encounter was. Note that slight differences in the execution of the different tests existed, which can have an influence on HRs as well, compare chapter 5.3. The shown statistics and the following statistics of HRs refer on the forced a fixed encounter tests.

Page 42
Figure 6-15: A320 distribution of Hazard Ratings, divided by session/pilot
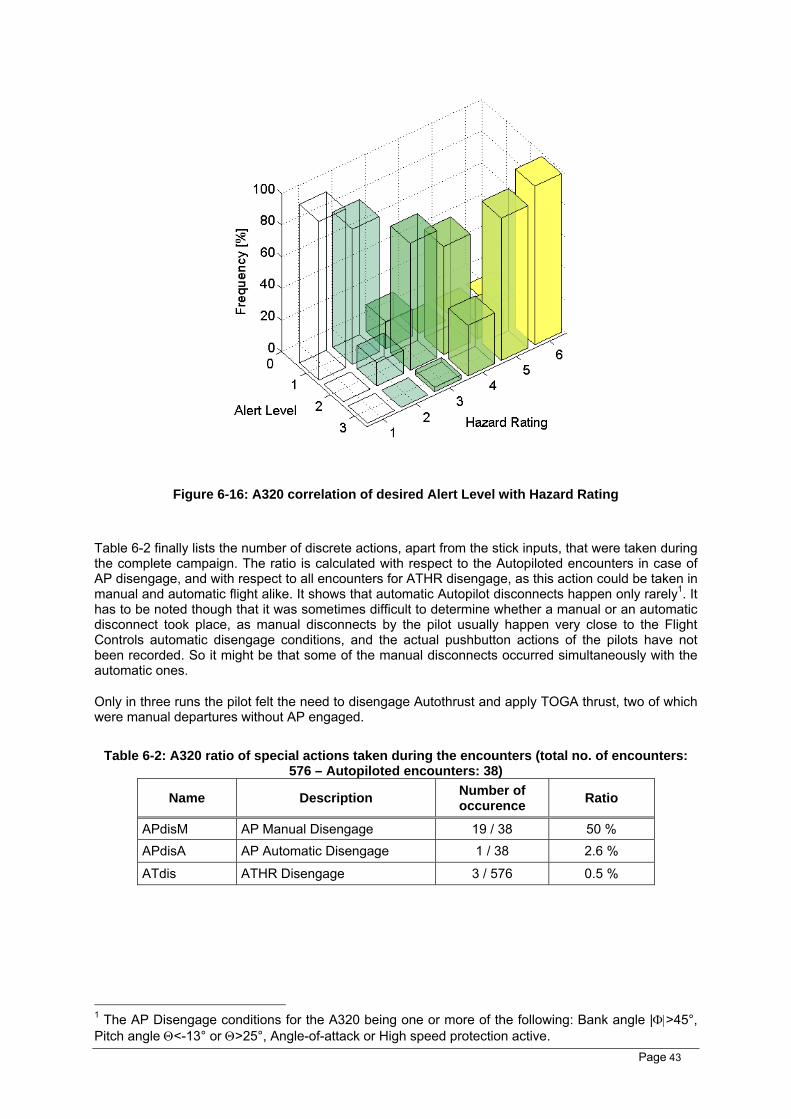
Figure 6-16 contains the correlation with the Alert Level desired by the pilots with the Hazard Rating they gave to each encounter. It shows the expected trend to higher Alerting Levels with higher Hazard Ratings. Based on a qualitative assessment of the distribution shown in the plot the following relation could be made:
Alert Level 1 (No Alert) ⇒ Hazard Rating 1-2
Alert Level 2 (Caution) ⇒ Hazard Rating 3-4
Alert Level 3 (Avoid) ⇒ Hazard Rating 5-6
Page 43
Figure 6-16: A320 correlation of desired Alert Level with Hazard Rating
Table 6-2 finally lists the number of discrete actions, apart from the stick inputs, that were taken during the complete campaign. The ratio is calculated with respect to the Autopiloted encounters in case of AP disengage, and with respect to all encounters for ATHR disengage, as this action could be taken in manual and automatic flight alike. It shows that automatic Autopilot disconnects happen only rarely1. It has to be noted though that it was sometimes difficult to determine whether a manual or an automatic disconnect took place, as manual disconnects by the pilot usually happen very close to the Flight Controls automatic disengage conditions, and the actual pushbutton actions of the pilots have not been recorded. So it might be that some of the manual disconnects occurred simultaneously with the automatic ones.
Only in three runs the pilot felt the need to disengage Autothrust and apply TOGA thrust, two of which were manual departures without AP engaged.
Table 6-2: A320 ratio of special actions taken during the encounters (total no. of encounters:
576 – Autopiloted encounters: 38)
Name Description Number of occurence Ratio
APdisM AP Manual Disengage 19 / 38 50 % APdisA AP Automatic Disengage 1 / 38 2.6 %
ATdis ATHR Disengage 3 / 576 0.5 %
1 The AP Disengage conditions for the A320 being one or more of the following: Bank angle |Φ|>45°, Pitch angle Θ<-13° or Θ>25°, Angle-of-attack or High speed protection active.
Page 44
6.3.2 A330 Full Flight Simulator
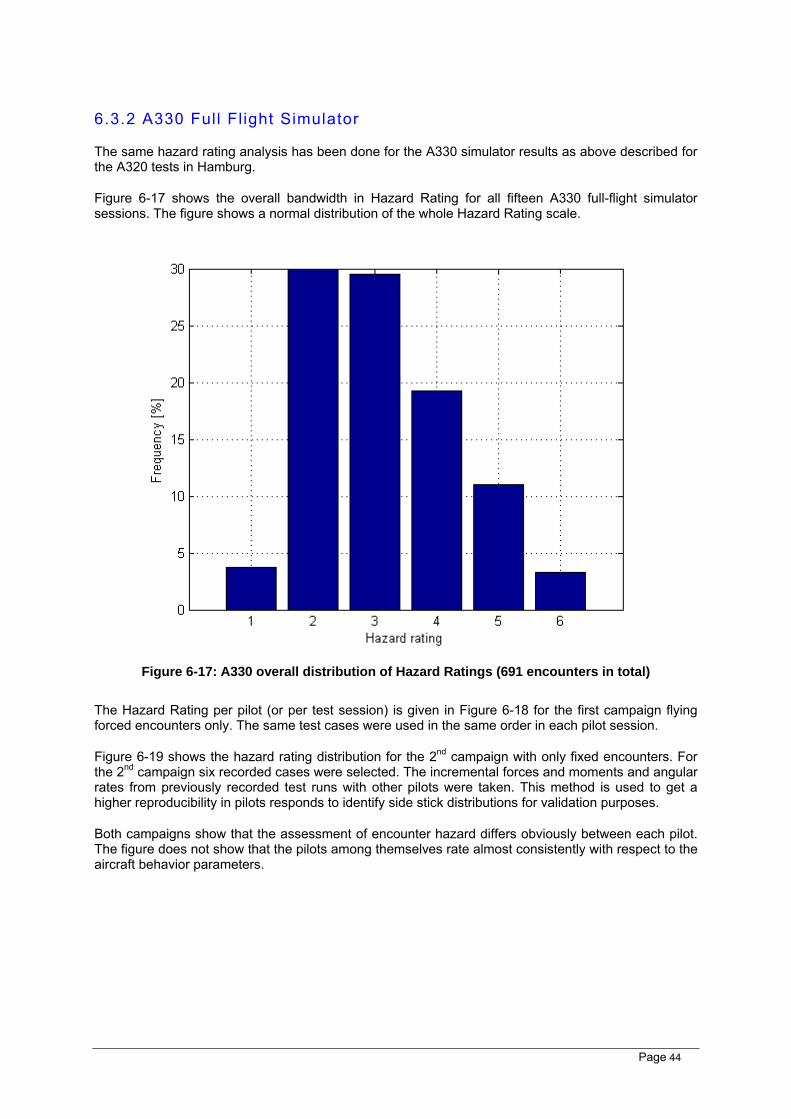
The same hazard rating analysis has been done for the A330 simulator results as above described for the A320 tests in Hamburg.
Figure 6-17 shows the overall bandwidth in Hazard Rating for all fifteen A330 full-flight simulator sessions. The figure shows a normal distribution of the whole Hazard Rating scale.
Figure 6-17: A330 overall distribution of Hazard Ratings (691 encounters in total)
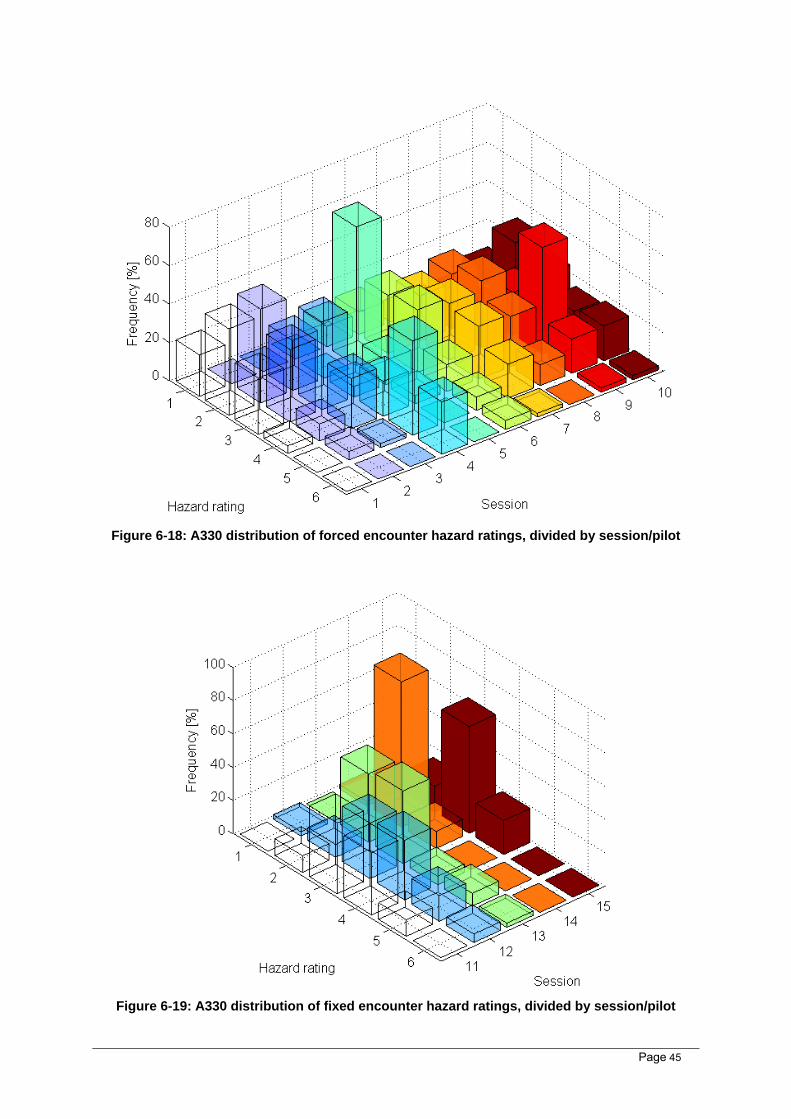
The Hazard Rating per pilot (or per test session) is given in Figure 6-18 for the first campaign flying forced encounters only. The same test cases were used in the same order in each pilot session.
Figure 6-19 shows the hazard rating distribution for the 2nd campaign with only fixed encounters. For the 2nd campaign six recorded cases were selected. The incremental forces and moments and angular rates from previously recorded test runs with other pilots were taken. This method is used to get a higher reproducibility in pilots responds to identify side stick distributions for validation purposes.
Both campaigns show that the assessment of encounter hazard differs obviously between each pilot. The figure does not show that the pilots among themselves rate almost consistently with respect to the aircraft behavior parameters.
Page 45
Figure 6-18: A330 distribution of forced encounter hazard ratings, divided by session/pilot
Figure 6-19: A330 distribution of fixed encounter hazard ratings, divided by session/pilot

Page 46
Figure 6-20 shows the correlation between the Alert Level expected by the pilots and the Hazard Rating for each encounter. It shows the expected trend to higher Alerting Levels with higher Hazard Ratings. The relation between Hazard Rating and Alert Level is not as clear as for the A320 tests. The Hazard Ratings for each desired Alert Level are distributed wider, covering 3 different ratings per Alert Level instead of only 2. A detailed analysis of the correlation is left to CREDOS task 3.1.6. An approximate correlation between Hazard Rating and chosen Alert level could be:
Alert Level 1 (No Alert) ⇒ Hazard Rating 1-2
Alert Level 2 (Caution) ⇒ Hazard Rating 2-4
Alert Level 3 (Avoid) ⇒ Hazard Rating 4-6
Figure 6-20: A330 correlation of desired Alert Level with Hazard Rating
Table 6-3 lists the number of special actions, apart from the stick inputs, that were taken during automated departures. It shows that the Autopilot was equally often disconnected manually and automatically 2. This could be due to the more precise determination of manual or automatic AP disconnect in the A330 FFS. The total ratio of AP disconnects however is fairly similar to that in the A320 simulator. In nine manual departures the pilot felt the need to disengage Autothrust and apply TOGA thrust.
Table 6-3:A330 ratio of special actions taken during the encounters (112 AP departures/691 overall)
Name Description Number of occurence Ratio
APdisM AP Manual Disengage 24 / 112 21.4 % APdisA AP Automatic Disengage 32 / 112 28.6 %
ATdis ATHR Disengage 9 / 691 1.3 %
2 The AP Disengage conditions for the A330 being one or more of the following: Bank angle |Φ|>45°, Pitch angle Θ<-13° or Θ>25°, Angle-of-attack or High speed protection active.

Page 47
6.4 DISCUSSION OF RESULTS
Forced encounter simulations are used to show the diversity of wake vortex encounters, aircraft behaviour and upset that could happen during departures. Cases of the initial vortex setup, based on the aircraft position, encounter geometry and the strength of the wake vortex were defined in preparation works of the simulator tests. Therefore the initial set up of all encounter cases are the same for each pilot in each session, see test program Table 8-1 to Table 8-4. The way through the vortex strongly depends on the pilot reaction. This test gives an idea of how manifold the way through the vortex could be for the same cases with different pilots.
The second campaign with fixed encounter focused on reproducibility between the same encounter cases. Fixed encounter means a fixed upset affects the aircraft as basically a rolling-, yawing-, and pitching moment. The fixed induced disturbance is independent of pilot response which leads to lower spreads in pilot reaction. Therefore fixed encounter tests were used for further pilot model verifications and validation purposes. Based on the bandwidth in real pilot reaction a mathematical model can be developed that fits in mean and standard deviation into the given boundaries, see figures in chapter 6.2.
The evaluation of the questionnaires shows that the personal assessment of encounter severity differs a lot between the pilots. The aircraft upset depends strongly on the pilot delay time, which can explain the differences in hazard ratings. Nevertheless it will be tough to find generalized correlations between aircraft upset parameters and hazard ratings. Evaluation for each pilot will be found in CREDOS deliverable D3-5, “Wake vortex encounter severity criteria for takeoff and departure”.
Page 48
7 SUMMARY
Twenty-nine piloted simulator sessions were carried out in total fourteen at the A320 simulator in Hamburg and fifteen at the A330 full-flight simulator in Berlin. Each session took about four hours of flight time extended by half an hour briefing ahead and half an hour debriefing after the session. Commercial pilots from several airlines with different flight experience were invited to share their experience with us.
The simulation software has been modified to simulate dynamic aircraft response to wake vortex encounters during departure. The basic simulator capabilities have been extended by a dedicated physical model of aircraft wake vortices to allow highly realistic simulations of wake vortex encounters. Safety hazard imposed by wake vortices has been quantified.
In each session the pilot flew manual departures hitting wake vortices that vary in magnitude and character. The pilot responses were recorded to deduce a generalized mathematical pilot model for departure and behaviour during wake vortex encounters that is required in CREDOS deliverable D3-6. Furthermore the subjective pilot rating on each encounter situation was collected to develop safety guidelines for wake vortex encounters and to classify encounter severity for risk assessment of new flight procedures, which will be part of CREDOS deliverable D3-5.
Page 49
8 REFERENCES [ 1] S. Amelsberg, H. Lenz, Trajectory model for takeoff and departure, CREDOS, TN D3-1,
2007 [ 2] M. Fuhrmann, R. Luckner, A. Reinke, M. Verbeek, Description of flight simulators for
wake vortex encounter simulations and flight simulator validations, S-Wake, Technical Note 312-1 © v1.2, 2002
[ 3] F. Holzäpfel, J.Kladetzke, C. Schwarz, I. De Visscher, G. Winckelmans, Airspace
Simulation for Take-Off and Departure, CREDOS, TN D3-2, 2008

Page 50
APPENDIX A Table 8-1: Test program #1, A320 THOR simulator, only Forced Encounters

Page 51
Table 8-2: Test program #2, A320 THOR simulator, Forced & Fixed Encounters

Page 52
Table 8-3: Test program #1, A330 TUB simulator, only Forced Encounters

Page 53
Table 8-4: Test program #2, A330 TUB simulator, only Fixed Encounters

Page 54
Figure 8-1: Pilot questionnaire used in the simulator tests

Page 55
CREDOS pilot survey
The CREDOS project aims at developing a concept for reducing wake vortex separation minima during take-off when the crosswind is strong enough to blow vortices out of the departure corridor. For development of this concept knowledge about current working practice of pilots being subjected to this reduced separation is very useful. 1.
a. As a pilot would it be sufficient to know in general that you may be subject to a CREDOS clearance e.g. if such information is given by the ground controller when giving clearance to taxi out? ( )
b. or do you as a pilot need to be told specifically each time that the take-off
clearance being given is a CREDOS clearance e.g. by the runway controller when he gives take-off clearance? ( )
2.
a. Would the introduction of CREDOS require you to have any additional information in the cockpit? Y ( ) N ( )
b. If so, what sort of information would you need?
__________________________________________________________
3.
a. Could it be useful for pilots to be able to use windsocks at airports to cross check the CREDOS clearance instructions given by the controllers? Y ( ) N ( )
b. Do you use wind socks? Y ( ) N ( )
c. If so, in what circumstances do you use them?
_________________________________________________________
d. Do they have wind socks at your home base airport? (and please specify which
airport and if they exist on all runways)
Y ( ) N ( ) ____________________________________________
Pilot name: ____________________________ Airline: ____________________
Figure 8-2: Questionnaire on operational working practice
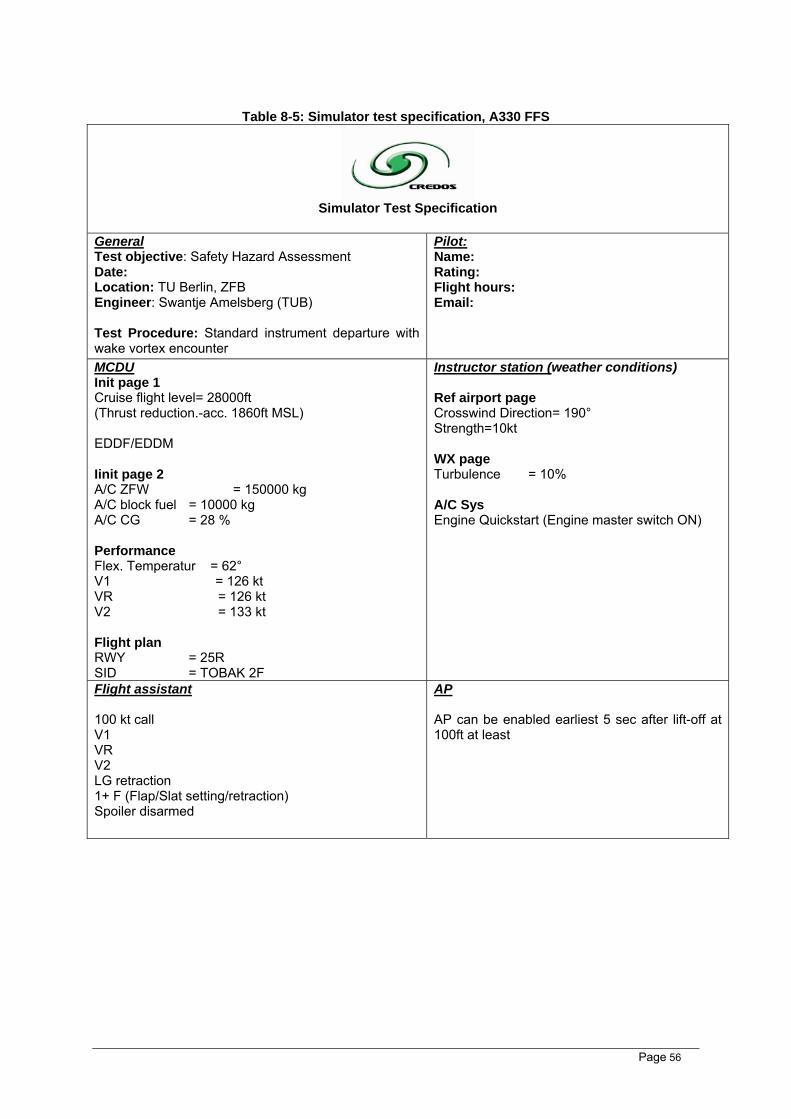
Page 56
Table 8-5: Simulator test specification, A330 FFS
Simulator Test Specification
General Test objective: Safety Hazard Assessment Date: Location: TU Berlin, ZFB Engineer: Swantje Amelsberg (TUB) Test Procedure: Standard instrument departure with wake vortex encounter
Pilot: Name: Rating: Flight hours: Email:
MCDU Init page 1 Cruise flight level= 28000ft (Thrust reduction.-acc. 1860ft MSL) EDDF/EDDM Iinit page 2 A/C ZFW = 150000 kg A/C block fuel = 10000 kg A/C CG = 28 % Performance Flex. Temperatur = 62° V1 = 126 kt VR = 126 kt V2 = 133 kt Flight plan RWY = 25R SID = TOBAK 2F
Instructor station (weather conditions) Ref airport page Crosswind Direction= 190° Strength=10kt WX page Turbulence = 10% A/C Sys Engine Quickstart (Engine master switch ON)
Flight assistant 100 kt call V1 VR V2 LG retraction 1+ F (Flap/Slat setting/retraction) Spoiler disarmed
AP AP can be enabled earliest 5 sec after lift-off at 100ft at least

Page 57
Figure 8-3: Pilot data sheet

Page 58
APPENDIX B
UDP interface description Reproducible wake vortices encounters during departures need a wake vortex setup under defined conditions.
An earth fixed aircraft trajectory in the runway coordinate system (gr) is influenced by many parameters. For example a/c weight, meteorological conditions, and pilot control inputs.
In the view of reproducibility, and to guarantee a vortex hit during departure, an earth fixed wake vortex system makes no sense. Therefore the wake vortex system is set depending on defined flight path parameters, like minimum reached altitude, minimum speed, and minimum pitch altitude angle.
Such an approach requires a communication between the basis simulation and the WVE package. The wake vortex setting is controlled by an external notebook, which is linked via a user datagram protocol (UDP) to the basis simulation. The User Datagram Protocol (UDP) is a connectionless protocol for sending data packets over the Inter- or Ethernet. UDP runs on the top of the Internet Protocol (IP); it provides a simple datagram service to guarantee the integrity of delivered packets. Data packets may be addressed to different processes that are running on the same host.
The wake vortex setting conditions are stored in .txt./dat files. The UDP interface receives the flight path parameters. As soon as the conditions are reached to set the vortex, a flag is activated by the UDP interface to set the vortex into the flight path.
Physical wake vortex parameters like circulation and core radius are stored in VTX.dat files. Attitude angles like ΔPSI, ΔTHETA, etc. can be found in ENC.dat files; these files are disposed in the CREDOS configuration. Fig. 8-1 gives an overview of the UDP interface implementation.
Fig. 8-1: UDP interface overview
Simulator software module The UDP interface inside the CREDOS configuration can be described with four files:
udp_credos.for

Page 59
inp_out_udp.c sim_data.inc vtx_data.inc Whereas the C routine is the actual UDP interface and the FORTRAN routine is the connection to the common database of the CAE simulation. The FORTRAN routine (prog udp_credos.f) is called by an autonomous input in the first band of the synchron process (sp0c0.def)
The C routine is activated by the FORTRAN module. The most important dates of the UPD interface can be found in the following:
Send ( „inp_out_udp.c“) IP-Adresse : 10.103.73.25 (Notebook) Port : 30083 Datenpaket: 20 Bytes Variables sent: H Height above ground [ft]
THETADG Pitch altitude angle [°] V Flight path velocity [kts] GAMMADG Air-path climb angle [°] START_RE Only for the software control
receive („inp_out_udp.c“) IP-Adresse : optional (receives any IP) Port : 3007 Datenpaket: 64 Bytes Received variables: VTX Vortex definition nr. ( VTX_DATA_Txxx)
ENC Encounter definition nr. ( ENC_DATA_Txxx) TSYNC Synchron time
LS_MA LSM Mach number (data base) INIT … WVE Package initial variable INIT0 … - “ - UNI … UNI-Option (0,1,2)
TCFFL … Flight freeze variable REC … Data recording REC=1(start), REC=0 (stop) RUN … Set wake vortex RUN=1 SAVE … Data storage SAVE=1
STOP ... Stop wake vortex effect Stop=1 VTASREF ... Input variable for wake vortex package
WVEINIT ... Control variable usd in udp_credos.for START ... Control variable usd in udp_credos.for
DATASAVE ... Control variable usd in udp_credos.for
The receive socket has a non-blocking-option, that means the real time process is not influenced if there is no data transfer.
3 Port choice: 3001 allocated by SimVis3D

Page 60
The data packages are stored in external structures, called simdata and vtxdata. In C the CDB is called external structure.
The external structure allocates the same storage area as the Fortran Common Block SIMDATA4, defined in sim_data.inc, including the above described flight –path parameter. See Fig. 8-2 for the storage principal.
The external structure vtxdata corresponds in the same way with the FORTRAN common block, defined in vtx_data.inc.
phys. stack
.
.
.
.
.
.
.
.
.
.
HTHETADG
GAMMADGV
START_RE
SIMDATA
1001
1005
1013
1009
1017
Adress
Fig. 8-2: Storage structure
For data transfer between the IBM AIX System (SRF) and the windows operating systems the Endian conversion has to keep in mind. The AIX system works with Big Endian format and whereas Windows XP calculates in the Little Endian format.
Therefore a “byte swap” algorithm is implemented in the inp_out_udp.c module. This algorithm converts on the one hand the input data into a Big Endian format and on the other hand the output into a Little Endian format.
External software module The UDP interface is described by the file wve_settings.c on the external side. This program is based on C and includes the following functions
• Allocate the UDP connection (send and receive)
• Read the input file vtx_inputXX.dat (includes wake vortex set conditions)
• Compare between the flight path parameter and the conditions to set the wake vortex.
• Trigger the WVE packet
Fig. 8-3 illustrates the external interface.
4 The use of capital and small initial letters is based on the custom of the IBM AIX compilers.

Page 61
Fig. 8-3: External UDP module
The external UDP interface data is the same as in the inp_out_udp.c module expects that data transfer (send and receive) works the other way around than in section 0. The “non-blocking-option” is not activated.
Beside the interface allocation, the program compares the flight path parameters to the wake vortex set terms.
Scenario definitions are soft coded in the file vtx_inputXX.dat, to keep the opportunity for easy changes. With the wve_settings.exe call the wake vortex scenarios were loaded.
In addition to the described data, the vtx_inputXX.dat files include parameters for the WVE package control.
Fig. 8-4 shows exemplarily a vtx_inputXX.dat file:
WV_LS_MA is needed to have the correct LSM data set when the WVE packages are initialised. The data sets have to be priori prepared and stored in the WVE configuration directory.
WV_INIT0 and VTASREFK are needed to initialise the WVE package
UNI OPTION is one of the results out of the S-Wake project. For further information see RD [ 2] , keyword “kinematical problem” .
The last four variables describe the wake vortex setting condition; minimum -height above ground, -pitch altitude angle, -true air speed, -and climb angle.
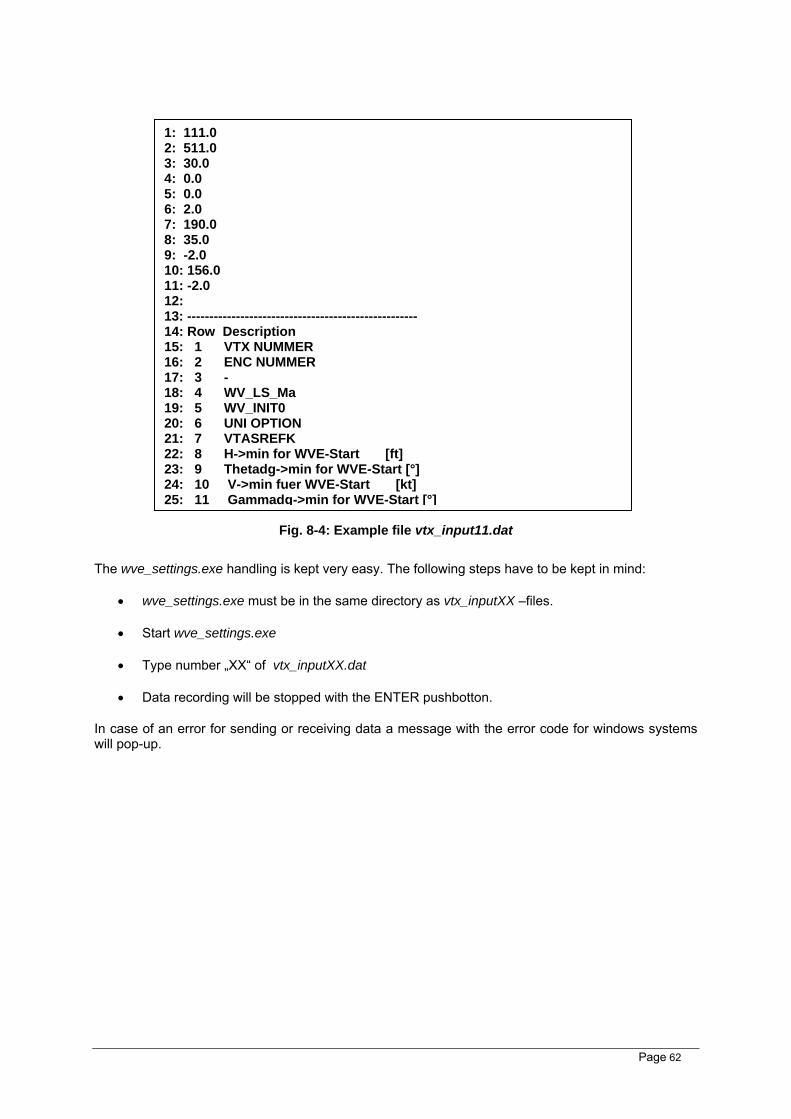
Page 62
Fig. 8-4: Example file vtx_input11.dat
The wve_settings.exe handling is kept very easy. The following steps have to be kept in mind:
• wve_settings.exe must be in the same directory as vtx_inputXX –files.
• Start wve_settings.exe
• Type number „XX“ of vtx_inputXX.dat
• Data recording will be stopped with the ENTER pushbotton.
In case of an error for sending or receiving data a message with the error code for windows systems will pop-up.
1: 111.0 2: 511.0 3: 30.0 4: 0.0 5: 0.0 6: 2.0 7: 190.0 8: 35.0 9: -2.0 10: 156.0 11: -2.0 12: 13: ---------------------------------------------------- 14: Row Description 15: 1 VTX NUMMER 16: 2 ENC NUMMER 17: 3 - 18: 4 WV_LS_Ma 19: 5 WV_INIT0 20: 6 UNI OPTION 21: 7 VTASREFK 22: 8 H->min for WVE-Start [ft] 23: 9 Thetadg->min for WVE-Start [°] 24: 10 V->min fuer WVE-Start [kt] 25: 11 Gammadg->min for WVE-Start [°]