The Correlation in the Global Context of Financial Markets ... · PDF filePractical...
6
International Journal of Trade, Economics and Finance, Vol. 2, No. 3, June 2011 179 Abstract—The purpose of this article is verifying the existing relation between BET index (Bucharest Exchange Trading) and the main international stock index during 2005-2010, through correlation coefficients. Design/methodology to achieve the purpose we used econometric methods for calculating the evolution and variations of indexes. Finding –There is a strong link between the stock market in Romania and international markets, which can be quantified through stock market indexes. There is a high level of inter- correlation. Correlation matrix underpins our findings. Practical implications – Knowing the influences between the stock indexes can represent a starting point for investors, for following the international context and evolution which can lead to forecasting certain patterns for the evolution of BET index. Index Terms— correlation, financial markets, stock index. I. INTRODUCTION Economic and financial environment in recent years has been characterized by high instability, leading to increased uncertainty among both investors at the stock market, and the economic and financial analysts. Uncertainty was manifested in particular by the differences between the analysts’ forecasts and the reality in the financial sector. One of the most important roles of the financial system and stock market in particular is that it brings face to face people with a surplus of funds, and those with financial needs. National and international trends and the stability of financial and economic environment influences the performance of companies listed on the stock market. Stock markets are indicatives of real economies, showing progress in a given period. A comparison of stock indexes is necessary to assess the impact of economic growth and regression periods on the listed companies. This paper aims to analyze the development of Romanian Manuscript received March 30, 2011 . This article is a result of the project POSDRU/6/1.5/S/11 „Doctoral Program and PhD Students in the education research and innovation triangle”. This project is co funded by European Social Fund through The Sectorial Operational Programme for Human Resources Development 2007-2013, coordinated by The Bucharest Academy of Economic Studies. C. Ciora is teaching assistant at the Bucharest Academy of Economic Studies, Department of Economic and Financial Analysis, member of the Romanian Society of Economic and Financial Analysis and member of the International Economics Development and Research Center. (E-mail: [email protected]). S. M. Munteanu is teaching assistant at the Bucharest Academy of Economic Studies in the field of efficiency and management (e-mail: [email protected]). V. Iordache is a PhD candidate at the Bucharest Academy of Economic Studies in the field of Financial and Economic Analysis. (e-mail: [email protected]). capital market through BET. BET is the reference index of the Romanian capital market, and was launched on September 19, 1997 with a starting value of 1,000 points, the first index developed by BSE. BET covers the 10 companies which have the most liquid shares listed on BSE, regulated in categories I and II, except for investment companies traded on a regulated market of BSE, investment funds and other entities treated as such. II. LITERATURE REVIEW Over time, a number of studies have followed the comparative evolution of indexes for determining quantifiable influences. Correlations related to indexes were followed by authors such as [2] in terms of liquidity and correlations between stock prices changes. Other authors such as in [11] have pursued the relationship and the correlation between options and capital market. Reference [15] shows the relationship between BET evolution and key macroeconomic variables in Romania: interest rate, inflation and unemployment. Links between stock indexes and exchange rates are brought to the fore as in [3], in a study realized between 1999 and 2007. Correlations between the BET index and international stock market indexes are an important research topic, but also for practice, through studies and newspaper articles. III. THE EMPIRICAL ANALYSIS OF ROMANIAN CAPITAL MARKET DEVELOPMENT A. Developments in international financial markets during 2005-2010 The financial crisis of 2008-2009 profoundly affected the evolution of international capital markets. This resulted in decreases in the stock exchange rates in most listed companies. An investor seeks any information necessary for the development or minimization of its portfolio, market development being a crucial factor. Furthermore, investors follow the developments in international markets, and thus we can find correlations between various indexes. For an overview, we followed up the following indices: BET - main index of the Bucharest Stock Exchange DJIA (Dow Jones Industrial Average) - also known as Dow Jones, Dow 30 or Dow is one of the most used indexes, known worldwide. The index was created by Charles Dow, Wall Street Journal editor and founder of Dow Jones & Company. This index follows the evolution of the 30 largest companies traded in the United States of America, and is calculated since The Correlation in the Global Context of Financial Markets and the Evolution of Emerging Market of Romania Through the Bucharest Stock Exchange C. Ciora, S. M. Munteanu, and V. Iordache
Transcript of The Correlation in the Global Context of Financial Markets ... · PDF filePractical...
International Journal of Trade, Economics and Finance, Vol. 2, No. 3, June 2011
179
Abstract—The purpose of this article is verifying the existing
relation between BET index (Bucharest Exchange Trading) and
the main international stock index during 2005-2010, through
correlation coefficients. Design/methodology to achieve the
purpose we used econometric methods for calculating the
evolution and variations of indexes. Finding –There is a strong
link between the stock market in Romania and international
markets, which can be quantified through stock market indexes.
There is a high level of inter- correlation. Correlation matrix
underpins our findings. Practical implications – Knowing the
influences between the stock indexes can represent a starting
point for investors, for following the international context and
evolution which can lead to forecasting certain patterns for the
evolution of BET index.
Index Terms— correlation, financial markets, stock index.
I. INTRODUCTION
Economic and financial environment in recent years has
been characterized by high instability, leading to increased
uncertainty among both investors at the stock market, and the
economic and financial analysts. Uncertainty was manifested
in particular by the differences between the analysts’ forecasts
and the reality in the financial sector.
One of the most important roles of the financial system and
stock market in particular is that it brings face to face people
with a surplus of funds, and those with financial needs.
National and international trends and the stability of financial
and economic environment influences the performance of
companies listed on the stock market.
Stock markets are indicatives of real economies, showing
progress in a given period. A comparison of stock indexes is
necessary to assess the impact of economic growth and
regression periods on the listed companies.
This paper aims to analyze the development of Romanian
Manuscript received March 30, 2011 .
This article is a result of the project POSDRU/6/1.5/S/11 „Doctoral
Program and PhD Students in the education research and innovation
triangle”. This project is co funded by European Social Fund through The
Sectorial Operational Programme for Human Resources Development
2007-2013, coordinated by The Bucharest Academy of Economic Studies.
C. Ciora is teaching assistant at the Bucharest Academy of Economic
Studies, Department of Economic and Financial Analysis, member of the
Romanian Society of Economic and Financial Analysis and member of the
International Economics Development and Research Center. (E-mail:
S. M. Munteanu is teaching assistant at the Bucharest Academy of
Economic Studies in the field of efficiency and management (e-mail:
V. Iordache is a PhD candidate at the Bucharest Academy of Economic
Studies in the field of Financial and Economic Analysis. (e-mail:
capital market through BET. BET is the reference index of the
Romanian capital market, and was launched on September 19,
1997 with a starting value of 1,000 points, the first index
developed by BSE. BET covers the 10 companies which have
the most liquid shares listed on BSE, regulated in categories I
and II, except for investment companies traded on a regulated
market of BSE, investment funds and other entities treated as
such.
II. LITERATURE REVIEW
Over time, a number of studies have followed the
comparative evolution of indexes for determining
quantifiable influences. Correlations related to indexes were
followed by authors such as [2] in terms of liquidity and
correlations between stock prices changes.
Other authors such as in [11] have pursued the relationship
and the correlation between options and capital market.
Reference [15] shows the relationship between BET
evolution and key macroeconomic variables in Romania:
interest rate, inflation and unemployment. Links between
stock indexes and exchange rates are brought to the fore as in
[3], in a study realized between 1999 and 2007.
Correlations between the BET index and international
stock market indexes are an important research topic, but also
for practice, through studies and newspaper articles.
III. THE EMPIRICAL ANALYSIS OF ROMANIAN CAPITAL
MARKET DEVELOPMENT
A. Developments in international financial markets during
2005-2010
The financial crisis of 2008-2009 profoundly affected the
evolution of international capital markets. This resulted in
decreases in the stock exchange rates in most listed companies.
An investor seeks any information necessary for the
development or minimization of its portfolio, market
development being a crucial factor. Furthermore, investors
follow the developments in international markets, and thus we
can find correlations between various indexes.
For an overview, we followed up the following indices:
BET - main index of the Bucharest Stock Exchange
DJIA (Dow Jones Industrial Average) - also known as Dow
Jones, Dow 30 or Dow is one of the most used indexes, known
worldwide. The index was created by Charles Dow, Wall
Street Journal editor and founder of Dow Jones & Company.
This index follows the evolution of the 30 largest companies
traded in the United States of America, and is calculated since
The Correlation in the Global Context of Financial Markets
and the Evolution of Emerging Market of Romania Through
the Bucharest Stock Exchange
C. Ciora, S. M. Munteanu, and V. Iordache

International Journal of Trade, Economics and Finance, Vol. 2, No. 3, June 2011
180
1896.
S & P 500 - was created by Standard & Poor's, one of the most
used global indexes together with DJIA, and includes the
prices of 500 large companies traded in the United States of
America.
FTSE 100 - is the index of 100 most liquid companies, with
the largest market capitalization on the London Stock
Exchange, of 81% of the UK capital.
DAX (Deutscher Aktien Index) - is the main German index of
Frankfurt Stock Exchange including 30 large companies
traded on that market.
Nikkei 225 - is the index of the Tokyo Stock Exchange,
including 225 Japanese companies, calculated since 1950.
The performance of these indexes was monitored during 1
January 2005 - 31 December 2010. Fig.1 shows the indexes
development.
Fig. 1. Performance of stock index between 2005 and 2010
TABLE I: AVERAGE MONTHLY RETURNS FOR 2005-2010
%
BET
%
S&P
%
FTSE
100
%
DIJA
%
DAX
%
N225
AVG
T 0.50% 0.21% 0.37% 0.24% 0.81% 0.00%
AVG
(1) 2.23% 0.74% 0.87% 0.81% 1.98% 1.24%
AVG
(2) -6.43%
-2.98
%
-2.31
% -2.76%
-2.28
% -2.97%
AVG
(3) 4.23% 2.30% 2.07% 2.11% 1.87% 0.86%
where:
AVG T = average monthly return over the period analyzed
AVG (1) = average monthly return over the period January
2005-August 2007
AVG (2) = average monthly return over the period
September 2007 - March 2009
AVG (3) = average monthly return over the period April
2009 - December 2010
Average monthly return for the period under review was at
similar values (between 0% and 0.81%), reflecting a similar
trend in the same direction. BET had a average monthly return
of 0.5%.
The period considered is especially important because is
reflecting three significant stages:
increasing evolution of indexes: January 2005 - August 2007
period (1);
decreasing evolution of indexes: September 2007 - March
2009 period (2);
increasing evolution of indexes between April 2009 and
December 2010(3).
Fig. 2. Monthly average returns of analyzed indexes
On this regard, starting from monthly return, we calculated
the total average of the period for each index, and also
average return for each period presented above.
The analysis of indexes on periods is needed to see how
financial markets have evolved in a time of rising and falling.
Fig. 3. Average monthly return for the three stages of analysis
Figure 3 presents comparative evolution of the average
monthly return for the three periods of analysis. It is noted that
BET had a higher development, compared with other
presented indexes. Both increases and decreases were
amplified in the evolution of BET.
The correlation degree of the Bucharest Stock Exchange
with external capital markets is analyzed further by
determining the correlation coefficients. This indicator
measures the strength of linear relationship between the two
analyzed indexes. The correlation coefficient is a
dimensionless measurement, which makes possible for the
variables values to be expressed in any unit.
The correlation coefficient (ryx) can range between -1 and
+1, the sign indicating the type of link: inverse or direct. The
correlation coefficient is calculated using the formula:
ryx = yxn
yyixxi
))(( (1)
where:
ryx = correlation coefficient
x = average variable x
y = average variable y
n = number of pairs observations
σ =Standard deviation of variable x or y

International Journal of Trade, Economics and Finance, Vol. 2, No. 3, June 2011
181
Determining the extent to which the BET index responds to
changes of analyzed indexes, and hence the change sensitivity
of BSE main index at indexes variations is made using the
elasticity coefficient. Basically, the coefficient of elasticity is
a ratio between the relative change of a variable and the
relative change of another variable. The coefficient of
elasticity was introduced by A. Marshall in 1890 and is used
in the theoretical study of consumer demand.
In our case we will calculate the elasticity coefficients of
the evolutions, the ratio of BET's annual return and annual
return on stock market index for comparison, according to the
formula:
Ce =Ind
BET
Ind
BET
Ind
BET
%
%:
0
0
(2)
where:
Ce = elasticity coefficient between BET and benchmark
index
ΔBET= BET absolute change in a year of analysis
ΔInd= absolute change of benchmark index in a year of
analysis
BET0= closing value of BET index in the first trading day
of an year
Ind0= closing value of benchmark index in the first trading
day of an year
Δ%BET= percentage change of BET index in one year of
analysis
Δ%Ind= percentage change of benchmark index in a year of
analysis
B. Comparative evolution of BET and S & P500 index
First we followed up the comparative evolution on BET
and S & P500 indexes through monthly returns. From Figure
4.we can observe the increased monthly developments of
BET indexes.
Fig. 4. Comparison between monthly returns of BET and S&P500
From Figure 4, BET high volatility is apparent for the
period 2005-2010. In figure 5 we presented the annual returns
of two indexes, from which we calculated the elasticity
coefficients in Figure 6. If in 2005, BET's annual return was
16.7% in the same year the S &P500 annual return was 5.7%,
resulting in a coefficient of elasticity of 2.94. Thus a 1%
change in the S &P500 index over a period of one year,
reflected in an increased BET with an average of 2.94%. This
year the correlation coefficient was 0.7611, indicating an
average predictability of the evolution of the Bucharest Stock
Exchange. In 2006, the elasticity coefficient value was 1.63
(on a 1% change in S & P500 index, BET has changed 1.63%),
while the correlation coefficient value was 0.6482. In 2007, as
shown in Figure 5, BET has been much progress over the
development of S & P500. Such a change of 3.5% S & P500
index, BET has grown by 22.1%, resulting in a coefficient of
elasticity of 6.25. The correlation coefficient for this year was
0.4601 indicating a low correlation between the two indices.
Fig. 5. Comparison between annual returns of BET and S&P500
The correlation coefficient in 2008 was 0.9518 indicating a
high correlation, evidence of a level of the coefficient of
elasticity, calculated on the basis of annual returns, of 1.83. At
a 1% increase of the S & P500 index BET index rose by
1.83%. The year 2008 brought significant decreases in both
considered markets; the Bucharest stock market volatility is
high. 2010 has brought a different pattern of BET, having
approximately the same evolution with the S & P500 index.
Fig. 6. Elasticity coefficients of BET's annual returns and S & P500 index
C. Comparative evolution of the BET and FTSE index
Next, we compared the BET and FTSE index through
absolute values, monthly returns and annual returns as well.
London Stock Exchange is one of the most important trading
markets and FTSE index expresses the evolution of the most
liquid 100 listed companies. The importance of this stock
exchange is a starting point for investors to analyze the
Bucharest stock market, who use, in my view information
concerning the trend on FTSE index.
Fig. 7. Comparison between monthly returns of the FTSE index and BET
In 2005, annual returns of the two indexes have similar
values (16.7% BET index, the FTSE index 15.8%), with a
coefficient of elasticity of 1.06 (on a 1% change in the FTSE
index, BET index has changed to 1.06%). In this year the

International Journal of Trade, Economics and Finance, Vol. 2, No. 3, June 2011
182
correlation coefficient was 0.71 indicating an average
correlation between the two financial markets. In 2006, BET
change was higher than the FTSE index, with an elasticity
coefficient of 2.07. This year the correlation coefficient
between the two indices was 0.63.
A different situation is found for the first two years in 2007,
when the two indexes had a correlation coefficient of 0.38
indicating a decoupling between the evolution of the two
indexes. This year, the coefficient of elasticity was 5.81. Thus
a 1% change in the FTSE index, changed BET index with
5.81%.
Fig. 8. Comparison between annual returns of the FTSE index and BET
Evolution of the two indexes in 2008 and 2009 aimed
restoring the degree of correlation (with correlation
coefficients of 0.97 in 2008 and 0.95 in 2009). At the annual
returns we find a similar pattern. Thus, a 1% change of the
FTSE index, BET index has changed in 2008 to 2.25% and
2.79% in 2009. In 2010, the coefficient of elasticity was 1.42,
close to the evolution of the two indexes.
Fig. 9. Comparison between annual returns of the FTSE index and BET
D. Comparative evolution of the BET and DJIA
Comparing the BET monthly returns and monthly returns
of the Dow Jones Industrial Average index, we continue to
analyze the correlation with the Bucharest Stock Exchange
with the most important external capital markets. Figure 10.
High volatility of BET is apparent, compared with DJIA
index.
Fig. 10. Comparison between monthly returns of the FTSE index and BET
Annual developments of the two indices continue the
elements mentioned above. Thus, in 2005 at a 1% change in
DJIA index, BET has changed to 7.68% at a correlation
coefficient of 0.79. In Figure 11. you can find the plot of the
two indexes. The year 2006 brings an approach of the
evolution of the two indexes (coefficient of elasticity 1.36)
but a low correlation level of 0.57.
Fig. 11. Comparison between annual returns of the DJIA index and BET
In 2007, BET has grown by 22.1% compared with the 6.4%
annual evolution of the DJIA index. The last two years of
analysis show a high correlation (correlation coefficient of
0.95 in 2008 and 0.97 in 2009), the coefficients of elasticity of
2.08 in 2008 and 3.28 in 2009. Figure 12 the elasticity
coefficient trend of annual returns of BET index and DJIA.
Last year analysis shows an elasticity coefficient of 1.16.
Fig. 12. Elasticity coefficients annual returns of DJIA index and BET
E. Comparative evolution of BET and DAX
Fig. 13. Comparison between the monthly returns of the BET and DAX
index
Besides the analysis of the indices from the US capital
market, we have analyzed and compared the evolution of the
BET index against the one of the German DAX index.
The annual return of DAX index outclassed the annual
return of the BET index in 2005; the elasticity factor (annual
BET return/ annual DAX flow) had a value of 0.55% (at a
change of 1% of the DAX index, the BET index changed with
0.55% 0.55%). For this year, the correlation factor was of
0.61. A close value was calculated also for 2006 (of 0.65), but
with a different evolution of the annual returns against 2005.
In the analyzed year, the modulus of elasticity had the value of
1.13, indicating similar annual returns.

International Journal of Trade, Economics and Finance, Vol. 2, No. 3, June 2011
183
Fig. 14. Comparison between the annual returns of the BET and DAX index
In 2007, the DAX index changed with 0.9%, in comparison
with the evolution of 22.1% of the BET index. The level of
correlation of the two indices was very low in value of 0.35.
For this year, is observed a decoupling of the evolution of the
two indices both at flow level and correlation factors level.
In figure 14 we can observe the stressed decrease in 2008
of the annual return for the two indices, similar with the
evolutions previously presented of the S&P500, FTSE and
DJIA indices. In this year, the coefficient of elasticity,
presented as an evolution in the period 2005-2009 in figure 15,
had a value of 1.92. In return, in 2009, we have calculated a
coefficient of elasticity of 1.65. The correlation factors were
of 0.91 in 2008 and 0.93 in 2009. In 2010, the coefficient of
elasticity had a value of 0.79, the subunit value representing
the low evolution of the BET index against DAX.
Fig. 15. Elasticity coefficients of the BET and DAX index
F. Comparative evolution of the BET index
The development of the Asian markets was obvious in the
last years, as a consequence of the economic development and
exchanges with these states. The performances of the
companies listed on the Asian stock markets have determined
the recognition of the Nikkei225 index as international index
of reference for investors. This reflects best the stock
evolution of the Asian companies.
Fig. 16. Comparison between the monthly returns of the BET and Nikkei225
index between 2005 and 2009
In the last part of our analysis we have compared the BET
index and Nikkei 225 index. In 2005, the annual flow of the
Nikkei 225 index was 41.8%, with a level of the correlation
factor of 0.8. The year of 2006 presents a low level of the
correlation factor of 0.41, on the background of a significant
difference between the annual returns (at an increase of 1% of
the Nikkei 225 index, the BET index increased with 5,05%).
Fig. 17. Comparison between the annual returns of the BET and Nikkei225
The year of 2007 presents a total decoupling of the two
indices, these not being modified in opposite way (the Nikkei
225 index dropped with 21.8% while the BET index increased
with 22,1%). The last two years of analysis presents
correlation factors of 0.89 in 2008 and 0.79 in 2008. The
elasticity factors were at similar values (1.71 in 2008 and 1.93
in 2009). In 2010, the BET index increased with 12.7%
whiles the NIKKEI 225 index dropped by 3%.
Figure 18 presents the trend of the elasticity factors of the
annual returns for the BET and Nikkei 225 index.
Fig. 18. Elasticity coefficients for BET and Nikkei225
IV. CONCLUSIONS
The Bucharest Stock Market presents a high level of
volatility, situation observable from the comparative analysis
with international stock indices presented previously. The
complexity of the financial market does not leave room for
generalizations or categorical statements. The financial world
is in continuous change leading to unpredictable evolutions
that exceed the mathematical calculations.
Bucharest Stock Market presented in the past two years of
analysis a high level of correlation with external markets. The
evolution of BET index, determined by the evolution of the
companies, may offer us important information about the
financial context of our analysis. As such, for a detailed
analysis of the performance of the analyzed companies which
are listed at the Bucharest Stock Market, will be followed also
the stock market evolutions, and the line with other indicators
for measurement of the performance or value request.
The impact and evolution of the financial markets can give
us information needed for developing the analysis at
International Journal of Trade, Economics and Finance, Vol. 2, No. 3, June 2011
184
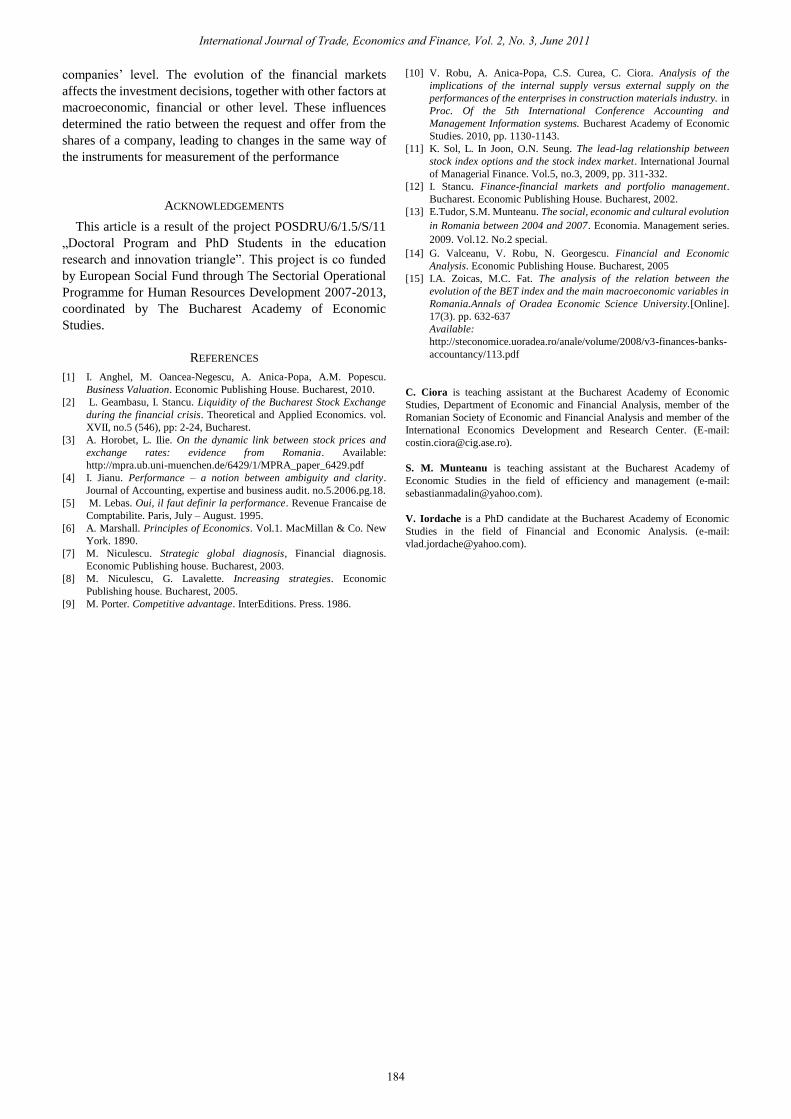
companies’ level. The evolution of the financial markets
affects the investment decisions, together with other factors at
macroeconomic, financial or other level. These influences
determined the ratio between the request and offer from the
shares of a company, leading to changes in the same way of
the instruments for measurement of the performance
ACKNOWLEDGEMENTS
This article is a result of the project POSDRU/6/1.5/S/11
„Doctoral Program and PhD Students in the education
research and innovation triangle”. This project is co funded
by European Social Fund through The Sectorial Operational
Programme for Human Resources Development 2007-2013,
coordinated by The Bucharest Academy of Economic
Studies.
REFERENCES
[1] I. Anghel, M. Oancea-Negescu, A. Anica-Popa, A.M. Popescu.
Business Valuation. Economic Publishing House. Bucharest, 2010.
[2] L. Geambasu, I. Stancu. Liquidity of the Bucharest Stock Exchange
during the financial crisis. Theoretical and Applied Economics. vol.
XVII, no.5 (546), pp: 2-24, Bucharest.
[3] A. Horobet, L. Ilie. On the dynamic link between stock prices and
exchange rates: evidence from Romania. Available:
http://mpra.ub.uni-muenchen.de/6429/1/MPRA_paper_6429.pdf
[4] I. Jianu. Performance – a notion between ambiguity and clarity.
Journal of Accounting, expertise and business audit. no.5.2006.pg.18.
[5] M. Lebas. Oui, il faut definir la performance. Revenue Francaise de
Comptabilite. Paris, July – August. 1995.
[6] A. Marshall. Principles of Economics. Vol.1. MacMillan & Co. New
York. 1890.
[7] M. Niculescu. Strategic global diagnosis, Financial diagnosis.
Economic Publishing house. Bucharest, 2003.
[8] M. Niculescu, G. Lavalette. Increasing strategies. Economic
Publishing house. Bucharest, 2005.
[9] M. Porter. Competitive advantage. InterEditions. Press. 1986.
[10] V. Robu, A. Anica-Popa, C.S. Curea, C. Ciora. Analysis of the
implications of the internal supply versus external supply on the
performances of the enterprises in construction materials industry. in
Proc. Of the 5th International Conference Accounting and
Management Information systems. Bucharest Academy of Economic
Studies. 2010, pp. 1130-1143.
[11] K. Sol, L. In Joon, O.N. Seung. The lead-lag relationship between
stock index options and the stock index market. International Journal
of Managerial Finance. Vol.5, no.3, 2009, pp. 311-332.
[12] I. Stancu. Finance-financial markets and portfolio management.
Bucharest. Economic Publishing House. Bucharest, 2002.
[13] E.Tudor, S.M. Munteanu. The social, economic and cultural evolution
in Romania between 2004 and 2007. Economia. Management series.
2009. Vol.12. No.2 special.
[14] G. Valceanu, V. Robu, N. Georgescu. Financial and Economic
Analysis. Economic Publishing House. Bucharest, 2005
[15] I.A. Zoicas, M.C. Fat. The analysis of the relation between the
evolution of the BET index and the main macroeconomic variables in
Romania.Annals of Oradea Economic Science University.[Online].
17(3). pp. 632-637
Available:
http://steconomice.uoradea.ro/anale/volume/2008/v3-finances-banks-
accountancy/113.pdf
C. Ciora is teaching assistant at the Bucharest Academy of Economic
Studies, Department of Economic and Financial Analysis, member of the
Romanian Society of Economic and Financial Analysis and member of the
International Economics Development and Research Center. (E-mail:
S. M. Munteanu is teaching assistant at the Bucharest Academy of
Economic Studies in the field of efficiency and management (e-mail:
V. Iordache is a PhD candidate at the Bucharest Academy of Economic
Studies in the field of Financial and Economic Analysis. (e-mail: