Referral and Management Guidelines for Colorectal Cancers ...

DOI: 10.1126/science.1133427, 268 (2006);314 Science
et al.Tobias SjöblomCancersThe Consensus Coding Sequences of Human Breast and Colorectal
This copy is for your personal, non-commercial use only.
clicking here.colleagues, clients, or customers by , you can order high-quality copies for yourIf you wish to distribute this article to others
here.following the guidelines
can be obtained byPermission to republish or repurpose articles or portions of articles
): March 6, 2013 www.sciencemag.org (this information is current as of
The following resources related to this article are available online at
http://www.sciencemag.org/content/314/5797/268.full.htmlversion of this article at:
including high-resolution figures, can be found in the onlineUpdated information and services,
http://www.sciencemag.org/content/suppl/2006/10/24/1133427.DC1.html can be found at: Supporting Online Material
http://www.sciencemag.org/content/314/5797/268.full.html#relatedfound at:
can berelated to this article A list of selected additional articles on the Science Web sites
http://www.sciencemag.org/content/314/5797/268.full.html#ref-list-1, 17 of which can be accessed free:cites 40 articlesThis article
727 article(s) on the ISI Web of Sciencecited by This article has been
http://www.sciencemag.org/content/314/5797/268.full.html#related-urls100 articles hosted by HighWire Press; see:cited by This article has been
http://www.sciencemag.org/cgi/collection/medicineMedicine, Diseases
subject collections:This article appears in the following
registered trademark of AAAS. is aScience2006 by the American Association for the Advancement of Science; all rights reserved. The title
CopyrightAmerican Association for the Advancement of Science, 1200 New York Avenue NW, Washington, DC 20005. (print ISSN 0036-8075; online ISSN 1095-9203) is published weekly, except the last week in December, by theScience
on
Mar
ch 6
, 201
3w
ww
.sci
ence
mag
.org
Dow
nloa
ded
from

The Consensus Coding Sequences ofHuman Breast and Colorectal CancersTobias Sjoblom,1* Sian Jones,1* Laura D. Wood,1* D. Williams Parsons,1* Jimmy Lin,1
Thomas D. Barber,1† Diana Mandelker,1 Rebecca J. Leary,1 Janine Ptak,1 Natalie Silliman,1
Steve Szabo,1 Phillip Buckhaults,2 Christopher Farrell,2 Paul Meeh,2 Sanford D. Markowitz,3
Joseph Willis,4 Dawn Dawson,4 James K. V. Willson,5 Adi F. Gazdar,6 James Hartigan,7 Leo Wu,8
Changsheng Liu,8 Giovanni Parmigiani,9 Ben Ho Park,10 Kurtis E. Bachman,11
Nickolas Papadopoulos,1 Bert Vogelstein,1‡ Kenneth W. Kinzler,1‡ Victor E. Velculescu1‡
The elucidation of the human genome sequence has made it possible to identify genetic alterationsin cancers in unprecedented detail. To begin a systematic analysis of such alterations, wedetermined the sequence of well-annotated human protein-coding genes in two common tumortypes. Analysis of 13,023 genes in 11 breast and 11 colorectal cancers revealed that individualtumors accumulate an average of È90 mutant genes but that only a subset of these contribute tothe neoplastic process. Using stringent criteria to delineate this subset, we identified 189 genes(average of 11 per tumor) that were mutated at significant frequency. The vast majority of thesegenes were not known to be genetically altered in tumors and are predicted to affect a wide rangeof cellular functions, including transcription, adhesion, and invasion. These data define the geneticlandscape of two human cancer types, provide new targets for diagnostic and therapeuticintervention, and open fertile avenues for basic research in tumor biology.
It is widely accepted that human cancer is a
genetic disease caused by sequential accumu-
lation of mutations in oncogenes and tumor
suppressor genes (1). These tumor-specific (that
is, somatic) mutations provide clues to the cellular
processes underlying tumorigenesis and have
proven useful for diagnostic and therapeutic
purposes. To date, however, only a small fraction
of the genes has been analyzed, and the number
and type of alterations responsible for the
development of common tumor types are
unknown (2). In the past, the selection of genes
chosen for mutational analyses in cancer has been
guided by information from linkage studies in
cancer-prone families, identification of chromo-
somal abnormalities in tumors, or known func-
tional attributes of individual genes or gene
families (2–4). With the determination of the hu-
man genome sequence and recent improvements
in sequencing and bioinformatic approaches, it is
now possible in principle to examine the cancer
cell genome in a comprehensive and unbiased
manner. Such an approach not only provides the
means to discover other genes that contribute to
tumorigenesis, but also can lead to mechanistic
insights that are only evident through a systems
biological perspective. Comprehensive genetic
analyses of human cancers could lead to discovery
of a set of genes, linked together through a shared
phenotype, that point to the importance of specific
cellular processes or pathways.
To begin the systematic study of the cancer
genome, we examined a major fraction of human
genes in two common tumor types, breast and
colorectal cancers. These cancers were chosen for
study because of their substantial clinical impor-
tance worldwide; together they account for È2.2
million cancer diagnoses (20% of the total) and
È940,000 cancer deaths each year (14% of the
total) (5). For genetic evaluation of these tumors,
we focused on a set of protein-coding genes,
termed the consensus coding sequences (CCDS),
that represent the most highly curated gene set
currently available. The CCDS Database (6) con-
tains full-length protein-coding genes that have
been defined by extensive manual curation and
computational processing and have gene annota-
tions that are identical among reference databases.
The goals of this study were (i) to develop a
methodological strategy for conducting genome-
wide analyses of cancer genes in human tumors,
(ii) to determine the spectrum and extent of so-
matic mutations in human tumors of similar and
different histologic types, and (iii) to identify new
cancer genes and molecular pathways that could
lead to improvements in diagnosis or therapy.
Cancer mutation discovery screen. The
initial step toward achieving these goals was the
development of methods for high-throughput
identification of somatic mutations in cancers.
These methods included those for primer design,
polymerase chain reaction (PCR), sequencing,
and mutational analysis (Fig. 1). The first compo-
nent involved extraction of all protein-coding se-
quences from the CCDS genes. A total of 120,839
nonredundant exons and adjacent intronic se-
quences were obtained from 14,661 different tran-
scripts in CCDS. These sequences were used to
design primers for PCR amplification and
sequencing of exons and adjacent splice sites.
Primers were designed using a number of criteria
to ensure robust amplification and sequencing of
template regions (7). Although most exons could
be amplified in a single PCR reaction, we found
that exons larger than 350 base pairs (bp) were
more effectively amplified as multiple over-
lapping amplicons. One member of every pair
of PCR primers was tailed with a universal
primer sequence for subsequent sequencing
reactions. A total of 135,483 primer pairs
encompassing È21 Mb of genomic sequence
were designed in this manner (table S1).
Eleven cell lines or xenografts of each tumor
type (breast and colorectal carcinomas) were used
in the discovery screen (table S2, A and B). Two
matching normal samples were used as controls to
help identify normal sequence variations and
amplicon-specific sequencing artifacts such as those
associated with GC-rich regions. A total of È3
million PCR products were generated and directly
sequenced, resulting in 465 Mb of tumor sequence.
Sequence data were assembled for each am-
plicon and evaluated for quality within the target
regionwith the use of software specifically designed
for this purpose (7). The target region of each exon
included all coding bases aswell as the four intronic
bases at both the 5¶ and 3¶ ends that serve as the
major splice recognition sites. For an amplicon to be
considered successfully analyzed, we required that
Q90% of bases in the target region have a Phred
quality score—defined as –10[log10(raw per-base
error)]—of at least 20 in at least three-quarters of
the tumor samples analyzed (8). This quality cut-
off was chosen to provide high sensitivity for mu-
tation detection while minimizing false positives.
Using these criteria, 93%of the 135,483 amplicons
and 90% of the total targeted bases in CCDS were
successfully analyzed for potential alterations.
Examination of sequence traces from these
amplicons revealed a total of 816,986 putative
RESEARCHARTICLE
1Ludwig Center and Howard Hughes Medical Institute, SidneyKimmel Comprehensive Cancer Center at Johns Hopkins,Baltimore, MD 21231, USA. 2Department of Pathology andMicrobiology, Center for Colon Cancer Research, and SouthCarolina Cancer Center, Division of Basic Research, Univer-sity of South Carolina School of Medicine, Columbia, SC29229, USA. 3Department of Medicine, Ireland CancerCenter, and Howard Hughes Medical Institute, Case WesternReserve University and University Hospitals of Cleveland,Cleveland, OH 44106, USA. 4Department of Pathology andIreland Cancer Center, Case Western Reserve University andUniversity Hospitals of Cleveland, Cleveland, OH 44106,USA. 5Harold C. Simmons Comprehensive Cancer Center,University of Texas Southwestern Medical Center, Dallas, TX75390, USA. 6Hamon Center for Therapeutic OncologyResearch and Department of Pathology, University of TexasSouthwestern Medical Center, Dallas, TX 75390, USA.7Agencourt Bioscience Corporation, Beverly, MA 01915,USA. 8SoftGenetics LLC, State College, PA 16803, USA.9Departments of Oncology, Biostatistics, and Pathology,Johns Hopkins Medical Institutions, Baltimore, MD 21205,USA. 10Sidney Kimmel Comprehensive Cancer Center atJohns Hopkins, Baltimore, MD 21231, USA. 11Department ofRadiation Oncology and Department of Biochemistry andMolecular Biology, Marlene and Stewart Greenebaum CancerCenter, University of Maryland School of Medicine, Balti-more, MD 21201, USA.
*These authors contributed equally to this work.†Present address: Lilly Research Laboratories, Eli Lilly andCompany, Indianapolis, IN 46285, USA.‡To whom correspondence should be addressed. E-mail:[email protected] (B.V.); [email protected] (K.W.K.);[email protected] (V.E.V.)
13 OCTOBER 2006 VOL 314 SCIENCE www.sciencemag.org268
on
Mar
ch 6
, 201
3w
ww
.sci
ence
mag
.org
Dow
nloa
ded
from

nucleotide changes. Because the vast majority of
changes that did not affect the amino acid se-
quence (i.e., synonymous or silent substitutions)
were likely to be nonfunctional, these changes
were not analyzed further. The remaining 557,029
changes could represent germline variants, artifacts
of PCR or sequencing, or bona fide somatic
mutations. Several bioinformatic and experimental
steps were used to distinguish among these pos-
sibilities. First, any alterations thatwere also present
in either of the two normal samples included in the
discovery screen were removed, as these were
likely to represent common germline polymor-
phisms or sequence artifacts. Second, as these two
normal control samples would be expected to con-
tain only a subset of known variants, any change
corresponding to a germline polymorphism found
in single-nucleotide polymorphism (SNP) data-
bases was also removed (7). Finally, the sequence
trace of each potential alteration was visually in-
spected so as to remove false positive calls in the
automated analysis. The combination of these data
analysis efforts was efficient, removing È96% of
the potential alterations and leaving 29,281 for
further scrutiny (Fig. 1).
To ensure that the observed mutations did not
arise artifactually during the PCR or sequencing
steps, we independently reamplified and re-
sequenced the regions containing them in the
corresponding tumors. This step removed 9295
alterations. The regions containing the putative
mutations were then sequenced in matched normal
DNA samples to determine whether the mutations
were truly somatic: 18,414 changes were observed
to be present in the germ line of these patients, rep-
resenting variants not currently annotated in SNP
databases, and were excluded. As a final step, the
remaining 1572 putative somatic mutations were
carefully examined in silico to ensure that the
alterations did not arise from mistargeted sequenc-
ing of highly related regions occurring elsewhere
in the genome (7). Alterations in such duplicated
regions may appear to be somatic when there is
loss of one or both alleles of the target region in
the tumor and when the selected primers closely
match and therefore amplify similar areas of the
genome. A total of 265 changes in closely related
regions were excluded in this fashion, resulting in
a total of 1307 confirmed somatic mutations in
1149 genes (Table 1).
Validation screen. To evaluate the preva-
lence and spectrum of somatic mutations in these
1149 genes, we determined their sequence in ad-
ditional tumors of the same histologic type (Fig. 1)
(table S2, A and B). Genes mutated in at least
one breast or colorectal tumor in the discovery
screen were analyzed in 24 additional breast or
colorectal tumors, respectively. This effort in-
volved 453,024 additional PCR and sequencing
reactions encompassing 77 Mb of tumor DNA.
A total of 133,693 putative changes were iden-
tified in the validation screen. Methods similar
to those used in the discovery screen were used
to exclude silent changes, known and novel germ-
line variants, false positives arising from PCR or
sequencing artifacts, and apparent changes that
were likely due to coamplification of highly re-
lated genes. Additionally, any changes corre-
sponding to germline variants not found in SNP
databases but identified in the discovery screen
were excluded. The regions containing the re-
maining 4948 changes were reamplified and re-
sequenced in the corresponding tumors (to ensure
reproducibility) and in matched normal tissue to
determine if they were somatic. An additional 365
somatic mutations in 236 genes were identified in
this manner. In total, 921 and 751 somatic muta-
tions were identified in breast and colorectal can-
cers, respectively (Fig. 1, Table 1, and table S4).
Mutation spectrum. The great majority of
the 1672 mutations observed in the discovery or
validation screens were single base substitutions:
81% of the mutations were missense, 7% were
nonsense, and 4% were altered splice sites
(Table 1). The remaining 8% were insertions,
deletions, and duplications ranging from 1 to 110
nucleotides in length. Although the fraction of
mutations that were single base substitutions was
similar in breast and colorectal cancers, the spec-
trum and nucleotide contexts of the substitution
mutations were very different between the two
tumor types. The most striking of these differences
occurred at C:G base pairs: 59% of the 696 colo-
rectal cancermutationswereC:G toT:A transitions,
whereas only 7% were C:G to G:C transversions
(Table 2 and table S3). In contrast, only 35% of the
mutations in breast cancers were C:G to T:A tran-
sitions, whereas 29% were C:G to G:C trans-
versions. In addition, a large fraction (44%) of the
mutations in colorectal cancers were at 5¶-CpG-3¶
dinucleotide sites, but only 17% of the mutations
in breast cancers occurred at such sites. This 5¶-
CpG-3¶ preference led to an excess of nonsynony-
mous mutations, resulting in changes of arginine
residues in colorectal cancers but not in breast
cancers (fig. S1). In contrast, 31% of mutations in
breast cancers occurred at 5¶-TpC-3¶ sites (or com-
plementary 5¶-GpA-3¶ sites), whereas only 11% of
mutations in colorectal cancers occurred at these
dinucleotide sites. The differences noted above
were all highly significant (P G 0.0001) (7) and
have substantial implications for the mechanisms
underlying mutagenesis in the two tumor types.
Distinction between passenger and non-passenger mutations. Somatic mutations in
Fig. 1. Schematic ofmutation discovery andvalidation screens.
Human genome consensus coding sequence14,661 transcripts from 13,023 genes
Extract protein coding sequences120,839 different exons
Design primers for PCR amplificationand sequencing of coding exons
21 Mb target sequence135,483 primer pairs
Amplify and sequence tumor DNA(11 breast tumors, 11 colorectal tumors, 2 normal samples)
465 Mb total tumor sequence
Assess gene mutation frequency and spectrumby sequencing 24 additional samples of affected tumor type
3 Mb target sequence77 Mb total tumor sequence
Assemble sequence data and identify potential mutations133,693 putative mutations observed
Assemble sequence data and identify putative mutations816,986 putative mutations observed
259,957 silent changes excluded
163,006 changes present in normal sample excluded
11,004 known polymorphisms excluded
353,738 changes excluded upon visual inspection
9,295 unconfirmed mutations excluded
18,414 germline variants excluded
265 changes from highly related regions excluded
41,586 silent changes excluded
18,198 germline variants excluded
68,961 changes excluded upon visual inspection
2,345 unconfirmed mutations excluded
2,042 germline variants excluded
196 changes from highly related regions excluded
Resequence tumor DNA to confirm remaining 29,281 mutations
Sequence patient-matched DNA from normal cells to determine whether remaining 19,986 mutations were somatic
1,307 somatic mutations in 1,149 genes
Resequence tumor DNA to confirm remaining 4,948 mutations
365 mutations in 236 genes
Sequence patient-matched DNA from normal cells todetermine whether remaining 2,603 mutations were somatic
Fractionmutationsremaining
Fractionmutationsremaining
100%
100%
68.9%
55.3%
3.7%
1.9%
0.42%
0.27%
68.2%
48.2%
46.9%
3.6%
2.4%
0.19%
0.16%
Dis
cove
ry s
cree
nV
alid
atio
n sc
reen
RESEARCH ARTICLE
www.sciencemag.org SCIENCE VOL 314 13 OCTOBER 2006 269
on
Mar
ch 6
, 201
3w
ww
.sci
ence
mag
.org
Dow
nloa
ded
from

human tumors can arise either through selection
of functionally important alterations (via their
effect on net cell growth) or through accumula-
tion of nonfunctional ‘‘passenger’’ alterations that
arise during repeated rounds of cell division in the
tumor or in its progenitor stem cell. In light of the
relatively low rates of mutation in human cancer
cells (9, 10), a distinction between selected and
passenger mutations is generally not required
when the number of genes and tumors analyzed
is small. In large-scale studies, however, such
distinctions are of paramount importance (11, 12).
For example, it has been estimated that non-
synonymous passenger mutations are present at a
frequency no higher than È1.2 per Mb of DNA
in cancers of the breast or colon (13–15). Because
we assessed 542 Mb of tumor DNA, we would
therefore have expected to observe È650 passen-
ger mutations. We actually observed 1672 muta-
tions (Table 1), many more than what would have
been predicted to occur by chance (P G 1 �10j10) (7). Moreover, the frequency of mutations
in the validation screen was significantly higher
than in the discovery screen (5.8 versus 3.1
mutations per Mb, P G 1 � 10j10; Table 1). The
mutations in the validation screen were also
enriched for nonsense, insertion, deletion, duplica-
tion, and splice site changes relative to the
discovery screen; each of these would be expected
to have a functional effect on the encoded proteins.
To distinguish genes likely to contribute to
tumorigenesis from those in which passenger
mutations occurred by chance, we first excluded
genes that were not mutated in the validation
screen. We next developed statistical methods to
estimate the probability that the number of muta-
tions in a given gene was greater than expected
from the backgroundmutation rate. For each gene,
this analysis incorporated the number of somatic
alterations observed in either the discovery or
validation screens, the number of tumors studied,
and the number of nucleotides successfully
analyzed (as indicated by the number of bases
with Phred quality scores of Q20). Because the
mutation frequencies varied with nucleotide type
and context and were different in breast versus
colorectal cancers (Table 2), these factors were
included in the calculations. The output of this
analysis was a cancer mutation prevalence
(CaMP) score for each gene analyzed. The CaMP
score reflects the probability that the number of
mutations observed in a gene reflects a mutation
frequency that is higher than that expected to be
observed by chance given the background mu-
tation rate; its derivation is based on principles
described in (7). The use of the CaMP score for
analysis of somatic mutations is analogous to
the use of the lod score for linkage analysis in
familial genetic settings. For example, 90% of
the genes with CaMP scores of 91.0 are
predicted to have mutation frequencies higher
than the background mutation frequency.
Candidate cancer genes. A complete list of
the somatic mutations identified in this study is
provided in table S4. Validated genes with
CaMP scores greater than 1.0 were considered
to be candidate cancer genes (CAN genes). The
combination of experimental validation and
statistical calculation thereby yielded four
nested sets of genes: Of 13,023 genes eval-
uated, 1149 were mutated, 236 were validated,
and 189 were CAN genes. Among these, the
CAN genes were most likely to have been
subjected to mutational selection during tumor-
igenesis. There were 122 and 69 CAN genes
identified in breast and colorectal cancers, re-
spectively (tables S5 and S6). Individual breast
cancers examined in the discovery screen
harbored an average of 12 (range 4 to 23) mutant
CAN genes, whereas the average number of CAN
genes in colorectal cancers was 9 (range 3 to 18)
(table S3). Interestingly, each cancer specimen of
a given tumor type carried its own distinct CAN-
gene mutational signature, as no cancer had more
than six mutant CAN genes in common with any
other cancer (tables S4 to S6).
CAN genes could be divided into three classes:
(i) genes previously observed to be mutationally
altered in human cancers, (ii) genes in which no
previous mutations in human cancers had been
discovered but had been linked to cancer through
functional studies, and (iii) genes with no pre-
vious strong connections to neoplasia.
The reidentification of genes that had been
previously shown to be somatically mutated in
cancers represented a critical validation of the
approach used in this study.All of theCCDSgenes
previously shown to be mutated in 910% of either
breast or colorectal cancers were found to be
CAN genes in the current study. These included
TP53 (2), APC (2), KRAS (2), SMAD4 (2), and
FBXW7 (CDC4) (16) (tables S4 to S6). In ad-
dition, we identified mutations in genes whose
mutation prevalence in sporadic cancers was
rather low. These genes included EPHA3
(17), MRE11A (18), NF1 (2), SMAD2 (19, 20),
SMAD3 (21), TCF7L2 (TCF4) (22), BRCA1 (2),
and TGFBRII (23). We also detected muta-
tions in genes that had been previously found to
be altered in human tumors but not in the same
tumor type identified in this study. These included
GNAS (guanine nucleotide binding protein, astimulating) (24), KEAP1 (kelch-like ECH-
associated protein) (25), RET (a proto-oncogene)
(2), and TCF1 (a transcription factor) (26). Fi-
nally, we found mutations in a number of genes
that have been previously identified as targets
of translocation or amplification in human can-
cers. These included NUP214 (a nucleoporin)
(2), KTN1 (a kinesin receptor) (27), DDX10
(DEAD box polypeptide 10) (28), GLI1 (glioma-
associated oncogene homolog 1) (29), andMTG8
(the translocation target gene of runt-related
transcription factor 1, RUNX1T1) (2). We con-
clude that if these genes had not already been
shown to play a causative role in human tumors,
they would have been discovered through the
approach taken in this study. By analogy, the 167
other CAN genes in tables S5 and S6 are likely to
Table 1. Summary of somatic mutations. Numbers in parentheses refer to percentage of total mutations.
TumorDiscovery screen* Validation screen† Both screens combined
Colorectal Breast Total Colorectal Breast Total Colorectal Breast Total
Number of mutated genes 519 673 1149 105 137 236 519 673 1149Number of mutations 574 733 1307 177 188 365 751 921 1672Nonsynonymous mutations in coding sequences
Missense 482 (84.0) 600 (81.9) 1082 (82.8) 126 (71.2) 145 (77.1) 271 (74.2) 608 (81.0) 745 (80.9) 1353 (80.9)Nonsense 35 (6.1) 39 (5.3) 74 (5.7) 26 (14.7) 8 (4.3) 34 (9.3) 61 (8.1) 47 (5.1) 108 (6.5)Insertion 3 (0.5) 3 (0.4) 6 (0.5) 2 (1.1) 2 (1.1) 4 (1.1) 5 (0.7) 5 (0.5) 10 (0.6)Deletion 18 (3.1) 48 (6.5) 66 (5.0) 10 (5.6) 13 (6.9) 23 (6.3) 28 (3.7) 61 (6.6) 89 (5.3)Duplication 17 (3.0) 2 (0.3) 19 (1.5) 3 (1.7) 12 (6.4) 15 (4.1) 20 (2.7) 14 (1.5) 34 (2.0)
Mutations in noncoding sequencesSplice site‡ 17 (3.0) 37 (5.0) 54 (4.1) 9 (5.1) 8 (4.3) 17 (4.7) 26 (3.5) 45 (4.9) 71 (4.2)UTR§ 2 (0.3) 4 (0.5) 6 (0.5) 1 (0.6) 0 (0.0) 1 (0.3) 3 (0.4) 4 (0.4) 7 (0.4)
Nucleotides successfully analyzed (Mb)¬ 208.5 209.2 417.7 28.7 34.3 63.0 237.2 243.5 480.7Mutation frequency (mutations/Mb) 2.8 3.5 3.1 6.2 5.5 5.8 3.2 3.8 3.5
*Coding and adjacent noncoding regions of 13,023 CCDS genes were sequenced in 11 colorectal and 11 breast cancers. †Genes mutated in the discovery screen were sequenced in 24additional tumor samples of the affected tumor type. ‡Intronic mutations within 4 bp of exon/intron boundary. §Mutations in untranslated regions (UTR) within 4 bp 5¶ of initiationcodon or 4 bp 3¶ of termination codon. ¬Nucleotides with Phred quality score of at least 20.
RESEARCH ARTICLE
13 OCTOBER 2006 VOL 314 SCIENCE www.sciencemag.org270
on
Mar
ch 6
, 201
3w
ww
.sci
ence
mag
.org
Dow
nloa
ded
from

play important roles in breast, colorectal, and
perhaps other types of cancers.
Although genetic alterations currently provide
the most reliable indicator of a gene’s importance
in human neoplasia (1, 30), many other genes are
thought to play key roles on the basis of func-
tional or expression studies. Our study provides
genetic evidence supporting the importance of
several of these genes in neoplasia. For example,
we discovered intragenic mutations in EPHB6 (an
ephrin receptor) (31), MLL3 (mixed-lineage leu-
kemia 3) (32), GSN (gelsolin) (33), CDH10 and
CDH20 (cadherins), FLNB (actin and SMAD
binding protein filamin B) (34), PTPRD (protein
tyrosine phosphatase receptor) (35), and AMFR
(autocrine motility factor receptor) (36).
In addition to these two classes of genes, our
study revealed a large number of genes that had not
been strongly suspected to be involved in cancer.
This third class of genes included PKHD1 (poly-
cystic kidney and hepatic disease 1), GUCY1A2
(guanylate cyclase 1), TBX22 (a transcription
factor), SEC8L1 (an exocyst complex compo-
nent), TTLL3 (a tubulin tyrosine ligase), ATP8B1
(an ATP-dependent transporter), CUBN (an in-
trinsic factor-cobalamin receptor), DBN1 (an actin
binding protein), and TECTA (tectorin a). In addi-tion, seven CAN genes corresponded to genes for
which no biologic role has yet been established.
We examined the distribution of mutations
within CAN-gene products to see whether clus-
tering occurred in specific regions or functional
domains. In addition to the well-documented hot-
spots in TP53 (37) and KRAS (38), we identified
threemutations inGNAS in colorectal cancers that
affected a single amino acid residue (Arg201).
Alterations of this residue have previously been
shown to lead to constitutive activation of the en-
coded heterotrimeric guanine nucleotide–binding
protein (G protein) asthrough inhibition of gua-
nosine triphosphatase (GTPase) activity (24).
Two mutations in the EGF-like gene EGFL6 in
breast tumors affected the same nucleotide
position and resulted in a Leu508 Y Phe change
in the MAM adhesion domain. A total of seven
genes had alterations located within five amino
acid residues of each other, and an additional 12
genes had clustering of multiple mutations within
a specific protein domain (13 to 78 amino acids
apart). Thirty-one of 40 of these changes affected
residues that were evolutionarily conserved.
Although the effects of these alterations are
unknown, their clustering suggests specific roles
for the mutated regions in the neoplastic process.
CAN-gene groups. An unbiased screen of a
large set of genes can provide insights into
pathogenesis that would not be apparent through
single-gene mutational analysis. This has been
exemplified by large-scale mutagenesis screens in
experimental organisms (39–41). We therefore
attempted to assign each CAN gene to a func-
tional group based on Gene Ontology (GO) mo-
lecular function or biochemical process groups,
the presence of specific INTERPRO sequence
domains, or previously published literature (Table
3 and Fig. 2). Several of the groups identified in
this way were of special interest. For example, 22
of the 122 (18%) breast CAN genes and 13 of the
69 (19%) colorectal CAN genes were transcrip-
tional regulators. At least one of these genes was
mutated in more than 80% of the tumors of each
type. Zinc-finger transcription factors were partic-
ularly highly represented (eight genes mutated
collectively in 43% of breast cancer samples).
Similarly, genes involved in cell adhesion rep-
resented È22% of CAN genes and affected more
than two-thirds of tumors of either type. Genes
involved in signal transduction represented È23%
of CAN genes, and at least one such gene was
mutated in 77% and 94% of the breast and
colorectal cancer samples, respectively. Subsets of
these groups were also of interest and included
metalloproteinases (part of the cell adhesion and
motility group and mutated in 37% of colorectal
cancers) and G proteins and their regulators (part
of the signal transduction group and altered in
43% of breast cancers). These data suggest that
dysregulation of specific cellular processes is
genetically selected during neoplasia and that
distinct members of each group may serve similar
roles in different tumors.
Discussion. Four important points have
emerged from this comprehensive mutational
analysis of human cancer. First, a relatively large
number of previously uncharacterized CAN genes
exist in breast and colorectal cancers, and these
genes can be discovered by unbiased approaches
such as that used in our study. These results
support the notion that large-scale mutational
analyses of other tumor types will prove useful
for identifying genes not previously known to be
linked to human cancer.
Second, our results suggest that the number of
mutational events occurring during the evolution
of human tumors from a benign to a metastatic
state is much larger than previously thought. We
found that breast and colorectal cancers harbor an
average of 52 and 67 nonsynonymous somatic
mutations in CCDS genes, of which an average of
9 and 12, respectively, were in CAN genes (table
S3). These data can be used to estimate the total
number of nonsynonymous mutations in coding
genes that arise in a ‘‘typical’’ cancer through
sequential rounds of mutation and selection. If we
assume that the mutation prevalence in genes that
have not yet been sequenced is similar to that of
the genes so far analyzed, we estimate that there
are 81 and 105 mutant genes (average 93) in the
typical colorectal or breast cancer, respectively
(7). Of these, an average of 14 and 20, respec-
tively, would be expected to be CAN genes. In
addition to the CAN genes, there were other
mutated CCDS genes that were likely to have
been selected for during tumorigenesis but were
not altered at a frequency high enough to war-
rant confidence in their interpretation.
A third point emerging from our study is that
breast and colorectal cancers show substantial
differences in their mutation spectra. In colorectal
cancers, a bias toward C:G to T:A transitions at
5¶-CpG-3¶ sites was previously noted in TP53 (42).
Our results suggest that this bias is genome-wide
Table 2. Spectrum of single base substitutions. Base substitutions in coding sequences resulting in nonsynonymous changes as well as substitutions innoncoding sequences are included (see Table 1). Numbers in parentheses indicate percentage of total mutations.
TumorDiscovery screen Validation screen Both screens combined
Colorectal Breast Total Colorectal Breast Total Colorectal Breast Total
Total number of substitutions 535 678 1213 161 160 321 696 838 1534Substitutions at C:G base pairs
C:G Y T:A 325 (60.7) 230 (33.9) 555 (45.8) 88 (54.7) 59 (36.9) 147 (45.8) 413* (59.3) 289* (34.5) 702 (45.8)C:G Y G:C 36 (6.7) 207 (30.5) 243 (20.0) 12 (7.5) 32 (20.0) 44 (13.7) 48* (6.9) 239* (28.5) 287 (18.7)C:G Y A:T 70 (13.1) 110 (16.2) 180 (14.8) 23 (14.3) 38 (23.8) 61 (19.0) 93 (13.4) 148 (17.7) 241 (15.7)
Substitutions at T:A base pairsT:A Y C:G 42 (7.9) 54 (8.0) 96 (7.9) 14 (8.7) 18 (11.3) 32 (10.0) 56 (8.0) 72 (8.6) 128 (8.3)T:A Y G:C 38 (7.1) 30 (4.4) 68 (5.6) 13 (8.1) 5 (3.1) 18 (5.6) 51 (7.3) 35 (4.2) 86 (5.6)T:A Y A:T 24 (4.5) 47 (6.9) 71 (5.9) 11 (6.8) 8 (5.0) 19 (5.9) 35 (5.0) 55 (6.6) 90 (5.9)
Substitutions at specific dinucleotides†5¶-CpG-3¶ 254 (47.5) 115 (17.0) 369 (30.4) 55 (34.2) 24 (15.0) 79 (24.6) 309* (44.4) 139* (16.6) 448 (29.2)5¶-TpC-3¶ 54 (10.1) 235 (34.7) 289 (23.8) 25 (15.5) 22 (13.8) 47 (14.6) 79* (11.4) 257* (30.7) 336 (21.9)
*Values in this category were significantly different between breast and colorectal cancers (P G 0.0001). †Includes substitutions at the C or G of the 5¶-CpG-3¶ dinucleotide, the C of the 5¶- TpC-3¶dinucleotide, or the G of the 5¶-GpA-3¶ dinucleotide.
RESEARCH ARTICLE
www.sciencemag.org SCIENCE VOL 314 13 OCTOBER 2006 271
on
Mar
ch 6
, 201
3w
ww
.sci
ence
mag
.org
Dow
nloa
ded
from
rather than representing a selection for certain
nucleotides within TP53. This bias may reflect a
more extensive methylation of 5¶-CpG-3¶ dinu-
cleotides in colorectal cancers than in breast
cancers, or it may be an effect of dietary
carcinogens (43, 44). In breast cancers, the fraction
ofmutations at 5¶-TpC-3¶ siteswas far higher in the
CCDS genes examined in this study than previ-
ously reported forTP53 (37). It has been noted that
a small fraction of breast tumors may have a de-
fective repair system, resulting in 5¶-TpC-3¶ muta-
tions (15). Our studies confirm that some breast
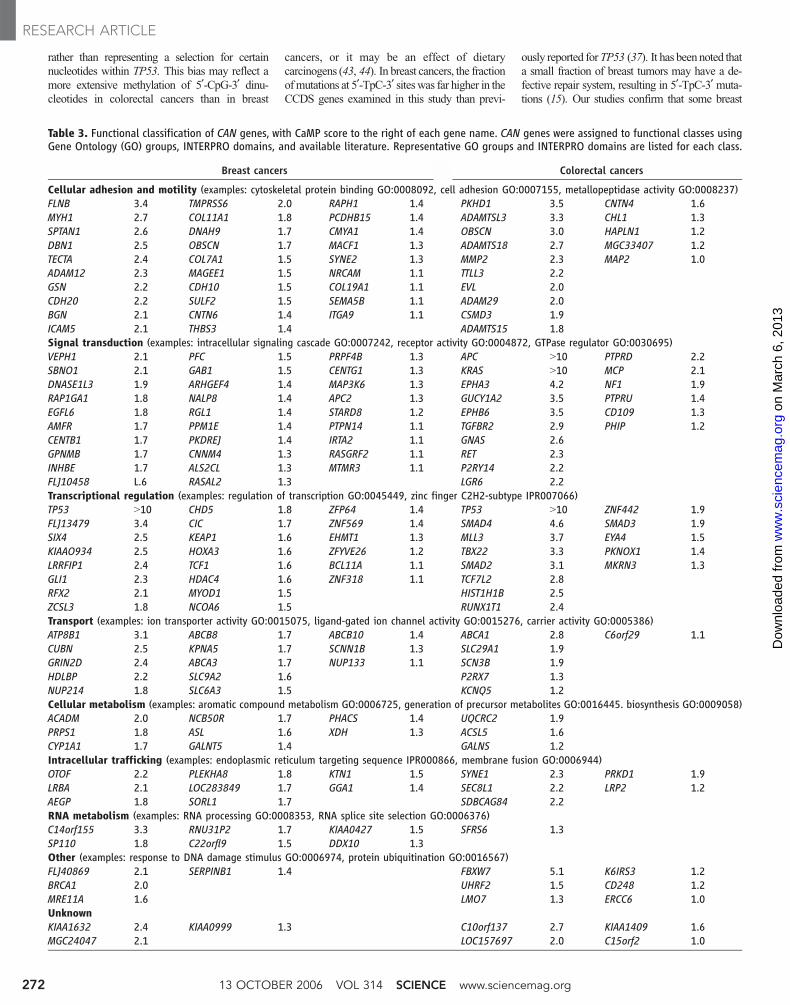
Table 3. Functional classification of CAN genes, with CaMP score to the right of each gene name. CAN genes were assigned to functional classes usingGene Ontology (GO) groups, INTERPRO domains, and available literature. Representative GO groups and INTERPRO domains are listed for each class.
Breast cancers Colorectal cancers
Cellular adhesion and motility (examples: cytoskeletal protein binding GO:0008092, cell adhesion GO:0007155, metallopeptidase activity GO:0008237)FLNB 3.4 TMPRSS6 2.0 RAPH1 1.4 PKHD1 3.5 CNTN4 1.6MYH1 2.7 COL11A1 1.8 PCDHB15 1.4 ADAMTSL3 3.3 CHL1 1.3SPTAN1 2.6 DNAH9 1.7 CMYA1 1.4 OBSCN 3.0 HAPLN1 1.2DBN1 2.5 OBSCN 1.7 MACF1 1.3 ADAMTS18 2.7 MGC33407 1.2TECTA 2.4 COL7A1 1.5 SYNE2 1.3 MMP2 2.3 MAP2 1.0ADAM12 2.3 MAGEE1 1.5 NRCAM 1.1 TTLL3 2.2GSN 2.2 CDH10 1.5 COL19A1 1.1 EVL 2.0CDH20 2.2 SULF2 1.5 SEMA5B 1.1 ADAM29 2.0BGN 2.1 CNTN6 1.4 ITGA9 1.1 CSMD3 1.9ICAM5 2.1 THBS3 1.4 ADAMTS15 1.8Signal transduction (examples: intracellular signaling cascade GO:0007242, receptor activity GO:0004872, GTPase regulator GO:0030695)VEPH1 2.1 PFC 1.5 PRPF4B 1.3 APC 910 PTPRD 2.2SBNO1 2.1 GAB1 1.5 CENTG1 1.3 KRAS 910 MCP 2.1DNASE1L3 1.9 ARHGEF4 1.4 MAP3K6 1.3 EPHA3 4.2 NF1 1.9RAP1GA1 1.8 NALP8 1.4 APC2 1.3 GUCY1A2 3.5 PTPRU 1.4EGFL6 1.8 RGL1 1.4 STARD8 1.2 EPHB6 3.5 CD109 1.3AMFR 1.7 PPM1E 1.4 PTPN14 1.1 TGFBR2 2.9 PHIP 1.2CENTB1 1.7 PKDREJ 1.4 IRTA2 1.1 GNAS 2.6GPNMB 1.7 CNNM4 1.3 RASGRF2 1.1 RET 2.3INHBE 1.7 ALS2CL 1.3 MTMR3 1.1 P2RY14 2.2FLJ10458 L.6 RASAL2 1.3 LGR6 2.2Transcriptional regulation (examples: regulation of transcription GO:0045449, zinc finger C2H2-subtype IPR007066)TP53 910 CHD5 1.8 ZFP64 1.4 TP53 910 ZNF442 1.9FLJ13479 3.4 CIC 1.7 ZNF569 1.4 SMAD4 4.6 SMAD3 1.9SIX4 2.5 KEAP1 1.6 EHMT1 1.3 MLL3 3.7 EYA4 1.5KIAAO934 2.5 HOXA3 1.6 ZFYVE26 1.2 TBX22 3.3 PKNOX1 1.4LRRFIP1 2.4 TCF1 1.6 BCL11A 1.1 SMAD2 3.1 MKRN3 1.3GLI1 2.3 HDAC4 1.6 ZNF318 1.1 TCF7L2 2.8RFX2 2.1 MYOD1 1.5 HIST1H1B 2.5ZCSL3 1.8 NCOA6 1.5 RUNX1T1 2.4Transport (examples: ion transporter activity GO:0015075, ligand-gated ion channel activity GO:0015276, carrier activity GO:0005386)ATP8B1 3.1 ABCB8 1.7 ABCB10 1.4 ABCA1 2.8 C6orf29 1.1CUBN 2.5 KPNA5 1.7 SCNN1B 1.3 SLC29A1 1.9GRIN2D 2.4 ABCA3 1.7 NUP133 1.1 SCN3B 1.9HDLBP 2.2 SLC9A2 1.6 P2RX7 1.3NUP214 1.8 SLC6A3 1.5 KCNQ5 1.2Cellular metabolism (examples: aromatic compound metabolism GO:0006725, generation of precursor metabolites GO:0016445. biosynthesis GO:0009058)ACADM 2.0 NCB50R 1.7 PHACS 1.4 UQCRC2 1.9PRPS1 1.8 ASL 1.6 XDH 1.3 ACSL5 1.6CYP1A1 1.7 GALNT5 1.4 GALNS 1.2Intracellular trafficking (examples: endoplasmic reticulum targeting sequence IPR000866, membrane fusion GO:0006944)OTOF 2.2 PLEKHA8 1.8 KTN1 1.5 SYNE1 2.3 PRKD1 1.9LRBA 2.1 LOC283849 1.7 GGA1 1.4 SEC8L1 2.2 LRP2 1.2AEGP 1.8 SORL1 1.7 SDBCAG84 2.2RNA metabolism (examples: RNA processing GO:0008353, RNA splice site selection GO:0006376)C14orf155 3.3 RNU31P2 1.7 KIAA0427 1.5 SFRS6 1.3SP110 1.8 C22orfl9 1.5 DDX10 1.3Other (examples: response to DNA damage stimulus GO:0006974, protein ubiquitination GO:0016567)FLJ40869 2.1 SERPINB1 1.4 FBXW7 5.1 K6IRS3 1.2BRCA1 2.0 UHRF2 1.5 CD248 1.2MRE11A 1.6 LMO7 1.3 ERCC6 1.0UnknownKIAA1632 2.4 KIAA0999 1.3 C10orf137 2.7 KIAA1409 1.6MGC24047 2.1 LOC157697 2.0 C15orf2 1.0
RESEARCH ARTICLE
13 OCTOBER 2006 VOL 314 SCIENCE www.sciencemag.org272
on
Mar
ch 6
, 201
3w
ww
.sci
ence
mag
.org
Dow
nloa
ded
from

cancers have higher fractions of 5¶-TpC-3¶ muta-
tions than others, but also show that mutations at
this dinucleotide are generally more frequent than
in colorectal cancers (Table 2 and table S3).
Finally, our results reveal that there are sub-
stantial differences in the panel of CAN genes
mutated in the two tumor types (Table 3). For
example, metalloproteinase genes were mutated in
a large fraction of colorectal but only in a small
fraction of breast cancers (tables S5 and S6).
Transcriptional regulator genes were mutated in a
high fraction of both breast and colorectal tumors,
but the specific genes affected varied according to
tumor type (Table 3). There was also considerable
heterogeneity among the CAN genes mutated in
different tumor specimens derived from the same
tissue type (tables S4 to S6). It has been docu-
mented that virtually all biochemical, biological,
and clinical attributes are heterogeneous within
human cancers of the same histologic subtype (45).
Our data suggest that differences in the genes
mutated in various tumors could account for a
major part of this heterogeneity. This might
explain why it has been so difficult to correlate
the behavior, prognosis, or response to therapy of
common solid tumorswith the presence or absence
of a single gene alteration; such alterations reflect
only a small component of each tumor’s muta-
tional composition. On the other hand, disparate
genes contributing to cancer are often functionally
equivalent, affecting net cell growth through the
same molecular pathway (1). Thus, TP53 and
MDM2 mutations exert comparable effects on
cells, as do mutations in RB1, CDKN2A (p16),
CCND1, and CDK4. It will be of interest to de-
termine whether a limited number of pathways
include most CAN genes, a possibility consistent
with the groupings in Fig. 2 and Table 3.
Like a draft version of any genome project, our
study has limitations. First, only genes present in
the current version of CCDSwere analyzed; of the
genes not yet included, there areÈ5000 genes for
which excellent supporting evidence exists (46).
Second, wewere not able to successfully sequence
È10% of the bases within the coding sequences of
the 13,023 CCDS genes (equivalent to 1302 unse-
quenced genes). Third, our identification of genes
mutated at significant frequencies assumed that the
background mutation frequency was constant
throughout the genome. Although it cannot current-
ly be determined whether certain genomic regions
have higher background mutation frequencies, we
have included the number of mutations observed
per Mb sequenced in tables S5 and S6 to facilitate
such analyses in the future. Fourth, although our
screenwould be expected to identify the most com-
mon types of mutations found in cancers, some
genetic alterations—including mutations in non-
coding genes, mutations in noncoding regions of
coding genes, relatively large deletions or insertions,
amplifications, and translocations—would not be
detectable by the methods we used. Future studies
using a combination of different technologies, such
as those envisioned by the Cancer Genome Atlas
Project (47), will be able to address these issues.
The results of this study inform future can-
cer genome sequencing efforts in several im-
portant ways:
1) A major technical challenge of such studies
will be discerning somatic mutations from the
large number of sequence alterations identified. In
our study, 557,029 nonsynonymous sequence al-
terations were detected in the discovery screen, but
after subsequent analyses only 0.23% of these
were identified as legitimate somatic mutations
(Fig. 1). Fewer than 10% of the putative nonsynon-
ymous alterations were known polymorphisms;
many of the rest were uncommon germline vari-
ants or sequence artifacts that were not reproduc-
ible. Inclusion of matched normal samples and
sequencing both strands of each PCR product
would reduce false positives in the discovery screen
but would increase the cost of sequencing by a
factor of 4. Although recently developed sequenc-
ing methods could reduce the cost of such studies
in the future (48), the higher error rates of these
approaches may result in an even lower ratio of
bona fide somatic mutations to putative alterations.
2) Another technical issue is that careful de-
sign of primers is important to eliminate sequence
artifacts due to the inadvertent amplification and
sequencing of related genes. The primer pairs that
resulted in successful amplification and sequencing
represent a valuable resource in this regard. Even
with well-designed primers, it is essential to exam-
ine any observed mutation to ensure that it is not
found as a normal variant in a related gene.
3) Although it is likely that studies of other
solid tumor typeswill also identify a large number
of somaticmutations, it will be important to apply
rigorous approaches to identify those mutations
that have been selected for during tumorigenesis.
Statistical techniques, such as those used in this
study or described by Greenman et al. (11), can
provide strong evidence for selection of mutated
genes. These approaches are likely to improve as
more cancer genomic sequencing data are accu-
mulated through the Cancer GenomeAtlas Project
(47) and other projects now under way.
4) There has been much discussion about
which genes should be the focus of future se-
quencing efforts. Our results suggest that many
genes not previously implicated in cancer are
mutated at significant levels and may provide
novel clues to pathogenesis. From these data, it
would seem that large-scale unbiased screens of
coding genes may be more informative than
screens based on previously defined criteria.
5) The results also raise questions about the
optimum number of tumors of any given type
that should be assessed in a cancer genome
study. Our study was designed to determine the
nature and types of alterations present in an
‘‘average’’ breast or colorectal cancer and to
discover genes mutated at reasonably high
frequencies. With this design, our power to detect
genes mutated in more than 20% of tumors of a
given type was 90%, but only 50% of genes
mutated in 6% of tumors would have been
discovered. Detection of genes mutated in 6%
or 1% of tumors with 999% probability in a
discovery screen would require sequence deter-
mination of at least 75 or 459 tumors, respec-
tively. Although it will be impossible to detect all
mutations that may occur in tumors, strategies
that would identify the most important ones at an
affordable cost can be envisioned on the basis
of the data and analysis reported herein.
6) Ultimately, the sequences of entire cancer
genomes, including intergenic regions, will be ob-
tainable. Our studies demonstrate the inherent dif-
ficulties in determining the consequences of
somatic mutations, even those that alter the amino
acid sequence of highly annotated andwell-studied
genes. Establishing the consequences of mutations
in noncoding regions of the genome will likely be
much more difficult. Until new tools for solving
this problem become available, it is likely that
gene-centric sequencing analyses of cancer will be
more useful than whole-genome sequencing.
Our results provide a large number of future
research opportunities in human cancer. For ge-
netics, it will be of interest to elucidate the timing
Fig. 2. Mutation frequency of CAN-genegroups. CAN genes were grouped byfunction with the use of Gene Ontologygroups, INTERPRO domains, and avail-able literature. Bars indicate the fractionof tumors (35 breast or 35 colorectal)with at least one mutated gene in thefunctional group.
RESEARCH ARTICLE
www.sciencemag.org SCIENCE VOL 314 13 OCTOBER 2006 273
on
Mar
ch 6
, 201
3w
ww
.sci
ence
mag
.org
Dow
nloa
ded
from

and extent of CAN-gene mutations in breast and
colorectal cancers, whether these genes aremutated
in other tumor types, andwhether germline variants
in CAN genes are associated with cancer pre-
disposition. For immunology, the finding that
tumors contain an average ofÈ90 different amino
acid substitutions not present in any normal cell
can provide novel approaches to engender anti-
tumor immunity. For epidemiology, the remark-
able difference in mutation spectra of breast and
colorectal cancers suggests the existence of organ-
specific carcinogens. For cancer biology, it is clear
that no current animal or in vitro model of cancer
recapitulates the genetic landscape of an actual hu-
man tumor. Understanding and capturing this
landscape and its heterogeneity may provide
models that more successfully mimic the human
disease. For epigenetics, it is possible that a subset
ofCAN genes can also be dysregulated in tumors
through changes in chromatin or DNA methyla-
tion rather than through mutation. For diagnostics,
the CAN genes define a relatively small subset of
genes that could prove useful as markers for neo-
plasia. Finally, some of these genes, particularly
those on the cell surface or those with enzymatic
activity, may prove to be good targets for
therapeutic development.
References and Notes1. B. Vogelstein, K. W. Kinzler, Nat. Med. 10, 789 (2004).2. P. A. Futreal et al., Nat. Rev. Cancer 4, 177 (2004).3. A. Bardelli, V. E. Velculescu, Curr. Opin. Genet. Dev. 15, 5
(2005).4. B. Vogelstein, K. W. Kinzler, The Genetic Basis of Human
Cancer (McGraw-Hill, Toronto, 2002).5. D. M. Parkin, F. Bray, J. Ferlay, P. Pisani, CA Cancer J. Clin.
55, 74 (2005).6. CCDS Database (www.ncbi.nlm.nih.gov/CCDS).
7. See supporting material on Science Online.8. B. Ewing, P. Green, Genome Res. 8, 186 (1998).9. C. Lengauer, K. W. Kinzler, B. Vogelstein, Nature 396,
643 (1998).10. L. A. Loeb, Cancer Res. 61, 3230 (2001).11. C. Greenman, R. Wooster, P. A. Futreal, M. R. Stratton,
D. F. Easton, Genetics 173, 2187 (2006).12. S. E. Kern, J. M. Winter, Cancer Biol. Ther. 5, 349 (2006).13. T. L. Wang et al., Proc. Natl. Acad. Sci. U.S.A. 99, 3076
(2002).14. D. Shen et al., in preparation.15. P. Stephens et al., Nat. Genet. 37, 590 (2005).16. H. Strohmaier et al., Nature 413, 316 (2001).17. A. Bardelli et al., Science 300, 949 (2003).18. Z. Wang et al., Cancer Res. 64, 2998 (2004).19. G. J. Riggins et al., Nat. Genet. 13, 347 (1996).20. K. Eppert et al., Cell 86, 543 (1996).21. J.-L. Ku et al., Cancer Lett. 10.1016/j.canlet.2006.05.008
(2006).22. A. Duval et al., Cancer Res. 59, 4213 (1999).23. S. Markowitz et al., Science 268, 1336 (1995).24. C. A. Landis et al., Nature 340, 692 (1989).25. B. Padmanabhan et al., Mol. Cell 21, 689 (2006).26. O. Bluteau et al., Nat. Genet. 32, 312 (2002).27. K. Salassidis et al., Cancer Res. 60, 2786 (2000).28. Y. Arai et al., Blood 89, 3936 (1997).29. K. W. Kinzler et al., Science 236, 70 (1987).30. H. Varmus, Science 312, 1162 (2006).31. X. X. Tang, G. M. Brodeur, B. G. Campling, N. Ikegaki,
Clin. Cancer Res. 5, 455 (1999).32. M. Ruault, M. E. Brun, M. Ventura, G. Roizes, A. De Sario,
Gene 284, 73 (2002).33. M. Tanaka et al., Cancer Res. 55, 3228 (1995).34. A. Sasaki, Y. Masuda, Y. Ohta, K. Ikeda, K. Watanabe,
J. Biol. Chem. 276, 17871 (2001).35. M. Sato et al., Genes Chromosomes Cancer 44, 405 (2005).36. Y. Onishi, K. Tsukada, J. Yokota, A. Raz, Clin. Exp.
Metastasis 20, 51 (2003).37. M. Hollstein, D. Sidransky, B. Vogelstein, C. C. Harris,
Science 253, 49 (1991).38. J. L. Bos et al., Nature 327, 293 (1987).39. R. Brent, Cell 100, 169 (2000).40. T. Ideker et al., Science 292, 929 (2001).41. S. L. Ooi et al., Trends Genet. 22, 56 (2006).
42. T. Soussi, G. Lozano, Biochem. Biophys. Res. Commun.331, 834 (2005).
43. M. Olivier, S. P. Hussain, C. Caron de Fromentel,P. Hainaut, C. C. Harris, IARC Sci. Publ. 157, 247(2004).
44. J. F. Costello et al., Nat. Genet. 24, 132 (2000).45. A. H. Owens, D. S. Coffey, S. B. Baylin, Eds., Tumor Cell
Heterogeneity (Academic Press, New York, 1982),pp. 441–460.
46. K. D. Pruitt, T. Tatusova, D. R. Maglott, Nucleic Acids Res.33, D501 (2005).
47. The Cancer Genome Atlas (http://cancergenome.nih.gov/index.asp).
48. Y. H. Rogers, J. C. Venter, Nature 437, 326 (2005).49. We thank J. Lutterbaugh, E. Lawrence, and L. Beard for
assistance with cell culture and DNA preparation; E. Suh,D. Smith, K. Makowski, and the Agencourt sequencingteam for assistance with automated sequencing; S. Kernfor helpful comments on the manuscript; and R. J.Vogelstein and J. T. Vogelstein for assistance withstatistical analyses. Supported by the Virginia andD. K. Ludwig Fund for Cancer Research; NIH grants CA121113, CA 43460, CA 57345, CA 62924, GM 07309, RR017698, P30-CA43703, and CA109274; NCI Division ofCancer Prevention contract HHSN261200433002C;Department of Defense grant DAMD17-03-1-0241; and thePew Charitable Trusts, the Palmetto Health Foundation, theMaryland Cigarette Restitution Fund, the State of OhioBiomedical Research and Technology Transfer Commis-sion, the Clayton Fund, the Blaustein Foundation, theNational Colorectal Cancer Research Alliance, the AvonFoundation, the Flight Attendant Medical ResearchInstitute, and the V Foundation for Cancer Research.
Supporting Online Materialwww.sciencemag.org/cgi/content/full/1133427/DC1Materials and MethodsFigs. S1 and S2Tables S1 to S5References
3 August 2006; accepted 30 August 2006Published online 7 September 2006;10.1126/science.1133427Include this information when citing this paper.
REPORTS
Self-Assembly of CdTe Nanocrystalsinto Free-Floating SheetsZhiyong Tang,1* Zhenli Zhang,1 Ying Wang,2 Sharon C. Glotzer,1,2† Nicholas A. Kotov1,2,3†
In their physical dimensions, surface chemistry, and degree of anisotropic interactions in solution,CdTe nanoparticles are similar to proteins. We experimentally observed their spontaneous,template-free organization into free-floating particulate sheets, which resemble the assembly ofsurface layer (S-layer) proteins. Computer simulation and concurrent experiments demonstratedthat the dipole moment, small positive charge, and directional hydrophobic attraction are thedriving forces for the self-organization process. The data presented here highlight the analogy ofthe solution behavior of the two vastly different classes of chemical structures.
Understanding the ability of nanoparticles
(NPs) to self-assemble will influence
both the fundamental picture of the
properties of matter on the nanoscale and the
practical realization of bottom-up fabrication
technologies (1–3). Self-organization processes
in solution have beenwell established for proteins
and other biomacromolecules (4–6), which have
physical dimensions of several nanometers, i.e.,
the same scale as that of many inorganic nano-
colloids. Recent studies demonstrate nanoparticle
self-organization into one-dimensional (1D) struc-
tures driven by anisotropic dipolar interparticle
forces (7–9). Highly uniform nanocolloids, with
presumably isotropic interactions, can form 3D
arrays or crystals (10–14). Two-dimensional
arrays of NPs produced at two-phase interfaces—
such as gas-solid (10), liquid-solid (15), gas-
liquid (16), or liquid-liquid (17)—where the
interfaces act as a template, are well known. We
report that the combination of the electrostatic
interaction and anisotropic hydrophobic attrac-
tion between NPs with tetrahedral shape result in
the spontaneous formation of 2D free-floating
sheets. The sheets display considerable mechan-
ical robustness and retain size-quantized proper-
ties of the semiconductor NP with characteristic
luminescence. Notably, they do not require any
interface that may give dimension-restrictive cues
1Department of Chemical Engineering, University ofMichigan, Ann Arbor, MI 48109–2136, USA. 2Departmentof Materials Science and Engineering, University ofMichigan, Ann Arbor, MI 48109–2136, USA. 3Departmentof Biomedical Engineering, University of Michigan, AnnArbor, MI 48109–2136, USA.
*Present address: National Center for Nanoscience andTechnology, Beijing 100080, China.†To whom correspondence should be addressed. E-mail:[email protected] (N.A.K.); [email protected] (S.C.G.)
13 OCTOBER 2006 VOL 314 SCIENCE www.sciencemag.org274
on
Mar
ch 6
, 201
3w
ww
.sci
ence
mag
.org
Dow
nloa
ded
from