Colorectal and other digestive-tract cancers (Full ...
201
Colorectal and other digestive-tract cancers
Transcript of Colorectal and other digestive-tract cancers (Full ...
Stronger evidence,better decisions,improved health and welfare
Stronger evidence, better decisions, improved health and welfare
Digestive-tract cancers are estimated to account for about 2 in 10 of all cancers diagnosed and nearly 3 in 10 cancer deaths. A person’s chance of surviving depends on the type of digestive-tract cancer: colorectal cancer (the most common digestive-tract cancer) had the highest 5-year relative survival rate (69%), while pancreatic cancer (the second most common digestive-tract cancer) had the lowest 5-year relative survival of all specified digestive cancers (8.7%).
aihw.gov.au
Colorectal and other digestive-tract cancers
Colorectal and other gastrointestinal cancersA
IHW

Australian Institute of Health and Welfare Canberra
Cat. no. CAN 117
Cancer Series
Number 114
Colorectal and other digestive-tract cancers
The Australian Institute of Health and Welfare is a major national agency whose purpose is to create authoritative and accessible information and statistics that inform decisions and improve the health and welfare of all Australians.
© Australian Institute of Health and Welfare 2018
This product, excluding the AIHW logo, Commonwealth Coat of Arms and any material owned by a third party or protected by a trademark, has been released under a Creative Commons BY 3.0 (CC-BY 3.0) licence. Excluded material owned by third parties may include, for example, design and layout, images obtained under licence from third parties and signatures. We have made all reasonable efforts to identify and label material owned by third parties.
You may distribute, remix and build upon this work. However, you must attribute the AIHW as the copyright holder of the work in compliance with our attribution policy available at <www.aihw.gov.au/copyright/>. The full terms and conditions of this licence are available at <http://creativecommons.org/licenses/by/3.0/au/>.
This publication is part of the Australian Institute of Health and Welfare’s Cancer series. A complete list of the Institute’s publications is available from the Institute’s website <www.aihw.gov.au>.
ISSN 2205-4855 (PDF) ISSN 1039-3307 (Print) ISBN 978-1-76054-429-4 (PDF) ISBN 978-1-76054-430-0 (Print)
Suggested citation Australian Institute of Health and Welfare 2018. Colorectal and other digestive-tract cancers. Cancer series no. 114. Cat. no. CAN 117. Canberra: AIHW.
Australian Institute of Health and Welfare Board Chair Director Mrs Louise Markus Mr Barry Sandison
Any enquiries relating to copyright or comments on this publication should be directed to: Australian Institute of Health and Welfare GPO Box 570 Canberra ACT 2601 Tel: (02) 6244 1000 Email: [email protected]
Published by the Australian Institute of Health and Welfare
This publication is printed in accordance with ISO 14001 (Environmental Management Systems) and ISO 9001 (Quality Management Systems). The paper is sourced from sustainably managed certified forests.
Please note that there is the potential for minor revisions of data in this report. Please check the online version at <www.aihw.gov.au> for any amendments.

iii
Contents Acknowledgments ................................................................................................................ v
Abbreviations ...................................................................................................................... vi Symbols .............................................................................................................................. vii Notes for tables and figures ............................................................................................. viii Summary ............................................................................................................................... x
Data at a glance .................................................................................................................. xv
1 Introduction ................................................................................................................... 1
1.1 Types of digestive-tract cancers reported ............................................................... 1
1.2 Impact of digestive-tract cancers on survivors ........................................................ 3
1.3 Data sources .......................................................................................................... 3
2 Colorectal (bowel) cancer (C18–C20) ........................................................................... 4
2.1 A picture of colorectal cancer in Australia ............................................................... 4
2.2 Screening, surveillance and diagnosis .................................................................. 10
2.3 Treatment ............................................................................................................. 13
2.4 Survivorship population ........................................................................................ 15
2.5 Burden from colorectal cancer .............................................................................. 16
3 Pancreatic cancer (C25) .............................................................................................. 19
3.1 A picture of pancreatic cancer in Australia ............................................................ 19
3.2 Treatment ............................................................................................................. 24
3.3 Survivorship population ........................................................................................ 26
3.4 Burden from pancreatic cancer ............................................................................. 26
4 Stomach cancer (C16) ................................................................................................. 29
4.1 A picture of stomach cancer in Australia ............................................................... 29
4.2 Treatment ............................................................................................................. 33
4.3 Survivorship population ........................................................................................ 35
4.4 Burden from stomach cancer ................................................................................ 36
5 Liver cancer (C22) ....................................................................................................... 39
5.1 A picture of liver cancer in Australia ...................................................................... 39
5.2 Treatment ............................................................................................................. 44
5.3 Survivorship population ........................................................................................ 46
5.4 Burden from liver cancer ...................................................................................... 47
iv
6 Oesophageal cancer (C15) .......................................................................................... 49
6.1 A picture of oesophageal cancer in Australia ........................................................ 49
6.2 Treatment ............................................................................................................. 53
6.3 Survivorship population ........................................................................................ 55
6.4 Burden from oesophageal cancer ......................................................................... 56
7 Cancer of the gallbladder and extrahepatic bile ducts (C23–C24) ........................... 59
7.1 A picture of cancer of the gallbladder and extrahepatic bile ducts in Australia ...... 59
7.2 Treatment ............................................................................................................. 63
7.3 Survivorship population ........................................................................................ 66
7.4 Burden from cancer of the gallbladder and extrahepatic bile ducts ....................... 67
8 Cancer of the small intestine (C17) ............................................................................ 69
8.1 A picture of cancer of the small intestine in Australia ............................................ 69
8.2 Treatment ............................................................................................................. 74
8.3 Survivorship population ........................................................................................ 76
8.4 Burden from cancer of the small intestine ............................................................. 76
9 Anal cancer (C21) ........................................................................................................ 78
9.1 A picture of anal cancer in Australia ..................................................................... 78
9.2 Treatment ............................................................................................................. 82
9.3 Survivorship population ........................................................................................ 84
9.4 Burden from anal cancer ...................................................................................... 85
10 Cancer of unspecified digestive organs (C26) .......................................................... 86
10.1 A picture of cancer of unspecified digestive organs in Australia ............................ 86
10.2 Treatment ............................................................................................................. 88
10.3 Survivorship population ........................................................................................ 89
Appendix A: Additional tables .......................................................................................... 90
Appendix B: Defining digestive-tract cancers ............................................................... 147
Appendix C: Data sources .............................................................................................. 150
Appendix D: Defining digestive-tract cancer hospitalisations ..................................... 154
Appendix E: Hospital-based colonoscopies ................................................................. 161
Glossary ............................................................................................................................ 163
References ........................................................................................................................ 166
List of tables ..................................................................................................................... 172
List of figures ................................................................................................................... 178
Related publications ........................................................................................................ 182
v
Acknowledgments This report was prepared by Natasha Bartlett, Ellen Connell, Justin Harvey, Harene Ranjithakumaran and Henry Wong, under the direction of Lynelle Moon. Substantial contributions were also made by Brett Davis, Rachel Kilo, Mark Short and the Australian Burden of Disease team.
The authors would like to thank all colleagues who commented on earlier drafts, including members of the Cancer Monitoring Advisory Group who provided expert advice and assistance in producing this document.
The support of the Australasian Association of Cancer Registries through providing cancer incidence data to the AIHW’s Australian Cancer Database is gratefully acknowledged.
vi
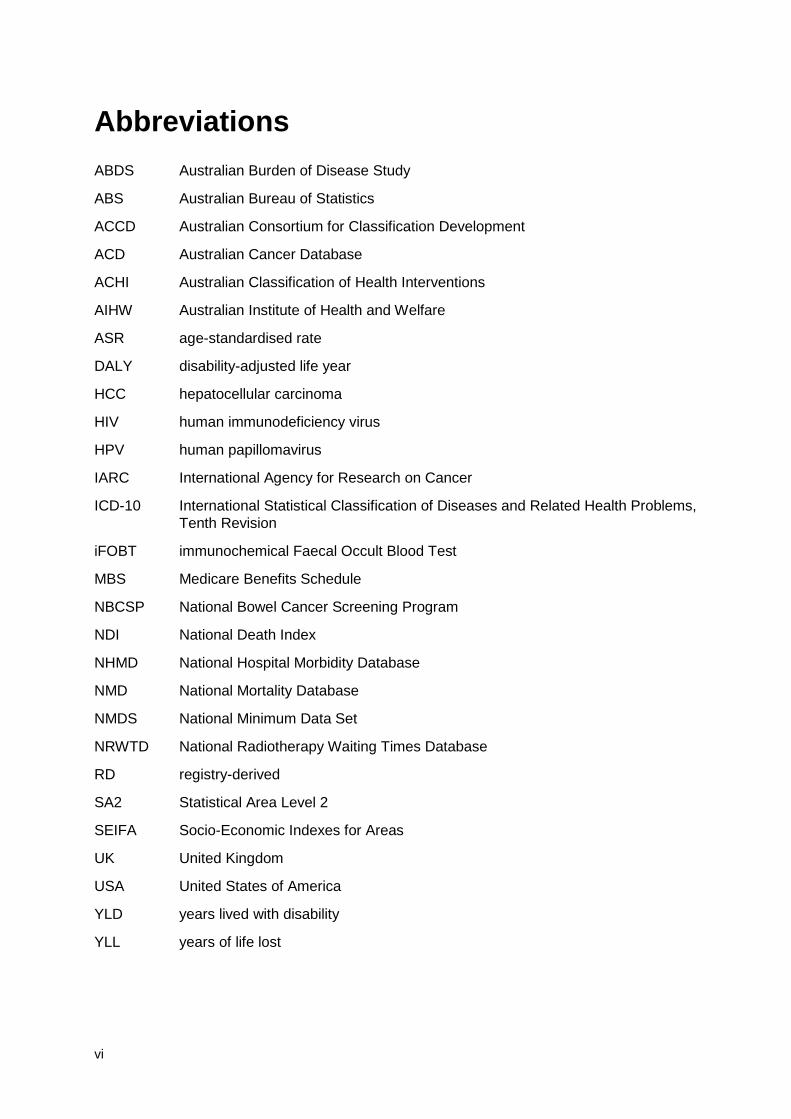
Abbreviations ABDS Australian Burden of Disease Study
ABS Australian Bureau of Statistics
ACCD Australian Consortium for Classification Development
ACD Australian Cancer Database
ACHI Australian Classification of Health Interventions
AIHW Australian Institute of Health and Welfare
ASR age-standardised rate
DALY disability-adjusted life year
HCC hepatocellular carcinoma
HIV human immunodeficiency virus
HPV human papillomavirus
IARC International Agency for Research on Cancer
ICD-10 International Statistical Classification of Diseases and Related Health Problems, Tenth Revision
iFOBT immunochemical Faecal Occult Blood Test
MBS Medicare Benefits Schedule
NBCSP National Bowel Cancer Screening Program
NDI National Death Index
NHMD National Hospital Morbidity Database
NMD National Mortality Database
NMDS National Minimum Data Set
NRWTD National Radiotherapy Waiting Times Database
RD registry-derived
SA2 Statistical Area Level 2
SEIFA Socio-Economic Indexes for Areas
UK United Kingdom
USA United States of America
YLD years lived with disability
YLL years of life lost

vii
Symbols — nil or rounded to zero
. . not applicable
n.p. not publishable because of small numbers, confidentiality or other concerns about the quality of the data

viii
Notes for tables and figures Notes for all the tables and figures are presented here, rather than as footnotes below each table and figure. Please refer to this section when reviewing tables and figures.
• The 2014 incidence data include estimates for NSW. • Deaths registered in 2014 and earlier are based on the final version of cause of death
data; deaths registered in 2015 and 2016 are based on revised and preliminary versions, respectively, and are subject to further revision by the ABS.
• Actual mortality data from 1998 to 2015 are based on the year of occurrence of the death and data for 2016 are based on the year of registration of the death.
• The 2015–2018 estimates for incidence are based on 2004–2013 incidence data. The 2017–2018 estimates for mortality are based on joinpoint analysis of 1994–2013 mortality data for males and 1995–2013 mortality data for females. Estimates for males and females may not sum to the total number of persons.
• Relative survival was calculated with the period method, using the period 2010–2014 (Brenner & Gefeller 1996). This method examines the survival experience of people who were alive at the beginning of a particular recent calendar period and who were diagnosed with cancer before this period. Note that this period does not contain incidence data for 2014 for NSW.
• Relative survival for registry-derived (RD) stage tables were calculated using the cohort method, using the period 2011–2016. In this method, a cohort of patients diagnosed with cancer is followed over time to estimate the proportion surviving for a selected timeframe (for example, 5 years).
• Observed survival was calculated for survival analysis by remoteness area and socioeconomic area. Observed survival was calculated using the period method, using the period 2010–2014. Note that this period does not contain incidence data for 2013–2014 for NSW because those data were not available. Records with Statistical Area Level 2 (SA2s) that were unknown or that could not be mapped to a remoteness area are excluded. Records with SA2s that were unknown or that could not be mapped to a socioeconomic group are excluded.
• Incidence and survival data by Indigenous status are for New South Wales, Victoria, Queensland, Western Australia and the Northern Territory only. Ninety per cent of Indigenous Australians live in these 5 jurisdictions.
• Cancer Institute New South Wales are currently investigating a potential issue with indigenous status and will determine any impacts to data released, when this work is completed.
• Mortality data by Indigenous status are for New South Wales, Queensland, Western Australia, South Australia and the Northern Territory only. Eighty-eight per cent of Indigenous Australians live in these 5 jurisdictions.
• Total count and age-standardised rate includes people whose Indigenous status was unknown. Therefore, tables by Indigenous status exclude people whose Indigenous status was unknown.
• Five-year relative survival rates are not calculated for Australians whose Indigenous status was unknown. Therefore, the Australia 5-year relative survival rate is not directly comparable to the Indigenous and non-Indigenous Australian 5-year relative survival rate.

ix
• Age-specific incidence, mortality and prevalence rates are expressed as number per 100,000 population
• Age-specific hospitalisation rates are expressed as number per 10,000 population. • Age-standardised incidence and mortality rates were age-standardised to the 2001
Australian Standard Population and are expressed as number per 100,000 population. • Age-standardised hospitalisation rates were age-standardised to the 2001 Australian
Standard Population and are expressed as number per 10,000 population. • Incidence and mortality rates are based on the Australia population as at 30 June.
Prevalence and hospitalisation rates are based on the Australian population as at 31 December.
• Remoteness areas are classified according to the 2011 Australian Statistical Geography Standard (ASGS) Remoteness Areas. Not all remoteness areas are represented in all jurisdictions. Disaggregation by remoteness area is based on SA2 of usual residence at time of diagnosis. The accuracy of these classifications decreases over time due to changes in infrastructure within SA2 boundaries since 2011.
• Socioeconomic groups are classified according to the SEIFA quintile using the Index of Relative Socioeconomic Disadvantage (IRSD). Disaggregation by SEIFA quintile is based on 2011 classifications of Statistical Areas Level 2 (SA2) of usual residence at time of diagnosis. The accuracy of these classifications decreases over time due to changes in infrastructure within SA2 boundaries since 2011.
• Male-to-female ratio is based on the proportion of prevalent counts between males and females.
• Hospitalisations for which the care type was reported as ‘Newborn with no qualified days’ and records for ‘Hospital boarders’ and ‘Posthumous organ procurement’ have been excluded from the analysis.
• Hospitalisations related to digestive-tract cancer are defined as those where the principal diagnosis (the diagnosis chiefly responsible for the episode of care) and the additional diagnosis (a diagnosis that coexists with the principal diagnosis or arises during the episode of care and affects the care) is a digestive-tract cancer.
• For radiotherapy tables, some providers report the primary site of cancer rather than the principal diagnosis.
• Burden of disease columns may not sum to the total due to rounding. • Attributable burden from multiple risk factors cannot be combined or added together due
to the complex pathways and interactions between risk factors. • See Appendix B for definition of digestive-tract cancer subsite and histology. • See Appendix D for definition of surgical and chemotherapy procedures. • Hospital codes were sourced from the ninth edition of the ACHI (ACCD 2014, 2015). • Stage data for colorectal cancer excludes cases identified from death certificates only,
cancer of the appendix (ICD-10 code C18.1), and colorectal cancers with a histology for which staging rules are not applicable.
• Hashed bars in the figures at the start of each chapter indicate the cancer that is explored in the chapter.
x
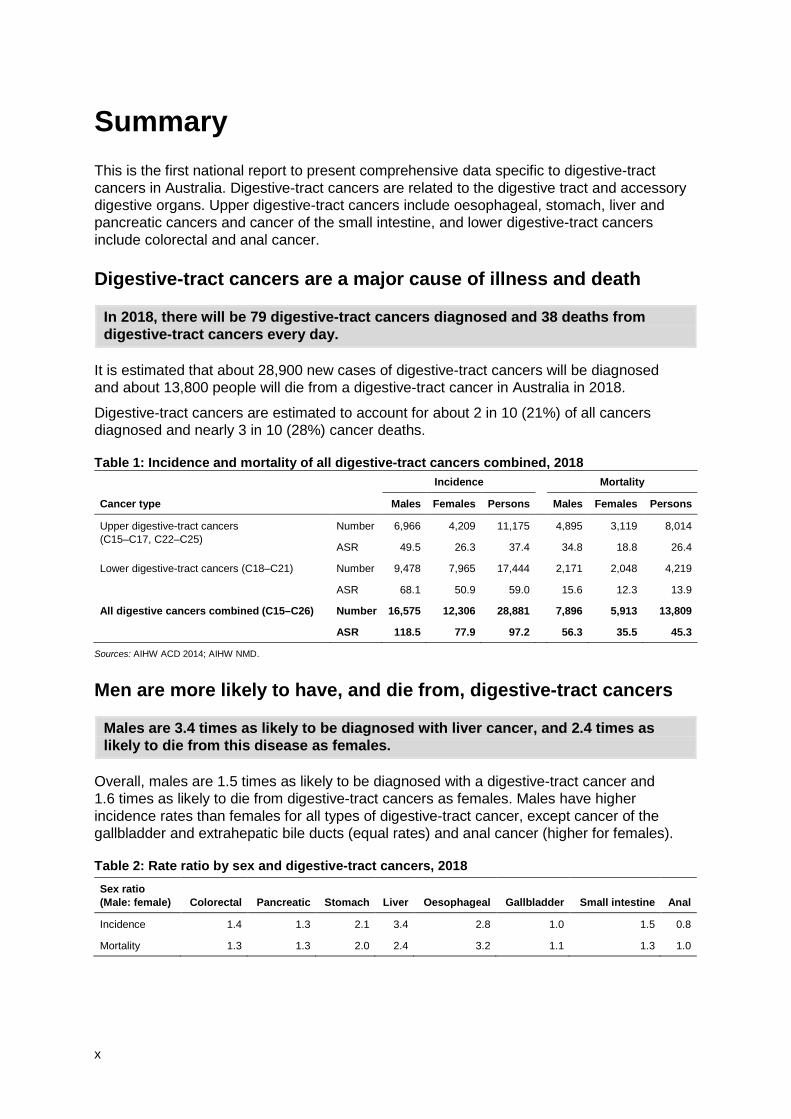
Summary This is the first national report to present comprehensive data specific to digestive-tract cancers in Australia. Digestive-tract cancers are related to the digestive tract and accessory digestive organs. Upper digestive-tract cancers include oesophageal, stomach, liver and pancreatic cancers and cancer of the small intestine, and lower digestive-tract cancers include colorectal and anal cancer.
Digestive-tract cancers are a major cause of illness and death
In 2018, there will be 79 digestive-tract cancers diagnosed and 38 deaths from digestive-tract cancers every day.
It is estimated that about 28,900 new cases of digestive-tract cancers will be diagnosed and about 13,800 people will die from a digestive-tract cancer in Australia in 2018.
Digestive-tract cancers are estimated to account for about 2 in 10 (21%) of all cancers diagnosed and nearly 3 in 10 (28%) cancer deaths.
Table 1: Incidence and mortality of all digestive-tract cancers combined, 2018 Incidence Mortality
Cancer type Males Females Persons Males Females Persons
Upper digestive-tract cancers (C15–C17, C22–C25)
Number 6,966 4,209 11,175 4,895 3,119 8,014
ASR 49.5 26.3 37.4 34.8 18.8 26.4
Lower digestive-tract cancers (C18–C21) Number 9,478 7,965 17,444 2,171 2,048 4,219
ASR 68.1 50.9 59.0 15.6 12.3 13.9
All digestive cancers combined (C15–C26) Number 16,575 12,306 28,881 7,896 5,913 13,809
ASR 118.5 77.9 97.2 56.3 35.5 45.3
Sources: AIHW ACD 2014; AIHW NMD.
Men are more likely to have, and die from, digestive-tract cancers
Males are 3.4 times as likely to be diagnosed with liver cancer, and 2.4 times as likely to die from this disease as females.
Overall, males are 1.5 times as likely to be diagnosed with a digestive-tract cancer and 1.6 times as likely to die from digestive-tract cancers as females. Males have higher incidence rates than females for all types of digestive-tract cancer, except cancer of the gallbladder and extrahepatic bile ducts (equal rates) and anal cancer (higher for females).
Table 2: Rate ratio by sex and digestive-tract cancers, 2018 Sex ratio (Male: female) Colorectal Pancreatic Stomach Liver Oesophageal Gallbladder Small intestine Anal
Incidence 1.4 1.3 2.1 3.4 2.8 1.0 1.5 0.8
Mortality 1.3 1.3 2.0 2.4 3.2 1.1 1.3 1.0

xi
Incidence and deaths increase with increasing age Incidence and mortality rates of digestive-tract cancers increase with age.
Source: Table A1.
Figure 1: Estimated age-specific incidence and mortality rates of upper and lower digestive-tract cancers, by age at diagnosis, 2018
Not all digestive-tract cancers are equal A person’s chance of survival depends on the type of digestive-tract cancer they have:
• colorectal cancer is the most commonly diagnosed digestive-tract cancer (59% of digestive-tract cancers) and has the highest 5-year relative survival rate of all digestive-tract cancers (69%)
• pancreatic cancer is the second most commonly diagnosed digestive-tract cancer (12% of digestive-tract cancers), and has the lowest 5-year relative survival of all specified digestive cancers (8.7%).
Source: Table A2.
Figure 2: Estimated incidence and mortality of digestive-tract cancers, by site, 2018
0–4
5–9
10–1
4
15–1
9
20–2
4
25–2
9
30–3
4
35–3
9
40–4
4
45–4
9
50–5
4
55–5
9
60–6
4
65–6
9
70–7
4
75–7
9
80–8
4
85+
Age group (years)
0100200300400500
Rate (per 100,000)
Mortality—Low er digestiveIncidence—Low er digestiveMortality—Upper digestiveIncidence—Upper digestive
digestiveIncidence—Upper
digestiveMortality—Upper
digestiveIncidence—Low er
digestiveMortality—Low er
0
5,000
10,000
15,000
20,000
Number
AnalColorectalSmall intestineGallbladderOesophagealLiverStomachPancreaticUpper digestive:
Lower digestive:
xii
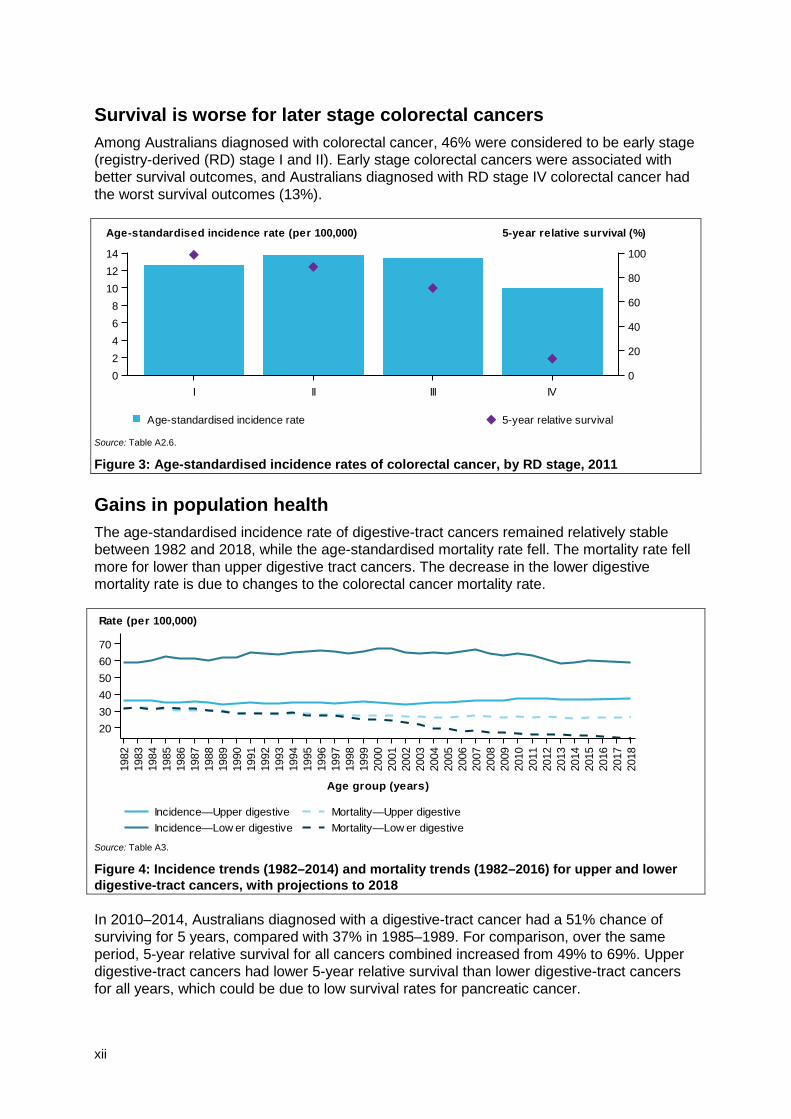
Survival is worse for later stage colorectal cancers Among Australians diagnosed with colorectal cancer, 46% were considered to be early stage (registry-derived (RD) stage I and II). Early stage colorectal cancers were associated with better survival outcomes, and Australians diagnosed with RD stage IV colorectal cancer had the worst survival outcomes (13%).
Source: Table A2.6.
Figure 3: Age-standardised incidence rates of colorectal cancer, by RD stage, 2011
Gains in population health The age-standardised incidence rate of digestive-tract cancers remained relatively stable between 1982 and 2018, while the age-standardised mortality rate fell. The mortality rate fell more for lower than upper digestive tract cancers. The decrease in the lower digestive mortality rate is due to changes to the colorectal cancer mortality rate.
Source: Table A3.
Figure 4: Incidence trends (1982–2014) and mortality trends (1982–2016) for upper and lower digestive-tract cancers, with projections to 2018
In 2010–2014, Australians diagnosed with a digestive-tract cancer had a 51% chance of surviving for 5 years, compared with 37% in 1985–1989. For comparison, over the same period, 5-year relative survival for all cancers combined increased from 49% to 69%. Upper digestive-tract cancers had lower 5-year relative survival than lower digestive-tract cancers for all years, which could be due to low survival rates for pancreatic cancer.
I II III IV02468
101214
Age-standardised incidence rate (per 100,000)
0
20
40
60
80
100
5-year relative survival (%)
Age-standardised incidence rate 5-year relative survival
1982
1983
1984
1985
1986
1987
1988
1989
1990
1991
1992
1993
1994
1995
1996
1997
1998
1999
2000
2001
2002
2003
2004
2005
2006
2007
2008
2009
2010
2011
2012
2013
2014
2015
2016
2017
2018
Age group (years)
203040506070
Rate (per 100,000)
Mortality—Low er digestiveIncidence—Low er digestiveMortality—Upper digestiveIncidence—Upper digestive
xiii
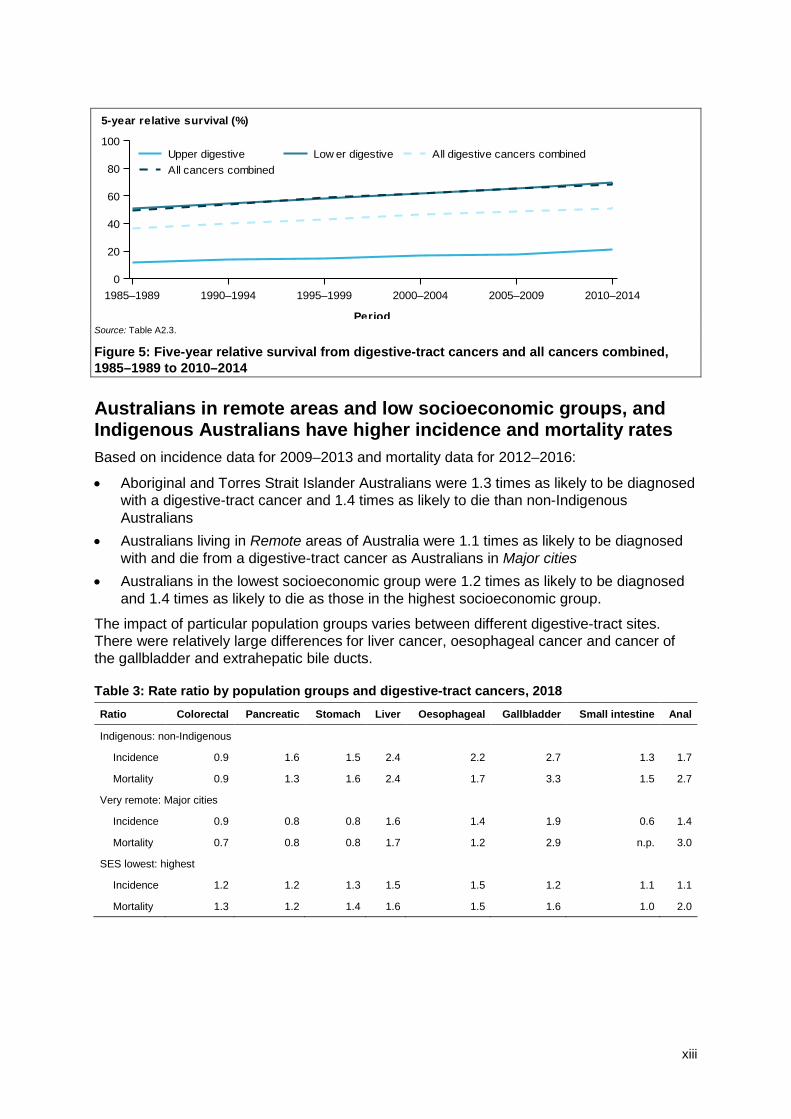
Source: Table A2.3.
Figure 5: Five-year relative survival from digestive-tract cancers and all cancers combined, 1985–1989 to 2010–2014
Australians in remote areas and low socioeconomic groups, and Indigenous Australians have higher incidence and mortality rates Based on incidence data for 2009–2013 and mortality data for 2012–2016:
• Aboriginal and Torres Strait Islander Australians were 1.3 times as likely to be diagnosed with a digestive-tract cancer and 1.4 times as likely to die than non-Indigenous Australians
• Australians living in Remote areas of Australia were 1.1 times as likely to be diagnosed with and die from a digestive-tract cancer as Australians in Major cities
• Australians in the lowest socioeconomic group were 1.2 times as likely to be diagnosed and 1.4 times as likely to die as those in the highest socioeconomic group.
The impact of particular population groups varies between different digestive-tract sites. There were relatively large differences for liver cancer, oesophageal cancer and cancer of the gallbladder and extrahepatic bile ducts.
Table 3: Rate ratio by population groups and digestive-tract cancers, 2018 Ratio Colorectal Pancreatic Stomach Liver Oesophageal Gallbladder Small intestine Anal
Indigenous: non-Indigenous
Incidence 0.9 1.6 1.5 2.4 2.2 2.7 1.3 1.7
Mortality 0.9 1.3 1.6 2.4 1.7 3.3 1.5 2.7
Very remote: Major cities
Incidence 0.9 0.8 0.8 1.6 1.4 1.9 0.6 1.4
Mortality 0.7 0.8 0.8 1.7 1.2 2.9 n.p. 3.0
SES lowest: highest
Incidence 1.2 1.2 1.3 1.5 1.5 1.2 1.1 1.1
Mortality 1.3 1.2 1.4 1.6 1.5 1.6 1.0 2.0
1985–1989 1990–1994 1995–1999 2000–2004 2005–2009 2010–2014
Period
0
20
40
60
80
100
5-year relative survival (%)
All cancers combinedAll digestive cancers combinedLow er digestiveUpper digestive
xiv
Treatment variation among digestive-tract cancers In 2016–17, there were 221,529 digestive-tract cancer-related hospitalisations. This accounted for 18% of all cancer-related hospitalisations in Australia. Treatment for patients with digestive-tract cancer included surgical procedures, chemotherapy procedures and radiotherapy. The type of surgical procedures varied between digestive-tract cancers.
In 2016–17 there were:
• 182,223 chemotherapy procedures related to a digestive-tract cancer, representing 27% of all chemotherapy procedures
• 6,213 radiotherapy courses where the principal diagnosis was a digestive-tract cancer, representing 10% of all radiotherapy courses.
High digestive-tract cancer burden In 2011, Australians lost 220,071 disability-adjusted life years (DALYs) due to premature death or living with disability due to digestive-tract cancers. This accounted for 26% of the burden of all cancers in Australia. The majority of the digestive-tract cancer burden was due to Australians dying prematurely. However, survivors of digestive-tract cancers often face ongoing burden as a result of the detection, diagnosis and treatment of cancer. For example, use of a stoma with a colostomy bag accounted for 8% of the non-fatal burden from colorectal cancer (AIHW 2017c).
A large proportion of the burden is potentially preventable A large proportion of the digestive-tract cancer burden (measured by DALYs) was potentially preventable due to modifiable risk factors. The risk factors that attributed the most to the burden of digestive-tract cancer burden were tobacco use, high body mass and alcohol use (AIHW 2017c).
• Tobacco use contributed to the burden of colorectal, pancreatic, stomach, liver and oesophageal cancer. Of particular note, 54% of oesophageal cancer burden was attributed to this risk factor.
• High body mass contributed to the burden of colorectal, pancreatic, liver, oesophageal cancer and cancer of the gallbladder and extrahepatic bile ducts.
• Alcohol use contributed to the burden of colorectal, liver and oesophageal cancer. Of particular note, 40% of liver cancer burden was attributable to this risk factor.

xv
Data at a glance Table 4: Summary of digestive-tract cancers in Australia
New cases
(2018) Deaths (2018)
5-year relative survival (%) (2010–2014)
5-year prevalence (end of 2013)
DALYs (2011)
Colorectal cancer (C18–C20) 17,004 4,129 69.4 52,892 92,422
Pancreatic cancer (C25) 3,364 3,006 8.7 3,045 44,428
Stomach cancer (C16) 2,332 1,078 29.5 4,150 22,583
Liver cancer (C22) 2,215 2,088 18.1 2,803 29,376
Oesophageal cancer (C15) 1,685 1,447 21.0 2,420 23,773
Cancer of the gallbladder and extrahepatic bile ducts (C23–C24) 931 262 19.7 1,329 4,287
Cancer of the small intestine (C17) 648 133 65.8 1,809 1,557
Anal cancer (C21) 440 90 67.4 1,498 1,645
Sources: AIHW ACD 2014; AIHW NMD.
Table 5: Trend summary for incidence, mortality and 5-year relative survival
Digestive-tract cancer Incidence rate Mortality rate 5-year relative survival (%)
Colorectal cancer (C18–C20) Stable Decrease Increase
Pancreatic cancer (C25) Stable Stable Increase
Stomach cancer (C16) Decrease Decrease Increase
Liver cancer (C22) Increase Increase Increase
Oesophageal cancer (C15) Stable Stable Increase
Cancer of the gallbladder and extrahepatic bile ducts (C23–C24) Stable Decrease Increase
Cancer of the small intestine (C17) Increase Stable Increase
Anal cancer (C21) Increase Stable Increase
Sources: AIHW ACD 2014; AIHW NMD.


Colorectal and other digestive-tract cancers 1
1 Introduction Cancer is a major cause of illness in Australia and has a substantial physical, psychological, social and economic impact on individuals, families and the community. As a disease group, cancer is the greatest contributor to the burden of disease, illness and injury in Australia, accounting for one-fifth (19%) of the burden (AIHW 2018a).
Cancer (also called malignant neoplasms) is a diverse group of diseases characterised by the uncontrolled proliferation of abnormal cells. These abnormal cells invade and damage the tissues around them, and spread to other parts of the body, which can cause further damage and potentially death. Digestive-tract cancers refer to various malignancies that can originate in the digestive organs and throughout the digestive tract.
This report is the latest in a series of reports developed under the framework of the National Centre for Monitoring Cancer, under the guidance of the Cancer Monitoring Advisory Group. It is the first national report to present key data specific to digestive-tract cancers (see Box 1.1 for details). Data are presented by sex, age, trend, characteristics (subsite, histology and stage) and population groups (Indigenous status, remoteness area and socioeconomic disadvantage).
Box 1.1: Aspects of cancer examined There are various ways to measure cancer within the Australian health system. For each type of cancer (forming individual chapters in this report), information is presented on:
incidence—the number of new cases occurring during a given period
mortality—the number of deaths occurring during a given period relative survival—a measure of the average survival experience of a population of people diagnosed with cancer, relative to the ‘average’ Australian of the same sex and age treatment—including hospitalisations, selected surgical procedures, chemotherapy and radiotherapy prevalence—the number of people alive who have been diagnosed with the cancer in the past 5 years burden of disease—the impact on the Australian population of dying prematurely or living with the cancer, and the burden attributed to modifiable risk factors. The chapter on colorectal cancer also includes information on participation in, and outcomes for, the National Bowel Cancer Screening Program (NBCSP) and on hospital-based colonoscopies used to identify bowel cancer.
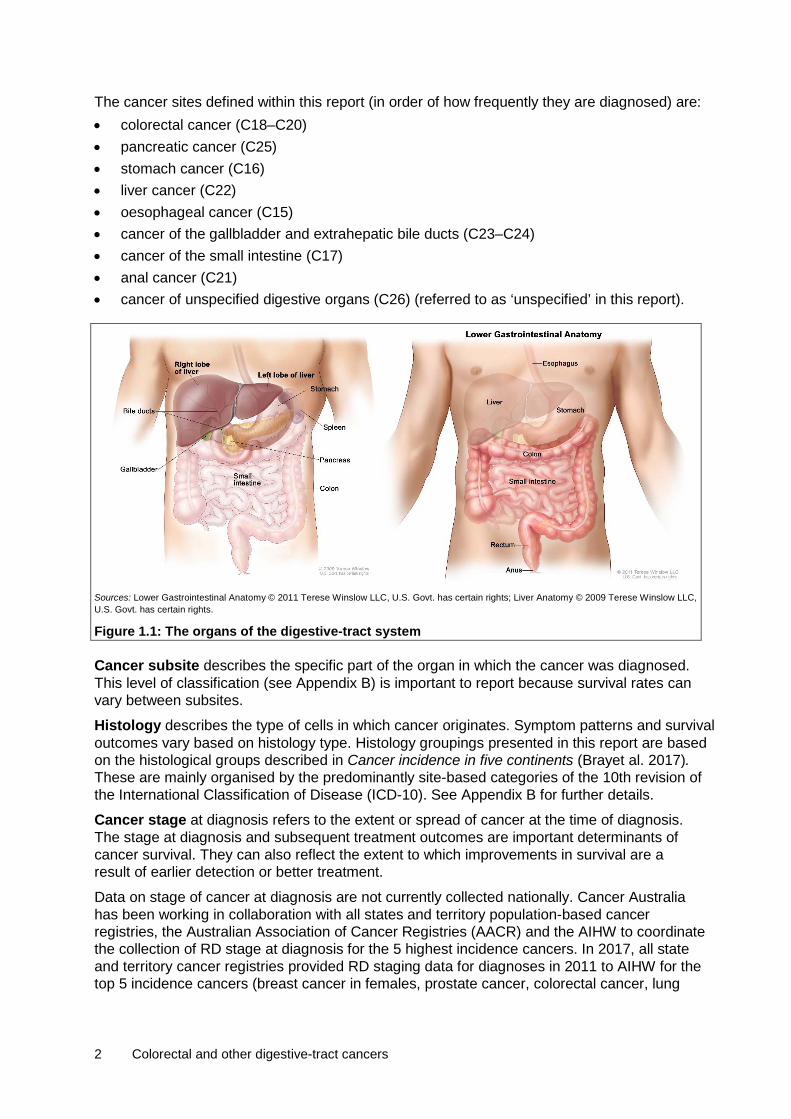
1.1 Types of digestive-tract cancers reported This report presents data on individual cancers within the digestive system. The digestive system (Figure 1.1) includes the digestive tract: a continuous tract, starting at the oesophagus and extending from the stomach to the intestines, and ending at the anus, through which food passes and waste exits. It also includes accessory digestive organs, such as the liver, gallbladder, pancreas and associated structures, which secrete digestive liquids and process substances absorbed by the organs of the digestive tract.
2 Colorectal and other digestive-tract cancers
The cancer sites defined within this report (in order of how frequently they are diagnosed) are: • colorectal cancer (C18–C20) • pancreatic cancer (C25) • stomach cancer (C16) • liver cancer (C22) • oesophageal cancer (C15) • cancer of the gallbladder and extrahepatic bile ducts (C23–C24) • cancer of the small intestine (C17) • anal cancer (C21) • cancer of unspecified digestive organs (C26) (referred to as ‘unspecified’ in this report).
Sources: Lower Gastrointestinal Anatomy © 2011 Terese Winslow LLC, U.S. Govt. has certain rights; Liver Anatomy © 2009 Terese Winslow LLC, U.S. Govt. has certain rights.
Figure 1.1: The organs of the digestive-tract system
Cancer subsite describes the specific part of the organ in which the cancer was diagnosed. This level of classification (see Appendix B) is important to report because survival rates can vary between subsites.
Histology describes the type of cells in which cancer originates. Symptom patterns and survival outcomes vary based on histology type. Histology groupings presented in this report are based on the histological groups described in Cancer incidence in five continents (Brayet al. 2017). These are mainly organised by the predominantly site-based categories of the 10th revision of the International Classification of Disease (ICD-10). See Appendix B for further details.
Cancer stage at diagnosis refers to the extent or spread of cancer at the time of diagnosis. The stage at diagnosis and subsequent treatment outcomes are important determinants of cancer survival. They can also reflect the extent to which improvements in survival are a result of earlier detection or better treatment.
Data on stage of cancer at diagnosis are not currently collected nationally. Cancer Australia has been working in collaboration with all states and territory population-based cancer registries, the Australian Association of Cancer Registries (AACR) and the AIHW to coordinate the collection of RD stage at diagnosis for the 5 highest incidence cancers. In 2017, all state and territory cancer registries provided RD staging data for diagnoses in 2011 to AIHW for the top 5 incidence cancers (breast cancer in females, prostate cancer, colorectal cancer, lung

Colorectal and other digestive-tract cancers 3
cancer and melanoma of the skin) for inclusion in the Australian Cancer Database (ACD). Colorectal cancer RD staging groups are based on a simplified TNM (tumour, nodes, metastasis) business rule, which uses 4 stages of increasing severity, based on the characteristics of the primary tumour (Bowel Cancer Australia 2017; UICC 2016). • stage I: cancer has invaded several layers of the bowel, but has not spread outside the
bowel wall • stage II: cancer has grown through the muscle layer of the bowel or rectum and invaded
nearby tissues, but has not spread to the lymph nodes • stage III: cancer has spread to nearby lymph nodes, but not to other parts of the body • stage IV: the cancer has spread from where it started in the colon or rectum to other
organs, often the liver and lungs, and/or non-regional lymph nodes.
1.2 Impact of digestive-tract cancers on survivors Survivors of digestive-tract cancers face a range of physical and psychosocial changes. Of the survivors who had surgery for major upper digestive-tract cancers, such as pancreatic, stomach and oesophageal cancers, some expressed experiencing difficulties consuming food and managing nutrition and body weight, with symptoms including premature feelings of fullness, reflux, malabsorption and loose movement of the bowels (diarrhoea) (Birgisson et al. 2007; Carey et al. 2013; Gusani et al. 2009; Wilson 2017). Of those who were treated for colorectal cancer, some identified worsened sexual function, urination and inability to achieve an erection or orgasm as additional issues (Bailey et al. 2015; Wilson 2017). Further effects of a range of digestive-tract cancers include fatigue (Jefford et al. 2008), pain and bloating from surgeries, the adjustment to resuming consuming food after having upper gastrointestinal cancer surgery and, for those who require a stoma, new knowledge, skill and commitment for stoma management (Carey et al. 2013; Wilson 2017).
Adjusting to these new physical requirements can lead to low confidence (Jefford et al. 2008) and body image issues. Survivors who have more digestive symptoms and diarrhoea have poorer body image. Low confidence and poor body image is directly associated with greater symptoms of stress, depression and anxiety (Benedict et al. 2016; Carey et al. 2013). Survivors of digestive-tract cancers, like other cancers, also face the stress associated with potential cancer recurrence (Jefford et al. 2008). Research has indicated that over one-third of colorectal cancer survivors are at risk of depression (Tsunoda et al. 2005) and that many survivors of colorectal cancer experience psychological distress that would warrant further psychological assessment and intervention (Lynch et al. 2008; Tian et al. 2007).
Survivors of digestive-tract cancers also face significant financial burden, associated with treatment, the cost of new clothes, medications and follow-up to maintain the changed body (Carey et al. 2013; Guy et al. 2014; Kale & Carroll 2016; Kent et al. 2013; Morgan 2009; Ramsey et al. 2013; Stone et al. 2017). Cancer survivors and their families also have to adjust to modifications that may be required at home and a change in medical support (Harvard University 2017; Jefford et al. 2008; Wilson 2017).
1.3 Data sources The results in this report were mainly produced using the ACD and the National Mortality Database (NMD). Other data sources include the National Hospital Morbidity Database, the National Radiotherapy Waiting Times Database and the National Bowel Cancer Screening Program database. See Appendix C for information about each of these data sources.
4 Colorectal and other digestive-tract cancers
2 Colorectal (bowel) cancer (C18–C20)
17,004 new cases 4,129 deaths
69% 5-year relative survival 92,422 DALYs
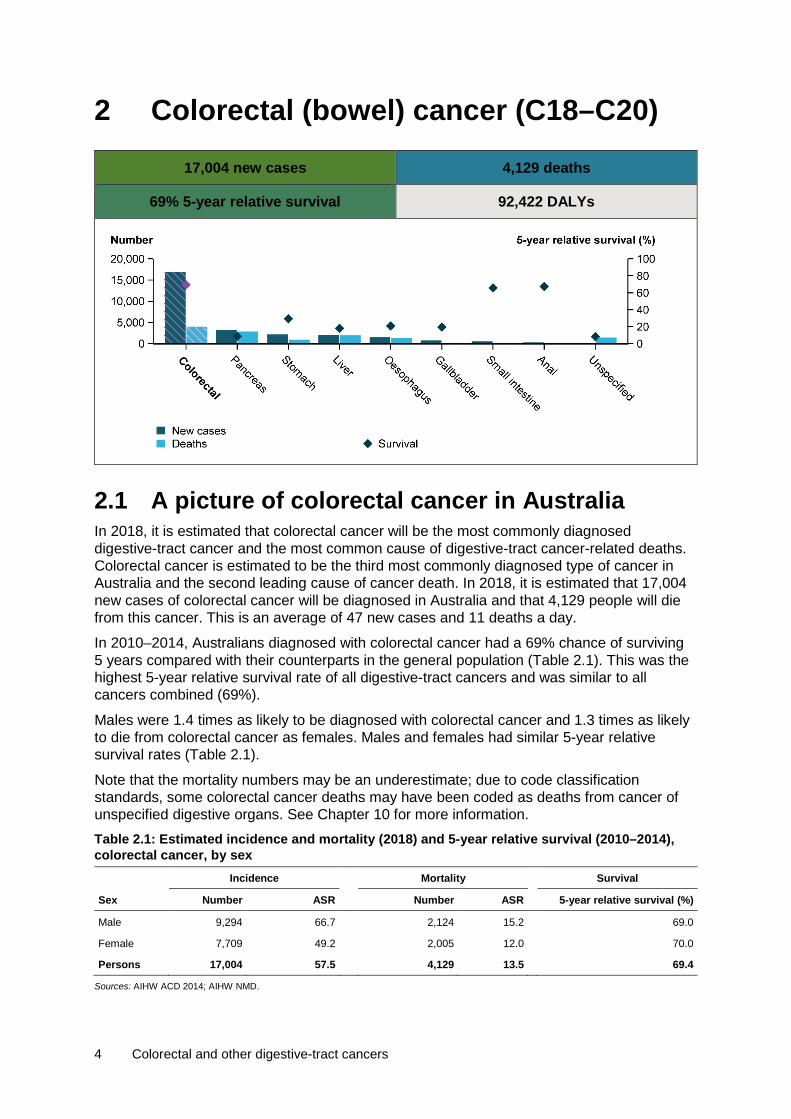
2.1 A picture of colorectal cancer in Australia In 2018, it is estimated that colorectal cancer will be the most commonly diagnosed digestive-tract cancer and the most common cause of digestive-tract cancer-related deaths. Colorectal cancer is estimated to be the third most commonly diagnosed type of cancer in Australia and the second leading cause of cancer death. In 2018, it is estimated that 17,004 new cases of colorectal cancer will be diagnosed in Australia and that 4,129 people will die from this cancer. This is an average of 47 new cases and 11 deaths a day.
In 2010–2014, Australians diagnosed with colorectal cancer had a 69% chance of surviving 5 years compared with their counterparts in the general population (Table 2.1). This was the highest 5-year relative survival rate of all digestive-tract cancers and was similar to all cancers combined (69%).
Males were 1.4 times as likely to be diagnosed with colorectal cancer and 1.3 times as likely to die from colorectal cancer as females. Males and females had similar 5-year relative survival rates (Table 2.1).
Note that the mortality numbers may be an underestimate; due to code classification standards, some colorectal cancer deaths may have been coded as deaths from cancer of unspecified digestive organs. See Chapter 10 for more information. Table 2.1: Estimated incidence and mortality (2018) and 5-year relative survival (2010–2014), colorectal cancer, by sex Incidence Mortality Survival
Sex Number ASR Number ASR 5-year relative survival (%)
Male 9,294 66.7 2,124 15.2 69.0
Female 7,709 49.2 2,005 12.0 70.0
Persons 17,004 57.5 4,129 13.5 69.4
Sources: AIHW ACD 2014; AIHW NMD.
Colorectal and other digestive-tract cancers 5
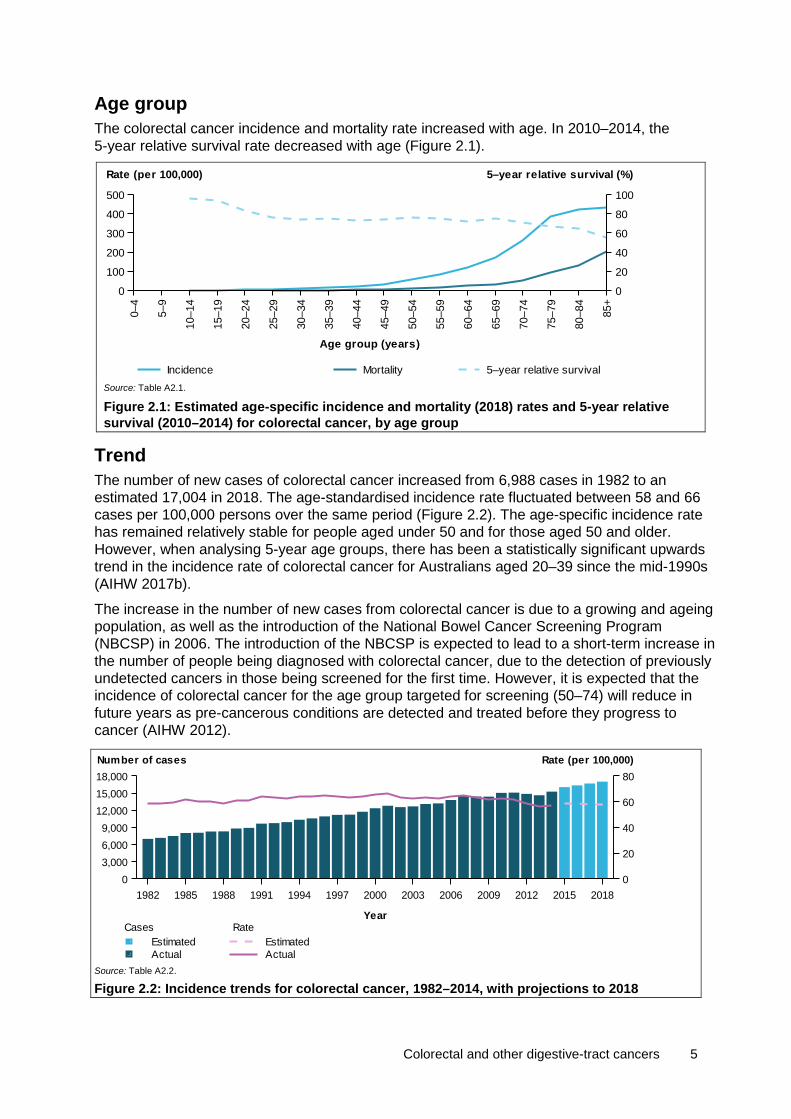
Age group The colorectal cancer incidence and mortality rate increased with age. In 2010–2014, the 5-year relative survival rate decreased with age (Figure 2.1).
Source: Table A2.1.
Figure 2.1: Estimated age-specific incidence and mortality (2018) rates and 5-year relative survival (2010–2014) for colorectal cancer, by age group
Trend The number of new cases of colorectal cancer increased from 6,988 cases in 1982 to an estimated 17,004 in 2018. The age-standardised incidence rate fluctuated between 58 and 66 cases per 100,000 persons over the same period (Figure 2.2). The age-specific incidence rate has remained relatively stable for people aged under 50 and for those aged 50 and older. However, when analysing 5-year age groups, there has been a statistically significant upwards trend in the incidence rate of colorectal cancer for Australians aged 20–39 since the mid-1990s (AIHW 2017b).
The increase in the number of new cases from colorectal cancer is due to a growing and ageing population, as well as the introduction of the National Bowel Cancer Screening Program (NBCSP) in 2006. The introduction of the NBCSP is expected to lead to a short-term increase in the number of people being diagnosed with colorectal cancer, due to the detection of previously undetected cancers in those being screened for the first time. However, it is expected that the incidence of colorectal cancer for the age group targeted for screening (50–74) will reduce in future years as pre-cancerous conditions are detected and treated before they progress to cancer (AIHW 2012).
Source: Table A2.2.
Figure 2.2: Incidence trends for colorectal cancer, 1982–2014, with projections to 2018
0–4
5–9
10–1
4
15–1
9
20–2
4
25–2
9
30–3
4
35–3
9
40–4
4
45–4
9
50–5
4
55–5
9
60–6
4
65–6
9
70–7
4
75–7
9
80–8
4
85+
Age group (years)
0
100
200
300
400
500
Rate (per 100,000)
0
20
40
60
80
100
5–year relative survival (%)
Incidence Mortality 5–year relative survival
1982 1985 1988 1991 1994 1997 2000 2003 2006 2009 2012 2015 2018
Year
03,0006,0009,000
12,00015,00018,000
0
20
40
60
80Number of cases Rate (per 100,000)
Rate
ActualEstimated
Cases
ActualEstimated
6 Colorectal and other digestive-tract cancers
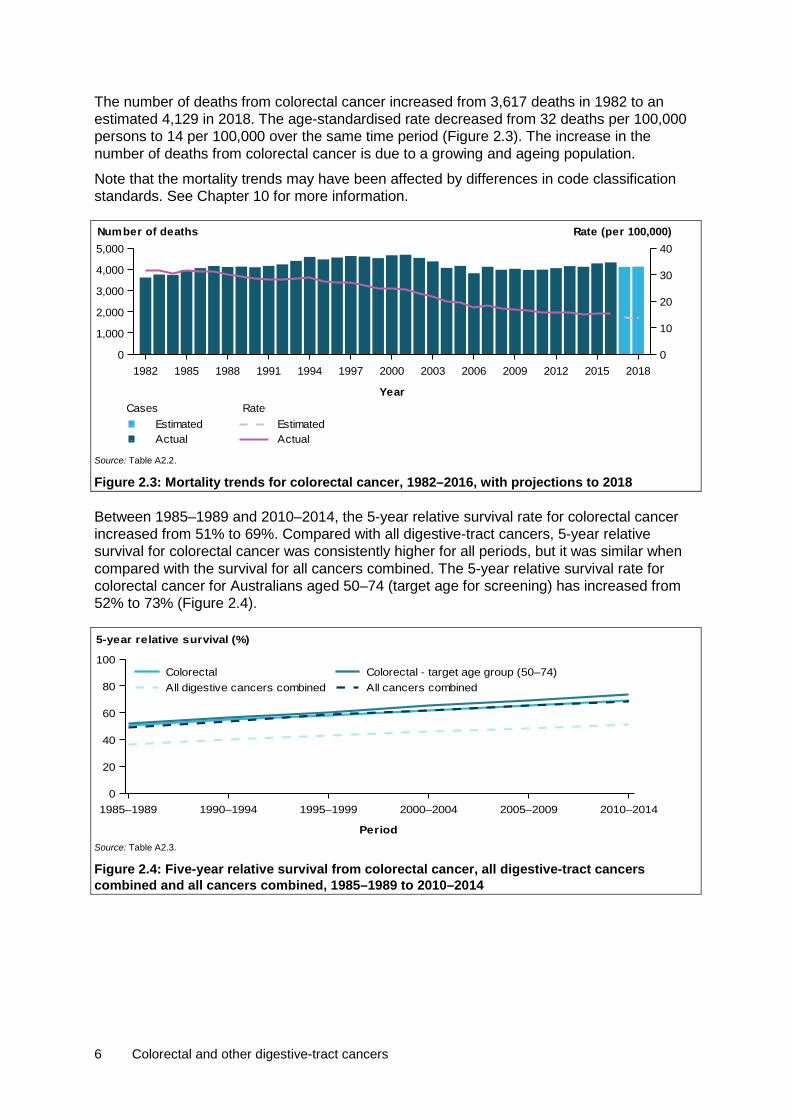
The number of deaths from colorectal cancer increased from 3,617 deaths in 1982 to an estimated 4,129 in 2018. The age-standardised rate decreased from 32 deaths per 100,000 persons to 14 per 100,000 over the same time period (Figure 2.3). The increase in the number of deaths from colorectal cancer is due to a growing and ageing population.
Note that the mortality trends may have been affected by differences in code classification standards. See Chapter 10 for more information.
Source: Table A2.2.
Figure 2.3: Mortality trends for colorectal cancer, 1982–2016, with projections to 2018
Between 1985–1989 and 2010–2014, the 5-year relative survival rate for colorectal cancer increased from 51% to 69%. Compared with all digestive-tract cancers, 5-year relative survival for colorectal cancer was consistently higher for all periods, but it was similar when compared with the survival for all cancers combined. The 5-year relative survival rate for colorectal cancer for Australians aged 50–74 (target age for screening) has increased from 52% to 73% (Figure 2.4).
Source: Table A2.3.
Figure 2.4: Five-year relative survival from colorectal cancer, all digestive-tract cancers combined and all cancers combined, 1985–1989 to 2010–2014
1982 1985 1988 1991 1994 1997 2000 2003 2006 2009 2012 2015 2018
Year
0
1,000
2,000
3,000
4,000
5,000
0
10
20
30
40Number of deaths Rate (per 100,000)
Rate
ActualEstimated
Cases
ActualEstimated
1985–1989 1990–1994 1995–1999 2000–2004 2005–2009 2010–2014
Period
0
20
40
60
80
100
5-year relative survival (%)
All cancers combinedAll digestive cancers combinedColorectal - target age group (50–74)Colorectal

Colorectal and other digestive-tract cancers 7
Characteristics
Subsite In 2013, the rectum was the most common colorectal cancer subsite, representing 26% of all colorectal cancer diagnoses. Australians diagnosed with this subsite had a 71% chance of surviving 5 years compared with their counterparts in the general population, which was higher than the 5-year relative survival rate for all colorectal cancers (69%).
Of all colorectal cancer subsites, 5-year relative survival was highest for the appendix (81%) and lowest for colon, unspecified (33%) (Figure 2.5). Colon, unspecified may have low survival rates because this category includes a relatively large proportion of cancers that are diagnosed at a later stage. Analysis of unpublished incidence data, indicates that this category is more common in older age groups.
Source: Table A2.4.
Figure 2.5: Incidence (2013) and 5-year relative survival (2010–2014) for colorectal cancer, by subsite
Histology In 2013, adenocarcinoma was the most common colorectal cancer histological type, representing 90% of all colorectal cancer cases diagnosed. Australians diagnosed with this histological type had a 71% chance of surviving 5 years compared with their counterparts in the general population. This was higher than the 5-year relative survival rate for all colorectal cancers (69%).
Five-year relative survival was highest for neuroendocrine neoplasms (87%) and lowest for unspecified neoplasms (8.3%) (Figure 2.6). Low survival rates for unspecified neoplasms may reflect cancers unsuitable for biopsy, treatment in patients with advanced disease at diagnosis or significant comorbidities. Analysis of unpublished incidence data indicates that unspecified neoplasms are more common in older age groups.
Caecum
Appendix
Ascending colon
Hepatic f lexure
Transverse colon
Splenic f lexure
Descending colon
Sigmoid colon
Colon, unspecif ied
Rectosigmoid junction
Rectum
0
1,000
2,000
3,000
4,000
Number
020406080100
5-year relative survival (%)
Number of new cases 5-year relative survival

8 Colorectal and other digestive-tract cancers
Source: Table A2.5.
Figure 2.6: Incidence (2013) and 5-year relative survival (2010–2014) for colorectal cancer, by histology
Stage Among Australians diagnosed with colorectal cancer in 2011, 46% were considered to be early stage (registry-derived (RD) stage I and II). A similar proportion of colorectal cancers were RD stage I, II, or III (around 23% for each), and a lower proportion were stage IV cancers (18%). Registry-derived stage II was the most common colorectal cancer stage at diagnosis for both males and females.
Early stage colorectal cancer was associated with better survival outcomes. Five-year relative survival was highest for Australians diagnosed with RD stage I colorectal cancer (99%) and then decreased with each stage. Australians diagnosed with RD stage IV colorectal cancer had the worst prognosis (13%) of the 4 stages (Figure 2.7). A similar pattern has been found in international studies (Morris et al. 2013; Public Health England 2016).
Source: Table A2.6.
Figure 2.7: Age-standardised incidence rates (2011) and 5-year relative survival (2011–2016) of colorectal cancer, by RD stage and sex
The age-specific colorectal cancer incidence rate by RD stage generally increased with age. Australians aged 50 and over had a higher proportion of early stage colorectal cancers (RD stage I and stage II) than those aged under 50 (Figure 2.8).
Squamouscarcinomas
Adeno-endocrine
Neuro-carcinomas
OthercarcinomasUnspecif ied
neoplasmsUnspecif ied
0
5,000
10,000
15,000
Number
0
20
40
60
80
100
5-year relative survival (%)
Number of new cases 5-year relative survival
Males Females Persons0369
121518
Age-standardised incidence rate (per 100,000)
020406080100
5-year relative survival (%)
IVIIIIII
Age-standardised incidence rate
IVIIIIII
5-year relative survival

Colorectal and other digestive-tract cancers 9
Source: Table A2.8.
Figure 2.8: Age-specific incidence rates of colorectal cancer, by RD stage and age group, 2011
Five-year relative survival from colorectal cancer was high across all age groups for early stage cancers (RD stage I and stage II). Five-year relative survival was lowest for RD stage IV cancers for all age groups and decreased with increasing age (Figure 2.9).
Source: Table A2.7.
Figure 2.9: Five-year relative survival of colorectal cancer, by RD stage and age group, 2011–2016
Population groups
Indigenous status Non-Indigenous Australians living in the jurisdictions for which data were available (see notes on page vii for more details) were 1.1 times as likely to be diagnosed with colorectal cancer in 2009–2013 and 1.1 times as likely to die from colorectal cancer in 2012–2016 as Indigenous Australians. This was the opposite pattern to the all cancers combined incidence and mortality rate ratio, where Indigenous Australians were more likely to be diagnosed with and die from all cancers combined. Five-year relative survival was lower in Indigenous Australians (57%) than in non-Indigenous Australians (67%) (Table A2.9).
0–4
5–9
10–1
4
15–1
9
20–2
4
25–2
9
30–3
4
35–3
9
40–4
4
45–4
9
50–5
4
55–5
9
60–6
4
65–6
9
70–7
4
75–7
9
80–8
4
85+
Age group (years)
0
20
40
60
80
100
120
Rate (per 100,000)
IVIIIIII
0–39 40–44 45–49 50–54 55–59 60–64 65–69 70–74 75–79 80–84 85+
Age group (years)
0
20
40
60
80
100
Survival (%)
IVIIIIII
10 Colorectal and other digestive-tract cancers
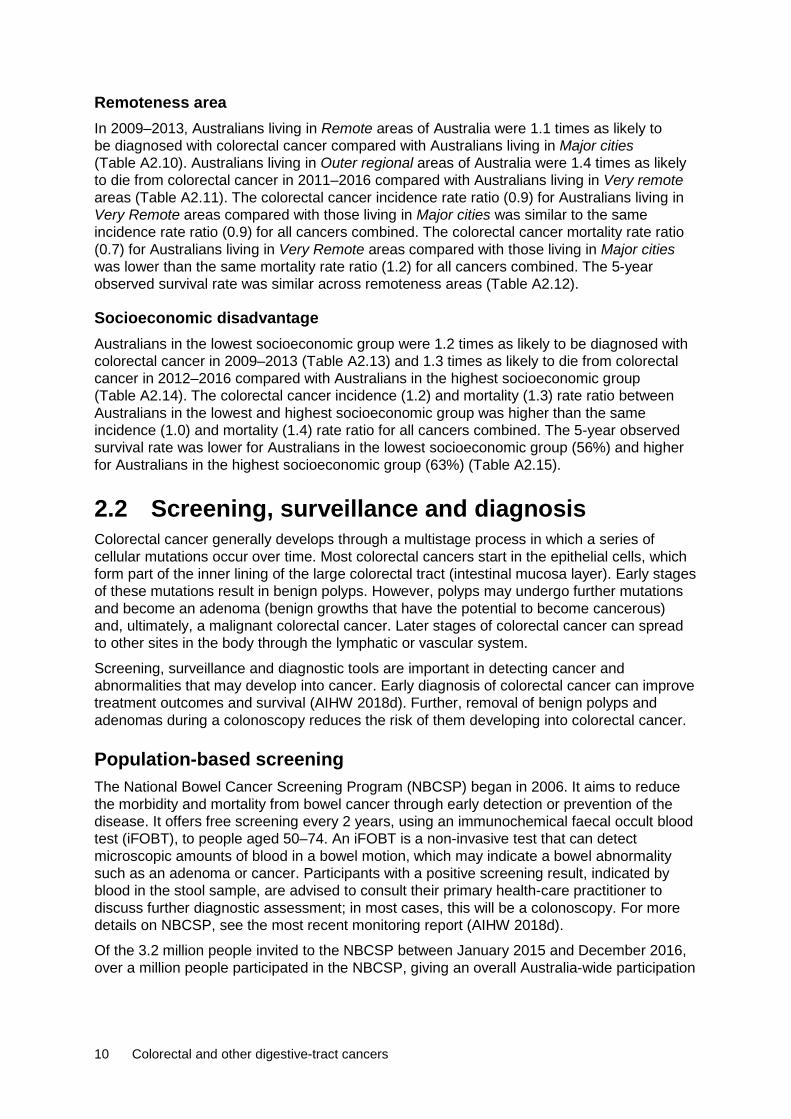
Remoteness area In 2009–2013, Australians living in Remote areas of Australia were 1.1 times as likely to be diagnosed with colorectal cancer compared with Australians living in Major cities (Table A2.10). Australians living in Outer regional areas of Australia were 1.4 times as likely to die from colorectal cancer in 2011–2016 compared with Australians living in Very remote areas (Table A2.11). The colorectal cancer incidence rate ratio (0.9) for Australians living in Very Remote areas compared with those living in Major cities was similar to the same incidence rate ratio (0.9) for all cancers combined. The colorectal cancer mortality rate ratio (0.7) for Australians living in Very Remote areas compared with those living in Major cities was lower than the same mortality rate ratio (1.2) for all cancers combined. The 5-year observed survival rate was similar across remoteness areas (Table A2.12).
Socioeconomic disadvantage Australians in the lowest socioeconomic group were 1.2 times as likely to be diagnosed with colorectal cancer in 2009–2013 (Table A2.13) and 1.3 times as likely to die from colorectal cancer in 2012–2016 compared with Australians in the highest socioeconomic group (Table A2.14). The colorectal cancer incidence (1.2) and mortality (1.3) rate ratio between Australians in the lowest and highest socioeconomic group was higher than the same incidence (1.0) and mortality (1.4) rate ratio for all cancers combined. The 5-year observed survival rate was lower for Australians in the lowest socioeconomic group (56%) and higher for Australians in the highest socioeconomic group (63%) (Table A2.15).
2.2 Screening, surveillance and diagnosis Colorectal cancer generally develops through a multistage process in which a series of cellular mutations occur over time. Most colorectal cancers start in the epithelial cells, which form part of the inner lining of the large colorectal tract (intestinal mucosa layer). Early stages of these mutations result in benign polyps. However, polyps may undergo further mutations and become an adenoma (benign growths that have the potential to become cancerous) and, ultimately, a malignant colorectal cancer. Later stages of colorectal cancer can spread to other sites in the body through the lymphatic or vascular system.
Screening, surveillance and diagnostic tools are important in detecting cancer and abnormalities that may develop into cancer. Early diagnosis of colorectal cancer can improve treatment outcomes and survival (AIHW 2018d). Further, removal of benign polyps and adenomas during a colonoscopy reduces the risk of them developing into colorectal cancer.
Population-based screening The National Bowel Cancer Screening Program (NBCSP) began in 2006. It aims to reduce the morbidity and mortality from bowel cancer through early detection or prevention of the disease. It offers free screening every 2 years, using an immunochemical faecal occult blood test (iFOBT), to people aged 50–74. An iFOBT is a non-invasive test that can detect microscopic amounts of blood in a bowel motion, which may indicate a bowel abnormality such as an adenoma or cancer. Participants with a positive screening result, indicated by blood in the stool sample, are advised to consult their primary health-care practitioner to discuss further diagnostic assessment; in most cases, this will be a colonoscopy. For more details on NBCSP, see the most recent monitoring report (AIHW 2018d).
Of the 3.2 million people invited to the NBCSP between January 2015 and December 2016, over a million people participated in the NBCSP, giving an overall Australia-wide participation

Colorectal and other digestive-tract cancers 11
rate of 41%. Participation was higher among those who had participated in the NBCSP before (AIHW 2018d).
In 2016, about 59,000 Australians returned a positive screening test, giving an 8.1% screening positivity rate. Of the people who received a positive screening test, 68% had reported a follow-up diagnostic assessment colonoscopy—a total of 39,928 people (AIHW 2018d). In 2016, of the data available for participants who had a diagnostic assessment colonoscopy, there were 228 confirmed cancers (0.6% of people who had a diagnostic assessment), 1,182 suspected cancers (3.2%) and 4,439 adenomas (12.1%) detected (AIHW 2018d).
Research into the impact of national screening found that NBCSP invitees (particularly those who participated) had less risk of dying from bowel cancer, and were more likely to have less-advanced bowel cancers when diagnosed, than non-invitees. These findings confirm that the NBCSP is contributing to reducing morbidity and mortality from bowel cancer in Australia (AIHW 2018b).
Hospital-based colonoscopies A colonoscopy is a commonly performed diagnostic assessment procedure to examine the bowel using a special scope (colonoscope). In a cancer context, colonoscopies are used as a diagnostic assessment tool for patients presenting with symptoms of colorectal cancer, as a surveillance tool in those at increased risk for colorectal cancer, and as a follow-up to positive iFOBT, including for those in the NBCSP. Colonoscopies are commonly used to diagnose colorectal cancer and the abnormalities, such as benign tumours and polyps, that may mutate further and result in colorectal cancer. Colonoscopies are carried out in admitted hospital settings and also in private clinics on an outpatient basis. Information on colonoscopies performed on admitted hospital patients is available through the National Hospital Morbidity Database (NHMD). This excludes people who received colonoscopies in a non-admitted setting.
In 2016–17, there were 838,975 colonoscopies performed in an admitted patient setting in hospitals. Of the colonoscopies performed in 2016–17, 1 in 4 (28%) were related to the treatment, surveillance and diagnosis of colorectal tumours (Table A2.16). The most common principal reason for the hospital admission in which a colonoscopy occurred was a non-malignant colorectal tumour (12%), followed by surveillance for intestinal cancer (where no tumour was found) (7.4%); polyp of colon (4.7%); follow-up after treatment for digestive-tract cancer (2.7%) and colorectal cancer (1.4%). Other reasons for the hospital admission in which a colonoscopy occurred included other diseases of the digestive system (such as dark blood in the stool or vomit) (7.3%); follow-up for treatment of a non-cancer condition (7.1%); abdominal and pelvic pain (7.0%); and other faecal abnormalities (6.9%) (Table A2.16). Other faecal abnormalities includes patients with a positive iFOBT (and no other symptoms), along with other stool abnormalities. It is expected that some of these colonoscopies are due to patients screening for colorectal cancer through the NBCSP, but it is currently not possible to separate them from patients presenting for other reasons.
There were more colonoscopies related to the treatment, surveillance and diagnosis of colorectal tumours performed in males than females. Colorectal tumour-related colonoscopies accounted for 31% of all colonoscopies performed in males and 26% for females. A higher proportion of colonoscopies performed had an associated diagnosis of colorectal tumours in males than in females, while a higher proportion of the colonoscopies performed in females had a recorded diagnosis of cancer surveillance (Table A2.16).
The number of colorectal tumour-related colonoscopies performed increased with age. About 7 in 10 (68%) colorectal tumour-related colonoscopies occurred for people within the NBCSP
12 Colorectal and other digestive-tract cancers
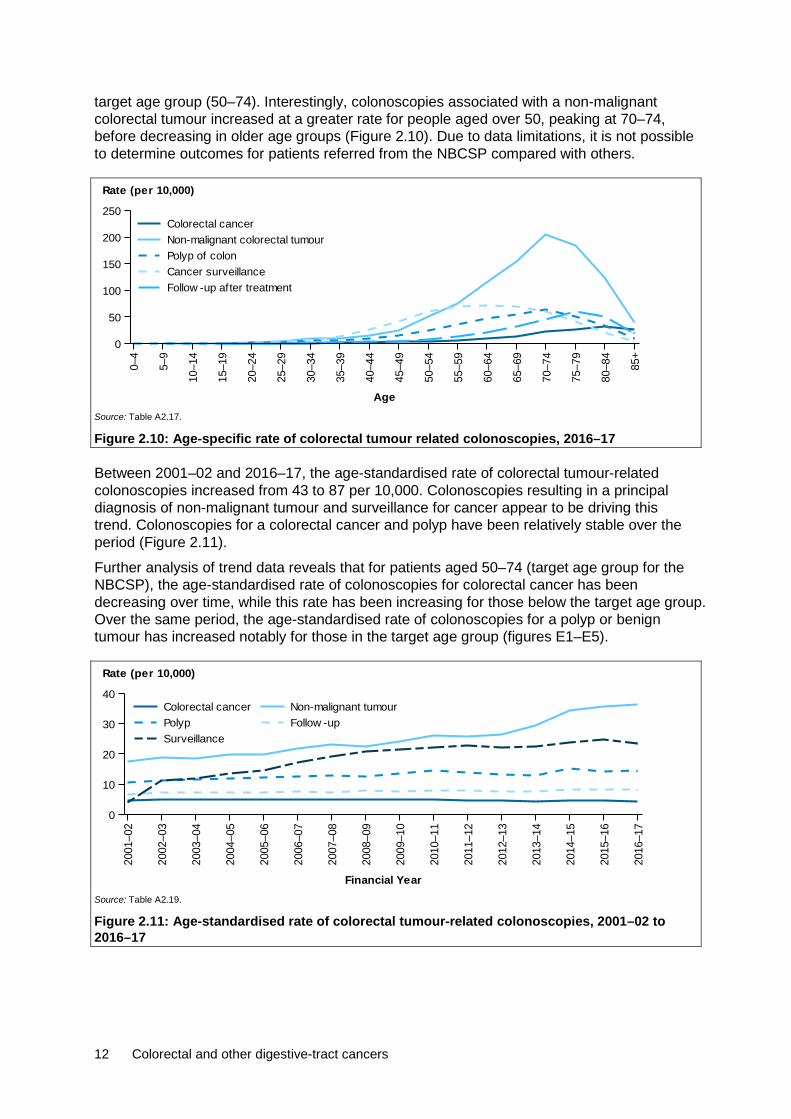
target age group (50–74). Interestingly, colonoscopies associated with a non-malignant colorectal tumour increased at a greater rate for people aged over 50, peaking at 70–74, before decreasing in older age groups (Figure 2.10). Due to data limitations, it is not possible to determine outcomes for patients referred from the NBCSP compared with others.
Source: Table A2.17.
Figure 2.10: Age-specific rate of colorectal tumour related colonoscopies, 2016–17
Between 2001–02 and 2016–17, the age-standardised rate of colorectal tumour-related colonoscopies increased from 43 to 87 per 10,000. Colonoscopies resulting in a principal diagnosis of non-malignant tumour and surveillance for cancer appear to be driving this trend. Colonoscopies for a colorectal cancer and polyp have been relatively stable over the period (Figure 2.11).
Further analysis of trend data reveals that for patients aged 50–74 (target age group for the NBCSP), the age-standardised rate of colonoscopies for colorectal cancer has been decreasing over time, while this rate has been increasing for those below the target age group. Over the same period, the age-standardised rate of colonoscopies for a polyp or benign tumour has increased notably for those in the target age group (figures E1–E5).
Source: Table A2.19.
Figure 2.11: Age-standardised rate of colorectal tumour-related colonoscopies, 2001–02 to 2016–17
0–4
5–9
10–1
4
15–1
9
20–2
4
25–2
9
30–3
4
35–3
9
40–4
4
45–4
9
50–5
4
55–5
9
60–6
4
65–6
9
70–7
4
75–7
9
80–8
4
85+
Age
0
50
100
150
200
250
Rate (per 10,000)
Follow -up after treatmentCancer surveillancePolyp of colonNon-malignant colorectal tumourColorectal cancer
2001
–02
2002
–03
2003
–04
2004
–05
2005
–06
2006
–07
2007
–08
2008
–09
2009
–10
2010
–11
2011
–12
2012
–13
2013
–14
2014
–15
2015
–16
2016
–17
Financial Year
0
10
20
30
40
Rate (per 10,000)
SurveillanceFollow -upPolypNon-malignant tumourColorectal cancer
Colorectal and other digestive-tract cancers 13
For those colorectal tumour-related colonoscopies where the principal reason for care was cancer surveillance, the most common additional diagnosis given as a reason for cancer surveillance was a family history of digestive-tract cancer (81%), followed by a personal history of polyps of the colon (4.5%) (Table A2.18). Due to data limitations, it is not possible to determine whether those with a family history of cancer or personal history of polyps have higher rates of cancer detection.
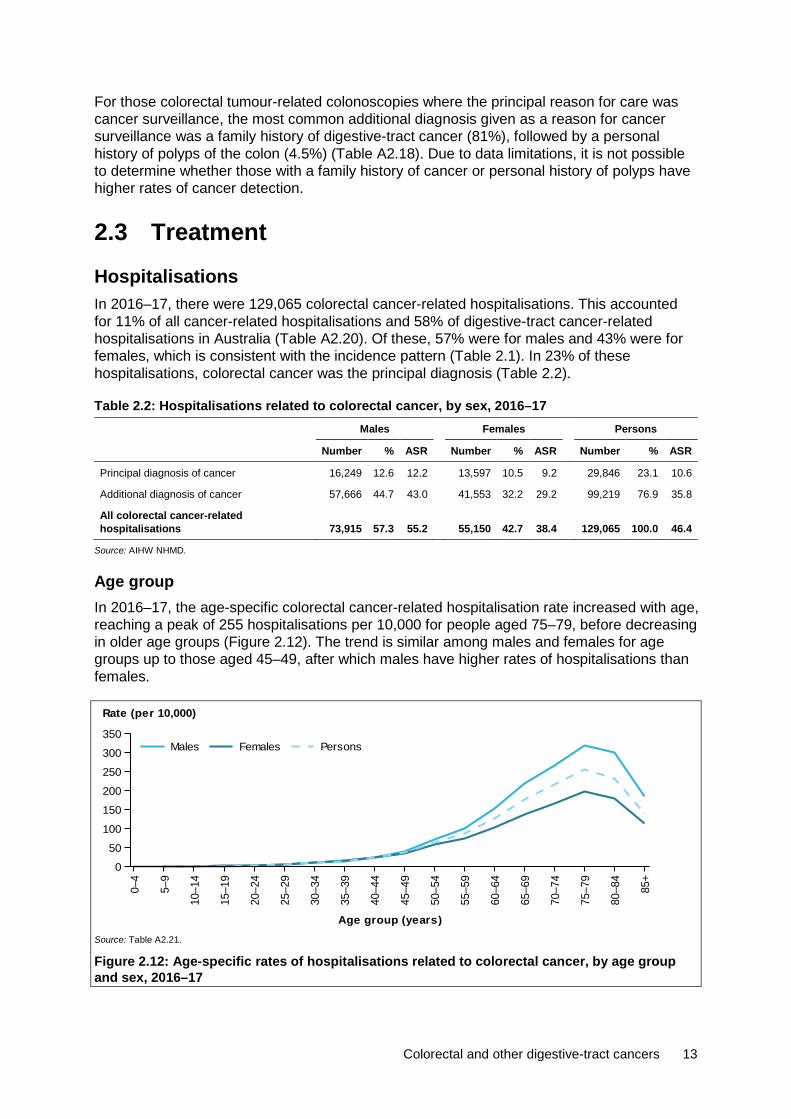
2.3 Treatment Hospitalisations In 2016–17, there were 129,065 colorectal cancer-related hospitalisations. This accounted for 11% of all cancer-related hospitalisations and 58% of digestive-tract cancer-related hospitalisations in Australia (Table A2.20). Of these, 57% were for males and 43% were for females, which is consistent with the incidence pattern (Table 2.1). In 23% of these hospitalisations, colorectal cancer was the principal diagnosis (Table 2.2).
Table 2.2: Hospitalisations related to colorectal cancer, by sex, 2016–17 Males Females Persons
Number % ASR Number % ASR Number % ASR
Principal diagnosis of cancer 16,249 12.6 12.2 13,597 10.5 9.2 29,846 23.1 10.6
Additional diagnosis of cancer 57,666 44.7 43.0 41,553 32.2 29.2 99,219 76.9 35.8
All colorectal cancer-related hospitalisations 73,915 57.3 55.2 55,150 42.7 38.4 129,065 100.0 46.4
Source: AIHW NHMD.
Age group In 2016–17, the age-specific colorectal cancer-related hospitalisation rate increased with age, reaching a peak of 255 hospitalisations per 10,000 for people aged 75–79, before decreasing in older age groups (Figure 2.12). The trend is similar among males and females for age groups up to those aged 45–49, after which males have higher rates of hospitalisations than females.
Source: Table A2.21.
Figure 2.12: Age-specific rates of hospitalisations related to colorectal cancer, by age group and sex, 2016–17
0–4
5–9
10–1
4
15–1
9
20–2
4
25–2
9
30–3
4
35–3
9
40–4
4
45–4
9
50–5
4
55–5
9
60–6
4
65–6
9
70–7
4
75–7
9
80–8
4
85+
Age group (years)
0
50
100
150
200
250
300
350
Rate (per 10,000)
PersonsFemalesMales
14 Colorectal and other digestive-tract cancers
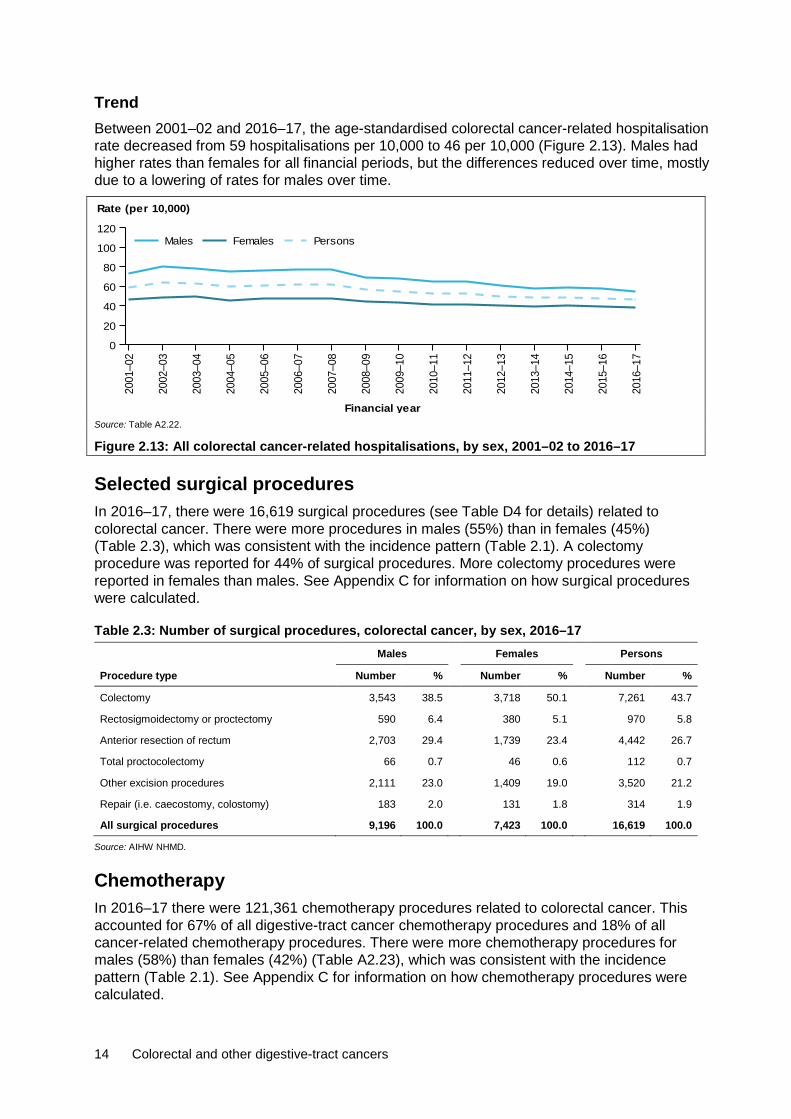
Trend Between 2001–02 and 2016–17, the age-standardised colorectal cancer-related hospitalisation rate decreased from 59 hospitalisations per 10,000 to 46 per 10,000 (Figure 2.13). Males had higher rates than females for all financial periods, but the differences reduced over time, mostly due to a lowering of rates for males over time.
Source: Table A2.22.
Figure 2.13: All colorectal cancer-related hospitalisations, by sex, 2001–02 to 2016–17
Selected surgical procedures In 2016–17, there were 16,619 surgical procedures (see Table D4 for details) related to colorectal cancer. There were more procedures in males (55%) than in females (45%) (Table 2.3), which was consistent with the incidence pattern (Table 2.1). A colectomy procedure was reported for 44% of surgical procedures. More colectomy procedures were reported in females than males. See Appendix C for information on how surgical procedures were calculated.
Table 2.3: Number of surgical procedures, colorectal cancer, by sex, 2016–17 Males Females Persons
Procedure type Number % Number % Number %
Colectomy 3,543 38.5 3,718 50.1 7,261 43.7
Rectosigmoidectomy or proctectomy 590 6.4 380 5.1 970 5.8
Anterior resection of rectum 2,703 29.4 1,739 23.4 4,442 26.7
Total proctocolectomy 66 0.7 46 0.6 112 0.7
Other excision procedures 2,111 23.0 1,409 19.0 3,520 21.2
Repair (i.e. caecostomy, colostomy) 183 2.0 131 1.8 314 1.9
All surgical procedures 9,196 100.0 7,423 100.0 16,619 100.0
Source: AIHW NHMD.
Chemotherapy In 2016–17 there were 121,361 chemotherapy procedures related to colorectal cancer. This accounted for 67% of all digestive-tract cancer chemotherapy procedures and 18% of all cancer-related chemotherapy procedures. There were more chemotherapy procedures for males (58%) than females (42%) (Table A2.23), which was consistent with the incidence pattern (Table 2.1). See Appendix C for information on how chemotherapy procedures were calculated.
2001
–02
2002
–03
2003
–04
2004
–05
2005
–06
2006
–07
2007
–08
2008
–09
2009
–10
2010
–11
2011
–12
2012
–13
2013
–14
2014
–15
2015
–16
2016
–17
Financial year
0
20
40
60
80
100
120
Rate (per 10,000)
PersonsFemalesMales

Colorectal and other digestive-tract cancers 15
Radiotherapy In 2016–17, there were 2,929 radiotherapy courses where the principal diagnosis was colorectal cancer. This accounted for 4.6% of all radiotherapy courses provided and 47% of all digestive-tract cancer-related radiotherapy courses. More radiotherapy courses were provided to males than females (Table A2.24). Of the radiotherapy courses, 70% of these courses were for a principal diagnosis of rectal cancer (AIHW, unpublished data).
2.4 Survivorship population The combined effect of several factors—increasing incidence, decreasing mortality, improving survival and developments in treatment—is leading to an increase in the population who has ever been diagnosed with cancer. This increasing proportion of the population will require ongoing treatments, support and long-term follow-up care. Cancer survivorship focuses on the health and wellbeing of a person living with and beyond cancer. Family members and caregivers are also part of the survivorship experience (Cancer Australia 2017). The number of people living with the effects of a diagnosis of cancer can be estimated using prevalence data. Please note that prevalence data reported in this report refers only to people alive who have been previously diagnosed with cancer and excludes family members and caregivers. Therefore, the true number living with the effects of cancer could be larger.
At the end of 2013, there were 52,892 people alive who were diagnosed with colorectal cancer in the previous 5 years. Five-year prevalence was 1.2 times higher for males than for females (Table 2.4), which is consistent with the incidence pattern (Table 2.1).
Table 2.4: Limited-duration prevalence of colorectal cancer, by sex, as at end of 2013 Males Females Persons
Number % of
cases Rate Number % of
cases Rate Number % of
cases Rate
1-year prevalence 6,998 54.4 60.4 5,867 45.6 50.1 12,865 100.0 55.2
5-year prevalence 29,037 54.9 250.7 23,855 45.1 203.6 52,892 100.0 227.0
32-year prevalence 70,672 52.9 610.2 62,957 47.1 537.4 133,629 100.0 573.6
Source: AIHW ACD 2014.
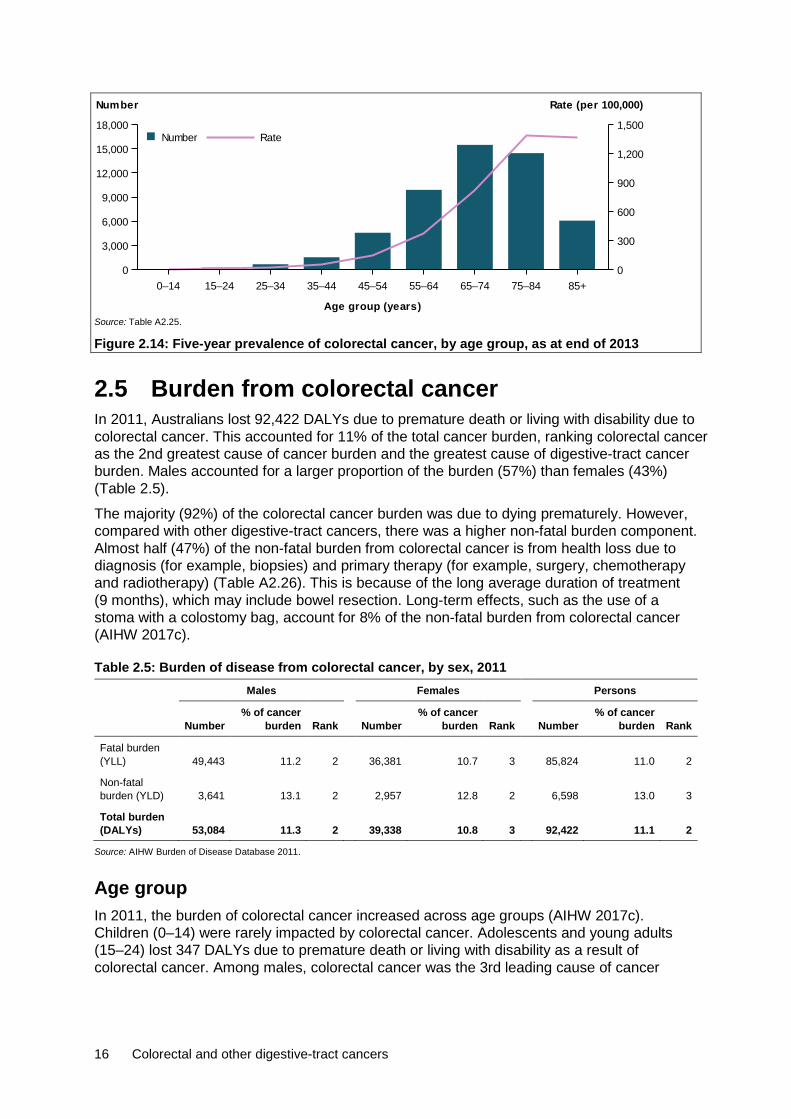
Age group Five-year prevalence rates for colorectal cancer increased with age from age group 0–14 to age group 75–84, before decreasing slightly for those aged 85 and older (Figure 2.14). People aged 75 or older accounted for 39% of the 5-year prevalent cases of colorectal cancer.
16 Colorectal and other digestive-tract cancers
Source: Table A2.25.
Figure 2.14: Five-year prevalence of colorectal cancer, by age group, as at end of 2013
2.5 Burden from colorectal cancer In 2011, Australians lost 92,422 DALYs due to premature death or living with disability due to colorectal cancer. This accounted for 11% of the total cancer burden, ranking colorectal cancer as the 2nd greatest cause of cancer burden and the greatest cause of digestive-tract cancer burden. Males accounted for a larger proportion of the burden (57%) than females (43%) (Table 2.5).
The majority (92%) of the colorectal cancer burden was due to dying prematurely. However, compared with other digestive-tract cancers, there was a higher non-fatal burden component. Almost half (47%) of the non-fatal burden from colorectal cancer is from health loss due to diagnosis (for example, biopsies) and primary therapy (for example, surgery, chemotherapy and radiotherapy) (Table A2.26). This is because of the long average duration of treatment (9 months), which may include bowel resection. Long-term effects, such as the use of a stoma with a colostomy bag, account for 8% of the non-fatal burden from colorectal cancer (AIHW 2017c).
Table 2.5: Burden of disease from colorectal cancer, by sex, 2011 Males Females Persons
Number % of cancer
burden Rank Number % of cancer
burden Rank Number % of cancer
burden Rank
Fatal burden (YLL) 49,443 11.2 2 36,381 10.7 3 85,824 11.0 2
Non-fatal burden (YLD) 3,641 13.1 2 2,957 12.8 2 6,598 13.0 3
Total burden (DALYs) 53,084 11.3 2 39,338 10.8 3 92,422 11.1 2
Source: AIHW Burden of Disease Database 2011.
Age group In 2011, the burden of colorectal cancer increased across age groups (AIHW 2017c). Children (0–14) were rarely impacted by colorectal cancer. Adolescents and young adults (15–24) lost 347 DALYs due to premature death or living with disability as a result of colorectal cancer. Among males, colorectal cancer was the 3rd leading cause of cancer
0–14 15–24 25–34 35–44 45–54 55–64 65–74 75–84 85+
Age group (years)
0
3,000
6,000
9,000
12,000
15,000
18,000
Number
0
300
600
900
1,200
1,500
Rate (per 100,000)
RateNumber

Colorectal and other digestive-tract cancers 17
burden, accounting for 7% of the total burden. Among females, it was the 8th leading cause of cancer burden, accounting for 2.5% of the total burden.
Adults (25–64) lost 38,844 DALYs due to premature death or living with disability as a result of colorectal cancer. Among males, colorectal cancer was the 2nd leading cause of cancer burden, accounting for 11% of the total burden. Among females, it was the 3rd leading cause of cancer burden, accounting for 10% of the total burden.
Older adults (65+) lost 53,221 DALYs due to premature death or living with disability as a result of colorectal cancer. Among males and females, colorectal cancer was the 3rd leading cause of cancer burden, accounting for 12% of the total burden (Table A2.27).
Contribution of risk factors to colorectal cancer burden Certain personal and lifestyle factors are associated with an increased risk of colorectal cancer. In particular, high-calorie diets comprised of a greater intake of meat, especially processed meats, and little fruit and vegetables as well as a high consumption of alcoholic beverages are linked to an increased risk of developing colorectal cancer. Australian-based research has indicated that 18% of colorectal cancers diagnosed were attributable to red and processed meat consumption (Nagle et al. 2015). Furthermore, excessive body fat and physical inactivity contribute to the enhanced risk of diagnosis. Smoking (including passive smoking) and use of smokeless tobacco are other lifestyle factors that may increase the risk of colorectal cancer (AIHW 2017c; IARC 2014; WCRF 2018).
The Australian Burden of Disease Study (ABDS) 2011 analysed 17 preventable risk factors and their contribution to the cancer burden. As a person can have more than 1 risk factor, and many risk factors are interrelated, the burden attributable to different risk factors cannot be simply added together. Cancers were only linked to a risk factor if there was sufficient evidence of a causal association (AIHW 2016b, 2017c). See the Burden of cancer in Australia (AIHW 2016b) for details on how risk factors are calculated.
In Australia, after adjusting for interrelated risk factors, about 51% of colorectal cancer burden in 2011 is estimated to be attributable to 8 risk factors combined (AIHW, unpublished data). Of these risk factors, physical inactivity and high body mass contributed the most individually to colorectal cancer burden in 2011 (16% and 13% of the colorectal cancer burden, respectively, although, because they are likely to be interrelated, their combined burden will be less than the sum of the individual burden estimates). A greater proportion of the colorectal cancer burden in males (18%) was due to high body mass than in females (6%) (Table 2.6).

18 Colorectal and other digestive-tract cancers
Table 2.6: Colorectal cancer burden attributed to selected risk factors, 2011 Males Females Persons
Risk factor Attributable
DALYs
% of colorectal
cancer burden
Attributable DALYs
% of colorectal
cancer burden
Attributable DALYs
% of colorectal
cancer burden
Physical inactivity(a) 8,363 15.8 6,640 16.9 15,003 16.2
High body mass(a) 9,307 17.5 2,513 6.4 11,819 12.8
Diet low in milk 5,821 11.0 4,393 11.2 10,214 11.1
Diet low in fibre 5,127 9.7 3,855 9.8 8,982 9.7
Tobacco use 3,466 6.5 3,747 9.5 7,213 7.8
Diet high in processed meat 4,744 8.9 2,380 6.1 7,124 7.7
Alcohol use(a) 2,562 4.8 2,448 6.2 5,010 5.4
Diet high in red meat 2,518 4.7 1,081 2.7 3,600 3.9
(a) Estimates for alcohol use, physical inactivity and high body mass are based on revised methods and improvements developed as part of extension projects done by the AIHW to look into the impact of various risk factors on chronic conditions (AIHW 2017e, 2017f, 2018c). These estimates will differ from those presented in earlier publications from the ABDS 2011 (AIHW 2016a).
Sources: AIHW ABDS 2011; AIHW (2016a, 2017d, 2017e, 2018b).
Other risk factors for colorectal cancer include occupational exposures to carcinogenic and/or toxic chemicals, industrial processes and ionising radiation (from, for example, diagnostic X-rays, working in the nuclear industry and natural sources) (IARC 2014). Certain genetic mutations increase the susceptibility of diagnosis. Around 20% of colorectal cancers can be attributed to a hereditary component (IARC 2014; Weitz et al. 2005).

Colorectal and other digestive-tract cancers 19
3 Pancreatic cancer (C25)
3,364 new cases 3,006 deaths
8.7% 5-year relative survival 44,428 DALYs
3.1 A picture of pancreatic cancer in Australia In 2018, it is estimated that pancreatic cancer will be the 2nd most commonly diagnosed digestive-tract cancer and the 2nd most common cause of digestive-tract cancer-related deaths. Pancreatic cancer is estimated to be the 10th most commonly diagnosed type of cancer in Australia and the fifth leading cause of cancer death. In 2018, it is estimated that 3,364 new cases of pancreatic cancer will be diagnosed in Australia and 3,006 people will die from this disease. This is an average of 9 new cases a day and 8 deaths a day.
In 2010–2014, Australians diagnosed with pancreatic cancer had an 8.7% chance of surviving 5 years compared with their counterparts in the general population. This was the 2nd lowest 5-year relative survival rate of all digestive-tract cancers and was lower than all cancers combined (69%).
Males were 1.3 times as likely to be diagnosed with pancreatic cancer and 1.3 times as likely to die from pancreatic cancer as females. Males and females had similar 5-year relative survival rates (Table 3.1).
Table 3.1: Estimated incidence and mortality (2018) and 5-year relative survival (2010–2014), pancreatic cancer, by sex Incidence Mortality Survival
Sex Number ASR Number ASR 5-year relative survival (%)
Male 1,774 12.6 1,563 11.1 8.7
Female 1,590 9.7 1,443 8.7 8.7
Persons 3,364 11.1 3,006 9.8 8.7
Sources: AIHW ACD 2014; AIHW NMD.
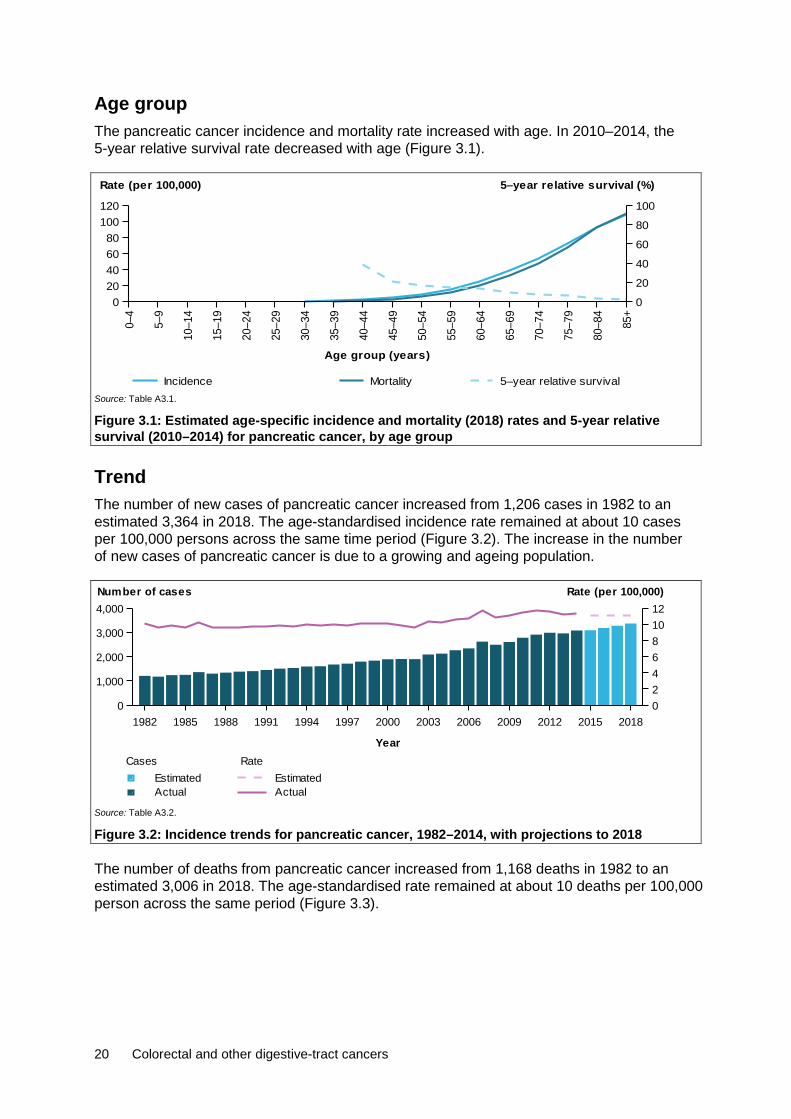
20 Colorectal and other digestive-tract cancers
Age group The pancreatic cancer incidence and mortality rate increased with age. In 2010–2014, the 5-year relative survival rate decreased with age (Figure 3.1).
Source: Table A3.1.
Figure 3.1: Estimated age-specific incidence and mortality (2018) rates and 5-year relative survival (2010–2014) for pancreatic cancer, by age group
Trend The number of new cases of pancreatic cancer increased from 1,206 cases in 1982 to an estimated 3,364 in 2018. The age-standardised incidence rate remained at about 10 cases per 100,000 persons across the same time period (Figure 3.2). The increase in the number of new cases of pancreatic cancer is due to a growing and ageing population.
Source: Table A3.2.
Figure 3.2: Incidence trends for pancreatic cancer, 1982–2014, with projections to 2018
The number of deaths from pancreatic cancer increased from 1,168 deaths in 1982 to an estimated 3,006 in 2018. The age-standardised rate remained at about 10 deaths per 100,000 person across the same period (Figure 3.3).
0–4
5–9
10–1
4
15–1
9
20–2
4
25–2
9
30–3
4
35–3
9
40–4
4
45–4
9
50–5
4
55–5
9
60–6
4
65–6
9
70–7
4
75–7
9
80–8
4
85+
Age group (years)
020406080
100120
Rate (per 100,000)
0
20
40
60
80
100
5–year relative survival (%)
Incidence Mortality 5–year relative survival
1982 1985 1988 1991 1994 1997 2000 2003 2006 2009 2012 2015 2018
Year
0
1,000
2,000
3,000
4,000
024681012
Number of cases Rate (per 100,000)
Rate
ActualEstimated
Cases
ActualEstimated
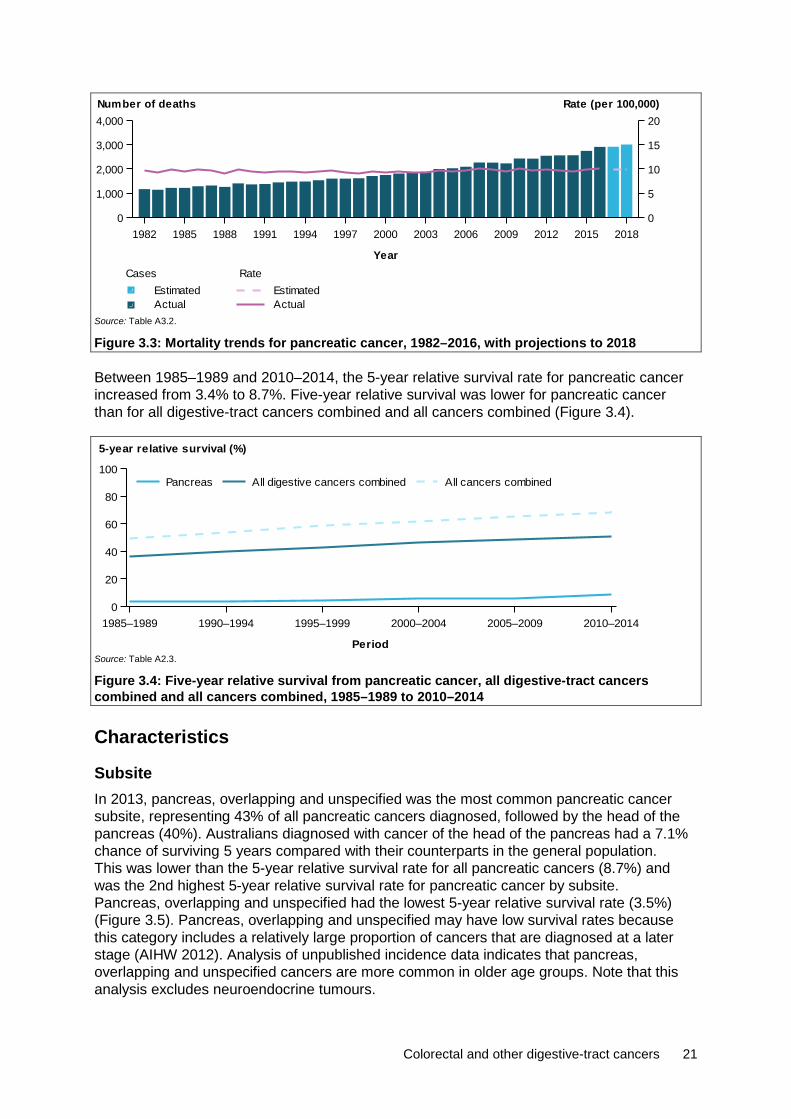
Colorectal and other digestive-tract cancers 21
Source: Table A3.2.
Figure 3.3: Mortality trends for pancreatic cancer, 1982–2016, with projections to 2018
Between 1985–1989 and 2010–2014, the 5-year relative survival rate for pancreatic cancer increased from 3.4% to 8.7%. Five-year relative survival was lower for pancreatic cancer than for all digestive-tract cancers combined and all cancers combined (Figure 3.4).
Source: Table A2.3.
Figure 3.4: Five-year relative survival from pancreatic cancer, all digestive-tract cancers combined and all cancers combined, 1985–1989 to 2010–2014
Characteristics
Subsite In 2013, pancreas, overlapping and unspecified was the most common pancreatic cancer subsite, representing 43% of all pancreatic cancers diagnosed, followed by the head of the pancreas (40%). Australians diagnosed with cancer of the head of the pancreas had a 7.1% chance of surviving 5 years compared with their counterparts in the general population. This was lower than the 5-year relative survival rate for all pancreatic cancers (8.7%) and was the 2nd highest 5-year relative survival rate for pancreatic cancer by subsite. Pancreas, overlapping and unspecified had the lowest 5-year relative survival rate (3.5%) (Figure 3.5). Pancreas, overlapping and unspecified may have low survival rates because this category includes a relatively large proportion of cancers that are diagnosed at a later stage (AIHW 2012). Analysis of unpublished incidence data indicates that pancreas, overlapping and unspecified cancers are more common in older age groups. Note that this analysis excludes neuroendocrine tumours.
1982 1985 1988 1991 1994 1997 2000 2003 2006 2009 2012 2015 2018
Year
0
1,000
2,000
3,000
4,000
0
5
10
15
20Number of deaths Rate (per 100,000)
Rate
ActualEstimated
Cases
ActualEstimated
1985–1989 1990–1994 1995–1999 2000–2004 2005–2009 2010–2014
Period
0
20
40
60
80
100
5-year relative survival (%)
All cancers combinedAll digestive cancers combinedPancreas
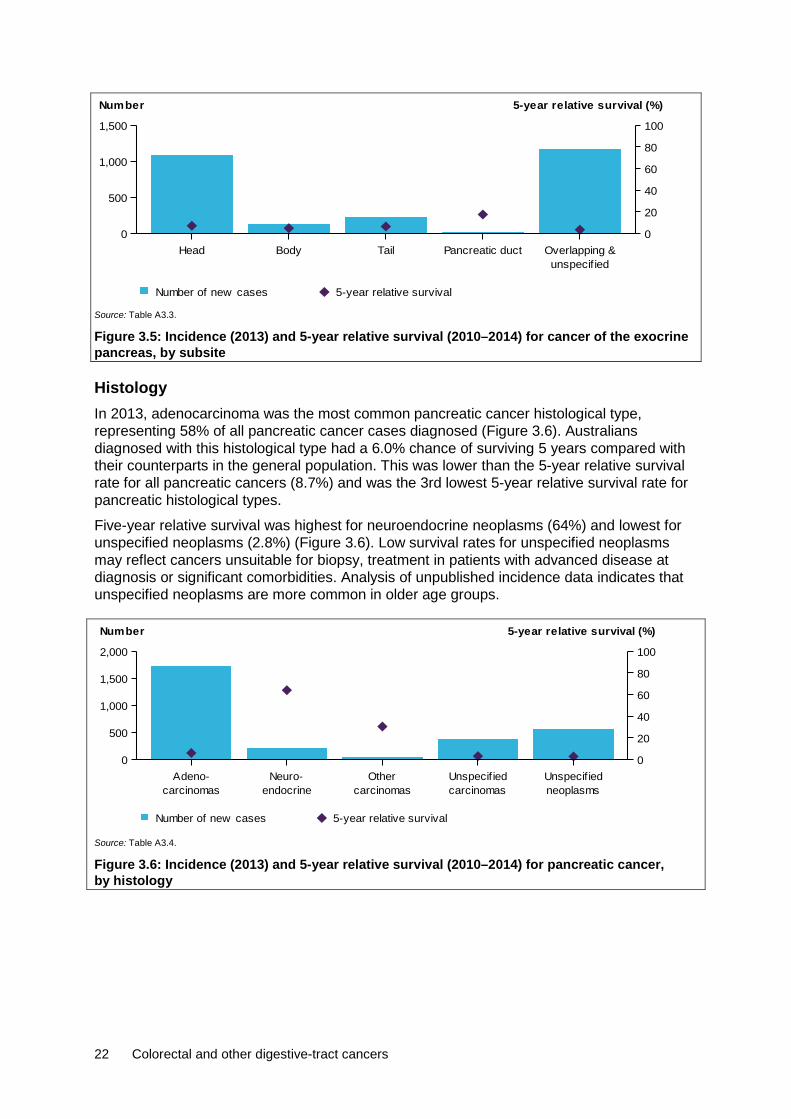
22 Colorectal and other digestive-tract cancers
Source: Table A3.3.
Figure 3.5: Incidence (2013) and 5-year relative survival (2010–2014) for cancer of the exocrine pancreas, by subsite
Histology In 2013, adenocarcinoma was the most common pancreatic cancer histological type, representing 58% of all pancreatic cancer cases diagnosed (Figure 3.6). Australians diagnosed with this histological type had a 6.0% chance of surviving 5 years compared with their counterparts in the general population. This was lower than the 5-year relative survival rate for all pancreatic cancers (8.7%) and was the 3rd lowest 5-year relative survival rate for pancreatic histological types.
Five-year relative survival was highest for neuroendocrine neoplasms (64%) and lowest for unspecified neoplasms (2.8%) (Figure 3.6). Low survival rates for unspecified neoplasms may reflect cancers unsuitable for biopsy, treatment in patients with advanced disease at diagnosis or significant comorbidities. Analysis of unpublished incidence data indicates that unspecified neoplasms are more common in older age groups.
Source: Table A3.4.
Figure 3.6: Incidence (2013) and 5-year relative survival (2010–2014) for pancreatic cancer, by histology
Head Body Tail Pancreatic ductunspecif ied
Overlapping &0
500
1,000
1,500
Number
0
20
40
60
80
100
5-year relative survival (%)
Number of new cases 5-year relative survival
carcinomasAdeno-
endocrineNeuro-
carcinomasOther
carcinomasUnspecif ied
neoplasmsUnspecif ied
0
500
1,000
1,500
2,000
Number
0
20
40
60
80
100
5-year relative survival (%)
Number of new cases 5-year relative survival
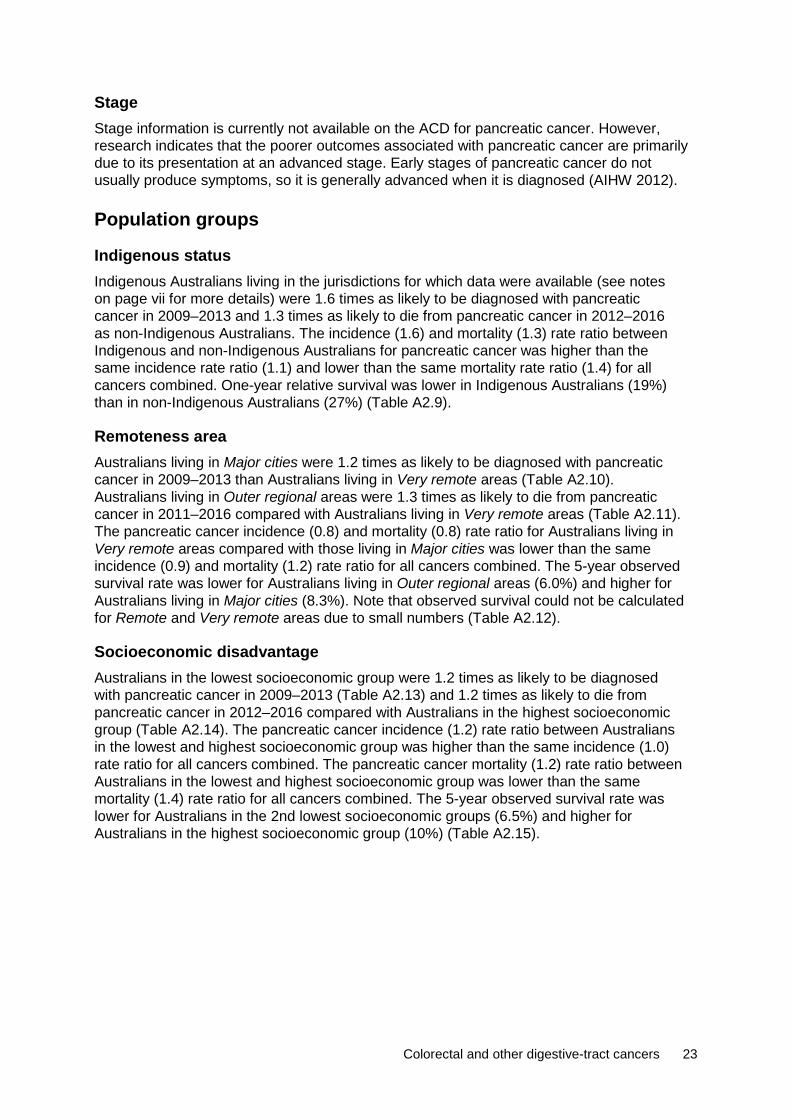
Colorectal and other digestive-tract cancers 23
Stage Stage information is currently not available on the ACD for pancreatic cancer. However, research indicates that the poorer outcomes associated with pancreatic cancer are primarily due to its presentation at an advanced stage. Early stages of pancreatic cancer do not usually produce symptoms, so it is generally advanced when it is diagnosed (AIHW 2012).
Population groups
Indigenous status Indigenous Australians living in the jurisdictions for which data were available (see notes on page vii for more details) were 1.6 times as likely to be diagnosed with pancreatic cancer in 2009–2013 and 1.3 times as likely to die from pancreatic cancer in 2012–2016 as non-Indigenous Australians. The incidence (1.6) and mortality (1.3) rate ratio between Indigenous and non-Indigenous Australians for pancreatic cancer was higher than the same incidence rate ratio (1.1) and lower than the same mortality rate ratio (1.4) for all cancers combined. One-year relative survival was lower in Indigenous Australians (19%) than in non-Indigenous Australians (27%) (Table A2.9).
Remoteness area Australians living in Major cities were 1.2 times as likely to be diagnosed with pancreatic cancer in 2009–2013 than Australians living in Very remote areas (Table A2.10). Australians living in Outer regional areas were 1.3 times as likely to die from pancreatic cancer in 2011–2016 compared with Australians living in Very remote areas (Table A2.11). The pancreatic cancer incidence (0.8) and mortality (0.8) rate ratio for Australians living in Very remote areas compared with those living in Major cities was lower than the same incidence (0.9) and mortality (1.2) rate ratio for all cancers combined. The 5-year observed survival rate was lower for Australians living in Outer regional areas (6.0%) and higher for Australians living in Major cities (8.3%). Note that observed survival could not be calculated for Remote and Very remote areas due to small numbers (Table A2.12).
Socioeconomic disadvantage Australians in the lowest socioeconomic group were 1.2 times as likely to be diagnosed with pancreatic cancer in 2009–2013 (Table A2.13) and 1.2 times as likely to die from pancreatic cancer in 2012–2016 compared with Australians in the highest socioeconomic group (Table A2.14). The pancreatic cancer incidence (1.2) rate ratio between Australians in the lowest and highest socioeconomic group was higher than the same incidence (1.0) rate ratio for all cancers combined. The pancreatic cancer mortality (1.2) rate ratio between Australians in the lowest and highest socioeconomic group was lower than the same mortality (1.4) rate ratio for all cancers combined. The 5-year observed survival rate was lower for Australians in the 2nd lowest socioeconomic groups (6.5%) and higher for Australians in the highest socioeconomic group (10%) (Table A2.15).
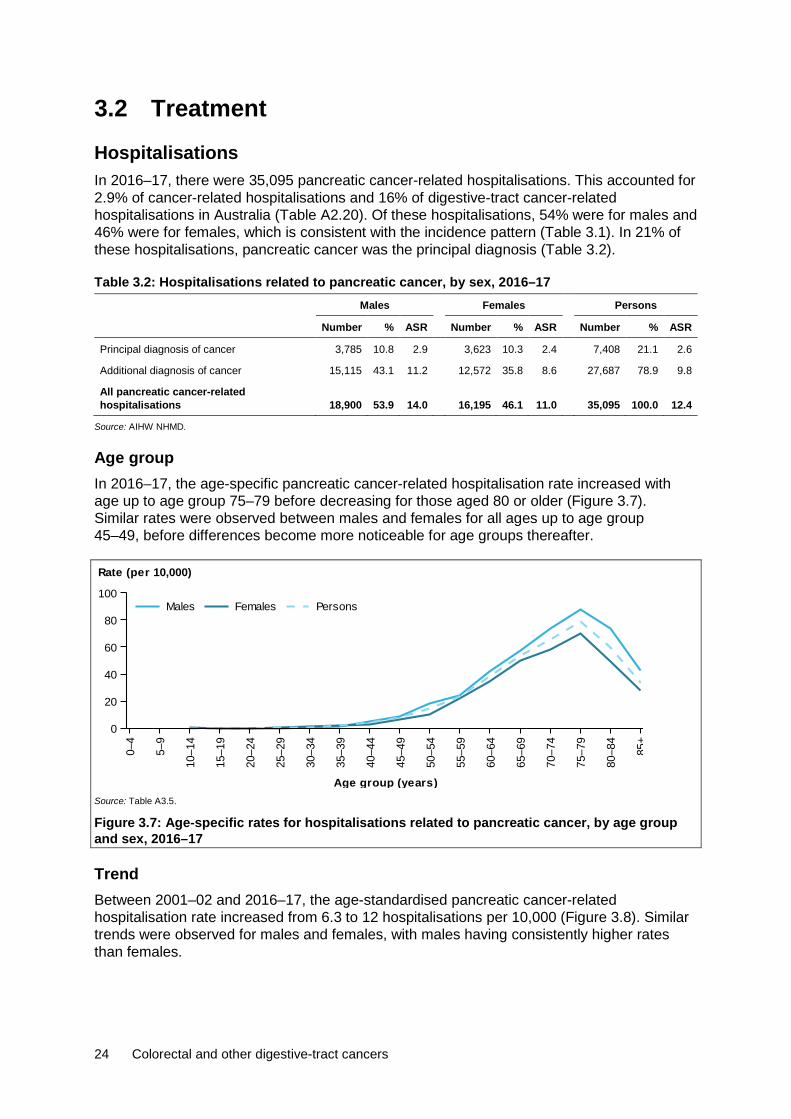
24 Colorectal and other digestive-tract cancers
3.2 Treatment Hospitalisations In 2016–17, there were 35,095 pancreatic cancer-related hospitalisations. This accounted for 2.9% of cancer-related hospitalisations and 16% of digestive-tract cancer-related hospitalisations in Australia (Table A2.20). Of these hospitalisations, 54% were for males and 46% were for females, which is consistent with the incidence pattern (Table 3.1). In 21% of these hospitalisations, pancreatic cancer was the principal diagnosis (Table 3.2).
Table 3.2: Hospitalisations related to pancreatic cancer, by sex, 2016–17 Males Females Persons
Number % ASR Number % ASR Number % ASR
Principal diagnosis of cancer 3,785 10.8 2.9 3,623 10.3 2.4 7,408 21.1 2.6
Additional diagnosis of cancer 15,115 43.1 11.2 12,572 35.8 8.6 27,687 78.9 9.8
All pancreatic cancer-related hospitalisations 18,900 53.9 14.0 16,195 46.1 11.0 35,095 100.0 12.4
Source: AIHW NHMD.
Age group In 2016–17, the age-specific pancreatic cancer-related hospitalisation rate increased with age up to age group 75–79 before decreasing for those aged 80 or older (Figure 3.7). Similar rates were observed between males and females for all ages up to age group 45–49, before differences become more noticeable for age groups thereafter.
Source: Table A3.5.
Figure 3.7: Age-specific rates for hospitalisations related to pancreatic cancer, by age group and sex, 2016–17
Trend Between 2001–02 and 2016–17, the age-standardised pancreatic cancer-related hospitalisation rate increased from 6.3 to 12 hospitalisations per 10,000 (Figure 3.8). Similar trends were observed for males and females, with males having consistently higher rates than females.
0–4
5–9
10–1
4
15–1
9
20–2
4
25–2
9
30–3
4
35–3
9
40–4
4
45–4
9
50–5
4
55–5
9
60–6
4
65–6
9
70–7
4
75–7
9
80–8
4
85+
Age group (years)
0
20
40
60
80
100
Rate (per 10,000)
PersonsFemalesMales

Colorectal and other digestive-tract cancers 25
Source: Table A3.6.
Figure 3.8: All pancreatic cancer-related hospitalisations, by sex, 2001–02 to 2016–17
Selected surgical procedures In 2016–17, there were 705 surgical procedures (see Table D5 for details) related to pancreatic cancer. There were more procedures in males (54%) than in females (46%) (Table 3.3), which was consistent with the incidence pattern (Table 3.1). A pancreatectomy procedure was reported for 98% of surgical procedures. See Appendix C for information on how surgical procedures were calculated.
Table 3.3: Number of surgical procedures, pancreatic cancer, by sex, 2016–17 Males Females Persons
Procedure type Number % Number % Number %
Pancreatectomy 376 97.9 314 97.8 690 97.9
Other excisions n.p. n.p. n.p. n.p. 15 2.1
All surgical procedures 384 100.0 321 100.0 705 100.0
Source: AIHW NHMD.
Chemotherapy In 2016–17, there were 26,397 chemotherapy procedures related to pancreatic cancer. This accounted for 15% of all digestive-tract cancer chemotherapy procedures and 4% of all cancer-related chemotherapy procedures. There were more chemotherapy procedures in males (55%) than females (45%) (Table A2.23), which was consistent with the incidence pattern (Table 3.1). See Appendix C for information on how chemotherapy procedures were calculated.
Radiotherapy In 2016–17, there were 466 radiotherapy courses where the principal diagnosis was recorded as pancreatic cancer. This accounted for 0.7% of all radiotherapy courses provided and 7.5% of all digestive-tract cancer-related radiotherapy courses. A similar number of courses were provided to males as females (Table A2.24).
2001
–02
2002
–03
2003
–04
2004
–05
2005
–06
2006
–07
2007
–08
2008
–09
2009
–10
2010
–11
2011
–12
2012
–13
2013
–14
2014
–15
2015
–16
2016
–17
Financial year
0
4
8
12
16
20
Rate (per 10,000)
PersonsFemalesMales

26 Colorectal and other digestive-tract cancers
3.3 Survivorship population Cancer survivorship focuses on the health and wellbeing of a person living with and beyond cancer (Cancer Australia 2017). See Section 2.4 for a full description of cancer survivorship, including data limitations. At the end of 2013, there were 3,045 people alive who were diagnosed with pancreatic cancer in the previous 5 years. Five-year prevalence for pancreatic cancer was 1.1 times higher in males than in females (Table 3.4), which is consistent with the incidence pattern (Table 3.1).
Table 3.4: Limited-duration prevalence of pancreatic cancer, by sex, as at end of 2013 Males Females Persons
Number % of
cases Rate Number % of
cases Rate Number % of
cases Rate
1-year prevalence 799 51.1 6.9 766 48.9 6.5 1,565 100.0 6.7
5-year prevalence 1,566 51.4 13.5 1,479 48.6 12.6 3,045 100.0 13.1
32-year prevalence 2,142 50.9 18.5 2,067 49.1 17.6 4,209 100.0 18.1
Source: AIHW ACD 2014.
Age group At the end of 2013, 5-year prevalence rates for pancreatic cancer increased with age until age group 75–84, before decreasing for those aged 85 and older (Figure 3.9). Australians aged 75 or older accounted for 30% of all 5-year prevalent cases of pancreatic cancer.
Source: Table A3.7.
Figure 3.9: Five-year prevalence of pancreatic cancer, by age group, as at end of 2013
3.4 Burden from pancreatic cancer In 2011, Australians lost 44,428 DALYs due to premature death or living with disability due to pancreatic cancer. This accounted for 5.3% of the total cancer burden, ranking pancreatic cancer the 5th greatest cause of cancer burden and the 2nd greatest cause of digestive-tract cancer burden. Males accounted for a larger proportion of the burden (55%) than females (45%) (Table 3.5).
The majority (99%) of the pancreatic cancer burden was due to dying prematurely. Compared with other digestive-tract cancers, there was a smaller non-fatal burden. Two-thirds (69%) of the non-fatal burden from pancreatic cancer is due to the metastatic and terminal phase
0–14 15–24 25–34 35–44 45–54 55–64 65–74 75–84 85+
Age group (years)
0
200
400
600
800
1,000
Number
0
20
40
60
80
100
Rate (per 100,000)
RateNumber
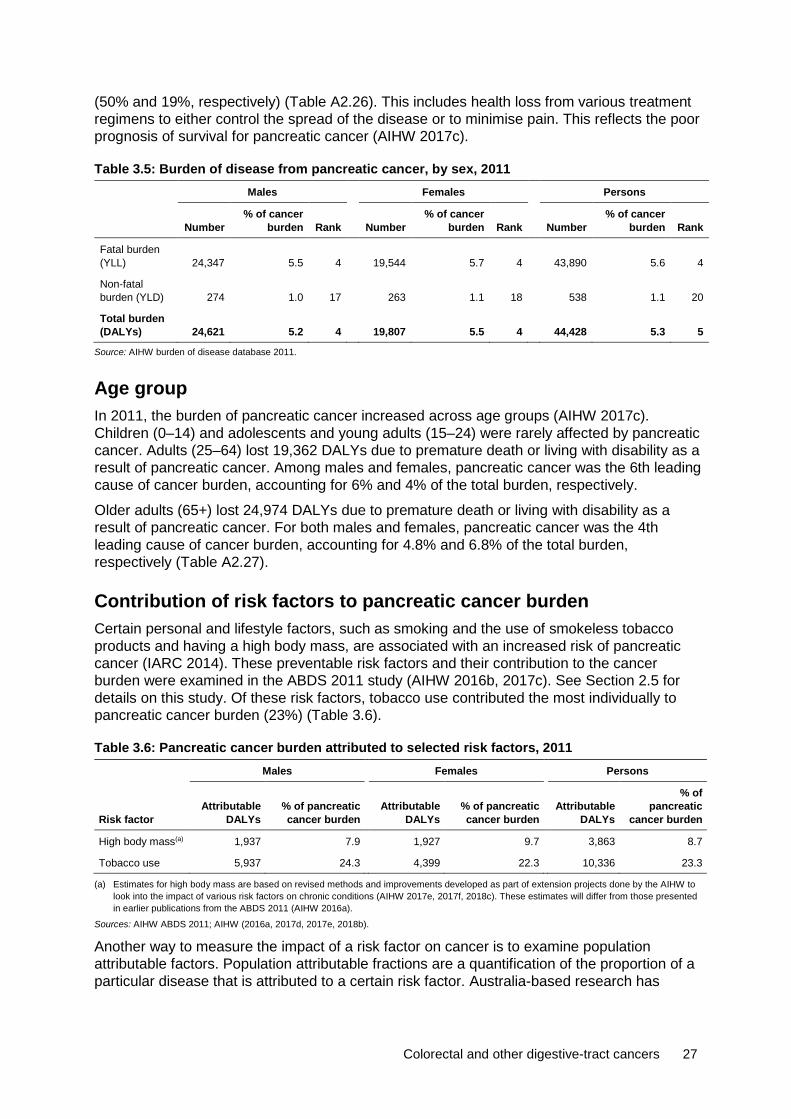
Colorectal and other digestive-tract cancers 27
(50% and 19%, respectively) (Table A2.26). This includes health loss from various treatment regimens to either control the spread of the disease or to minimise pain. This reflects the poor prognosis of survival for pancreatic cancer (AIHW 2017c).
Table 3.5: Burden of disease from pancreatic cancer, by sex, 2011 Males Females Persons
Number % of cancer
burden Rank Number % of cancer
burden Rank Number % of cancer
burden Rank
Fatal burden (YLL) 24,347 5.5 4 19,544 5.7 4 43,890 5.6 4
Non-fatal burden (YLD) 274 1.0 17 263 1.1 18 538 1.1 20
Total burden (DALYs) 24,621 5.2 4 19,807 5.5 4 44,428 5.3 5
Source: AIHW burden of disease database 2011.
Age group In 2011, the burden of pancreatic cancer increased across age groups (AIHW 2017c). Children (0–14) and adolescents and young adults (15–24) were rarely affected by pancreatic cancer. Adults (25–64) lost 19,362 DALYs due to premature death or living with disability as a result of pancreatic cancer. Among males and females, pancreatic cancer was the 6th leading cause of cancer burden, accounting for 6% and 4% of the total burden, respectively.
Older adults (65+) lost 24,974 DALYs due to premature death or living with disability as a result of pancreatic cancer. For both males and females, pancreatic cancer was the 4th leading cause of cancer burden, accounting for 4.8% and 6.8% of the total burden, respectively (Table A2.27).
Contribution of risk factors to pancreatic cancer burden Certain personal and lifestyle factors, such as smoking and the use of smokeless tobacco products and having a high body mass, are associated with an increased risk of pancreatic cancer (IARC 2014). These preventable risk factors and their contribution to the cancer burden were examined in the ABDS 2011 study (AIHW 2016b, 2017c). See Section 2.5 for details on this study. Of these risk factors, tobacco use contributed the most individually to pancreatic cancer burden (23%) (Table 3.6).
Table 3.6: Pancreatic cancer burden attributed to selected risk factors, 2011 Males Females Persons
Risk factor Attributable
DALYs % of pancreatic cancer burden
Attributable
DALYs % of pancreatic cancer burden
Attributable
DALYs
% of pancreatic
cancer burden
High body mass(a) 1,937 7.9 1,927 9.7 3,863 8.7
Tobacco use 5,937 24.3 4,399 22.3 10,336 23.3
(a) Estimates for high body mass are based on revised methods and improvements developed as part of extension projects done by the AIHW to look into the impact of various risk factors on chronic conditions (AIHW 2017e, 2017f, 2018c). These estimates will differ from those presented in earlier publications from the ABDS 2011 (AIHW 2016a).
Sources: AIHW ABDS 2011; AIHW (2016a, 2017d, 2017e, 2018b).
Another way to measure the impact of a risk factor on cancer is to examine population attributable factors. Population attributable fractions are a quantification of the proportion of a particular disease that is attributed to a certain risk factor. Australia-based research has
28 Colorectal and other digestive-tract cancers
indicated a population attributable fraction of 7.8% for pancreatic cancer diagnoses attributed to being overweight and obese. This is over double the population attributable fraction for all cancers combined (3.4%) (Kendall et al. 2015).
Certain hereditary diseases, such as diabetes mellitus type 1, increases the risk of pancreatic cancer (IARC 2014). Genetics and family history are associated with increased risk of pancreatic cancer, with an estimated 5–9% due to hereditary syndromes or disease (Hassan et al. 2007; Lochan et al. 2007). Type II diabetes, chronic cirrhosis, pancreatitis and prior cholecystectomy are associated with increased risk of the disease (Huxley et al. 2005).
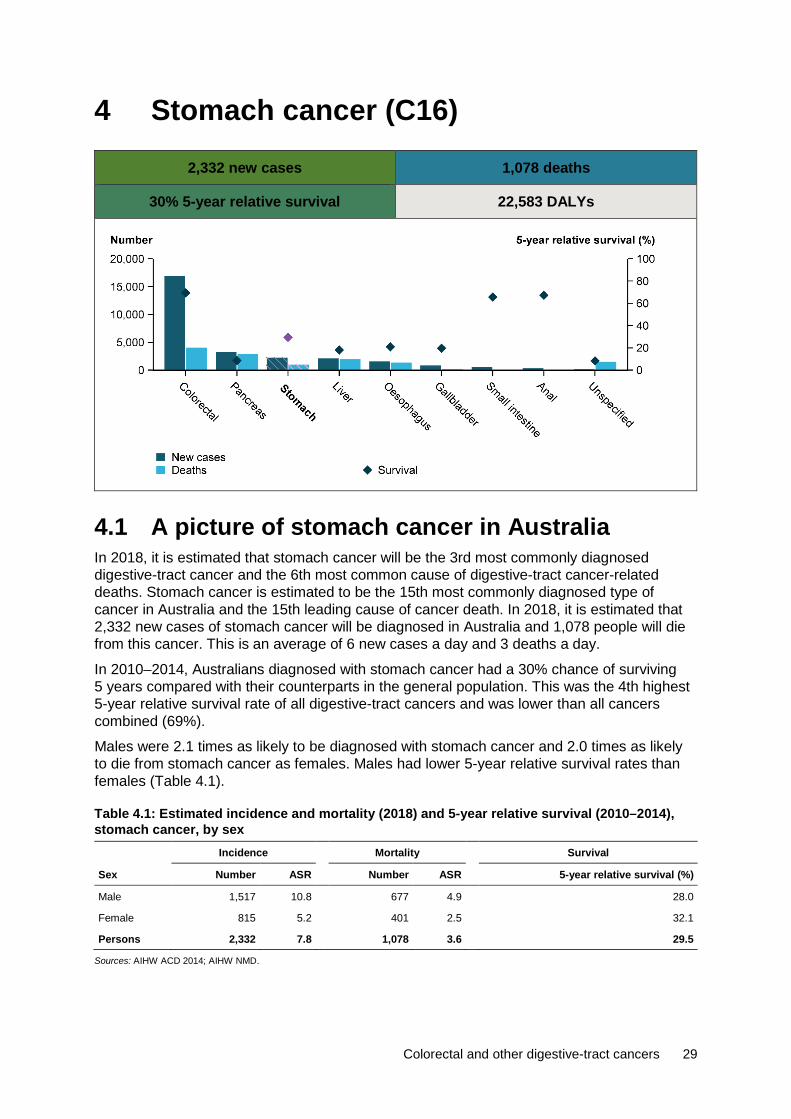
Colorectal and other digestive-tract cancers 29
4 Stomach cancer (C16)
2,332 new cases 1,078 deaths
30% 5-year relative survival 22,583 DALYs
4.1 A picture of stomach cancer in Australia In 2018, it is estimated that stomach cancer will be the 3rd most commonly diagnosed digestive-tract cancer and the 6th most common cause of digestive-tract cancer-related deaths. Stomach cancer is estimated to be the 15th most commonly diagnosed type of cancer in Australia and the 15th leading cause of cancer death. In 2018, it is estimated that 2,332 new cases of stomach cancer will be diagnosed in Australia and 1,078 people will die from this cancer. This is an average of 6 new cases a day and 3 deaths a day.
In 2010–2014, Australians diagnosed with stomach cancer had a 30% chance of surviving 5 years compared with their counterparts in the general population. This was the 4th highest 5-year relative survival rate of all digestive-tract cancers and was lower than all cancers combined (69%).
Males were 2.1 times as likely to be diagnosed with stomach cancer and 2.0 times as likely to die from stomach cancer as females. Males had lower 5-year relative survival rates than females (Table 4.1).
Table 4.1: Estimated incidence and mortality (2018) and 5-year relative survival (2010–2014), stomach cancer, by sex Incidence Mortality Survival
Sex Number ASR Number ASR 5-year relative survival (%)
Male 1,517 10.8 677 4.9 28.0
Female 815 5.2 401 2.5 32.1
Persons 2,332 7.8 1,078 3.6 29.5
Sources: AIHW ACD 2014; AIHW NMD.
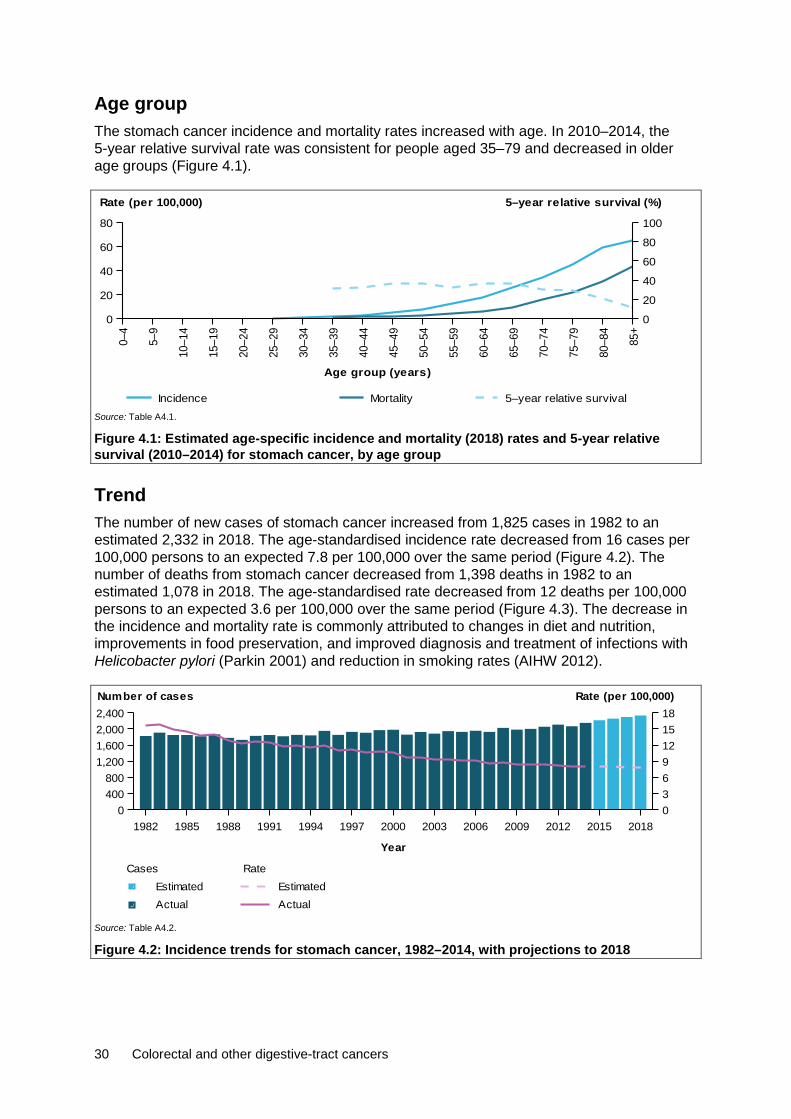
30 Colorectal and other digestive-tract cancers
Age group The stomach cancer incidence and mortality rates increased with age. In 2010–2014, the 5-year relative survival rate was consistent for people aged 35–79 and decreased in older age groups (Figure 4.1).
Source: Table A4.1.
Figure 4.1: Estimated age-specific incidence and mortality (2018) rates and 5-year relative survival (2010–2014) for stomach cancer, by age group
Trend The number of new cases of stomach cancer increased from 1,825 cases in 1982 to an estimated 2,332 in 2018. The age-standardised incidence rate decreased from 16 cases per 100,000 persons to an expected 7.8 per 100,000 over the same period (Figure 4.2). The number of deaths from stomach cancer decreased from 1,398 deaths in 1982 to an estimated 1,078 in 2018. The age-standardised rate decreased from 12 deaths per 100,000 persons to an expected 3.6 per 100,000 over the same period (Figure 4.3). The decrease in the incidence and mortality rate is commonly attributed to changes in diet and nutrition, improvements in food preservation, and improved diagnosis and treatment of infections with Helicobacter pylori (Parkin 2001) and reduction in smoking rates (AIHW 2012).
Source: Table A4.2.
Figure 4.2: Incidence trends for stomach cancer, 1982–2014, with projections to 2018
0–4
5–9
10–1
4
15–1
9
20–2
4
25–2
9
30–3
4
35–3
9
40–4
4
45–4
9
50–5
4
55–5
9
60–6
4
65–6
9
70–7
4
75–7
9
80–8
4
85+
Age group (years)
0
20
40
60
80
Rate (per 100,000)
0
20
40
60
80
100
5–year relative survival (%)
Incidence Mortality 5–year relative survival
1982 1985 1988 1991 1994 1997 2000 2003 2006 2009 2012 2015 2018
Year
0400800
1,2001,6002,0002,400
0369121518
Number of cases Rate (per 100,000)
Rate
ActualEstimated
Cases
ActualEstimated

Colorectal and other digestive-tract cancers 31
Source: Table A4.2.
Figure 4.3: Mortality trends for stomach cancer, 1982–2016, with projections to 2018
Between 1985–1989 and 2010–2014, the 5-year relative survival rate for stomach cancer increased from 18% to 30%. Five-year relative survival was lower for stomach cancer than for all digestive-tract cancers combined and all cancers combined (Figure 4.4).
Source: Table A2.3.
Figure 4.4: Five-year relative survival for stomach cancer, all digestive-tract cancers combined and all cancers combined, 1985–1989 to 2010–2014
Characteristics
Subsite In 2013, the cardia (including cardio-oesophageal junction) was the most common stomach cancer subsite, representing 34% of all stomach cancer cases diagnosed. Australians diagnosed with this subsite had a 24% chance of surviving 5 years compared with their counterparts in the general population. This was lower than the 5-year relative survival rate for all stomach cancers (30%) and was the lowest 5-year relative survival rate for stomach cancer subsites. Five-year relative survival was highest for curvatures of the stomach (41%) (Figure 4.5).
1982 1985 1988 1991 1994 1997 2000 2003 2006 2009 2012 2015 2018
Year
0
500
1,000
1,500
2,000
03691215
Number of deaths Rate (per 100,000)
Rate
Actual
EstimatedCases
Actual
Estimated
1985–1989 1990–1994 1995–1999 2000–2004 2005–2009 2010–2014
Period
0
20
40
60
80
100
5-year relative survival (%)
All cancers combinedAll digestive cancers combinedStomach
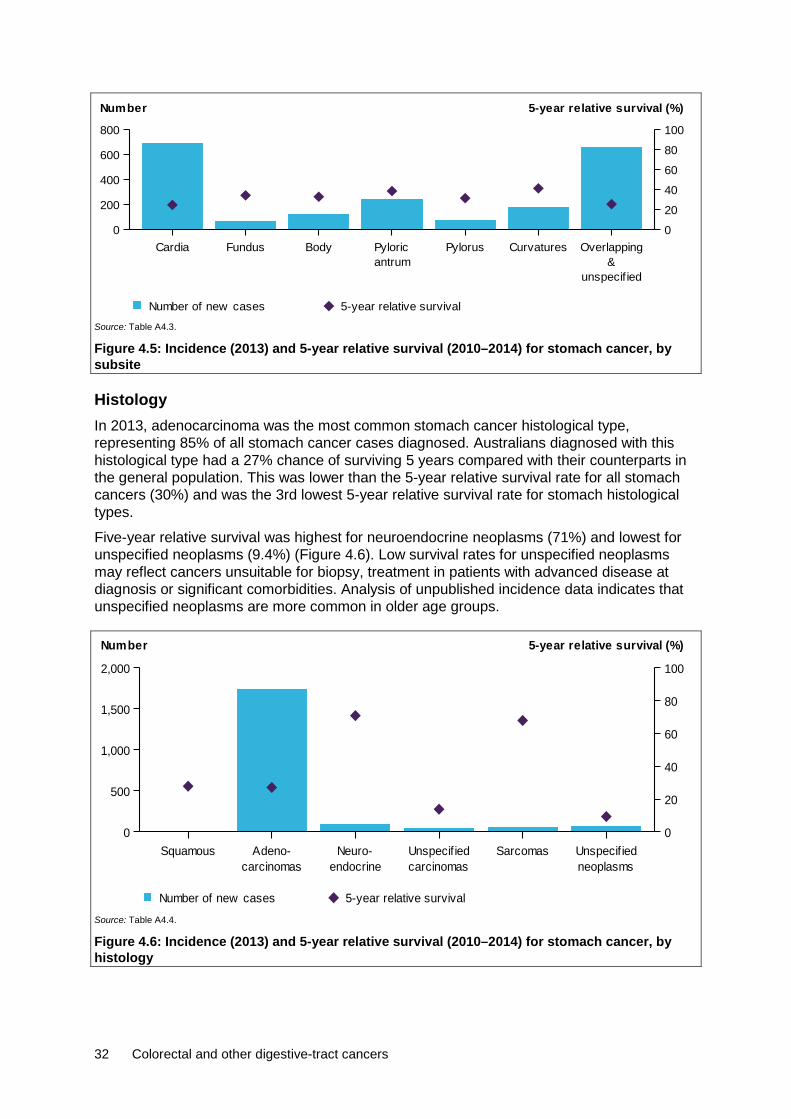
32 Colorectal and other digestive-tract cancers
Source: Table A4.3.
Figure 4.5: Incidence (2013) and 5-year relative survival (2010–2014) for stomach cancer, by subsite
Histology In 2013, adenocarcinoma was the most common stomach cancer histological type, representing 85% of all stomach cancer cases diagnosed. Australians diagnosed with this histological type had a 27% chance of surviving 5 years compared with their counterparts in the general population. This was lower than the 5-year relative survival rate for all stomach cancers (30%) and was the 3rd lowest 5-year relative survival rate for stomach histological types.
Five-year relative survival was highest for neuroendocrine neoplasms (71%) and lowest for unspecified neoplasms (9.4%) (Figure 4.6). Low survival rates for unspecified neoplasms may reflect cancers unsuitable for biopsy, treatment in patients with advanced disease at diagnosis or significant comorbidities. Analysis of unpublished incidence data indicates that unspecified neoplasms are more common in older age groups.
Source: Table A4.4.
Figure 4.6: Incidence (2013) and 5-year relative survival (2010–2014) for stomach cancer, by histology
Cardia Fundus BodyantrumPyloric Pylorus Curvatures
unspecif ied&
Overlapping0
200
400
600
800
Number
0
20
40
60
80
100
5-year relative survival (%)
Number of new cases 5-year relative survival
Squamouscarcinomas
Adeno-endocrine
Neuro-carcinomasUnspecif ied Sarcomas
neoplasmsUnspecif ied
0
500
1,000
1,500
2,000
Number
0
20
40
60
80
100
5-year relative survival (%)
Number of new cases 5-year relative survival

Colorectal and other digestive-tract cancers 33
Population groups
Indigenous status Indigenous Australians living in the jurisdictions for which data were available (see notes on page vii for more details) were 1.5 times as likely to be diagnosed with stomach cancer in 2009–2013 and 1.6 times as likely to die from stomach cancer in 2012–2016 as non-Indigenous Australians. The incidence (1.5) and mortality (1.6) rate ratio between Indigenous and non-Indigenous Australians for stomach cancer was higher than the same incidence rate ratio (1.1) and the mortality rate ratio (1.4) for all cancers combined. Five-year relative survival was lower in Indigenous Australians (19%) than in non-Indigenous Australians (28%) (Table A2.9).
Remoteness area Australians living in Major cities of Australia were 1.3 times as likely to be diagnosed with stomach cancer in 2009–2013 (Table A2.10) and 1.2 as likely to die from stomach cancer in 2011–2016 compared with Australians living in Very remote areas (Table A2.11). The stomach cancer incidence (0.8) and mortality (0.8) rate ratio for Australians living in Very remote areas compared with those living in Major cities was lower than the same incidence (0.9) and mortality (1.2) rate ratio for all cancers combined. The 5-year observed survival rate was lower for Australians living in Remote and Very remote areas (20%) and higher for Australians living in Major cities (27%) (Table A2.12).
Socioeconomic disadvantage Australians in the lowest socioeconomic group were 1.3 times as likely to be diagnosed with stomach cancer in 2009–2013 (Table A2.13) and 1.4 times as likely to die from stomach cancer in 2012–2016 compared with Australians in the highest socioeconomic group (Table A2.14). The stomach cancer incidence (1.3) rate ratio between Australians in the lowest and highest socioeconomic group was higher than the same incidence (1.0) rate ratio for all cancers combined. The stomach cancer mortality (1.4) rate ratio between Australians in the lowest and highest socioeconomic group was similar than the same mortality (1.4) rate ratio for all cancers combined. The 5-year observed survival rate was lower for Australians in the two lowest socioeconomic groups (23%) and higher for Australians in the highest socioeconomic group (29%) (Table A2.15).
4.2 Treatment Hospitalisations In 2016–17, there were 16,993 stomach cancer-related hospitalisations. This accounted for 1.4% of cancer-related hospitalisations and 7.7% of digestive-tract cancer-related hospitalisations in Australia (Table A2.20). Of these, 68% were for males and 32% were for females, which is consistent with the incidence pattern (Table 4.1). In 31% of these hospitalisations, stomach cancer was the principal diagnosis (Table 4.2).

34 Colorectal and other digestive-tract cancers
Table 4.2: Hospitalisations related to stomach cancer, by sex, 2016–17 Males Females Persons
No % ASR No % ASR No % ASR
Principal diagnosis of cancer 3,384 19.9 2.5 1,872 11.0 1.3 5,256 30.9 1.9
Additional diagnosis of cancer 8,216 48.3 6.1 3,521 20.7 2.5 11,737 69.1 4.2
All stomach cancer-related hospitalisations 11,600 68.3 8.6 5,393 31.7 3.7 16,993 100.0 6.1
Source: AIHW NHMD.
Age group In 2016–17, the age-specific stomach cancer-related hospitalisation rate increased with age, reaching a peak for age group 75–79, before decreasing in older age groups (Figure 4.7).
Source: Table A4.5.
Figure 4.7: Age-specific rates of hospitalisations related to stomach cancer, by age group and sex, 2016–17
Trend Between 2001–02 and 2016–17, the age-standardised stomach cancer-related hospitalisation rate remained relatively stable, varying between 5.7 and 7.2 per 10,000 (Figure 4.8). Similar trends were observed for males and females, with males having higher rates than females.
Source: Table A4.6.
Figure 4.8: All stomach cancer-related hospitalisations, by sex, 2001–02 to 2016–17
0–4
5–9
10–1
4
15–1
9
20–2
4
25–2
9
30–3
4
35–3
9
40–4
4
45–4
9
50–5
4
55–5
9
60–6
4
65–6
9
70–7
4
75–7
9
80–8
4
85+
Age group (years)
0
10
20
30
40
50
Rate (per 10,000)
PersonsFemalesMales
2001
–02
2002
–03
2003
–04
2004
–05
2005
–06
2006
–07
2007
–08
2008
–09
2009
–10
2010
–11
2011
–12
2012
–13
2013
–14
2014
–15
2015
–16
2016
–17
Financial year
0
3
6
9
12
15
Rate (per 10,000)
PersonsFemalesMales
Colorectal and other digestive-tract cancers 35
Selected surgical procedures In 2016–17, there were 804 surgical procedures (see Table D6 for details) related to stomach cancer. There were more procedures in males (65%) than in females (35%) (Table 4.3), which was consistent with the incidence pattern (Table 4.1). A gastrectomy procedure was reported for 78% of surgical procedures. See Appendix C for information on how surgical procedures were calculated.
Table 4.3: Number of surgical procedures, stomach cancer, by sex, 2016–17 Males Females Persons
Procedure type Number % Number % Number %
Gastrectomy 432 82.1 197 70.9 629 78.2
Other excision procedures on stomach 37 7.0 41 14.7 78 9.7
Gastrostomy or gastroenterostomy 57 10.8 40 14.4 97 12.1
All surgical procedures 526 100.0 278 100.0 804 100.0
Source: AIHW NHMD.
Chemotherapy In 2016–17, there were 12,322 chemotherapy procedures related to stomach cancer. This accounted for 6.8% of all digestive-tract cancer chemotherapy procedures and 1.8% of all cancer-related chemotherapy procedures. There were more chemotherapy procedures in males (70%) than females (30%) (Table A2.23), which was consistent with the incidence pattern (Table 4.1). See Appendix C for information on how chemotherapy procedures were calculated.
Radiotherapy In 2016–17, there were 415 radiotherapy courses for a principal diagnosis of stomach cancer. This accounted for 0.7% of all radiotherapy courses provided and 6.7% of all digestive-tract cancer-related radiotherapy courses. More courses were provided to males than females (Table A2.24).
4.3 Survivorship population Cancer survivorship focuses on the health and wellbeing of a person living with and beyond cancer (Cancer Australia 2017). See Section 2.4 for a full description of cancer survivorship, including data limitations. At the end of 2013, there were 4,150 people alive who were diagnosed with stomach cancer in the previous 5 years (Table 4.4). Five-year prevalence for stomach cancer was 1.9 times higher in males than females, which is consistent with the incidence pattern (Table 4.1).

36 Colorectal and other digestive-tract cancers
Table 4.4: Limited-duration prevalence of stomach cancer, by sex, as at end of 2013 Males Females Persons
Number % of
cases Rate Number % of
cases Rate Number % of
cases Rate
1-year prevalence 1,011 67.9 8.7 478 32.1 4.1 1,489 100.0 6.4
5-year prevalence 2,713 65.4 23.4 1,437 34.6 12.3 4,150 100.0 17.8
32-year prevalence 5,894 62.7 50.9 3,508 37.3 29.9 9,402 100.0 40.4
Source: AIHW ACD 2014.
Age group Five-year prevalence rates for stomach cancer increased with age from age group 15–24 to age group 75–84, before decreasing for those aged 85 and older (Figure 4.9). At the end of 2013, Australians aged 75 and older accounted for over one-third (35%) of all 5-year prevalent cases for stomach cancer.
Source: Table A4.7.
Figure 4.9: Five-year prevalence of stomach cancer, by age group, as at end of 2013
4.4 Burden from stomach cancer In 2011, Australians lost 22,583 DALYs due to premature death or living with disability due to stomach cancer. This accounted for 2.7% of the total cancer burden, ranking stomach cancer as the 13th greatest cause of cancer burden and the 5th highest cause of digestive-tract cancer burden. Stomach cancer ranked lower in burden compared with other less common digestive-tract cancers, reflecting the slightly higher survival rates.
Stomach cancer accounted for a greater proportion of cancer burden in males (3.1%) than females (2.2%). Almost double the number of years of life lost were attributed to males than females for the same year (Table 4.5).
The majority (97%) of the stomach cancer burden was due to dying prematurely. Compared with other digestive-tract cancers, there was a higher non-fatal burden component. Almost half (49%) of the non-fatal burden from stomach cancer is from health loss due to diagnosis (for example, biopsies) and primary therapy (for example, surgery, chemotherapy and radiotherapy), and 23% is from health loss during the control phase, and includes general worry and daily medications (Table A2.26) (AIHW 2017c).
0–14 15–24 25–34 35–44 45–54 55–64 65–74 75–84 85+
Age group (years)
0
200
400
600
800
1,000
1,200
1,400
Number
0
20
40
60
80
100
120
Rate (per 100,000)
RateNumber

Colorectal and other digestive-tract cancers 37
Table 4.5: Burden of disease from stomach cancer, by sex, 2011 Males Females Persons
Number % of cancer
burden Rank Number % of cancer
burden Rank Number % of cancer
burden Rank
Fatal burden (YLL) 14,176 3.2 11 7,826 2.3 11 22,002 2.8 13
Non-fatal burden (YLD) 372 1.3 15 209 0.9 21 581 1.1 18
Total burden (DALYs) 14,548 3.1 12 8,035 2.2 11 22,583 2.7 13
Source: AIHW burden of disease database 2011.
Age group In 2011, the stomach cancer burden increased across age groups (AIHW 2017c). Children (0–14) and adolescents and young adults (15–24) were rarely impacted by stomach cancer. Adults (25–64) lost 11,153 DALYs due to premature death or living with disability as a result of stomach cancer. Among males, stomach cancer was the 11th leading cause of cancer burden, accounting for 3.5% of the total burden. Among females, it was the 11th leading cause of cancer burden, accounting for 2.3% of the total burden.
Older adults (65+) lost 11,354 DALYs due to premature death or living with disability as a result of stomach cancer. Among males in this age group, stomach cancer was the 12th leading cause of cancer burden, accounting for 2.9% of the total burden. Among females, it was the 14th leading cause of cancer burden, accounting for 2.1% of the total burden (Table A2.27).
Contribution of risk factors to stomach cancer burden Personal and lifestyle factors such as smoking and a diet high in sodium are associated with an increased risk of stomach cancer. These preventable risk factors and their contribution to the cancer burden were examined in the ABDS 2011 (AIHW 2016b, 2017c). See Section 2.5 for details on this study. Of these risk factors, tobacco use contributed the most individually to stomach cancer burden (14%). A greater proportion of stomach cancer burden in males (16%) was due to tobacco use than in females (12%) (Table 4.6).
Table 4.6: Stomach cancer burden attributed to selected risk factors, 2011 Males Females Persons
Risk factor Attributable
DALYs % of stomach
cancer burden
Attributable
DALYs % of stomach
cancer burden
Attributable
DALYs
% of stomach cancer burden
Tobacco use 2,313 16.0 920 11.6 3,234 14.3
Diet high in sodium 467 3.2 147 1.8 614 2.7
Sources: AIHW ABDS 2011; AIHW (2016a, 2017d, 2017e, 2018b).
There is some evidence that other lifestyle factors, such as consumption of alcoholic beverages (Agudo et al. 1992; Bagnardi et al. 2001a, 2001b; Kabat et al. 1993; Vaughan et al. 1995) and body fatness (Chen et al. 2013; MacInnis et al. 2006; WCRF/AICR 2018, WCRF 2018; Yang et al. 2009) may be associated with stomach cancer.
Certain viral and bacterial infections of the stomach can lead to formation of carcinogenic substances and consequently increase the risk of stomach cancer (IARC 2014). Helicobacter pylori, a common bacterium that infects the stomach, is associated with an increased risk ofr stomach cancer (Forman & Burley 2006; WCRF/AICR 2007). In Australia, about 40% of

38 Colorectal and other digestive-tract cancers
people over 60 years of age have Helicobacter pylori, and this infection is higher in Indigenous communities than in non-Indigenous communities (GESA 2010). Helicobacter pylori is estimated to confer a 1–2% risk of gastric cancer (Mitchell & Katelaris 2016).
Occupational and general exposure to carcinogenic and/or toxic substances can be risk factors for stomach cancer. Furthermore, exposure to ionising radiation from, for example, diagnostic X-rays, working in the nuclear industry and natural sources is often associated with increased risk of stomach cancer (IARC 2014). Certain genetic anomalies can be associated with an increased risk of stomach cancer (IARC 2014).
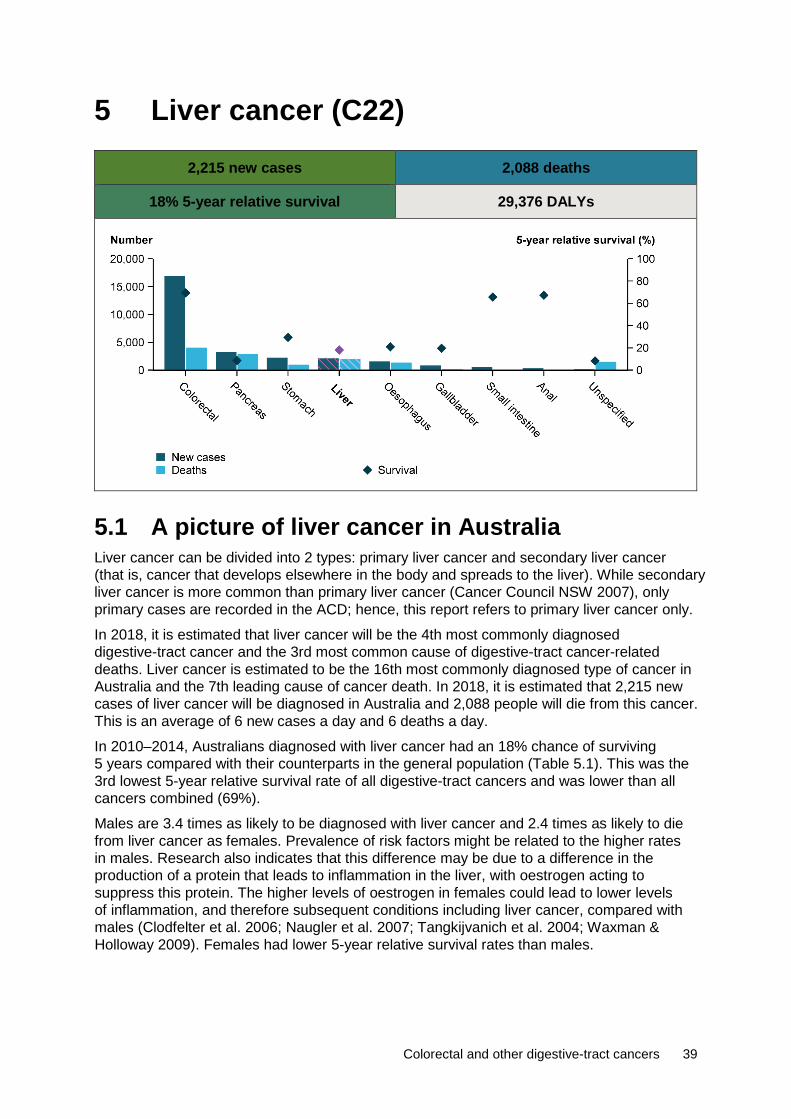
Colorectal and other digestive-tract cancers 39
5 Liver cancer (C22)
2,215 new cases 2,088 deaths
18% 5-year relative survival 29,376 DALYs
5.1 A picture of liver cancer in Australia Liver cancer can be divided into 2 types: primary liver cancer and secondary liver cancer (that is, cancer that develops elsewhere in the body and spreads to the liver). While secondary liver cancer is more common than primary liver cancer (Cancer Council NSW 2007), only primary cases are recorded in the ACD; hence, this report refers to primary liver cancer only.
In 2018, it is estimated that liver cancer will be the 4th most commonly diagnosed digestive-tract cancer and the 3rd most common cause of digestive-tract cancer-related deaths. Liver cancer is estimated to be the 16th most commonly diagnosed type of cancer in Australia and the 7th leading cause of cancer death. In 2018, it is estimated that 2,215 new cases of liver cancer will be diagnosed in Australia and 2,088 people will die from this cancer. This is an average of 6 new cases a day and 6 deaths a day.
In 2010–2014, Australians diagnosed with liver cancer had an 18% chance of surviving 5 years compared with their counterparts in the general population (Table 5.1). This was the 3rd lowest 5-year relative survival rate of all digestive-tract cancers and was lower than all cancers combined (69%).
Males are 3.4 times as likely to be diagnosed with liver cancer and 2.4 times as likely to die from liver cancer as females. Prevalence of risk factors might be related to the higher rates in males. Research also indicates that this difference may be due to a difference in the production of a protein that leads to inflammation in the liver, with oestrogen acting to suppress this protein. The higher levels of oestrogen in females could lead to lower levels of inflammation, and therefore subsequent conditions including liver cancer, compared with males (Clodfelter et al. 2006; Naugler et al. 2007; Tangkijvanich et al. 2004; Waxman & Holloway 2009). Females had lower 5-year relative survival rates than males.
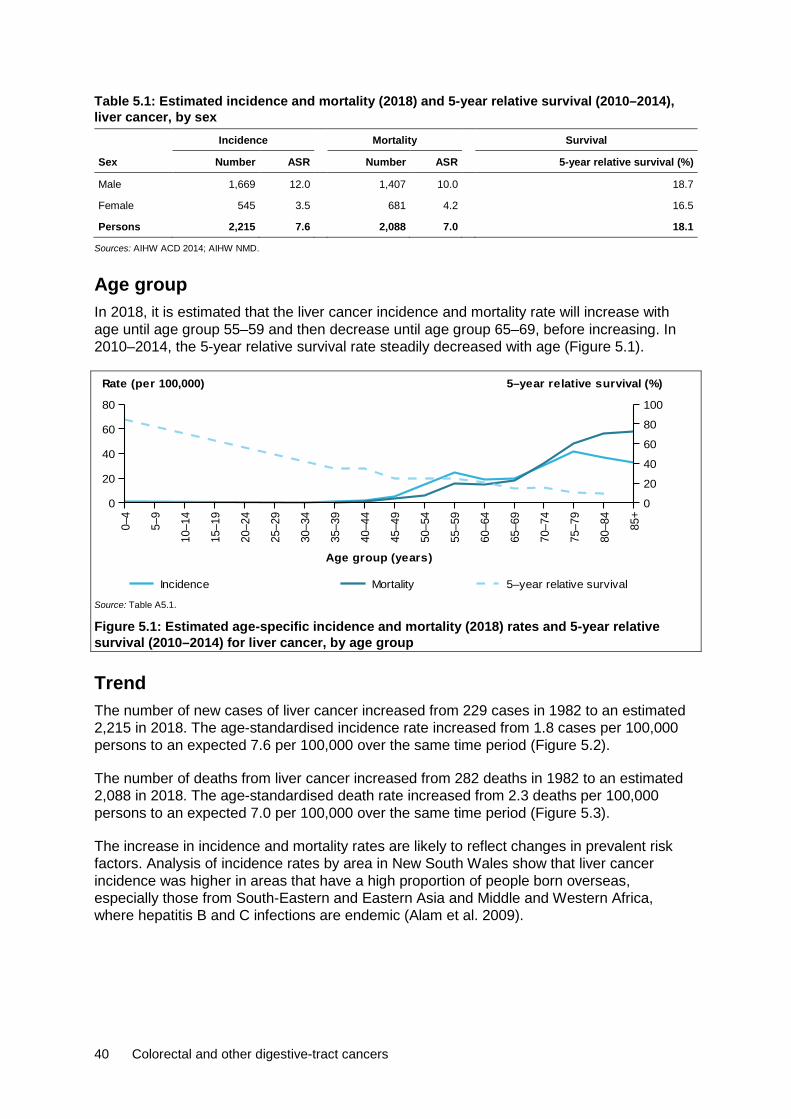
40 Colorectal and other digestive-tract cancers
Table 5.1: Estimated incidence and mortality (2018) and 5-year relative survival (2010–2014), liver cancer, by sex Incidence Mortality Survival
Sex Number ASR Number ASR 5-year relative survival (%)
Male 1,669 12.0 1,407 10.0 18.7
Female 545 3.5 681 4.2 16.5
Persons 2,215 7.6 2,088 7.0 18.1
Sources: AIHW ACD 2014; AIHW NMD.
Age group In 2018, it is estimated that the liver cancer incidence and mortality rate will increase with age until age group 55–59 and then decrease until age group 65–69, before increasing. In 2010–2014, the 5-year relative survival rate steadily decreased with age (Figure 5.1).
Source: Table A5.1.
Figure 5.1: Estimated age-specific incidence and mortality (2018) rates and 5-year relative survival (2010–2014) for liver cancer, by age group
Trend The number of new cases of liver cancer increased from 229 cases in 1982 to an estimated 2,215 in 2018. The age-standardised incidence rate increased from 1.8 cases per 100,000 persons to an expected 7.6 per 100,000 over the same time period (Figure 5.2).
The number of deaths from liver cancer increased from 282 deaths in 1982 to an estimated 2,088 in 2018. The age-standardised death rate increased from 2.3 deaths per 100,000 persons to an expected 7.0 per 100,000 over the same time period (Figure 5.3).
The increase in incidence and mortality rates are likely to reflect changes in prevalent risk factors. Analysis of incidence rates by area in New South Wales show that liver cancer incidence was higher in areas that have a high proportion of people born overseas, especially those from South-Eastern and Eastern Asia and Middle and Western Africa, where hepatitis B and C infections are endemic (Alam et al. 2009).
0–4
5–9
10–1
4
15–1
9
20–2
4
25–2
9
30–3
4
35–3
9
40–4
4
45–4
9
50–5
4
55–5
9
60–6
4
65–6
9
70–7
4
75–7
9
80–8
4
85+
Age group (years)
0
20
40
60
80
Rate (per 100,000)
0
20
40
60
80
100
5–year relative survival (%)
Incidence Mortality 5–year relative survival
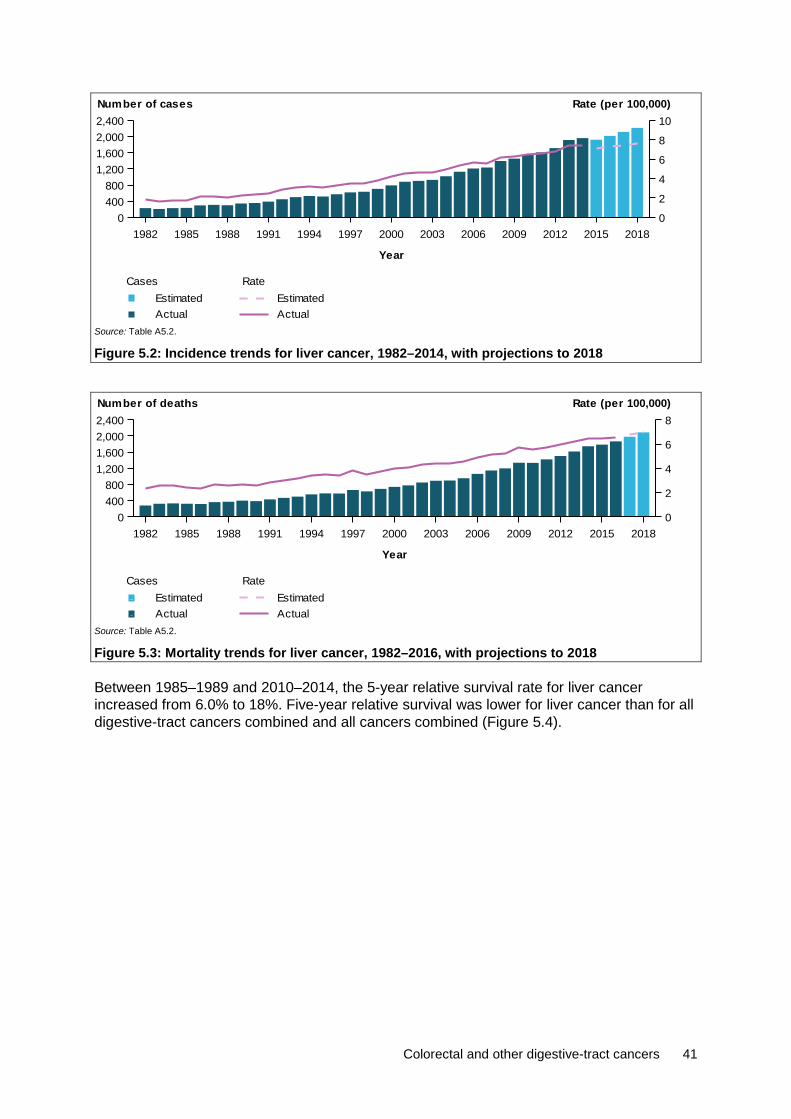
Colorectal and other digestive-tract cancers 41
Source: Table A5.2.
Figure 5.2: Incidence trends for liver cancer, 1982–2014, with projections to 2018
Source: Table A5.2.
Figure 5.3: Mortality trends for liver cancer, 1982–2016, with projections to 2018
Between 1985–1989 and 2010–2014, the 5-year relative survival rate for liver cancer increased from 6.0% to 18%. Five-year relative survival was lower for liver cancer than for all digestive-tract cancers combined and all cancers combined (Figure 5.4).
1982 1985 1988 1991 1994 1997 2000 2003 2006 2009 2012 2015 2018
Year
0400800
1,2001,6002,0002,400
0
2
4
6
8
10Number of cases Rate (per 100,000)
Rate
ActualEstimated
Cases
ActualEstimated
1982 1985 1988 1991 1994 1997 2000 2003 2006 2009 2012 2015 2018
Year
0400800
1,2001,6002,0002,400
0
2
4
6
8Number of deaths Rate (per 100,000)
Rate
ActualEstimated
Cases
ActualEstimated
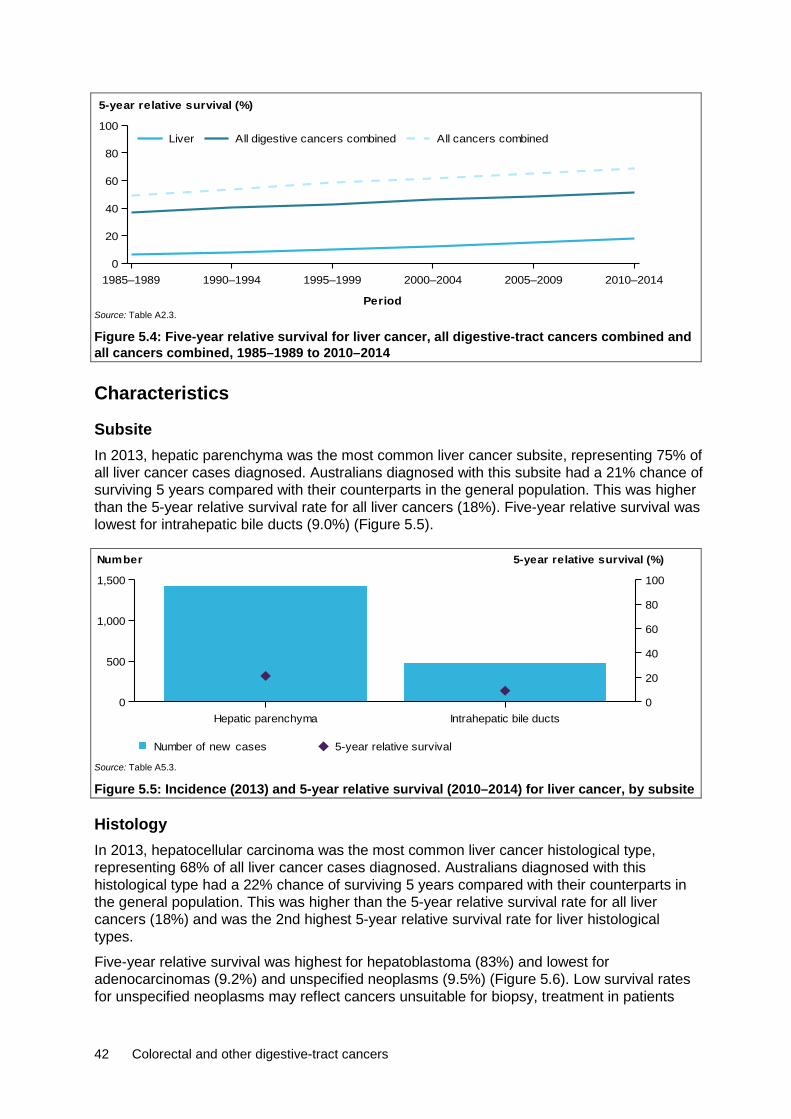
42 Colorectal and other digestive-tract cancers
Source: Table A2.3.
Figure 5.4: Five-year relative survival for liver cancer, all digestive-tract cancers combined and all cancers combined, 1985–1989 to 2010–2014
Characteristics
Subsite In 2013, hepatic parenchyma was the most common liver cancer subsite, representing 75% of all liver cancer cases diagnosed. Australians diagnosed with this subsite had a 21% chance of surviving 5 years compared with their counterparts in the general population. This was higher than the 5-year relative survival rate for all liver cancers (18%). Five-year relative survival was lowest for intrahepatic bile ducts (9.0%) (Figure 5.5).
Source: Table A5.3.
Figure 5.5: Incidence (2013) and 5-year relative survival (2010–2014) for liver cancer, by subsite
Histology In 2013, hepatocellular carcinoma was the most common liver cancer histological type, representing 68% of all liver cancer cases diagnosed. Australians diagnosed with this histological type had a 22% chance of surviving 5 years compared with their counterparts in the general population. This was higher than the 5-year relative survival rate for all liver cancers (18%) and was the 2nd highest 5-year relative survival rate for liver histological types.
Five-year relative survival was highest for hepatoblastoma (83%) and lowest for adenocarcinomas (9.2%) and unspecified neoplasms (9.5%) (Figure 5.6). Low survival rates for unspecified neoplasms may reflect cancers unsuitable for biopsy, treatment in patients
1985–1989 1990–1994 1995–1999 2000–2004 2005–2009 2010–2014
Period
0
20
40
60
80
100
5-year relative survival (%)
All cancers combinedAll digestive cancers combinedLiver
Hepatic parenchyma Intrahepatic bile ducts0
500
1,000
1,500
Number
0
20
40
60
80
100
5-year relative survival (%)
Number of new cases 5-year relative survival
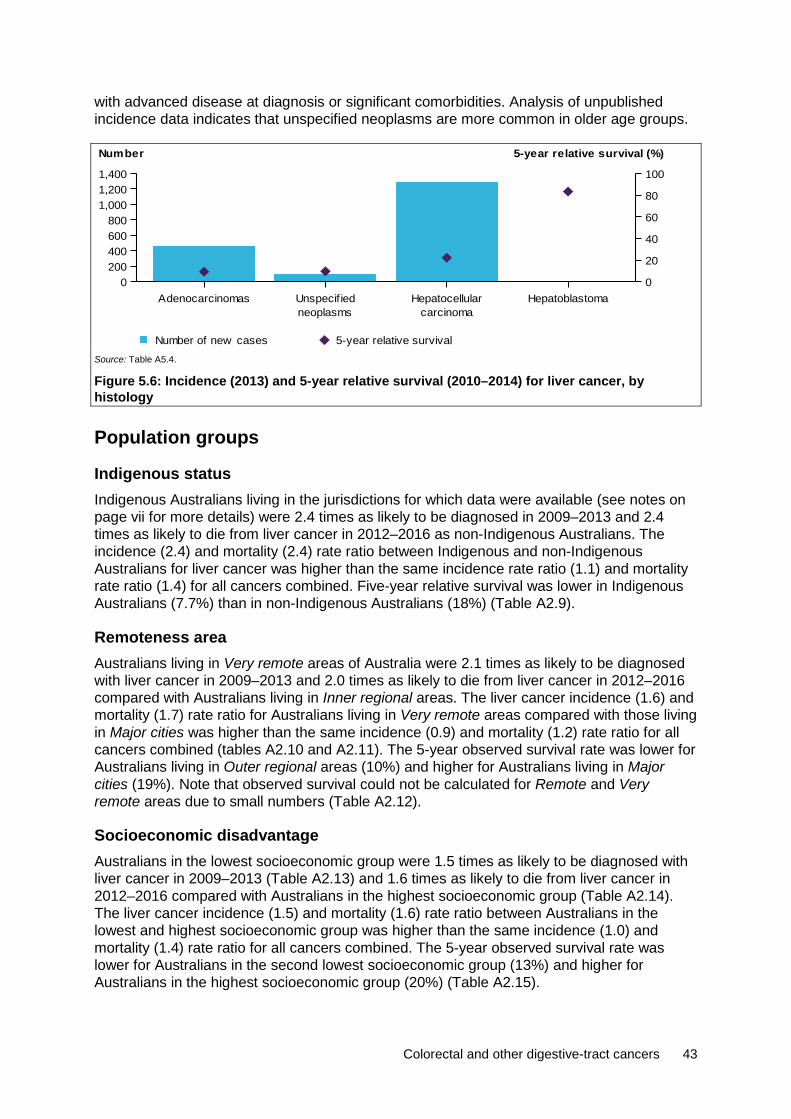
Colorectal and other digestive-tract cancers 43
with advanced disease at diagnosis or significant comorbidities. Analysis of unpublished incidence data indicates that unspecified neoplasms are more common in older age groups.
Source: Table A5.4.
Figure 5.6: Incidence (2013) and 5-year relative survival (2010–2014) for liver cancer, by histology
Population groups
Indigenous status Indigenous Australians living in the jurisdictions for which data were available (see notes on page vii for more details) were 2.4 times as likely to be diagnosed in 2009–2013 and 2.4 times as likely to die from liver cancer in 2012–2016 as non-Indigenous Australians. The incidence (2.4) and mortality (2.4) rate ratio between Indigenous and non-Indigenous Australians for liver cancer was higher than the same incidence rate ratio (1.1) and mortality rate ratio (1.4) for all cancers combined. Five-year relative survival was lower in Indigenous Australians (7.7%) than in non-Indigenous Australians (18%) (Table A2.9).
Remoteness area Australians living in Very remote areas of Australia were 2.1 times as likely to be diagnosed with liver cancer in 2009–2013 and 2.0 times as likely to die from liver cancer in 2012–2016 compared with Australians living in Inner regional areas. The liver cancer incidence (1.6) and mortality (1.7) rate ratio for Australians living in Very remote areas compared with those living in Major cities was higher than the same incidence (0.9) and mortality (1.2) rate ratio for all cancers combined (tables A2.10 and A2.11). The 5-year observed survival rate was lower for Australians living in Outer regional areas (10%) and higher for Australians living in Major cities (19%). Note that observed survival could not be calculated for Remote and Very remote areas due to small numbers (Table A2.12).
Socioeconomic disadvantage Australians in the lowest socioeconomic group were 1.5 times as likely to be diagnosed with liver cancer in 2009–2013 (Table A2.13) and 1.6 times as likely to die from liver cancer in 2012–2016 compared with Australians in the highest socioeconomic group (Table A2.14). The liver cancer incidence (1.5) and mortality (1.6) rate ratio between Australians in the lowest and highest socioeconomic group was higher than the same incidence (1.0) and mortality (1.4) rate ratio for all cancers combined. The 5-year observed survival rate was lower for Australians in the second lowest socioeconomic group (13%) and higher for Australians in the highest socioeconomic group (20%) (Table A2.15).
AdenocarcinomasneoplasmsUnspecif ied
carcinomaHepatocellular Hepatoblastoma
0200400600800
1,0001,2001,400
Number
0
20
40
60
80
100
5-year relative survival (%)
Number of new cases 5-year relative survival

44 Colorectal and other digestive-tract cancers
5.2 Treatment Hospitalisations In 2016–17, there were 12,800 liver cancer-related hospitalisations. This accounted for 1.0% of cancer-related hospitalisations and 5.8% of digestive-tract cancer-related hospitalisations in Australia (Table A2.20). Of these, around 68% were for males and 32% were for females, which is consistent with the incidence pattern (Table 5.1). In 45% of these hospitalisations, liver cancer was the principal diagnosis (Table 5.2).
Table 5.2: Hospitalisations related to liver cancer, by sex, 2016–17 Males Females Persons
Number % ASR Number % ASR Number % ASR
Principal diagnosis of cancer 4,188 32.7 3.1 1,506 11.8 1.0 5,694 44.5 2.0
Additional diagnosis of cancer 4,454 34.8 3.3 2,652 20.7 1.9 7,106 55.5 2.5
All liver cancer-related hospitalisations 8,642 67.5 6.3 4,158 32.5 2.9 12,800 100.0 4.6
Source: AIHW NHMD.
Age group In 2016–17, the age-specific liver cancer-related hospitalisation rate remained relatively low for those aged 0–49. The rate then increased to age group 75–79, before decreasing in older age groups (Figure 5.7). There was a large difference between males and females aged 50 and older, with males having a more rapid increase than females.
Source: Table A5.5.
Figure 5.7: Age-specific rates of hospitalisations related to liver cancer, by age group and sex, 2016–17
Trend Between 2001–02 and 2016–17, the age-standardised liver cancer-related hospitalisation rate increased from 2.1 to 4.6 per 10,000 (Figure 5.8). A similar trend is observed in both males and females, with males consistently having higher rates than females.
0–4
5–9
10–1
4
15–1
9
20–2
4
25–2
9
30–3
4
35–3
9
40–4
4
45–4
9
50–5
4
55–5
9
60–6
4
65–6
9
70–7
4
75–7
9
80–8
4
85+
Age group (years)
0
5
10
15
20
25
30
35
Rate (per 10,000)
PersonsFemalesMales

Colorectal and other digestive-tract cancers 45
Source: Table A5.6.
Figure 5.8: All liver cancer-related hospitalisations, by sex, 2001–02 to 2016–17
Selected surgical procedures In 2016–17, there were 540 surgical procedures (see Table D7 for details) related to liver cancer. There were more procedures in males (70%) than in females (30%) (Table 5.3), which was consistent with the incidence pattern (Table 5.1). The number of surgical procedures related to liver cancer appears low compared with the number of new cases diagnosed each year and could possibly indicate advanced disease at diagnosis. A segmental resection of the liver was reported for 37% of surgical procedures. A transplantation of the liver was reported for 6% of surgical procedures. See Appendix C for information on how surgical procedures were calculated.
Table 5.3: Number of surgical procedures, liver cancer, by sex, 2016–17 Males Females Persons
Procedure type Number % Number % Number %
Excision of lesion of liver 28 7.4 10 6.3 38 7.0
Segmental resection of liver 144 37.9 58 36.3 202 37.4
Lobectomy of liver 120 31.6 59 36.9 179 33.1
Trisegmental resection of liver 54 14.2 27 16.9 81 15.0
Total hepatectomy 6 1.6 — — 6 1.1
Transplantation of liver 28 7.4 6 3.8 34 6.3
All surgical procedures 380 100.0 160 100.0 540 100.0
Source: AIHW NHMD.
Chemotherapy In 2016–17, there were 4,422 chemotherapy procedures related to liver cancer. This accounted for 2.4% of all digestive-tract cancer chemotherapy procedures and 0.6% of all cancer-related chemotherapy procedures. Liver cancer chemotherapy procedures are ranked lower than its incidence pattern. This may reflect the fact that chemotherapy is not as effective in treating liver cancer as other digestive-tract cancers (American Cancer Society 2018). There were more chemotherapy procedures in males (55%) than females (45%) (Table A2.23), which was consistent with the incidence pattern (Table 5.1). See Appendix C for information on how chemotherapy procedures were calculated.
2001
–02
2002
–03
2003
–04
2004
–05
2005
–06
2006
–07
2007
–08
2008
–09
2009
–10
2010
–11
2011
–12
2012
–13
2013
–14
2014
–15
2015
–16
2016
–17
Financial year
0
2
4
6
8
Rate (per 10,000)
PersonsFemalesMales

46 Colorectal and other digestive-tract cancers
Radiotherapy In 2016–17, there were 244 radiotherapy courses where the principal diagnosis was recorded as liver cancer. This accounted for 0.4% of all radiotherapy courses provided and 3.9% of all digestive-tract cancer-related radiotherapy courses. More courses were provided to males than females (Table A2.24).
5.3 Survivorship population Cancer survivorship focuses on the health and wellbeing of a person living with and beyond cancer (Cancer Australia 2017). See Section 2.4 for a full description of cancer survivorship, including data limitations. At the end of 2013, there were 2,803 people alive who were diagnosed with liver cancer in the previous 5 years. Five-year prevalence for liver cancer in males was 2.8 times that of females. Liver cancer has with the greatest difference in 5-year prevalence between males and females out of all digestive-tract cancer (Table 5.4).
Table 5.4: Limited-duration prevalence of liver cancer, by sex, as at end of 2013 Males Females Persons
Number
% of prevalent
cases Rate Number
% of prevalent
cases Rate Number
% of prevalent
cases Rate
1-year prevalence 879 74.1 7.6 307 25.9 2.6 1,186 100.0 5.1
5-year prevalence 2,063 73.6 17.8 740 26.4 6.3 2,803 100.0 12.0
32-year prevalence 2,997 72.4 25.9 1,141 27.6 9.7 4,138 100.0 17.8
Source: AIHW ACD 2014.
Age group Five-year prevalence rates for liver cancer generally increased with age from those aged 0–14 (decreasing slightly for those aged 15–34) to those aged 75–84, before decreasing for those aged 85 and older (Figure 5.9). People aged 75 or older accounted for around a quarter (24%) of all 5-year prevalent cases of liver cancer.
Source: Table A5.7.
Figure 5.9: Five-year prevalence of liver cancer, by age group, as at end of 2013
0–14 15–24 25–34 35–44 45–54 55–64 65–74 75–84 85+
Age group (years)
0
200
400
600
800
1,000
Number
0
10
20
30
40
50
60
Rate (per 100,000)
RateNumber

Colorectal and other digestive-tract cancers 47
5.4 Burden from liver cancer In 2011, Australians lost 29,376 DALYs due to premature death or living with disability due to liver cancer. This accounted for 3.5% of the total cancer burden, ranking liver cancer as the 10th most common cause of cancer burden and the 3rd highest cause of digestive-tract cancer burden. Liver cancer ranked higher in burden compared with other more common digestive-tract cancers, due to the low survival rates and high fatal burden. Males accounted for 3 times the proportion of the burden (74%) than females (26%) (Table 5.5).
Most of the liver cancer burden was due to dying prematurely (99%). Compared with other digestive-tract cancers, there was a smaller non-fatal burden. Half (50%) of the non-fatal burden from liver cancer is due to the metastatic and terminal phase (30% and 20%, respectively) (Table A2.26). This includes health loss from various treatment regimens to either control the spread of the disease or to minimise pain. This reflects the poor prognosis of survival for liver cancer (AIHW 2017c).
Table 5.5: Burden of disease from liver cancer, by sex, 2011 Males Females Persons
Number % of cancer
burden Rank Number % of cancer
burden Rank Number % of cancer
burden Rank
Fatal burden (YLL) 21,523 4.9 6 7,544 2.2 12 29,067 3.7 10
Non-fatal burden (YLD) 220 0.8 19 89 0.4 24 309 0.6 24
Total burden (DALYs) 21,743 4.6 6 7,632 2.1 12 29,376 3.5 10
Source: AIHW burden of disease database 2011.
Age group In 2011, the burden of liver cancer varied across age groups (AIHW 2017c). Children (0–14) lost 251 DALYs due to premature death or living with disability as a result of liver cancer. Among males, liver cancer was the 5th leading cause of cancer burden, accounting for 3.4% of the total burden. Among females, it was the 6th leading cause of cancer burden, accounting for 2.0% of the total burden.
Adolescents and young adults (15–24) lost 128 DALYs due to premature death or living with disability as a result of liver cancer. Among males in this age group, liver cancer was the 10th leading cause of cancer burden, accounting for 1.6% of the total burden. Among females, it was the 12th leading cause of cancer burden, accounting for 2.2% of the total burden.
Adults (25–64) lost 15,842 DALYs due to premature death or living with disability as a result of liver cancer. Among males in this age group, liver cancer was the 4th leading cause of cancer burden, accounting for 6.5% of the total burden. Among females, it was the 14th leading cause of cancer burden, accounting for 1.7% of the total burden.
Older adults (65+) lost 13,154 DALYs due to premature death or living with disability as a result of liver cancer. Among males in this age group, liver cancer was the 10th leading cause of cancer burden, accounting for 3.3% of the total burden. Among females, it was the 9th leading cause of cancer burden, accounting for 2.5% of the total burden (Table A2.27).
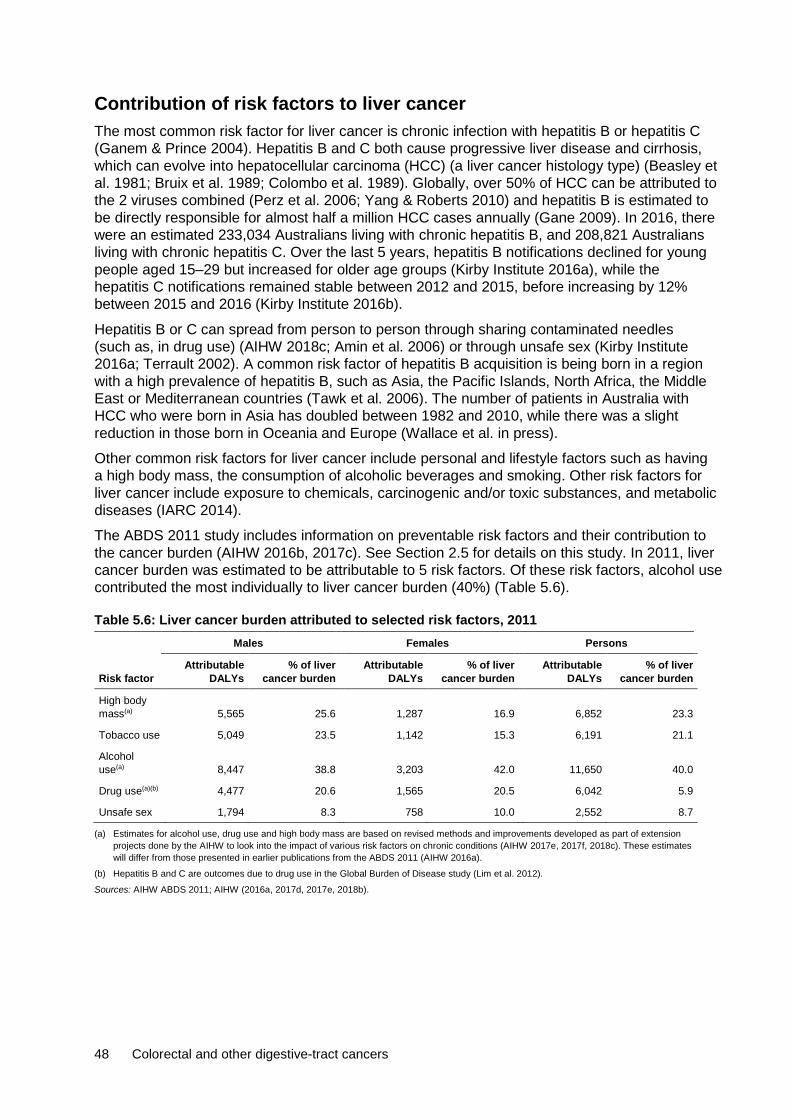
48 Colorectal and other digestive-tract cancers
Contribution of risk factors to liver cancer The most common risk factor for liver cancer is chronic infection with hepatitis B or hepatitis C (Ganem & Prince 2004). Hepatitis B and C both cause progressive liver disease and cirrhosis, which can evolve into hepatocellular carcinoma (HCC) (a liver cancer histology type) (Beasley et al. 1981; Bruix et al. 1989; Colombo et al. 1989). Globally, over 50% of HCC can be attributed to the 2 viruses combined (Perz et al. 2006; Yang & Roberts 2010) and hepatitis B is estimated to be directly responsible for almost half a million HCC cases annually (Gane 2009). In 2016, there were an estimated 233,034 Australians living with chronic hepatitis B, and 208,821 Australians living with chronic hepatitis C. Over the last 5 years, hepatitis B notifications declined for young people aged 15–29 but increased for older age groups (Kirby Institute 2016a), while the hepatitis C notifications remained stable between 2012 and 2015, before increasing by 12% between 2015 and 2016 (Kirby Institute 2016b).
Hepatitis B or C can spread from person to person through sharing contaminated needles (such as, in drug use) (AIHW 2018c; Amin et al. 2006) or through unsafe sex (Kirby Institute 2016a; Terrault 2002). A common risk factor of hepatitis B acquisition is being born in a region with a high prevalence of hepatitis B, such as Asia, the Pacific Islands, North Africa, the Middle East or Mediterranean countries (Tawk et al. 2006). The number of patients in Australia with HCC who were born in Asia has doubled between 1982 and 2010, while there was a slight reduction in those born in Oceania and Europe (Wallace et al. in press).
Other common risk factors for liver cancer include personal and lifestyle factors such as having a high body mass, the consumption of alcoholic beverages and smoking. Other risk factors for liver cancer include exposure to chemicals, carcinogenic and/or toxic substances, and metabolic diseases (IARC 2014).
The ABDS 2011 study includes information on preventable risk factors and their contribution to the cancer burden (AIHW 2016b, 2017c). See Section 2.5 for details on this study. In 2011, liver cancer burden was estimated to be attributable to 5 risk factors. Of these risk factors, alcohol use contributed the most individually to liver cancer burden (40%) (Table 5.6).
Table 5.6: Liver cancer burden attributed to selected risk factors, 2011 Males Females Persons
Risk factor Attributable
DALYs % of liver
cancer burden Attributable
DALYs % of liver
cancer burden Attributable
DALYs % of liver
cancer burden
High body mass(a) 5,565 25.6 1,287 16.9 6,852 23.3
Tobacco use 5,049 23.5 1,142 15.3 6,191 21.1
Alcohol use(a) 8,447 38.8 3,203 42.0 11,650 40.0
Drug use(a)(b) 4,477 20.6 1,565 20.5 6,042 5.9
Unsafe sex 1,794 8.3 758 10.0 2,552 8.7
(a) Estimates for alcohol use, drug use and high body mass are based on revised methods and improvements developed as part of extension projects done by the AIHW to look into the impact of various risk factors on chronic conditions (AIHW 2017e, 2017f, 2018c). These estimates will differ from those presented in earlier publications from the ABDS 2011 (AIHW 2016a).
(b) Hepatitis B and C are outcomes due to drug use in the Global Burden of Disease study (Lim et al. 2012).
Sources: AIHW ABDS 2011; AIHW (2016a, 2017d, 2017e, 2018b).

Colorectal and other digestive-tract cancers 49
6 Oesophageal cancer (C15)
1,685 new cases 1,447 deaths
21% 5-year relative survival 23,773 DALYs
6.1 A picture of oesophageal cancer in Australia In 2018, it is estimated that oesophageal cancer will be the 5th most commonly diagnosed digestive-tract cancer and the 5th most common cause of digestive-tract cancer-related deaths. Oesophageal cancer is estimated to be the 19th most commonly diagnosed type of cancer in Australia and the 12th leading cause of cancer death. In 2018, it is estimated that 1,685 new cases of oesophageal cancer will be diagnosed in Australia and that 1,447 people will die from this cancer. This is an average of 5 new cases a day and 4 deaths a day.
In 2010–2014, Australians diagnosed with oesophageal cancer had a 21% chance of surviving 5 years compared with their counterparts in the general population. This was the 5th lowest 5-year relative survival rate of all digestive-tract cancers and was lower than all cancers combined (69%).
Males were 2.8 times as likely to be diagnosed with oesophageal cancer and 3.2 times as likely to die from oesophageal cancer as females. Males and females had similar 5-year relative survival rates (Table 6.1).
Table 6.1: Estimated incidence and mortality (2018) and 5-year relative survival (2010–2014), oesophageal cancer, by sex
Incidence Mortality Survival
Sex Number ASR Number ASR 5-year relative survival (%)
Male 1,182 8.3 1,045 7.4 20.5
Female 504 3.0 403 2.3 22.0
Persons 1,685 5.6 1,447 4.8 21.0
Sources: AIHW ACD 2014; AIHW NMD.
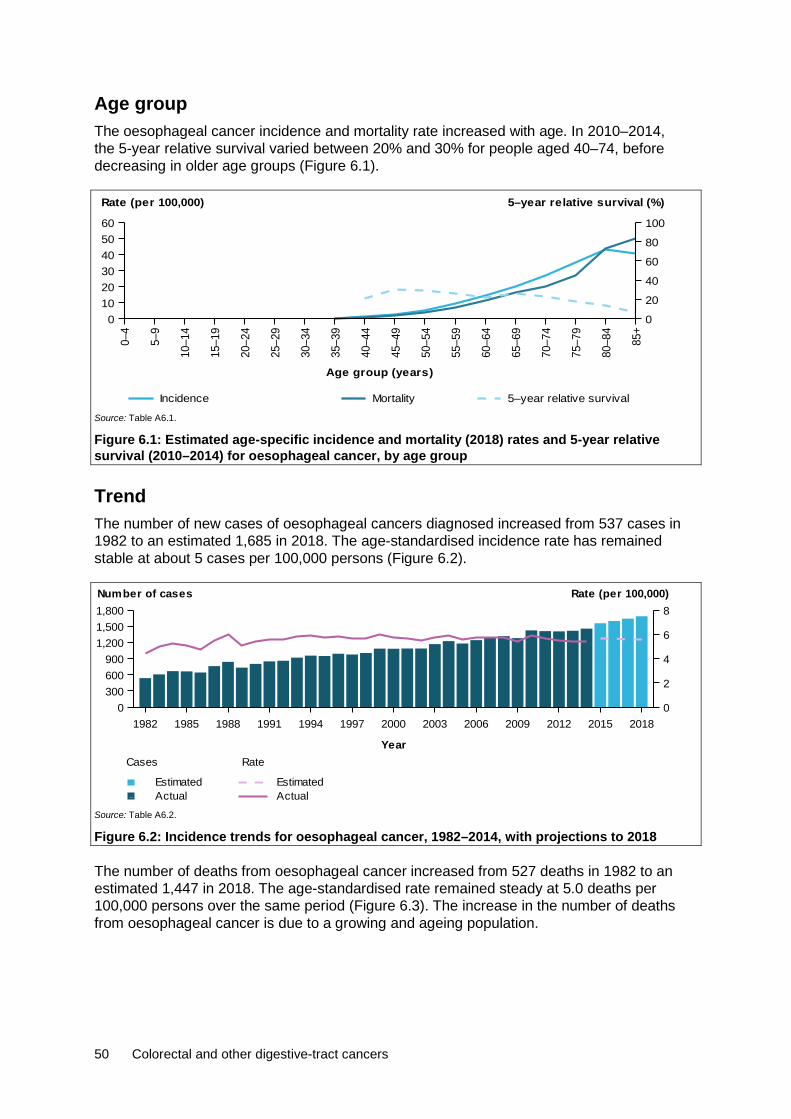
50 Colorectal and other digestive-tract cancers
Age group The oesophageal cancer incidence and mortality rate increased with age. In 2010–2014, the 5-year relative survival varied between 20% and 30% for people aged 40–74, before decreasing in older age groups (Figure 6.1).
Source: Table A6.1.
Figure 6.1: Estimated age-specific incidence and mortality (2018) rates and 5-year relative survival (2010–2014) for oesophageal cancer, by age group
Trend The number of new cases of oesophageal cancers diagnosed increased from 537 cases in 1982 to an estimated 1,685 in 2018. The age-standardised incidence rate has remained stable at about 5 cases per 100,000 persons (Figure 6.2).
Source: Table A6.2.
Figure 6.2: Incidence trends for oesophageal cancer, 1982–2014, with projections to 2018
The number of deaths from oesophageal cancer increased from 527 deaths in 1982 to an estimated 1,447 in 2018. The age-standardised rate remained steady at 5.0 deaths per 100,000 persons over the same period (Figure 6.3). The increase in the number of deaths from oesophageal cancer is due to a growing and ageing population.
0–4
5–9
10–1
4
15–1
9
20–2
4
25–2
9
30–3
4
35–3
9
40–4
4
45–4
9
50–5
4
55–5
9
60–6
4
65–6
9
70–7
4
75–7
9
80–8
4
85+
Age group (years)
0102030405060
Rate (per 100,000)
0
20
40
60
80
100
5–year relative survival (%)
Incidence Mortality 5–year relative survival
1982 1985 1988 1991 1994 1997 2000 2003 2006 2009 2012 2015 2018
Year
0300600900
1,2001,5001,800
0
2
4
6
8Number of cases Rate (per 100,000)
Rate
ActualEstimated
Cases
ActualEstimated

Colorectal and other digestive-tract cancers 51
Source: Table A6.2.
Figure 6.3: Mortality trends for oesophageal cancer, 1982–2016, with projections to 2018
Between 1985–1989 and 2010–2014, the 5-year relative survival rate for oesophageal cancer increased from 10% to 21%. Five-year relative survival was lower for oesophageal cancer than for all digestive-tract cancers combined and all cancers combined (Figure 6.4).
Source: Table A2.3.
Figure 6.4: Five-year relative survival for oesophageal cancer, all digestive-tract cancers combined and all cancers combined, 1985–1989 to 2010–2014
Characteristics
Subsite In 2013, the lower third of the oesophagus was the most common oesophageal cancer subsite, representing 45% of all oesophageal cancers diagnosed. Australians diagnosed with this subsite had a 22% chance of surviving 5 years compared with their counterparts in the general population. This was higher than the 5-year relative survival rate for all oesophagus cancers (21%). The 5-year relative survival rate for this subsite was similar to other oesophageal subsites (Figure 6.5).
1982 1985 1988 1991 1994 1997 2000 2003 2006 2009 2012 2015 2018
Year
0
400
800
1,200
1,600
0
2
4
6
8
10Number of deaths Rate (per 100,000)
Rate
ActualEstimated
Cases
ActualEstimated
1985–1989 1990–1994 1995–1999 2000–2004 2005–2009 2010–2014
Period
0
20
40
60
80
100
5-year relative survival (%)
All cancers combinedAll digestive cancers combinedOesophagus

52 Colorectal and other digestive-tract cancers
Source: Table A6.3.
Figure 6.5: Incidence (2013) and 5-year relative survival (2010–2014) for oesophageal cancer, by subsite
Histology In 2013, adenocarcinomas was the most common oesophageal cancer histological type, representing 53% of all oesophageal cancer cases diagnosed. Between 1982 and 2013, the number of adenocarcinomas cases increased from 75 cases in 1982 to 756 cases in 2013. Over the same period, the number of squamous cell carcinomas (previously the most common oesophageal cancer) fluctuated between 360 and 509 cases. The increase in adenocarcinomas may be related to increasing rates of obesity (AIHW 2018a) and gastro-oesophageal reflux disease (GORD) (WCRF/AICR 2007).
Australians diagnosed with adenocarcinomas had a 23% chance of surviving 5 years compared with their counterparts in the general population. This was higher than the 5-year relative survival rate for all oesophagus cancers (21%) and was the highest 5-year relative survival rate for oesophageal histological types. Five-year relative survival was lowest for unspecified carcinomas (8.6%) (Figure 6.6). Low survival rates for unspecified neoplasms and unspecified carcinomas may reflect cancers unsuitable for biopsy, treatment in patients with advanced disease at diagnosis or significant comorbidities.
Source: Table A6.4.
Figure 6.6: Incidence (2013) and 5-year relative survival (2010–2014) for oesophageal cancer, by histology
Upper third Middle third Low er thirdunspecif ied
Overlapping &0
200
400
600
800
1,000
Number
0
20
40
60
80
100
5-year relative survival (%)
Number of new cases 5-year relative survival
Squamous AdenocarcinomascarcinomasUnspecif ied
neoplasmsUnspecif ied
0
200
400
600
800
Number
0
20
40
60
80
100
5-year relative survival (%)
Number of new cases 5-year relative survival
Colorectal and other digestive-tract cancers 53
Population groups
Indigenous status Indigenous Australians living in the jurisdictions for which data were available (see notes on page vii for more details) were 2.2 times as likely to be diagnosed with oesophageal cancer in 2009–2013 and 1.7 times as likely to die from oesophageal cancer in 2012–2016 as non-Indigenous Australians. The incidence (2.2) and mortality (1.7) rate ratio between Indigenous and non-Indigenous Australians for oesophageal cancer was higher than the same incidence rate ratio (1.1) and mortality rate ratio (1.4) for all cancers combined. One-year relative survival was lower in Indigenous Australians (37%) than in non-Indigenous Australians (48%) (Table A2.9).
Remoteness area Australians living in Remote areas of Australia were 1.4 times as likely to be diagnosed with oesophageal cancer in 2009–2013 (Table A2.10) and 1.5 times as likely to die from oesophageal cancer in 2011–2016, compared with Australians living in Major cities (Table A2.11). The oesophageal cancer incidence (1.4) and mortality (1.2) rate ratio for Australians living in Very remote areas compared with those living in Major cities was higher than the same incidence (0.9) and mortality (1.2) rate ratio for all cancers combined. The 5-year observed survival rate was lower for Australians living in Outer regional areas (15%) and higher for Australians living in Major cities (20%). Note that observed survival could not be calculated for Remote and Very remote areas due to small numbers (Table A2.12).
Socioeconomic disadvantage Australians in the lowest socioeconomic group were 1.5 times as likely to be diagnosed with oesophageal cancer in 2009–2013 (Table A2.13) and 1.5 times as likely to die from oesophageal cancer in 2012–2016 compared with Australians in the highest socioeconomic group (Table A2.14). The oesophageal cancer incidence (1.5) and mortality (1.5) rate ratio between Australians in the lowest and highest socioeconomic group was higher than the same incidence (1.0) and mortality (1.4) rate ratio for all cancers combined. The 5-year observed survival rate was lower for Australians in the lowest socioeconomic group (16%) and higher for Australians in the two highest socioeconomic group (21%) (Table A2.15).
6.2 Treatment Hospitalisations In 2016–17, there were 12,863 oesophageal cancer-related hospitalisations. This accounted for 1.0% of cancer-related hospitalisations and 5.8% of digestive-tract cancer-related hospitalisations in Australia (Table A2.20). Of these, around 77% were for males and 23% were for females, which is consistent with the incidence pattern (Table 6.1). In 32% of these hospitalisations, oesophageal cancer was the principal diagnosis (Table 6.2).
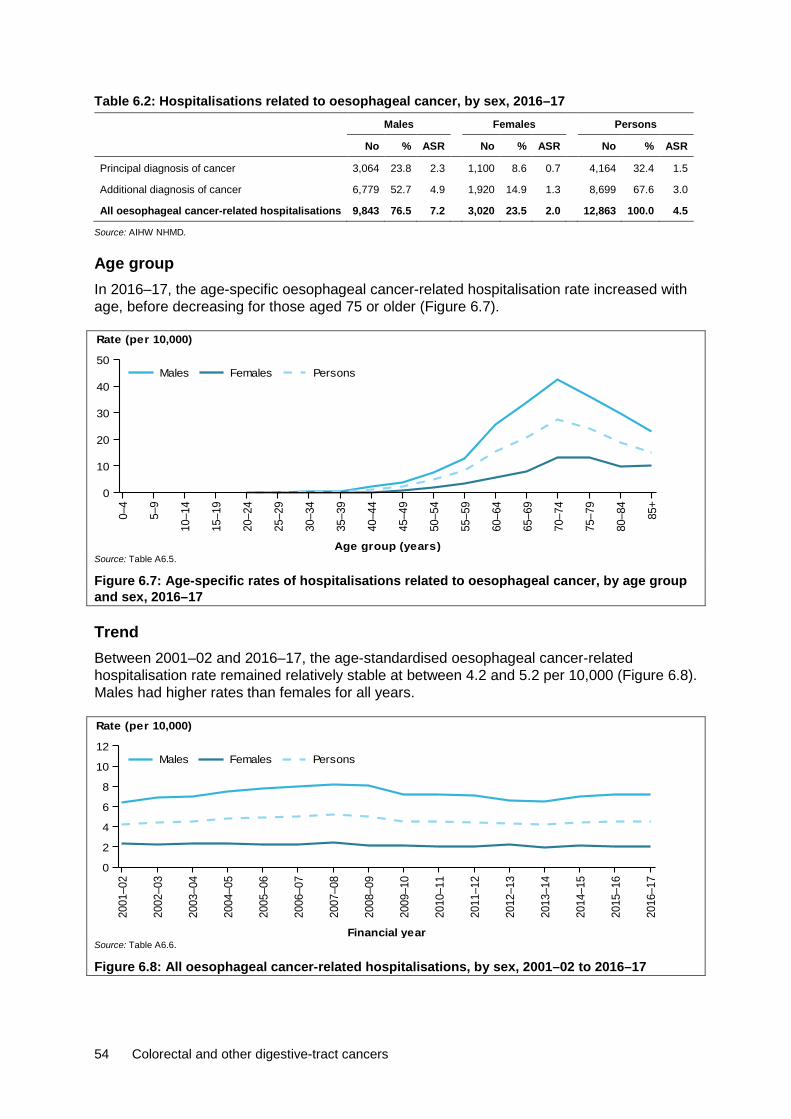
54 Colorectal and other digestive-tract cancers
Table 6.2: Hospitalisations related to oesophageal cancer, by sex, 2016–17 Males Females Persons
No % ASR No % ASR No % ASR
Principal diagnosis of cancer 3,064 23.8 2.3 1,100 8.6 0.7 4,164 32.4 1.5
Additional diagnosis of cancer 6,779 52.7 4.9 1,920 14.9 1.3 8,699 67.6 3.0
All oesophageal cancer-related hospitalisations 9,843 76.5 7.2 3,020 23.5 2.0 12,863 100.0 4.5
Source: AIHW NHMD.
Age group In 2016–17, the age-specific oesophageal cancer-related hospitalisation rate increased with age, before decreasing for those aged 75 or older (Figure 6.7).
Source: Table A6.5.
Figure 6.7: Age-specific rates of hospitalisations related to oesophageal cancer, by age group and sex, 2016–17
Trend Between 2001–02 and 2016–17, the age-standardised oesophageal cancer-related hospitalisation rate remained relatively stable at between 4.2 and 5.2 per 10,000 (Figure 6.8). Males had higher rates than females for all years.
Source: Table A6.6.
Figure 6.8: All oesophageal cancer-related hospitalisations, by sex, 2001–02 to 2016–17
0–4
5–9
10–1
4
15–1
9
20–2
4
25–2
9
30–3
4
35–3
9
40–4
4
45–4
9
50–5
4
55–5
9
60–6
4
65–6
9
70–7
4
75–7
9
80–8
4
85+
Age group (years)
0
10
20
30
40
50
Rate (per 10,000)
PersonsFemalesMales
2001
–02
2002
–03
2003
–04
2004
–05
2005
–06
2006
–07
2007
–08
2008
–09
2009
–10
2010
–11
2011
–12
2012
–13
2013
–14
2014
–15
2015
–16
2016
–17
Financial year
0
2
4
6
8
10
12
Rate (per 10,000)
PersonsFemalesMales
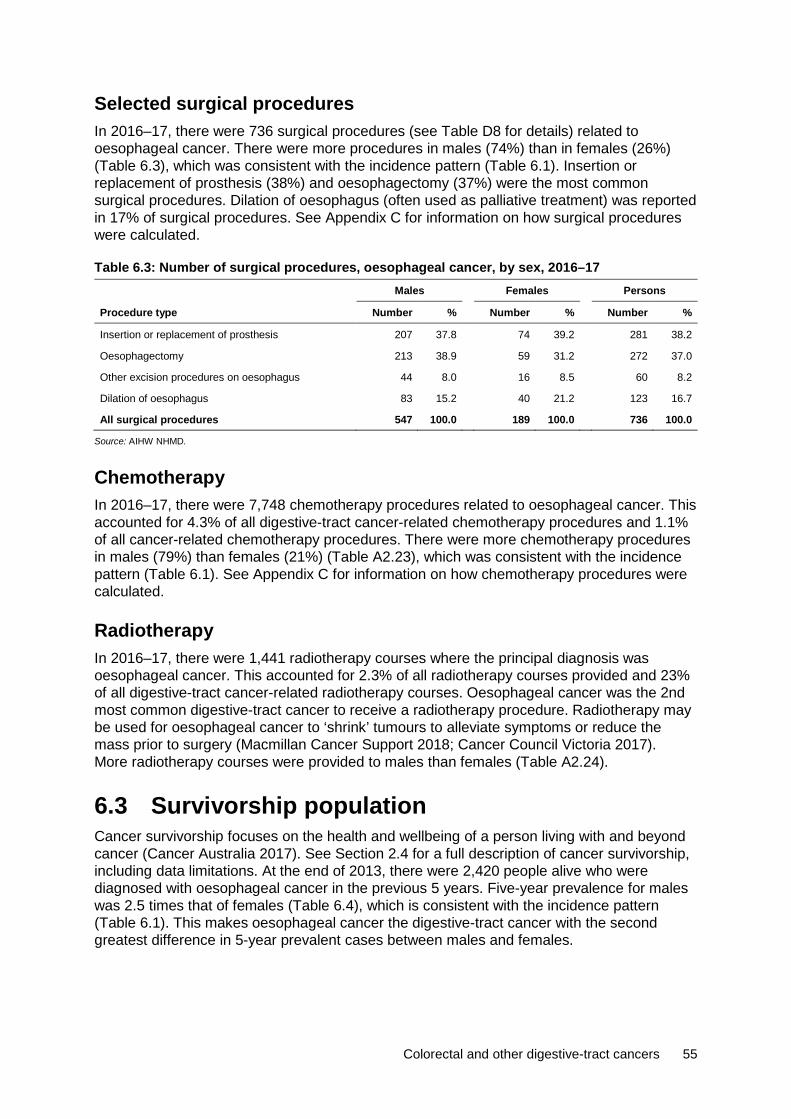
Colorectal and other digestive-tract cancers 55
Selected surgical procedures In 2016–17, there were 736 surgical procedures (see Table D8 for details) related to oesophageal cancer. There were more procedures in males (74%) than in females (26%) (Table 6.3), which was consistent with the incidence pattern (Table 6.1). Insertion or replacement of prosthesis (38%) and oesophagectomy (37%) were the most common surgical procedures. Dilation of oesophagus (often used as palliative treatment) was reported in 17% of surgical procedures. See Appendix C for information on how surgical procedures were calculated.
Table 6.3: Number of surgical procedures, oesophageal cancer, by sex, 2016–17 Males Females Persons
Procedure type Number % Number % Number %
Insertion or replacement of prosthesis 207 37.8 74 39.2 281 38.2
Oesophagectomy 213 38.9 59 31.2 272 37.0
Other excision procedures on oesophagus 44 8.0 16 8.5 60 8.2
Dilation of oesophagus 83 15.2 40 21.2 123 16.7
All surgical procedures 547 100.0 189 100.0 736 100.0
Source: AIHW NHMD.
Chemotherapy In 2016–17, there were 7,748 chemotherapy procedures related to oesophageal cancer. This accounted for 4.3% of all digestive-tract cancer-related chemotherapy procedures and 1.1% of all cancer-related chemotherapy procedures. There were more chemotherapy procedures in males (79%) than females (21%) (Table A2.23), which was consistent with the incidence pattern (Table 6.1). See Appendix C for information on how chemotherapy procedures were calculated.
Radiotherapy In 2016–17, there were 1,441 radiotherapy courses where the principal diagnosis was oesophageal cancer. This accounted for 2.3% of all radiotherapy courses provided and 23% of all digestive-tract cancer-related radiotherapy courses. Oesophageal cancer was the 2nd most common digestive-tract cancer to receive a radiotherapy procedure. Radiotherapy may be used for oesophageal cancer to ‘shrink’ tumours to alleviate symptoms or reduce the mass prior to surgery (Macmillan Cancer Support 2018; Cancer Council Victoria 2017). More radiotherapy courses were provided to males than females (Table A2.24).
6.3 Survivorship population Cancer survivorship focuses on the health and wellbeing of a person living with and beyond cancer (Cancer Australia 2017). See Section 2.4 for a full description of cancer survivorship, including data limitations. At the end of 2013, there were 2,420 people alive who were diagnosed with oesophageal cancer in the previous 5 years. Five-year prevalence for males was 2.5 times that of females (Table 6.4), which is consistent with the incidence pattern (Table 6.1). This makes oesophageal cancer the digestive-tract cancer with the second greatest difference in 5-year prevalent cases between males and females.
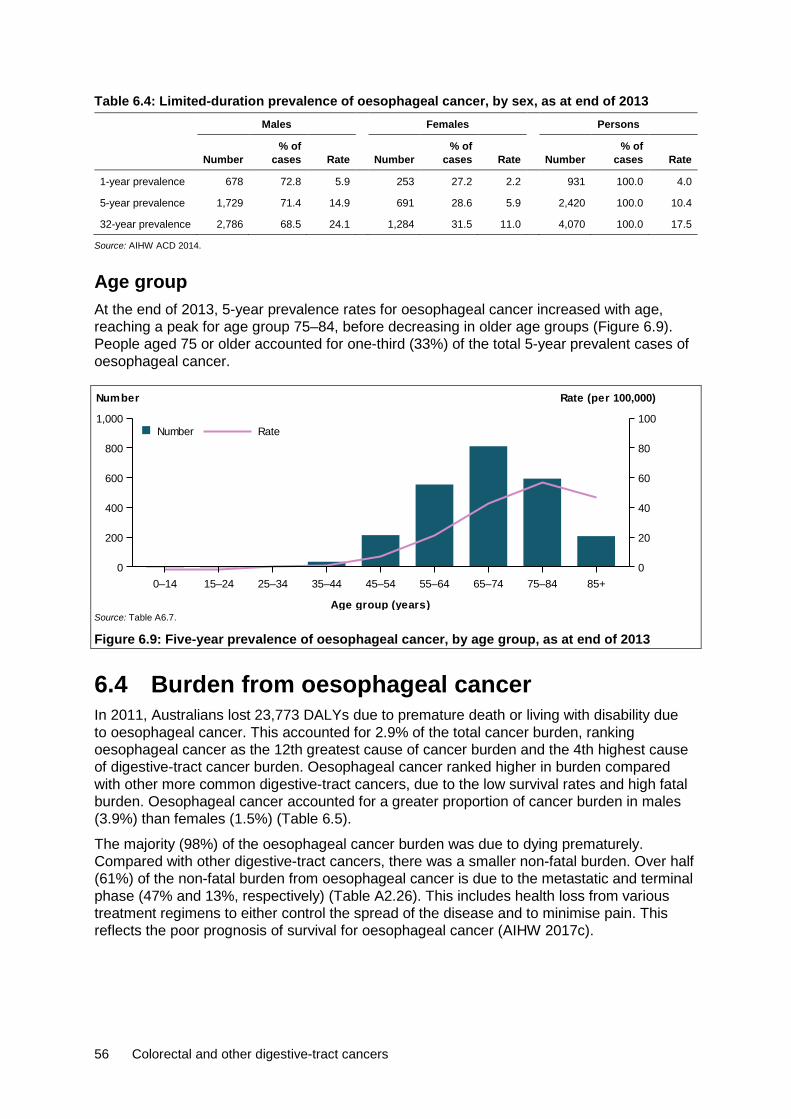
56 Colorectal and other digestive-tract cancers
Table 6.4: Limited-duration prevalence of oesophageal cancer, by sex, as at end of 2013 Males Females Persons
Number % of
cases Rate Number % of
cases Rate Number % of
cases Rate
1-year prevalence 678 72.8 5.9 253 27.2 2.2 931 100.0 4.0
5-year prevalence 1,729 71.4 14.9 691 28.6 5.9 2,420 100.0 10.4
32-year prevalence 2,786 68.5 24.1 1,284 31.5 11.0 4,070 100.0 17.5
Source: AIHW ACD 2014.
Age group At the end of 2013, 5-year prevalence rates for oesophageal cancer increased with age, reaching a peak for age group 75–84, before decreasing in older age groups (Figure 6.9). People aged 75 or older accounted for one-third (33%) of the total 5-year prevalent cases of oesophageal cancer.
Source: Table A6.7.
Figure 6.9: Five-year prevalence of oesophageal cancer, by age group, as at end of 2013
6.4 Burden from oesophageal cancer In 2011, Australians lost 23,773 DALYs due to premature death or living with disability due to oesophageal cancer. This accounted for 2.9% of the total cancer burden, ranking oesophageal cancer as the 12th greatest cause of cancer burden and the 4th highest cause of digestive-tract cancer burden. Oesophageal cancer ranked higher in burden compared with other more common digestive-tract cancers, due to the low survival rates and high fatal burden. Oesophageal cancer accounted for a greater proportion of cancer burden in males (3.9%) than females (1.5%) (Table 6.5).
The majority (98%) of the oesophageal cancer burden was due to dying prematurely. Compared with other digestive-tract cancers, there was a smaller non-fatal burden. Over half (61%) of the non-fatal burden from oesophageal cancer is due to the metastatic and terminal phase (47% and 13%, respectively) (Table A2.26). This includes health loss from various treatment regimens to either control the spread of the disease and to minimise pain. This reflects the poor prognosis of survival for oesophageal cancer (AIHW 2017c).
0–14 15–24 25–34 35–44 45–54 55–64 65–74 75–84 85+
Age group (years)
0
200
400
600
800
1,000
Number
0
20
40
60
80
100
Rate (per 100,000)
RateNumber
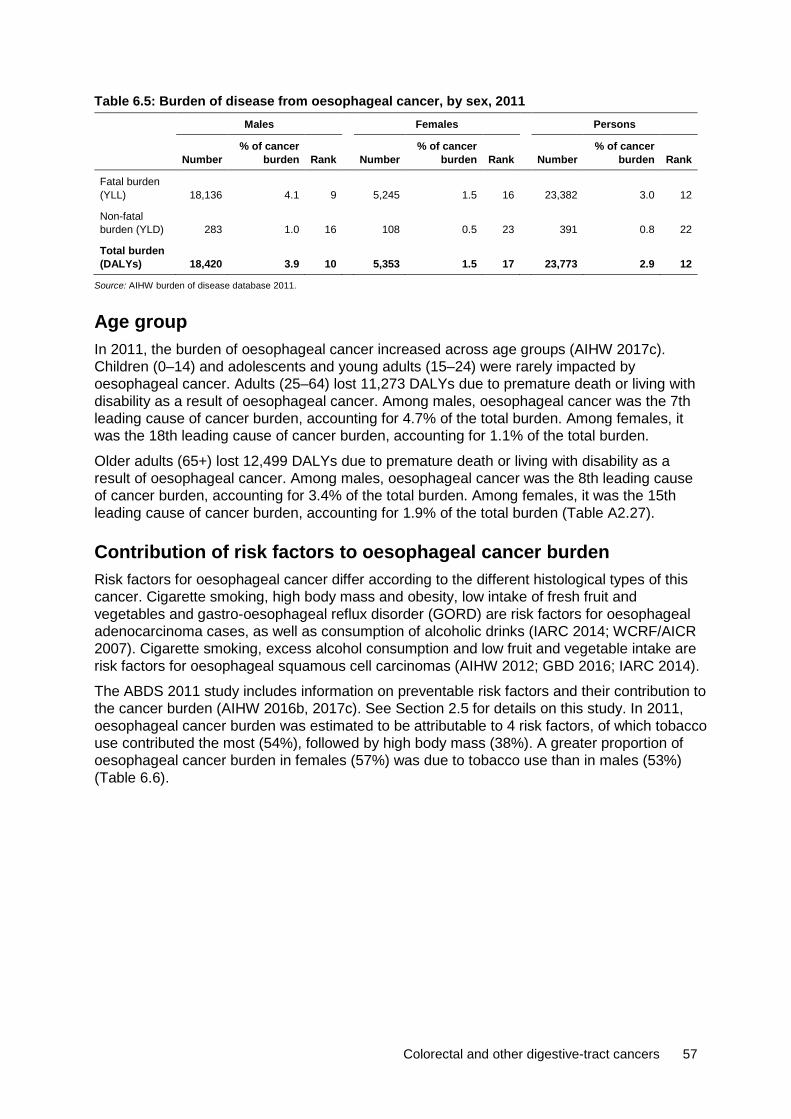
Colorectal and other digestive-tract cancers 57
Table 6.5: Burden of disease from oesophageal cancer, by sex, 2011 Males Females Persons
Number % of cancer
burden Rank Number % of cancer
burden Rank Number % of cancer
burden Rank
Fatal burden (YLL) 18,136 4.1 9 5,245 1.5 16 23,382 3.0 12
Non-fatal burden (YLD) 283 1.0 16 108 0.5 23 391 0.8 22
Total burden (DALYs) 18,420 3.9 10 5,353 1.5 17 23,773 2.9 12
Source: AIHW burden of disease database 2011.
Age group In 2011, the burden of oesophageal cancer increased across age groups (AIHW 2017c). Children (0–14) and adolescents and young adults (15–24) were rarely impacted by oesophageal cancer. Adults (25–64) lost 11,273 DALYs due to premature death or living with disability as a result of oesophageal cancer. Among males, oesophageal cancer was the 7th leading cause of cancer burden, accounting for 4.7% of the total burden. Among females, it was the 18th leading cause of cancer burden, accounting for 1.1% of the total burden.
Older adults (65+) lost 12,499 DALYs due to premature death or living with disability as a result of oesophageal cancer. Among males, oesophageal cancer was the 8th leading cause of cancer burden, accounting for 3.4% of the total burden. Among females, it was the 15th leading cause of cancer burden, accounting for 1.9% of the total burden (Table A2.27).
Contribution of risk factors to oesophageal cancer burden Risk factors for oesophageal cancer differ according to the different histological types of this cancer. Cigarette smoking, high body mass and obesity, low intake of fresh fruit and vegetables and gastro-oesophageal reflux disorder (GORD) are risk factors for oesophageal adenocarcinoma cases, as well as consumption of alcoholic drinks (IARC 2014; WCRF/AICR 2007). Cigarette smoking, excess alcohol consumption and low fruit and vegetable intake are risk factors for oesophageal squamous cell carcinomas (AIHW 2012; GBD 2016; IARC 2014).
The ABDS 2011 study includes information on preventable risk factors and their contribution to the cancer burden (AIHW 2016b, 2017c). See Section 2.5 for details on this study. In 2011, oesophageal cancer burden was estimated to be attributable to 4 risk factors, of which tobacco use contributed the most (54%), followed by high body mass (38%). A greater proportion of oesophageal cancer burden in females (57%) was due to tobacco use than in males (53%) (Table 6.6).
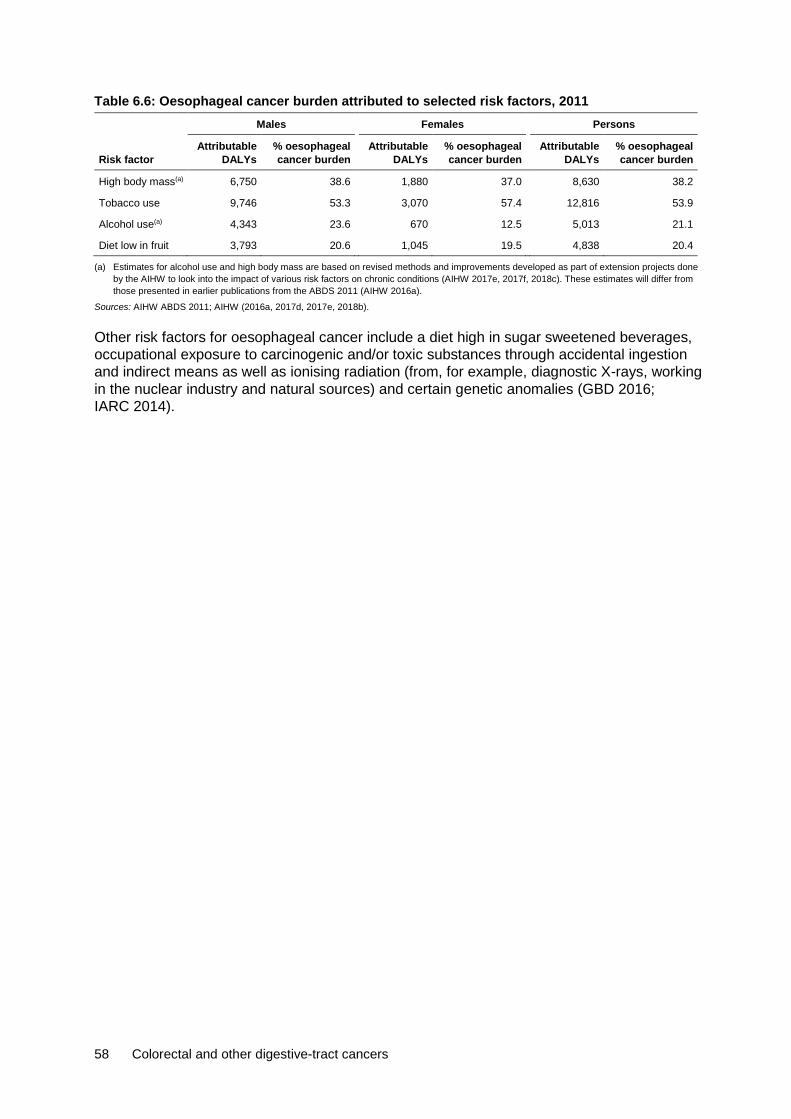
58 Colorectal and other digestive-tract cancers
Table 6.6: Oesophageal cancer burden attributed to selected risk factors, 2011 Males Females Persons
Risk factor Attributable
DALYs % oesophageal cancer burden
Attributable DALYs
% oesophageal cancer burden
Attributable DALYs
% oesophageal cancer burden
High body mass(a) 6,750 38.6 1,880 37.0 8,630 38.2
Tobacco use 9,746 53.3 3,070 57.4 12,816 53.9
Alcohol use(a) 4,343 23.6 670 12.5 5,013 21.1
Diet low in fruit 3,793 20.6 1,045 19.5 4,838 20.4
(a) Estimates for alcohol use and high body mass are based on revised methods and improvements developed as part of extension projects done by the AIHW to look into the impact of various risk factors on chronic conditions (AIHW 2017e, 2017f, 2018c). These estimates will differ from those presented in earlier publications from the ABDS 2011 (AIHW 2016a).
Sources: AIHW ABDS 2011; AIHW (2016a, 2017d, 2017e, 2018b).
Other risk factors for oesophageal cancer include a diet high in sugar sweetened beverages, occupational exposure to carcinogenic and/or toxic substances through accidental ingestion and indirect means as well as ionising radiation (from, for example, diagnostic X-rays, working in the nuclear industry and natural sources) and certain genetic anomalies (GBD 2016; IARC 2014).

Colorectal and other digestive-tract cancers 59
7 Cancer of the gallbladder and extrahepatic bile ducts (C23–C24)
931 new cases 262 deaths
20% 5-year relative survival 4,287 DALYs
7.1 A picture of cancer of the gallbladder and extrahepatic bile ducts in Australia
In 2018, it is estimated that cancer of the gallbladder and extrahepatic bile ducts will be the 6th most commonly diagnosed digestive-tract cancer and the 7th most common cause of digestive-tract cancer-related deaths. Cancer of the gallbladder and extrahepatic bile ducts is estimated to be the 24th most commonly diagnosed type of cancer in Australia and the 25th leading cause of cancer death. In 2018, it is estimated that 931 new cases of cancer of the gallbladder and extrahepatic bile ducts will be diagnosed in Australia and that 262 people will die from this cancer. This is an average of 3 new cases a day and 5 deaths a week.
In 2010–2014, Australians diagnosed with cancer of the gallbladder and extrahepatic bile ducts had a 20% chance of surviving 5 years compared with their counterparts in the general population (Table 7.1). This was the 6th highest 5-year relative survival rate of all digestive-tract cancers and was lower than all cancers combined (69%).
Males and females were equally likely to be diagnosed with and die from cancer of the gallbladder and extrahepatic bile ducts in 2018. Females had lower 5-year relative survival rates than males.
Table 7.1: Estimated incidence and mortality (2018) and 5-year relative survival (2010–2014), cancers of the gallbladder and extrahepatic bile ducts, by sex Incidence Mortality Survival
Sex Number ASR Number ASR 5-year relative survival (%)
Male 444 3.1 127 0.9 21.8
Female 487 3.0 135 0.8 17.8
Persons 931 3.1 262 0.9 19.7
Sources: AIHW ACD 2014; AIHW NMD.
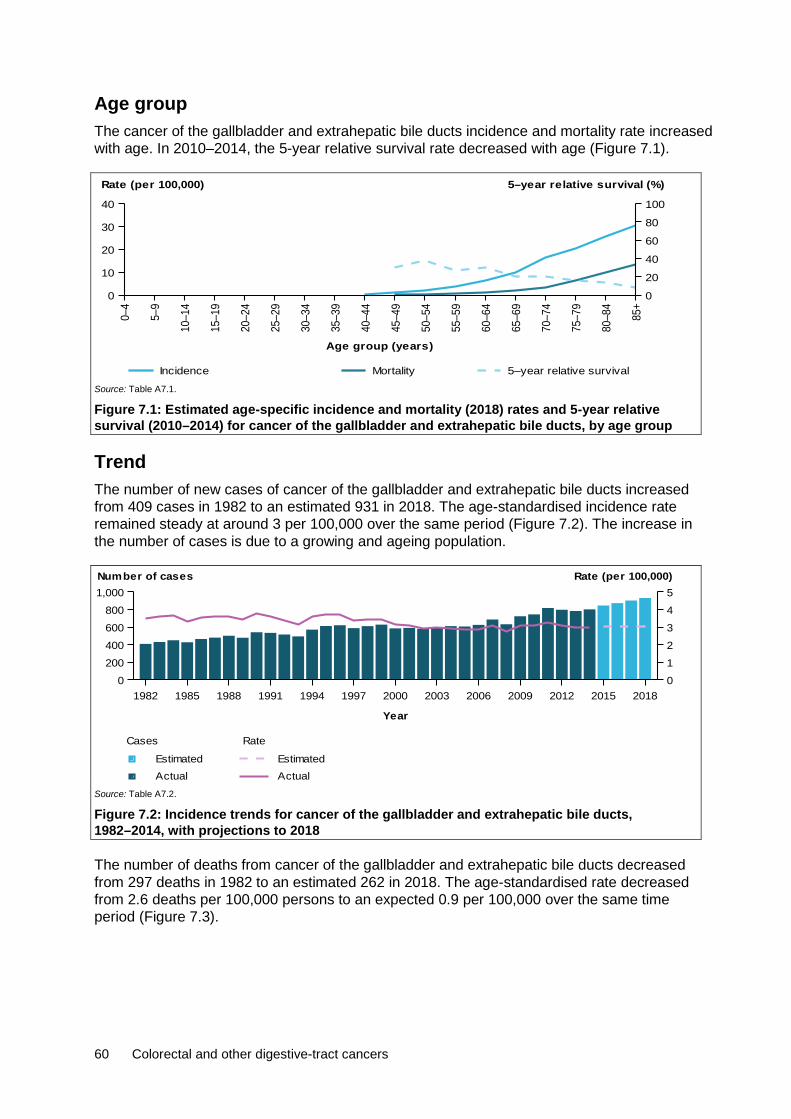
60 Colorectal and other digestive-tract cancers
Age group The cancer of the gallbladder and extrahepatic bile ducts incidence and mortality rate increased with age. In 2010–2014, the 5-year relative survival rate decreased with age (Figure 7.1).
Source: Table A7.1.
Figure 7.1: Estimated age-specific incidence and mortality (2018) rates and 5-year relative survival (2010–2014) for cancer of the gallbladder and extrahepatic bile ducts, by age group
Trend The number of new cases of cancer of the gallbladder and extrahepatic bile ducts increased from 409 cases in 1982 to an estimated 931 in 2018. The age-standardised incidence rate remained steady at around 3 per 100,000 over the same period (Figure 7.2). The increase in the number of cases is due to a growing and ageing population.
Source: Table A7.2.
Figure 7.2: Incidence trends for cancer of the gallbladder and extrahepatic bile ducts, 1982–2014, with projections to 2018
The number of deaths from cancer of the gallbladder and extrahepatic bile ducts decreased from 297 deaths in 1982 to an estimated 262 in 2018. The age-standardised rate decreased from 2.6 deaths per 100,000 persons to an expected 0.9 per 100,000 over the same time period (Figure 7.3).
0–4
5–9
10–1
4
15–1
9
20–2
4
25–2
9
30–3
4
35–3
9
40–4
4
45–4
9
50–5
4
55–5
9
60–6
4
65–6
9
70–7
4
75–7
9
80–8
4
85+
Age group (years)
0
10
20
30
40
Rate (per 100,000)
0
20
40
60
80
100
5–year relative survival (%)
Incidence Mortality 5–year relative survival
1982 1985 1988 1991 1994 1997 2000 2003 2006 2009 2012 2015 2018
Year
0200400600800
1,000
012345
Number of cases Rate (per 100,000)
Rate
ActualEstimated
Cases
ActualEstimated

Colorectal and other digestive-tract cancers 61
Source: Table A7.2.
Figure 7.3: Mortality trends for cancer of the gallbladder and extrahepatic bile ducts, 1982–2016, with projections to 2018
Between 1985–1989 and 2010–2014, the 5-year relative survival rate for cancer of the gallbladder and extrahepatic bile ducts increased from 12% to 20%. Five-year relative survival was lower for cancer of the gallbladder and extrahepatic bile ducts than for all digestive-tract cancers combined and all cancers combined (Figure 7.4).
Source: Table A2.3.
Figure 7.4: Five-year relative survival from cancer of the gallbladder and extrahepatic bile ducts, all digestive-tract cancers combined and all cancers combined, 1985–89 to 2010–14
Characteristics
Subsite In 2013, the gallbladder was the most common site of cancer, representing 43% of cases diagnosed. Australians diagnosed with gallbladder cancer had an 18% chance of surviving 5 years compared with their counterparts in the general population. This was lower than the 5-year relative survival rate for all cancers of the gallbladder and extrahepatic bile ducts (20%) and was the 2nd lowest 5-year relative survival rate for the cancer of the gallbladder and extrahepatic bile ducts subsite. Five-year relative survival was highest for cancer of the ampulla of Vater (38%) and lowest for the extrahepatic bile duct (13%) (Figure 7.5).
1982 1985 1988 1991 1994 1997 2000 2003 2006 2009 2012 2015 2018
Year
0
100
200
300
400
0
1
2
3
4Number of deaths Rate (per 100,000)
Rate
ActualEstimated
Cases
ActualEstimated
1985–1989 1990–1994 1995–1999 2000–2004 2005–2009 2010–2014
Period
0
20
40
60
80
100
5-year relative survival (%)
All cancers combinedAll digestive cancers combinedGallbladder

62 Colorectal and other digestive-tract cancers
Source: Table A7.3.
Figure 7.5: Incidence (2013) and 5-year relative survival (2010–2014) for cancer of the gallbladder and extrahepatic bile ducts, by subsite
Histology In 2013, adenocarcinoma was the most common histological type diagnosed in the gallbladder and extrahepatic bile ducts, representing 82% of cases diagnosed. Australians diagnosed with this histological type had a 21% chance of surviving 5 years compared with their counterparts in the general population. This was higher than the 5-year relative survival rate for all cancers of the gallbladder and extrahepatic bile ducts (20%) and was the 2nd highest 5-year relative survival rate for cancer of the gallbladder and extrahepatic bile ducts histological types.
Five-year relative survival was highest for neuroendocrine neoplasms (46%) and lowest for unspecified neoplasms (7.4%) (Figure 7.6). Low survival rates for unspecified neoplasms may reflect cancers unsuitable for biopsy, treatment in patients with advanced disease at diagnosis or significant comorbidities. Analysis of unpublished incidence data indicates unspecified neoplasms are more common in older age groups.
Source: Table A7.4.
Figure 7.6: Incidence (2013) and 5-year relative survival (2010–2014) for cancer of the gallbladder and extrahepatic bile ducts, by histology
Gallbladder Extrahepatic bile duct Ampulla of Vater
unspecif iedoverlapping &Bilary tract,
0
100
200
300
400
Number
0
20
40
60
80
100
5-year relative survival (%)
Number of new cases 5-year relative survival
Adenocarcinomas NeuroendocrinecarcinomasUnspecif ied
neoplasmsUnspecif ied
0100200300400500600700
Number
0
20
40
60
80
100
5-year relative survival (%)
Number of new cases 5-year relative survival

Colorectal and other digestive-tract cancers 63
Population groups
Indigenous status Indigenous Australians living in the jurisdictions for which data were available (see notes on page vii for more details) were 2.7 times as likely to be diagnosed with cancer of the gallbladder and extrahepatic bile ducts in 2009–2013 and 3.3 times as likely to die from cancer of the gallbladder and extrahepatic bile ducts in 2012–2016 than non-Indigenous Australians. The incidence (2.7) and mortality (3.3) rate ratio between Indigenous and non-Indigenous Australians for cancer of the gallbladder and extrahepatic bile ducts was higher than the same incidence rate ratio (1.1) and mortality rate ratio (1.4) for all cancers combined. One-year relative survival was lower in Indigenous Australians (26%) than in non-Indigenous Australians (47%) (Table A2.9).
Remoteness area Australians living in Very remote areas of Australia were 1.9 times as likely to be diagnosed with cancer of the gallbladder and extrahepatic bile ducts in 2009–2013 (Table A2.10) and 2.9 times as likely to die from this cancer in 2011–2016 as Australians living in Major cities (Table A2.11). The cancer of the gallbladder and extrahepatic bile ducts incidence (1.9) and mortality (2.9) rate ratio between Australians living in Very remote and Major cites was higher than the same incidence (0.9) and mortality (1.2) rate ratio for all cancers combined. The 5-year observed survival rate was lower for Australians living in Inner regional areas (14%) and higher for Australians living in Major cities (18%). Note that observed survival could not be calculated for Remote and Very remote areas due to small numbers (Table A2.12).
Socioeconomic disadvantage Australians in the lowest socioeconomic group were 1.2 times as likely to be diagnosed with cancer of the gallbladder and extrahepatic bile ducts in 2009–2013 (Table A2.13) and 1.6 times as likely to die from cancer of the gallbladder and extrahepatic bile ducts in 2012–2016 than Australians in the highest socioeconomic group (Table A2.14). The cancer of the gallbladder and extrahepatic bile ducts incidence (1.2) and mortality (1.6) rate ratio between Australians in the lowest and highest socioeconomic group was higher than the same incidence (1.0) rate ratio for all cancers combined and similar to the same mortality (1.4) rate ratio for all cancers combined. The 5-year observed survival rate was lower for Australians in the 2nd lowest socioeconomic group (12%) and higher for Australians in the highest socioeconomic group (22%) (Table A2.15).
7.2 Treatment Hospitalisations In 2016–17, there were 6,740 hospitalisations related to cancer of the gallbladder and extrahepatic bile ducts. This accounted for 0.5% of cancer-related hospitalisations and 3.0% of digestive-tract cancer-related hospitalisations in Australia (Table A2.20). Males and females had similar number of hospitalisations, which is consistent with the incidence pattern (Table 7.1). In 26% of these hospitalisations, cancer of the gallbladder and extrahepatic bile ducts was the principal diagnosis (Table 7.2).

64 Colorectal and other digestive-tract cancers
Table 7.2: Hospitalisations related to cancer of the gallbladder and extrahepatic bile ducts, by sex, 2016–17
Males Females Persons
No % ASR No % ASR No % ASR
Principal diagnosis of cancer 842 12.5 0.6 915 13.6 0.6 1,757 26.1 0.6
Additional diagnosis of cancer 2,527 37.5 1.9 2,456 36.4 1.6 4,983 73.9 1.8
All hospitalisations related to cancer of the gall bladder and extrahepatic bile ducts 3,369 50.0 2.5 3,371 50.0 2.2 6,740 100.0 2.4
Source: AIHW NHMD.
Age group In 2016–17, the age-specific cancer of the gallbladder and extrahepatic bile ducts-related hospitalisation rate increased with age, before generally decreasing for those aged 80 or older (Figure 7.7). There was little variation in the rate between males and females until age group 60–64, after which differences become more noticeable.
Source: Table A7.5.
Figure 7.7: Age-specific rates of hospitalisations related to cancer of the gallbladder and extrahepatic bile ducts, by age group and sex, 2016–17
Trend Between 2001–02 and 2016–17, the age-standardised cancer of the gallbladder and extrahepatic bile ducts-related hospitalisation rate increased from 1.5 to 2.4 per 10,000 (Figure 7.8). This trend is observed in both males and females.
0–4
5–9
10–1
4
15–1
9
20–2
4
25–2
9
30–3
4
35–3
9
40–4
4
45–4
9
50–5
4
55–5
9
60–6
4
65–6
9
70–7
4
75–7
9
80–8
4
85+
Age group (years)
0
5
10
15
20
25
Rate (per 10,000)
PersonsFemalesMales
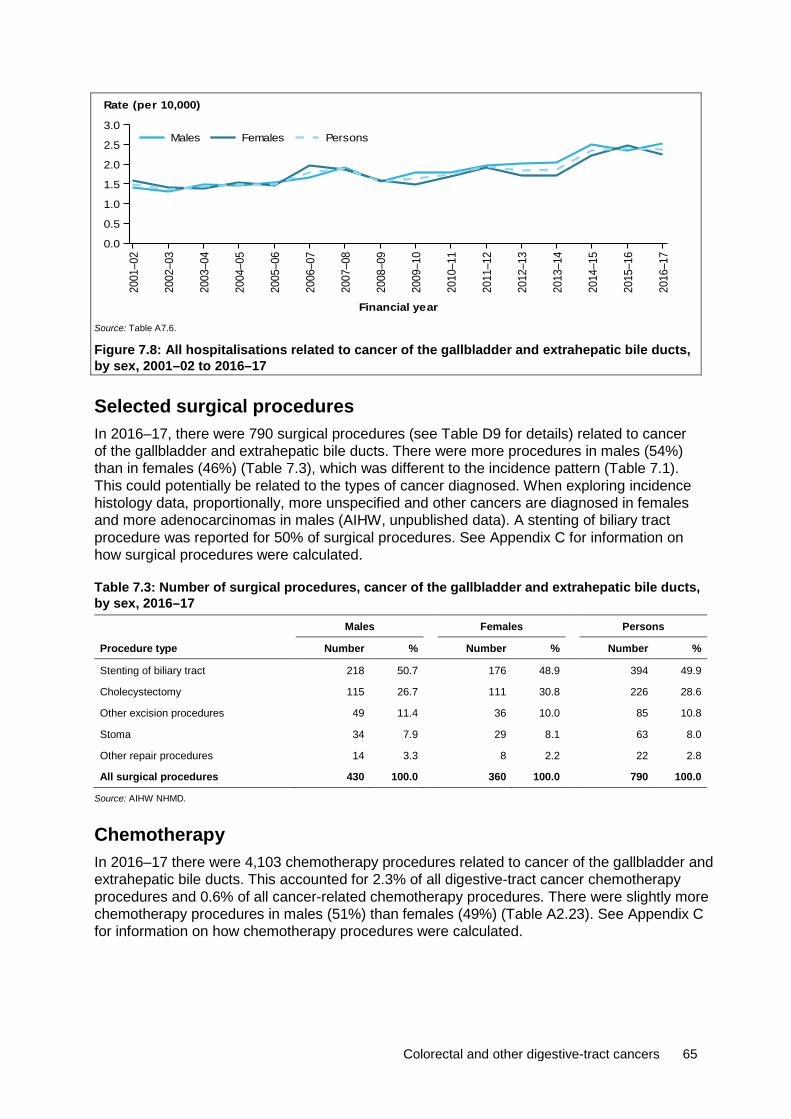
Colorectal and other digestive-tract cancers 65
Source: Table A7.6.
Figure 7.8: All hospitalisations related to cancer of the gallbladder and extrahepatic bile ducts, by sex, 2001–02 to 2016–17
Selected surgical procedures In 2016–17, there were 790 surgical procedures (see Table D9 for details) related to cancer of the gallbladder and extrahepatic bile ducts. There were more procedures in males (54%) than in females (46%) (Table 7.3), which was different to the incidence pattern (Table 7.1). This could potentially be related to the types of cancer diagnosed. When exploring incidence histology data, proportionally, more unspecified and other cancers are diagnosed in females and more adenocarcinomas in males (AIHW, unpublished data). A stenting of biliary tract procedure was reported for 50% of surgical procedures. See Appendix C for information on how surgical procedures were calculated.
Table 7.3: Number of surgical procedures, cancer of the gallbladder and extrahepatic bile ducts, by sex, 2016–17
Males Females Persons
Procedure type Number % Number % Number %
Stenting of biliary tract 218 50.7 176 48.9 394 49.9
Cholecystectomy 115 26.7 111 30.8 226 28.6
Other excision procedures 49 11.4 36 10.0 85 10.8
Stoma 34 7.9 29 8.1 63 8.0
Other repair procedures 14 3.3 8 2.2 22 2.8
All surgical procedures 430 100.0 360 100.0 790 100.0
Source: AIHW NHMD.
Chemotherapy In 2016–17 there were 4,103 chemotherapy procedures related to cancer of the gallbladder and extrahepatic bile ducts. This accounted for 2.3% of all digestive-tract cancer chemotherapy procedures and 0.6% of all cancer-related chemotherapy procedures. There were slightly more chemotherapy procedures in males (51%) than females (49%) (Table A2.23). See Appendix C for information on how chemotherapy procedures were calculated.
2001
–02
2002
–03
2003
–04
2004
–05
2005
–06
2006
–07
2007
–08
2008
–09
2009
–10
2010
–11
2011
–12
2012
–13
2013
–14
2014
–15
2015
–16
2016
–17
Financial year
0.0
0.5
1.0
1.5
2.0
2.5
3.0
Rate (per 10,000)
PersonsFemalesMales

66 Colorectal and other digestive-tract cancers
Radiotherapy In 2016–17, there were 135 radiotherapy courses where the principal diagnosis was recorded as cancer of the gallbladder and extrahepatic bile ducts. This accounted for 0.2% of all radiotherapy courses provided and 2.2% of all digestive-tract cancer-related radiotherapy courses. A similar number of courses were provided to males and females (Table A2.24).
7.3 Survivorship population Cancer survivorship focuses on the health and wellbeing of a person living with and beyond cancer (Cancer Australia 2017). See Section 2.4 for a full description of cancer survivorship, including data limitations. At the end of 2013, there were 1,329 people alive who were diagnosed with cancer of the gallbladder and extrahepatic bile ducts in the previous 5 years. The 5-year prevalence was similar for males and females (Table 7.4), which is consistent with the incidence pattern (Table 7.1).
Table 7.4: Limited-duration prevalence of cancer of the gallbladder and extrahepatic bile ducts, by sex, as at end of 2013
Males Females Persons
Number % of
cases Rate Number % of
cases Rate Number % of
cases Rate
1-year prevalence 264 50.0 2.3 264 50.0 2.3 528 100.0 2.3
5-year prevalence 665 50.0 5.7 664 50.0 5.7 1,329 100.0 5.7
32-year prevalence 1,153 47.7 10.0 1,266 52.3 10.8 2,419 100.0 10.4
Source: AIHW ACD 2014.
Age group Five-year prevalence rates for cancer of the gallbladder and extrahepatic bile ducts increased with age to a peak of 37 per 100,000 for people aged 85 or older (Figure 7.9). At the end of 2013, the majority (73%) of 5-year prevalent cases of cancer of the gallbladder and extrahepatic bile ducts were in those aged 65 and older.
Source: Table A7.7.
Figure 7.9: Five-year prevalence of cancer of the gallbladder and extrahepatic bile ducts, by age group, as at end of 2013.
0–14 15–24 25–34 35–44 45–54 55–64 65–74 75–84 85+
Age group (years)
0
100
200
300
400
500
Number
0
10
20
30
40
50
Rate (per 100,000)
RateNumber
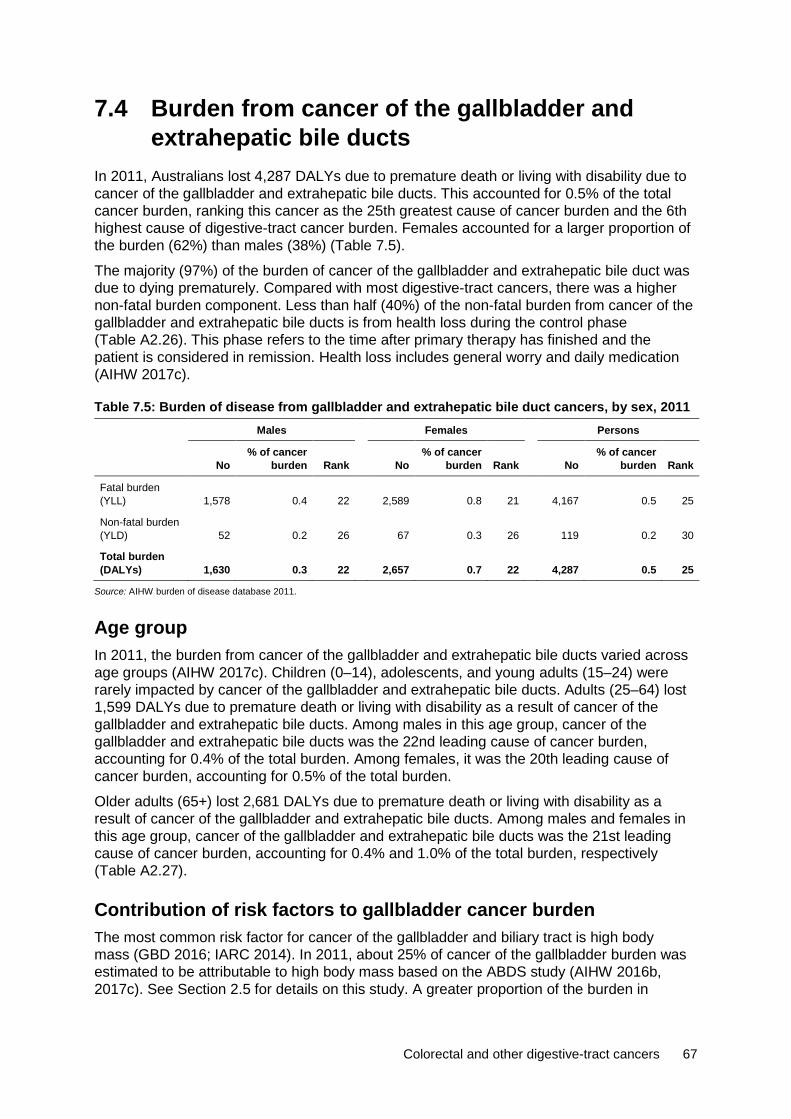
Colorectal and other digestive-tract cancers 67
7.4 Burden from cancer of the gallbladder and extrahepatic bile ducts
In 2011, Australians lost 4,287 DALYs due to premature death or living with disability due to cancer of the gallbladder and extrahepatic bile ducts. This accounted for 0.5% of the total cancer burden, ranking this cancer as the 25th greatest cause of cancer burden and the 6th highest cause of digestive-tract cancer burden. Females accounted for a larger proportion of the burden (62%) than males (38%) (Table 7.5).
The majority (97%) of the burden of cancer of the gallbladder and extrahepatic bile duct was due to dying prematurely. Compared with most digestive-tract cancers, there was a higher non-fatal burden component. Less than half (40%) of the non-fatal burden from cancer of the gallbladder and extrahepatic bile ducts is from health loss during the control phase (Table A2.26). This phase refers to the time after primary therapy has finished and the patient is considered in remission. Health loss includes general worry and daily medication (AIHW 2017c).
Table 7.5: Burden of disease from gallbladder and extrahepatic bile duct cancers, by sex, 2011 Males Females Persons
No % of cancer
burden Rank No % of cancer
burden Rank No % of cancer
burden Rank
Fatal burden (YLL) 1,578 0.4 22 2,589 0.8 21 4,167 0.5 25
Non-fatal burden (YLD) 52 0.2 26 67 0.3 26 119 0.2 30
Total burden (DALYs) 1,630 0.3 22 2,657 0.7 22 4,287 0.5 25
Source: AIHW burden of disease database 2011.
Age group In 2011, the burden from cancer of the gallbladder and extrahepatic bile ducts varied across age groups (AIHW 2017c). Children (0–14), adolescents, and young adults (15–24) were rarely impacted by cancer of the gallbladder and extrahepatic bile ducts. Adults (25–64) lost 1,599 DALYs due to premature death or living with disability as a result of cancer of the gallbladder and extrahepatic bile ducts. Among males in this age group, cancer of the gallbladder and extrahepatic bile ducts was the 22nd leading cause of cancer burden, accounting for 0.4% of the total burden. Among females, it was the 20th leading cause of cancer burden, accounting for 0.5% of the total burden.
Older adults (65+) lost 2,681 DALYs due to premature death or living with disability as a result of cancer of the gallbladder and extrahepatic bile ducts. Among males and females in this age group, cancer of the gallbladder and extrahepatic bile ducts was the 21st leading cause of cancer burden, accounting for 0.4% and 1.0% of the total burden, respectively (Table A2.27).
Contribution of risk factors to gallbladder cancer burden The most common risk factor for cancer of the gallbladder and biliary tract is high body mass (GBD 2016; IARC 2014). In 2011, about 25% of cancer of the gallbladder burden was estimated to be attributable to high body mass based on the ABDS study (AIHW 2016b, 2017c). See Section 2.5 for details on this study. A greater proportion of the burden in
68 Colorectal and other digestive-tract cancers
females (29%) was due to high body mass than in males (17%) (Table 7.6). Other risk factors include a diet high in sugar and sweetened beverages (GBD 2016), a history of cholelithiasis (gallstones), chronic infections of the gallbladder, environmental exposures and genetics (Hundal & Shaffer 2014; Jain et al. 2013; Sheth et al. 2000).
Table 7.6: Gallbladder cancer burden attributed to selected risk factors (DALYs and proportion), 2011 Males Females Persons
Risk factor Attributable
DALYs % gallbladder
cancer of burden
Attributable
DALYs % gallbladder
cancer of burden
Attributable
DALYs
% gallbladder cancer of
burden
High body mass(a) 271 16.7 782 29.4 1,054 24.6
(a) Estimates for high body mass are based on revised methods and improvements developed as part of extension projects done by the AIHW to look into the impact of various risk factors on chronic conditions (AIHW 2017e, 2017f, 2018c). These estimates will differ from those presented in earlier publications from the ABDS 2011 (AIHW 2016a).
Sources: AIHW ABDS 2011; AIHW (2016a, 2017d, 2017e, 2018b).
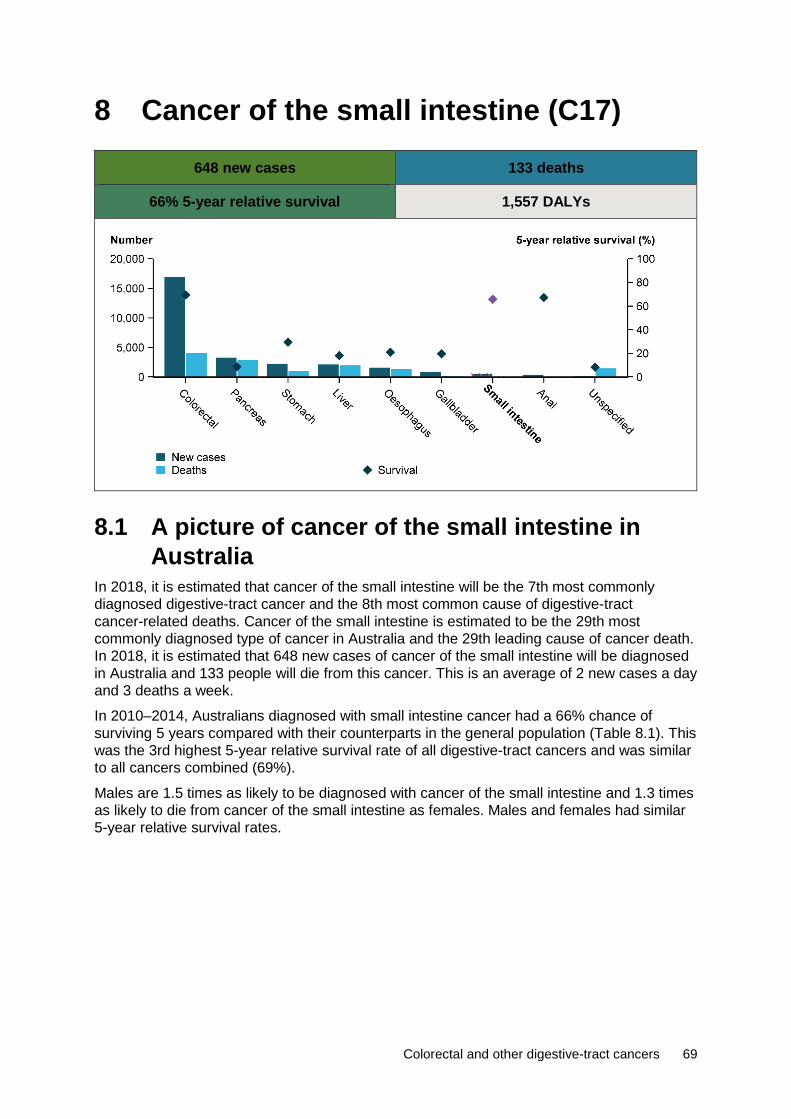
Colorectal and other digestive-tract cancers 69
8 Cancer of the small intestine (C17)
648 new cases 133 deaths
66% 5-year relative survival 1,557 DALYs
8.1 A picture of cancer of the small intestine in Australia
In 2018, it is estimated that cancer of the small intestine will be the 7th most commonly diagnosed digestive-tract cancer and the 8th most common cause of digestive-tract cancer-related deaths. Cancer of the small intestine is estimated to be the 29th most commonly diagnosed type of cancer in Australia and the 29th leading cause of cancer death. In 2018, it is estimated that 648 new cases of cancer of the small intestine will be diagnosed in Australia and 133 people will die from this cancer. This is an average of 2 new cases a day and 3 deaths a week.
In 2010–2014, Australians diagnosed with small intestine cancer had a 66% chance of surviving 5 years compared with their counterparts in the general population (Table 8.1). This was the 3rd highest 5-year relative survival rate of all digestive-tract cancers and was similar to all cancers combined (69%).
Males are 1.5 times as likely to be diagnosed with cancer of the small intestine and 1.3 times as likely to die from cancer of the small intestine as females. Males and females had similar 5-year relative survival rates.
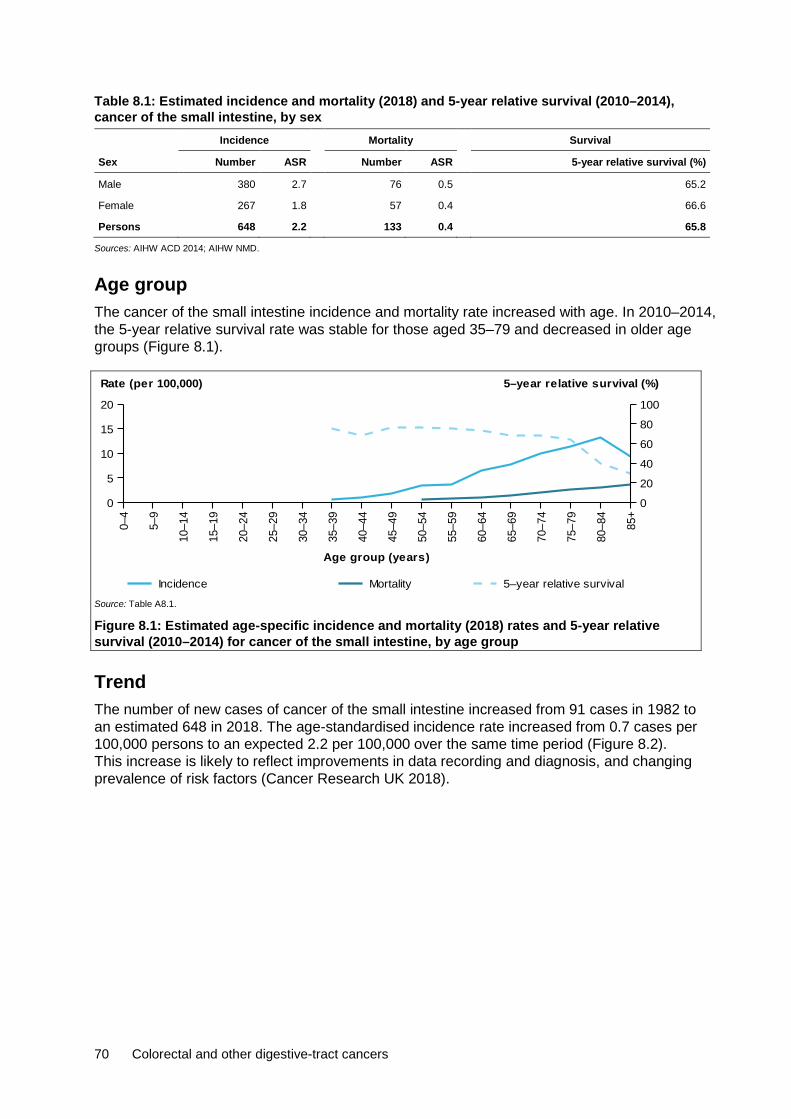
70 Colorectal and other digestive-tract cancers
Table 8.1: Estimated incidence and mortality (2018) and 5-year relative survival (2010–2014), cancer of the small intestine, by sex Incidence Mortality Survival
Sex Number ASR Number ASR 5-year relative survival (%)
Male 380 2.7 76 0.5 65.2
Female 267 1.8 57 0.4 66.6
Persons 648 2.2 133 0.4 65.8
Sources: AIHW ACD 2014; AIHW NMD.
Age group The cancer of the small intestine incidence and mortality rate increased with age. In 2010–2014, the 5-year relative survival rate was stable for those aged 35–79 and decreased in older age groups (Figure 8.1).
Source: Table A8.1.
Figure 8.1: Estimated age-specific incidence and mortality (2018) rates and 5-year relative survival (2010–2014) for cancer of the small intestine, by age group
Trend The number of new cases of cancer of the small intestine increased from 91 cases in 1982 to an estimated 648 in 2018. The age-standardised incidence rate increased from 0.7 cases per 100,000 persons to an expected 2.2 per 100,000 over the same time period (Figure 8.2). This increase is likely to reflect improvements in data recording and diagnosis, and changing prevalence of risk factors (Cancer Research UK 2018).
0–4
5–9
10–1
4
15–1
9
20–2
4
25–2
9
30–3
4
35–3
9
40–4
4
45–4
9
50–5
4
55–5
9
60–6
4
65–6
9
70–7
4
75–7
9
80–8
4
85+
Age group (years)
0
5
10
15
20
Rate (per 100,000)
0
20
40
60
80
100
5–year relative survival (%)
Incidence Mortality 5–year relative survival

Colorectal and other digestive-tract cancers 71
Source: Table A8.2.
Figure 8.2: Incidence trends for cancer of the small intestine, 1982–2014, with projections to 2018
The number of deaths from cancer of the small intestine increased from 44 deaths in 1982 to an estimated 133 in 2018. The age-standardised rate remained at 0.4 deaths per 100,000 persons over the same time period. The increase in the number of deaths from cancer of the small intestine is due to a growing and ageing population (Figure 8.3).
Source: Table A8.2.
Figure 8.3: Mortality trends for cancer of the small intestine, 1982–2016, with projections to 2018
Between 1985–1989 and 2010–2014, the 5-year relative survival rate for cancer of the small intestine increased from 42% to 66%. Five-year relative survival was higher for cancer of the small intestine than for all digestive-tract cancers combined, but lower than the all cancers combined 5-year relative survival rate (Figure 8.4).
1982 1985 1988 1991 1994 1997 2000 2003 2006 2009 2012 2015 2018
Year
0
200
400
600
800
012345
Number of cases Rate (per 100,000)
Rate
ActualEstimated
Cases
ActualEstimated
1982 1985 1988 1991 1994 1997 2000 2003 2006 2009 2012 2015 2018
Year
0
50
100
150
0
1
2Number of deaths Rate (per 100,000)
Rate
ActualEstimated
Cases
ActualEstimated

72 Colorectal and other digestive-tract cancers
Source: Table A2.3.
Figure 8.4: Five-year relative survival for cancer of the small intestine, all digestive-tract cancers combined and all cancers combined, 1985–1989 to 2010–2014
Characteristics
Subsite In 2013, small intestine, overlapping and unspecified, and cancer of the duodenum were the most common subsites diagnosed, both representing 33% of all cancers of the small intestine. Australians diagnosed with small intestine, overlapping and unspecified had a 71% chance of surviving 5 years compared with their counterparts in the general population. This was higher than the 5-year relative survival rate for all cancers of the small intestine (66%) and was the 2nd highest 5-year relative survival rate for cancer of the small intestine. Australian diagnosed with cancer of the duodenum had a 46% chance of surviving 5 years compared with their counterparts in the general population. This was the lowest 5-year relative survival rate for cancer of the small intestine. The highest 5-year relative survival rate was for cancer of the ileum (83%) (Figure 8.5).
Source: Table A8.3.
Figure 8.5: Incidence (2013) and 5-year relative survival (2010–2014) for cancer of the small intestine, by subsite
Histology In 2013, neuroendocrine neoplasms was the most common cancer of the small intestine histological type diagnosed, representing 55% of cases. Australians diagnosed with neuroendocrine neoplasms of the small intestine had an 88% chance of surviving 5 years
1985–1989 1990–1994 1995–1999 2000–2004 2005–2009 2010–2014
Period
0
20
40
60
80
100
5-year relative survival (%)
All cancers combinedAll digestive cancers combinedSmall intestine
Duodenum Jejunum Ileumunspecif ied
Overlapping &0
50
100
150
200
Number
0
20
40
60
80
100
5-year relative survival (%)
Number of new cases 5-year relative survival
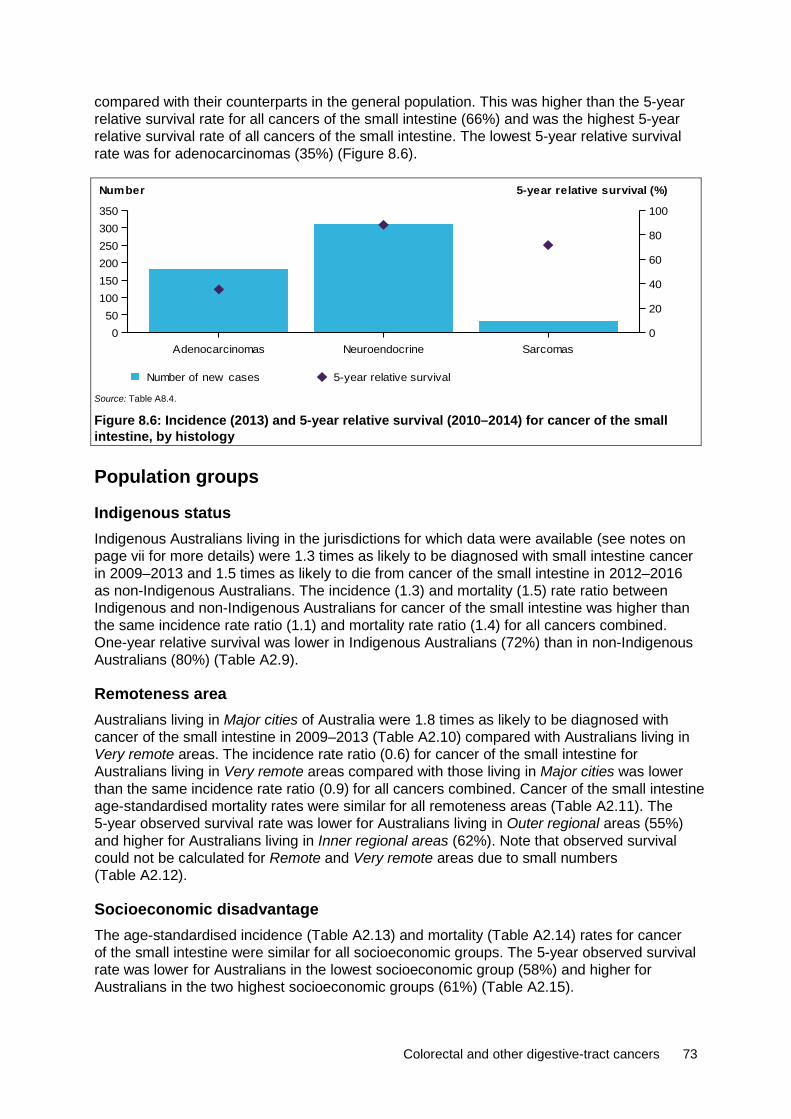
Colorectal and other digestive-tract cancers 73
compared with their counterparts in the general population. This was higher than the 5-year relative survival rate for all cancers of the small intestine (66%) and was the highest 5-year relative survival rate of all cancers of the small intestine. The lowest 5-year relative survival rate was for adenocarcinomas (35%) (Figure 8.6).
Source: Table A8.4.
Figure 8.6: Incidence (2013) and 5-year relative survival (2010–2014) for cancer of the small intestine, by histology
Population groups
Indigenous status Indigenous Australians living in the jurisdictions for which data were available (see notes on page vii for more details) were 1.3 times as likely to be diagnosed with small intestine cancer in 2009–2013 and 1.5 times as likely to die from cancer of the small intestine in 2012–2016 as non-Indigenous Australians. The incidence (1.3) and mortality (1.5) rate ratio between Indigenous and non-Indigenous Australians for cancer of the small intestine was higher than the same incidence rate ratio (1.1) and mortality rate ratio (1.4) for all cancers combined. One-year relative survival was lower in Indigenous Australians (72%) than in non-Indigenous Australians (80%) (Table A2.9).
Remoteness area Australians living in Major cities of Australia were 1.8 times as likely to be diagnosed with cancer of the small intestine in 2009–2013 (Table A2.10) compared with Australians living in Very remote areas. The incidence rate ratio (0.6) for cancer of the small intestine for Australians living in Very remote areas compared with those living in Major cities was lower than the same incidence rate ratio (0.9) for all cancers combined. Cancer of the small intestine age-standardised mortality rates were similar for all remoteness areas (Table A2.11). The 5-year observed survival rate was lower for Australians living in Outer regional areas (55%) and higher for Australians living in Inner regional areas (62%). Note that observed survival could not be calculated for Remote and Very remote areas due to small numbers (Table A2.12).
Socioeconomic disadvantage The age-standardised incidence (Table A2.13) and mortality (Table A2.14) rates for cancer of the small intestine were similar for all socioeconomic groups. The 5-year observed survival rate was lower for Australians in the lowest socioeconomic group (58%) and higher for Australians in the two highest socioeconomic groups (61%) (Table A2.15).
Adenocarcinomas Neuroendocrine Sarcomas0
50100150200250300350
Number
0
20
40
60
80
100
5-year relative survival (%)
Number of new cases 5-year relative survival

74 Colorectal and other digestive-tract cancers
8.2 Treatment Hospitalisations In 2016–17, there were 4,757 small intestine cancer-related hospitalisations. This accounted for 0.4% of cancer-related hospitalisations and 2.1% of digestive-tract cancer-related hospitalisations in Australia (Table A2.20). Of these, 57% were for males and 43% were for females, which is consistent with the incidence pattern (Table 8.1). In 24% of these hospitalisations, cancer of the small intestine was the principal diagnosis (Table 8.2).
Table 8.2: Hospitalisations related to cancer of the small intestine, by sex, 2016–17 Males Females Persons
Number % ASR Number % ASR Number % ASR
Principal diagnosis of cancer 627 13.2 0.5 516 10.8 0.4 1,143 24.0 0.4
Additional diagnosis of cancer 2,086 43.9 1.5 1,528 32.1 1.1 3,614 76.0 1.3
All hospitalisations related to cancer of the small intestine 2,713 57.0 2.0 2,044 43.0 1.4 4,757 100.0 1.7
Source: AIHW NHMD.
Age group In 2016–17, the age-specific cancer of the small intestine-related hospitalisation rate increased with age from 25–29 to 75–79, before decreasing for those aged 80 or older (Figure 8.7). Rates were similar for males and females for age groups up to 55–59. Differences were more apparent for older age groups.
Source: Table A8.5.
Figure 8.7: Age-specific rates of hospitalisations related to cancer of the small intestine, by age group and sex, 2016–17
Trend Between 2001–02 and 2016–17, the age-standardised cancer of the small intestine-related hospitalisation rate increased from 0.9 to 1.7 per 10,000 (Figure 8.8). This trend was observed for both males and females, with males having consistently higher rates than females.
0–4
5–9
10–1
4
15–1
9
20–2
4
25–2
9
30–3
4
35–3
9
40–4
4
45–4
9
50–5
4
55–5
9
60–6
4
65–6
9
70–7
4
75–7
9
80–8
4
85+
Age group (years)
0
3
6
9
12
15
Rate (per 10,000)
PersonsFemalesMales

Colorectal and other digestive-tract cancers 75
Source: Table A8.6.
Figure 8.8: All hospitalisations related to cancer of the small intestine, by sex, 2001–02 to 2016–17
Selected surgical procedures In 2016–17, there were 277 surgical procedures (see Table D10 for details) related to cancer of the small intestine. There were more procedures in males (53%) than in females (47%) (Table 8.3), which was consistent with the incidence pattern (Table 8.1). A resection of small intestine was reported for 84% of surgical procedures. See Appendix C for information on how surgical procedures were calculated.
Table 8.3: Number of surgical procedures, cancer of the small intestine, by sex, 2016–17 Males Females Persons
Procedure type Number % Number % Number %
Insertion of prosthesis 10 6.8 8 6.2 18 6.5
Enterotomy n.p. n.p. n.p. n.p. 5 1.8
Resection of small intestine 124 83.8 108 83.7 232 83.8
Other excision procedure n.p. n.p. n.p. n.p. 8 2.9
Stomas of small intestine n.p. n.p. n.p. n.p. 14 5.1
All surgical procedures 148 100.0 129 100.0 277 100.0
Source: AIHW NHMD.
Chemotherapy In 2016–17, there were 3,567 chemotherapy procedures related to cancer of the small intestine. This accounted for 2.0% of all digestive-tract cancer chemotherapy procedures and 0.5% of all cancer-related chemotherapy procedures. There were more chemotherapy procedures in males (57%) than females (43%) (Table A2.23), which was consistent with the incidence pattern (Table 8.1). See Appendix C for information on how chemotherapy procedures were calculated.
Radiotherapy In 2016–17, there were 56 radiotherapy courses where the principal diagnosis was recorded as cancer of the small intestine. This accounted for 0.1% of all radiotherapy courses provided and 0.9% of all digestive-tract cancer-related radiotherapy courses. A similar number of courses were provided to males and females (Table A2.24).
2001
–02
2002
–03
2003
–04
2004
–05
2005
–06
2006
–07
2007
–08
2008
–09
2009
–10
2010
–11
2011
–12
2012
–13
2013
–14
2014
–15
2015
–16
2016
–17
Financial year
0.0
0.5
1.0
1.5
2.0
2.5
3.0
Rate (per 10,000)
PersonsFemalesMales
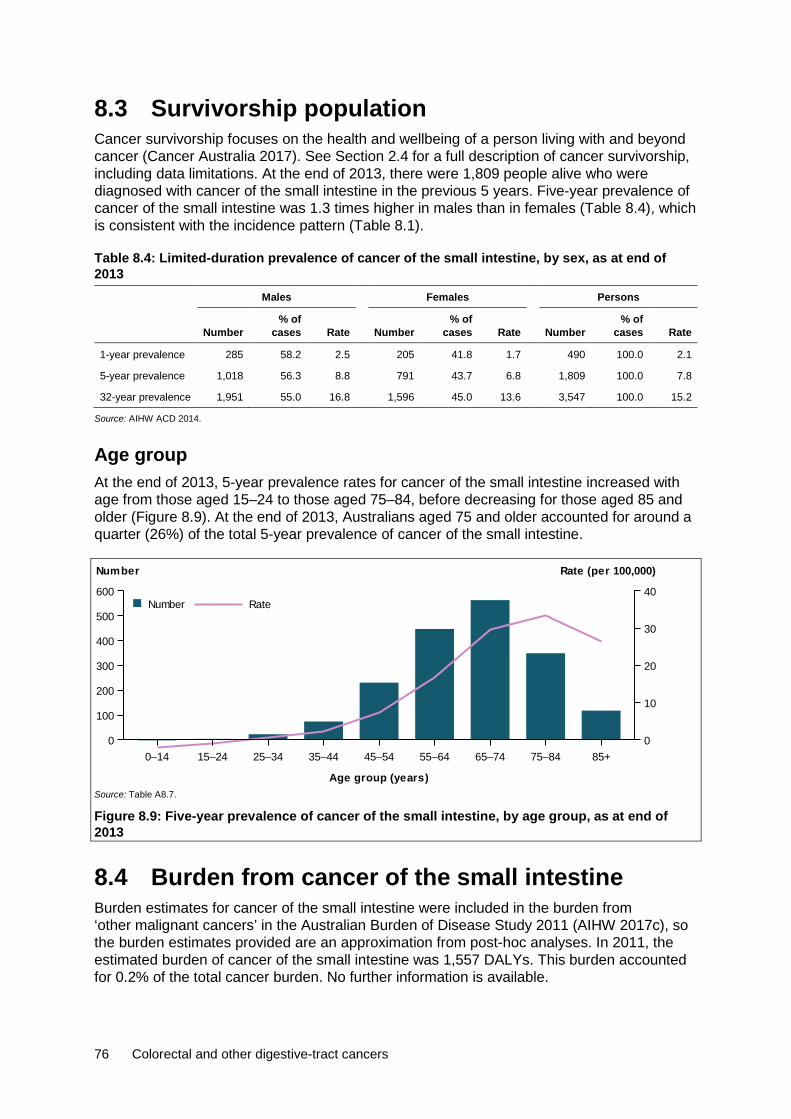
76 Colorectal and other digestive-tract cancers
8.3 Survivorship population Cancer survivorship focuses on the health and wellbeing of a person living with and beyond cancer (Cancer Australia 2017). See Section 2.4 for a full description of cancer survivorship, including data limitations. At the end of 2013, there were 1,809 people alive who were diagnosed with cancer of the small intestine in the previous 5 years. Five-year prevalence of cancer of the small intestine was 1.3 times higher in males than in females (Table 8.4), which is consistent with the incidence pattern (Table 8.1).
Table 8.4: Limited-duration prevalence of cancer of the small intestine, by sex, as at end of 2013
Males Females Persons
Number % of
cases Rate Number % of
cases Rate Number % of
cases Rate
1-year prevalence 285 58.2 2.5 205 41.8 1.7 490 100.0 2.1
5-year prevalence 1,018 56.3 8.8 791 43.7 6.8 1,809 100.0 7.8
32-year prevalence 1,951 55.0 16.8 1,596 45.0 13.6 3,547 100.0 15.2
Source: AIHW ACD 2014.
Age group At the end of 2013, 5-year prevalence rates for cancer of the small intestine increased with age from those aged 15–24 to those aged 75–84, before decreasing for those aged 85 and older (Figure 8.9). At the end of 2013, Australians aged 75 and older accounted for around a quarter (26%) of the total 5-year prevalence of cancer of the small intestine.
Source: Table A8.7.
Figure 8.9: Five-year prevalence of cancer of the small intestine, by age group, as at end of 2013
8.4 Burden from cancer of the small intestine Burden estimates for cancer of the small intestine were included in the burden from ‘other malignant cancers’ in the Australian Burden of Disease Study 2011 (AIHW 2017c), so the burden estimates provided are an approximation from post-hoc analyses. In 2011, the estimated burden of cancer of the small intestine was 1,557 DALYs. This burden accounted for 0.2% of the total cancer burden. No further information is available.
0–14 15–24 25–34 35–44 45–54 55–64 65–74 75–84 85+
Age group (years)
0
100
200
300
400
500
600
Number
0
10
20
30
40
Rate (per 100,000)
RateNumber
Colorectal and other digestive-tract cancers 77
Risk factors Certain viral and bacterial infections of the small intestine may lead to prolonged inflammation and cause the symptoms of Crohn’s disease and coeliac disease, which are risk factors for cancer of the small intestine. Some research indicates that personal and lifestyle factors such as dietary habits, smoking and lack of physical activity are associated with causing and/or worsening of symptoms related to Crohn’s disease and coeliac disease (IARC 2014).
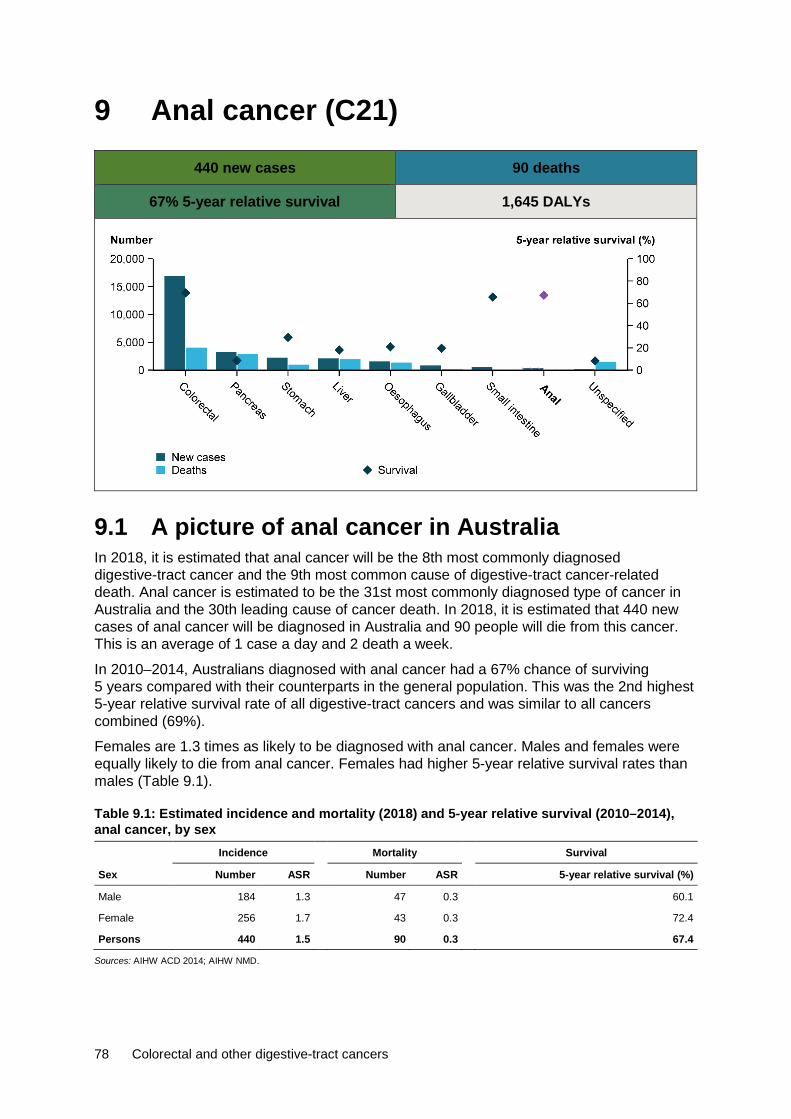
78 Colorectal and other digestive-tract cancers
9 Anal cancer (C21)
440 new cases 90 deaths
67% 5-year relative survival 1,645 DALYs
9.1 A picture of anal cancer in Australia In 2018, it is estimated that anal cancer will be the 8th most commonly diagnosed digestive-tract cancer and the 9th most common cause of digestive-tract cancer-related death. Anal cancer is estimated to be the 31st most commonly diagnosed type of cancer in Australia and the 30th leading cause of cancer death. In 2018, it is estimated that 440 new cases of anal cancer will be diagnosed in Australia and 90 people will die from this cancer. This is an average of 1 case a day and 2 death a week.
In 2010–2014, Australians diagnosed with anal cancer had a 67% chance of surviving 5 years compared with their counterparts in the general population. This was the 2nd highest 5-year relative survival rate of all digestive-tract cancers and was similar to all cancers combined (69%).
Females are 1.3 times as likely to be diagnosed with anal cancer. Males and females were equally likely to die from anal cancer. Females had higher 5-year relative survival rates than males (Table 9.1).
Table 9.1: Estimated incidence and mortality (2018) and 5-year relative survival (2010–2014), anal cancer, by sex
Incidence Mortality Survival
Sex Number ASR Number ASR 5-year relative survival (%)
Male 184 1.3 47 0.3 60.1
Female 256 1.7 43 0.3 72.4
Persons 440 1.5 90 0.3 67.4
Sources: AIHW ACD 2014; AIHW NMD.

Colorectal and other digestive-tract cancers 79
Age group The incidence and mortality rates for anal cancer increased with age. In 2010–2014, the 5-year relative survival rate decreased with increasing age (Figure 9.1).
Source: Table A9.1.
Figure 9.1: Estimated age-specific incidence and mortality (2018) rates and 5-year relative survival (2010–2014) for anal cancer, by age group
Trend The number of new cases of anal cancer increased from 96 cases in 1982 to an estimated 440 in 2018. The age-standardised incidence rate increased from 0.8 cases per 100,000 to an expected 1.5 per 100,000 over the same time period (Figure 9.2). This increase is likely due to smoking, sexual behaviours, and infection by human papillomavirus (HPV) or human immunodeficiency virus (HIV), but the introduction of the HPV vaccine is expected to lead to a decrease in the incidence of cases in the future (Islami et al. 2016; van der Zee et al. 2013).
Source: Table A9.2.
Figure 9.2: Incidence trends for anal cancer, 1982–2014, with projections to 2018
The number of deaths from anal cancer increased from 29 deaths in 1982 to an estimated 90 in 2018. The age-standardised rate remained at 0.3 deaths per 100,000 persons during this period (Figure 9.3).
0–4
5–9
10–1
4
15–1
9
20–2
4
25–2
9
30–3
4
35–3
9
40–4
4
45–4
9
50–5
4
55–5
9
60–6
4
65–6
9
70–7
4
75–7
9
80–8
4
85+
Age group (years)
0
2
4
6
8
10
Rate (per 100,000)
0
20
40
60
80
100
5–year relative survival (%)
Incidence Mortality 5–year relative survival
1982 1985 1988 1991 1994 1997 2000 2003 2006 2009 2012 2015 2018
Year
0100200300400500
0
1
2
3
4Number of cases Rate (per 100,000)
Rate
ActualEstimated
Cases
ActualEstimated

80 Colorectal and other digestive-tract cancers
Source: Table A9.2.
Figure 9.3: Mortality trends for anal cancer, 1982–2016, with projections to 2018
Between 1985–1989 and 2010–2014, the 5-year relative survival rate for anal cancer increased from 51% to 67%. Five-year relative survival for anal cancer was higher than the all digestive-tract cancers combined and all cancers combined (Figure 9.4).
Source: Table A2.3.
Figure 9.4: Five-year relative survival for anal cancer, all digestive-tract cancers combined and all cancers combined, 2010–2014
Characteristics
Subsite In 2013, the anal canal was the most common anal cancer subsite diagnosed, representing 37% of all anal cancer cases. Australians diagnosed with this subsite had a 72% chance of surviving 5 years compared with their counterparts in the general population. This was higher than the 5-year relative survival rate for all anal cancers (67%) and was the highest 5-year relative survival rate for anal cancer. The lowest 5-year relative survival rate was for cancer of the overlapping lesion of rectum, anus and anal canal (62%) (Figure 9.5).
1982 1985 1988 1991 1994 1997 2000 2003 2006 2009 2012 2015 2018
Year
020406080
100
0.0
0.5
1.0Number of deaths Rate (per 100,000)
Rate
Actual
EstimatedCases
Actual
Estimated
1985–1989 1990–1994 1995–1999 2000–2004 2005–2009 2010–2014
Period
0
20
40
60
80
100
5-year relative survival (%)
All cancers combinedAll digestive cancers combinedAnus

Colorectal and other digestive-tract cancers 81
Source: Table A9.3.
Figure 9.5: Incidence (2013) and 5-year relative survival for anal cancer (2010–2014), by subsite
Histology In 2013, squamous neoplasms were the most common anal cancer histological type, representing 78% of all anal cancer cases diagnosed. Australians diagnosed with squamous neoplasms had a 73% chance of surviving 5 years compared with their counterparts in the general population. This was higher than the 5-year relative survival rate for all anal cancers (67%) and was the highest 5-year relative survival rate for anal histological types. Adenocarcinomas have the lowest 5-year relative survival rate (51%) (Figure 9.6).
Source: Table A9.4.
Figure 9.6: Incidence (2013) and 5-year relative survival (2010–2014) for anal cancer, by histology
Population groups
Indigenous status Indigenous Australians living in the jurisdictions for which data were available (see notes on page vii for more details) were 1.7 times as likely to be diagnosed with anal cancer in 2009–2013 and 2.7 times as likely to die from anal cancer in 2012–2016 as non-Indigenous Australians. The incidence (1.7) and mortality (2.7) rate ratio between Indigenous and non-Indigenous Australians for anal cancer was higher than the same incidence rate ratio (1.1) and mortality rate ratio (1.4) for all cancers combined. One-year relative survival was lower in Indigenous Australians (81%) than in non-Indigenous Australians (88%) (Table A2.9).
Anus, unspecif ied Anal canal Overlapping lesions0
50
100
150
200
Number
0
20
40
60
80
100
5-year relative survival (%)
Number of new cases 5-year relative survival
Squamous Adenocarcinomas0
50100150200250300350
Number
0
20
40
60
80
100
5-year relative survival (%)
Number of new cases 5-year relative survival

82 Colorectal and other digestive-tract cancers
Remoteness area Australians living in Very remote areas of Australia were 1.4 times as likely to be diagnosed with anal cancer in 2009–2013 (Table A2.10) and 3.0 times as likely to die from anal cancer in 2011–2016 compared with Australians living in Major cities (Table A2.11). The anal cancer incidence (1.4) and mortality (3.0) rate ratio for Australians living in Very remote areas compared with those living in Major cities was higher than the same incidence (0.9) and mortality (1.2) rate ratio for all cancers combined. The 5-year observed survival rate was lower for Australians living in Outer regional areas (56%) and higher for Australians living in Major cities (62%). Note that observed survival could not be calculated for Remote and Very remote areas due to small numbers (Table A2.12).
Socioeconomic disadvantage Australians in the lowest socioeconomic group were 1.1 times as likely to be diagnosed with anal cancer in 2009–2013 (Table A2.13) and 2.0 times as likely to die from anal cancer in 2012–2016 compared with Australians in the highest socioeconomic group (Table A2.14). The anal cancer incidence (1.1) and mortality (2.0) rate ratio between Australians in the lowest and highest socioeconomic group was higher than the same incidence (1.0) and mortality (1.4) rate ratio for all cancers combined. The 5-year observed survival rate was lowest for Australians in the lowest socioeconomic group (55%) and higher for Australians in the third highest socioeconomic group (66%) (Table A2.15).
9.2 Treatment Hospitalisations In 2016–17, there were 2,826 anal cancer-related hospitalisations. This accounted for 0.2% of cancer-related hospitalisations and 1.3% of digestive-tract cancer-related hospitalisations in Australia (Table A2.20). Of these, 36% were for males and 64% were for females, which is consistent with the incidence pattern (Table 9.1). Anal cancer was the principal diagnosis in just over one-third (34%) of these hospitalisations (Table 9.2).
Table 9.2: Hospitalisations related to anal cancer, by sex, 2016–17 Males Females Persons
Number % ASR Number % ASR Number % ASR
Principal diagnosis of cancer 399 14.1 0.3 567 20.1 0.4 966 34.2 0.3
Additional diagnosis of cancer 619 21.9 0.5 1,241 43.9 0.9 1,860 65.8 0.7
All anal cancer-related hospitalisations 1,018 36.0 0.8 1,808 64.0 1.3 2,826 100.0 1.0
Source: AIHW NHMD.
Age group In 2016–17, the age-specific anal cancer-related hospitalisation rate increased with age, before decreasing for those aged 75 or older. Females had higher rates than males for most age groups between 40–44 and 85 and over (Figure 9.7).
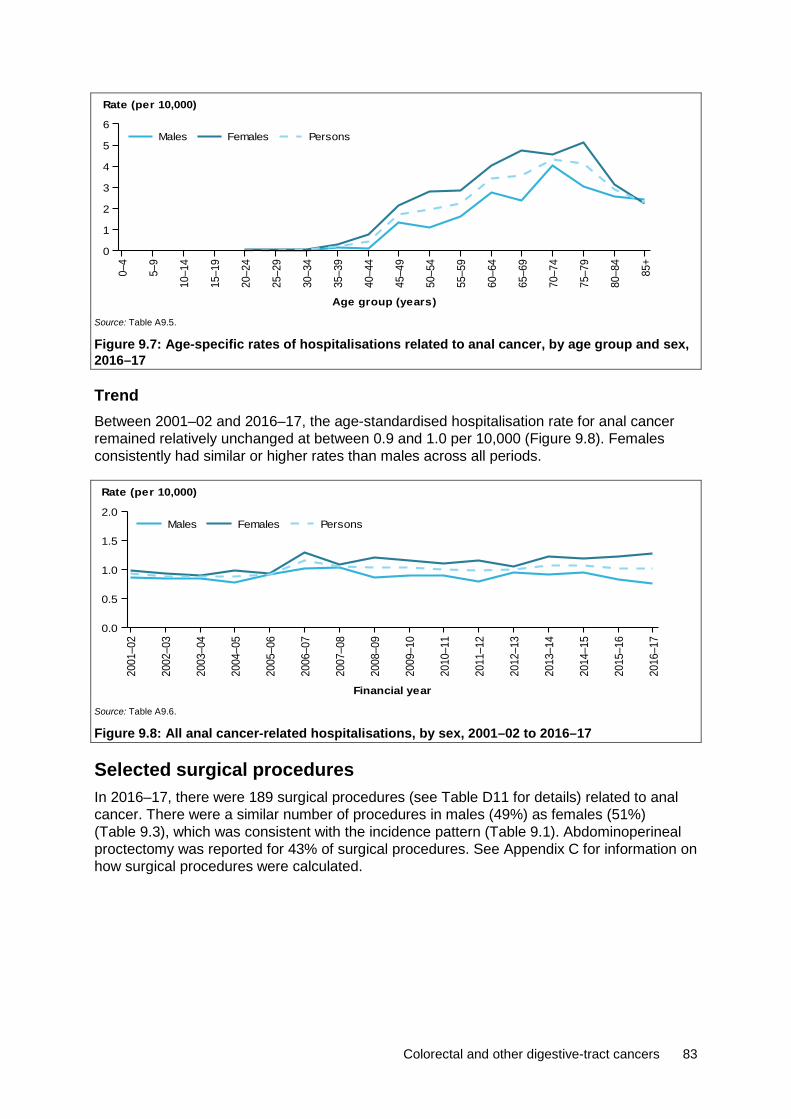
Colorectal and other digestive-tract cancers 83
Source: Table A9.5.
Figure 9.7: Age-specific rates of hospitalisations related to anal cancer, by age group and sex, 2016–17
Trend Between 2001–02 and 2016–17, the age-standardised hospitalisation rate for anal cancer remained relatively unchanged at between 0.9 and 1.0 per 10,000 (Figure 9.8). Females consistently had similar or higher rates than males across all periods.
Source: Table A9.6.
Figure 9.8: All anal cancer-related hospitalisations, by sex, 2001–02 to 2016–17
Selected surgical procedures In 2016–17, there were 189 surgical procedures (see Table D11 for details) related to anal cancer. There were a similar number of procedures in males (49%) as females (51%) (Table 9.3), which was consistent with the incidence pattern (Table 9.1). Abdominoperineal proctectomy was reported for 43% of surgical procedures. See Appendix C for information on how surgical procedures were calculated.
0–4
5–9
10–1
4
15–1
9
20–2
4
25–2
9
30–3
4
35–3
9
40–4
4
45–4
9
50–5
4
55–5
9
60–6
4
65–6
9
70–7
4
75–7
9
80–8
4
85+
Age group (years)
0
1
2
3
4
5
6
Rate (per 10,000)
PersonsFemalesMales20
01–0
2
2002
–03
2003
–04
2004
–05
2005
–06
2006
–07
2007
–08
2008
–09
2009
–10
2010
–11
2011
–12
2012
–13
2013
–14
2014
–15
2015
–16
2016
–17
Financial year
0.0
0.5
1.0
1.5
2.0
Rate (per 10,000)
PersonsFemalesMales

84 Colorectal and other digestive-tract cancers
Table 9.3: Number of surgical procedures, anal cancer, by sex, 2016–17 Males Females Persons
Procedure type Number % Number % Number %
Abdominoperineal proctectomy 43 46.7 38 39.2 81 42.9
Other excision procedures 49 53.3 59 60.8 108 57.1
All surgical procedures 92 100.0 97 100.0 189 100.0
Source: AIHW NHMD.
Chemotherapy In 2016–17 there were 1,791 chemotherapy procedures related to anal cancer. This accounted for 1.0% of all digestive-tract cancer chemotherapy procedures and 0.3% of all cancer-related chemotherapy procedures. The high number of chemotherapy procedures for anal cancer (compared with other digestive-tract cancers) may be due to the fact that chemotherapy, in combination with radiotherapy, is the main treatment for anal cancer treatment (Cancer Council Victoria 2016). There were more chemotherapy procedures in females (68%) than males (32%) (Table A2.23), which was consistent with the incidence pattern (Table 9.1). See Appendix C for information on how chemotherapy procedures were calculated.
Radiotherapy In 2016–17, there were 498 radiotherapy courses where the principal diagnosis was recorded as anal cancer. This accounted for 0.8% of all radiotherapy courses provided and 8.0% of all digestive-tract cancer-related radiotherapy courses. More courses were provided to females than males (Table A2.24).
9.3 Survivorship population Cancer survivorship focuses on the health and wellbeing of a person living with and beyond cancer (Cancer Australia 2017). See Section 2.4 for a full description of cancer survivorship, including data limitations. At the end of 2013, there were 1,498 people alive who were diagnosed with anal cancer in the previous 5 years. Five-year prevalence for anal cancer was 1.6 times higher in females than in males (Table 9.4), which is consistent with the incidence pattern (Table 9.1).
Table 9.4: Limited-duration prevalence of anal cancer, by sex, as at end of 2013 Males Females Persons
Number
% of prevalent
cases Rate Number
% of prevalent
cases Rate Number
% of prevalent
cases Rate
1-year prevalence 161 41.8 1.4 224 58.2 1.9 385 100.0 1.7
5-year prevalence 576 38.5 5.0 922 61.5 7.9 1,498 100.0 6.4
32-year prevalence 1,232 38.5 10.6 1,968 61.5 16.8 3,200 100.0 13.7
Source: AIHW ACD 2014.
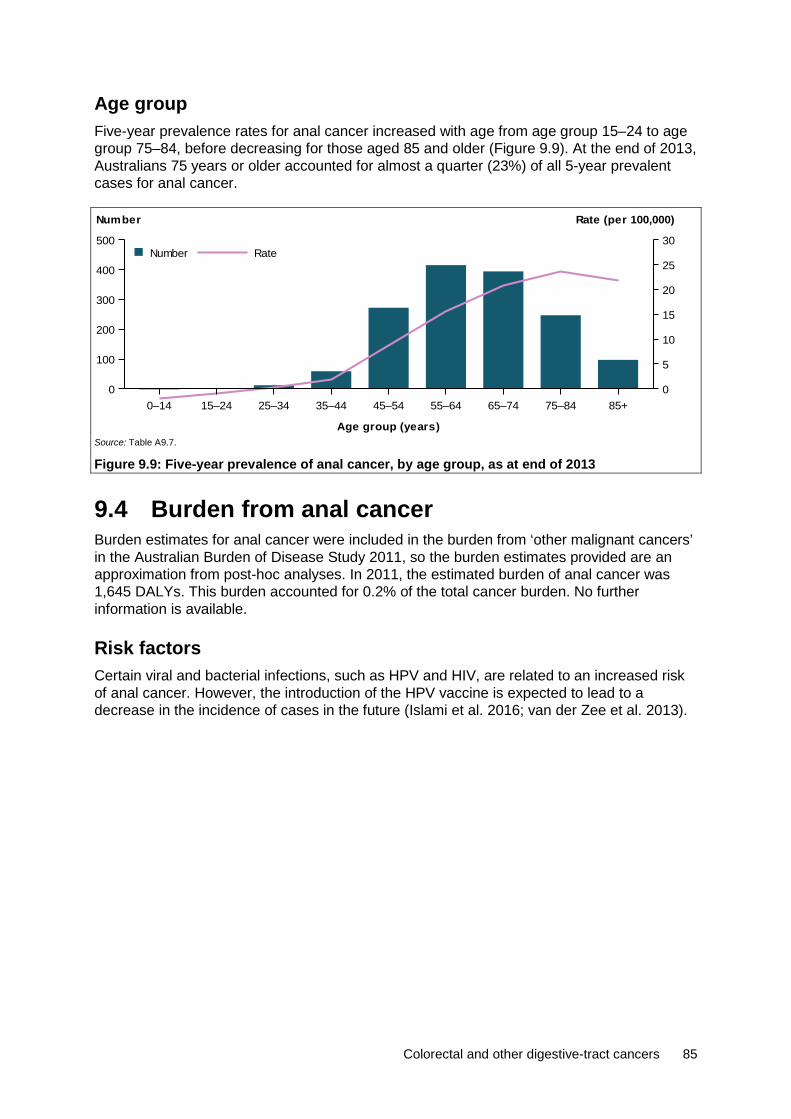
Colorectal and other digestive-tract cancers 85
Age group Five-year prevalence rates for anal cancer increased with age from age group 15–24 to age group 75–84, before decreasing for those aged 85 and older (Figure 9.9). At the end of 2013, Australians 75 years or older accounted for almost a quarter (23%) of all 5-year prevalent cases for anal cancer.
Source: Table A9.7.
Figure 9.9: Five-year prevalence of anal cancer, by age group, as at end of 2013
9.4 Burden from anal cancer Burden estimates for anal cancer were included in the burden from ‘other malignant cancers’ in the Australian Burden of Disease Study 2011, so the burden estimates provided are an approximation from post-hoc analyses. In 2011, the estimated burden of anal cancer was 1,645 DALYs. This burden accounted for 0.2% of the total cancer burden. No further information is available.
Risk factors Certain viral and bacterial infections, such as HPV and HIV, are related to an increased risk of anal cancer. However, the introduction of the HPV vaccine is expected to lead to a decrease in the incidence of cases in the future (Islami et al. 2016; van der Zee et al. 2013).
0–14 15–24 25–34 35–44 45–54 55–64 65–74 75–84 85+
Age group (years)
0
100
200
300
400
500
Number
0
5
10
15
20
25
30
Rate (per 100,000)
RateNumber

86 Colorectal and other digestive-tract cancers
10 Cancer of unspecified digestive organs (C26)
263 new cases 1,576 deaths
8.3% 5-year relative survival
This category is used when the primary site of the cancer cannot be narrowed down to a specific organ but is known to be in the digestive system. In some cases the primary site might be known to the treating doctors but not to the organisation that creates and maintains the record in its database, while in other cases the primary site might be truly unknown. This could be because investigations did not reveal the primary site, or the patient was too frail to subject to further investigations, or refused further investigations or died before the primary site was located.
This category occurs much more frequently in mortality data than in incidence data. There are 2 reasons for this. The first is that the doctor who completes the medical certificate of cause of death (MCCD) may not have access to all the relevant details and so is only able to attribute the cause to ‘cancer of the digestive system’. The second reason is the common use of the terms ‘bowel cancer’ and ‘colorectal cancer’ on the MCCD. These terms are not specific enough to assign to colon (C18), rectosigmoid junction (C19) or rectum (C20) and so are assigned to ‘intestinal tract, part unspecified, for which the code is C26.0 (ABS 2017).
10.1 A picture of cancer of unspecified digestive organs in Australia
In 2018, it is estimated that 263 new cases of cancer of unspecified digestive organs will be diagnosed in Australia and 1,576 people will die from this cancer. This is an average of 5 cases a week and 4 deaths each day. In 2010–2014, Australians diagnosed with cancer of unspecified digestive organs had an 8.3% chance of surviving 5 years compared with their counterparts in the general population (Table 10.1). This was the lowest 5-year relative survival rate of all digestive-tract cancers and was lower than all cancers combined (69%).

Colorectal and other digestive-tract cancers 87
Males were 1.3 times as likely to be diagnosed with cancer of unspecified digestive organs and 1.4 times as likely to die from cancer of unspecified digestive organs as females. Males and females had similar 5-year relative survival rates.
Table 10.1: Estimated incidence and mortality (2018) and 5-year relative survival (2010–2014), cancer of unspecified digestive organs, by sex Incidence Mortality Survival
Sex Number ASR Number ASR 5-year relative survival (%)
Male 131 0.9 830 5.9 7.9
Female 132 0.7 746 4.3 8.8
Persons 263 0.8 1,576 5.1 8.3
Sources: AIHW ACD 2014; AIHW NMD.
Trend The number of new cases of cancer of unspecified digestive organs increased from 80 cases in 1982 to an estimated 263 in 2018. The age-standardised incidence rate remained relatively steady at 0.8 cases per 100,000 persons over the same time period (Figure 10.1).
Source: Table A10.1.
Figure 10.1: Incidence trends for cancer of unspecified digestive organs, 1982–2014, with projections to 2018
The number of deaths from cancer of unspecified digestive organs increased from 113 deaths in 1982 to an estimated 1,576 in 2018. The age-standardised rate increased from 1.1 deaths per 100,000 persons to an expected 5.1 per 100,000 over the same time period (Figure 10.2). The increase in the number and rate might be related to changes in the availability of information on the death certificate or changes in recording or coding practices, rather than an actual increase.
1982 1985 1988 1991 1994 1997 2000 2003 2006 2009 2012 2015 2018
Year
0
100
200
300
400
0
1
2Number of cases Rate (per 100,000)
Rate
ActualEstimated
Cases
ActualEstimated

88 Colorectal and other digestive-tract cancers
Source: Table A10.1.
Figure 10.2: Mortality trends for cancer of unspecified digestive organs, 1982–2016, with projections to 2018
Between 1985–1989 and 2010–2014, the 5-year relative survival rate for cancer of unspecified digestive organs decreased from 14% to 8.3%. Five-year relative survival was lower for cancer of unspecified digestive organs than for all digestive-tract cancers combined and all cancers combined (Figure 10.3).
Source: Table A2.3.
Figure 10.3: Five-year relative survival from cancer of unspecified digestive organs, all digestive-tract cancers combined and all cancers combined, 2010–2014
10.2 Treatment Hospitalisations In 2016–17, there were 1,393 hospitalisations related to cancer of unspecified digestive organs. This accounted for 0.1% of cancer-related hospitalisations and 0.6% of digestive-tract cancer-related hospitalisations in Australia (Table A2.20). Of these, 53% were for males and 47% were for females, which is consistent with the incidence pattern (Table 10.1). In 24% of these hospitalisations, cancer of unspecified digestive organs was the principal diagnosis (Table 10.2).
1982 1985 1988 1991 1994 1997 2000 2003 2006 2009 2012 2015 2018
Year
0
500
1,000
1,500
2,000
0
2
4
6
8Number of deaths Rate (per 100,000)
Rate
ActualEstimated
Cases
ActualEstimated
1985–1989 1990–1994 1995–1999 2000–2004 2005–2009 2010–2014
Period
0
20
40
60
80
100
5-year relative survival (%)
All cancers combinedAll digestive cancers combinedUnspecif ied
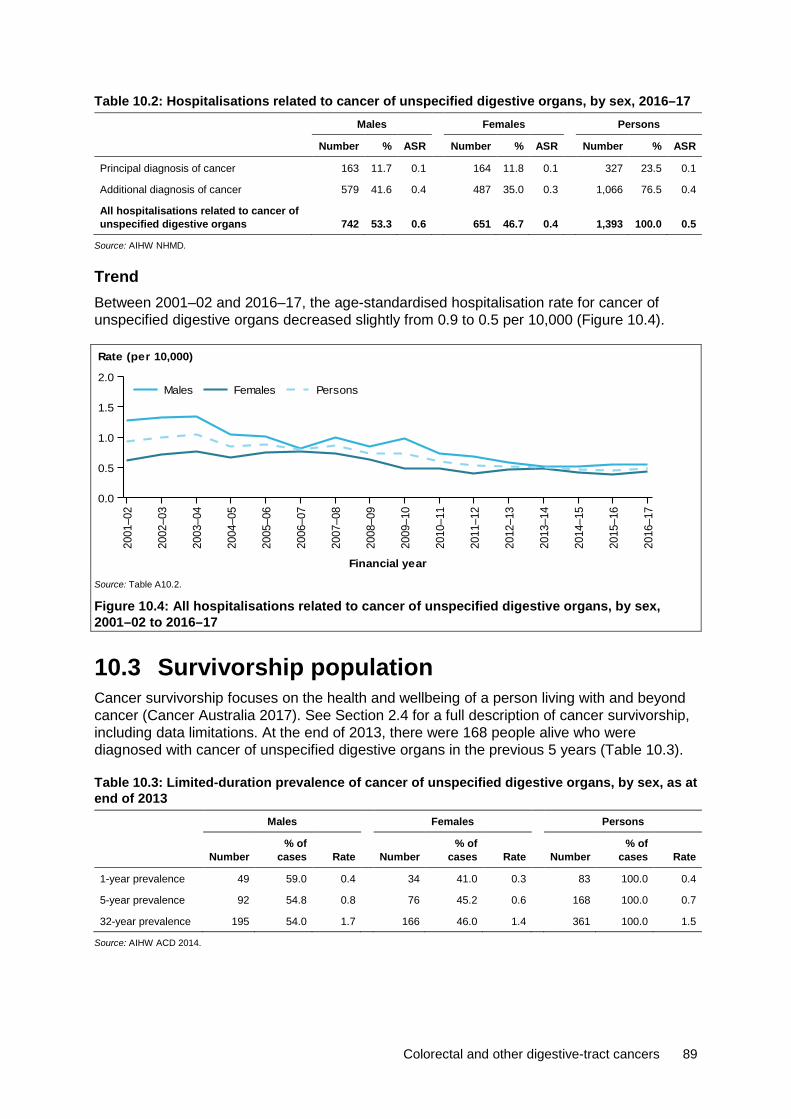
Colorectal and other digestive-tract cancers 89
Table 10.2: Hospitalisations related to cancer of unspecified digestive organs, by sex, 2016–17 Males Females Persons
Number % ASR Number % ASR Number % ASR
Principal diagnosis of cancer 163 11.7 0.1 164 11.8 0.1 327 23.5 0.1
Additional diagnosis of cancer 579 41.6 0.4 487 35.0 0.3 1,066 76.5 0.4
All hospitalisations related to cancer of unspecified digestive organs 742 53.3 0.6 651 46.7 0.4 1,393 100.0 0.5
Source: AIHW NHMD.
Trend Between 2001–02 and 2016–17, the age-standardised hospitalisation rate for cancer of unspecified digestive organs decreased slightly from 0.9 to 0.5 per 10,000 (Figure 10.4).
Source: Table A10.2.
Figure 10.4: All hospitalisations related to cancer of unspecified digestive organs, by sex, 2001–02 to 2016–17
10.3 Survivorship population Cancer survivorship focuses on the health and wellbeing of a person living with and beyond cancer (Cancer Australia 2017). See Section 2.4 for a full description of cancer survivorship, including data limitations. At the end of 2013, there were 168 people alive who were diagnosed with cancer of unspecified digestive organs in the previous 5 years (Table 10.3).
Table 10.3: Limited-duration prevalence of cancer of unspecified digestive organs, by sex, as at end of 2013
Males Females Persons
Number % of
cases Rate Number % of
cases Rate Number % of
cases Rate
1-year prevalence 49 59.0 0.4 34 41.0 0.3 83 100.0 0.4
5-year prevalence 92 54.8 0.8 76 45.2 0.6 168 100.0 0.7
32-year prevalence 195 54.0 1.7 166 46.0 1.4 361 100.0 1.5
Source: AIHW ACD 2014.
2001
–02
2002
–03
2003
–04
2004
–05
2005
–06
2006
–07
2007
–08
2008
–09
2009
–10
2010
–11
2011
–12
2012
–13
2013
–14
2014
–15
2015
–16
2016
–17
Financial year
0.0
0.5
1.0
1.5
2.0
Rate (per 10,000)
PersonsFemalesMales

90 Colorectal and other digestive-tract cancers
Appendix A: Additional tables
Summary Table A1: Estimated age-specific incidence and mortality rates of upper and lower digestive-tract cancers, by age at diagnosis, 2018
Incidence Mortality
Age group
Upper digestive-tract cancers
Lower digestive-tract cancers
Upper digestive-tract cancers
Lower digestive-tract cancers
0–4 0.7 n.p. n.p. 0.0
5–9 n.p. n.p. n.p. n.p.
10–14 n.p. 0.5 n.p. n.p.
15–19 n.p. 1.2 n.p. n.p.
20–24 0.5 2.3 n.p. n.p.
25–29 1.1 6.8 0.5 1.3
30–34 2.0 8.7 0.7 1.0
35–39 4.3 13.5 2.1 1.8
40–44 9.6 20.5 5.0 3.4
45–49 20.1 33.6 10.8 5.3
50–54 41.8 60.8 20.1 10.1
55–59 68.9 88.1 40.0 15.1
60–64 88.6 124.9 55.5 25.2
65–69 121.9 175.5 79.9 32.0
70–74 171.1 265.6 120.2 51.8
75–79 225.8 392.5 173.5 93.4
80–84 269.2 429.7 235.8 132.1
85+ 286.9 437.4 278.7 204.4
Sources: AIHW ACD 2014; AIHW NMD.
Table A2: Estimated incidence and mortality of digestive-tract cancers, by site, 2018 Cancer Incidence Mortality
Upper digestive-tract cancers
Pancreatic cancer (C25) 3,364 3,006
Stomach cancer (C16) 2,332 1,078
Liver cancer (C22) 2,215 2,088
Oesophageal cancer (C15) 1,685 1,447
Cancer of the gallbladder and extrahepatic bile ducts (C23–C24) 931 262
Cancer of the small intestine (C17) 648 133
Lower digestive-tract cancers
Colorectal cancer (C18–C20) 17,004 4,129
Anal cancer (C21) 440 90
Sources: AIHW ACD 2014; AIHW NMD.

Colorectal and other digestive-tract cancers 91
Table A3: Trends in incidence (1982–2014) and mortality (1982–2016) age-standardised rates of upper and lower digestive-tract cancers, with projections to 2018
Incidence Mortality
Year Upper digestive-tract
cancers Lower digestive-tract
cancers Upper digestive-tract
cancers Lower digestive-tract
cancers
1982 36.2 59.0 31.8 31.8
1983 36.3 58.9 32.4 32.0
1984 36.2 60.1 32.1 30.7
1985 35.2 62.8 31.1 31.9
1986 35.4 61.1 30.5 31.4
1987 35.7 61.2 30.6 31.5
1988 35.2 60.0 30.4 30.3
1989 33.7 62.1 30.4 29.6
1990 34.7 61.8 28.4 28.7
1991 35.0 65.0 29.1 28.4
1992 34.5 64.3 28.7 28.3
1993 34.6 63.8 28.2 28.6
1994 35.3 65.1 28.9 29.1
1995 35.4 65.2 28.8 27.7
1996 35.0 65.9 28.2 27.5
1997 34.8 65.4 28.2 27.1
1998 34.9 64.2 27.4 26.2
1999 35.5 65.6 27.3 25.2
2000 35.2 67.1 27.1 25.2
2001 34.3 67.5 27.4 24.7
2002 33.9 64.8 27.0 23.3
2003 34.7 64.0 26.9 21.9
2004 34.9 64.7 26.3 19.9
2005 35.3 64.0 26.4 19.9
2006 35.7 65.2 26.5 17.8
2007 36.6 66.5 27.1 18.6
2008 36.1 64.5 26.8 17.5
2009 36.1 63.2 26.2 17.2
2010 37.3 64.2 26.5 16.7
2011 37.5 62.9 26.3 16.3
2012 37.5 60.4 26.6 16.0
2013 37.1 58.0 26.5 15.9
2014 37.1 58.9 25.7 15.4
2015 37.0 60.3 26.3 15.6
2016 37.1 59.8 26.5 15.4
2017 37.3 59.4 26.4 14.2
2018 37.4 59.0 26.4 13.9
Sources: AIHW ACD 2014; AIHW NMD.
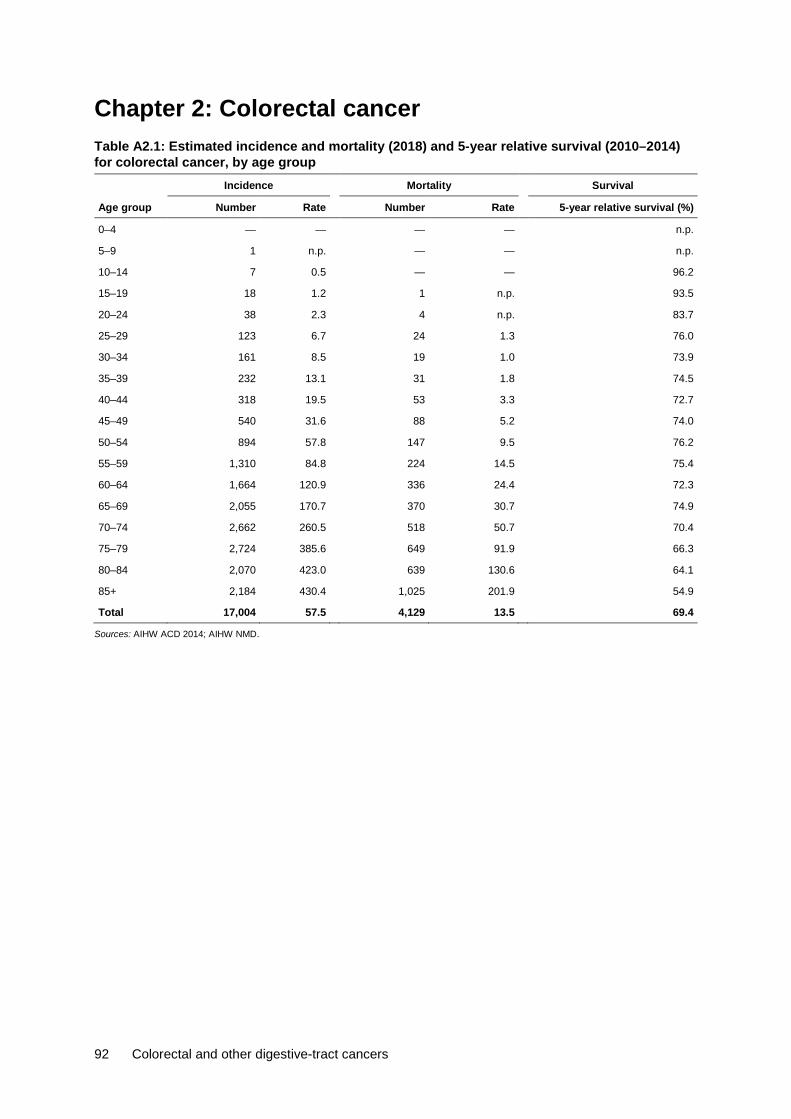
92 Colorectal and other digestive-tract cancers
Chapter 2: Colorectal cancer Table A2.1: Estimated incidence and mortality (2018) and 5-year relative survival (2010–2014) for colorectal cancer, by age group Incidence Mortality Survival
Age group Number Rate Number Rate 5-year relative survival (%)
0–4 — — — — n.p.
5–9 1 n.p. — — n.p.
10–14 7 0.5 — — 96.2
15–19 18 1.2 1 n.p. 93.5
20–24 38 2.3 4 n.p. 83.7
25–29 123 6.7 24 1.3 76.0
30–34 161 8.5 19 1.0 73.9
35–39 232 13.1 31 1.8 74.5
40–44 318 19.5 53 3.3 72.7
45–49 540 31.6 88 5.2 74.0
50–54 894 57.8 147 9.5 76.2
55–59 1,310 84.8 224 14.5 75.4
60–64 1,664 120.9 336 24.4 72.3
65–69 2,055 170.7 370 30.7 74.9
70–74 2,662 260.5 518 50.7 70.4
75–79 2,724 385.6 649 91.9 66.3
80–84 2,070 423.0 639 130.6 64.1
85+ 2,184 430.4 1,025 201.9 54.9
Total 17,004 57.5 4,129 13.5 69.4
Sources: AIHW ACD 2014; AIHW NMD.

Colorectal and other digestive-tract cancers 93
Table A2.2: Incidence (1982–2014) and mortality (1982–2016) trends, colorectal cancer, with projections to 2018
Incidence Mortality
Year Number ASR Number ASR
1982 6,988 58.2 3,617 31.5
1983 7,160 58.2 3,758 31.7
1984 7,493 59.1 3,738 30.5
1985 8,007 61.7 3,969 31.7
1986 8,048 60.2 4,059 31.2
1987 8,271 60.3 4,155 31.3
1988 8,290 58.9 4,112 30.0
1989 8,792 61.2 4,127 29.5
1990 8,900 60.6 4,098 28.4
1991 9,647 63.9 4,162 28.2
1992 9,733 63.1 4,233 28.1
1993 9,913 62.8 4,398 28.5
1994 10,335 64.0 4,587 28.8
1995 10,571 64.1 4,468 27.4
1996 10,929 64.6 4,560 27.2
1997 11,184 64.4 4,630 26.9
1998 11,219 62.9 4,599 26.0
1999 11,733 64.2 4,527 24.9
2000 12,355 65.9 4,661 24.9
2001 12,775 66.3 4,687 24.3
2002 12,545 63.5 4,538 22.9
2003 12,663 62.8 4,373 21.6
2004 13,088 63.5 4,070 19.7
2005 13,194 62.4 4,165 19.6
2006 13,793 63.9 3,814 17.5
2007 14,464 65.1 4,119 18.3
2008 14,392 63.1 3,981 17.3
2009 14,377 61.6 4,028 17.0
2010 15,041 62.6 3,969 16.3
2011 15,086 61.4 3,987 15.9
2012 14,864 58.7 4,056 15.7
2013 14,625 56.5 4,151 15.7
2014 15,253 57.4 4,120 15.1
2015 16,031 58.8 4,279 15.3
2016 16,349 58.5 4,326 15.2
2017 16,682 57.9 4,114 13.9
2018 17,004 57.5 4,129 13.5
Sources: AIHW ACD 2014; AIHW NMD.
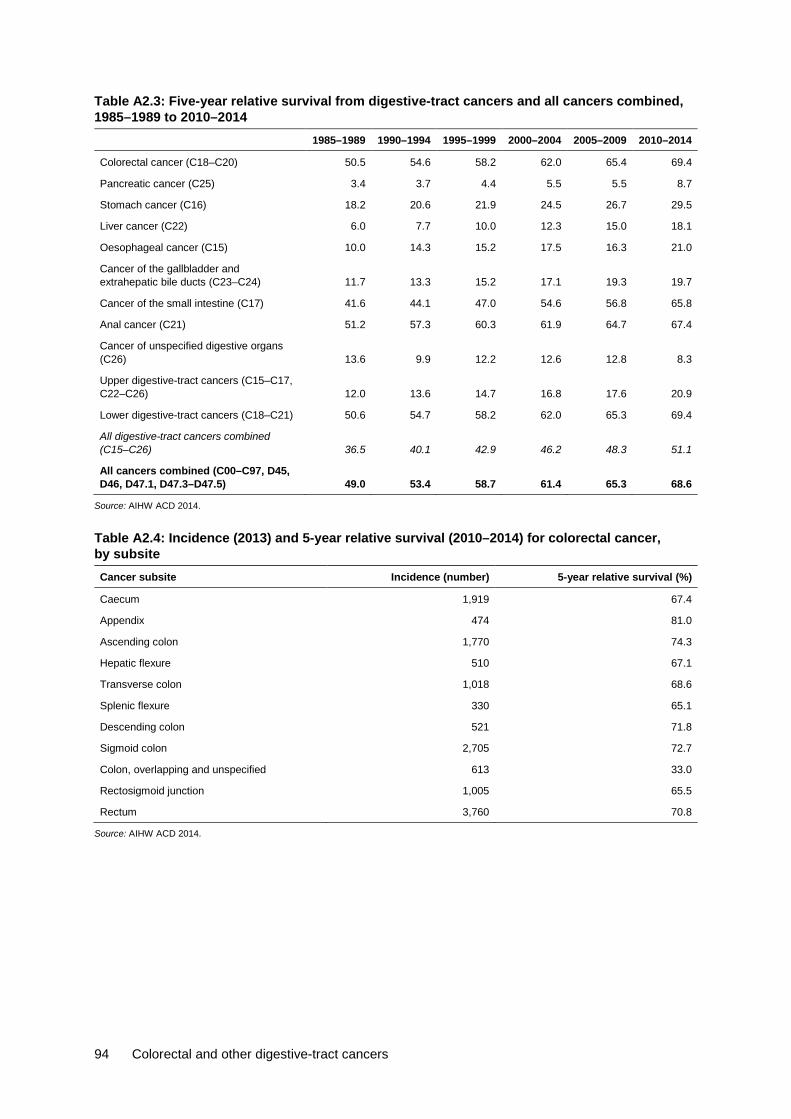
94 Colorectal and other digestive-tract cancers
Table A2.3: Five-year relative survival from digestive-tract cancers and all cancers combined, 1985–1989 to 2010–2014
1985–1989 1990–1994 1995–1999 2000–2004 2005–2009 2010–2014
Colorectal cancer (C18–C20) 50.5 54.6 58.2 62.0 65.4 69.4
Pancreatic cancer (C25) 3.4 3.7 4.4 5.5 5.5 8.7
Stomach cancer (C16) 18.2 20.6 21.9 24.5 26.7 29.5
Liver cancer (C22) 6.0 7.7 10.0 12.3 15.0 18.1
Oesophageal cancer (C15) 10.0 14.3 15.2 17.5 16.3 21.0
Cancer of the gallbladder and extrahepatic bile ducts (C23–C24) 11.7 13.3 15.2 17.1 19.3 19.7
Cancer of the small intestine (C17) 41.6 44.1 47.0 54.6 56.8 65.8
Anal cancer (C21) 51.2 57.3 60.3 61.9 64.7 67.4
Cancer of unspecified digestive organs (C26) 13.6 9.9 12.2 12.6 12.8 8.3
Upper digestive-tract cancers (C15–C17, C22–C26) 12.0 13.6 14.7 16.8 17.6 20.9
Lower digestive-tract cancers (C18–C21) 50.6 54.7 58.2 62.0 65.3 69.4
All digestive-tract cancers combined (C15–C26) 36.5 40.1 42.9 46.2 48.3 51.1
All cancers combined (C00–C97, D45, D46, D47.1, D47.3–D47.5) 49.0 53.4 58.7 61.4 65.3 68.6
Source: AIHW ACD 2014.
Table A2.4: Incidence (2013) and 5-year relative survival (2010–2014) for colorectal cancer, by subsite Cancer subsite Incidence (number) 5-year relative survival (%)
Caecum 1,919 67.4
Appendix 474 81.0
Ascending colon 1,770 74.3
Hepatic flexure 510 67.1
Transverse colon 1,018 68.6
Splenic flexure 330 65.1
Descending colon 521 71.8
Sigmoid colon 2,705 72.7
Colon, overlapping and unspecified 613 33.0
Rectosigmoid junction 1,005 65.5
Rectum 3,760 70.8
Source: AIHW ACD 2014.
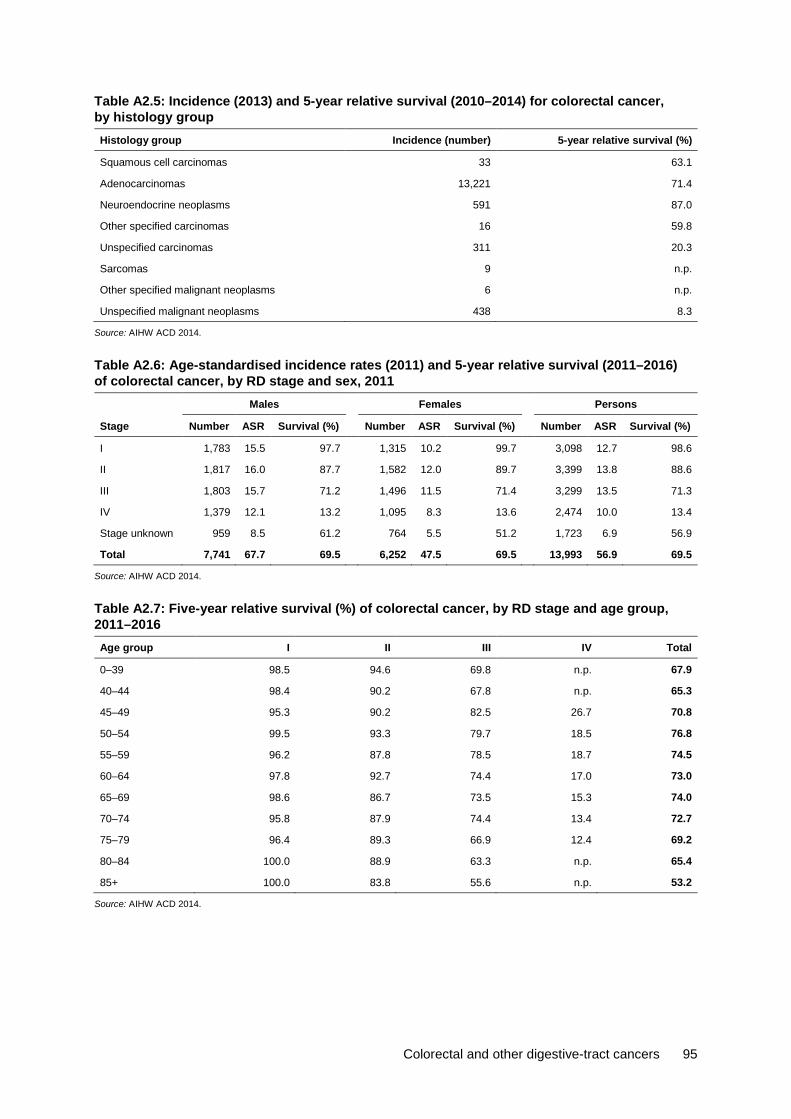
Colorectal and other digestive-tract cancers 95
Table A2.5: Incidence (2013) and 5-year relative survival (2010–2014) for colorectal cancer, by histology group Histology group Incidence (number) 5-year relative survival (%)
Squamous cell carcinomas 33 63.1
Adenocarcinomas 13,221 71.4
Neuroendocrine neoplasms 591 87.0
Other specified carcinomas 16 59.8
Unspecified carcinomas 311 20.3
Sarcomas 9 n.p.
Other specified malignant neoplasms 6 n.p.
Unspecified malignant neoplasms 438 8.3
Source: AIHW ACD 2014.
Table A2.6: Age-standardised incidence rates (2011) and 5-year relative survival (2011–2016) of colorectal cancer, by RD stage and sex, 2011 Males Females Persons
Stage Number ASR Survival (%) Number ASR Survival (%) Number ASR Survival (%)
I 1,783 15.5 97.7 1,315 10.2 99.7 3,098 12.7 98.6
II 1,817 16.0 87.7 1,582 12.0 89.7 3,399 13.8 88.6
III 1,803 15.7 71.2 1,496 11.5 71.4 3,299 13.5 71.3
IV 1,379 12.1 13.2 1,095 8.3 13.6 2,474 10.0 13.4
Stage unknown 959 8.5 61.2 764 5.5 51.2 1,723 6.9 56.9
Total 7,741 67.7 69.5 6,252 47.5 69.5 13,993 56.9 69.5
Source: AIHW ACD 2014.
Table A2.7: Five-year relative survival (%) of colorectal cancer, by RD stage and age group, 2011–2016 Age group I II III IV Total
0–39 98.5 94.6 69.8 n.p. 67.9
40–44 98.4 90.2 67.8 n.p. 65.3
45–49 95.3 90.2 82.5 26.7 70.8
50–54 99.5 93.3 79.7 18.5 76.8
55–59 96.2 87.8 78.5 18.7 74.5
60–64 97.8 92.7 74.4 17.0 73.0
65–69 98.6 86.7 73.5 15.3 74.0
70–74 95.8 87.9 74.4 13.4 72.7
75–79 96.4 89.3 66.9 12.4 69.2
80–84 100.0 88.9 63.3 n.p. 65.4
85+ 100.0 83.8 55.6 n.p. 53.2
Source: AIHW ACD 2014.

96 Colorectal and other digestive-tract cancers
Table A2.8: Age-specific incidence rates of colorectal cancer, by RD stage and age group, 2011
Age group
I II III IV Stage unknown Total
Number Rate Number Rate Number Rate Number Rate Number Rate Number Rate
0–4 — — — — — — — — — — — —
5–9 — — — — — — — — — — — —
10–14 — — — — — — — — — — — —
15–19 — — 1 n.p. — — 1 n.p. — — 2 n.p.
20–24 1 n.p. 3 n.p. 8 0.5 3 n.p. — — 15 0.9
25–29 14 0.8 11 0.7 15 0.9 13 0.8 3 n.p. 56 3.4
30–34 15 1.0 16 1.0 20 1.3 27 1.8 8 0.5 86 5.6
35–39 24 1.5 21 1.3 36 2.3 38 2.4 16 1.0 135 8.6
40–44 42 2.6 47 3.0 61 3.8 53 3.3 24 1.5 227 14.3
45–49 102 6.6 83 5.4 119 7.7 112 7.3 47 3.0 463 30.0
50–54 181 12.1 168 11.2 213 14.3 134 9.0 89 6.0 785 52.5
55–59 290 21.7 201 15.0 315 23.6 201 15.0 103 7.7 1,110 83.1
60–64 365 29.8 382 31.2 381 31.1 302 24.6 181 14.8 1,611 131.4
65–69 481 50.4 405 42.4 431 45.2 274 28.7 168 17.6 1,759 184.3
70–74 540 74.2 558 76.7 522 71.7 342 47.0 259 35.6 2,221 305.2
75–79 458 82.0 561 100.5 481 86.1 339 60.7 230 41.2 2,069 370.6
80–84 350 78.8 530 119.4 404 91.0 313 70.5 243 54.7 1,840 414.4
85+ 235 58.2 412 102.1 293 72.6 322 79.8 352 87.2 1,614 399.9
Source: AIHW ACD 2014.

Colorectal and other digestive-tract cancers 97
Table A2.9: Incidence (2009–2013), mortality (2012–2016) and 5-year relative survival (2007–2014) for digestive-tract cancers, by Indigenous status and cancer type, selected jurisdictions
Incidence Mortality Survival
Cancer Indigenous status Number ASR Number ASR
1-yearrelativesurvival
(%)
5-yearrelativesurvival
(%)
Colorectal cancer (C18–C20) Indigenous Australians 612 53.1 162 13.6 83.4 57.3
Non-Indigenous Australians 59,650 55.8 14,200 14.9 85.2 66.7
Pancreatic cancer (C25) Indigenous Australians 190 17.1 158 12.3 18.8 n.p.
Non-Indigenous Australians 11,679 10.8 9,123 9.6 27.3 7.5
Stomach cancer (C16) Indigenous Australians 145 12.2 79 6.5 43.5 19.3
Non-Indigenous Australians 8,417 7.9 3,783 4.0 54.0 27.7
Liver cancer (C22) Indigenous Australians 211 15.5 202 15.3 28.9 7.7
Non-Indigenous Australians 6,795 6.4 5,957 6.3 43.9 17.8
Oesophageal cancer (C15) Indigenous Australians 144 11.5 118 7.8 37.4 n.p.
Non-Indigenous Australians 5,656 5.2 4,380 4.6 48.0 19.3
Cancer of the gallbladder and extrahepatic bile ducts (C23–C24)
Indigenous Australians 84 7.7 28 3.0 26.4 n.p.
Non-Indigenous Australians 3,173 2.9 859 0.9 47.2 19.5
Cancer of the small intestine (C17)
Indigenous Australians 30 2.4 9 0.6 72.1 n.p.
Non-Indigenous Australians 2,041 1.9 380 0.4 79.6 61.2
Anal cancer (C21) Indigenous Australians 34 2.5 9 0.8 81.4 n.p.
Non-Indigenous Australians 1,603 1.5 284 0.3 88.0 65.1
Cancer of unspecified digestive organs (C26)
Indigenous Australians 12 1.8 57 5.2 n.p. n.p.
Non-Indigenous Australians 792 0.7 4,290 4.4 18.2 9.1
All digestive cancers combined (C15–C26)
Indigenous Australians 1,462 123.8 822 65.0 55.0 31.1
Non-Indigenous Australians 99,806 93.1 43,256 45.5 69.7 49.1
All cancers combined (C00–C97, D45, D46, D47.1, D47.3–D47.5)
Indigenous Australians 6,397 501.4 2,917 234.5 68.7 49.7
Non-Indigenous Australians 466,956 438.6 155,790 163.9 80.4 64.5
Sources: AIHW ACD 2014; AIHW NMD.
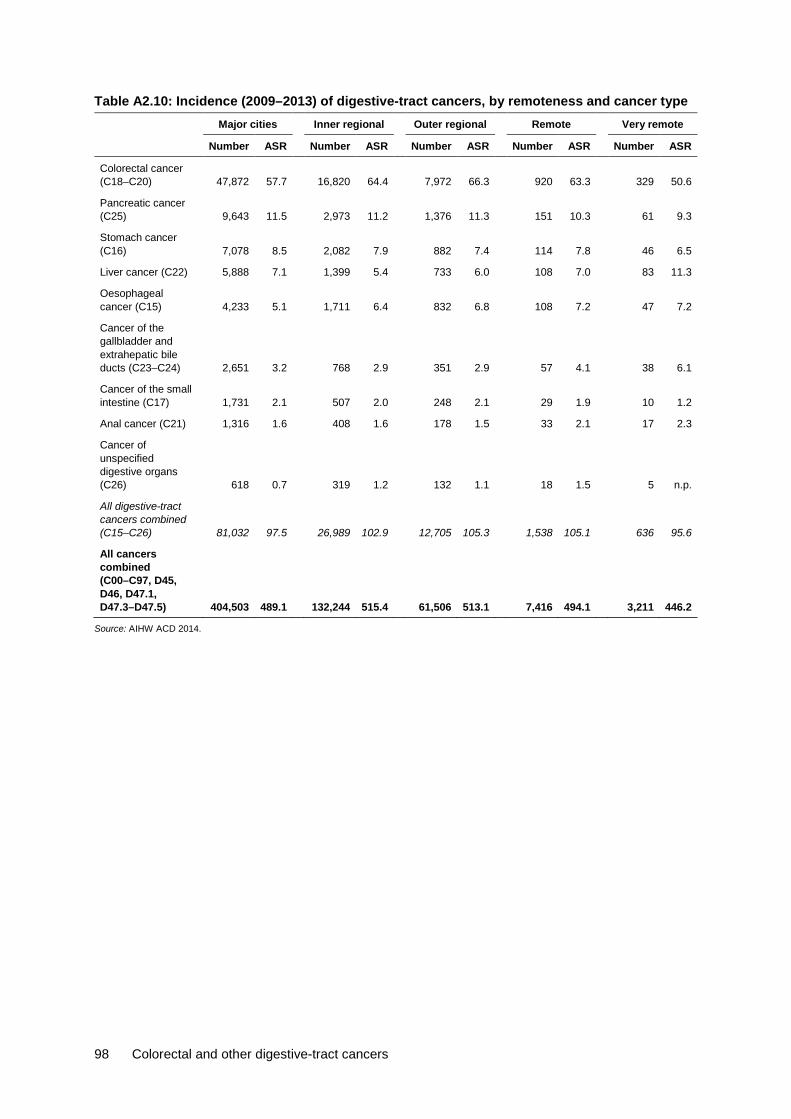
98 Colorectal and other digestive-tract cancers
Table A2.10: Incidence (2009–2013) of digestive-tract cancers, by remoteness and cancer type Major cities Inner regional Outer regional Remote Very remote
Number ASR Number ASR Number ASR Number ASR Number ASR
Colorectal cancer (C18–C20) 47,872 57.7 16,820 64.4 7,972 66.3 920 63.3 329 50.6
Pancreatic cancer (C25) 9,643 11.5 2,973 11.2 1,376 11.3 151 10.3 61 9.3
Stomach cancer (C16) 7,078 8.5 2,082 7.9 882 7.4 114 7.8 46 6.5
Liver cancer (C22) 5,888 7.1 1,399 5.4 733 6.0 108 7.0 83 11.3
Oesophageal cancer (C15) 4,233 5.1 1,711 6.4 832 6.8 108 7.2 47 7.2
Cancer of the gallbladder and extrahepatic bile ducts (C23–C24) 2,651 3.2 768 2.9 351 2.9 57 4.1 38 6.1
Cancer of the small intestine (C17) 1,731 2.1 507 2.0 248 2.1 29 1.9 10 1.2
Anal cancer (C21) 1,316 1.6 408 1.6 178 1.5 33 2.1 17 2.3
Cancer of unspecified digestive organs (C26) 618 0.7 319 1.2 132 1.1 18 1.5 5 n.p.
All digestive-tract cancers combined (C15–C26) 81,032 97.5 26,989 102.9 12,705 105.3 1,538 105.1 636 95.6
All cancers combined (C00–C97, D45, D46, D47.1, D47.3–D47.5) 404,503 489.1 132,244 515.4 61,506 513.1 7,416 494.1 3,211 446.2
Source: AIHW ACD 2014.

Colorectal and other digestive-tract cancers 99
Table A2.11: Mortality (2011–2016) of digestive-tract cancers, by remoteness and cancer type Major cities Inner regional Outer regional Remote Very remote
Number ASR Number ASR Number ASR Number ASR Number ASR
Colorectal cancer (C18–C20) 14,031 15.3 4,522 15.5 2,072 15.9 206 14.1 69 11.1
Pancreatic cancer (C25) 8,916 9.8 2,872 9.7 1,317 10.0 144 9.7 48 7.5
Stomach cancer (C16) 3,968 4.4 1,162 4.0 518 4.0 62 4.2 27 3.6
Liver cancer (C22) 5,817 6.5 1,649 5.7 823 6.2 108 6.6 86 11.2
Oesophageal cancer (C15) 3,733 4.1 1,633 5.6 809 6.1 102 6.3 39 5.1
Cancer of the gallbladder and extrahepatic bile ducts (C23–C24) 871 0.9 289 1.0 112 0.8 19 1.3 15 2.6
Cancer of the small intestine (C17) 377 0.4 113 0.4 53 0.4 8 0.5 2 n.p.
Anal cancer (C21) 273 0.3 89 0.3 40 0.3 6 0.4 7 0.9
Cancer of unspecified digestive organs (C26) 3,162 3.3 1,852 6.2 959 7.3 93 6.4 48 8.6
All digestive cancers combined (C15–C26) 41,148 45.0 14,181 48.5 6,705 51.1 747 49.6 341 50.8
All cancers combined (C00–C97, D45, D46, D47.1, D47.3–D47.5) 144,048 157.3 51,442 175.8 23,680 180.2 2,619 175.5 1,279 195.2
Source: AIHW NMD.

100 Colorectal and other digestive-tract cancers
Table A2.12: 5-year observed survival for digestive-tract cancers, by cancer type and remoteness area, 2010–2014
Cancer site (ICD-10 code) Major cities
Inner regional
Outer regional
Remote and Very remote
Colorectal cancer (C18–C20) 60.2 58.9 58.3 59.5
Pancreatic cancer (C25) 8.3 6.5 6.0 n.p.
Stomach cancer (C16) 26.6 22.4 23.1 19.6
Liver cancer (C22) 18.7 11.1 10.2 n.p.
Oesophageal cancer (C15) 19.7 17.0 14.8 n.p.
Cancer of the gallbladder and extrahepatic bile duct (C23–C24) 17.7 13.6 16.4 n.p.
Cancer of the small intestine (C17) 59.3 61.7 54.9 n.p.
Anal cancer (C21) 62.4 59.7 55.5 n.p.
Cancer of other and unspecified digestive organs (C26) 7.7 n.p. n.p. n.p.
All digestive-tract cancers combined (C15–C26) 44.5 43.8 43.1 40.0
All cancers combined (C00–C97, D45, D46, D47.1, D47.3–D47.5) 61.7 60.1 59.3 57.7
Source: AIHW ACD 2014.
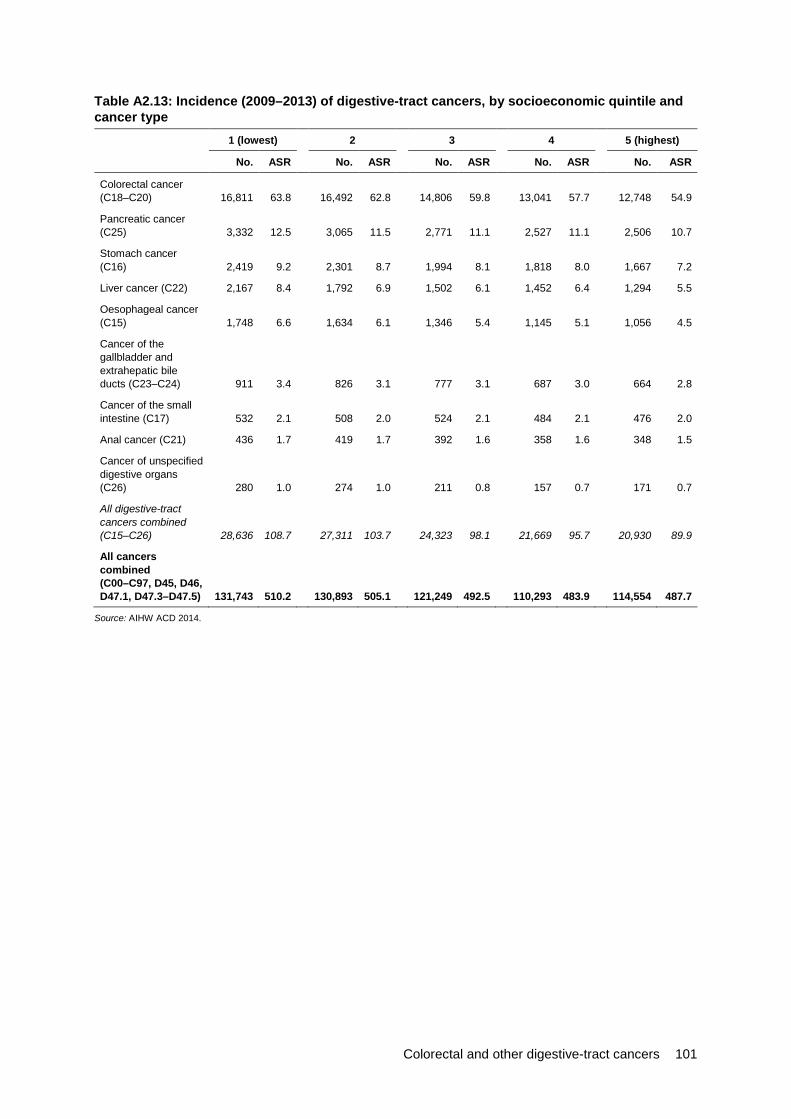
Colorectal and other digestive-tract cancers 101
Table A2.13: Incidence (2009–2013) of digestive-tract cancers, by socioeconomic quintile and cancer type
1 (lowest) 2 3 4 5 (highest)
No. ASR No. ASR No. ASR No. ASR No. ASR
Colorectal cancer (C18–C20) 16,811 63.8 16,492 62.8 14,806 59.8 13,041 57.7 12,748 54.9
Pancreatic cancer (C25) 3,332 12.5 3,065 11.5 2,771 11.1 2,527 11.1 2,506 10.7
Stomach cancer (C16) 2,419 9.2 2,301 8.7 1,994 8.1 1,818 8.0 1,667 7.2
Liver cancer (C22) 2,167 8.4 1,792 6.9 1,502 6.1 1,452 6.4 1,294 5.5
Oesophageal cancer (C15) 1,748 6.6 1,634 6.1 1,346 5.4 1,145 5.1 1,056 4.5
Cancer of the gallbladder and extrahepatic bile ducts (C23–C24) 911 3.4 826 3.1 777 3.1 687 3.0 664 2.8
Cancer of the small intestine (C17) 532 2.1 508 2.0 524 2.1 484 2.1 476 2.0
Anal cancer (C21) 436 1.7 419 1.7 392 1.6 358 1.6 348 1.5
Cancer of unspecified digestive organs (C26) 280 1.0 274 1.0 211 0.8 157 0.7 171 0.7
All digestive-tract cancers combined (C15–C26) 28,636 108.7 27,311 103.7 24,323 98.1 21,669 95.7 20,930 89.9
All cancers combined (C00–C97, D45, D46, D47.1, D47.3–D47.5) 131,743 510.2 130,893 505.1 121,249 492.5 110,293 483.9 114,554 487.7
Source: AIHW ACD 2014.

102 Colorectal and other digestive-tract cancers
Table A2.14: Mortality (2011–2016) of digestive-tract cancers, by socioeconomic quintile and cancer type
1 (lowest) 2 3 4 5 (highest)
No. ASR No. ASR No. ASR No. ASR No. ASR
Colorectal cancer (C18–C20) 4,929 17.0 4,596 15.8 4,155 15.2 3,773 15.1 3,447 13.5
Pancreatic cancer (C25) 3,060 10.6 2,895 9.9 2,630 9.6 2,435 9.8 2,277 9.0
Stomach cancer (C16) 1,395 4.9 1,243 4.3 1,169 4.3 1,022 4.1 907 3.6
Liver cancer (C22) 2,221 7.9 1,928 6.7 1,666 6.1 1,424 5.7 1,244 4.9
Oesophageal cancer (C15) 1,593 5.6 1,478 5.1 1,236 4.5 1,023 4.1 983 3.8
Cancer of the gallbladder and extrahepatic bile ducts (C23–C24) 314 1.1 298 1.0 241 0.9 260 1.0 194 0.7
Cancer of the small intestine (C17) 108 0.4 116 0.4 125 0.5 106 0.4 98 0.4
Anal cancer (C21) 108 0.4 91 0.3 81 0.3 71 0.3 63 0.2
Cancer of unspecified digestive organs (C26) 1,630 5.5 1,632 5.4 1,169 4.2 872 3.4 811 3.1
All digestive cancers combined (C15–C26) 15,358 53.3 14,278 48.9 12,472 45.6 10,985 44.0 10,024 39.3
All cancers combined (C00–C97, D45, D46, D47.1, D47.3–D47.5) 54,175 187.7 51,187 175.5 44,742 163.7 38,084 152.5 34,867 136.6
Source: AIHW NMD.
Table A2.15: 5-year observed survival for digestive-tract cancers, by cancer type and socioeconomic group, 2010–2014
Cancer site (ICD-10 code) 1
Lowest 2 3 4 5
Highest
Colorectal cancer (C18–C20) 55.8 58.8 60.4 61.4 63.1
Pancreatic cancer (C25) 6.7 6.5 7.0 8.5 10.2
Stomach cancer (C16) 22.7 22.7 25.8 28.4 28.7
Liver cancer (C22) 16.1 12.9 15.3 18.8 20.2
Oesophageal cancer (C15) 15.7 16.6 19.3 20.9 20.5
Cancer of the gallbladder and extrahepatic bile duct (C23–C24) 16.9 12.1 16.1 18.6 21.8
Cancer of the small intestine (C17) 57.5 58.6 58.7 61.0 61.0
Anal cancer (C21) 54.5 58.0 66.2 63.4 65.1
Cancer of other and unspecified digestive organs (C26) 4.6 n.p. n.p. n.p. n.p.
All digestive-tract cancers combined (C15–C26) 40.5 42.7 44.9 46.0 48.0
All cancers combined (C00–C97, D45, D46, D47.1, D47.3–D47.5) 55.5 58.6 61.4 63.7 67.2
Source: AIHW ACD 2014.
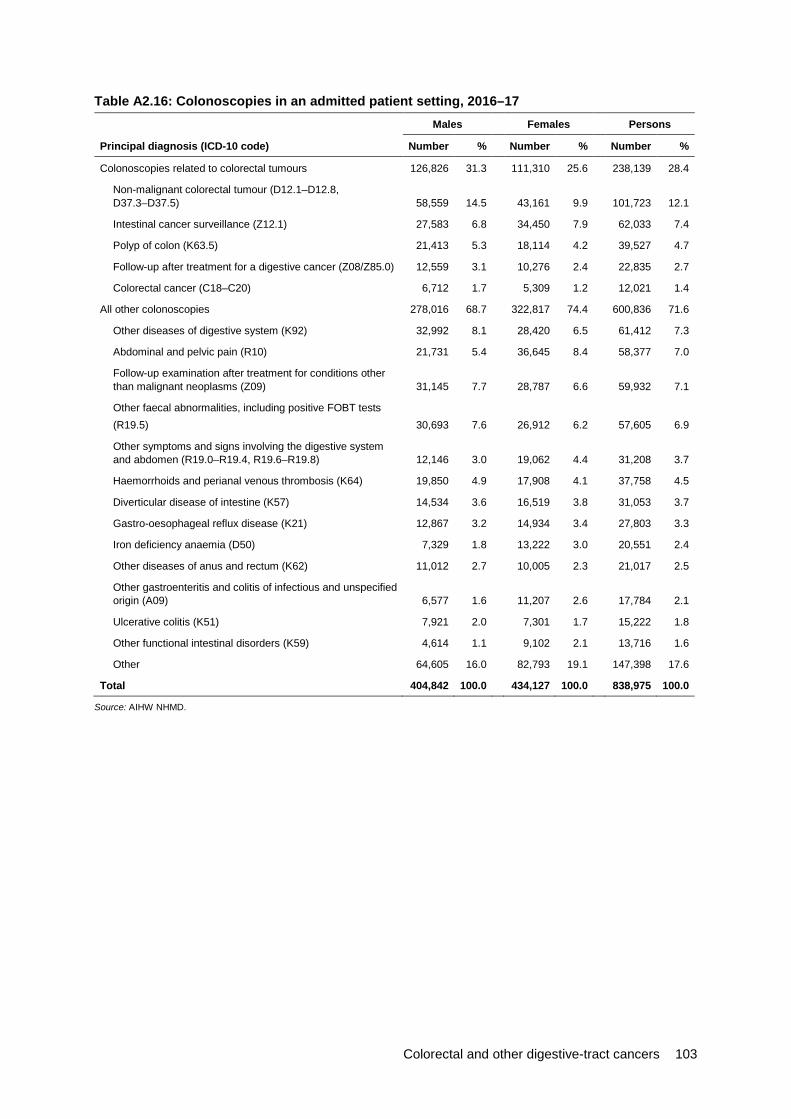
Colorectal and other digestive-tract cancers 103
Table A2.16: Colonoscopies in an admitted patient setting, 2016–17
Principal diagnosis (ICD-10 code)
Males Females Persons
Number % Number % Number %
Colonoscopies related to colorectal tumours 126,826 31.3 111,310 25.6 238,139 28.4
Non-malignant colorectal tumour (D12.1–D12.8, D37.3–D37.5) 58,559 14.5 43,161 9.9 101,723 12.1
Intestinal cancer surveillance (Z12.1) 27,583 6.8 34,450 7.9 62,033 7.4
Polyp of colon (K63.5) 21,413 5.3 18,114 4.2 39,527 4.7
Follow-up after treatment for a digestive cancer (Z08/Z85.0) 12,559 3.1 10,276 2.4 22,835 2.7
Colorectal cancer (C18–C20) 6,712 1.7 5,309 1.2 12,021 1.4
All other colonoscopies 278,016 68.7 322,817 74.4 600,836 71.6
Other diseases of digestive system (K92) 32,992 8.1 28,420 6.5 61,412 7.3
Abdominal and pelvic pain (R10) 21,731 5.4 36,645 8.4 58,377 7.0
Follow-up examination after treatment for conditions other than malignant neoplasms (Z09) 31,145 7.7 28,787 6.6 59,932 7.1
Other faecal abnormalities, including positive FOBT tests (R19.5) 30,693 7.6 26,912 6.2 57,605 6.9
Other symptoms and signs involving the digestive system and abdomen (R19.0–R19.4, R19.6–R19.8) 12,146 3.0 19,062 4.4 31,208 3.7
Haemorrhoids and perianal venous thrombosis (K64) 19,850 4.9 17,908 4.1 37,758 4.5
Diverticular disease of intestine (K57) 14,534 3.6 16,519 3.8 31,053 3.7
Gastro-oesophageal reflux disease (K21) 12,867 3.2 14,934 3.4 27,803 3.3
Iron deficiency anaemia (D50) 7,329 1.8 13,222 3.0 20,551 2.4
Other diseases of anus and rectum (K62) 11,012 2.7 10,005 2.3 21,017 2.5
Other gastroenteritis and colitis of infectious and unspecified origin (A09) 6,577 1.6 11,207 2.6 17,784 2.1
Ulcerative colitis (K51) 7,921 2.0 7,301 1.7 15,222 1.8
Other functional intestinal disorders (K59) 4,614 1.1 9,102 2.1 13,716 1.6
Other 64,605 16.0 82,793 19.1 147,398 17.6
Total 404,842 100.0 434,127 100.0 838,975 100.0
Source: AIHW NHMD.
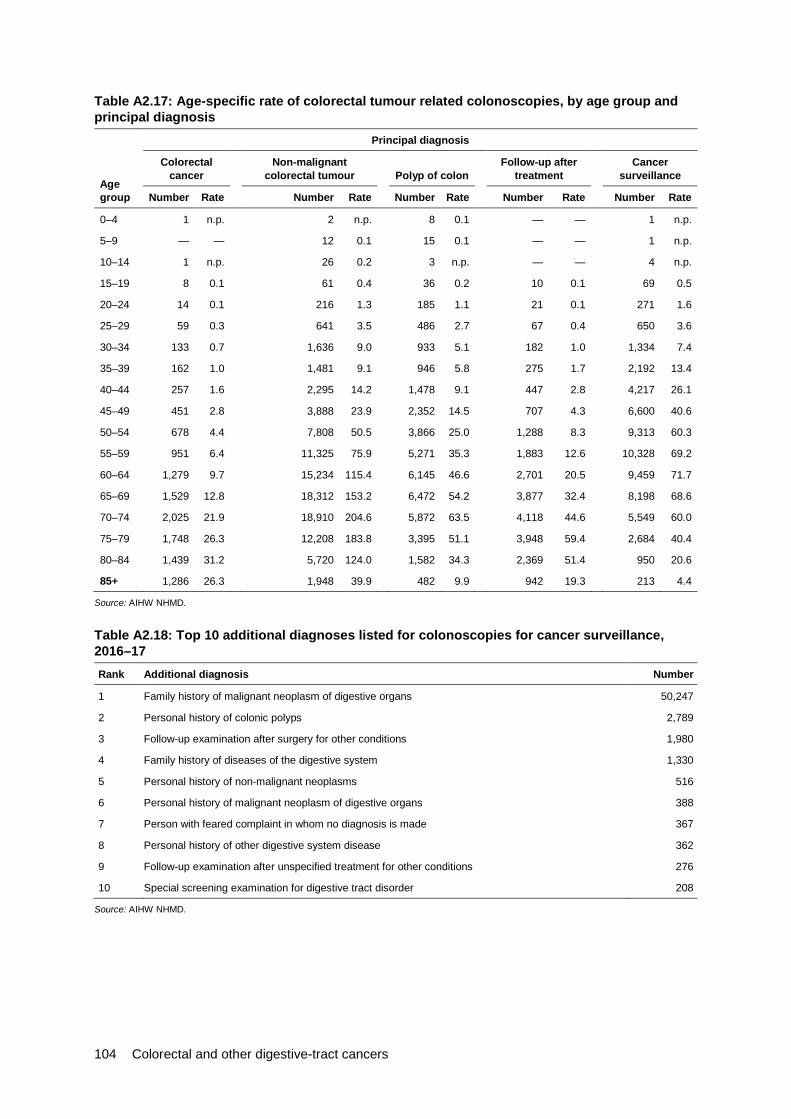
104 Colorectal and other digestive-tract cancers
Table A2.17: Age-specific rate of colorectal tumour related colonoscopies, by age group and principal diagnosis
Age group
Principal diagnosis
Colorectal cancer
Non-malignant colorectal tumour Polyp of colon
Follow-up after treatment
Cancer surveillance
Number Rate Number Rate Number Rate Number Rate Number Rate
0–4 1 n.p. 2 n.p. 8 0.1 — — 1 n.p.
5–9 — — 12 0.1 15 0.1 — — 1 n.p.
10–14 1 n.p. 26 0.2 3 n.p. — — 4 n.p.
15–19 8 0.1 61 0.4 36 0.2 10 0.1 69 0.5
20–24 14 0.1 216 1.3 185 1.1 21 0.1 271 1.6
25–29 59 0.3 641 3.5 486 2.7 67 0.4 650 3.6
30–34 133 0.7 1,636 9.0 933 5.1 182 1.0 1,334 7.4
35–39 162 1.0 1,481 9.1 946 5.8 275 1.7 2,192 13.4
40–44 257 1.6 2,295 14.2 1,478 9.1 447 2.8 4,217 26.1
45–49 451 2.8 3,888 23.9 2,352 14.5 707 4.3 6,600 40.6
50–54 678 4.4 7,808 50.5 3,866 25.0 1,288 8.3 9,313 60.3
55–59 951 6.4 11,325 75.9 5,271 35.3 1,883 12.6 10,328 69.2
60–64 1,279 9.7 15,234 115.4 6,145 46.6 2,701 20.5 9,459 71.7
65–69 1,529 12.8 18,312 153.2 6,472 54.2 3,877 32.4 8,198 68.6
70–74 2,025 21.9 18,910 204.6 5,872 63.5 4,118 44.6 5,549 60.0
75–79 1,748 26.3 12,208 183.8 3,395 51.1 3,948 59.4 2,684 40.4
80–84 1,439 31.2 5,720 124.0 1,582 34.3 2,369 51.4 950 20.6
85+ 1,286 26.3 1,948 39.9 482 9.9 942 19.3 213 4.4
Source: AIHW NHMD.
Table A2.18: Top 10 additional diagnoses listed for colonoscopies for cancer surveillance, 2016–17 Rank Additional diagnosis Number
1 Family history of malignant neoplasm of digestive organs 50,247
2 Personal history of colonic polyps 2,789
3 Follow-up examination after surgery for other conditions 1,980
4 Family history of diseases of the digestive system 1,330
5 Personal history of non-malignant neoplasms 516
6 Personal history of malignant neoplasm of digestive organs 388
7 Person with feared complaint in whom no diagnosis is made 367
8 Personal history of other digestive system disease 362
9 Follow-up examination after unspecified treatment for other conditions 276
10 Special screening examination for digestive tract disorder 208
Source: AIHW NHMD.

Colorectal and other digestive-tract cancers 105
Table A2.19: Age-standardised rate of colorectal tumour related colonoscopies, 2001–02 to 2016–17 Principal diagnosis
Colorectal cancer
Non-malignant colorectal
tumour Polyp of colon Follow-up after
treatment Cancer surveillance
All colorectal tumour-related colonoscopies
Financial year Number ASR Number ASR Number ASR Number ASR Number ASR Number ASR
2001–02 9,192 4.7 33,994 17.4 20,631 10.6 13,024 6.7 7,860 4.0 84,701 43.4
2002–03 9,730 4.9 37,281 18.7 22,117 11.1 14,316 7.2 22,261 11.2 105,705 53.0
2003–04 9,845 4.8 37,781 18.5 23,471 11.5 14,742 7.3 24,416 12.0 110,255 54.2
2004–05 10,112 4.9 41,227 19.8 24,771 11.9 15,052 7.3 28,268 13.7 119,430 57.5
2005–06 10,277 4.8 42,039 19.8 25,610 12.1 15,382 7.3 30,716 14.6 124,024 58.4
2006–07 11,087 5.1 47,867 22.0 27,291 12.6 16,502 7.6 37,288 17.3 140,035 64.5
2007–08 11,204 5.0 51,949 23.2 28,681 12.9 16,310 7.3 42,618 19.3 150,762 67.7
2008–09 11,223 4.9 51,230 22.3 28,477 12.5 17,746 7.8 47,049 20.9 155,725 68.3
2009–10 11,341 4.8 56,403 24.0 31,558 13.5 18,142 7.8 49,563 21.5 167,007 71.5
2010–11 12,185 5.0 62,793 26.0 34,539 14.4 18,648 7.8 52,135 22.1 180,300 75.3
2011–12 11,785 4.7 64,164 25.9 33,718 13.7 19,291 7.8 55,003 22.8 183,961 75.0
2012–13 11,652 4.6 67,441 26.5 33,373 13.2 19,371 7.7 54,268 22.0 186,105 74.0
2013–14 11,645 4.5 76,918 29.5 33,255 12.9 19,928 7.7 56,478 22.5 198,224 77.0
2014–15 12,344 4.6 91,402 34.3 40,237 15.3 21,693 8.2 60,826 23.8 226,502 86.1
2015–16 12,383 4.5 97,344 35.7 37,749 14.1 22,447 8.2 64,725 24.8 234,648 87.4
2016–17 12,021 4.3 101,723 36.4 39,527 14.4 22,835 8.2 62,033 23.4 238,139 86.6
Source: AIHW NHMD.
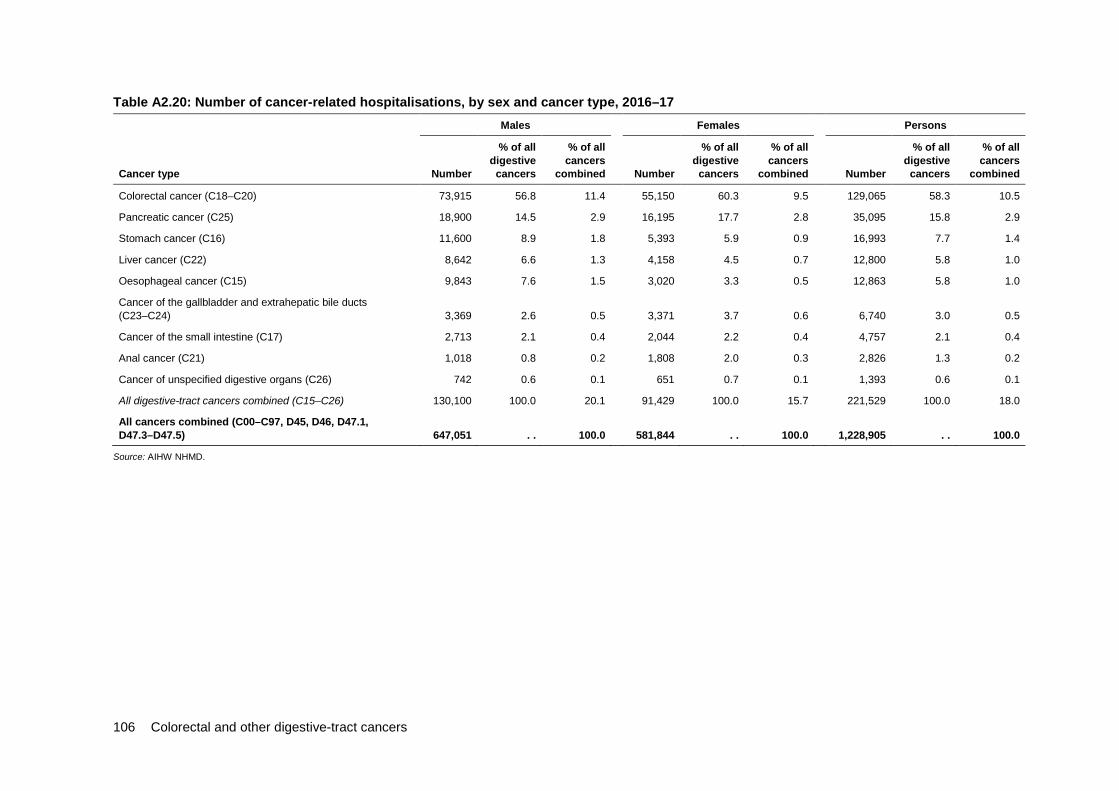
106 Colorectal and other digestive-tract cancers
Table A2.20: Number of cancer-related hospitalisations, by sex and cancer type, 2016–17 Males Females Persons
Cancer type Number
% of all digestive
cancers
% of all cancers
combined Number
% of all digestive
cancers
% of all cancers
combined Number
% of all digestive
cancers
% of all cancers
combined
Colorectal cancer (C18–C20) 73,915 56.8 11.4 55,150 60.3 9.5 129,065 58.3 10.5
Pancreatic cancer (C25) 18,900 14.5 2.9 16,195 17.7 2.8 35,095 15.8 2.9
Stomach cancer (C16) 11,600 8.9 1.8 5,393 5.9 0.9 16,993 7.7 1.4
Liver cancer (C22) 8,642 6.6 1.3 4,158 4.5 0.7 12,800 5.8 1.0
Oesophageal cancer (C15) 9,843 7.6 1.5 3,020 3.3 0.5 12,863 5.8 1.0
Cancer of the gallbladder and extrahepatic bile ducts (C23–C24) 3,369 2.6 0.5 3,371 3.7 0.6 6,740 3.0 0.5
Cancer of the small intestine (C17) 2,713 2.1 0.4 2,044 2.2 0.4 4,757 2.1 0.4
Anal cancer (C21) 1,018 0.8 0.2 1,808 2.0 0.3 2,826 1.3 0.2
Cancer of unspecified digestive organs (C26) 742 0.6 0.1 651 0.7 0.1 1,393 0.6 0.1
All digestive-tract cancers combined (C15–C26) 130,100 100.0 20.1 91,429 100.0 15.7 221,529 100.0 18.0
All cancers combined (C00–C97, D45, D46, D47.1, D47.3–D47.5) 647,051 . . 100.0 581,844 . . 100.0 1,228,905 . . 100.0
Source: AIHW NHMD.
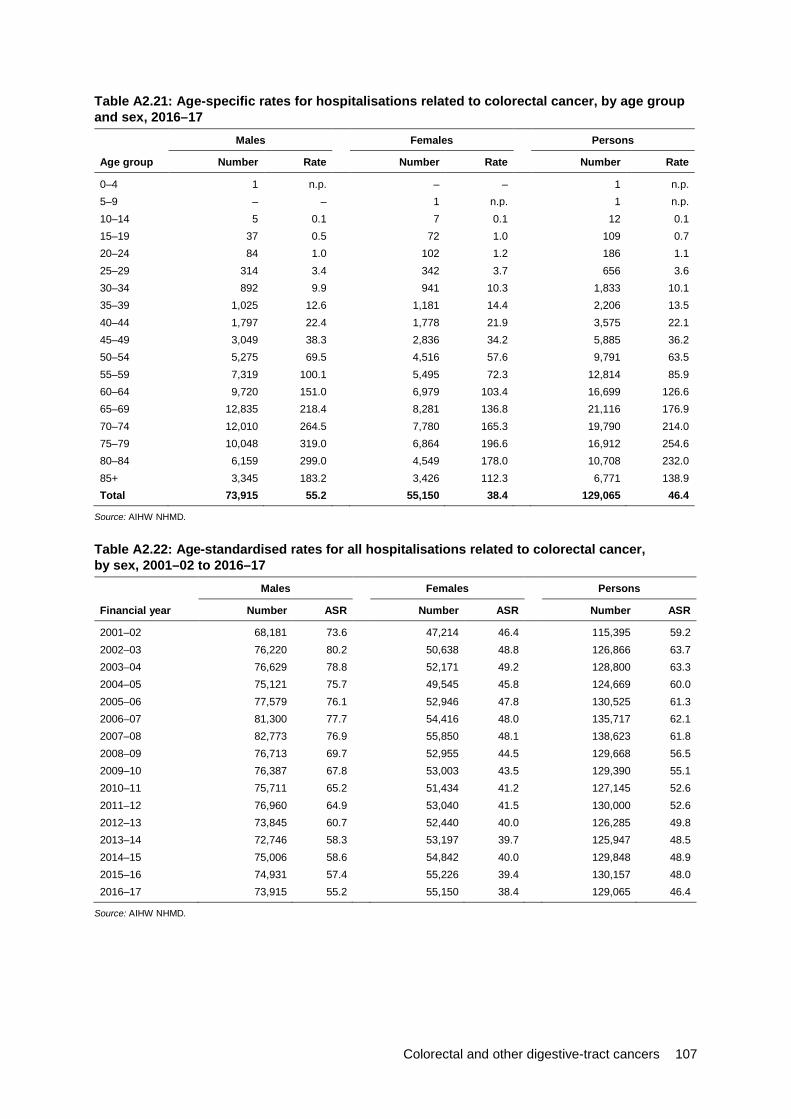
Colorectal and other digestive-tract cancers 107
Table A2.21: Age-specific rates for hospitalisations related to colorectal cancer, by age group and sex, 2016–17
Males Females Persons
Age group Number Rate Number Rate Number Rate
0–4 1 n.p. – – 1 n.p.5–9 – – 1 n.p. 1 n.p.10–14 5 0.1 7 0.1 12 0.115–19 37 0.5 72 1.0 109 0.720–24 84 1.0 102 1.2 186 1.125–29 314 3.4 342 3.7 656 3.630–34 892 9.9 941 10.3 1,833 10.135–39 1,025 12.6 1,181 14.4 2,206 13.540–44 1,797 22.4 1,778 21.9 3,575 22.145–49 3,049 38.3 2,836 34.2 5,885 36.250–54 5,275 69.5 4,516 57.6 9,791 63.555–59 7,319 100.1 5,495 72.3 12,814 85.960–64 9,720 151.0 6,979 103.4 16,699 126.665–69 12,835 218.4 8,281 136.8 21,116 176.970–74 12,010 264.5 7,780 165.3 19,790 214.075–79 10,048 319.0 6,864 196.6 16,912 254.680–84 6,159 299.0 4,549 178.0 10,708 232.085+ 3,345 183.2 3,426 112.3 6,771 138.9Total 73,915 55.2 55,150 38.4 129,065 46.4
Source: AIHW NHMD.
Table A2.22: Age-standardised rates for all hospitalisations related to colorectal cancer, by sex, 2001–02 to 2016–17
Males Females Persons
Financial year Number ASR Number ASR Number ASR
2001–02 68,181 73.6 47,214 46.4 115,395 59.2 2002–03 76,220 80.2 50,638 48.8 126,866 63.7 2003–04 76,629 78.8 52,171 49.2 128,800 63.3 2004–05 75,121 75.7 49,545 45.8 124,669 60.0 2005–06 77,579 76.1 52,946 47.8 130,525 61.3 2006–07 81,300 77.7 54,416 48.0 135,717 62.1 2007–08 82,773 76.9 55,850 48.1 138,623 61.8 2008–09 76,713 69.7 52,955 44.5 129,668 56.5 2009–10 76,387 67.8 53,003 43.5 129,390 55.1 2010–11 75,711 65.2 51,434 41.2 127,145 52.6 2011–12 76,960 64.9 53,040 41.5 130,000 52.6 2012–13 73,845 60.7 52,440 40.0 126,285 49.8 2013–14 72,746 58.3 53,197 39.7 125,947 48.5 2014–15 75,006 58.6 54,842 40.0 129,848 48.9 2015–16 74,931 57.4 55,226 39.4 130,157 48.0 2016–17 73,915 55.2 55,150 38.4 129,065 46.4
Source: AIHW NHMD.
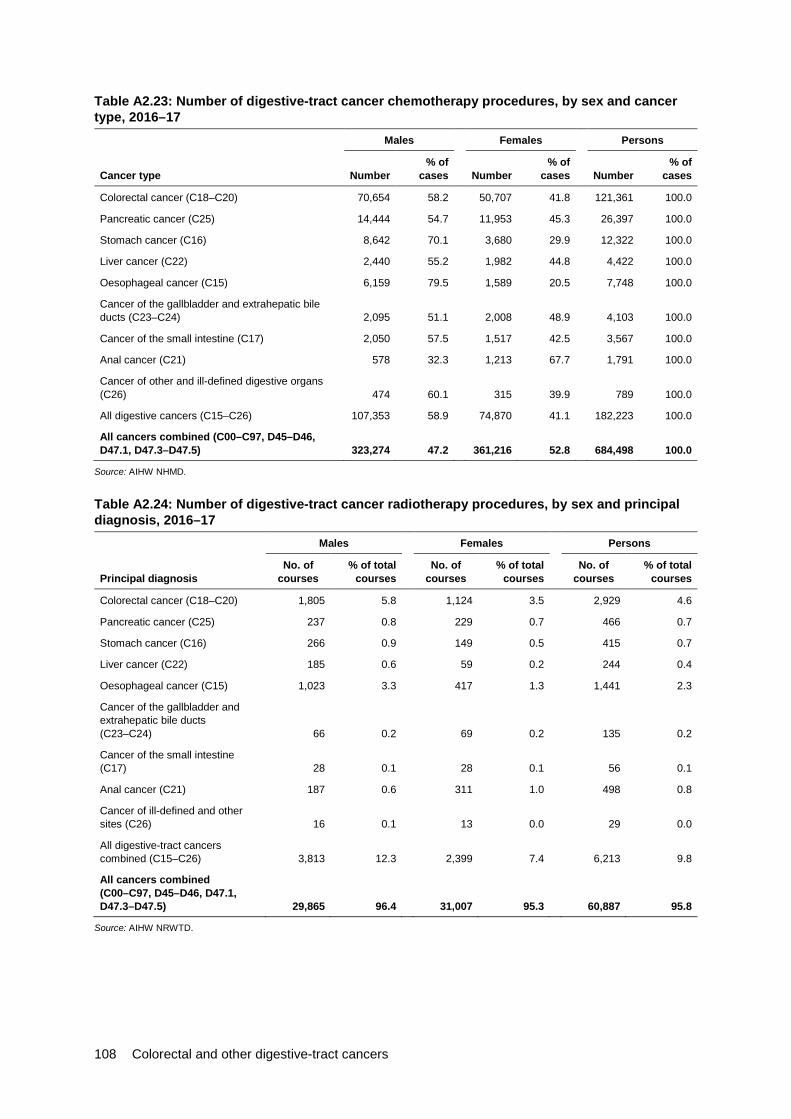
108 Colorectal and other digestive-tract cancers
Table A2.23: Number of digestive-tract cancer chemotherapy procedures, by sex and cancer type, 2016–17
Males Females Persons
Cancer type Number % of
cases Number % of
cases Number % of
cases
Colorectal cancer (C18–C20) 70,654 58.2 50,707 41.8 121,361 100.0
Pancreatic cancer (C25) 14,444 54.7 11,953 45.3 26,397 100.0
Stomach cancer (C16) 8,642 70.1 3,680 29.9 12,322 100.0
Liver cancer (C22) 2,440 55.2 1,982 44.8 4,422 100.0
Oesophageal cancer (C15) 6,159 79.5 1,589 20.5 7,748 100.0
Cancer of the gallbladder and extrahepatic bile ducts (C23–C24) 2,095 51.1 2,008 48.9 4,103 100.0
Cancer of the small intestine (C17) 2,050 57.5 1,517 42.5 3,567 100.0
Anal cancer (C21) 578 32.3 1,213 67.7 1,791 100.0
Cancer of other and ill-defined digestive organs (C26) 474 60.1 315 39.9 789 100.0
All digestive cancers (C15–C26) 107,353 58.9 74,870 41.1 182,223 100.0
All cancers combined (C00–C97, D45–D46, D47.1, D47.3–D47.5) 323,274 47.2 361,216 52.8 684,498 100.0
Source: AIHW NHMD.
Table A2.24: Number of digestive-tract cancer radiotherapy procedures, by sex and principal diagnosis, 2016–17
Males Females Persons
Principal diagnosis No. of
courses % of total
courses No. of
courses % of total
courses No. of
courses % of total
courses
Colorectal cancer (C18–C20) 1,805 5.8 1,124 3.5 2,929 4.6
Pancreatic cancer (C25) 237 0.8 229 0.7 466 0.7
Stomach cancer (C16) 266 0.9 149 0.5 415 0.7
Liver cancer (C22) 185 0.6 59 0.2 244 0.4
Oesophageal cancer (C15) 1,023 3.3 417 1.3 1,441 2.3
Cancer of the gallbladder and extrahepatic bile ducts (C23–C24) 66 0.2 69 0.2 135 0.2
Cancer of the small intestine (C17) 28 0.1 28 0.1 56 0.1
Anal cancer (C21) 187 0.6 311 1.0 498 0.8
Cancer of ill-defined and other sites (C26) 16 0.1 13 0.0 29 0.0
All digestive-tract cancers combined (C15–C26) 3,813 12.3 2,399 7.4 6,213 9.8
All cancers combined (C00–C97, D45–D46, D47.1, D47.3–D47.5) 29,865 96.4 31,007 95.3 60,887 95.8
Source: AIHW NRWTD.
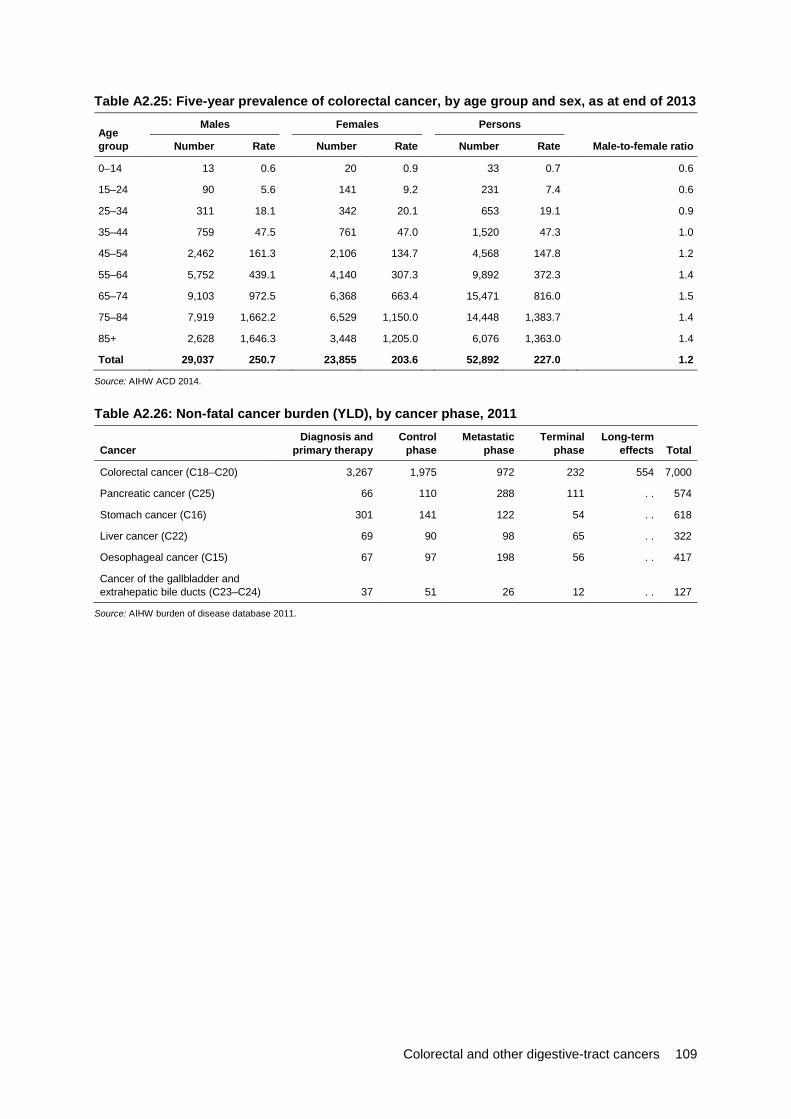
Colorectal and other digestive-tract cancers 109
Table A2.25: Five-year prevalence of colorectal cancer, by age group and sex, as at end of 2013
Age group
Males Females Persons
Number Rate Number Rate Number Rate Male-to-female ratio
0–14 13 0.6 20 0.9 33 0.7 0.6
15–24 90 5.6 141 9.2 231 7.4 0.6
25–34 311 18.1 342 20.1 653 19.1 0.9
35–44 759 47.5 761 47.0 1,520 47.3 1.0
45–54 2,462 161.3 2,106 134.7 4,568 147.8 1.2
55–64 5,752 439.1 4,140 307.3 9,892 372.3 1.4
65–74 9,103 972.5 6,368 663.4 15,471 816.0 1.5
75–84 7,919 1,662.2 6,529 1,150.0 14,448 1,383.7 1.4
85+ 2,628 1,646.3 3,448 1,205.0 6,076 1,363.0 1.4
Total 29,037 250.7 23,855 203.6 52,892 227.0 1.2
Source: AIHW ACD 2014.
Table A2.26: Non-fatal cancer burden (YLD), by cancer phase, 2011
Cancer Diagnosis and
primary therapy Control
phase Metastatic
phase Terminal
phase Long-term
effects Total
Colorectal cancer (C18–C20) 3,267 1,975 972 232 554 7,000
Pancreatic cancer (C25) 66 110 288 111 . . 574
Stomach cancer (C16) 301 141 122 54 . . 618
Liver cancer (C22) 69 90 98 65 . . 322
Oesophageal cancer (C15) 67 97 198 56 . . 417
Cancer of the gallbladder and extrahepatic bile ducts (C23–C24) 37 51 26 12 . . 127
Source: AIHW burden of disease database 2011.

110 Colorectal and other digestive-tract cancers
Table A2.27: Burden of disease from digestive-tract cancers, by age group, 2011 0–14 15–24 25–64 65+
DALYs
% of total cancer burden Rank DALYs
% of total cancer burden Rank DALYs
% of total cancer burden Rank DALYs
% of total cancer burden Rank
Males
Colorectal cancer (C18–C20) — — — 273 7.1 3 22,061 11.0 2 30,748 11.8 3
Pancreatic cancer (C25) 78 1.6 8 6 0.2 13 11,934 6.0 6 12,603 4.8 4
Stomach cancer (C16) — — — 9 0.2 12 7,045 3.5 11 7,493 2.9 12
Liver cancer (C22) 163 3.4 5 63 1.6 10 12,928 6.5 4 8,589 3.3 10
Oesophageal cancer (C15) — — — — — — 9,424 4.7 7 8,995 3.4 8
Cancer of the gallbladder and extrahepatic bile ducts (C23–C24) — — — — — — 712 0.4 22 919 0.4 21
Females
Colorectal cancer (C18–C20) 8 0.2 19 74 2.5 8 16,783 9.6 3 22,473 12.4 3
Pancreatic cancer (C25) 8 0.2 13 — — — 7,428 4.2 6 12,371 6.8 4
Stomach cancer (C16) — — — 66 2.2 11 4,108 2.3 11 3,861 2.1 14
Liver cancer (C22) 88 2.0 6 65 2.2 12 2,914 1.7 14 4,565 2.5 9
Oesophageal cancer (C15) — — — — — — 1,849 1.1 18 3,504 1.9 15
Cancer of the gallbladder and extrahepatic bile ducts (C23–C24) 8 0.2 10 — — — 887 0.5 20 1,762 1.0 21
Source: AIHW burden of disease database 2011.

Colorectal and other digestive-tract cancers 111
Chapter 3: Pancreatic cancer Table A3.1: Estimated incidence and mortality (2018) and 5-year relative survival (2010–2014) for pancreatic cancer, by age group Incidence Mortality Survival
Age group Number Rate Number Rate 5-year relative survival (%)
0–4 — — — — n.p.
5–9 — — 1 n.p. n.p.
10–14 — — — — n.p.
15–19 1 n.p. — — n.p.
20–24 1 n.p. — — n.p.
25–29 4 n.p. 1 n.p. n.p.
30–34 9 0.5 4 n.p. n.p.
35–39 16 0.9 10 0.6 n.p.
40–44 35 2.2 22 1.3 38.1
45–49 75 4.4 51 3.0 21.1
50–54 131 8.5 95 6.2 16.5
55–59 231 15.0 180 11.7 14.9
60–64 345 25.0 278 20.2 13.2
65–69 463 38.4 388 32.2 9.2
70–74 542 53.1 490 47.9 7.4
75–79 507 71.8 476 67.4 6.2
80–84 449 91.7 451 92.1 2.7
85+ 553 109.0 558 110.0 1.7
Total 3,364 11.1 3,006 9.8 8.7
Sources: AIHW ACD 2014; AIHW NMD.

112 Colorectal and other digestive-tract cancers
Table A3.2: Incidence (1982–2014) and mortality (1982–2016) trends, pancreatic cancer, with projections to 2018 Incidence Mortality
Year Number ASR Number ASR
1982 1,206 10.0 1,168 9.8
1983 1,175 9.6 1,141 9.4
1984 1,239 9.9 1,218 9.8
1985 1,245 9.7 1,220 9.5
1986 1,361 10.3 1,287 9.8
1987 1,298 9.6 1,315 9.7
1988 1,341 9.6 1,259 9.1
1989 1,380 9.7 1,404 9.9
1990 1,403 9.7 1,366 9.4
1991 1,448 9.7 1,377 9.3
1992 1,503 9.9 1,445 9.5
1993 1,529 9.7 1,477 9.4
1994 1,592 9.9 1,480 9.3
1995 1,604 9.8 1,533 9.4
1996 1,677 10.0 1,601 9.6
1997 1,711 9.9 1,602 9.3
1998 1,795 10.1 1,618 9.1
1999 1,834 10.1 1,709 9.4
2000 1,894 10.1 1,749 9.3
2001 1,901 9.9 1,811 9.4
2002 1,899 9.6 1,841 9.3
2003 2,087 10.3 1,882 9.3
2004 2,123 10.3 1,998 9.7
2005 2,263 10.7 2,026 9.5
2006 2,338 10.7 2,091 9.6
2007 2,620 11.7 2,266 10.1
2008 2,488 10.9 2,260 9.8
2009 2,602 11.0 2,227 9.4
2010 2,779 11.5 2,430 10.0
2011 2,908 11.7 2,425 9.7
2012 2,983 11.6 2,544 9.9
2013 2,960 11.2 2,558 9.6
2014 3,078 11.3 2,565 9.4
2015 3,088 11.1 2,745 9.8
2016 3,177 11.1 2,911 10.2
2017 3,271 11.1 2,915 9.8
2018 3,364 11.1 3,006 9.8
Sources: AIHW ACD 2014 AIHW NMD.

Colorectal and other digestive-tract cancers 113
Table A3.3: Incidence (2013) and 5-year relative survival (2010–2014), pancreatic cancer, by subsite Cancer subsite Incidence (number) 5-year relative survival (%)
Head of pancreas 1,095 7.1
Body of pancreas 143 4.9
Tail of pancreas 232 6.4
Pancreatic duct 33 17.6
Other parts of pancreas 61 n.p.
Overlapping and unspecified 1,177 3.5
Source: AIHW ACD 2014.
Table A3.4: Incidence (2013) and 5-year relative survival (2010–2014), pancreatic cancer, by histology Histology group Incidence (number) 5-year relative survival (%)
Adenocarcinomas 1,731 6.0
Neuroendocrine neoplasms 219 64.1
Other specified carcinomas 49 30.5
Unspecified carcinomas 382 3.1
Sarcomas 1 n.p.
Other specified malignant neoplasms 1 n.p.
Unspecified malignant neoplasms 577 2.8
Source: AIHW ACD 2014.
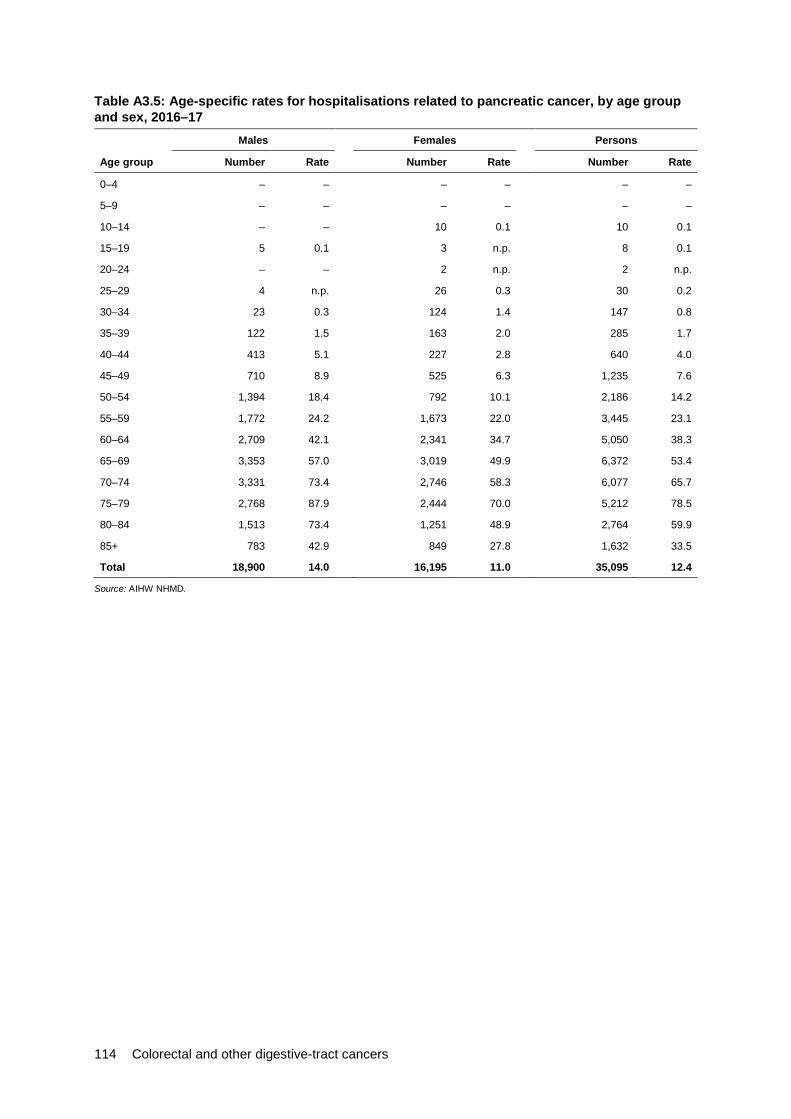
114 Colorectal and other digestive-tract cancers
Table A3.5: Age-specific rates for hospitalisations related to pancreatic cancer, by age group and sex, 2016–17
Males Females Persons
Age group Number Rate Number Rate Number Rate
0–4 – – – – – –
5–9 – – – – – –
10–14 – – 10 0.1 10 0.1
15–19 5 0.1 3 n.p. 8 0.1
20–24 – – 2 n.p. 2 n.p.
25–29 4 n.p. 26 0.3 30 0.2
30–34 23 0.3 124 1.4 147 0.8
35–39 122 1.5 163 2.0 285 1.7
40–44 413 5.1 227 2.8 640 4.0
45–49 710 8.9 525 6.3 1,235 7.6
50–54 1,394 18.4 792 10.1 2,186 14.2
55–59 1,772 24.2 1,673 22.0 3,445 23.1
60–64 2,709 42.1 2,341 34.7 5,050 38.3
65–69 3,353 57.0 3,019 49.9 6,372 53.4
70–74 3,331 73.4 2,746 58.3 6,077 65.7
75–79 2,768 87.9 2,444 70.0 5,212 78.5
80–84 1,513 73.4 1,251 48.9 2,764 59.9
85+ 783 42.9 849 27.8 1,632 33.5
Total 18,900 14.0 16,195 11.0 35,095 12.4
Source: AIHW NHMD.

Colorectal and other digestive-tract cancers 115
Table A3.6: Age-standardised rates for all hospitalisations related to pancreatic cancer, by sex, 2001–02 to 2016–17
Males Females Persons
Financial year Number ASR Number ASR Number ASR
2001–02 7,001 7.6 5,330 5.1 12,331 6.3
2002–03 7,270 7.7 6,023 5.7 13,293 6.7
2003–04 8,042 8.4 6,642 6.2 14,684 7.2
2004–05 8,216 8.3 7,570 6.9 15,786 7.6
2005–06 9,558 9.5 7,116 6.3 16,674 7.8
2006–07 10,633 10.2 8,059 7.0 18,692 8.5
2007–08 10,695 10.0 8,293 7.0 18,988 8.4
2008–09 10,118 9.2 8,356 7.0 18,474 8.0
2009–10 11,741 10.4 9,840 8.0 21,581 9.1
2010–11 12,746 11.0 10,130 8.0 22,876 9.4
2011–12 13,636 11.5 11,434 8.7 25,070 10.0
2012–13 13,777 11.2 11,381 8.5 25,158 9.8
2013–14 13,494 10.7 11,584 8.5 25,078 9.6
2014–15 16,275 12.6 13,670 9.7 29,946 11.1
2015–16 17,947 13.7 15,796 10.9 33,743 12.2
2016–17 18,900 14.0 16,195 11.0 35,095 12.4
Source: AIHW NHMD.
Table A3.7: Five-year prevalence of pancreatic cancer, by age group and sex, as at end of 2013 Males Females Persons
Age group Number Rate Number Rate Number Rate Male-to-female ratio
0–14 1 n.p. 3 n.p. 4 n.p. n.p.
15–24 2 n.p. 6 0.4 8 0.3 n.p.
25–34 11 0.6 19 1.1 30 0.9 0.6
35–44 60 3.8 43 2.7 103 3.2 1.4
45–54 173 11.3 134 8.6 307 9.9 1.3
55–64 375 28.6 345 25.6 720 27.1 1.1
65–74 512 54.7 451 47.0 963 50.8 1.2
75–84 333 69.9 321 56.5 654 62.6 1.2
85+ 99 62.0 157 54.9 256 57.4 1.1
Total 1,566 13.5 1,479 12.6 3,045 13.1 1.1
Source: AIHW ACD 2014.

116 Colorectal and other digestive-tract cancers
Chapter 4: Stomach cancer Table A4.1: Estimated incidence and mortality (2018) and 5-year relative survival (2010–2014) for stomach cancer, by age group
Incidence Mortality Survival
Age group Number Rate Number Rate 5-year relative survival (%)
0–4 — — — — n.p.
5–9 — — — — n.p.
10–14 — — — — n.p.
15–19 1 n.p. — — n.p.
20–24 3 n.p. 1 n.p. n.p.
25–29 6 0.3 3 n.p. n.p.
30–34 13 0.7 3 n.p. n.p.
35–39 26 1.4 11 0.6 31.9
40–44 47 2.9 27 1.6 32.3
45–49 83 4.9 38 2.2 36.8
50–54 116 7.5 42 2.7 36.9
55–59 189 12.2 64 4.1 32.2
60–64 242 17.6 85 6.2 36.2
65–69 316 26.3 117 9.7 36.3
70–74 354 34.7 159 15.6 30.3
75–79 318 45.0 155 22.0 29.3
80–84 288 58.9 152 31.0 20.6
85+ 328 64.6 222 43.7 11.4
Total 2,332 7.8 1,078 3.6 29.5
Sources: AIHW ACD 2014; AIHW NMD.
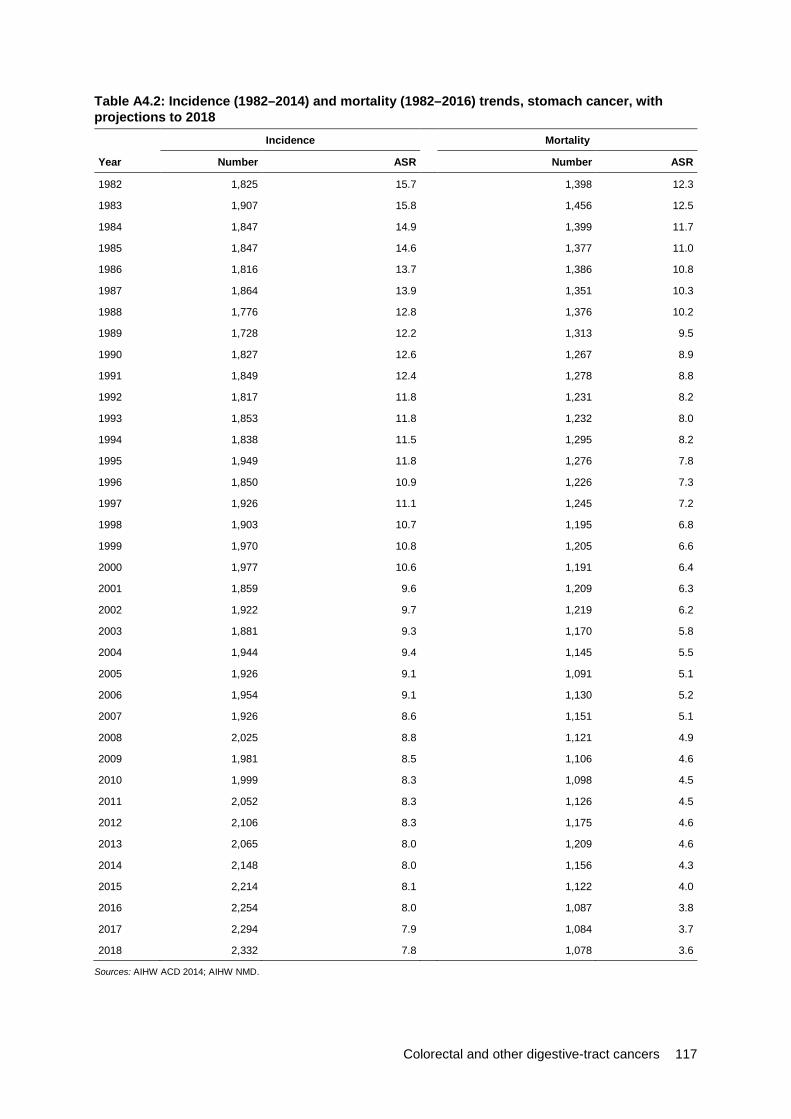
Colorectal and other digestive-tract cancers 117
Table A4.2: Incidence (1982–2014) and mortality (1982–2016) trends, stomach cancer, with projections to 2018 Incidence Mortality
Year Number ASR Number ASR
1982 1,825 15.7 1,398 12.3
1983 1,907 15.8 1,456 12.5
1984 1,847 14.9 1,399 11.7
1985 1,847 14.6 1,377 11.0
1986 1,816 13.7 1,386 10.8
1987 1,864 13.9 1,351 10.3
1988 1,776 12.8 1,376 10.2
1989 1,728 12.2 1,313 9.5
1990 1,827 12.6 1,267 8.9
1991 1,849 12.4 1,278 8.8
1992 1,817 11.8 1,231 8.2
1993 1,853 11.8 1,232 8.0
1994 1,838 11.5 1,295 8.2
1995 1,949 11.8 1,276 7.8
1996 1,850 10.9 1,226 7.3
1997 1,926 11.1 1,245 7.2
1998 1,903 10.7 1,195 6.8
1999 1,970 10.8 1,205 6.6
2000 1,977 10.6 1,191 6.4
2001 1,859 9.6 1,209 6.3
2002 1,922 9.7 1,219 6.2
2003 1,881 9.3 1,170 5.8
2004 1,944 9.4 1,145 5.5
2005 1,926 9.1 1,091 5.1
2006 1,954 9.1 1,130 5.2
2007 1,926 8.6 1,151 5.1
2008 2,025 8.8 1,121 4.9
2009 1,981 8.5 1,106 4.6
2010 1,999 8.3 1,098 4.5
2011 2,052 8.3 1,126 4.5
2012 2,106 8.3 1,175 4.6
2013 2,065 8.0 1,209 4.6
2014 2,148 8.0 1,156 4.3
2015 2,214 8.1 1,122 4.0
2016 2,254 8.0 1,087 3.8
2017 2,294 7.9 1,084 3.7
2018 2,332 7.8 1,078 3.6
Sources: AIHW ACD 2014; AIHW NMD.
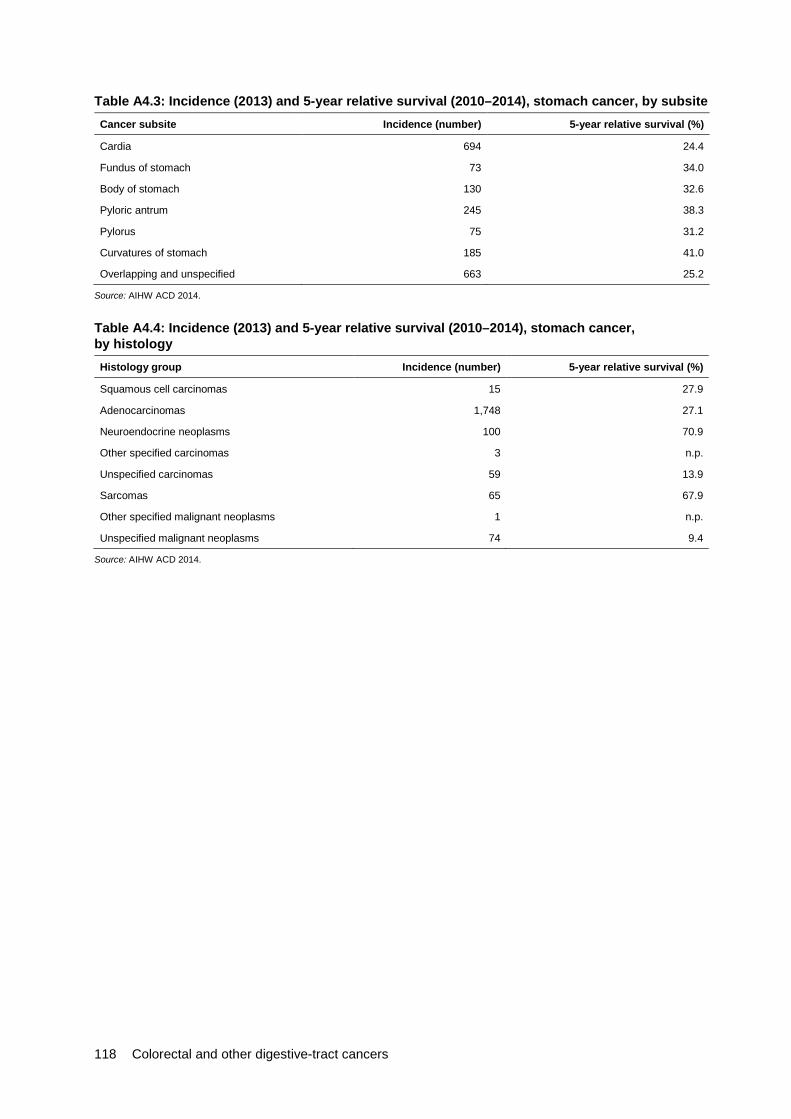
118 Colorectal and other digestive-tract cancers
Table A4.3: Incidence (2013) and 5-year relative survival (2010–2014), stomach cancer, by subsite Cancer subsite Incidence (number) 5-year relative survival (%)
Cardia 694 24.4
Fundus of stomach 73 34.0
Body of stomach 130 32.6
Pyloric antrum 245 38.3
Pylorus 75 31.2
Curvatures of stomach 185 41.0
Overlapping and unspecified 663 25.2
Source: AIHW ACD 2014.
Table A4.4: Incidence (2013) and 5-year relative survival (2010–2014), stomach cancer, by histology Histology group Incidence (number) 5-year relative survival (%)
Squamous cell carcinomas 15 27.9
Adenocarcinomas 1,748 27.1
Neuroendocrine neoplasms 100 70.9
Other specified carcinomas 3 n.p.
Unspecified carcinomas 59 13.9
Sarcomas 65 67.9
Other specified malignant neoplasms 1 n.p.
Unspecified malignant neoplasms 74 9.4
Source: AIHW ACD 2014.
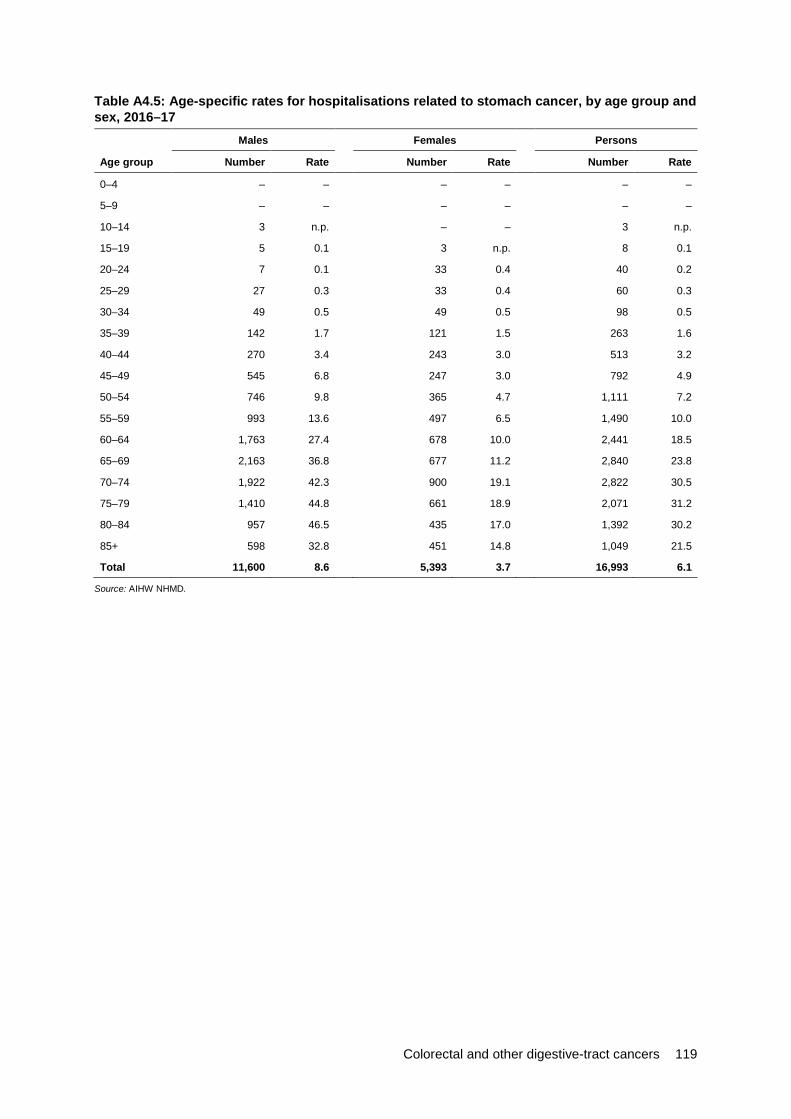
Colorectal and other digestive-tract cancers 119
Table A4.5: Age-specific rates for hospitalisations related to stomach cancer, by age group and sex, 2016–17
Males Females Persons
Age group Number Rate Number Rate Number Rate
0–4 – – – – – –
5–9 – – – – – –
10–14 3 n.p. – – 3 n.p.
15–19 5 0.1 3 n.p. 8 0.1
20–24 7 0.1 33 0.4 40 0.2
25–29 27 0.3 33 0.4 60 0.3
30–34 49 0.5 49 0.5 98 0.5
35–39 142 1.7 121 1.5 263 1.6
40–44 270 3.4 243 3.0 513 3.2
45–49 545 6.8 247 3.0 792 4.9
50–54 746 9.8 365 4.7 1,111 7.2
55–59 993 13.6 497 6.5 1,490 10.0
60–64 1,763 27.4 678 10.0 2,441 18.5
65–69 2,163 36.8 677 11.2 2,840 23.8
70–74 1,922 42.3 900 19.1 2,822 30.5
75–79 1,410 44.8 661 18.9 2,071 31.2
80–84 957 46.5 435 17.0 1,392 30.2
85+ 598 32.8 451 14.8 1,049 21.5
Total 11,600 8.6 5,393 3.7 16,993 6.1
Source: AIHW NHMD.

120 Colorectal and other digestive-tract cancers
Table A4.6: Age-standardised rates for all hospitalisations related to stomach cancer, by sex, 2001–02 to 2016–17
Males Females Persons
Financial year Number ASR Number ASR Number ASR
2001–02 8,791 9.7 4,432 4.3 13,223 6.8
2002–03 9,017 9.7 4,466 4.3 13,483 6.8
2003–04 10,176 10.7 4,429 4.1 14,605 7.2
2004–05 9,975 10.2 4,332 4.0 14,307 6.9
2005–06 10,104 10.1 4,683 4.2 14,787 7.0
2006–07 10,561 10.3 4,504 3.9 15,065 6.9
2007–08 10,901 10.3 5,098 4.4 15,999 7.2
2008–09 10,735 9.9 4,485 3.8 15,220 6.6
2009–10 11,253 10.1 4,300 3.5 15,553 6.6
2010–11 10,207 8.9 4,360 3.5 14,567 6.1
2011–12 9,811 8.3 4,344 3.4 14,155 5.7
2012–13 10,168 8.4 4,601 3.5 14,769 5.8
2013–14 10,925 8.7 4,840 3.6 15,765 6.0
2014–15 10,698 8.4 5,002 3.6 15,700 5.9
2015–16 10,902 8.3 4,849 3.5 15,752 5.8
2016–17 11,600 8.6 5,393 3.7 16,993 6.1
Source: AIHW NHMD.
Table A4.7: Five-year prevalence of stomach cancer, by age group and sex, as at end of 2013
Males Females Persons
Age group Number Rate Number Rate Number Rate Male-to-female ratio
0–14 – – – – – – –
15–24 5 0.3 8 0.5 13 0.4 0.6
25–34 19 1.1 22 1.3 41 1.2 0.9
35–44 70 4.4 74 4.6 144 4.5 1.0
45–54 231 15.1 142 9.1 373 12.1 1.7
55–64 593 45.3 251 18.6 844 31.8 2.4
65–74 894 95.5 404 42.1 1,298 68.5 2.3
75–84 691 145.0 380 66.9 1,071 102.6 2.2
85+ 210 131.6 156 54.5 366 82.1 2.4
Total 2,713 23.4 1,437 12.3 4,150 17.8 1.9
Source: AIHW ACD 2014.
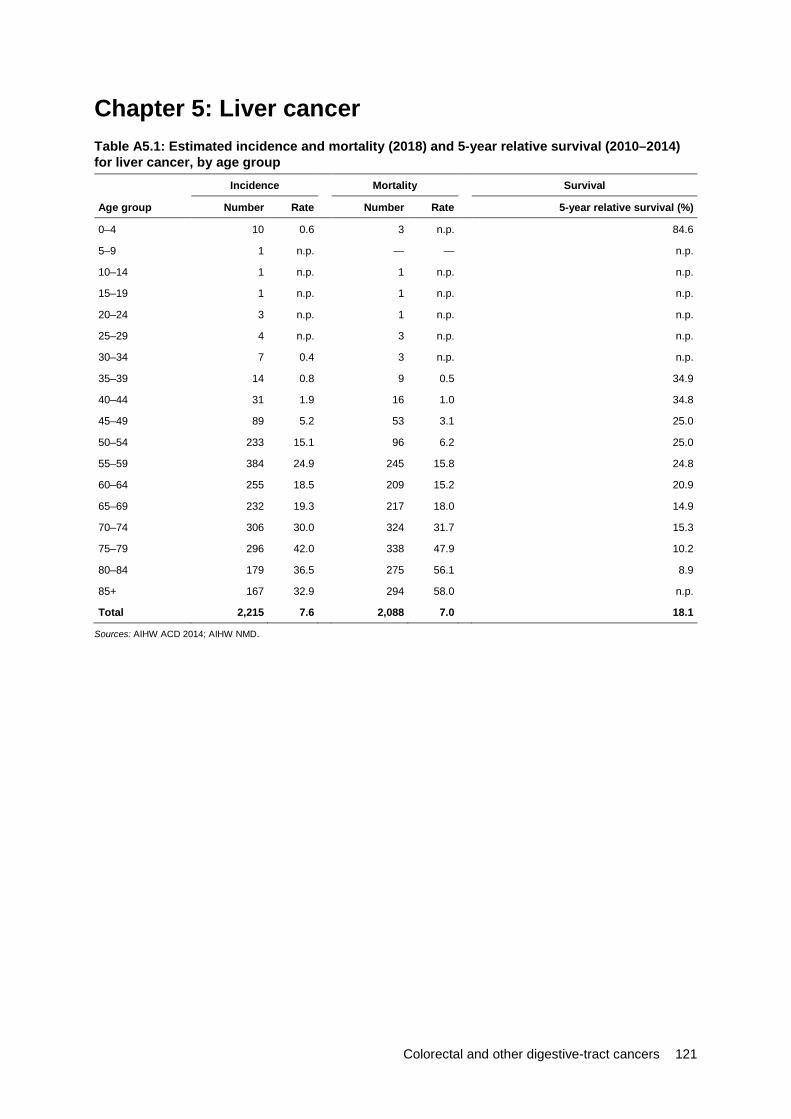
Colorectal and other digestive-tract cancers 121
Chapter 5: Liver cancer Table A5.1: Estimated incidence and mortality (2018) and 5-year relative survival (2010–2014) for liver cancer, by age group Incidence Mortality Survival
Age group Number Rate Number Rate 5-year relative survival (%)
0–4 10 0.6 3 n.p. 84.6
5–9 1 n.p. — — n.p.
10–14 1 n.p. 1 n.p. n.p.
15–19 1 n.p. 1 n.p. n.p.
20–24 3 n.p. 1 n.p. n.p.
25–29 4 n.p. 3 n.p. n.p.
30–34 7 0.4 3 n.p. n.p.
35–39 14 0.8 9 0.5 34.9
40–44 31 1.9 16 1.0 34.8
45–49 89 5.2 53 3.1 25.0
50–54 233 15.1 96 6.2 25.0
55–59 384 24.9 245 15.8 24.8
60–64 255 18.5 209 15.2 20.9
65–69 232 19.3 217 18.0 14.9
70–74 306 30.0 324 31.7 15.3
75–79 296 42.0 338 47.9 10.2
80–84 179 36.5 275 56.1 8.9
85+ 167 32.9 294 58.0 n.p.
Total 2,215 7.6 2,088 7.0 18.1
Sources: AIHW ACD 2014; AIHW NMD.
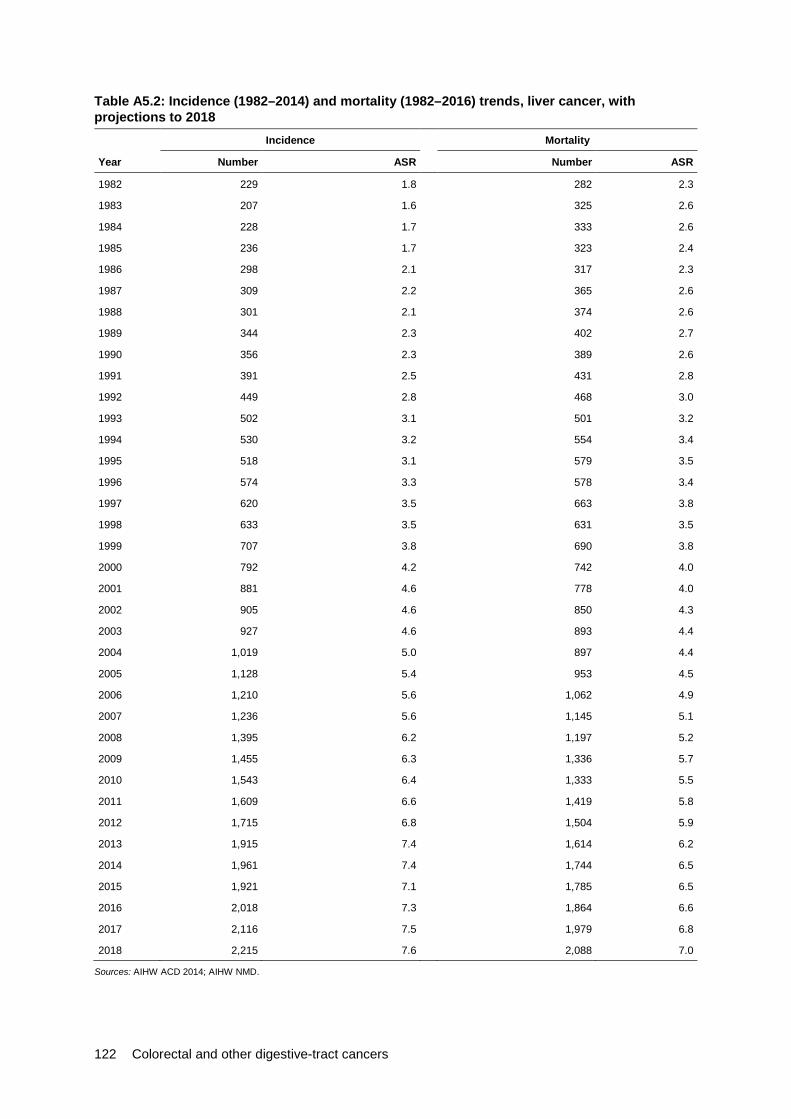
122 Colorectal and other digestive-tract cancers
Table A5.2: Incidence (1982–2014) and mortality (1982–2016) trends, liver cancer, with projections to 2018 Incidence Mortality
Year Number ASR Number ASR
1982 229 1.8 282 2.3
1983 207 1.6 325 2.6
1984 228 1.7 333 2.6
1985 236 1.7 323 2.4
1986 298 2.1 317 2.3
1987 309 2.2 365 2.6
1988 301 2.1 374 2.6
1989 344 2.3 402 2.7
1990 356 2.3 389 2.6
1991 391 2.5 431 2.8
1992 449 2.8 468 3.0
1993 502 3.1 501 3.2
1994 530 3.2 554 3.4
1995 518 3.1 579 3.5
1996 574 3.3 578 3.4
1997 620 3.5 663 3.8
1998 633 3.5 631 3.5
1999 707 3.8 690 3.8
2000 792 4.2 742 4.0
2001 881 4.6 778 4.0
2002 905 4.6 850 4.3
2003 927 4.6 893 4.4
2004 1,019 5.0 897 4.4
2005 1,128 5.4 953 4.5
2006 1,210 5.6 1,062 4.9
2007 1,236 5.6 1,145 5.1
2008 1,395 6.2 1,197 5.2
2009 1,455 6.3 1,336 5.7
2010 1,543 6.4 1,333 5.5
2011 1,609 6.6 1,419 5.8
2012 1,715 6.8 1,504 5.9
2013 1,915 7.4 1,614 6.2
2014 1,961 7.4 1,744 6.5
2015 1,921 7.1 1,785 6.5
2016 2,018 7.3 1,864 6.6
2017 2,116 7.5 1,979 6.8
2018 2,215 7.6 2,088 7.0
Sources: AIHW ACD 2014; AIHW NMD.
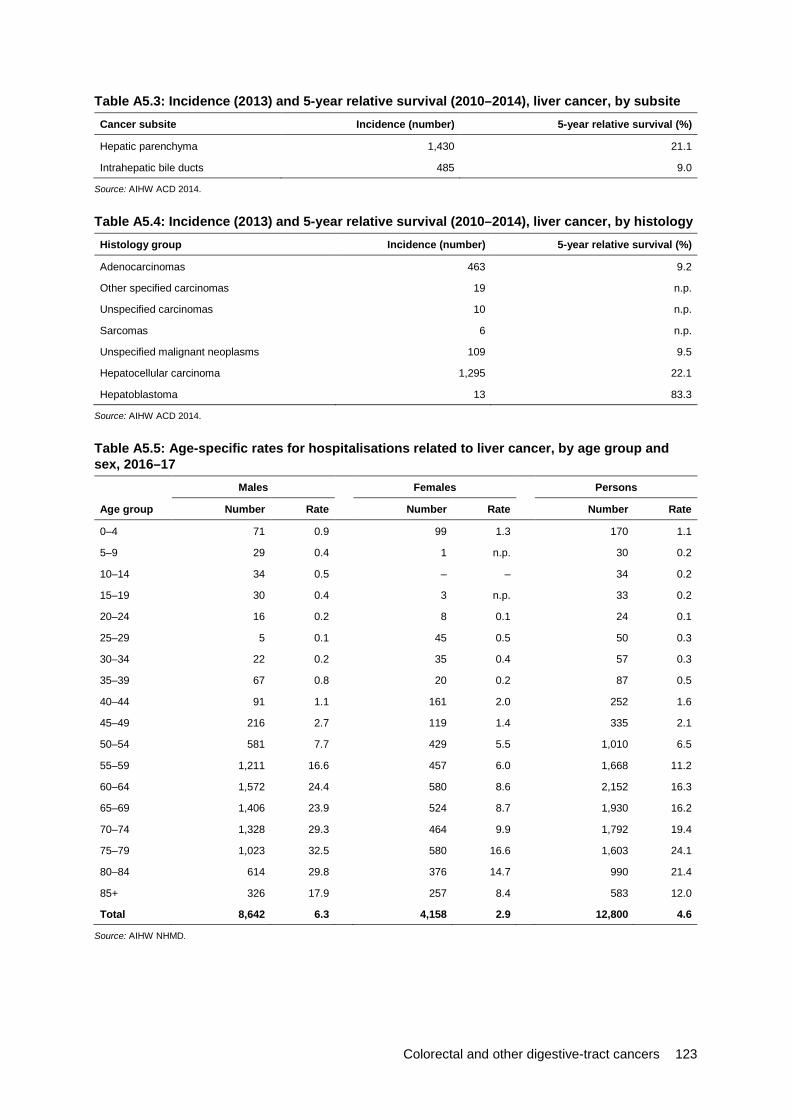
Colorectal and other digestive-tract cancers 123
Table A5.3: Incidence (2013) and 5-year relative survival (2010–2014), liver cancer, by subsite Cancer subsite Incidence (number) 5-year relative survival (%)
Hepatic parenchyma 1,430 21.1
Intrahepatic bile ducts 485 9.0
Source: AIHW ACD 2014.
Table A5.4: Incidence (2013) and 5-year relative survival (2010–2014), liver cancer, by histology Histology group Incidence (number) 5-year relative survival (%)
Adenocarcinomas 463 9.2
Other specified carcinomas 19 n.p.
Unspecified carcinomas 10 n.p.
Sarcomas 6 n.p.
Unspecified malignant neoplasms 109 9.5
Hepatocellular carcinoma 1,295 22.1
Hepatoblastoma 13 83.3
Source: AIHW ACD 2014.
Table A5.5: Age-specific rates for hospitalisations related to liver cancer, by age group and sex, 2016–17
Males Females Persons
Age group Number Rate Number Rate Number Rate
0–4 71 0.9 99 1.3 170 1.1
5–9 29 0.4 1 n.p. 30 0.2
10–14 34 0.5 – – 34 0.2
15–19 30 0.4 3 n.p. 33 0.2
20–24 16 0.2 8 0.1 24 0.1
25–29 5 0.1 45 0.5 50 0.3
30–34 22 0.2 35 0.4 57 0.3
35–39 67 0.8 20 0.2 87 0.5
40–44 91 1.1 161 2.0 252 1.6
45–49 216 2.7 119 1.4 335 2.1
50–54 581 7.7 429 5.5 1,010 6.5
55–59 1,211 16.6 457 6.0 1,668 11.2
60–64 1,572 24.4 580 8.6 2,152 16.3
65–69 1,406 23.9 524 8.7 1,930 16.2
70–74 1,328 29.3 464 9.9 1,792 19.4
75–79 1,023 32.5 580 16.6 1,603 24.1
80–84 614 29.8 376 14.7 990 21.4
85+ 326 17.9 257 8.4 583 12.0
Total 8,642 6.3 4,158 2.9 12,800 4.6
Source: AIHW NHMD.

124 Colorectal and other digestive-tract cancers
Table A5.6: Age-standardised rates for all hospitalisations related to liver cancer, by sex, 2001–02 to 2016–17
Males Females Persons
Financial year Number ASR Number ASR Number ASR
2001–02 2,871 3.1 1,257 1.2 4,128 2.1
2002–03 3,084 3.3 1,472 1.4 4,556 2.3
2003–04 3,421 3.6 1,908 1.8 5,329 2.6
2004–05 3,733 3.8 1,885 1.7 5,618 2.7
2005–06 4,371 4.4 2,132 1.9 6,503 3.1
2006–07 4,627 4.5 2,202 2.0 6,829 3.2
2007–08 4,864 4.6 2,407 2.1 7,271 3.3
2008–09 4,962 4.6 2,264 1.9 7,226 3.2
2009–10 5,139 4.6 2,550 2.1 7,689 3.3
2010–11 5,769 5.0 2,533 2.0 8,302 3.5
2011–12 5,724 4.8 3,006 2.4 8,730 3.5
2012–13 6,505 5.4 3,194 2.4 9,699 3.8
2013–14 6,915 5.5 3,451 2.6 10,366 4.0
2014–15 7,665 6.0 3,438 2.5 11,103 4.2
2015–16 8,437 6.4 3,742 2.7 12,183 4.4
2016–17 8,642 6.3 4,158 2.9 12,800 4.6
Source: AIHW NHMD.
Table A5.7: Five-year prevalence of liver cancer, by age group and sex, as at end of 2013
Age group
Males Females Persons
Number Rate Number Rate Number Rate Male-to-female ratio
0–14 35 1.5 20 0.9 55 1.2 1.7
15–24 4 n.p. 4 n.p. 8 0.3 n.p.
25–34 15 0.9 11 0.6 26 0.8 1.4
35–44 49 3.1 24 1.5 73 2.3 2.1
45–54 306 20.0 90 5.8 396 12.8 3.5
55–64 684 52.2 168 12.5 852 32.1 4.2
65–74 548 58.5 184 19.2 732 38.6 3.1
75–84 332 69.7 184 32.4 516 49.4 2.2
85+ 90 56.4 55 19.2 145 32.5 2.9
Total 2,063 17.8 740 6.3 2,803 12.0 2.8
Source: AIHW ACD 2014.
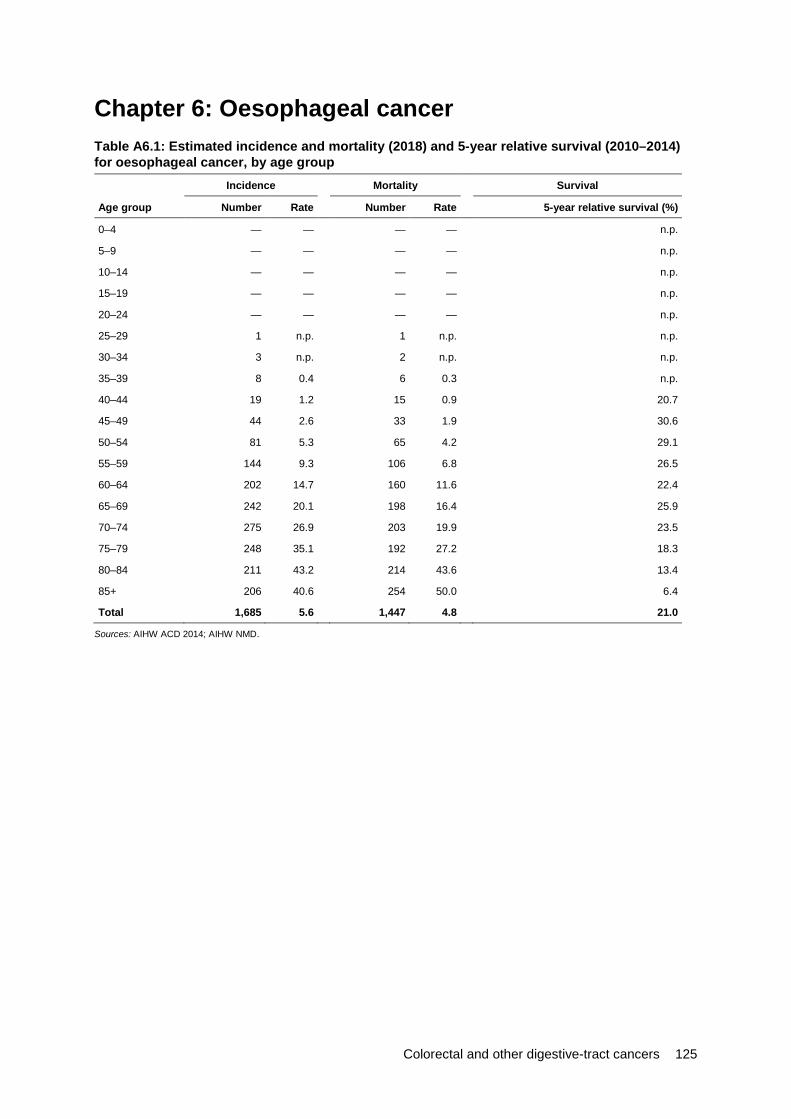
Colorectal and other digestive-tract cancers 125
Chapter 6: Oesophageal cancer Table A6.1: Estimated incidence and mortality (2018) and 5-year relative survival (2010–2014) for oesophageal cancer, by age group Incidence Mortality Survival
Age group Number Rate Number Rate 5-year relative survival (%)
0–4 — — — — n.p.
5–9 — — — — n.p.
10–14 — — — — n.p.
15–19 — — — — n.p.
20–24 — — — — n.p.
25–29 1 n.p. 1 n.p. n.p.
30–34 3 n.p. 2 n.p. n.p.
35–39 8 0.4 6 0.3 n.p.
40–44 19 1.2 15 0.9 20.7
45–49 44 2.6 33 1.9 30.6
50–54 81 5.3 65 4.2 29.1
55–59 144 9.3 106 6.8 26.5
60–64 202 14.7 160 11.6 22.4
65–69 242 20.1 198 16.4 25.9
70–74 275 26.9 203 19.9 23.5
75–79 248 35.1 192 27.2 18.3
80–84 211 43.2 214 43.6 13.4
85+ 206 40.6 254 50.0 6.4
Total 1,685 5.6 1,447 4.8 21.0
Sources: AIHW ACD 2014; AIHW NMD.

126 Colorectal and other digestive-tract cancers
Table A6.2: Incidence (1982–2014) and mortality (1982–2016) trends, oesophageal cancer, with projections to 2018 Incidence Mortality
Year Number ASR Number ASR
1982 537 4.4 527 4.4
1983 607 5.0 585 4.9
1984 668 5.2 616 4.9
1985 663 5.1 677 5.3
1986 641 4.8 618 4.7
1987 760 5.5 696 5.1
1988 840 6.0 786 5.7
1989 732 5.1 774 5.4
1990 802 5.4 725 4.9
1991 848 5.6 796 5.3
1992 860 5.6 813 5.3
1993 918 5.8 829 5.3
1994 956 5.9 875 5.5
1995 948 5.8 910 5.6
1996 989 5.9 930 5.5
1997 977 5.6 945 5.5
1998 1,005 5.7 976 5.5
1999 1,086 6.0 940 5.2
2000 1,082 5.8 971 5.2
2001 1,088 5.6 1,040 5.4
2002 1,088 5.5 1,005 5.1
2003 1,169 5.8 1,130 5.6
2004 1,225 5.9 1,088 5.3
2005 1,180 5.5 1,176 5.5
2006 1,242 5.7 1,156 5.3
2007 1,282 5.7 1,118 5.0
2008 1,316 5.7 1,207 5.2
2009 1,280 5.4 1,176 5.0
2010 1,423 5.9 1,196 4.9
2011 1,410 5.7 1,240 4.9
2012 1,405 5.5 1,218 4.7
2013 1,418 5.4 1,260 4.7
2014 1,457 5.4 1,198 4.4
2015 1,555 5.6 1,312 4.7
2016 1,598 5.6 1,338 4.7
2017 1,642 5.6 1,418 4.8
2018 1,685 5.6 1,447 4.8
Sources: AIHW ACD 2014; AIHW NMD.

Colorectal and other digestive-tract cancers 127
Table A6.3: Incidence (2013) and 5-year relative survival (2010–2014), oesophageal cancer, by subsite Cancer subsite Incidence (number) 5-year relative survival (%)
Cervical part of oesophagus 10 n.p.
Thoracic part of oesophagus 9 n.p.
Upper third of oesophagus 75 20.3
Middle third of oesophagus 166 19.1
Lower third of oesophagus 637 21.9
Overlapping and unspecified 521 20.7
Source: AIHW ACD 2014.
Table A6.4: Incidence (2013) and 5-year relative survival (2010–2014), oesophageal cancer, by histology Histology group Incidence (number) 5-year relative survival (%)
Squamous cell carcinomas 509 20.4
Adenocarcinomas 756 23.2
Neuroendocrine neoplasms 20 n.p.
Other specified carcinomas 12 n.p.
Unspecified carcinomas 57 8.6
Sarcomas 1 n.p.
Other specified malignant neoplasms 2 n.p.
Unspecified malignant neoplasms 61 11.9
Source: AIHW ACD 2014.

128 Colorectal and other digestive-tract cancers
Table A6.5: Age-specific rates for hospitalisations related to oesophageal cancer, by age group and sex, 2016–17
Males Females Persons
Age group Number Rate Number Rate Number Rate
0–4 – – – – – –
5–9 – – – – – –
10–14 – – – – – –
15–19 – – – – – –
20–24 – – 1 n.p. 1 n.p.
25–29 17 0.2 2 n.p. 19 0.1
30–34 39 0.4 8 0.1 47 0.3
35–39 41 0.5 7 0.1 48 0.3
40–44 188 2.3 6 0.1 194 1.2
45–49 289 3.6 73 0.9 362 2.2
50–54 586 7.7 156 2.0 742 4.8
55–59 947 12.9 266 3.5 1,213 8.1
60–64 1,657 25.7 371 5.5 2,028 15.4
65–69 1,991 33.9 487 8.0 2,478 20.8
70–74 1,927 42.4 614 13.0 2,541 27.5
75–79 1,132 35.9 465 13.3 1,597 24.0
80–84 612 29.7 253 9.9 865 18.7
85+ 417 22.8 311 10.2 728 14.9
Total 9,843 7.2 3,020 2.0 12,863 4.5
Source: AIHW NHMD.
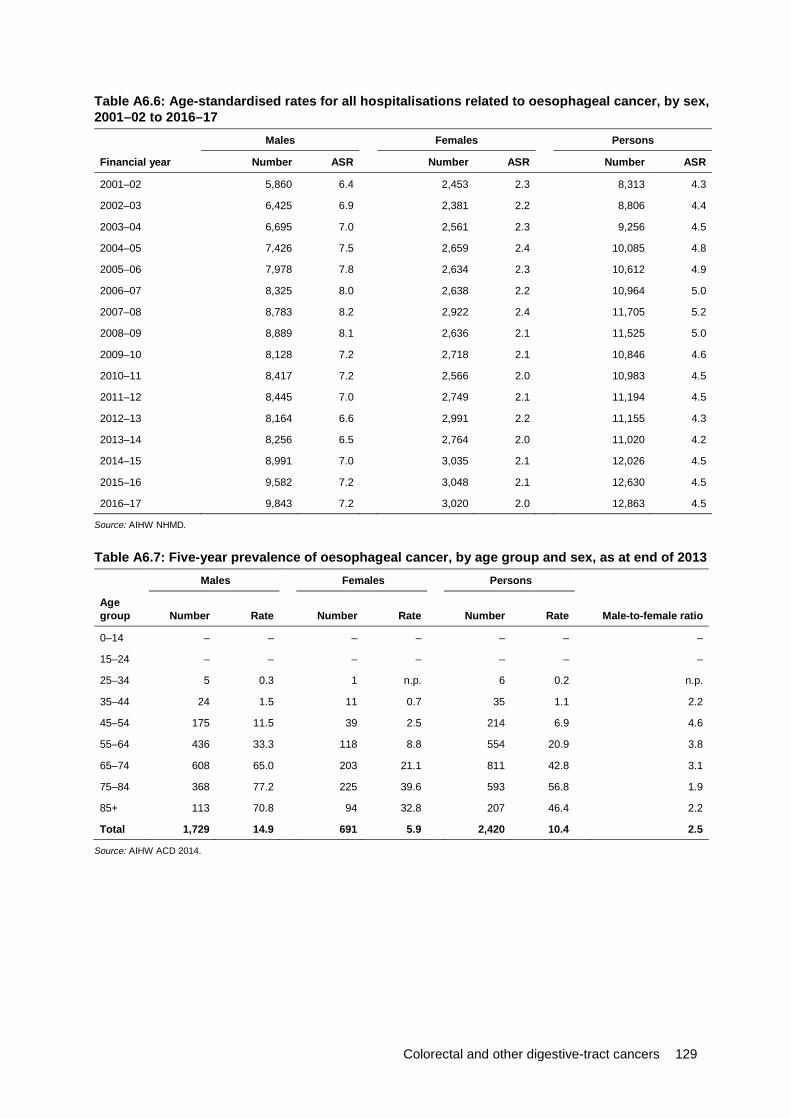
Colorectal and other digestive-tract cancers 129
Table A6.6: Age-standardised rates for all hospitalisations related to oesophageal cancer, by sex, 2001–02 to 2016–17
Males Females Persons
Financial year Number ASR Number ASR Number ASR
2001–02 5,860 6.4 2,453 2.3 8,313 4.3
2002–03 6,425 6.9 2,381 2.2 8,806 4.4
2003–04 6,695 7.0 2,561 2.3 9,256 4.5
2004–05 7,426 7.5 2,659 2.4 10,085 4.8
2005–06 7,978 7.8 2,634 2.3 10,612 4.9
2006–07 8,325 8.0 2,638 2.2 10,964 5.0
2007–08 8,783 8.2 2,922 2.4 11,705 5.2
2008–09 8,889 8.1 2,636 2.1 11,525 5.0
2009–10 8,128 7.2 2,718 2.1 10,846 4.6
2010–11 8,417 7.2 2,566 2.0 10,983 4.5
2011–12 8,445 7.0 2,749 2.1 11,194 4.5
2012–13 8,164 6.6 2,991 2.2 11,155 4.3
2013–14 8,256 6.5 2,764 2.0 11,020 4.2
2014–15 8,991 7.0 3,035 2.1 12,026 4.5
2015–16 9,582 7.2 3,048 2.1 12,630 4.5
2016–17 9,843 7.2 3,020 2.0 12,863 4.5
Source: AIHW NHMD.
Table A6.7: Five-year prevalence of oesophageal cancer, by age group and sex, as at end of 2013 Males Females Persons
Age group Number Rate Number Rate Number Rate Male-to-female ratio
0–14 – – – – – – –
15–24 – – – – – – –
25–34 5 0.3 1 n.p. 6 0.2 n.p.
35–44 24 1.5 11 0.7 35 1.1 2.2
45–54 175 11.5 39 2.5 214 6.9 4.6
55–64 436 33.3 118 8.8 554 20.9 3.8
65–74 608 65.0 203 21.1 811 42.8 3.1
75–84 368 77.2 225 39.6 593 56.8 1.9
85+ 113 70.8 94 32.8 207 46.4 2.2
Total 1,729 14.9 691 5.9 2,420 10.4 2.5
Source: AIHW ACD 2014.

130 Colorectal and other digestive-tract cancers
Chapter 7: Cancer of the gallbladder and extrahepatic bile ducts Table A7.1: Estimated incidence and mortality (2018) and 5-year relative survival (2010–2014) for gallbladder and extrahepatic bile duct cancers, by age group Incidence Mortality Survival
Age group Number Rate Number Rate 5-year relative survival (%)
0–4 — — — — n.p.
5–9 — — — — n.p.
10–14 — — — — n.p.
15–19 — — — — n.p.
20–24 — — — — n.p.
25–29 1 n.p. — — n.p.
30–34 2 n.p. — — n.p.
35–39 4 n.p. — — n.p.
40–44 8 0.5 — — n.p.
45–49 20 1.2 5 0.3 30.5
50–54 32 2.0 6 0.4 37.5
55–59 61 3.9 13 0.9 26.8
60–64 88 6.4 18 1.3 30.0
65–69 121 10.1 25 2.1 19.9
70–74 170 16.6 32 3.1 20.5
75–79 145 20.5 45 6.4 16.4
80–84 125 25.6 48 9.9 13.4
85+ 155 30.5 68 13.5 8.5
Total 931 3.1 262 0.9 19.7
Sources: AIHW ACD 2014; AIHW NMD.
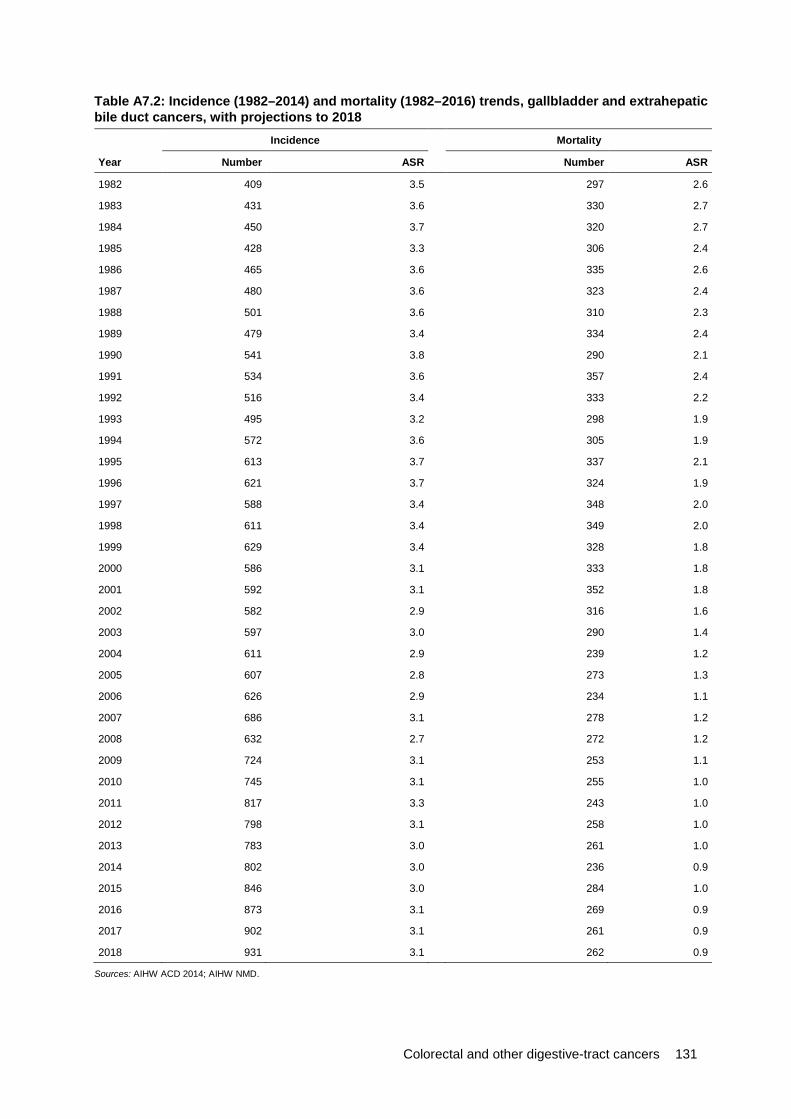
Colorectal and other digestive-tract cancers 131
Table A7.2: Incidence (1982–2014) and mortality (1982–2016) trends, gallbladder and extrahepatic bile duct cancers, with projections to 2018 Incidence Mortality
Year Number ASR Number ASR
1982 409 3.5 297 2.6
1983 431 3.6 330 2.7
1984 450 3.7 320 2.7
1985 428 3.3 306 2.4
1986 465 3.6 335 2.6
1987 480 3.6 323 2.4
1988 501 3.6 310 2.3
1989 479 3.4 334 2.4
1990 541 3.8 290 2.1
1991 534 3.6 357 2.4
1992 516 3.4 333 2.2
1993 495 3.2 298 1.9
1994 572 3.6 305 1.9
1995 613 3.7 337 2.1
1996 621 3.7 324 1.9
1997 588 3.4 348 2.0
1998 611 3.4 349 2.0
1999 629 3.4 328 1.8
2000 586 3.1 333 1.8
2001 592 3.1 352 1.8
2002 582 2.9 316 1.6
2003 597 3.0 290 1.4
2004 611 2.9 239 1.2
2005 607 2.8 273 1.3
2006 626 2.9 234 1.1
2007 686 3.1 278 1.2
2008 632 2.7 272 1.2
2009 724 3.1 253 1.1
2010 745 3.1 255 1.0
2011 817 3.3 243 1.0
2012 798 3.1 258 1.0
2013 783 3.0 261 1.0
2014 802 3.0 236 0.9
2015 846 3.0 284 1.0
2016 873 3.1 269 0.9
2017 902 3.1 261 0.9
2018 931 3.1 262 0.9
Sources: AIHW ACD 2014; AIHW NMD.

132 Colorectal and other digestive-tract cancers
Table A7.3: Incidence (2013) and 5-year relative survival (2010–2014), gallbladder and extrahepatic bile duct cancers, by subsite Cancer subsite Incidence (number) 5-year relative survival (%)
Gallbladder 335 17.6
Extrahepatic bile duct 226 13.0
Ampulla of Vater 164 38.1
Biliary tract, overlapping and unspecified 58 n.p.
Source: AIHW ACD 2014.
Table A7.4: Incidence (2013) and 5-year relative survival (2010–2014), gallbladder and extrahepatic bile duct cancers, by histology Histology group Incidence (number) 5-year relative survival (%)
Squamous cell carcinomas 2 n.p.
Adenocarcinomas 641 20.7
Neuroendocrine neoplasms 20 45.8
Other specified carcinomas 5 n.p.
Unspecified carcinomas 49 11.0
Other specified malignant neoplasms 2 n.p.
Unspecified malignant neoplasms 64 7.4
Source: AIHW ACD 2014.
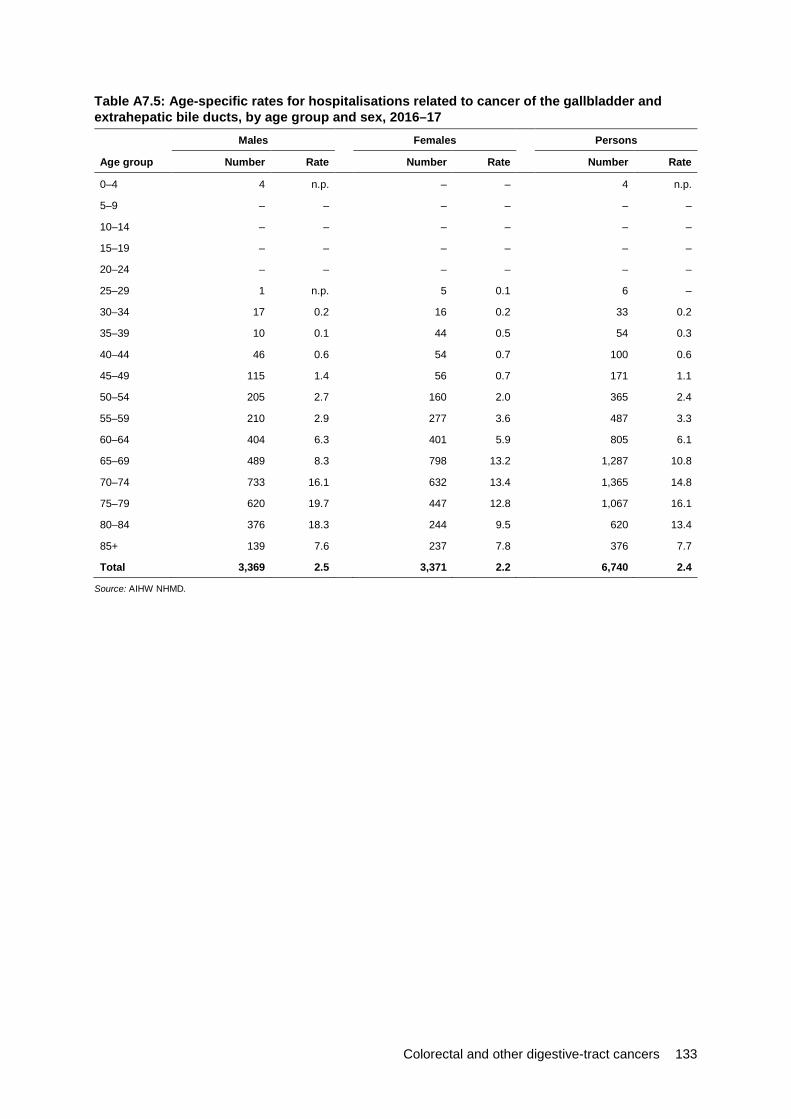
Colorectal and other digestive-tract cancers 133
Table A7.5: Age-specific rates for hospitalisations related to cancer of the gallbladder and extrahepatic bile ducts, by age group and sex, 2016–17
Males Females Persons
Age group Number Rate Number Rate Number Rate
0–4 4 n.p. – – 4 n.p.
5–9 – – – – – –
10–14 – – – – – –
15–19 – – – – – –
20–24 – – – – – –
25–29 1 n.p. 5 0.1 6 –
30–34 17 0.2 16 0.2 33 0.2
35–39 10 0.1 44 0.5 54 0.3
40–44 46 0.6 54 0.7 100 0.6
45–49 115 1.4 56 0.7 171 1.1
50–54 205 2.7 160 2.0 365 2.4
55–59 210 2.9 277 3.6 487 3.3
60–64 404 6.3 401 5.9 805 6.1
65–69 489 8.3 798 13.2 1,287 10.8
70–74 733 16.1 632 13.4 1,365 14.8
75–79 620 19.7 447 12.8 1,067 16.1
80–84 376 18.3 244 9.5 620 13.4
85+ 139 7.6 237 7.8 376 7.7
Total 3,369 2.5 3,371 2.2 6,740 2.4
Source: AIHW NHMD.

134 Colorectal and other digestive-tract cancers
Table A7.6: Age-standardised rates for all hospitalisations related to cancer of the gallbladder and extrahepatic bile ducts, by sex, 2001–02 to 2016–17
Males Females Persons
Financial year Number ASR Number ASR Number ASR
2001–02 1,244 1.4 1,649 1.6 2,893 1.5
2002–03 1,210 1.3 1,485 1.4 2,695 1.3
2003–04 1,389 1.5 1,520 1.4 2,909 1.4
2004–05 1,376 1.5 1,689 1.5 3,065 1.5
2005–06 1,526 1.5 1,642 1.5 3,168 1.5
2006–07 1,708 1.7 2,231 2.0 3,939 1.8
2007–08 2,027 1.9 2,205 1.9 4,232 1.9
2008–09 1,654 1.5 1,942 1.6 3,596 1.6
2009–10 2,000 1.8 1,826 1.5 3,826 1.6
2010–11 2,053 1.8 2,169 1.7 4,222 1.7
2011–12 2,294 2.0 2,530 1.9 4,824 1.9
2012–13 2,461 2.0 2,294 1.7 4,755 1.8
2013–14 2,565 2.1 2,401 1.7 4,966 1.9
2014–15 3,220 2.5 3,138 2.2 6,358 2.4
2015–16 3,109 2.4 3,613 2.5 6,722 2.4
2016–17 3,369 2.5 3,371 2.2 6,740 2.4
Source: AIHW NHMD.
Table A7.7: Five-year prevalence of cancer of the gallbladder and extrahepatic bile ducts, by age group and sex, as at end of 2013
Age group
Males Females Persons
Number Rate Number Rate Number Rate Male-to-female ratio
0–14 2 n.p. – – 2 n.p. –
15–24 – – 1 n.p. 1 n.p. –
25–34 1 n.p. 2 n.p. 3 n.p. n.p.
35–44 16 1.0 13 0.8 29 0.9 1.2
45–54 49 3.2 46 2.9 95 3.1 1.1
55–64 125 9.5 110 8.2 235 8.8 1.2
65–74 224 23.9 206 21.5 430 22.7 1.1
75–84 176 36.9 192 33.8 368 35.2 1.1
85+ 72 45.1 94 32.8 166 37.2 1.4
Total 665 5.7 664 5.7 1,329 5.7 1.0
Source: AIHW ACD 2014.
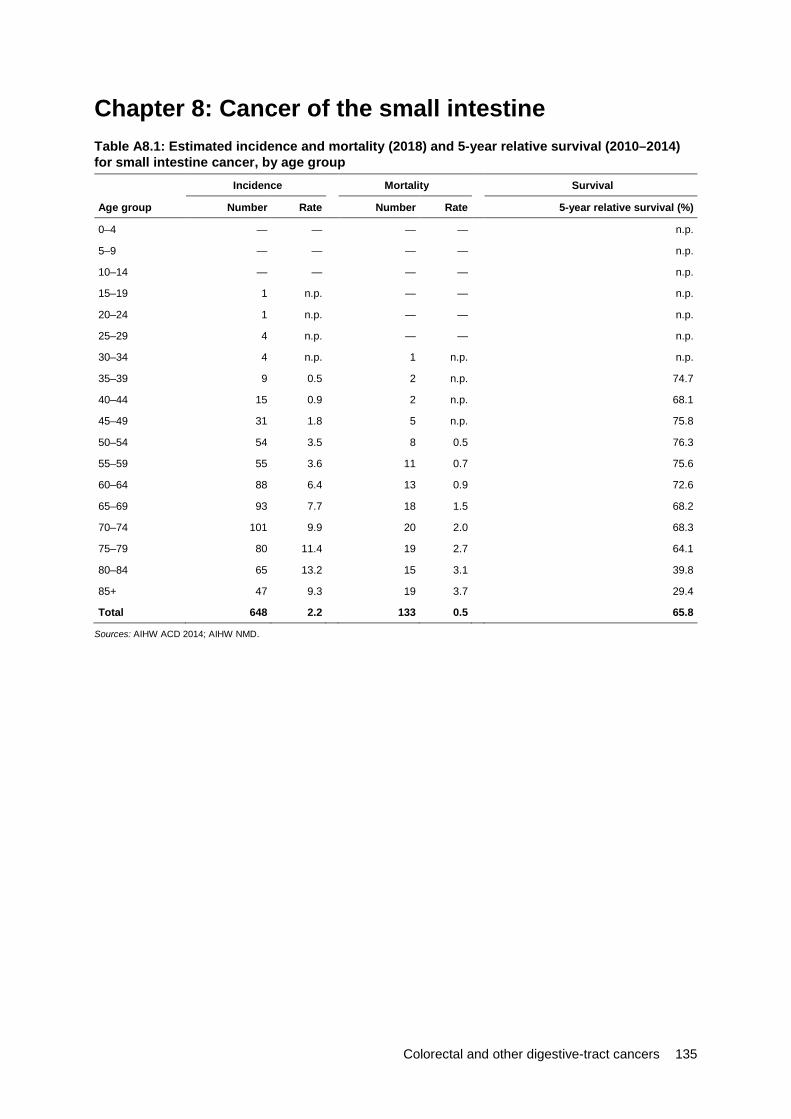
Colorectal and other digestive-tract cancers 135
Chapter 8: Cancer of the small intestine Table A8.1: Estimated incidence and mortality (2018) and 5-year relative survival (2010–2014) for small intestine cancer, by age group Incidence Mortality Survival
Age group Number Rate Number Rate 5-year relative survival (%)
0–4 — — — — n.p.
5–9 — — — — n.p.
10–14 — — — — n.p.
15–19 1 n.p. — — n.p.
20–24 1 n.p. — — n.p.
25–29 4 n.p. — — n.p.
30–34 4 n.p. 1 n.p. n.p.
35–39 9 0.5 2 n.p. 74.7
40–44 15 0.9 2 n.p. 68.1
45–49 31 1.8 5 n.p. 75.8
50–54 54 3.5 8 0.5 76.3
55–59 55 3.6 11 0.7 75.6
60–64 88 6.4 13 0.9 72.6
65–69 93 7.7 18 1.5 68.2
70–74 101 9.9 20 2.0 68.3
75–79 80 11.4 19 2.7 64.1
80–84 65 13.2 15 3.1 39.8
85+ 47 9.3 19 3.7 29.4
Total 648 2.2 133 0.5 65.8
Sources: AIHW ACD 2014; AIHW NMD.

136 Colorectal and other digestive-tract cancers
Table A8.2: Incidence (1982–2014) and mortality (1982–2016) trends, small intestine cancer, with projections to 2018 Incidence Mortality
Year Number ASR Number ASR
1982 91 0.7 44 0.4
1983 93 0.7 52 0.4
1984 102 0.8 51 0.4
1985 111 0.8 47 0.4
1986 122 0.9 54 0.4
1987 134 1.0 72 0.5
1988 137 1.0 61 0.4
1989 147 1.0 62 0.4
1990 137 0.9 65 0.5
1991 182 1.2 72 0.5
1992 160 1.0 71 0.5
1993 155 1.0 61 0.4
1994 183 1.1 86 0.5
1995 193 1.1 79 0.5
1996 207 1.2 70 0.4
1997 208 1.2 70 0.4
1998 262 1.5 88 0.5
1999 254 1.4 99 0.5
2000 267 1.4 93 0.5
2001 284 1.5 101 0.5
2002 304 1.5 99 0.5
2003 353 1.8 89 0.4
2004 300 1.5 66 0.3
2005 372 1.8 82 0.4
2006 368 1.7 92 0.4
2007 408 1.9 103 0.5
2008 402 1.8 100 0.4
2009 432 1.9 91 0.4
2010 502 2.1 102 0.4
2011 472 1.9 95 0.4
2012 556 2.2 131 0.5
2013 565 2.2 107 0.4
2014 538 2.0 94 0.3
2015 568 2.1 101 0.4
2016 594 2.2 120 0.4
2017 621 2.2 129 0.4
2018 648 2.2 133 0.4
Sources: AIHW ACD 2014; AIHW NMD.
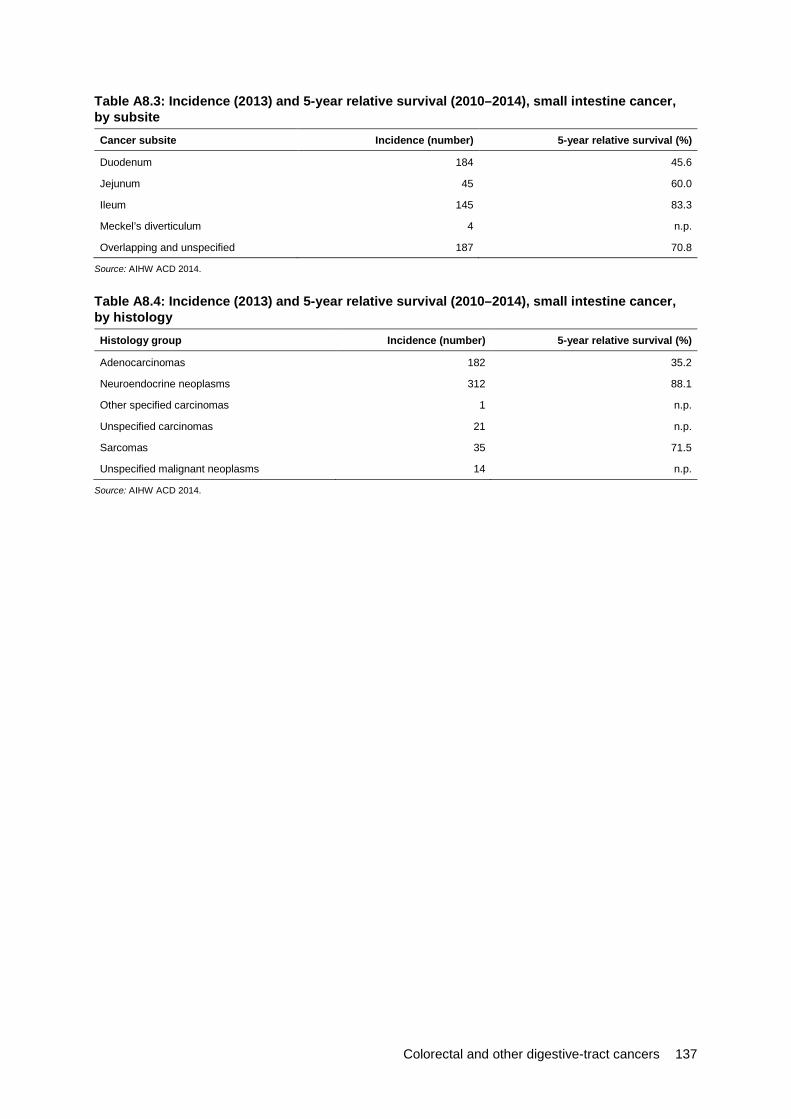
Colorectal and other digestive-tract cancers 137
Table A8.3: Incidence (2013) and 5-year relative survival (2010–2014), small intestine cancer, by subsite Cancer subsite Incidence (number) 5-year relative survival (%)
Duodenum 184 45.6
Jejunum 45 60.0
Ileum 145 83.3
Meckel’s diverticulum 4 n.p.
Overlapping and unspecified 187 70.8
Source: AIHW ACD 2014.
Table A8.4: Incidence (2013) and 5-year relative survival (2010–2014), small intestine cancer, by histology Histology group Incidence (number) 5-year relative survival (%)
Adenocarcinomas 182 35.2
Neuroendocrine neoplasms 312 88.1
Other specified carcinomas 1 n.p.
Unspecified carcinomas 21 n.p.
Sarcomas 35 71.5
Unspecified malignant neoplasms 14 n.p.
Source: AIHW ACD 2014.

138 Colorectal and other digestive-tract cancers
Table A8.5: Age-specific rates for hospitalisations related to cancer of the small intestine, by age group and sex, 2016–17
Males Females Persons
Age group Number Rate Number Rate Number Rate
0–4 1 n.p. – – 1 n.p.
5–9 – – – – – –
10–14 – – – – – –
15–19 – – – – – –
20–24 – – 8 0.1 8 –
25–29 3 n.p. 4 n.p. 7 –
30–34 13 0.1 34 0.4 47 0.3
35–39 29 0.4 17 0.2 46 0.3
40–44 60 0.7 43 0.5 103 0.6
45–49 114 1.4 140 1.7 254 1.6
50–54 174 2.3 183 2.3 357 2.3
55–59 358 4.9 218 2.9 576 3.9
60–64 472 7.3 301 4.5 773 5.9
65–69 458 7.8 298 4.9 756 6.3
70–74 397 8.7 362 7.7 759 8.2
75–79 360 11.4 182 5.2 542 8.2
80–84 179 8.7 150 5.9 329 7.1
85+ 95 5.2 104 3.4 199 4.1
Total 2,713 2.0 2,044 1.4 4,757 1.7
Source: AIHW NHMD.
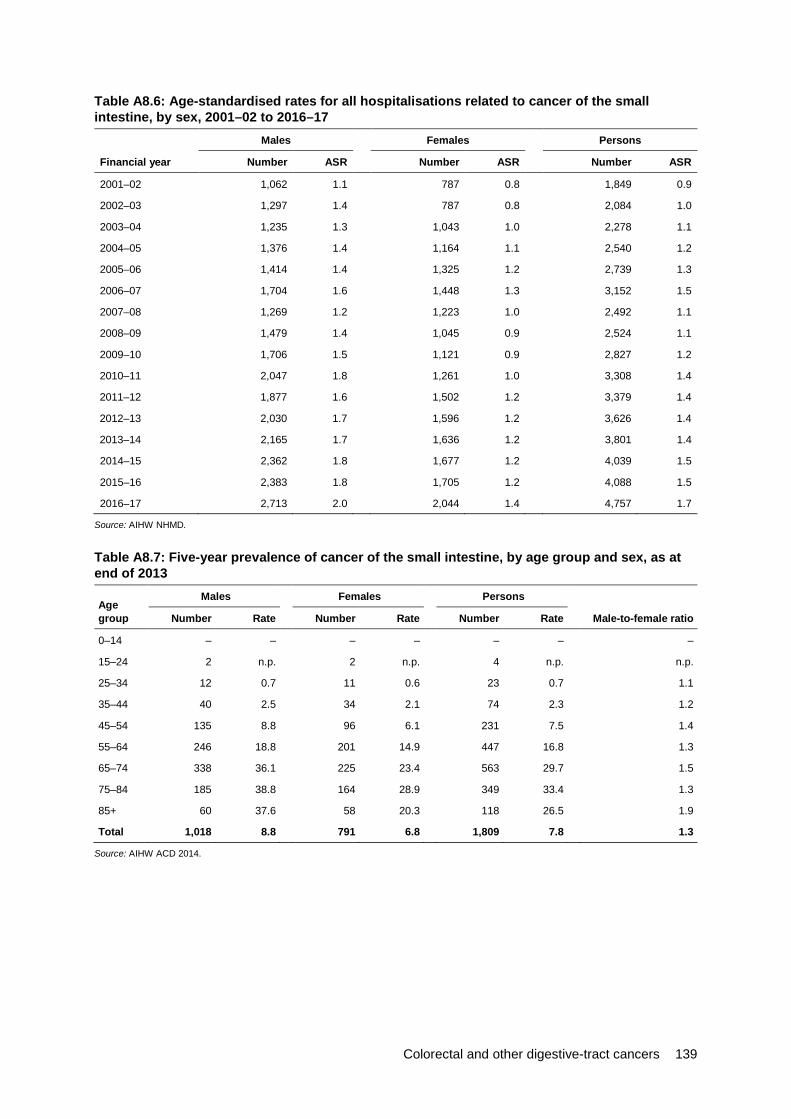
Colorectal and other digestive-tract cancers 139
Table A8.6: Age-standardised rates for all hospitalisations related to cancer of the small intestine, by sex, 2001–02 to 2016–17
Males Females Persons
Financial year Number ASR Number ASR Number ASR
2001–02 1,062 1.1 787 0.8 1,849 0.9
2002–03 1,297 1.4 787 0.8 2,084 1.0
2003–04 1,235 1.3 1,043 1.0 2,278 1.1
2004–05 1,376 1.4 1,164 1.1 2,540 1.2
2005–06 1,414 1.4 1,325 1.2 2,739 1.3
2006–07 1,704 1.6 1,448 1.3 3,152 1.5
2007–08 1,269 1.2 1,223 1.0 2,492 1.1
2008–09 1,479 1.4 1,045 0.9 2,524 1.1
2009–10 1,706 1.5 1,121 0.9 2,827 1.2
2010–11 2,047 1.8 1,261 1.0 3,308 1.4
2011–12 1,877 1.6 1,502 1.2 3,379 1.4
2012–13 2,030 1.7 1,596 1.2 3,626 1.4
2013–14 2,165 1.7 1,636 1.2 3,801 1.4
2014–15 2,362 1.8 1,677 1.2 4,039 1.5
2015–16 2,383 1.8 1,705 1.2 4,088 1.5
2016–17 2,713 2.0 2,044 1.4 4,757 1.7
Source: AIHW NHMD.
Table A8.7: Five-year prevalence of cancer of the small intestine, by age group and sex, as at end of 2013
Age group
Males Females Persons
Number Rate Number Rate Number Rate Male-to-female ratio
0–14 – – – – – – –
15–24 2 n.p. 2 n.p. 4 n.p. n.p.
25–34 12 0.7 11 0.6 23 0.7 1.1
35–44 40 2.5 34 2.1 74 2.3 1.2
45–54 135 8.8 96 6.1 231 7.5 1.4
55–64 246 18.8 201 14.9 447 16.8 1.3
65–74 338 36.1 225 23.4 563 29.7 1.5
75–84 185 38.8 164 28.9 349 33.4 1.3
85+ 60 37.6 58 20.3 118 26.5 1.9
Total 1,018 8.8 791 6.8 1,809 7.8 1.3
Source: AIHW ACD 2014.

140 Colorectal and other digestive-tract cancers
Chapter 9: Anal cancer Table A9.1: Estimated incidence and mortality (2018) and 5-year relative survival (2010–2014) for anal cancer, by age group Incidence Mortality Survival
Age group Number Rate Number Rate 5-year relative survival (%)
0–4 — — — — n.p.
5–9 — — — — n.p.
10–14 — — — — n.p.
15–19 — — — — n.p.
20–24 1 n.p. — — n.p.
25–29 1 n.p. — — n.p.
30–34 3 n.p. — — n.p.
35–39 7 0.4 1 n.p. 85.8
40–44 16 1.0 2 n.p. 77.0
45–49 33 1.9 2 n.p. 76.8
50–54 46 3.0 9 0.6 68.6
55–59 50 3.2 8 0.5 72.4
60–64 56 4.0 10 0.7 71.5
65–69 57 4.8 15 1.2 62.3
70–74 53 5.2 11 1.1 70.6
75–79 49 6.9 11 1.6 64.9
80–84 33 6.7 7 1.5 51.4
85+ 35 7.0 12 2.5 46.9
Total 440 1.5 90 0.3 67.4
Sources: AIHW ACD 2014; AIHW NMD.

Colorectal and other digestive-tract cancers 141
Table A9.2: Incidence (1982–2014) and mortality (1982–2016) trends, anal cancer, with projections to 2018 Incidence Mortality
Year Number ASR Number ASR
1982 96 0.8 29 0.3
1983 97 0.8 34 0.3
1984 120 0.9 22 0.2
1985 142 1.1 30 0.2
1986 120 0.9 22 0.2
1987 124 0.9 33 0.2
1988 151 1.1 32 0.2
1989 133 0.9 26 0.2
1990 171 1.2 34 0.2
1991 161 1.1 34 0.2
1992 176 1.2 39 0.3
1993 166 1.0 29 0.2
1994 185 1.1 41 0.3
1995 195 1.2 40 0.2
1996 210 1.3 46 0.3
1997 185 1.1 41 0.2
1998 226 1.3 44 0.2
1999 253 1.4 48 0.3
2000 229 1.2 59 0.3
2001 238 1.2 68 0.4
2002 250 1.3 64 0.3
2003 258 1.3 57 0.3
2004 263 1.3 54 0.3
2005 334 1.6 54 0.3
2006 299 1.4 56 0.3
2007 302 1.4 63 0.3
2008 318 1.4 59 0.3
2009 363 1.6 62 0.3
2010 371 1.5 76 0.3
2011 374 1.5 90 0.4
2012 437 1.7 68 0.3
2013 410 1.6 74 0.3
2014 435 1.6 98 0.4
2015 406 1.5 87 0.3
2016 418 1.5 87 0.3
2017 429 1.5 87 0.3
2018 440 1.5 90 0.3
Sources: AIHW ACD 2014; AIHW NMD.

142 Colorectal and other digestive-tract cancers
Table A9.3: Incidence (2013) and 5-year relative survival (2010–2014), anal cancer, by subsite Cancer subsite Incidence (number) 5-year relative survival (%)
Anus, unspecified 111 68.2
Anal canal 151 71.9
Cloacogenic zone 1 n.p.
Overlapping lesions 147 61.9
Source: AIHW ACD 2014.
Table A9.4: Incidence (2013) and 5-year relative survival (2010–2014), anal cancer, by histology Histology group Incidence (number) 5-year relative survival (%)
Squamous cell carcinomas 318 73.2
Adenocarcinomas 71 51.0
Neuroendocrine neoplasms 3 n.p.
Other specified carcinomas 1 n.p.
Unspecified carcinomas 3 n.p.
Other specified malignant neoplasms 9 n.p.
Unspecified malignant neoplasms 5 n.p.
Source: AIHW ACD 2014.
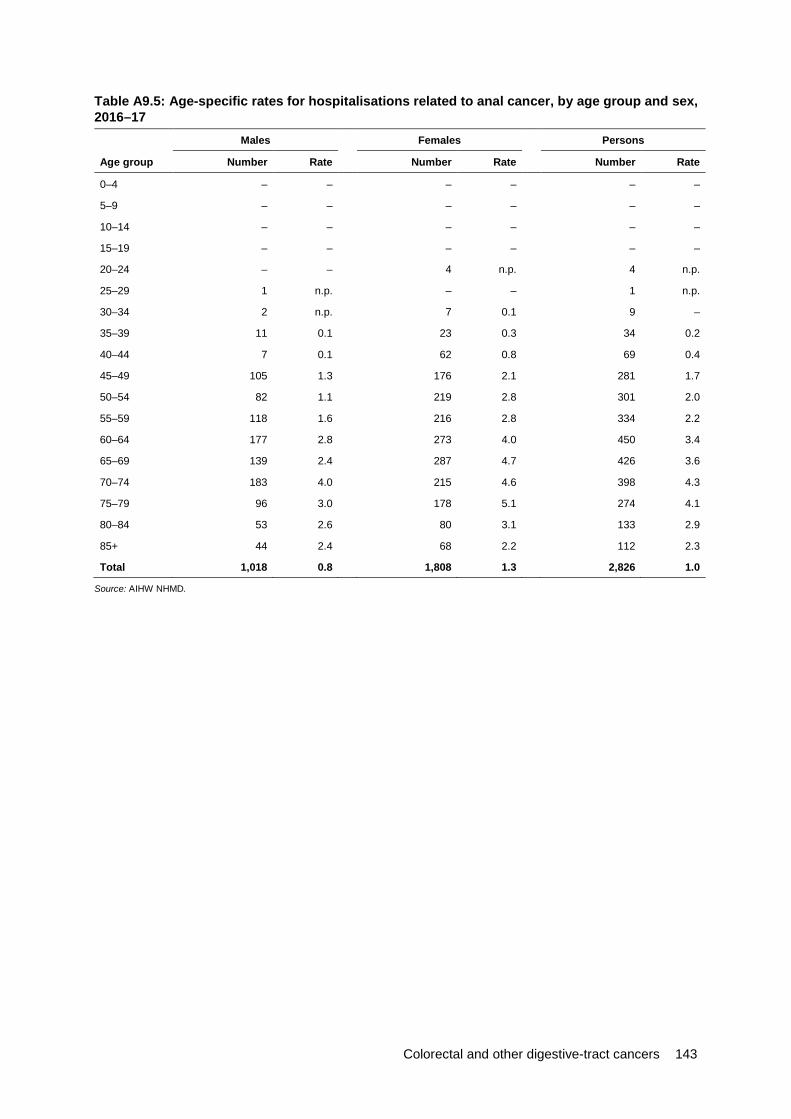
Colorectal and other digestive-tract cancers 143
Table A9.5: Age-specific rates for hospitalisations related to anal cancer, by age group and sex, 2016–17
Males Females Persons
Age group Number Rate Number Rate Number Rate
0–4 – – – – – –
5–9 – – – – – –
10–14 – – – – – –
15–19 – – – – – –
20–24 – – 4 n.p. 4 n.p.
25–29 1 n.p. – – 1 n.p.
30–34 2 n.p. 7 0.1 9 –
35–39 11 0.1 23 0.3 34 0.2
40–44 7 0.1 62 0.8 69 0.4
45–49 105 1.3 176 2.1 281 1.7
50–54 82 1.1 219 2.8 301 2.0
55–59 118 1.6 216 2.8 334 2.2
60–64 177 2.8 273 4.0 450 3.4
65–69 139 2.4 287 4.7 426 3.6
70–74 183 4.0 215 4.6 398 4.3
75–79 96 3.0 178 5.1 274 4.1
80–84 53 2.6 80 3.1 133 2.9
85+ 44 2.4 68 2.2 112 2.3
Total 1,018 0.8 1,808 1.3 2,826 1.0
Source: AIHW NHMD.
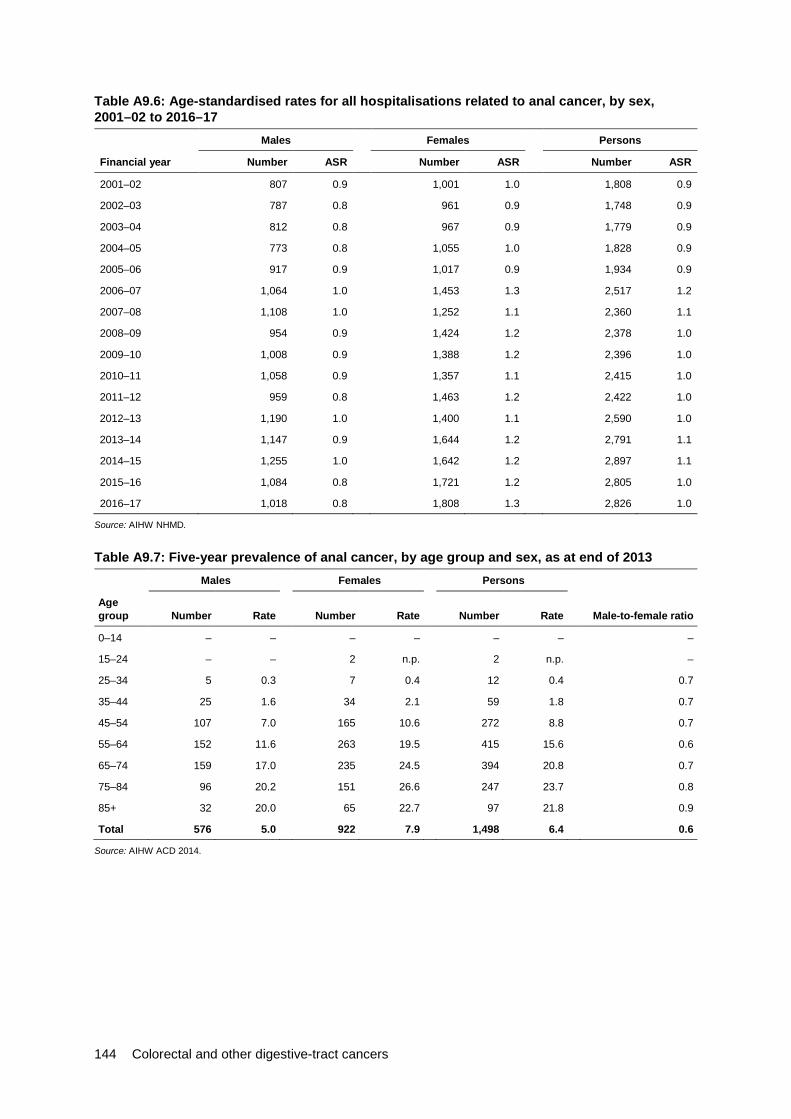
144 Colorectal and other digestive-tract cancers
Table A9.6: Age-standardised rates for all hospitalisations related to anal cancer, by sex, 2001–02 to 2016–17
Males Females Persons
Financial year Number ASR Number ASR Number ASR
2001–02 807 0.9 1,001 1.0 1,808 0.9
2002–03 787 0.8 961 0.9 1,748 0.9
2003–04 812 0.8 967 0.9 1,779 0.9
2004–05 773 0.8 1,055 1.0 1,828 0.9
2005–06 917 0.9 1,017 0.9 1,934 0.9
2006–07 1,064 1.0 1,453 1.3 2,517 1.2
2007–08 1,108 1.0 1,252 1.1 2,360 1.1
2008–09 954 0.9 1,424 1.2 2,378 1.0
2009–10 1,008 0.9 1,388 1.2 2,396 1.0
2010–11 1,058 0.9 1,357 1.1 2,415 1.0
2011–12 959 0.8 1,463 1.2 2,422 1.0
2012–13 1,190 1.0 1,400 1.1 2,590 1.0
2013–14 1,147 0.9 1,644 1.2 2,791 1.1
2014–15 1,255 1.0 1,642 1.2 2,897 1.1
2015–16 1,084 0.8 1,721 1.2 2,805 1.0
2016–17 1,018 0.8 1,808 1.3 2,826 1.0
Source: AIHW NHMD.
Table A9.7: Five-year prevalence of anal cancer, by age group and sex, as at end of 2013 Males Females Persons
Age group Number Rate Number Rate Number Rate Male-to-female ratio
0–14 – – – – – – –
15–24 – – 2 n.p. 2 n.p. –
25–34 5 0.3 7 0.4 12 0.4 0.7
35–44 25 1.6 34 2.1 59 1.8 0.7
45–54 107 7.0 165 10.6 272 8.8 0.7
55–64 152 11.6 263 19.5 415 15.6 0.6
65–74 159 17.0 235 24.5 394 20.8 0.7
75–84 96 20.2 151 26.6 247 23.7 0.8
85+ 32 20.0 65 22.7 97 21.8 0.9
Total 576 5.0 922 7.9 1,498 6.4 0.6
Source: AIHW ACD 2014.

Colorectal and other digestive-tract cancers 145
Chapter 10: Cancer of unspecified digestive organs Table A10.1: Incidence (1982–2014) and mortality (1982–2016) trends, cancer of unspecified digestive organs, with projections to 2018 Incidence Mortality
Year Number ASR Number ASR
1982 80 0.7 113 1.1 1983 95 0.8 136 1.2 1984 88 0.8 158 1.3 1985 111 0.9 186 1.5 1986 103 0.8 208 1.7 1987 120 1.0 228 1.8 1988 136 1.0 213 1.6 1989 118 0.9 250 1.8 1990 101 0.7 262 1.9 1991 82 0.6 246 1.7 1992 89 0.6 245 1.7 1993 96 0.6 179 1.2 1994 85 0.6 214 1.4 1995 77 0.5 202 1.3 1996 90 0.6 269 1.6 1997 103 0.6 299 1.8 1998 97 0.6 271 1.6 1999 109 0.6 362 2.0 2000 124 0.7 305 1.6 2001 122 0.6 353 1.8 2002 119 0.6 414 2.1 2003 125 0.6 716 3.5 2004 147 0.7 887 4.3 2005 137 0.6 915 4.3 2006 170 0.8 1,257 5.7 2007 159 0.7 960 4.2 2008 156 0.7 1,277 5.5 2009 211 0.9 1,341 5.6 2010 212 0.8 1,352 5.5 2011 219 0.8 1,247 4.9 2012 209 0.8 1,280 4.9 2013 251 0.9 1,210 4.5 2014 306 1.1 1,221 4.4 2015 237 0.8 1,237 4.3 2016 246 0.8 1,171 4.0 2017 254 0.8 1,532 5.1 2018 263 0.8 1,576 5.1
Sources: AIHW ACD 2014; AIHW NMD.
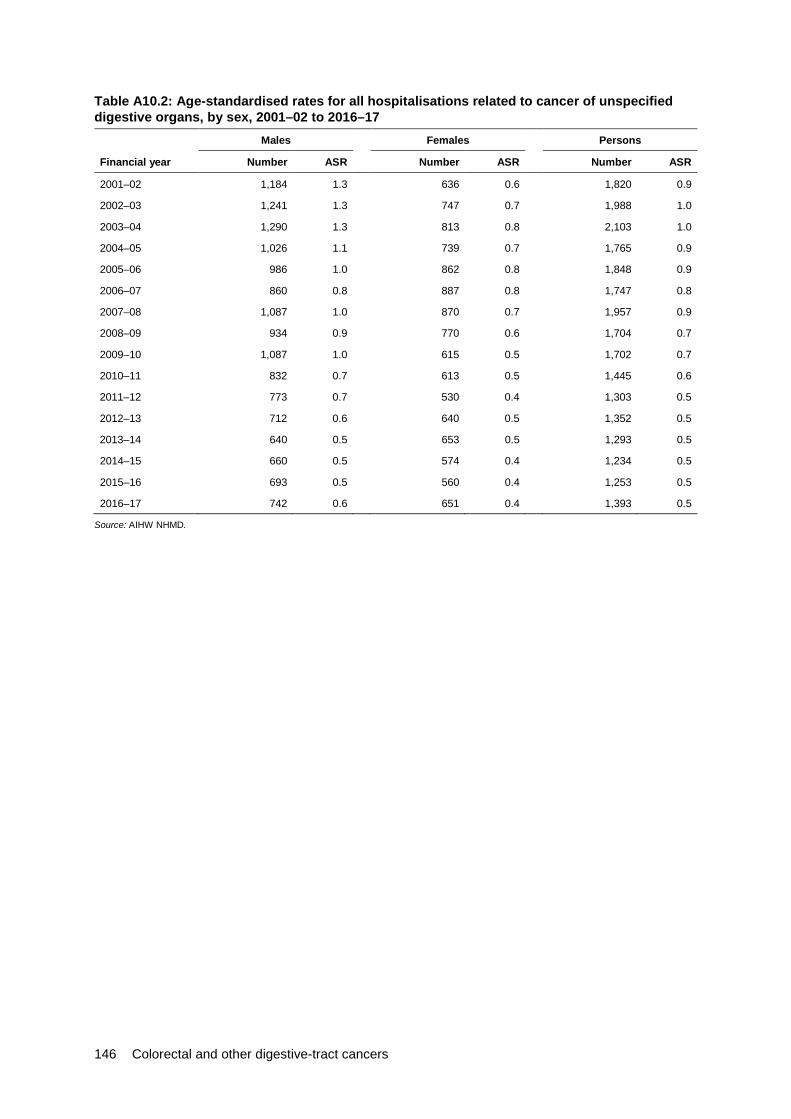
146 Colorectal and other digestive-tract cancers
Table A10.2: Age-standardised rates for all hospitalisations related to cancer of unspecified digestive organs, by sex, 2001–02 to 2016–17
Males Females Persons
Financial year Number ASR Number ASR Number ASR
2001–02 1,184 1.3 636 0.6 1,820 0.9
2002–03 1,241 1.3 747 0.7 1,988 1.0
2003–04 1,290 1.3 813 0.8 2,103 1.0
2004–05 1,026 1.1 739 0.7 1,765 0.9
2005–06 986 1.0 862 0.8 1,848 0.9
2006–07 860 0.8 887 0.8 1,747 0.8
2007–08 1,087 1.0 870 0.7 1,957 0.9
2008–09 934 0.9 770 0.6 1,704 0.7
2009–10 1,087 1.0 615 0.5 1,702 0.7
2010–11 832 0.7 613 0.5 1,445 0.6
2011–12 773 0.7 530 0.4 1,303 0.5
2012–13 712 0.6 640 0.5 1,352 0.5
2013–14 640 0.5 653 0.5 1,293 0.5
2014–15 660 0.5 574 0.4 1,234 0.5
2015–16 693 0.5 560 0.4 1,253 0.5
2016–17 742 0.6 651 0.4 1,393 0.5
Source: AIHW NHMD.
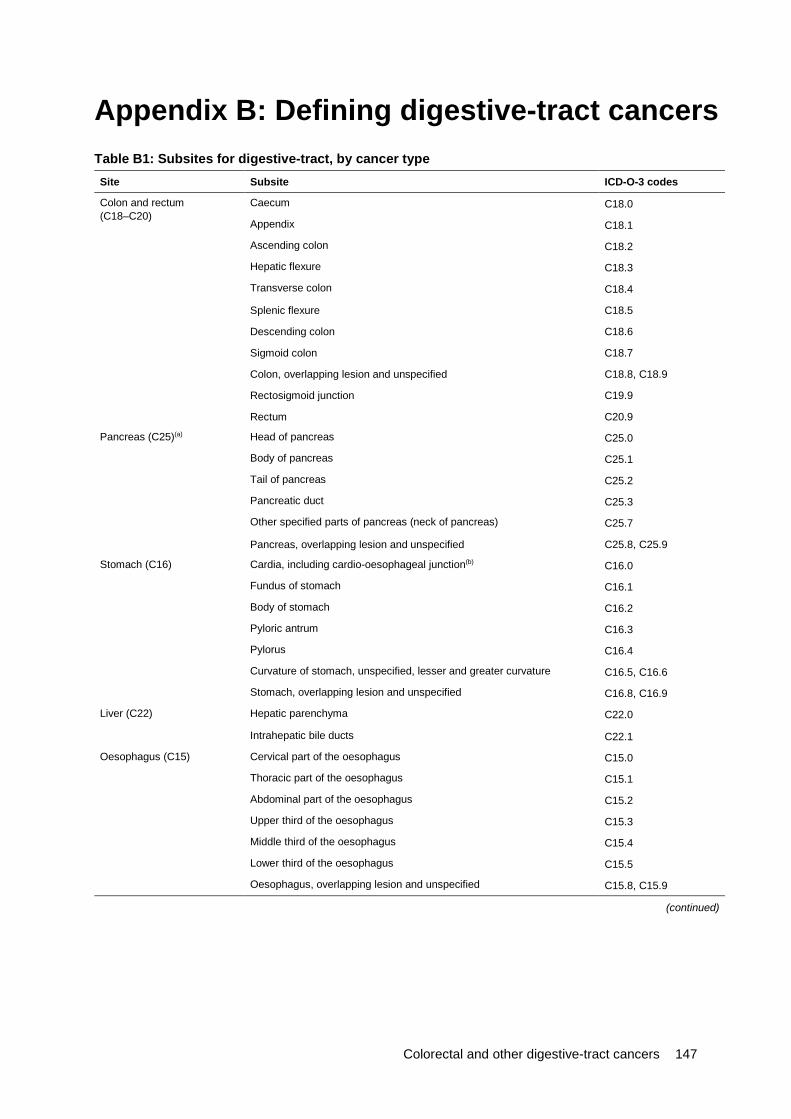
Colorectal and other digestive-tract cancers 147
Appendix B: Defining digestive-tract cancers Table B1: Subsites for digestive-tract, by cancer type Site Subsite ICD-O-3 codes
Colon and rectum (C18–C20)
Caecum C18.0
Appendix C18.1
Ascending colon C18.2
Hepatic flexure C18.3
Transverse colon C18.4
Splenic flexure C18.5
Descending colon C18.6
Sigmoid colon C18.7
Colon, overlapping lesion and unspecified C18.8, C18.9
Rectosigmoid junction C19.9
Rectum C20.9
Pancreas (C25)(a) Head of pancreas C25.0
Body of pancreas C25.1
Tail of pancreas C25.2
Pancreatic duct C25.3
Other specified parts of pancreas (neck of pancreas) C25.7
Pancreas, overlapping lesion and unspecified C25.8, C25.9
Stomach (C16) Cardia, including cardio-oesophageal junction(b) C16.0
Fundus of stomach C16.1
Body of stomach C16.2
Pyloric antrum C16.3
Pylorus C16.4
Curvature of stomach, unspecified, lesser and greater curvature C16.5, C16.6
Stomach, overlapping lesion and unspecified C16.8, C16.9
Liver (C22) Hepatic parenchyma C22.0
Intrahepatic bile ducts C22.1
Oesophagus (C15) Cervical part of the oesophagus C15.0
Thoracic part of the oesophagus C15.1
Abdominal part of the oesophagus C15.2
Upper third of the oesophagus C15.3
Middle third of the oesophagus C15.4
Lower third of the oesophagus C15.5
Oesophagus, overlapping lesion and unspecified C15.8, C15.9
(continued)
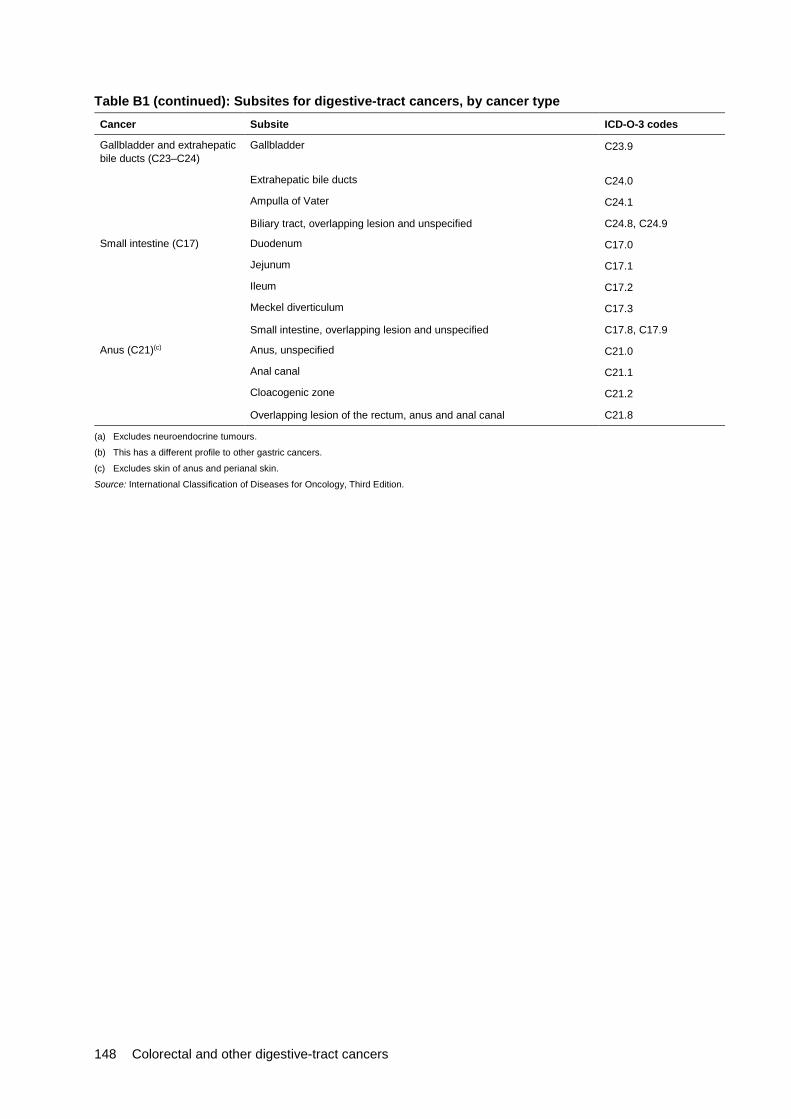
148 Colorectal and other digestive-tract cancers
Table B1 (continued): Subsites for digestive-tract cancers, by cancer type Cancer Subsite ICD-O-3 codes
Gallbladder and extrahepatic bile ducts (C23–C24)
Gallbladder C23.9
Extrahepatic bile ducts C24.0
Ampulla of Vater C24.1
Biliary tract, overlapping lesion and unspecified C24.8, C24.9
Small intestine (C17) Duodenum C17.0
Jejunum C17.1
Ileum C17.2
Meckel diverticulum C17.3
Small intestine, overlapping lesion and unspecified C17.8, C17.9
Anus (C21)(c) Anus, unspecified C21.0
Anal canal C21.1
Cloacogenic zone C21.2
Overlapping lesion of the rectum, anus and anal canal C21.8
(a) Excludes neuroendocrine tumours.
(b) This has a different profile to other gastric cancers.
(c) Excludes skin of anus and perianal skin.
Source: International Classification of Diseases for Oncology, Third Edition.
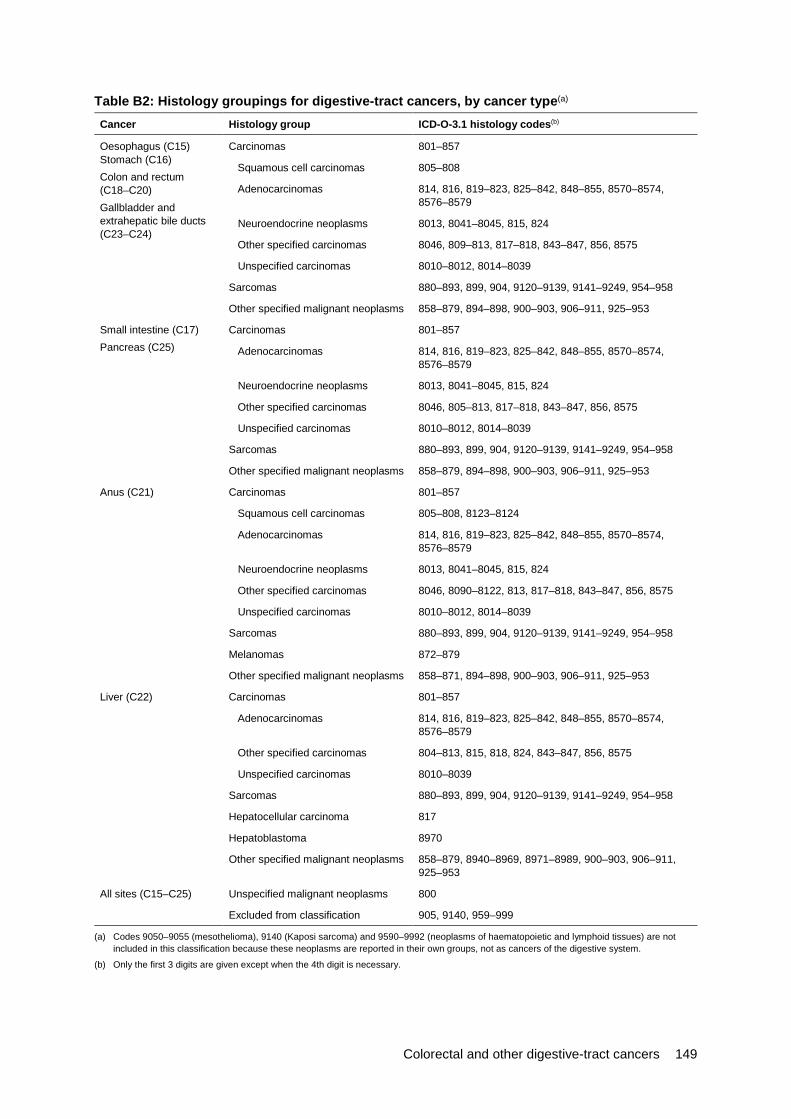
Colorectal and other digestive-tract cancers 149
Table B2: Histology groupings for digestive-tract cancers, by cancer type(a)
Cancer Histology group ICD-O-3.1 histology codes(b)
Oesophagus (C15) Stomach (C16) Colon and rectum (C18–C20) Gallbladder and extrahepatic bile ducts (C23–C24)
Carcinomas 801–857
Squamous cell carcinomas 805–808
Adenocarcinomas 814, 816, 819–823, 825–842, 848–855, 8570–8574, 8576–8579
Neuroendocrine neoplasms 8013, 8041–8045, 815, 824
Other specified carcinomas 8046, 809–813, 817–818, 843–847, 856, 8575
Unspecified carcinomas 8010–8012, 8014–8039
Sarcomas 880–893, 899, 904, 9120–9139, 9141–9249, 954–958
Other specified malignant neoplasms 858–879, 894–898, 900–903, 906–911, 925–953
Small intestine (C17) Pancreas (C25)
Carcinomas 801–857
Adenocarcinomas 814, 816, 819–823, 825–842, 848–855, 8570–8574, 8576–8579
Neuroendocrine neoplasms 8013, 8041–8045, 815, 824
Other specified carcinomas 8046, 805–813, 817–818, 843–847, 856, 8575
Unspecified carcinomas 8010–8012, 8014–8039
Sarcomas 880–893, 899, 904, 9120–9139, 9141–9249, 954–958
Other specified malignant neoplasms 858–879, 894–898, 900–903, 906–911, 925–953
Anus (C21) Carcinomas 801–857
Squamous cell carcinomas 805–808, 8123–8124
Adenocarcinomas 814, 816, 819–823, 825–842, 848–855, 8570–8574, 8576–8579
Neuroendocrine neoplasms 8013, 8041–8045, 815, 824
Other specified carcinomas 8046, 8090–8122, 813, 817–818, 843–847, 856, 8575
Unspecified carcinomas 8010–8012, 8014–8039
Sarcomas 880–893, 899, 904, 9120–9139, 9141–9249, 954–958
Melanomas 872–879
Other specified malignant neoplasms 858–871, 894–898, 900–903, 906–911, 925–953
Liver (C22) Carcinomas 801–857
Adenocarcinomas 814, 816, 819–823, 825–842, 848–855, 8570–8574, 8576–8579
Other specified carcinomas 804–813, 815, 818, 824, 843–847, 856, 8575
Unspecified carcinomas 8010–8039
Sarcomas 880–893, 899, 904, 9120–9139, 9141–9249, 954–958
Hepatocellular carcinoma 817
Hepatoblastoma 8970
Other specified malignant neoplasms 858–879, 8940–8969, 8971–8989, 900–903, 906–911, 925–953
All sites (C15–C25) Unspecified malignant neoplasms 800
Excluded from classification 905, 9140, 959–999
(a) Codes 9050–9055 (mesothelioma), 9140 (Kaposi sarcoma) and 9590–9992 (neoplasms of haematopoietic and lymphoid tissues) are not included in this classification because these neoplasms are reported in their own groups, not as cancers of the digestive system.
(b) Only the first 3 digits are given except when the 4th digit is necessary.

150 Colorectal and other digestive-tract cancers
Appendix C: Data sources Table C1: Data sources
Data source Measure Disaggregation and associated notes
ACD 2014 Incidence Sex and age group: 2018 estimates
Trend: 1982 to 2014 actual, 2015 to 2018 estimates
Characteristics: subsite and histology: 2013 actual. 2013 is the most recent year for which actual data were available for all states and territories
Population group: Indigenous status, Remoteness area, SES: 2009–2013. 2013 is the most recent year for which actual data were available for all states and territories. Multiple years provided to reduce random variations in rates
Survival Sex and age group: 2010–2014
Trend: 1985–1989 to 2010–2014
Population group: Indigenous status, Remoteness area, SES
Prevalence Limited-duration prevalence with an index date of 31 December 2013. 32-year prevalence has been used because it is the maximum number of years for which prevalence can be calculated using the available data
National Mortality Database 2016 (Deaths registered in 2013 and earlier: final Deaths registered in 2014: revised Deaths registered in 2015 and 2016: preliminary)
Mortality Sex and age group: 2018 estimates
Trend: 1982–2016 actual, 2017–2018 estimates
Population group: Indigenous status, Remoteness area, SES: 2011–2016. Multiple years to reduce random variations in rates
National Hospital Morbidly database
Hospitalisation Number of hospitalisations: Age, sex: 2016–2017
Number of hospitalisations: Trend: 2001–2002 to 2016–2017
Selected hospital procedures: 2016–2017. Surgical procedure include common surgical procedures performed with the purpose of treating digestive-tract cancer and excludes chemotherapy and radiotherapy and those interventions performed routinely in the course of a hospitalisation, such as administration of anaesthesia. Procedures relate to both public and private hospitals. The data presented are counts of procedures and do not to equate to the number of hospitalisations, because more than 1 procedure can be performed during a single hospitalisation
Chemotherapy: 2016–2017. Chemotherapy procedures relate to both public and private hospitals. The data presented are counts of procedures and do not to equate to the number of hospitalisations, because more than 1 procedure can be performed during a single hospitalisation
National Radiotherapy Waiting Times Database
Radiotherapy courses: sex: 2016–2017
NBCSP NBCSP indicators Participation, screening positivity, diagnostic assessment
Colorectal and other digestive-tract cancers 151
Australian Cancer Database All forms of cancer, except basal and squamous cell carcinomas of the skin, are notifiable diseases in each Australian state and territory. The Australian Cancer Database (ACD) contains information on all new cases of primary invasive cancer (excluding basal cell and squamous cell carcinoma of the skin) diagnosed in Australia since 1982. Actual incidence data covers the period 1982–2014, except for New South Wales, where data are available to 2013 and estimated for 2014.
Cancer reporting and registration is a dynamic process, and records in the state and territory cancer registries may be modified if new information is received. As a result, the number of cancer cases reported by the AIHW for any particular year may change slightly over time and may not always align with state and territory reporting for that same year.
This report also includes estimates of cancer incidence for 2015–2018. The 2015–2018 estimates are only indicative of future trends and the actual incidence may differ from these estimates. They are not forecasts and do not attempt to allow for future changes in cancer detection methods, changes in cancer risk factors or for non-demographic factors (such as, government policy changes) that may affect future cancer incidence rates. Estimates in this report used methodology outlined in Cancer in Australia 2017 (AIHW 2017d).
The Data Quality Statement for the ACD 2013 can be found at <http://meteor.aihw.gov.au/content/index.phtml/itemId/658607>.
National Mortality Database This report sources data from the AIHW National Mortality Database (NMD). The AIHW NMD contains information provided by the Registry of Births, Deaths and Marriages in each state and territory and the National Coronial Information System (managed by the Victorian Department of Justice)—and coded by the ABS—for deaths from 1964 to 2016. Registration of deaths is the responsibility of each state and territory Registry of Births, Deaths and Marriages. These data are then collated and coded by the ABS and are maintained at the AIHW in the NMD.
In the NMD, both the year in which the death occurred and the year in which it was registered are provided. The mortality data presented in this report from 1982 to 2015 are based on the year of occurrence of the death, and data for 2016 are based on the year of registration of the death.
Due to the difference in data sources and analysis approaches, mortality data are not directly comparable with those published by individual state and territory cancer registries. Mortality data in this report were derived using the place of a person’s residence at the time of death. In contrast, some state and territory cancer registries present mortality information based on a person’s place of residence at the time of diagnosis. In the latter data, the deaths may or may not have occurred in the state or territory indicated.
The data quality statements underpinning the AIHW NMD can be found on the following ABS internet pages: • ABS quality declaration summary for Deaths, Australia (ABS cat. no. 3302.0)
<http://www.abs.gov.au/ausstats/abs%40.nsf/mf/3302.0/> • ABS quality declaration summary for Causes of death, Australia (ABS cat. no. 3303.0)
<http://www.abs.gov.au/ausstats/abs%40.nsf/mf/3303.0/>.
For more information on the AIHW NMD see Deaths data at AIHW <http://www.aihw.gov.au/deaths/aihw-deaths-data/>.
This report includes estimates of mortality data for 2017–2018 based on the NMD. The 2017–2018 estimates are only indicative of the future trends, and the actual numbers may differ
152 Colorectal and other digestive-tract cancers
from these estimates. They are not forecasts and do not attempt to allow for future changes in cancer treatments. Estimates in this report, using methodology outlined in Cancer in Australia: 2017 (AIHW 2017d), with the exception of estimates for cancer of the small intestine, which used similar methodology, but used join-point analysis software to determine an appropriate modelling window of 1968–2013, rather than 2004–2013 as the window.
National Hospital Morbidity Database This report sources data from the National Hospital Morbidity Database (NHMD), which is a compilation of episode-level records from admitted patient morbidity data collection systems in Australian. For more information on the NHMD, refer to Appendix D and to Admitted patient care 2016–17: Australian hospital statistics (AIHW 2017a).
The AIHW NHMD is a compilation of episode-level records from admitted patient morbidity data collection systems in Australian hospitals. The data supplied are based on the National Minimum Data Set (NMDS) for admitted patient care; they include demographic, administrative and length of stay data, as well as data on the diagnoses of the patients, the procedures they underwent in hospital and external causes of injury and poisoning.
The purpose of the NMDS for admitted patient care is to collect information about care provided to admitted patients in Australian hospitals. The scope of the NMDS is episodes of care for admitted patients in all public and private acute and psychiatric hospitals, free-standing day hospital facilities, and alcohol and drug treatment centres in Australia. Hospitals operated by the Australian Defence Force, corrections authorities and in Australia’s off-shore territories are not in scope, but some are included.
The Data Quality Statement for the AIHW NHMD 2016–17 can be found at <http://meteor.aihw.gov.au/content/index.phtml/itemId/612171>.
National Radiotherapy Waiting Times Database The National Radiotherapy Waiting Times Database is a compilation of data supplied to the AIHW—based on the Radiotherapy Waiting Times National Minimum Data Set specification—which was collected from participating radiotherapy providers (100% of radiotherapy sites in Australia participated in the collection (AIHW 2018e) for the period 2016–17. Each record provides information relating to a course of radiotherapy that began in the reference period (that is, where the waiting period associated with the course of radiotherapy ended in the reference period). Other data collected includes administrative details, patient demographic characteristics and some clinical information, including principal diagnosis (9th edition of ICD-10-AM).
This report sources data on radiotherapy based on the National Radiotherapy Waiting Times Database (NRWTD). Radiotherapy is often provided on a non-admitted basis so limited information is available in the NHMD and therefore, radiotherapy numbers based on the NHMD are not presented. The NRWTD provides data on the number of courses of radiotherapy that began in a reporting period, key characteristics of the patients and information on the waiting times associated with these courses. The NRWTD contains data about the principal diagnosis. The principal diagnosis is the diagnosis established after study to be chiefly responsible for causing a patient’s need for a course of treatment. In the case of radiotherapy treatment, it is most typically a type of cancer.
Data reported for principal diagnosis may not reflect the incidence of certain cancers in the Australian population. The differences in principal diagnosis activity in this report may indicate data quality issues; for example, some providers, such as Victoria, report the primary site of the cancer, rather than the diagnosis code associated with the health condition being treated in the
Colorectal and other digestive-tract cancers 153
specific course of radiotherapy. For this reason, comparisons with incidence data should be made with caution. See Radiotherapy in Australia 2016–17 (AIHW 2018e) for further details.
The Data Quality Statement for the NRWTD can be found at <http://meteor.aihw.gov.au/content/index.phtml/itemId/696042>.
National Death Index The National Death Index (NDI) is a database, housed at the AIHW, which contains records of all deaths occurring in Australia since 1980. The data are obtained from the Registrar of Births, Deaths and Marriages in each state and territory. The NDI is designed to facilitate the conduct of epidemiological studies and its use is strictly confined to medical research. Cancer incidence records from the ACD were linked to the NDI and used to calculate the survival and prevalence data presented in this report.
The Data Quality Statement for the NDI can be found at <http://meteor.aihw.gov.au/content/index.phtml/itemId/480010>.
Australian Burden of Disease Study Data to develop the Australian Burden of Disease Study (ABDS) estimates for cancer were obtained from many different sources. Deaths data for the fatal burden were sourced from the NMD. Data for the non-fatal burden came from a variety of administrative sources including the ACD, the NHMD and Medicare Benefits Schedule (MBS) claims data, as well as a number of epidemiological studies.
Other inputs for the ABDS were obtained from the 2010 or 2013 Global Burden of Disease. These included the standard life table for fatal burden, health states and disability weights for the non-fatal burden and relative risks, and theoretical minimum risk exposure distributions for the risk factor attribution. Population estimates underpinning all estimates were sourced from the Australian Demographic Statistics from the ABS.
Full details on the various methods, data sources and standard inputs are available in Australian Burden of Disease Study 2011: methods and supplementary material (AIHW 2016b) and Burden of cancer in Australia: Australian Burden of Disease Study 2011 (AIHW 2017c).
Population data Throughout this report, population data were used to derive rates of, for example, cancer incidence and mortality. The population data were sourced from the ABS using the most up-to-date estimates available at the time of analysis.
To derive its estimates of the resident populations, the ABS uses the 5-yearly Census of Population and Housing data and adjusts it as described here: • All respondents in the Census are placed in their state or territory, Statistical Local Area
and postcode of usual residence; overseas visitors are excluded. • An adjustment is made for persons missed in the Census. • Australians temporarily overseas on Census night are added to the usual residence
Census count.
Estimated resident populations are then updated each year from the Census data, using indicators of population change, such as births, deaths and net migration. More information is available from the ABS website at <www.abs.gov.au>.

154 Colorectal and other digestive-tract cancers
Appendix D: Defining digestive-tract cancer hospitalisations Table D1: Definition of digestive-tract cancer-related hospitalisations
Group Definition Codes
Digestive-tract cancers
Principal diagnosis C15–C26
Additional diagnosis C15–C26
Notes
1. Codes were sourced from the 9th edition of the ACHI (ACCD 2014).
2. Hospitalisation for which the care type was reported as ‘Newborn with no qualified days’ and records for ‘Hospital boarders’ and ‘Posthumous organ procurement’ have been excluded from the analysis.
Table D2: Definition of colonoscopies
Block name Block code
Procedure code Procedure name
Fibreoptic colonoscopy 905 32084-00 Fibreoptic colonoscopy to hepatic flexure
32084-02 Fibreoptic colonoscopy to hepatic flexure with administration of tattooing agent
32090-00 Fibreoptic colonoscopy to caecum
32090-02 Fibreoptic colonoscopy to caecum with administration of tattooing agent
Fibreoptic colonoscopy with excision 911 32084-01 Fibreoptic colonoscopy to hepatic flexure, with biopsy
32087-00 Fibreoptic colonoscopy to hepatic flexure, with polypectomy
32090-01 Fibreoptic colonoscopy to caecum, with biopsy
32093-00 Fibreoptic colonoscopy to caecum, with polypectomy
Computerised tomography of abdomen 1962 56549-01 Computerised tomography of colon (virtual colonoscopy)
Note: Codes were sourced from the 9th edition of the ACHI (ACCD 2015).

Colorectal and other digestive-tract cancers 155
Table D3: Definition of principal and additional diagnosis codes for colorectal tumour-related colonoscopies Diagnosis ICD-10-AM Code
Principal diagnosis codes
Colorectal cancer C18–C20
Non-malignant colorectal tumour D12.1–D12.8, D37.3–D37.5
Polyp of colon K63.5
Follow-up after cancer treatment(a) Z08
Cancer surveillance(b) Z12.1
Additional diagnosis codes
Family history of malignant neoplasm of digestive organs Z80.0
Personal history of colonic polyps Z87.12
Follow-up examination after surgery for other conditions Z09.0
Family history of diseases of the digestive system Z83.7
Personal history of non-malignant neoplasms Z86.0
Personal history of malignant neoplasm of digestive organs Z85.0
Person with feared complaint in whom no diagnosis is made Z71.1
Personal history of other digestive system disease Z87.18
Follow-up examination after unspecified treatment for other conditions Z09.9
Special screening examination for digestive tract disorder Z13.83
(a) Only records with an additional diagnosis of Z85.0 Personal history of malignant neoplasm of digestive organs were included in analysis.
(b) The code Z12 Special screening examination for neoplasms is assigned when no neoplasm is found.
Note: Codes were sourced from the 9th edition of the ACHI (ACCD 2015).
Table D4: Definition of surgical procedures for colorectal cancer Group Procedure code Procedure name
Colectomy 30515-03 Ileocolic resection with anastomosis
30515-04 Laparoscopic ileocolic resection with anastomosis
30515-05 Ileocolic resection with formation of stoma
30515-06 Laparoscopic ileocolic resection with formation of stoma
32003-00 Limited excision of large intestine with anastomosis
32003-02 Laparoscopic limited excision of large intestine with anastomosis
32000-00 Limited excision of large intestine with formation of stoma
32000-02 Laparoscopic limited excision of large intestine with anastomosis
32003-01 Right hemicolectomy with anastomosis
32003-03 Laparoscopic right hemicolectomy with anastomosis
32000-01 Right hemicolectomy with formation of stoma
32000-03 Laparoscopic right hemicolectomy with formation of stoma
32005-01 Extended right hemicolectomy with anastomosis
32005-03 Laparoscopic extended right hemicolectomy with anastomosis
(continued)

156 Colorectal and other digestive-tract cancers
Table D4 (continued): Definition of surgical procedures for colorectal cancer Group Procedure code Procedure name
Colectomy (continued) 32004-01 Extended right hemicolectomy with formation of stoma
32004-03 Laparoscopic extended right hemicolectomy with formation of stoma
32006-00 Left hemicolectomy with anastomosis
32006-02 Laparoscopic left hemicolectomy with anastomosis
32006-01 Left hemicolectomy with formation of stoma
32006-03 Laparoscopic left hemicolectomy with formation of stoma
32005-00 Subtotal colectomy with anastomosis
32005-02 Laparoscopic subtotal colectomy with anastomosis
32004-00 Subtotal colectomy with formation of stoma
32004-02 Laparoscopic subtotal colectomy with formation of stoma
32012-00 Total colectomy with ileorectal anastomosis
32012-01 Laparoscopic total colectomy with ileorectal anastomosis
32009-00 Total colectomy with ileostomy
32009-01 Laparoscopic total colectomy with ileostomy
Rectosigmoidoscopy or proctectomy
32030-00 Rectosigmoidectomy with formation of stoma
32030-01 Laparoscopic rectosigmoidectomy with formation of stoma
32047-00 Perineal proctectomy
32039-00 Abdominoperineal proctectomy
32060-00 Restorative proctectomy
Anterior resection of rectum 32024-00 High anterior resection of rectum
32025-00 Low anterior resection of rectum
32026-00 Ultra low anterior resection of rectum
32028-00 Ultra low anterior resection of rectum with hand sutured coloanal anastomosis
92208-00 Anterior resection of rectum, level unspecified
Total proctocolectomy 32015-00 Total proctocolectomy with ileostomy
32051-00 Total proctocolectomy with ileo-anal anastomosis
32051-01 Total proctocolectomy with ileo-anal anastomosis and formation of temporary ileostomy
Other excision procedures 32078-00 Rigid sigmoidoscopy with polypectomy involving removal of 9 polyps
32087-00 Fibreoptic colonoscopy to hepatic flexure, with polypectomy
32093-00 Fibreoptic colonoscopy to caecum, with polypectomy
90297-02 Endoscopic mucosal resection of large intestine
32029-00 Construction of colonic reservoir
90959-00 Excision of other lesion of large intestine
32099-00 Per anal excision of lesion or tissue of rectum
90341-00 Other excision of lesion of rectum
Repair (caecostomy or colostomy)
30375-00 Caecostomy
30375-28 Temporary colostomy
30375-04 Other colostomy
Note: Codes were sourced from the 9th edition of the ACHI (ACCD 2015).
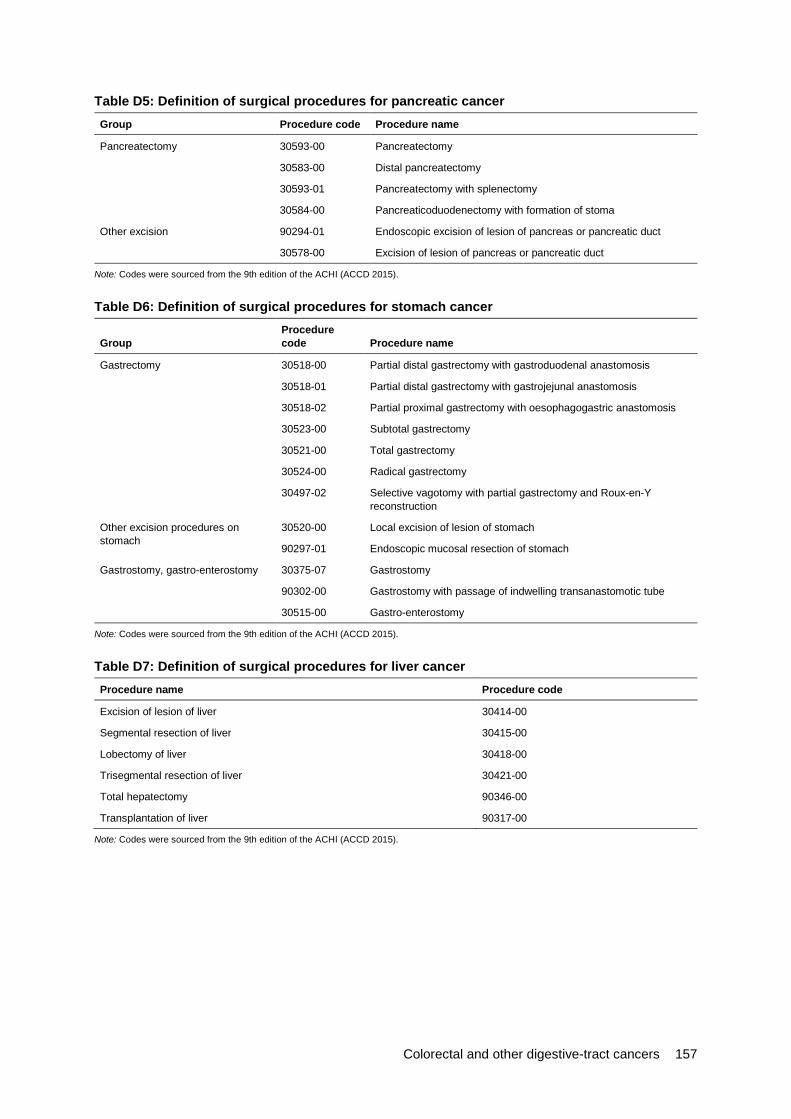
Colorectal and other digestive-tract cancers 157
Table D5: Definition of surgical procedures for pancreatic cancer Group Procedure code Procedure name
Pancreatectomy 30593-00 Pancreatectomy
30583-00 Distal pancreatectomy
30593-01 Pancreatectomy with splenectomy
30584-00 Pancreaticoduodenectomy with formation of stoma
Other excision 90294-01 Endoscopic excision of lesion of pancreas or pancreatic duct
30578-00 Excision of lesion of pancreas or pancreatic duct
Note: Codes were sourced from the 9th edition of the ACHI (ACCD 2015).
Table D6: Definition of surgical procedures for stomach cancer
Group Procedure code Procedure name
Gastrectomy 30518-00 Partial distal gastrectomy with gastroduodenal anastomosis
30518-01 Partial distal gastrectomy with gastrojejunal anastomosis
30518-02 Partial proximal gastrectomy with oesophagogastric anastomosis
30523-00 Subtotal gastrectomy
30521-00 Total gastrectomy
30524-00 Radical gastrectomy
30497-02 Selective vagotomy with partial gastrectomy and Roux-en-Y reconstruction
Other excision procedures on stomach
30520-00 Local excision of lesion of stomach
90297-01 Endoscopic mucosal resection of stomach
Gastrostomy, gastro-enterostomy 30375-07 Gastrostomy
90302-00 Gastrostomy with passage of indwelling transanastomotic tube
30515-00 Gastro-enterostomy
Note: Codes were sourced from the 9th edition of the ACHI (ACCD 2015).
Table D7: Definition of surgical procedures for liver cancer Procedure name Procedure code
Excision of lesion of liver 30414-00
Segmental resection of liver 30415-00
Lobectomy of liver 30418-00
Trisegmental resection of liver 30421-00
Total hepatectomy 90346-00
Transplantation of liver 90317-00
Note: Codes were sourced from the 9th edition of the ACHI (ACCD 2015).
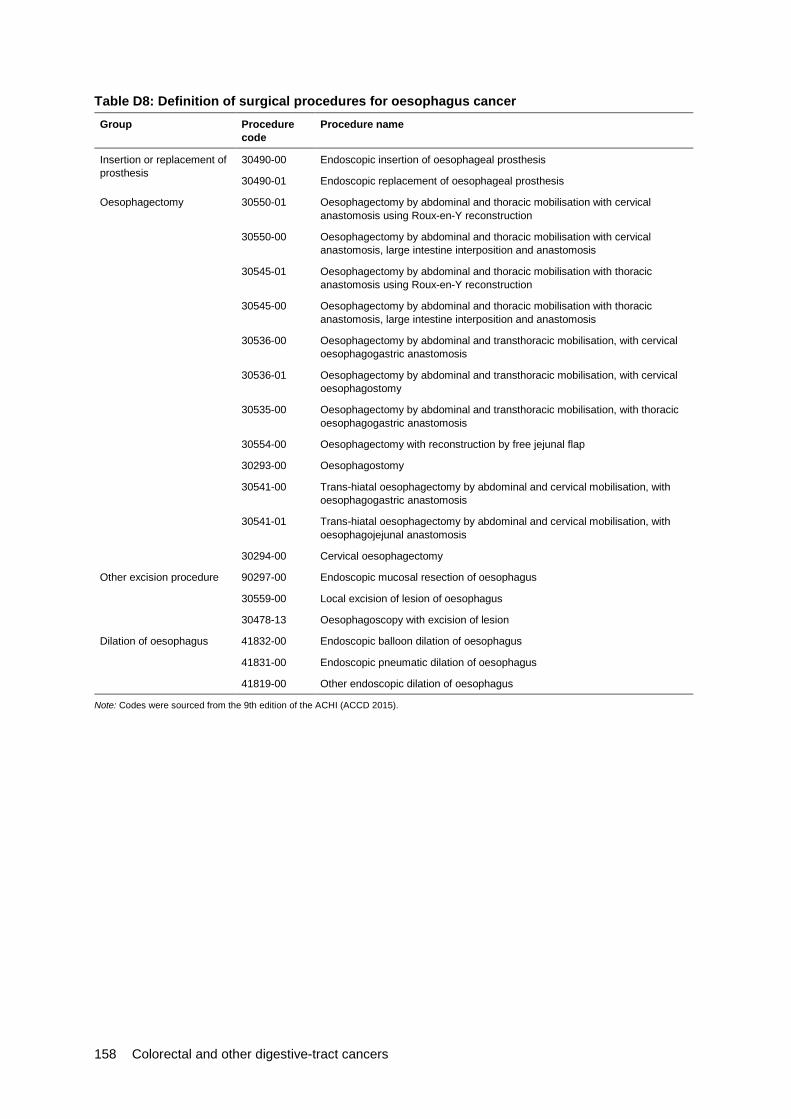
158 Colorectal and other digestive-tract cancers
Table D8: Definition of surgical procedures for oesophagus cancer Group Procedure
code Procedure name
Insertion or replacement of prosthesis
30490-00 Endoscopic insertion of oesophageal prosthesis
30490-01 Endoscopic replacement of oesophageal prosthesis
Oesophagectomy 30550-01 Oesophagectomy by abdominal and thoracic mobilisation with cervical anastomosis using Roux-en-Y reconstruction
30550-00 Oesophagectomy by abdominal and thoracic mobilisation with cervical anastomosis, large intestine interposition and anastomosis
30545-01 Oesophagectomy by abdominal and thoracic mobilisation with thoracic anastomosis using Roux-en-Y reconstruction
30545-00 Oesophagectomy by abdominal and thoracic mobilisation with thoracic anastomosis, large intestine interposition and anastomosis
30536-00 Oesophagectomy by abdominal and transthoracic mobilisation, with cervical oesophagogastric anastomosis
30536-01 Oesophagectomy by abdominal and transthoracic mobilisation, with cervical oesophagostomy
30535-00 Oesophagectomy by abdominal and transthoracic mobilisation, with thoracic oesophagogastric anastomosis
30554-00 Oesophagectomy with reconstruction by free jejunal flap
30293-00 Oesophagostomy
30541-00 Trans-hiatal oesophagectomy by abdominal and cervical mobilisation, with oesophagogastric anastomosis
30541-01 Trans-hiatal oesophagectomy by abdominal and cervical mobilisation, with oesophagojejunal anastomosis
30294-00 Cervical oesophagectomy
Other excision procedure 90297-00 Endoscopic mucosal resection of oesophagus
30559-00 Local excision of lesion of oesophagus
30478-13 Oesophagoscopy with excision of lesion
Dilation of oesophagus 41832-00 Endoscopic balloon dilation of oesophagus
41831-00 Endoscopic pneumatic dilation of oesophagus
41819-00 Other endoscopic dilation of oesophagus
Note: Codes were sourced from the 9th edition of the ACHI (ACCD 2015).
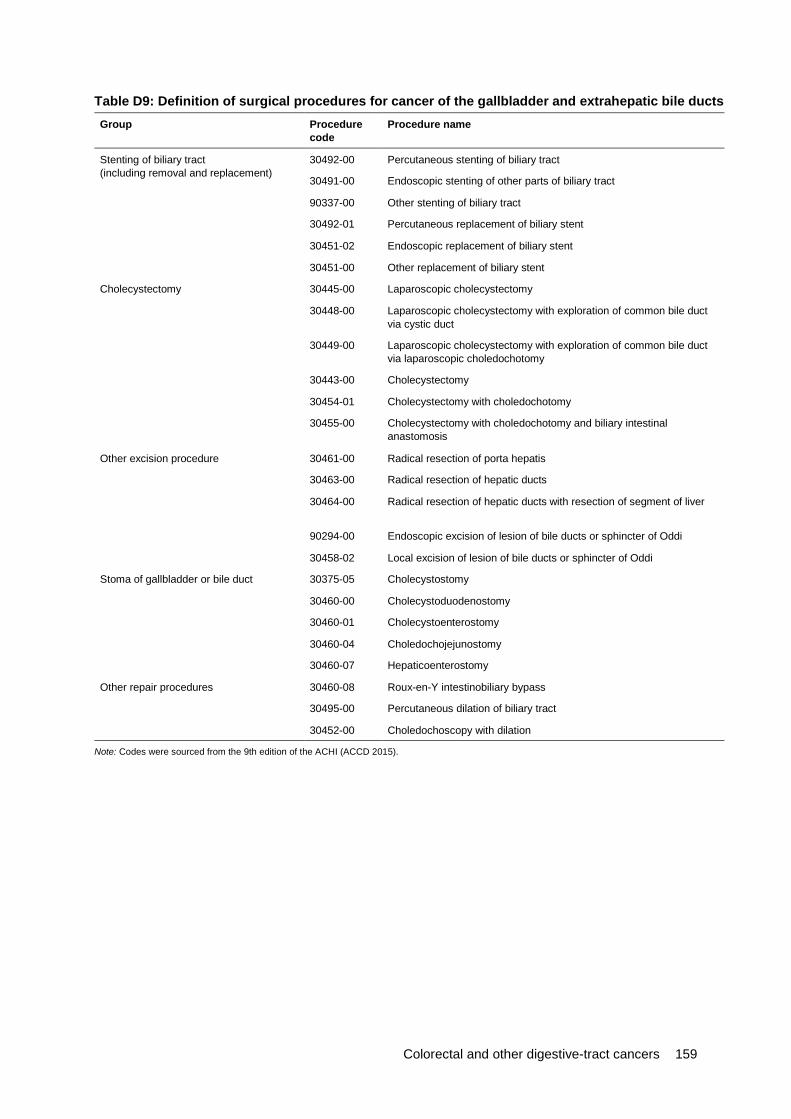
Colorectal and other digestive-tract cancers 159
Table D9: Definition of surgical procedures for cancer of the gallbladder and extrahepatic bile ducts Group Procedure
code Procedure name
Stenting of biliary tract (including removal and replacement)
30492-00 Percutaneous stenting of biliary tract
30491-00 Endoscopic stenting of other parts of biliary tract
90337-00 Other stenting of biliary tract
30492-01 Percutaneous replacement of biliary stent
30451-02 Endoscopic replacement of biliary stent
30451-00 Other replacement of biliary stent
Cholecystectomy 30445-00 Laparoscopic cholecystectomy
30448-00 Laparoscopic cholecystectomy with exploration of common bile duct via cystic duct
30449-00 Laparoscopic cholecystectomy with exploration of common bile duct via laparoscopic choledochotomy
30443-00 Cholecystectomy
30454-01 Cholecystectomy with choledochotomy
30455-00 Cholecystectomy with choledochotomy and biliary intestinal anastomosis
Other excision procedure 30461-00 Radical resection of porta hepatis
30463-00 Radical resection of hepatic ducts
30464-00 Radical resection of hepatic ducts with resection of segment of liver
90294-00 Endoscopic excision of lesion of bile ducts or sphincter of Oddi
30458-02 Local excision of lesion of bile ducts or sphincter of Oddi
Stoma of gallbladder or bile duct 30375-05 Cholecystostomy
30460-00 Cholecystoduodenostomy
30460-01 Cholecystoenterostomy
30460-04 Choledochojejunostomy
30460-07 Hepaticoenterostomy
Other repair procedures 30460-08 Roux-en-Y intestinobiliary bypass
30495-00 Percutaneous dilation of biliary tract
30452-00 Choledochoscopy with dilation
Note: Codes were sourced from the 9th edition of the ACHI (ACCD 2015).
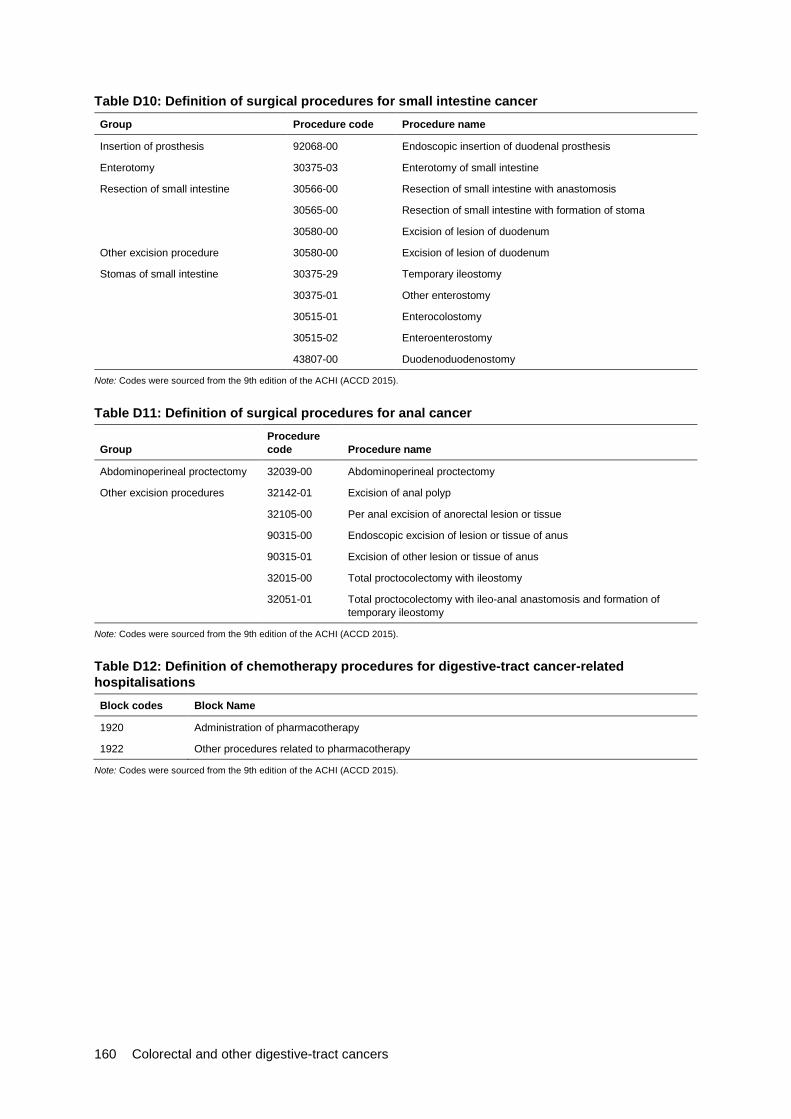
160 Colorectal and other digestive-tract cancers
Table D10: Definition of surgical procedures for small intestine cancer Group Procedure code Procedure name
Insertion of prosthesis 92068-00 Endoscopic insertion of duodenal prosthesis
Enterotomy 30375-03 Enterotomy of small intestine
Resection of small intestine 30566-00 Resection of small intestine with anastomosis
30565-00 Resection of small intestine with formation of stoma
30580-00 Excision of lesion of duodenum
Other excision procedure 30580-00 Excision of lesion of duodenum
Stomas of small intestine 30375-29 Temporary ileostomy
30375-01 Other enterostomy
30515-01 Enterocolostomy
30515-02 Enteroenterostomy
43807-00 Duodenoduodenostomy
Note: Codes were sourced from the 9th edition of the ACHI (ACCD 2015).
Table D11: Definition of surgical procedures for anal cancer
Group Procedure code Procedure name
Abdominoperineal proctectomy 32039-00 Abdominoperineal proctectomy
Other excision procedures 32142-01 Excision of anal polyp
32105-00 Per anal excision of anorectal lesion or tissue
90315-00 Endoscopic excision of lesion or tissue of anus
90315-01 Excision of other lesion or tissue of anus
32015-00 Total proctocolectomy with ileostomy
32051-01 Total proctocolectomy with ileo-anal anastomosis and formation of temporary ileostomy
Note: Codes were sourced from the 9th edition of the ACHI (ACCD 2015).
Table D12: Definition of chemotherapy procedures for digestive-tract cancer-related hospitalisations Block codes Block Name
1920 Administration of pharmacotherapy
1922 Other procedures related to pharmacotherapy
Note: Codes were sourced from the 9th edition of the ACHI (ACCD 2015).
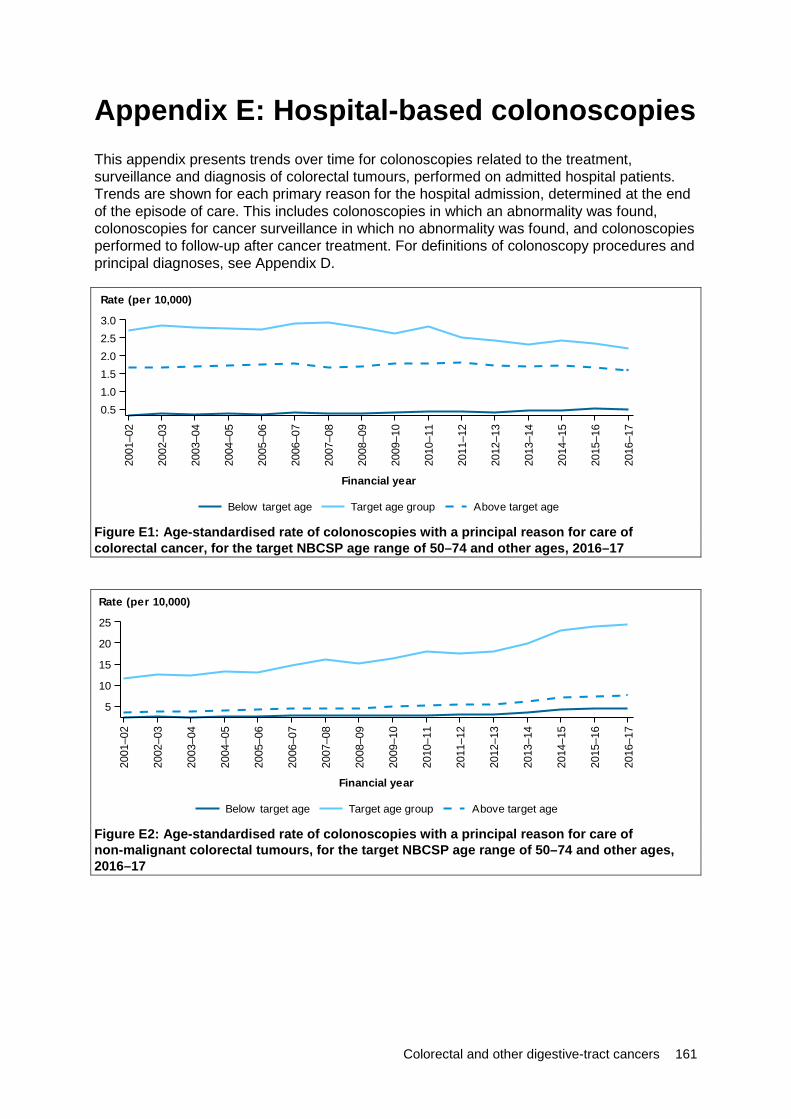
Colorectal and other digestive-tract cancers 161
Appendix E: Hospital-based colonoscopies This appendix presents trends over time for colonoscopies related to the treatment, surveillance and diagnosis of colorectal tumours, performed on admitted hospital patients. Trends are shown for each primary reason for the hospital admission, determined at the end of the episode of care. This includes colonoscopies in which an abnormality was found, colonoscopies for cancer surveillance in which no abnormality was found, and colonoscopies performed to follow-up after cancer treatment. For definitions of colonoscopy procedures and principal diagnoses, see Appendix D.
Figure E1: Age-standardised rate of colonoscopies with a principal reason for care of colorectal cancer, for the target NBCSP age range of 50–74 and other ages, 2016–17
Figure E2: Age-standardised rate of colonoscopies with a principal reason for care of non-malignant colorectal tumours, for the target NBCSP age range of 50–74 and other ages, 2016–17
2001
–02
2002
–03
2003
–04
2004
–05
2005
–06
2006
–07
2007
–08
2008
–09
2009
–10
2010
–11
2011
–12
2012
–13
2013
–14
2014
–15
2015
–16
2016
–17
Financial year
0.51.01.52.02.53.0
Rate (per 10,000)
Above target ageTarget age groupBelow target age
2001
–02
2002
–03
2003
–04
2004
–05
2005
–06
2006
–07
2007
–08
2008
–09
2009
–10
2010
–11
2011
–12
2012
–13
2013
–14
2014
–15
2015
–16
2016
–17
Financial year
5
10
15
20
25
Rate (per 10,000)
Above target ageTarget age groupBelow target age
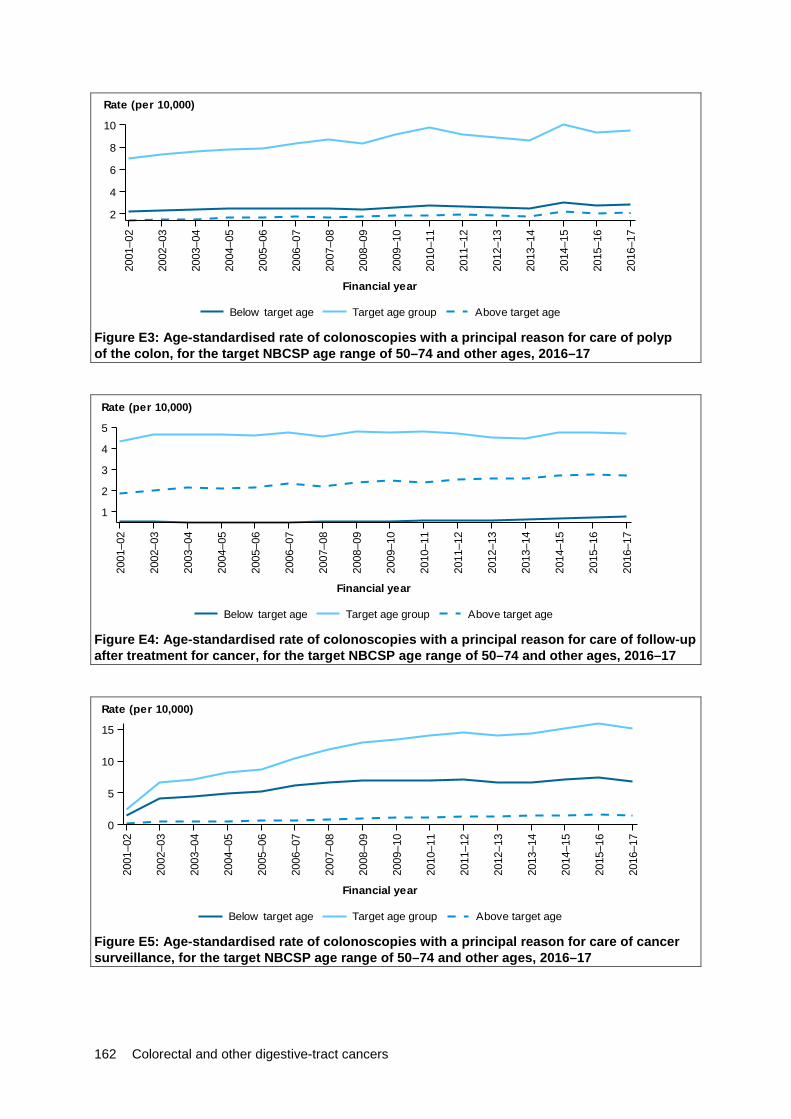
162 Colorectal and other digestive-tract cancers
Figure E3: Age-standardised rate of colonoscopies with a principal reason for care of polyp of the colon, for the target NBCSP age range of 50–74 and other ages, 2016–17
Figure E4: Age-standardised rate of colonoscopies with a principal reason for care of follow-up after treatment for cancer, for the target NBCSP age range of 50–74 and other ages, 2016–17
Figure E5: Age-standardised rate of colonoscopies with a principal reason for care of cancer surveillance, for the target NBCSP age range of 50–74 and other ages, 2016–17
2001
–02
2002
–03
2003
–04
2004
–05
2005
–06
2006
–07
2007
–08
2008
–09
2009
–10
2010
–11
2011
–12
2012
–13
2013
–14
2014
–15
2015
–16
2016
–17
Financial year
2
4
6
8
10
Rate (per 10,000)
Above target ageTarget age groupBelow target age
2001
–02
2002
–03
2003
–04
2004
–05
2005
–06
2006
–07
2007
–08
2008
–09
2009
–10
2010
–11
2011
–12
2012
–13
2013
–14
2014
–15
2015
–16
2016
–17
Financial year
1
2
3
4
5
Rate (per 10,000)
Above target ageTarget age groupBelow target age
2001
–02
2002
–03
2003
–04
2004
–05
2005
–06
2006
–07
2007
–08
2008
–09
2009
–10
2010
–11
2011
–12
2012
–13
2013
–14
2014
–15
2015
–16
2016
–17
Financial year
0
5
10
15
Rate (per 10,000)
Above target ageTarget age groupBelow target age

Colorectal and other digestive-tract cancers 163
Glossary additional diagnosis: A diagnosis established after study to be a contributing factor to, or affecting, the patient’s episode of care in hospital (or attendance at the health-care facility). Compare with principal diagnosis. adenocarcinoma: A malignant tumour originating in glandular epithelium.
admitted patient: A person who undergoes a hospital’s formal admission process to receive treatment and/or care. Such treatment or care can occur in hospital and/or in the person’s home (as a ‘hospital-in-home’ patient).
age-standardisation: A method of removing the influence of age when comparing populations with different age-structures. This is usually necessary because the rates of many diseases vary strongly (usually increasing) with age. The age structures of the different populations are converted to the same ‘standard’ structure, and then the disease rates that would have occurred with that structure are calculated and compared.
age-standardised rate: A rate that results from removing the influence of age by converting the age-structures of the different populations to the same ‘standard’ structure. This provides a more valid way of comparing rates from populations with different age-structures.
anastomosis: The surgical union of parts, especially if hollow or tubular.
benign: Term that describes non-cancerous tumours that may grow larger but do not spread to other parts of the body.
cancer: (also called malignancy), is a term for diseases in which abnormal cells divide without control and can invade nearby tissues. Cancer cells can also spread to other parts of the body through the blood and lymph systems. carcinoma: A malignant tumour of epithelial origin.
colectomy: Surgical removal of part or all of the colon. chemotherapy: The use of drugs (chemicals) to prevent or treat disease, with the term usually being applied to treatment for cancer rather than for other uses.
cholecystectomy: Surgical removal of the gallbladder.
cirrhosis: Widespread disruption of normal liver structure by degeneration of cells, inflammation and fibrous thickening of tissue.
colostomy: Surgical formation of an artificial anus by connecting the colon to an opening in the abdominal wall (stoma). death due to cancer: A death where the underlying cause is indicated as cancer. diabetes mellitus: A condition in which the body’s ability to produce or respond to the hormone insulin is impaired, resulting in abnormal metabolism of carbohydrates and elevated levels of glucose in the blood.
disability-adjusted life year (DALY): A year of healthy life lost, either through premature death or equivalently through living with disability due to illness or injury. It is the basic unit used in burden of disease and injury estimates.
endoscopy: Examination of the inside of the body using a fibre-optic flexible or rigid tubular instrument for visualising the interior of a hollow organ or part, usually the oesophagus, stomach and portions of the small intestine. enterotomy: Surgical cutting into the intestines.
164 Colorectal and other digestive-tract cancers
gastrectomy: Surgical removal of part or all of the stomach.
gastrostomy: An opening placed directly into the stomach. gastroenterostomy: Surgical formation of an artificial opening between the stomach and the small intestine, usually at the jejunum. hospitalisation: Synonymous with admission and separation; that is, an episode of hospital care that starts with the formal admission process and ends with the formal separation process. An episode of care can be completed by the patient being discharged, transferred to another hospital or care facility, or dying, or by a portion of a hospital stay beginning or ending in a change of type of care (for example, from acute to rehabilitation).
incidence: The number of new cases (of an illness or event, and so on) occurring during a given period. Compare with prevalence.
International Classification of Diseases (ICD): The World Health Organization’s internationally accepted statistical classification of death and disease. The 10th revision (ICD-10) is currently in use. The Australian modification of the ICD-10 (ICD-10-AM) is used for diagnoses and procedures recorded for patients admitted to hospitals.
ionising radiation: Radiation capable of producing ions, directly or indirectly, when passing through matter. Within living organisms this results in the death of cells, delay in their development, and/or the production of gene mutations and chromosome breaks.
malignant: A tumour with the capacity to spread to surrounding tissue or to other sites in the body.
Medicare: A national, government-funded scheme that subsidises the cost of personal medical services for all Australians and aims to help them afford medical care. The Medicare Benefits Schedule (MBS) is the listing of the Medicare services subsidised by the Australian Government. The schedule is part of the wider Medicare Benefits Scheme (Medicare).
melanoma: A tumour of melanin-forming cells; a malignant tumour associated with skin cancer.
metastatic: The spread of a disease from the primary site of disease to another part of the body.
mortality: Death.
mortality rate: The number of deaths in a given period, adjusted to take account of population age-structure, expressed per 100,000 population.
neoplasm: An abnormal (‘neo’, new) growth of tissue. Can be ‘benign’ (not a cancer) or ‘malignant’ (a cancer). Same as a tumour. neuroendocrine: Relating to a hormonal substance that influences the activity of nerves.
oesophagectomy: Removal of part or the entire oesophagus (food pipe, or gullet) and replacement with another organ.
oesophagogastric (Heller) myotomy: Incision or division of external muscular tissue in the lower oesophagus and stomach.
pancreatectomy: Surgical removal of part or all of the pancreas. pancreatitis: Inflammation of the pancreas. polyp: A growth projecting from a mucous membrane.
prevalence: The total number of people alive at a specific date who have been diagnosed with a particular disease (such as cancer) within a defined period.
principal diagnosis: The diagnosis listed in hospitals records to describe the problem that was chiefly responsible for the patient’s episode of care in hospital.
Colorectal and other digestive-tract cancers 165
proctectomy: Surgical removal of part or all of the rectum. proctocolectomy: Surgical removal of the rectum and part or all of the colon. radiotherapy: Radiation directed at a localised area to kill or damage cancer cells. There are several types of radiotherapy. This report focuses on megavoltage external beam radiotherapy delivered by linear accelerator machines. rate ratio: A relative difference measure used to compare the incidence rates.
rectosigmoidoscopy: Examination of the rectum and pelvic colon with an endoscope designed to be passed through the anus in order to permit inspection, diagnosis, treatment and photography (sigmoidoscope). rectosigmoidectomy: Surgical removal of the rectum and sigmoid colon. relative survival: A measure of the average survival experience of a population of people diagnosed with cancer, relative to the ‘average’ Australian of the same sex and age, at a specified interval after diagnosis (usually 5 or 10 years).
resection: Surgical removal of part or all of a damaged organ or structure, particularly the removal of a tumour.
separation: An episode of care for an admitted patient which may include a total hospital stay (from admission to discharge, transfer or death) or a portion of a hospital stay that begins or ends in a change of type of care (for example, from acute to rehabilitation). In this report, separations are also referred to as hospitalisations.
stent: A short narrow plastic or metal tube, often a mesh, inserted into the lumen of an anatomical vessel (for example, bile duct, artery), often to keep a previously blocked passageway open. stoma: An artificial opening made in surgical procedures, kept open for drainage or other purposes.
tumour: See neoplasm.
vagotomy: A surgical procedure that involves removing part of the vagus nerve.
years lived with disability (YLD): A measure of the years of what could have been a healthy life but were instead spent in states of less than full health. YLD represent non-fatal burden.
years of life lost (YLL): Years of life lost due to premature death, defined as dying before the global ideal life span at the age of death. YLL represent fatal burden.
166 Colorectal and other digestive-tract cancers
References ABS (Australian Bureau of Statistics) 2017. Cause of death, Australia 2015. ABS cat. no. 3303.0. Canberra: ABS. Viewed August 2018, <http://www.abs.gov.au/ausstats/[email protected]/Lookup/by%20Subject/3303.0~2015~Main%20Features~Complexities%20in%20the%20measurement%20of%20bowel%20cancer%20in%20Australia~7>. ACCD (Australian Consortium for Classification Development) 2014. The International Statistical Classification of Diseases and Related Health Problems, 10th Revision, Australian Modification (ICD-10-AM). 9th edn. Tabular list of diseases, and alphabetic index of diseases. Adelaide: Independent Hospital Pricing Authority.
ACCD 2015. The Australian Classification of Health Interventions (ACHI). 9th edn. Tabular list of interventions, and alphabetic index of interventions. Adelaide: Independent Hospital Pricing Authority.
Agudo A, Gonzalez CA, Marcos G, Sanz M, Saigi E, Verge J et al. 1992. Consumption of alcohol, coffee, and tobacco, and gastric cancer in Spain. Cancer Causes and Control 3(2):137–143.
AIHW (Australian Institute of Health and Welfare) 2012. Cancer incidence projections: Australia, 2011 to 2020. Cancer series no. 66. Cat. no. CAN 62. Canberra: AIHW.
AIHW 2016a. Australian Burden of Disease Study: impact and causes of illness and death in Australia 2011. Australian Burden of Disease Study series no. 3. Cat. no. BOD 4. Canberra: AIHW.
AIHW 2016b. Australian Burden of Disease Study 2011: methods and supplementary material. Australian Burden of Disease Study series no. 5. Cat. no. BOD 6. Canberra: AIHW.
AIHW 2017a. Admitted patient care 2016–17: Australian hospital statistics. Health services series no. 84. Cat. no. HSE 201. Canberra: AIHW.
AIHW 2017b. Australian Cancer Incidence and Mortality (ACIM) books. Cat. no. WEB 206. Canberra: AIHW.
AIHW 2017c. Burden of cancer in Australia: Australian Burden of Disease Study 2011. Australian Burden of Disease Study series no. 12. Cat. no. BOD 13. Canberra: AIHW.
AIHW 2017d. Cancer in Australia 2017. Cancer series no. 101. Cat. no. CAN 100. Canberra: AIHW.
AIHW 2017e. Impact of overweight and obesity as a risk factor for chronic conditions: Australian burden of disease study. Australian burden of disease study series no. 11. Cat. no. BOD 12. Canberra: AIHW.
AIHW 2017f. Impact of physical inactivity as a risk factor for chronic conditions: Australian Burden of Disease Study. Australian Burden of Disease Study series no. 15. Cat. no. BOD 16. Canberra: AIHW.
AIHW 2018a. Australia’s health 2018. Australia’s health series no. 16. Cat. no. AUS 221. Canberra: AIHW.
AIHW 2018b. Analysis of bowel cancer outcomes for the National Bowel Cancer Screening Program 2018. Cat. no. CAN 113. Canberra: AIHW.
AIHW 2018c. Impact of alcohol and illicit drug use on the burden of disease and injury in Australia: Australian Burden of Disease Study 2011. Australian Burden of Disease Study series no. 17. Cat. no. BOD 19. Canberra: AIHW.
AIHW 2018d. National Bowel Cancer Screening Program: monitoring report 2018. Cat. no. CAN 112. Canberra: AIHW.
Colorectal and other digestive-tract cancers 167
AIHW 2018e. Radiotherapy in Australia 2016–17. Cat. no. HSE 209. Canberra: AIHW. Viewed September 2018, <https://www.aihw.gov.au/reports/hospitals/radiotherapy-in-australia-2016-17/contents/radiotherapy-activity-and-collection-participation>.
Alam N, Chen W, Baker D & Bishop J 2009. Liver cancer in New South Wales. Sydney: Cancer Institute NSW.
American Cancer Society 2018. Chemotherapy for liver cancer. Atlanta, Georgia: American Cancer Society. Viewed September 2018, <https://www.cancer.org/cancer/liver-cancer/treating/chemotherapy.html>.
Amin J, Law MG, Bartlett M, Kaldor JM & Dore GJ 2006. Causes of death after diagnosis of hepatitis B or hepatitis C infection: a large community-based linkage study. The Lancet 368:938–945.
Bagnardi V, Blangiardo M, La Vecchia C & Corrao G 2001a. Alcohol consumption and the risk of cancer: a meta-analysis. Alcohol Research and Health 25(4):263–270.
Bagnardi V, Blangiardo M, La Vecchia C & Corrao G 2001b. A meta-analysis of alcohol drinking and cancer risk. British Journal of Cancer 85:1700–1705.
Bailey CE, Tran Cao HS, Hu CY, Chang GJ, Feig BW, Rodriguez-Bigas MA, et al. 2015. Functional deficits and symptoms of long-term survivors of colorectal cancer treated by multimodality therapy differ by age at diagnosis. Journal of Gastrointestinal Surgery 19:180–188. Beasley RP, Hwang LY, Lin CC & Chien CS 1981. Hepatocellular carcinoma and hepatitis B virus. A prospective study of 22,707 men in Taiwan. The Lancet 2(8256):1129–33.
Benedict C, Rodriguez VM, Carter J, Temple L, Nelson C & DuHamel K 2016. Investigation of body image as a mediator of the effects of bowel and GI symptoms on psychological distress in female survivors of rectal and anal cancer. Support Care Cancer 24:1795–1802.
Birgisson H, Påhlman L, Gunnarsson U & Glimelius B 2007. Late adverse effects of radiation therapy for rectal cancer—a systematic overview. Acta Oncologica 46(4):504–516.
Bowel Cancer Australia 2017. Bowel cancer staging. Sydney: Bowel Cancer Australia. Viewed June 2018, <https://www.bowelcanceraustralia.org/bowel-cancer-staging>.
Bray F, Colombet M, Mery L, Piñeros M, Znaor A, Zanetti R et al. (eds). 2017. Cancer incidence in five continents. Vol. XI (electronic version). Lyon, France: International Agency for Research on Cancer. Viewed June 2018, <http://ci5.iarc.fr>.
Brenner H & Gefeller O 1996. An alternative approach to monitoring cancer patient survival. Cancer 78:2004–10.
Bruix J, Barrera JM, Calvet X, Ercilla G, Costa J, Sanchez-Tapias JM et al. 1989. Prevalence of antibodies to hepatitis C virus in Spanish patients with hepatocellular carcinoma and hepatic cirrhosis. The Lancet 2(8670):1004–06.
Cancer Australia 2017. Principles of cancer survivorship. Sydney: Cancer Australia. Viewed August 2018, <https://canceraustralia.gov.au/system/tdf/publications/principles-cancer-survivorship/pdf/pocs_-_principles_of_cancer_survivorship.pdf?file=1&type=node&id=5341>.
Cancer Council New South Wales 2007. Liver cancer—what is liver cancer? Sydney: Cancer Council NSW. Viewed November 2011, <http://www.cancercouncil.com.au/editorial.asp?pageid=2638>.
Cancer Council Victoria 2016. Treatment for anal cancer. Melbourne: Cancer Council Victoria. Viewed August 2018, <https://www.cancervic.org.au/cancer-information/cancer-types/cancer_types/anal_cancer/anal-cancer-treatment.html>.

168 Colorectal and other digestive-tract cancers
Cancer Council Victoria 2017. Treatment for oesophageal cancer. Melbourne: Cancer Council Victoria. Viewed July 2018, <https://www.cancervic.org.au/cancer-information/cancer-types/cancer_types/stomach_and_oesophageal_cancer/treatment_for_oesophag.html>.
Cancer Research UK 2018. Small intestine cancer incidence statistics. London: Cancer Research UK. Viewed July 2018, <https://www.cancerresearchuk.org/health-professional/cancer-statistics/statistics-by-cancer-type/small-intestine-cancer/incidence#heading-Two>.
Carey S, Laws R, Ferrie S, Young J & Allman-Farinelli M 2013. Struggling with food and eating—life after major upper gastrointestinal surgery. Support Care Cancer 21:2749–2757. Chen Y, Liu L, Wang X, Wang J, Yan Z, Cheng J et al. 2013. Body mass index and risk of gastric cancer: a meta-analysis of a population with more than ten million from 24 prospective studies. Cancer Epidemiology, Biomarkers & Prevention 22(8):1395–1408. Clodfelter KH, Holloway MG, Hodor P, Park SH, Ray WJ & Waxman DJ 2006. Sex-dependent liver gene expression is extensive and largely dependent upon signal transducer and activator of transcription 5b (STAT5b): STAT5b-dependent activation of male genes and repression of female genes revealed by microarray analysis. Molecular Endocrinology 20(6):1333–51. Colombo M, Kuo G, Choo QL, Donato MF, Del Ninno E, Tommasini MA et al. 1989. Prevalence of antibodies to hepatitis C virus in Italian patients with hepatocellular carcinoma. Lancet 2(8670):1006–08.
Forman D & Burley V 2006. Gastric cancer: global pattern of the disease and an overview of environmental risk factors. Best Practice & Research Clinical Gastroenterology 20:633–49.
Gane E 2009. Screening for hepatocellular carcinoma. Cancer Forum 33(2):115–119.
Ganem D & Prince AM 2004. Hepatitis B virus infection—natural history and clinical consequences. New England Journal of Medicine 350:1118–29.
GBD (Global Burden of Disease Study) 2015 Collaborators 2016. Global, regional, and national comparative risk assessment of 79 behavioural, environmental and occupational, and metabolic risks or clusters of risks, 1990–2015: a systematic analysis for the Global Burden of Disease Study 2015. The Lancet 388(10053):S1–4070. doi:10.1016/S0140-6736(16)31679-8.
GESA (Gastroenterological Society of Australia) 2010. Information about Helicobacter pylori (H. pylori). Melbourne: GESA. Viewed August 2018, <http://cart.gesa.org.au/membes/files/Consumer%20Information/H_Pylori.pdf>.
Gusani NJ, Schubart JR, Wise J, Farace E, Green MJ, Jiang Y, et al. 2009. Cancer survivorship: a new challenge for surgical and medical oncologists. Journal of General Internal Medicine 24(Suppl. 2):456–458.
Guy GP, Yabroff KR, Ekwueme DU, Smith AW, Dowling EC, Rechis R et al. 2014. Estimating the health and economic burden of cancer among those diagnosed as adolescents and young adults. Health Affairs 33(6):1024–1031.
Harvard University 2017. Life after cancer. Harvard Health Publications. Special Health Reports. Boston MA, USA: Harvard Health Publications.
Hassan MM, Bondy ML, Wolff RA, Abbruzzese JL, Vauthey JN, Pisters PW et al. 2007. Risk factors for pancreatic cancer: case-control study. The American Journal of Gastroenterology 102(12):2696–2707.
Hundal R & Shaffer EA 2014. Gallbladder cancer: epidemiology and outcome. Clinical Epidemiology 6:99–109.
Colorectal and other digestive-tract cancers 169
Huxley R, Ansary-Moghaddam A, de Gonzalez AB, Barzi F & Woodward M 2005. Type-II diabetes and pancreatic cancer: a meta-analysis of 36 studies. British Journal of Cancer 92:2076–83.
IARC (International Agency for Research on Cancer) 2014. World cancer report 2014. Lyon, France: IARC.
Islami F, Ferlay J, Lortet-Tieulent J, Bray F & Jemal A 2016. International trends in anal cancer incidence rates. International Journal of Epidemiology 46(3):924–938.
Jain K, Sreenivas V, Velpandian T, Kapil U & Garg PK 2013. Risk factors for gallbladder cancer: a case-control study. International Journal of Cancer 132(7):1660–1666.
Jefford M, Karahalios E, Pollard A, Baravelli C, Carey M, Franklin J, et al. 2008. Survivorship issues following treatment completion—results from focus group with Australian cancer survivors and health professionals. Journal of Cancer Survivorship 2:20–32.
Kabat GC, Ng SKC & Wynder EL 1993. Tobacco, alcohol intake, and diet in relation to adenocarcinoma of the esophagus and gastric cardia. Cancer Causes and Control 4(2):123–132.
Kale HP & Carroll NV 2016. Self-reported financial burden of cancer care and its effect on physical and mental health-related quality of life among US cancer survivors. Cancer 122(8):283–289.
Kendall BJ, Wilson LF, Olsen CM, Webb PM, Neale RE, Bain CJ et al. 2015. Cancer in Australia in 2010 attributable to overweight and obesity. Australian and New Zealand Journal of Public Health 39(5):452–457.
Kent EE, Forsythe LP, Yabroff KR, Weaver KE, Moor JS, Rodriguez JL et al. 2013. Are survivors who report cancer‐related financial problems more likely to forgo or delay medical care? Cancer 119(20):3710–3717.
Kirby Institute 2016a. Hepatitis B. New South Wales. Sydney: University of New South Wales—Kirby Institute. Viewed July 2018, <https://data.kirby.unsw.edu.au/hepatitis-b>.
Kirby Institute 2016b. Hepatitis C. New South Wales. Sydney: University of New South Wales—Kirby Institute. Viewed July 2018, <https://data.kirby.unsw.edu.au/hepatitis-c>.
Lim SS, Vox T, Flaxman AD, Danaei G, Shibuya K, Adair-Rohani H et al. 2012. A comparative risk assessment of burden of disease and injury attributable to 67 risk factors and risk factor clusters in 21 regions, 1990–2010: a systematic analysis for the Global Burden of Disease Study 2010. The Lancet 380:2224–2260.
Lochan R, Daly AK, Reeves HL & Charnley RM 2007. Genetic susceptibility in pancreatic ductal adenocarcinoma. British Journal of Surgery 95(1):22–32.
Lynch BM, Steginga SK, Hawkes AL, Pakenham KI & Dunn J 2008. Describing and predicting psychological distress after colorectal cancer. CA: A Cancer Journal for Clinicians 112(6):1363–1370.
MacInnis RJ, English DR, Hopper JL & Giles GG 2006. Body size and composition and the risk of gastric and oesophageal adenocarcinoma. International Journal of Cancer 11:2628–2631.
Macmillan Cancer Support 2018. Radiotherapy for oesophageal cancer. London, UK: Macmillan Cancer Support. Viewed July 2018, <https://www.macmillan.org.uk/information-and-support/oesophageal-gullet-cancer/treating/radiotherapy/radiotherapy-explained/radiotherapy-oesophageal-cancer.html>.
Mitchell H & Katelaris P 2016. Epidemiology, clinical impacts and current clinical management of Helicobacter pylori infection. The Medical Journal of Australia 204(10):376–380.

170 Colorectal and other digestive-tract cancers
Morgan MA 2009. Cancer survivorship: history, quality-of-life issues, and the evolving multidisciplinary approach to implementation of cancer survivorship care plans. Oncology Nursing Forum 36:429–436.
Morris CR, Ramirez CN, Cook SN, Parikh-Patel A, Kizer KW, Bates JH, et al. 2013. Cancer stage at diagnosis. Sacramento CA, USA: California Department of Public Health, California Cancer Registry.
Nagle CM, Wilson LF, Hughes MCB, Ibiebele TI, Miura K, Bain CJ et al. 2015. Cancers in Australia in 2010 attributable to the consumption of red and processed meat. Australian and New Zealand Journal of Public Health 39(5):429–433.
Naugler WE, Sakurai T, Kim S, Maeda S, Kim K, Elsharkawy AM et al. 2007. Gender disparity in liver cancer due to sex differences in MyD88-dependent IL-6 production. Science 317(5834):121–124.
Parkin DM 2001. Global cancer statistics in the year 2000. The Lancet Oncology 2:533–43.
Perz JF, Armstrong GL, Farrington LA, Hutin YJF & Bell BP 2006. The contributions of hepatitis B virus and hepatitis C virus infections to cirrhosis and primary liver cancer worldwide. Journal of Hepatology 45:529–538.
Public Health England 2016. Stage at diagnosis 2012–2014 and one-year cancer survival in England. London, UK: Public Health England. Viewed August 2018, <http://www.ncin.org.uk/publications/survival_by_stage>.
Ramsey S, Blough D, Kirchhoff A, Kreizenbeck K, Fedorenko C, Snell K et al. 2013. Washington State cancer patients found to be at greater risk for bankruptcy than people without a cancer diagnosis. Health Affairs 32(6):1143–1152.
Sheth S, Bedford A & Chopra S 2000. Primary gallbladder cancer: recognition of risk factors and the role of prophylactic cholecystectomy. American Journal of Gastroenterology 95(6):1402–1410.
Stone DS, Ganz PA, Pavlish C & Robbins WA 2017. Young adult cancer survivors and work: a systematic review. Journal of Cancer Survivorship 11:765–781.
Tangkijvanich P, Mahachai V, Suwangool P & Poovorawan Y 2004. Gender difference in clinicopathologic features and survival of patients with hepatocellular carcinoma. World Journal of Gastroenterology 10(11):1547–1550.
Tawk HM, Vickery K, Bisset L, Lo SK, Selby W, Cossart YE et al. 2006. The current pattern of hepatitis B virus infection in Australia. Journal of Viral Hepatitis 13:206–215.
Terrault NA 2002. Sexual activity as a risk factor for hepatitis C. Hepatology 36(5 Supplement 1):S99–105.
Tian J, Chen ZC & Hang LF 2007. Effects of nutritional and psychological status in gastrointestinal cancer patients on tolerance of treatment. World Journal of Gastroenterology 13(30):4136–4140.
Tsunoda A, Nakao K, Hiratsuka K, Yasuda N, Shibusawa M & Kusano M 2005. Anxiety, depression and quality of life in colorectal cancer patients. International Journal of Clinical Oncology 10:411–417.
Tyson GL & El-Serag HB 2011. Risk factors for cholangiocarcinoma. Hepatology 54(1):173–184.
UICC (Union for International Cancer Control) 2016. TNM classification of malignant tumours 8th edn. Chichester, UK: John Wiley and Sons.
Colorectal and other digestive-tract cancers 171
van der Zee RP, Richel O, de Vries HJC & Prins JM 2013. The increasing incidence of anal cancer: can it be explained by trends in risk groups? The Netherlands Journal of Medicine 71(7):401–411.
Vaughan TL, Davis S, Kristal A & Thomas DB 1995. Obesity, alcohol, and tobacco as risk factors for cancers of the esophagus and gastric cardia: adenocarcinoma versus squamous cell carcinoma. Cancer Epidemiology, Biomarkers and Prevention 4(2):85–92.
Wallace MC, Preen DB, Short MW, Adams LA & Jeffrey GP 2018 (in press). Hepatocellular carcinoma in Australia 1982–2014: increasing incidence and improving survival. Liver International.
Waxman DJ & Holloway MG 2009. Sex differences in the expression of hepatic drug metabolizing enzymes. Molecular Pharmacology 76(2):215–228.
WCRF/AICR (World Cancer Research Fund/American Institute for Cancer Research) 2007. Food, nutrition, physical activity, and the prevention of cancer: a global perspective. Washington DC, USA: American Institute of Cancer Research.
WCRF/AICR 2018. Body fatness and weight gain and the risk of cancer. Washington DC, USA: American Institute of Cancer Research.
WCRF (World Cancer Research Fund) 2018. Diet, nutrition, physical activity and cancer: a global perspective. Third expert report. London, UK: WCRF. Viewed July 2018, <https://www.wcrf.org/dietandcancer>.
Weitz J, Koch M, Debus J, Hohler T, Galle PR & Buchler MW 2005. Colorectal cancer. The Lancet 365:153–65.
Wilson LM 2017. After colorectal cancer (CRC) treatment, there is a need for survivorship care. What information do people require who have been treated for CRC, how should it be delivered and by whom? Journal of Stomal Therapy Australia 73(3):13–15.
Yang JD & Roberts LR 2010. Hepatocellular carcinoma: a global view. Nature Reviews: Gastroenterology and Hepatology 7:448–458. Yang P, Zhou Y, Chen B, Wan HW, Jia GQ, Bai HL et al. 2009. Overweight, obesity and gastric cancer risk: results from a meta-analysis of cohort studies. European Journal of Cancer 45(16):2867–2873.
172 Colorectal and other digestive-tract cancers
List of tables Table 1: Incidence and mortality of all digestive-tract cancers combined, 2018 ............................. x
Table 2: Rate ratio by sex and digestive-tract cancers, 2018 ......................................................... x
Table 3: Rate ratio by population groups and digestive-tract cancers, 2018 ............................... xiii
Table 4: Summary of digestive-tract cancers in Australia ............................................................. xv
Table 5: Trend summary for incidence, mortality and 5-year relative survival .............................. xv
Table 2.1: Estimated incidence and mortality (2018) and 5-year relative survival (2010–2014), colorectal cancer, by sex ................................................................................................... 4
Table 2.2: Hospitalisations related to colorectal cancer, by sex, 2016–17 ......................................13
Table 2.3: Number of surgical procedures, colorectal cancer, by sex, 2016–17 .............................14
Table 2.4: Limited-duration prevalence of colorectal cancer, by sex, as at end of 2013 .................15
Table 2.5: Burden of disease from colorectal cancer, by sex, 2011 ................................................16
Table 2.6: Colorectal cancer burden attributed to selected risk factors, 2011 .................................18
Table 3.1: Estimated incidence and mortality (2018) and 5-year relative survival (2010–2014), pancreatic cancer, by sex ................................................................................................19
Table 3.2: Hospitalisations related to pancreatic cancer, by sex, 2016–17 .....................................24
Table 3.3: Number of surgical procedures, pancreatic cancer, by sex, 2016–17 ............................25
Table 3.4: Limited-duration prevalence of pancreatic cancer, by sex, as at end of 2013 ................26
Table 3.5: Burden of disease from pancreatic cancer, by sex, 2011 ...............................................27
Table 3.6: Pancreatic cancer burden attributed to selected risk factors, 2011 ................................27
Table 4.1: Estimated incidence and mortality (2018) and 5-year relative survival (2010–2014), stomach cancer, by sex ...................................................................................................29
Table 4.2: Hospitalisations related to stomach cancer, by sex, 2016–17 ........................................34
Table 4.3: Number of surgical procedures, stomach cancer, by sex, 2016–17 ...............................35
Table 4.4: Limited-duration prevalence of stomach cancer, by sex, as at end of 2013 ...................36
Table 4.5: Burden of disease from stomach cancer, by sex, 2011 ..................................................37
Table 4.6: Stomach cancer burden attributed to selected risk factors, 2011 ...................................37
Table 5.1: Estimated incidence and mortality (2018) and 5-year relative survival (2010–2014), liver cancer, by sex ..........................................................................................................40
Table 5.2: Hospitalisations related to liver cancer, by sex, 2016–17 ...............................................44
Table 5.3: Number of surgical procedures, liver cancer, by sex, 2016–17 ......................................45
Table 5.4: Limited-duration prevalence of liver cancer, by sex, as at end of 2013 ..........................46
Table 5.5: Burden of disease from liver cancer, by sex, 2011 .........................................................47
Table 5.6: Liver cancer burden attributed to selected risk factors, 2011 .........................................48
Table 6.1: Estimated incidence and mortality (2018) and 5-year relative survival (2010–2014), oesophageal cancer, by sex ............................................................................................49
Table 6.2: Hospitalisations related to oesophageal cancer, by sex, 2016–17 .................................54
Table 6.3: Number of surgical procedures, oesophageal cancer, by sex, 2016–17 ........................55

Colorectal and other digestive-tract cancers 173
Table 6.4: Limited-duration prevalence of oesophageal cancer, by sex, as at end of 2013 ............56
Table 6.5: Burden of disease from oesophageal cancer, by sex, 2011 ...........................................57
Table 6.6: Oesophageal cancer burden attributed to selected risk factors, 2011 ............................58
Table 7.1: Estimated incidence and mortality (2018) and 5-year relative survival (2010–2014), cancers of the gallbladder and extrahepatic bile ducts, by sex .......................................59
Table 7.2: Hospitalisations related to cancer of the gallbladder and extrahepatic bile ducts, by sex, 2016–17 ..............................................................................................................64
Table 7.3: Number of surgical procedures, cancer of the gallbladder and extrahepatic bile ducts, by sex, 2016–17 .............................................................................................65
Table 7.4: Limited-duration prevalence of cancer of the gallbladder and extrahepatic bile ducts, by sex, as at end of 2013 ...............................................................................66
Table 7.5: Burden of disease from gallbladder and extrahepatic bile duct cancers, by sex, 2011 .................................................................................................................................67
Table 7.6: Gallbladder cancer burden attributed to selected risk factors (DALYs and proportion), 2011 .................................................................................................................................68
Table 8.1: Estimated incidence and mortality (2018) and 5-year relative survival (2010–2014), cancer of the small intestine, by sex ...............................................................................70
Table 8.2: Hospitalisations related to cancer of the small intestine, by sex, 2016–17 .....................74
Table 8.3: Number of surgical procedures, cancer of the small intestine, by sex, 2016–17 ............75
Table 8.4: Limited-duration prevalence of cancer of the small intestine, by sex, as at end of 2013 .............................................................................................................................76
Table 9.1: Estimated incidence and mortality (2018) and 5-year relative survival (2010–2014), anal cancer, by sex .........................................................................................................78
Table 9.2: Hospitalisations related to anal cancer, by sex, 2016–17 ...............................................82
Table 9.3: Number of surgical procedures, anal cancer, by sex, 2016–17 ......................................84
Table 9.4: Limited-duration prevalence of anal cancer, by sex, as at end of 2013 ..........................84
Table 10.1: Estimated incidence and mortality (2018) and 5-year relative survival (2010–2014), cancer of unspecified digestive organs, by sex ...............................................................87
Table 10.2: Hospitalisations related to cancer of unspecified digestive organs, by sex, 2016–17 ....89
Table 10.3: Limited-duration prevalence of cancer of unspecified digestive organs, by sex, as at end of 2013 .............................................................................................................89
Table A1: Estimated age-specific incidence and mortality rates of upper and lower digestive-tract cancers, by age at diagnosis, 2018 .........................................................90
Table A2: Estimated incidence and mortality of digestive-tract cancers, by site, 2018 ...................90
Table A3: Trends in incidence (1982–2014) and mortality (1982–2016) age-standardised rates of upper and lower digestive-tract cancers, with projections to 2018 ....................91
Table A2.1: Estimated incidence and mortality (2018) and 5-year relative survival (2010–2014) for colorectal cancer, by age group .................................................................................92
Table A2.2: Incidence (1982–2014) and mortality (1982–2016) trends, colorectal cancer, with projections to 2018 ..........................................................................................................93
Table A2.3: Five-year relative survival from digestive-tract cancers and all cancers combined, 1985–1989 to 2010–2014 ...............................................................................................94
Table A2.4: Incidence (2013) and 5-year relative survival (2010–2014) for colorectal cancer, by subsite ........................................................................................................................94
174 Colorectal and other digestive-tract cancers
Table A2.5: Incidence (2013) and 5-year relative survival (2010–2014) for colorectal cancer, by histology group ...........................................................................................................95
Table A2.6: Age-standardised incidence rates (2011) and 5-year relative survival (2011–2016) of colorectal cancer, by RD stage and sex, 2011 ............................................................95
Table A2.7: Five-year relative survival (%) of colorectal cancer, by RD stage and age group, 2011–2016 .......................................................................................................................95
Table A2.8: Age-specific incidence rates of colorectal cancer, by RD stage and age group, 2011 .................................................................................................................................96
Table A2.9: Incidence (2009–2013), mortality (2012–2016) and 5-year relative survival (2007–2014) for digestive-tract cancers, by Indigenous status and cancer type, selected jurisdictions .......................................................................................................97
Table A2.10: Incidence (2009–2013) of digestive-tract cancers, by remoteness and cancer type ......98
Table A2.11: Mortality (2011–2016) of digestive-tract cancers, by remoteness and cancer type ........99
Table A2.12: 5-year observed survival for digestive-tract cancers, by cancer type and remoteness area, 2010–2014 .......................................................................................100
Table A2.13: Incidence (2009–2013) of digestive-tract cancers, by socioeconomic quintile and cancer type ....................................................................................................................101
Table A2.14: Mortality (2011–2016) of digestive-tract cancers, by socioeconomic quintile and cancer type ....................................................................................................................102
Table A2.15: 5-year observed survival for digestive-tract cancers, by cancer type and socioeconomic group, 2010–2014 ................................................................................102
Table A2.16: Colonoscopies in an admitted patient setting, 2016–17 ...............................................103
Table A2.17: Age-specific rate of colorectal tumour related colonoscopies, by age group and principal diagnosis .........................................................................................................104
Table A2.18: Top 10 additional diagnoses listed for colonoscopies for cancer surveillance, 2016–17 .........................................................................................................................104
Table A2.19: Age-standardised rate of colorectal tumour related colonoscopies, 2001–02 to 2016–17 .........................................................................................................................105
Table A2.20: Number of cancer-related hospitalisations, by sex and cancer type, 2016–17 ............106
Table A2.21: Age-specific rates for hospitalisations related to colorectal cancer, by age group and sex, 2016–17 ..........................................................................................................107
Table A2.22: Age-standardised rates for all hospitalisations related to colorectal cancer, by sex, 2001–02 to 2016–17 .....................................................................................................107
Table A2.23: Number of digestive-tract cancer chemotherapy procedures, by sex and cancer type, 2016–17 ................................................................................................................108
Table A2.24: Number of digestive-tract cancer radiotherapy procedures, by sex and principal diagnosis, 2016–17 .......................................................................................................108
Table A2.25: Five-year prevalence of colorectal cancer, by age group and sex, as at end of 2013 ...............................................................................................................................109
Table A2.26: Non-fatal cancer burden (YLD), by cancer phase, 2011 ...............................................109
Table A2.27: Burden of disease from digestive-tract cancers, by age group, 2011 ...........................110
Table A3.1: Estimated incidence and mortality (2018) and 5-year relative survival (2010–2014) for pancreatic cancer, by age group ..............................................................................111
Table A3.2: Incidence (1982–2014) and mortality (1982–2016) trends, pancreatic cancer, with projections to 2018 .................................................................................................112

Colorectal and other digestive-tract cancers 175
Table A3.3: Incidence (2013) and 5-year relative survival (2010–2014), pancreatic cancer, by subsite ......................................................................................................................113
Table A3.4: Incidence (2013) and 5-year relative survival (2010–2014), pancreatic cancer, by histology ....................................................................................................................113
Table A3.5: Age-specific rates for hospitalisations related to pancreatic cancer, by age group and sex, 2016–17 ..........................................................................................................114
Table A3.6: Age-standardised rates for all hospitalisations related to pancreatic cancer, by sex, 2001–02 to 2016–17 .....................................................................................................115
Table A3.7: Five-year prevalence of pancreatic cancer, by age group and sex, as at end of 2013 ...............................................................................................................................115
Table A4.1: Estimated incidence and mortality (2018) and 5-year relative survival (2010–2014) for stomach cancer, by age group .................................................................................116
Table A4.2: Incidence (1982–2014) and mortality (1982–2016) trends, stomach cancer, with projections to 2018 .................................................................................................117
Table A4.3: Incidence (2013) and 5-year relative survival (2010–2014), stomach cancer, by subsite ......................................................................................................................118
Table A4.4: Incidence (2013) and 5-year relative survival (2010–2014), stomach cancer, by histology ....................................................................................................................118
Table A4.5: Age-specific rates for hospitalisations related to stomach cancer, by age group and sex, 2016–17 ..........................................................................................................119
Table A4.6: Age-standardised rates for all hospitalisations related to stomach cancer, by sex, 2001–02 to 2016–17 .....................................................................................................120
Table A4.7: Five-year prevalence of stomach cancer, by age group and sex, as at end of 2013 ...120
Table A5.1: Estimated incidence and mortality (2018) and 5-year relative survival (2010–2014) for liver cancer, by age group ........................................................................................121
Table A5.2: Incidence (1982–2014) and mortality (1982–2016) trends, liver cancer, with projections to 2018 ........................................................................................................122
Table A5.3: Incidence (2013) and 5-year relative survival (2010–2014), liver cancer, by subsite ......................................................................................................................123
Table A5.4: Incidence (2013) and 5-year relative survival (2010–2014), liver cancer, by histology ....................................................................................................................123
Table A5.5: Age-specific rates for hospitalisations related to liver cancer, by age group and sex, 2016–17 .................................................................................................................123
Table A5.6: Age-standardised rates for all hospitalisations related to liver cancer, by sex, 2001–02 to 2016–17 .....................................................................................................124
Table A5.7: Five-year prevalence of liver cancer, by age group and sex, as at end of 2013 ..........124
Table A6.1: Estimated incidence and mortality (2018) and 5-year relative survival (2010–2014) for oesophageal cancer, by age group ..........................................................................125
Table A6.2: Incidence (1982–2014) and mortality (1982–2016) trends, oesophageal cancer, with projections to 2018 .................................................................................................126
Table A6.3: Incidence (2013) and 5-year relative survival (2010–2014), oesophageal cancer, by subsite ......................................................................................................................127
Table A6.4: Incidence (2013) and 5-year relative survival (2010–2014), oesophageal cancer, by histology ....................................................................................................................127
176 Colorectal and other digestive-tract cancers
Table A6.5: Age-specific rates for hospitalisations related to oesophageal cancer, by age group and sex, 2016–17 ..........................................................................................................128
Table A6.6: Age-standardised rates for all hospitalisations related to oesophageal cancer, by sex, 2001–02 to 2016–17 .........................................................................................129
Table A6.7: Five-year prevalence of oesophageal cancer, by age group and sex, as at end of 2013 ...............................................................................................................................129
Table A7.1: Estimated incidence and mortality (2018) and 5-year relative survival (2010–2014) for gallbladder and extrahepatic bile duct cancers, by age group .................................130
Table A7.2: Incidence (1982–2014) and mortality (1982–2016) trends, gallbladder and extrahepatic bile duct cancers, with projections to 2018 ...............................................131
Table A7.3: Incidence (2013) and 5-year relative survival (2010–2014), gallbladder and extrahepatic bile duct cancers, by subsite ....................................................................132
Table A7.4: Incidence (2013) and 5-year relative survival (2010–2014), gallbladder and extrahepatic bile duct cancers, by histology ..................................................................132
Table A7.5: Age-specific rates for hospitalisations related to cancer of the gallbladder and extrahepatic bile ducts, by age group and sex, 2016–17 ..............................................133
Table A7.6: Age-standardised rates for all hospitalisations related to cancer of the gallbladder and extrahepatic bile ducts, by sex, 2001–02 to 2016–17 ............................................134
Table A7.7: Five-year prevalence of cancer of the gallbladder and extrahepatic bile ducts, by age group and sex, as at end of 2013 ......................................................................134
Table A8.1: Estimated incidence and mortality (2018) and 5-year relative survival (2010–2014) for small intestine cancer, by age group .......................................................................135
Table A8.2: Incidence (1982–2014) and mortality (1982–2016) trends, small intestine cancer, with projections to 2018 .................................................................................................136
Table A8.3: Incidence (2013) and 5-year relative survival (2010–2014), small intestine cancer, by subsite ......................................................................................................................137
Table A8.4: Incidence (2013) and 5-year relative survival (2010–2014), small intestine cancer, by histology ....................................................................................................................137
Table A8.5: Age-specific rates for hospitalisations related to cancer of the small intestine, by age group and sex, 2016–17 ....................................................................................138
Table A8.6: Age-standardised rates for all hospitalisations related to cancer of the small intestine, by sex, 2001–02 to 2016–17 .........................................................................139
Table A8.7: Five-year prevalence of cancer of the small intestine, by age group and sex, as at end of 2013 ....................................................................................................................139
Table A9.1: Estimated incidence and mortality (2018) and 5-year relative survival (2010–2014) for anal cancer, by age group ........................................................................................140
Table A9.2: Incidence (1982–2014) and mortality (1982–2016) trends, anal cancer, with projections to 2018 ........................................................................................................141
Table A9.3: Incidence (2013) and 5-year relative survival (2010–2014), anal cancer, by subsite ......................................................................................................................142
Table A9.4: Incidence (2013) and 5-year relative survival (2010–2014), anal cancer, by histology ....................................................................................................................142
Table A9.5: Age-specific rates for hospitalisations related to anal cancer, by age group and sex, 2016–17 .........................................................................................................................143
Table A9.6: Age-standardised rates for all hospitalisations related to anal cancer, by sex, 2001–02 to 2016–17 .....................................................................................................144

Colorectal and other digestive-tract cancers 177
Table A9.7: Five-year prevalence of anal cancer, by age group and sex, as at end of 2013 ..........144
Table A10.1: Incidence (1982–2014) and mortality (1982–2016) trends, cancer of unspecified digestive organs, with projections to 2018 ....................................................................145
Table A10.2: Age-standardised rates for all hospitalisations related to cancer of unspecified digestive organs, by sex, 2001–02 to 2016–17 .............................................................146
Table B1: Subsites for digestive-tract, by cancer type ..................................................................147
Table B2: Histology groupings for digestive-tract cancers, by cancer type ...................................149
Table C1: Data sources .................................................................................................................150
Table D1: Definition of digestive-tract cancer-related hospitalisations ..........................................154
Table D2: Definition of colonoscopies ............................................................................................154
Table D3: Definition of principal and additional diagnosis codes for colorectal tumour-related colonoscopies ................................................................................................................155
Table D4: Definition of surgical procedures for colorectal cancer .................................................155
Table D5: Definition of surgical procedures for pancreatic cancer ................................................157
Table D6: Definition of surgical procedures for stomach cancer ...................................................157
Table D7: Definition of surgical procedures for liver cancer ..........................................................157
Table D8: Definition of surgical procedures for oesophagus cancer .............................................158
Table D9: Definition of surgical procedures for cancer of the gallbladder and extrahepatic bile ducts .......................................................................................................................159
Table D10: Definition of surgical procedures for small intestine cancer ..........................................160
Table D11: Definition of surgical procedures for anal cancer ..........................................................160
Table D12: Definition of chemotherapy procedures for digestive-tract cancer-related hospitalisations ..............................................................................................................160
178 Colorectal and other digestive-tract cancers
List of figures Figure 1: Estimated age-specific incidence and mortality rates of upper and lower
digestive-tract cancers, by age at diagnosis, 2018 .......................................................... xi
Figure 2: Estimated incidence and mortality of digestive-tract cancers, by site, 2018 .................... xi
Figure 3: Age-standardised incidence rates of colorectal cancer, by RD stage, 2011 .................. xii
Figure 4: Incidence trends (1982–2014) and mortality trends (1982–2016) for upper and lower digestive-tract cancers, with projections to 2018 ............................................................ xii
Figure 5: Five-year relative survival from digestive-tract cancers and all cancers combined, 1985–1989 to 2010–2014 .............................................................................................. xiii
Figure 1.1: The organs of the digestive-tract system .......................................................................... 2
Figure 2.1: Estimated age-specific incidence and mortality (2018) rates and 5-year relative survival (2010–2014) for colorectal cancer, by age group ................................................ 5
Figure 2.2: Incidence trends for colorectal cancer, 1982–2014, with projections to 2018 .................. 5
Figure 2.3: Mortality trends for colorectal cancer, 1982–2016, with projections to 2018 .................... 6
Figure 2.4: Five-year relative survival from colorectal cancer, all digestive-tract cancers combined and all cancers combined, 1985–1989 to 2010–2014 ...................................... 6
Figure 2.5: Incidence (2013) and 5-year relative survival (2010–2014) for colorectal cancer, by subsite .......................................................................................................................... 7
Figure 2.6: Incidence (2013) and 5-year relative survival (2010–2014) for colorectal cancer, by histology ........................................................................................................................ 8
Figure 2.7: Age-standardised incidence rates (2011) and 5-year relative survival (2011–2016) of colorectal cancer, by RD stage and sex ........................................................................ 8
Figure 2.8: Age-specific incidence rates of colorectal cancer, by RD stage and age group, 2011 ..... 9
Figure 2.9: Five-year relative survival of colorectal cancer, by RD stage and age group, 2011–2016 ......................................................................................................................... 9
Figure 2.10: Age-specific rate of colorectal tumour related colonoscopies, 2016–17 .........................12
Figure 2.11: Age-standardised rate of colorectal tumour-related colonoscopies, 2001–02 to 2016–17 ...........................................................................................................................12
Figure 2.12: Age-specific rates of hospitalisations related to colorectal cancer, by age group and sex, 2016–17 ............................................................................................................13
Figure 2.13: All colorectal cancer-related hospitalisations, by sex, 2001–02 to 2016–17 ..................14
Figure 2.14: Five-year prevalence of colorectal cancer, by age group, as at end of 2013 .................16
Figure 3.1: Estimated age-specific incidence and mortality (2018) rates and 5-year relative survival (2010–2014) for pancreatic cancer, by age group .............................................20
Figure 3.2: Incidence trends for pancreatic cancer, 1982–2014, with projections to 2018 ...............20
Figure 3.3: Mortality trends for pancreatic cancer, 1982–2016, with projections to 2018 .................21
Figure 3.4: Five-year relative survival from pancreatic cancer, all digestive-tract cancers combined and all cancers combined, 1985–1989 to 2010–2014 ....................................21
Figure 3.5: Incidence (2013) and 5-year relative survival (2010–2014) for cancer of the exocrine pancreas, by subsite .........................................................................................22
Figure 3.6: Incidence (2013) and 5-year relative survival (2010–2014) for pancreatic cancer, by histology ......................................................................................................................22

Colorectal and other digestive-tract cancers 179
Figure 3.7: Age-specific rates for hospitalisations related to pancreatic cancer, by age group and sex, 2016–17 ............................................................................................................24
Figure 3.8: All pancreatic cancer-related hospitalisations, by sex, 2001–02 to 2016–17 .................25
Figure 3.9: Five-year prevalence of pancreatic cancer, by age group, as at end of 2013 ................26
Figure 4.1: Estimated age-specific incidence and mortality (2018) rates and 5-year relative survival (2010–2014) for stomach cancer, by age group ................................................30
Figure 4.2: Incidence trends for stomach cancer, 1982–2014, with projections to 2018 ..................30
Figure 4.3: Mortality trends for stomach cancer, 1982–2016, with projections to 2018 ....................31
Figure 4.4: Five-year relative survival for stomach cancer, all digestive-tract cancers combined and all cancers combined, 1985–1989 to 2010–2014 ....................................................31
Figure 4.5: Incidence (2013) and 5-year relative survival (2010–2014) for stomach cancer, by subsite ........................................................................................................................32
Figure 4.6: Incidence (2013) and 5-year relative survival (2010–2014) for stomach cancer, by histology .....................................................................................................................32
Figure 4.7: Age-specific rates of hospitalisations related to stomach cancer, by age group and sex, 2016–17 ...................................................................................................................34
Figure 4.8: All stomach cancer-related hospitalisations, by sex, 2001–02 to 2016–17 ....................34
Figure 4.9: Five-year prevalence of stomach cancer, by age group, as at end of 2013 ...................36
Figure 5.1: Estimated age-specific incidence and mortality (2018) rates and 5-year relative survival (2010–2014) for liver cancer, by age group .......................................................40
Figure 5.2: Incidence trends for liver cancer, 1982–2014, with projections to 2018 .........................41
Figure 5.3: Mortality trends for liver cancer, 1982–2016, with projections to 2018 ...........................41
Figure 5.4: Five-year relative survival for liver cancer, all digestive-tract cancers combined and all cancers combined, 1985–1989 to 2010–2014 ...........................................................42
Figure 5.5: Incidence (2013) and 5-year relative survival (2010–2014) for liver cancer, by subsite ........................................................................................................................42
Figure 5.6: Incidence (2013) and 5-year relative survival (2010–2014) for liver cancer, by histology ......................................................................................................................43
Figure 5.7: Age-specific rates of hospitalisations related to liver cancer, by age group and sex, 2016–17 ...........................................................................................................................44
Figure 5.8: All liver cancer-related hospitalisations, by sex, 2001–02 to 2016–17 ...........................45
Figure 5.9: Five-year prevalence of liver cancer, by age group, as at end of 2013 ..........................46
Figure 6.1: Estimated age-specific incidence and mortality (2018) rates and 5-year relative survival (2010–2014) for oesophageal cancer, by age group .........................................50
Figure 6.2: Incidence trends for oesophageal cancer, 1982–2014, with projections to 2018 ...........50
Figure 6.3: Mortality trends for oesophageal cancer, 1982–2016, with projections to 2018 .............51
Figure 6.4: Five-year relative survival for oesophageal cancer, all digestive-tract cancers combined and all cancers combined, 1985–1989 to 2010–2014 ....................................51
Figure 6.5: Incidence (2013) and 5-year relative survival (2010–2014) for oesophageal cancer, by subsite ........................................................................................................................52
Figure 6.6: Incidence (2013) and 5-year relative survival (2010–2014) for oesophageal cancer, by histology ......................................................................................................................52
180 Colorectal and other digestive-tract cancers
Figure 6.7: Age-specific rates of hospitalisations related to oesophageal cancer, by age group and sex, 2016–17 ............................................................................................................54
Figure 6.8: All oesophageal cancer-related hospitalisations, by sex, 2001–02 to 2016–17 .............54
Figure 6.9: Five-year prevalence of oesophageal cancer, by age group, as at end of 2013 ............56
Figure 7.1: Estimated age-specific incidence and mortality (2018) rates and 5-year relative survival (2010–2014) for cancer of the gallbladder and extrahepatic bile ducts, by age group....................................................................................................................60
Figure 7.2: Incidence trends for cancer of the gallbladder and extrahepatic bile ducts, 1982–2014, with projections to 2018 ..............................................................................60
Figure 7.3: Mortality trends for cancer of the gallbladder and extrahepatic bile ducts, 1982–2016, with projections to 2018 ..............................................................................61
Figure 7.4: Five-year relative survival from cancer of the gallbladder and extrahepatic bile ducts, all digestive-tract cancers combined and all cancers combined, 1985–89 to 2010–14 .......................................................................................................61
Figure 7.5: Incidence (2013) and 5-year relative survival (2010–2014) for cancer of the gallbladder and extrahepatic bile ducts, by subsite .........................................................62
Figure 7.6: Incidence (2013) and 5-year relative survival (2010–2014) for cancer of the gallbladder and extrahepatic bile ducts, by histology ......................................................62
Figure 7.7: Age-specific rates of hospitalisations related to cancer of the gallbladder and extrahepatic bile ducts, by age group and sex, 2016–17 ................................................64
Figure 7.8: All hospitalisations related to cancer of the gallbladder and extrahepatic bile ducts, by sex, 2001–02 to 2016–17 ...........................................................................................65
Figure 7.9: Five-year prevalence of cancer of the gallbladder and extrahepatic bile ducts, by age group, as at end of 2013. ....................................................................................66
Figure 8.1: Estimated age-specific incidence and mortality (2018) rates and 5-year relative survival (2010–2014) for cancer of the small intestine, by age group.............................70
Figure 8.2: Incidence trends for cancer of the small intestine, 1982–2014, with projections to 2018 .................................................................................................................................71
Figure 8.3: Mortality trends for cancer of the small intestine, 1982–2016, with projections to 2018 .................................................................................................................................71
Figure 8.4: Five-year relative survival for cancer of the small intestine, all digestive-tract cancers combined and all cancers combined, 1985–1989 to 2010–2014 ......................72
Figure 8.5: Incidence (2013) and 5-year relative survival (2010–2014) for cancer of the small intestine, by subsite .........................................................................................................72
Figure 8.6: Incidence (2013) and 5-year relative survival (2010–2014) for cancer of the small intestine, by histology ......................................................................................................73
Figure 8.7: Age-specific rates of hospitalisations related to cancer of the small intestine, by age group and sex, 2016–17 ..................................................................................................74
Figure 8.8: All hospitalisations related to cancer of the small intestine, by sex, 2001–02 to 2016–17 ...........................................................................................................................75
Figure 8.9: Five-year prevalence of cancer of the small intestine, by age group, as at end of 2013 .................................................................................................................................76
Figure 9.1: Estimated age-specific incidence and mortality (2018) rates and 5-year relative survival (2010–2014) for anal cancer, by age group .......................................................79
Figure 9.2: Incidence trends for anal cancer, 1982–2014, with projections to 2018 .........................79

Colorectal and other digestive-tract cancers 181
Figure 9.3: Mortality trends for anal cancer, 1982–2016, with projections to 2018 ...........................80
Figure 9.4: Five-year relative survival for anal cancer, all digestive-tract cancers combined and all cancers combined, 2010–2014 ..................................................................................80
Figure 9.5: Incidence (2013) and 5-year relative survival for anal cancer (2010–2014), by subsite ........................................................................................................................81
Figure 9.6: Incidence (2013) and 5-year relative survival (2010–2014) for anal cancer, by histology ..........................................................................................................................81
Figure 9.7: Age-specific rates of hospitalisations related to anal cancer, by age group and sex, 2016–17 ...........................................................................................................................83
Figure 9.8: All anal cancer-related hospitalisations, by sex, 2001–02 to 2016–17 ...........................83
Figure 9.9: Five-year prevalence of anal cancer, by age group, as at end of 2013 ..........................85
Figure 10.1: Incidence trends for cancer of unspecified digestive organs, 1982–2014, with projections to 2018 ..........................................................................................................87
Figure 10.2: Mortality trends for cancer of unspecified digestive organs, 1982–2016, with projections to 2018 ..........................................................................................................88
Figure 10.3: Five-year relative survival from cancer of unspecified digestive organs, all digestive-tract cancers combined and all cancers combined, 2010–2014 .....................88
Figure 10.4: All hospitalisations related to cancer of unspecified digestive organs, by sex, 2001–02 to 2016–17 .......................................................................................................89
182 Colorectal and other digestive-tract cancers
Related publications The following AIHW publications relating to cancer might be of interest:
• AIHW 2018. Cancer in Aboriginal and Torres Strait Islander people of Australia.Web report. Cat. no. CAN 109. Canberra: AIHW. Viewed September 2018,<https://www.aihw.gov.au/reports/cancer/cancer-in-indigenous-australians/contents/table-of-contents>.
• AIHW 2018. Cancer in adolescents and young adults in Australia. Cat. no. CAN 110.Canberra: AIHW.
• AIHW 2017. Brain and other central nervous system cancers. Cat. no. CAN 106.Canberra: AIHW.
• AIHW 2017. Cancer in Australia 2017. Cancer series no. 101. Cat. no. CAN 100.Canberra: AIHW.
• AIHW 2016. Skin cancer in Australia. Cat. no. CAN 96. Canberra: AIHW.• AIHW 2015. Breast cancer in young women: key facts about breast cancer in women
in their 20s and 30s. Cancer series no. 96. Cat. no. CAN 94. Canberra: AIHW.• AIHW 2014. Head and neck cancers in Australia. Cancer series no. 83. Cat. no. CAN 80.
Canberra: AIHW.
Stronger evidence,better decisions,improved health and welfare
Stronger evidence, better decisions, improved health and welfare
Digestive-tract cancers are estimated to account for about 2 in 10 of all cancers diagnosed and nearly 3 in 10 cancer deaths. A person’s chance of surviving depends on the type of digestive-tract cancer: colorectal cancer (the most common digestive-tract cancer) had the highest 5-year relative survival rate (69%), while pancreaticcancer (the second most common digestive-tract cancer)had the lowest 5-year relative survival of all specifieddigestive cancers (8.7%).
aihw.gov.au
Colorectal and other gastrointestinal cancers
Colorectal and other gastrointestinal cancersA
IHW