The composition and interests of Russia’s business lobbies ... and Solanko... · Rise and Decline...
23
Public Choice (2013) 155:19–41 DOI 10.1007/s11127-011-9823-x The composition and interests of Russia’s business lobbies: testing Olson’s hypothesis of the “encompassing organization” William Pyle · Laura Solanko Received: 14 March 2011 / Accepted: 2 July 2011 / Published online: 20 July 2011 © Springer Science+Business Media, LLC 2011 Abstract Why are some business lobbies less benign in their external effects than others? In The rise and decline of nations (New Haven: Yale University Press, 1982), Mancur Olson proposed that less-encompassing groups—i.e., those whose constituents collectively repre- sent a relatively narrow range of interests—have a greater interest in seeking the types of subsidies, tariffs, tax loopholes, and competition-limiting regulations that, while benefiting their members, impose costs on the rest of society. By drawing on a unique pair of surveys— one targeted to managers of Russian regional lobbies, and the other addressed to managers of Russian industrial enterprises—we provide what we believe to be the most direct test of this hypothesis to date. The pattern of responses is striking. Managers of both the less encompassing lobbies and the enterprises belonging to those types of organizations display stronger preferences for narrowly targeted policy interventions. Our results, that is, strongly support Olson’s hypothesis. Keywords Mancur Olson · Business lobbies · Lobbying · Encompassing · Russia JEL Classification D71 · D72 1 Introduction Some business lobbies promote their constituents’ interests by pursuing policies that im- pose costs on non-members. Alternatively, others’ advocacy efforts may be more benign to outsiders (Doner and Schneider 2000). Much of the literature on business lobbies does not acknowledge this potential diversity. And that does offers little guidance as to where on this spectrum we might expect to find a given group. Mancur Olson’s work is an exception, W. Pyle ( ) Middlebury College, Middlebury, VT, USA e-mail: [email protected] L. Solanko Bank of Finland Institute for Economies in Transition, Helsinki, Finland
Transcript of The composition and interests of Russia’s business lobbies ... and Solanko... · Rise and Decline...
Public Choice (2013) 155:19–41DOI 10.1007/s11127-011-9823-x
The composition and interests of Russia’s businesslobbies: testing Olson’s hypothesis of the “encompassingorganization”
William Pyle · Laura Solanko
Received: 14 March 2011 / Accepted: 2 July 2011 / Published online: 20 July 2011© Springer Science+Business Media, LLC 2011
Abstract Why are some business lobbies less benign in their external effects than others?In The rise and decline of nations (New Haven: Yale University Press, 1982), Mancur Olsonproposed that less-encompassing groups—i.e., those whose constituents collectively repre-sent a relatively narrow range of interests—have a greater interest in seeking the types ofsubsidies, tariffs, tax loopholes, and competition-limiting regulations that, while benefitingtheir members, impose costs on the rest of society. By drawing on a unique pair of surveys—one targeted to managers of Russian regional lobbies, and the other addressed to managersof Russian industrial enterprises—we provide what we believe to be the most direct testof this hypothesis to date. The pattern of responses is striking. Managers of both the lessencompassing lobbies and the enterprises belonging to those types of organizations displaystronger preferences for narrowly targeted policy interventions. Our results, that is, stronglysupport Olson’s hypothesis.
Keywords Mancur Olson · Business lobbies · Lobbying · Encompassing · Russia
JEL Classification D71 · D72
1 Introduction
Some business lobbies promote their constituents’ interests by pursuing policies that im-pose costs on non-members. Alternatively, others’ advocacy efforts may be more benignto outsiders (Doner and Schneider 2000). Much of the literature on business lobbies doesnot acknowledge this potential diversity. And that does offers little guidance as to where onthis spectrum we might expect to find a given group. Mancur Olson’s work is an exception,
W. Pyle (�)Middlebury College, Middlebury, VT, USAe-mail: [email protected]
L. SolankoBank of Finland Institute for Economies in Transition, Helsinki, Finland

20 Public Choice (2013) 155:19–41
laying out a testable hypothesis as to why lobby groups differ in the extent to which theirpolicy preferences align with social welfare. In The rise and decline of nations (1982), hisseminal book on comparative development in the post-war era, Olson distinguished interestgroups by the degree to which their constituents collectively represent a broad cross-sectionof a community. Organizations that are less encompassing in this sense are more apt, hepostulated, to prefer narrowly tailored policies—e.g., subsidies, tariffs, tax loopholes andcompetition-limiting regulations—that impose costs on the rest of society and ultimatelyretard economic growth.Was Olson right? Though a rich literature addresses how socially sub-optimal institu-
tions may result from the interaction of self-interested lobbies and public officials, large-Nstudies that link lobby group scope to preferences for redistributive policies are surprisinglyfew. The reason, no doubt, relates to the absence of adequate data for assessing variationacross lobby groups.1 Here, we take a step in addressing this noteworthy gap in the litera-ture. A unique pair of surveys, administered in the Russian Federation and targeting bothregional business lobbies and their constituents, allow us to provide the most direct test ofOlson’s hypothesis of encompassingness yet conducted. Managers of both were asked aset of questions that explored their preferences for policies that would benefit sectoral orregional interests and implicitly impose external costs. The broadly posed questions ref-erence neither specific sectors nor regions (e.g., those associated with the respondent) butrather address targeted policy interventions in general terms. The pattern of responses isstriking. Managers of both the less-encompassing lobbies and the firms belonging to less-encompassing groups are apt to view redistributive policies in a relatively favorable light.More encompassing lobby groups and the members of such organizations, on the other hand,exhibited more skepticism. Responses from the two surveys, in other words, point in thesame direction.To the extent that their policy preferences reflect the organizations over which they
preside, the responses of lobby group managers provide support for Olson’s hypoth-esis. Those of enterprise managers offer reassuring confirmation but also take us be-yond the logic explicitly laid out in The rise and decline of nations. Olson sought toexplain the heterogeneity of group interests as a function of group scope (or encom-passingness). He did not, however, consider explicitly how differences in group prefer-ences might extend to, and even reflect, the preferences of individual constituents. Hisarguments, however, could reasonably be extended to include the corollary that a groupmember is more likely than a non-member, all else equal, to share its group’s prefer-ences. Two factors could explain why. Enterprises might well select into organizationsthat share and promote their preferences. Or their preferences may be shaped over timeby the organizations to which they belong (DiMaggio and Powell 1991; Martin 1995;Martin and Swank 2004). Though we provide what we feel is the literature’s most directtest of Olson’s hypothesis of the “encompassing organization,” our data do not allow usto distinguish between these two explanations for this corollary. Additionally, we are un-able to establish that the relationship between a lobby group’s scope and its preferences iscausal. The fact that less-encompassing lobbies prefer targeted government interventions,that is, may not be because they are less encompassing; it may be that firms with strongerredistributionist preferences are just more apt to establish less broad-based organizations.
1Gray and Lowery (1988) highlight the data inadequacies of first-generation empirical tests of Olson’sRise and Decline theories in part for ignoring the important distinction between encompassing and non-encompassing groups. The paucity of adequate data for testing Olson’s theories has been noted, as well, inrecently completed studies (Coates et al. 2011). Horgos and Zimmermann (2009), for instance, acknowledgetheir inability to distinguish business lobbies based on their degree of encompassingness.
Public Choice (2013) 155:19–41 21
Our article proceeds as follows. Section 2 presents a fuller discussion of the relevantliterature to which we believe this article contributes. Section 3 provides a brief summaryof the development of business lobbies in Russia’s post-communist era. The unique Russiansurvey data that we draw on for the empirical analysis is presented in Sect. 4 as are datadesigned to provide a picture of the importance of business lobby groups to the business-state interface. Section 5 comprises the heart of the paper. We present the questions used toassess firms’ policy preferences and then we explore the degree to which the responses—from both lobby groups and member firms—relate to group composition. Section 6 brieflyconsiders the relative importance of different services offered by these organizations beforeSect. 7 presents conclusions.
2 Lobby groups: scope and interests
When Olson observed that business lobbies advocate for policies that enhance their mem-bers’ welfare at the expense of society, he added an important caveat:
[In] organizations that encompass a substantial portion of the societies of which theyare a part. . . the incentives. . . are dramatically different from those facing an organi-zation that represents only a narrow segment of society. . . [T]he encompassing orga-nization, if it has rational leadership, will care about the excess burden arising fromdistributional policies favorable to its members and will out of sheer self-interest striveto make the excess burden as small as possible. . . . (Olson 1982: 48)
Preferences for government policies that either create barriers to trade or prioritize somesectors over others should be weaker, that is, within organizations that represent a largershare of the economic landscape.2
In highlighting the differences across collective action groups, Olson never wholly com-mits to a single metric for assessing how encompassing are the interests of a particularorganization. In the relevant section of Rise and Decline, he points initially to the degree towhich a group’s constituents own (or represent) the “income-producing capacity” of a soci-ety. But he subsequently qualifies this characterization by suggesting that a business lobbythat merely adds firms from a sector that it already represents need not develop a moreencompassing interest.
There is, in addition, little or no gain in concern for the society as a whole when aspecial-interest organization expands from, say, firm to industry size. . . . The circum-stance in which an increase in the extent to which a special-interest organization isencompassing is likely to be most constructive is when it is already so substantial thatit encompasses many different industries. At that stage further expansion. . . wouldcreate an incentive to give greater weight to the organization’s impact on social effi-ciency. (Olson 1982: 50)
Olson thus links greater sectoral diversity within an organization to the probability that itexpresses interests more in line with social welfare. Jankowski (1988, 1989) echoes thispoint, arguing that the essence of an Olsonian encompassing organization lies in the numberof sectors (not in the percentage of aggregate income) that its members represent.
2This distinction between distributional coalitions and encompassing coalitions, has been seen as one of the“crucial innovations” of Olson’s Rise and Decline (Rosser 2007).

22 Public Choice (2013) 155:19–41
Olson goes on to suggest that organizations with more encompassing interests have agreater incentive to develop ties to other organized interests. Groups whose concerns aremore closely aligned with social welfare are more apt to find like-minded allies within thelarger pool of organized interests. Moreover, the subsequent inter-group cooperation mayproduce policy preferences and lobbying efforts, which, because they are based on the unionof multiple groups, are even more pro-social than those of the single group.3
The characteristics that Olson identifies with more encompassing groups dovetail nicelywith questions from our surveys. Association managers are asked which sectors are repre-sented in their membership (and in what proportions) and whether or not their associationwas founded wholly or in part by another lobby. The enterprise survey asks lobby memberswhether they belong to a multi-sector and/or a sector-specific group.Much of the research inspired by Olson’s analysis of interest groups and their influence
on policy and economic outcomes overlooks the important distinction that he made betweenmore and less encompassing groups. Instead, it effectively treats groups as homogeneousin the extent to which their interests align with social welfare. The formal modeling lit-erature, for instance, demonstrates that welfare-reducing government interventions can bean equilibrium outcome in a world in which business interests bid for self-benefiting sup-port from public officials (Grossman and Helpman 1994, 1996, 2001; Felli and Merlo 2006;Baldwin and Robert-Nicoud 2007). But this line of research explores neither the sources of,nor the variation in, lobby preferences for targeted government intervention.4
Owing to data limitations, much of the empirical literature effectively ignores this sortof group-level heterogeneity as well. A number of Olson-inspired studies, for instance, usecross-sectional data to explore the relationship between the simple number of registeredinterest groups and various macro-level measures, effectively disregarding potential differ-ences across groups in composition, policy preferences and influence (Heckelman 2007;Coates and Heckelman 2003; Coates et al. 2011).5 Instead, most discussions of the en-compassing organization hypothesis have been based on case-study evidence (Lehner 1983;Doner and Schneider 2000).
3Such an organization, he writes: “[H]as not only an incentive at least to consider the effect of its policieson the efficiency of the society, but also an incentive to bargain with other substantial organized groups inthe interest of a more productive society. The really narrow special-interest group usually does not have anincentive to do so (Olson 1982: 48).”4Much of the work on special interest group (SIG) politics assumes that the preferences of lobbies are ex-ogenously given. This holds for both the theoretical (Becker 1983; Grossman and Helpman 1994, 2001)and empirical literatures (Potters and Sloof 1996; Goldberg and Maggi 1999). Recent literature on cam-paign finance in the United States (Stratmann 2005; Ansolabehere et al. 2003) takes the preferencesof SIGs as given, even though they are assumed to differ in their policy aims. The size of a lobbygroup may matter for campaign finance. Bombardini and Trebbi (2011) uncover a non-linear relation-ship between SIG contributions and voting shares in a jurisdiction. Another strand in the literature ex-amines the interaction between SIG contributions, private information and voting strategies (Coate 2004;Houser and Stratmann 2008; Larcinese et al. 2011). The literature on campaign spending limits (Milligan andRekkas 2008) also does not address the origin of SIG preferences. Based on a cross-county examination intransition economies, Campos and Giovannoni (2007) analyze other characteristics of SIG members but theydo not have data on the policy preferences of either the members or the lobbies themselves.5Such studies not only treat all lobby groups as equal in their potential growth effects, in the absence of dataon policy preferences or policies, they cannot explore the fundamental link that Olson hypothesized connectedthe presence of lobby groups and macro-economic outcomes. A related literature explores the determinantsof interest group numbers at the country level (Murrell 1984; Bischoff 2003). In an implicit endorsement ofour approach here, the most recent of these studies suggests that more cross-country studies like these maynot be useful for testing Olson’s ideas: “A microeconomic rather than a macroeconomic approach may yieldthe most fruitful next steps. . . [to explore] the mechanisms underlying [Olson’s] implications. . .” (Coates etal. 2011).

Public Choice (2013) 155:19–41 23
The article that most closely resembles ours in the sense of addressing why differentlobby groups might impose different external costs also draws on regional and firm-leveldata from contemporary Russia. As do we, Guriev et al. (2010) recognize that the relativelyhigh degree of regional variation in the Russian Federation makes its political economy anideal testing ground for this type of question.6 Their approach, however, differs from oursin at least two important respects. First, unlike us, they do not consider Olsonian groupsof firms bound by membership in voluntarily-comprised, non-for-profit associations.7 In-stead, they focus on groups of firms joined by overlapping ownership in conglomerate-like,profit-motivated structures, some of which draw in firms from across multiple regions andsome of which are concentrated in a single region. Second, they do not directly observepolicy preferences. Instead, they observe their potential effects by demonstrating that firmsin regions bordered by multi-regional groups are more apt to perform better than firms inregions bordered by mono-regional groups. They infer from this that multi-regional groupsare more apt to consider the external effects of the regional laws and regulations whose na-ture they are in a position to influence. We thus interpret our efforts here as complementaryto theirs in the sense that we both uncover evidence, ours more direct than theirs, that morebroadly representative groups are more sensitive to the negative external effects of targetedgovernment policies.8
3 Russia’s business lobbies
Many of the first Russian business associations grew up to lobby for the interests of smallprivate initiatives that were permitted during the late Soviet period.9 Others that date backto this era were organized by large state enterprises that shared an interest in preservinginter-firm ties and access to state subsidies as the mechanisms of centralized economic co-ordination evaporated. Some were first established from the top down by ministry officialsas their own hedge against the uncertainty of the future (Lehmbruch 1999). And still oth-ers probably served as fronts for corrupt or profit-motivated ventures. Generally speaking,these first associations were neither well organized nor transparent in purpose (Sulakshinand Romanikhin 2003). Unlike in some continental European countries, business associa-tion membership in Russia has been voluntary.
6A study by Gray and Lowery (1988), which focuses on the United States, also merits mention. They cre-ate state-level measures for encompassingness by comparing the number of registered lobbyists representingfirms to the number representing trade associations; states with relatively more of the former are taken to havebusiness communities with less-encompassing interests on the assumption that “trade associations are defi-nitionally more encompassing than individual firms.” Although they recognize the centrality of lobby groupheterogeneity to Olson’s thinking, their article does not amount to a direct exploration of his hypothesis. First,the authors make comparisons at the (macro) state rather than the (micro)organizational level. Second, thoughtheir aggregate measure of encompassingness assumes a difference between a single firm and a single collec-tive actor, it treats the group from which the latter is drawn as wholly homogeneous; all trade associations,that is, are assumed to be equally encompassing. And third, the authors do not directly observe lobby groupinterests or policy preferences; rather, they infer them from state-level economic outcomes.7The authors do not frame their analysis in terms of Olson’s hypothesis but rather in terms of the literatureon federal systems and inter-state externalities.8Our article also relates to the literature highlighting the preferences of individuals with respect to governmentintervention in markets (Mayda 2006; Mayda and Rodrik 2005; O’Rourke and Sinnott 2001, 2006).9Much of this section draws closely on similar narratives in Pyle (2006, 2011).

24 Public Choice (2013) 155:19–41
The reforms of the 1990s also gave rise to a wave of national-level, sector-specific or-ganizations as well as a number of multi-sector and sector-specific organizations that op-erate at the regional and municipal levels. Although the lack of a comprehensive registrycontinues to render an accurate accounting of their numbers impossible, one recent esti-mate puts the numbers of business associations nationally at close to five thousand.10 TheRussian Union of Industrialists and Entrepreneurs (RSPP) and the Chambers of Commerceand Industry (TPP) are two multi-sector associations that are among the most developedand influential. RSPP first emerged as a powerful alliance of Soviet-era enterprise directorsthat in the initial stages of the reform era lobbied for the retention of many price controls,continued access to state subsidies and strict limits on foreign investment (McFaul 1993;Hanson and Teague 2005). By the mid- to late-1990s, it had begun to adopt a more liberalorientation and to help organize a network of independent affiliates about which little hasbeen written. Like these RSPP affiliates, the Chambers of Commerce and Industry (TPP)draw their membership from many different sectors of the economy. Regulated througha special 1993 law guaranteeing their independence from state bodies, the TPP networktraces its roots to a communist-era institution that promoted commercial ties with the non-communist bloc. As with the RSPP, relatively little has been written of its activities, particu-larly those of the 170-plus independent Chambers that operate at the regional and municipallevels.11
Like many of the organizations that populate civil society, the functions of business asso-ciations can be divided along two dimensions. First, they help develop and strengthen “hor-izontal” ties among non-state actors by facilitating inter-firm communication regarding, forinstance, new technologies (Pyle 2006) and the reliability of potential trading partners (Pyle2005). Second, they can be instrumental in the “vertical” relationship between the businesscommunity and state actors by aggregating, transmitting and advocating business intereststo public officials. At the federal level, for instance, RSPP was widely recognized as being apowerful force behind some of the reform efforts pushed forward (not always successfully)in the early Putin years—e.g., judicial and natural monopoly reform and the dismantling ofregulatory barriers to small business development. Assessing the RSPP’s record from thistime, one pair of experts concluded that “In many cases, the RSPP lobbying activities havebeen conducive to Russia’s long-term economic prosperity” (Guriev and Rachinsky 2005).
4 Data
Several surveys were administered across the Russian Federation in 2004 to develop a pic-ture of what business lobbies do and why firms choose to join them. An initial screeningsurvey was used to construct a sample for a detailed survey of 606 firms from over half ofRussia’s 83 territorial subjects (regions).12 An effort was made to achieve a roughly equalrepresentation of respondents across territorial subjects and seven industrial sectors.13 By
10Interview in July 2005 in Moscow with the Director of the Department for Cooperation with BusinessAssociations at the Chamber of Commerce of the Russian Federation.11For additional perspectives on both lobbying and business associations in Russia, see Frye (2002), Golikova(2009), and Zudin (2006).12The screening survey’s findings of membership rate variation across sectors and employment sizes wereused to weight the sample’s distribution of members and non-members across these two dimensions.13These include metallurgy, chemicals, machine building and metal working, construction materials, woodprocessing, light industry and food processing.

Public Choice (2013) 155:19–41 25
construction, 280 (or slightly under a half) were members of at least one association. In ad-dition to standard firm-specific information, the survey asked enterprise managers a seriesof questions about their interaction with business associations. Some of these association-specific questions were directed at all firms, whereas some were only designed to be an-swered by members.From these questions, we can calculate the share of firms belonging to associations
of different types. For instance, firms were more likely to report membership in regionalassociations—i.e., those whose membership is composed almost exclusively of firms from asingle territorial subject—than those that are federal or multi-regional. Whereas only 46.2%of firms from the full sample of (280 of 606) were members in any type of association,39.4% (239 of 606) of the firms reported belonging to a regional association. The region-level associations, that is, had much higher membership rates than supra-regional or federalorganizations. Of firms that reported membership in at least one regional association, 85.8%(205) reported being in one that drew membership from across multiple sectors, whereas20.1% (48) belonged to at least one regional sector-specific association. A small number,5.9% (14), of firms were in both types of regional associations. We exploit this distinctionbetween multi-sector and sector-specific associations below to distinguish between more andless encompassing lobby groups. Table 1 reports summary data on those firms belonging tomulti-sectoral and sector-specific groups. With a few exceptions, the differences betweenthe two are not stark. Those in multi-sector groups are more likely both to have foreignshareholders and to have been established in the post-Soviet era. Firms in sector-specificlobbies are more apt to characterize their output markets as extremely competitive.Another survey queried the directors of 145 independent regional business associations,
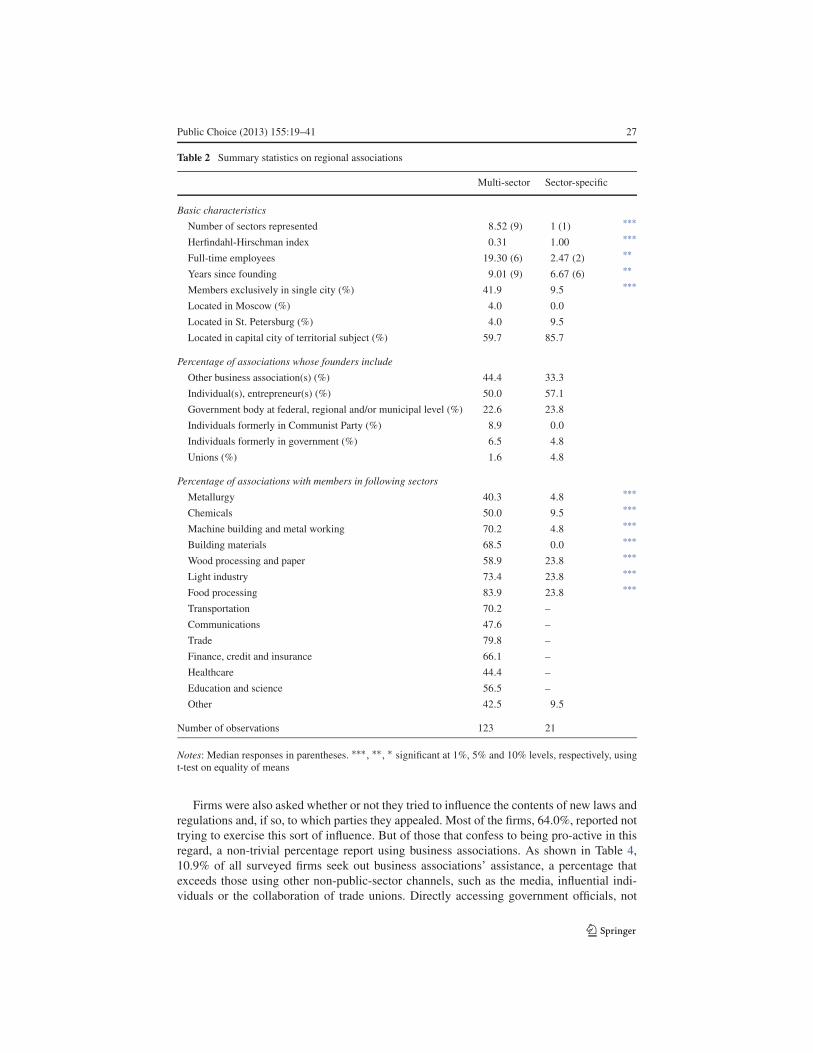
representing 34 of Russia’s eighty-plus territorial subjects.14 The solid majority of theseorganizations, 85.5% (124), represents multiple sectors, with the average being 8.52. Theremaining sector-specific associations represent a variety of industrial interests, with thosein wood-processing and paper, light industry and food processing being the most commonin our sample. On average, at the time of the survey, the regional associations were just overeight years old and operated with roughly 17 paid employees. Just under two-thirds werelocated in the capital city of their region and slightly over half numbered individual en-trepreneurs/businesspeople among their founders. Other business associations and state or-ganizations/agencies also played prominent roles in establishing a goodly number of them.And as shown in Table 2, relative to sector-specific lobbies, those representing multiple sec-tors were older and larger. In addition to having members from various industrial branches,many also included firms from the transportation, communications, trade, finance, health-care, and education sectors.Business lobbies (and their preferences) are meaningful only in the sense of affecting
policy if firms see them as useful in representing their interests and, of course, if the lobbiesshare that understanding of their role. To assess the extent to which Russia’s regional associ-ations are relevant in this regard, association managers were asked to characterize on a scalefrom 1 (not at all important) to 5 (extremely important) the value of various services to thelife of their association. Their ranking appears in Table 3. At the top of the list, “lobbyinggovernment officials” scored an average of 4.5, followed by “participating in the develop-ment of legislation” and “participating in the development of industrial policy,” respectively.
14In the absence of an official registry, a variety of sources were used to construct a sample of active asso-ciations that we deemed to be broadly representative in terms of regional distribution and the mix betweensector-specific and multi-sector associations.

26 Public Choice (2013) 155:19–41
Table 1 Summary statistics on firms
Members of multi-sector association
Members of sector-specific association
Basic characteristics
Full-time employees 867.4 (280) 801.1 (330)
First registered after 1991 (%) 43.4 29.2 *
State or municipal enterprise (%) 2.9 4.2
Influence of foreign shareholders (0–4 scale) 0.28 (0) 0.06 (0) ***
Level of technology (1–4 scale) 2.04 (2) 2.00 (2)
Located in Moscow (%) 2.9 4.2
Located in St Petersburg (%) 2.9 8.3
Located in capital city of territorial subject (%) 74.1 72.9
Competition
Competition in output market (1–5 scale) 4.11 (5) 4.50 (5) ***
Major competitors include firms in other Russian regions (%) 70.7 62.5
Major competitors include firms in other countries (%) 40.0 35.4
Trade partners
Sell to firms in other Russian regions (%) 74.6 62.5
Sell to firms in other countries (%) 45.4 33.3
Sell to Russian government (fulfill government orders) (%) 24.4 29.2
Sell to firms in same commercial group (%) 13.2 12.5
Purchase inputs from firms in other Russian regions (%) 72.7 62.5
Purchase inputs from firms in other countries (%) 40.0 43.8
Purchase inputs from Russian government (%) 6.8 14.6
Purchase inputs from firms in same commercial group (%) 12.2 10.4
Sectors (%)
Metallurgy 12.7 6.3
Machine building and metal working 23.4 10.4 **
Chemicals 11.7 6.3
Wood processing and paper 9.7 12.5
Building materials 10.7 20.8
Textiles 18.1 25.0
Food processing 13.6 18.8
Number of observations 205 48
Note: Median responses in parentheses. ∗∗∗ , ∗∗, ∗ significant at 1%, 5% and 10% levels, respectively, usingt-test on equality of means
The managers of regional associations, that is, ranked the three services most closely associ-ated with the representation of members’ policy interests ahead of every other service aboutwhich they were asked.15
15The difference between the mean “lobbying government officials” response is statistically different thanthe mean “helping development small business” response, as well as all those responses ranked below it,at the 1% level. The difference between the mean “participating in development of legislation” response isstatistically different than the mean “protecting firms from illegitimate government interference” response, aswell as those responses ranked below it, at the 5% level.
Public Choice (2013) 155:19–41 27
Table 2 Summary statistics on regional associations
Multi-sector Sector-specific
Basic characteristics
Number of sectors represented 8.52 (9) 1 (1) ***
Herfindahl-Hirschman index 0.31 1.00 ***
Full-time employees 19.30 (6) 2.47 (2) **
Years since founding 9.01 (9) 6.67 (6) **
Members exclusively in single city (%) 41.9 9.5 ***
Located in Moscow (%) 4.0 0.0
Located in St. Petersburg (%) 4.0 9.5
Located in capital city of territorial subject (%) 59.7 85.7
Percentage of associations whose founders include
Other business association(s) (%) 44.4 33.3
Individual(s), entrepreneur(s) (%) 50.0 57.1
Government body at federal, regional and/or municipal level (%) 22.6 23.8
Individuals formerly in Communist Party (%) 8.9 0.0
Individuals formerly in government (%) 6.5 4.8
Unions (%) 1.6 4.8
Percentage of associations with members in following sectors
Metallurgy 40.3 4.8 ***
Chemicals 50.0 9.5 ***
Machine building and metal working 70.2 4.8 ***
Building materials 68.5 0.0 ***
Wood processing and paper 58.9 23.8 ***
Light industry 73.4 23.8 ***
Food processing 83.9 23.8 ***
Transportation 70.2 –
Communications 47.6 –
Trade 79.8 –
Finance, credit and insurance 66.1 –
Healthcare 44.4 –
Education and science 56.5 –
Other 42.5 9.5
Number of observations 123 21
Notes: Median responses in parentheses. ∗∗∗, ∗∗, ∗ significant at 1%, 5% and 10% levels, respectively, usingt-test on equality of means
Firms were also asked whether or not they tried to influence the contents of new laws andregulations and, if so, to which parties they appealed. Most of the firms, 64.0%, reported nottrying to exercise this sort of influence. But of those that confess to being pro-active in thisregard, a non-trivial percentage report using business associations. As shown in Table 4,10.9% of all surveyed firms seek out business associations’ assistance, a percentage thatexceeds those using other non-public-sector channels, such as the media, influential indi-viduals or the collaboration of trade unions. Directly accessing government officials, not

28 Public Choice (2013) 155:19–41
Table 3 How important are the following services to your association at the present time?
Lobbying government officials 4.50
Participating in development of legislation 4.31
Participation in development of industrial policy 4.23
Helping develop small businesses 4.17
Providing informational, legal, consulting services 4.07
Protecting firms from illegitimate government interference 3.99
Helping firms develop contacts with other Russian firms 3.94
Helping develop a “social partnership” in social-labor sphere 3.63
Helping develop behavioral standards/ethics 3.59
Assisting in resolution of disputes between firms 3.59
Helping firms develop contacts with foreign firms 3.09
Number of observations 145
Notes: 1= not important at all; 5= extremely important
Table 4 Does your firm try to influence the contents of new laws and regulations? If so, whose assistancedoes it seek? (%)
All firms Regional lobbymembers
All firms thattry to influence
All regional lobbymembers that try toinfluence
Assistance sought from
Business associations 10.9 20.9 30.3 39.7
Personnel from executive branch 20.1 32.2 56.0 61.1
Personnel from legislative branch 14.5 24.3 40.4 46.0
Mass media 8.1 12.1 22.5 23.0
Trade unions 4.8 7.9 13.3 15.1
Influential individuals/entrepreneurs 7.1 10.9 19.7 20.5
Does not try to influence 64.0 47.3 – –
surprisingly, is the most popular channel for exercising influence over the design of newpolicies; 20.1% of all firms report approaching executive branch personnel and 14.5% uselegislative branch channels. Among the subset of respondents belonging to regional businesslobbies, the percentage of those responding that they use business associations is compara-ble to those that directly approach officials in the legislative branch, 20.9% as opposed to24.3%. Among all firms that admit to trying to exercise influence, 30.3% report using busi-ness lobbies; and within the subset of that group that belongs to a business association, justunder 40% report drawing directly on the services of a business association.
5 Lobby group composition and interests
5.1 Assessing preferences for free markets
To gauge business interests in government intervention, we draw on the answers to questionsgiven by the managers of both firms and associations. Managers from both were asked two
Public Choice (2013) 155:19–41 29
questions to elicit how favorably they were disposed to two general types of governmentintervention:
(1) To what degree do you agree with the statement that regional governmental bodiesshould impose economic barriers to the import of goods from other regions and coun-tries in order to support employment and an otherwise favorable economic environmentin the region?
(2) To what degree do you agree with the statement that the government should create spe-cial conditions—through tax breaks, subsidies, etc.—so as to promote the developmentof prioritized economic sectors?
References to specific sectors or regions (most notably, the respondent’s) were deliberatelyomitted so as to best capture general preferences toward types of targeted government in-terventions that would not be unfamiliar to respondents. Greater use of the tax code andregulatory mechanisms to benefit Russian manufacturing was the focus of a concerted lob-bying effort by the federal TPP at roughly the same time as the survey was conducted(Gosudarstvennaia promyshlennaia politika Rossi 2004). And throughout the 1990s, manyregional governments manipulated local laws and regulations to benefit narrow interests(Slinko et al. 2005; Guriev et al. 2010). Over the same time period, we have ample evidenceof regional politicians promoting various protectionist measures in contradiction of federallaws designed to facilitate the free flow of goods across regional borders (Berkowitz andDeJong 2003b).An additional question was addressed only to managers of the lobby groups. They were
asked how beneficial the seemingly imminent WTO accession for Russia would be for theirregion.16 At the time, it was widely understood that accession would lower import tariffs,thus diminishing government interference with trade flows and putting foreign and domes-tic companies on a more equal footing in several previously protected sectors (Chowdhury2003). An intense public debate swirled around the issue. Some of the most protected sec-tors, such as automobiles, marshaled fierce opposition while others, such as steel exporters,came out strongly in support of accession; RSPP was generally supportive although, withinits ranks, there was far from universal agreement (Guriev and Rachinsky 2005). Most of theeconomic analysis pointed to positive net welfare effects with Rutherford and Tarr (2006)concluding that all regions would benefit with gains likely to be greatest in areas closest tointernational markets.17
We believe that these questions provide us with a comprehensive and direct test of Ol-son’s hypothesis by allowing us to examine the robustness of our findings across two dimen-sions. First, we ask about targeted policy interventions in three separate ways. If Olson’shypothesis holds, groups more narrowly composed should be more favorably disposed to-ward regional trade barriers as well as targeted tax and/or regulatory policies. We would alsoexpect them to be less favorably disposed to WTO accession.18 Second, the questions are
16Russia’s WTO accession was one element of a series of structural reforms for which President Putin waspushing during his first term. Indeed, at the time of the surveys, most optimistic commentators expectedmembership to come as early as the end of 2004.17Positive welfare effects are also found from microsimulations based on extensive household-level data(Rutherford and Tarr 2008). For additional World Bank research on the topic, see http://go.worldbank.org/CJQ7ZLJJF0.18Since two of the three questions deal explicitly with barriers to trade, we should note that Olson highlightedthat free trade was the most effective means for mitigating the malign effects of business lobby groups.We might thus presume that in questions of trade protection and market access, we would observe most
30 Public Choice (2013) 155:19–41
Fig. 1 Attitudes toward import barriers
Fig. 2 Attitudes toward industrial polocy
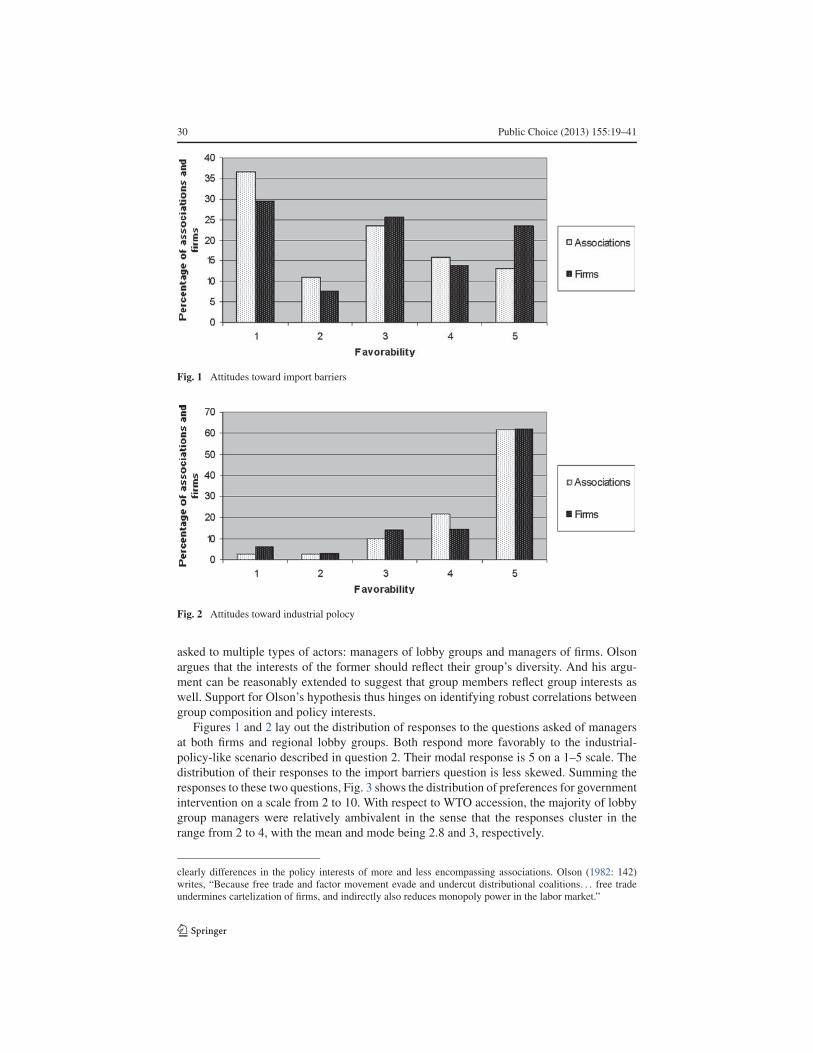
asked to multiple types of actors: managers of lobby groups and managers of firms. Olsonargues that the interests of the former should reflect their group’s diversity. And his argu-ment can be reasonably extended to suggest that group members reflect group interests aswell. Support for Olson’s hypothesis thus hinges on identifying robust correlations betweengroup composition and policy interests.Figures 1 and 2 lay out the distribution of responses to the questions asked of managers
at both firms and regional lobby groups. Both respond more favorably to the industrial-policy-like scenario described in question 2. Their modal response is 5 on a 1–5 scale. Thedistribution of their responses to the import barriers question is less skewed. Summing theresponses to these two questions, Fig. 3 shows the distribution of preferences for governmentintervention on a scale from 2 to 10. With respect to WTO accession, the majority of lobbygroup managers were relatively ambivalent in the sense that the responses cluster in therange from 2 to 4, with the mean and mode being 2.8 and 3, respectively.
clearly differences in the policy interests of more and less encompassing associations. Olson (1982: 142)writes, “Because free trade and factor movement evade and undercut distributional coalitions. . . free tradeundermines cartelization of firms, and indirectly also reduces monopoly power in the labor market.”

Public Choice (2013) 155:19–41 31
Fig. 3 Attitudes toward government intervention
5.2 Explaining associations’ interests
To assess the factors that explain the interests expressed by managers at the mth regionallobby with respect to the kth policy (AImk), we estimate the equation:
AImk = α + φ1Nm + φ2Bm + γAm + ζRm + εm (1)
The dependent variables include those highlighted in Figs. 1–3—preference intensity forregional trade barriers, industrial policy and the two jointly—as well as the respondents’sense of the regional impact of WTO accession.Our measures of how encompassing a group is include the number of sectors, Nm, rep-
resented by its membership (see Table 2 for the list of 14 sectors) and a dummy variablecapturing whether or not the founders include another business association. But if, as Olsonpresumed, less encompassing associations are more likely to favor government interventionto disrupt market forces, we would expect the coefficients on N and B , φ1 and φ2, to benegative when considering how favorably they regard industrial policy and trade barriers.Similarly, we would expect these proxies for encompassing interests to be positive whenmanagers are asked about the effect of WTO accession. As a robustness check, we substi-tute for the number of sectors, a Herfindahl-Hirschman index (HHI) that measures sectoralconcentration in an association.19 For all sector-specific groups, the index has a value of 1;for the multi-sector associations, the average is 0.31. Since higher values of the index corre-spond to greater concentration, we would expect the coefficient estimates to be opposite insign to those for N and B .We also control for other association-specific characteristics, Am, listed in Table 2. These
include the number of both its full-time employees and the years since its founding, as wellas dummy variables for location and the identity of the lobby’s founders.
Rm represents a vector of characteristics of the respondent’s region: political competi-tion; log per capita income; the sum of exports and imports as a share of gross regionalproduct; the share of regional product contributed by the fuel and energy sector; and the
19Due to non-responses, this results in the loss of about twenty observations.

32 Public Choice (2013) 155:19–41
share of regional industrial production accounted for by the largest industrial sector. 20,21
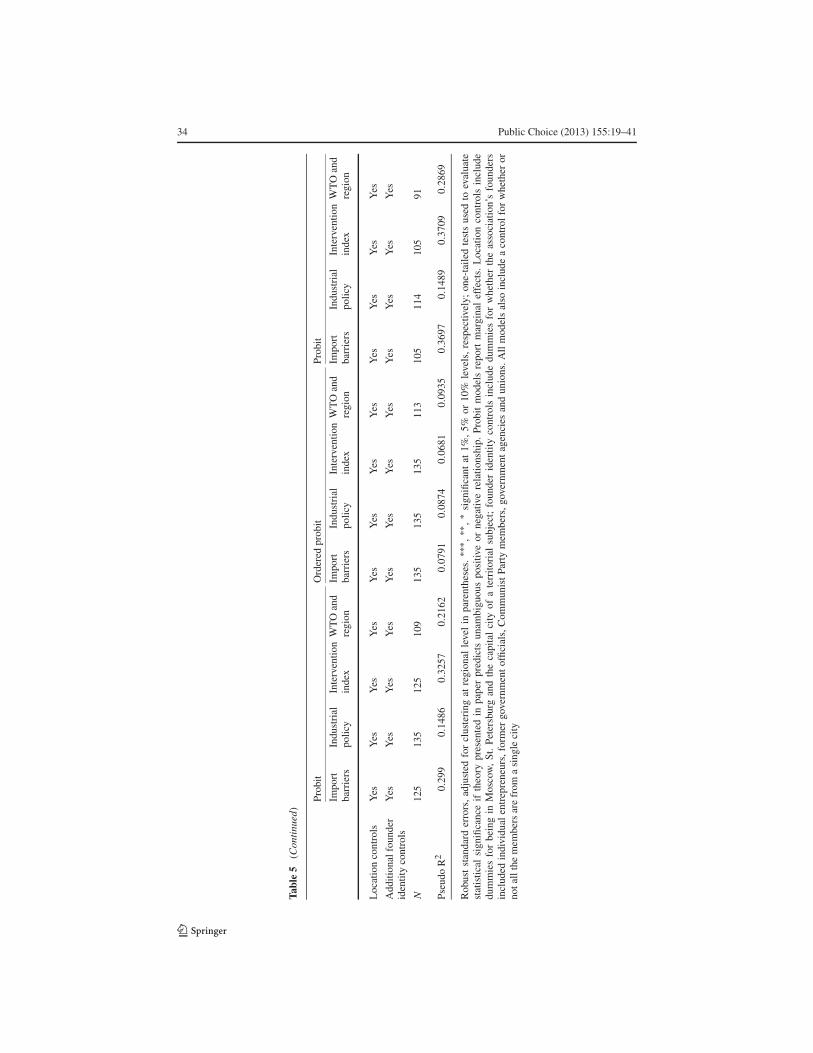
Russia is constitutionally a federation consisting of 83 territorial subjects (regions), whichhave enjoyed a considerable degree of autonomy in deciding on regional economic poli-cies (Berkowitz and DeJong 2003a). Although the trend in recent years has been towardrecentralization of policy-making, economic institutions and income levels still vary widelyacross Russia’s regions. Even though there is some evidence of convergence in income lev-els, regional disparities remain extremely large (Bradshaw and Vartapelov 2003; Hansonand Bradshaw 2000; Solanko 2008). Furthermore, a number of indices of regional politicaland economic development suggest that Russia’s regions have developed widely divergentbusiness environments.Table 5 lays out our results. In the first four columns, we present our baseline probit
model in which the dependent variable takes on the value of one if managers express max-imum enthusiasm for the policy—i.e., 5 on a 1–5 scale for the import barrier, industrialpolicy and WTO accession questions, and 10 on the “intervention index,” the sum of the re-sponses to the import barrier and industrial policy questions. Columns 5–8 and 9–12 presentrobustness checks: ordered probit models in the former; the HHI substituting for the numberof sectors in the latter.The signs on our proxies for how encompassing a regional lobby is are consistent with
Olson’s theory. More encompassing lobbies, that is, are less prone to support import bar-riers and industrial-policy-like interventions and are more likely to have a favorable viewof WTO accession. Lobbies representing fewer associations have a more favorable attitudetoward the imposition of regional trade barriers; and those founded by other associations aremore prone to approve of industrial-policy-like interventions. In our baseline probit model,these relationships are significant at the 1% level; in the ordered probit model and in thespecification that includes the HHI, they are all significant at the 5% level.We also observe in columns 3 and 4 that lobbies representing fewer sectors are more
likely to express a strong preference for government intervention (i.e., maximum approvalfor both import barriers and industrial policy) and to regard the regional impact of WTOaccession less favorably; these relationships are significant at the 1% and 5% levels, respec-tively. In three of the four robustness checks (columns 7–8 and 11–12), these relationshipsare statistically significant in the predicted direction. Our robustness checks further demon-strate the strength of the link between policy preferences and having another association asa founder.
5.3 Explaining firms’ interests
So as to provide further confirmation of the relationship between the interests and compo-sition of lobby groups, we now turn to assessing the factors that explain variation in the
20The index of “political competition” that we use comes from the Democratic Audit of Russia, a jointproject of three independent and respected Russian organizations: the Public Expertise Institute, the INDEMFoundation and the Merkator Analytical Center. Two features of the index make it particularly useful for ouranalysis. First, the rankings are based on electoral data and thus differ from indices that rely on relativelyopaque “expert” assessments. Second, the time period used to compile the index, 1995–2005, fits well withour survey data collected in 2004. Since we employ the index as an explanatory variable in regressionsthat explore the choices of firms and associations, our concerns about possible feedback effects from thosebehaviors to the regional political index are minimized knowing that the index is based almost exclusivelyon electoral data that precede the administration of our surveys. We should also note that though Russia hasended the practice of regional gubernatorial elections, they were still taking place during the decade from1995–2005. See Pyle (2011) for more details.21All economic data for the regions are annual measures for 2003 from Rosstat.

Public Choice (2013) 155:19–41 33
Tabl
e5Intensityofassociationmanagers’interests:institutingregionaltradebarriers,promotingindustrialpolicy,promotingWTOaccession
Probit
Orderedprobit
Probit
Import
barriers
Industrial
policy
Intervention
index
WTOand
region
Import
barriers
Industrial
policy
Intervention
index
WTOand
region
Import
barriers
Industrial
policy
Intervention
index
WTOand
region
Numberofsectors
representedin
membership
−0.021***
0.011
−0.014***
0.012**
−0.070**
−0.001
−0.058**
0.083**
(0.006
)(0
.012
)(0
.006
)(0
.007
)(0
.032
)(0
.034
)(0
.033
)(0
.036
)
Membership
concentrationindex
0.266***
−0.119
0.137*
−0.001
(0.088
)(0
.145
)(0
.082
)(0
.007
)
Foundersinclude
otherbusiness
association(s)
−0.040*
−0.354***
−0.039*
−0.020
−0.534**
−0.794**
−0.641***
0.327
−0.028
−0.335**
−0.029
−0.001
(0.028
)(0
.125
)(0
.028
)(0
.046
)(0
.241
)(0
.346
)(0
.249
)(0
.273
)(0
.030
)(0
.145
)(0
.024
)(0
.004
)
Full-timeemployees
(log)
0.002
0.006
0.007
0.020
−0.006
0.036
0.021
0.196*
−0.001
0.001
0.003
0.003
(0.013
)(0
.043
)(0
.008
)(0
.016
)(0
.098
)(0
.099
)(0
.096
)(0
.104
)(0
.014
)(0
.050
)(0
.007
)(0
.004
)
Yearssincefounding
(log)
0.059
−0.063
0.040*
−0.097***
0.135
−0.061
0.077
−0.339
0.074**
−0.025
0.031
−0.007
(0.037
)(0
.086
)(0
.024
)(0
.035
)(0
.236
)(0
.224
)(0
.213
)(0
.215
)(0
.037
)(0
.091
)(0
.021
)(0
.009
)
Politicalcompetition
inregion
0.048***
0.062
0.029***
−0.003
0.103
0.112
0.096
−0.057
0.027*
0.040
0.012
−0.004
(0.018
)(0
.062
)(0
.011
)(0
.024
)(0
.127
)(0
.150
)(0
.121
)(0
.109
)(0
.016
)(0
.071
)(0
.009
)(0
.005
)
GRPshareoflargest
sectorinregion
−0.006**
0.007
−0.005**
−0.008*
−0.053***
0.009
−0.033**
−0.015
−0.006**
0.002
−0.004*
−0.002
(0.003
)(0
.008
)(0
.002
)(0
.005
)(0
.013
)(0
.018
)(0
.014
)(0
.017
)(0
.003
)(0
.009
)(0
.002
)(0
.003
)
(Exports
+imports)/
GRPinregion
−0.114
−0.419
−0.089
0.051
−0.237
−0.828
−0.495
1.580**
−0.175
−0.447
−0.145
0.009
(0.103
)(0
.437
)(0
.082
)(0
.116
)(0
.473
)(1
.011
)(0
.623
)(0
.709
)(0
.127
)(0
.365
)(0
.089
)(0
.015
)
(Fuelandenergy
production)/GRPin
region
0.001
0.000
0.000
0.000
−0.002
0.000
−0.002
−0.002
0.002
−0.002
0.000
0.000
(0.002
)(0
.006
)(0
.001
)(0
.002
)(0
.009
)(0
.013
)(0
.011
)(0
.012
)(0
.002
)(0
.006
)(0
.001
)(0
.000
)
Percapitaincome
(log)inregion
0.085
0.223
0.034
0.054
1.041**
0.527
0.886
−0.397
0.091
0.318
0.034
−0.002
(0.102
)(0
.312
)(0
.065
)(0
.126
)(0
.486
)(0
.690
)(0
.551
)(0
.663
)(0
.096
)(0
.323
)(0
.055
)(0
.009
)
(con
tinu
edon
the
next
page)
34 Public Choice (2013) 155:19–41
Tabl
e5(C
onti
nued)
Probit
Orderedprobit
Probit
Import
barriers
Industrial
policy
Intervention
index
WTOand
region
Import
barriers
Industrial
policy
Intervention
index
WTOand
region
Import
barriers
Industrial
policy
Intervention
index
WTOand
region
Locationcontrols
Yes
Yes
Yes
Yes
Yes
Yes
Yes
Yes
Yes
Yes
Yes
Yes
Additionalfounder
identitycontrols
Yes
Yes
Yes
Yes
Yes
Yes
Yes
Yes
Yes
Yes
Yes
Yes
N125
135
125
109
135
135
135
113
105
114
105
91
PseudoR2
0.299
0.1486
0.3257
0.2162
0.0791
0.0874
0.0681
0.0935
0.3697
0.1489
0.3709
0.2869
Robuststandarderrors,adjustedforclusteringatregionallevelinparentheses.
∗∗∗ ,
∗∗,
∗significantat1%,5%
or10%levels,respectively;one-tailedtestsusedtoevaluate
statisticalsignificanceiftheorypresentedinpaperpredictsunambiguouspositiveornegativerelationship.Probitmodelsreportmarginaleffects.Locationcontrolsinclude
dummiesforbeinginMoscow,St.Petersburgandthecapitalcityofaterritorialsubject;founderidentitycontrolsincludedummiesforwhethertheassociation’sfounders
includedindividualentrepreneurs,formergovernmentofficials,CommunistPartymembers,governmentagenciesandunions.Allmodelsalsoincludeacontrolforwhetheror
notallthemembersarefrom
asinglecity

Public Choice (2013) 155:19–41 35
expressed policy preferences of managers at firms belonging to a regional business lobby,by estimating the following:
FIi,j = α + βSi + γFi + ζRi + εi (2)
Here, we highlight the relationship of the interests of firm i toward policy intervention j
(FIi,j ) to its membership in a regional sector-specific lobby, Si . Fi is a vector of additionalcharacteristics specific to the firm that one might reasonably presume affect interests towardgovernment intervention. Controls for enterprise size, ownership by the state and by foreign-ers are included, as is one for whether the firm was created in the post-Soviet era. Controlsare included for a firm’s exposure to trade beyond its regional borders; specifically, dum-mies capture whether or not it purchases inputs from and/or sells output to foreign countriesand/or other Russian regions. Other dummies measure whether the respondent has tradingpartners that include government entities or firms within a commercially oriented businessgroup (i.e., sharing a single, overlapping ownership structure). Indices measuring the relativesophistication of the firm’s capital stock as well as the competitiveness of the firm’s primaryoutput market are also included, as is a dummy variable reflecting whether the firm’s majorcompetitors are based outside its region. Location controls are included to capture whetherthe respondent is based in a regional capital or in Moscow or St. Petersburg, the two citiesthat have the same status as a region. We also include enterprise sector controls. And fi-nally, Ri represents a vector of the same regional characteristics that we controlled for in themodels run on the responses of lobby group managers.We run model (2) only on the sub-sample of respondents that are regional association
members. If the more narrowly composed, sector-specific lobbies are more apt to value gov-ernment intervention in markets, we might expect to find, as a corollary to Olson’s encom-passingness hypothesis, that firms joining them are apt to view those interventions in a morepositive light than members of multi-sector groups—i.e., the estimate of β is positive. Theresults, laid out in Table 6, generally confirm the hypothesis. Notably, compared to membersin multi-sector associations, we observe that with respect to the import barriers question, theestimate of β is positive and statistically significant at at least the 5% level in both the probitand ordered probit specifications. Members of sector-specific associations, that is, are moreprone than members of multi-sector associations to view this sort of intervention favorably.In our baseline model, the estimates of β are positive for the industrial policy question aswell as for the joint “intervention index”; only the latter, however, is statistically significant.In the ordered probit specifications, the estimates of β for both these models are statisticallysignificant.As we noted earlier, we are sensitive to the possibility that our results are driven by
reverse causality—i.e., from preferences to membership—but our objective here is not todemonstrate that firm preferences are shaped by membership in a lobby of a particular type.Support for Olson’s hypothesis, we feel, hinges only on being able to identify robust cor-relations between group composition and policy interests. Whether firms’ preferences drivetheir decisions to join a particular association or whether their decision to join a particularassociation shapes their preferences is not our direct concern.
6 Relative importance of representation services
As one additional step in our analysis, we return to the question of how important represen-tation services are to lobby members by exploring whether that importance is a function of

36 Public Choice (2013) 155:19–41
Table 6 Intensity of enterprise managers’ interests: instituting regional trade barriers, promoting industrialpolicy
Probit Ordered probit
Importbarriers
Industrialpolicy
Interventionindex
Importbarriers
Industrialpolicy
Interventionindex
Member ofsector-specificassociation
0.174** 0.070 0.117* 0.501*** 0.284* 0.510***
(0.083) (0.095) (0.074) (0.204) (0.218) (0.196)
Full-time employeesin 2004 (log)
−0.013 −0.094** −0.025 −0.117* −0.192** −0.161**(0.029) (0.039) (0.024) (0.060) (0.089) (0.062)
Founded inpost-Soviet era
−0.067 −0.239*** −0.088 −0.322* −0.484*** −0.421**(0.062) (0.070) (0.053) (0.191) (0.173) (0.183)
State or municipalenterprise
0.023 0.215 0.093 −0.362 0.706 −0.101(0.130) (0.150) (0.140) (0.328) (0.549) (0.307)
Influence of foreignshareholders
0.065 −0.096** 0.045 0.022 −0.296** −0.105(0.048) (0.045) (0.044) (0.137) (0.119) (0.135)
Sell output outsideregion within Russia
0.165** −0.097 0.088 0.450** −0.323 0.186
(0.051) (0.081) (0.055) (0.204) (0.224) (0.193)
Sell output abroad 0.113 0.197* 0.188** 0.043 0.463* 0.232
(0.096) (0.101) (0.089) (0.224) (0.279) (0.225)
Buy inputs outsideregion within Russia
−0.237*** 0.094 −0.265*** −0.389* 0.367 −0.112(0.077) (0.111) (0..073) (0.201) (0.276) (0.226)
Buy inputs abroad −0.041 −0.006 −0.037 0.085 0.021 0.044
(0.073) (0.084) (0.069) (0.177) (0.206) (0.182)
Political competitionin region
0.027 −0.043 0.004 −0.045 −0.131 −0.087(0.036) (0.050) (0.034) (0.089) (0.126) (0.085)
GRP share of largestsector in region
−0.002 0.008 −0.000 −0.013 0.005 −0.010(0.007) (0.006) (0.005) (0.021) (0.016) (0.017)
(Exports+ imports)/GRP in region
−0.109 −0.022 −0.087 −0.202 −0.054 −0.153(0.114) (0.113) (0.097) (0.302) (0.269) (0.273)
(Fuel and energyproduction)/GRP inregion
−0.001 −0.001 0.000 −0.006 −0.003 −0.006(0.002) (0.003) (0.002) (0.007) (0.008) (0.007)
Per capita income(log) in region
0.097 −0.106 0.023 0.204 0.123 0.267
(0.149) (0.166) (0.125) (0.532) (0.423) (0.476)
Competitor andadditional tradepartner controls
Yes Yes Yes Yes Yes Yes
Location controls Yes Yes Yes Yes Yes Yes
Sector controls Yes Yes Yes Yes Yes Yes
N 224 227 225 234 234 234
Pseudo R2 0.1474 0.1237 0.1455 0.0615 0.0902 0.0513
Robust standard errors, adjusted for clustering at regional level in parentheses. ∗∗∗ , ∗∗, ∗ significant at 1%, 5%or 10% levels, respectively; one-tailed tests used to evaluate statistical significance if theory presented in paperpredicts unambiguous positive or negative relationship. Probit models report marginal effects. Competitorcontrols include dummies for whether the firm has competitors in other Russian regions and abroad; a controlis also included for the respondent’s assessment of the competitiveness of their output market (1–5 scale).Additional trade partner controls include dummies for sales to/purchases from state agencies or firms as wellas to/from members of respondent’s commercial association (financial-industrial group). Location controlsinclude dummies for being in Moscow, St. Petersburg and the capital city of a territorial subject
Public Choice (2013) 155:19–41 37
lobby type (multi-sector or sector-specific). Earlier, we observed the percentages of firmsthat report having approached a business association in order to lobby for the passage ofnew rules and regulations. We now turn to a more pointed question in which managers offirms were asked about the regional lobby most important to their economic well-being (if,indeed, they belonged to more than one). Each enterprise manager was asked to rank ona scale from 1 (little value) to 5 (great value), the importance of ten separate services po-tentially offered by that organization; for firms whose association did not offer a particularservice, we recorded a 0.22
If less-encompassing, sector-specific business lobbies are more favorably disposed to-ward targeted government intervention, we might feel more comfortable about inferringthe welfare effects of those preferences if, indeed, their services related to acting on thosepreferences are considered important by members. If we could show, that is, that less-encompassing associations focused more on representation services, as opposed to otherswhose welfare effects might be considered more benign (e.g., sponsoring trade fairs or run-ning tribunals to mediate inter-firm disputes), we would have at least some (admittedly indi-rect and imperfect) basis for connecting patterns of policy preferences to social welfare. Tothis end, we estimate the following equation to assess the relative importance of the servicesreceived by regional association members from their “most important” association:
RStv = α + βSv + γFv + ζRv + εv (3)
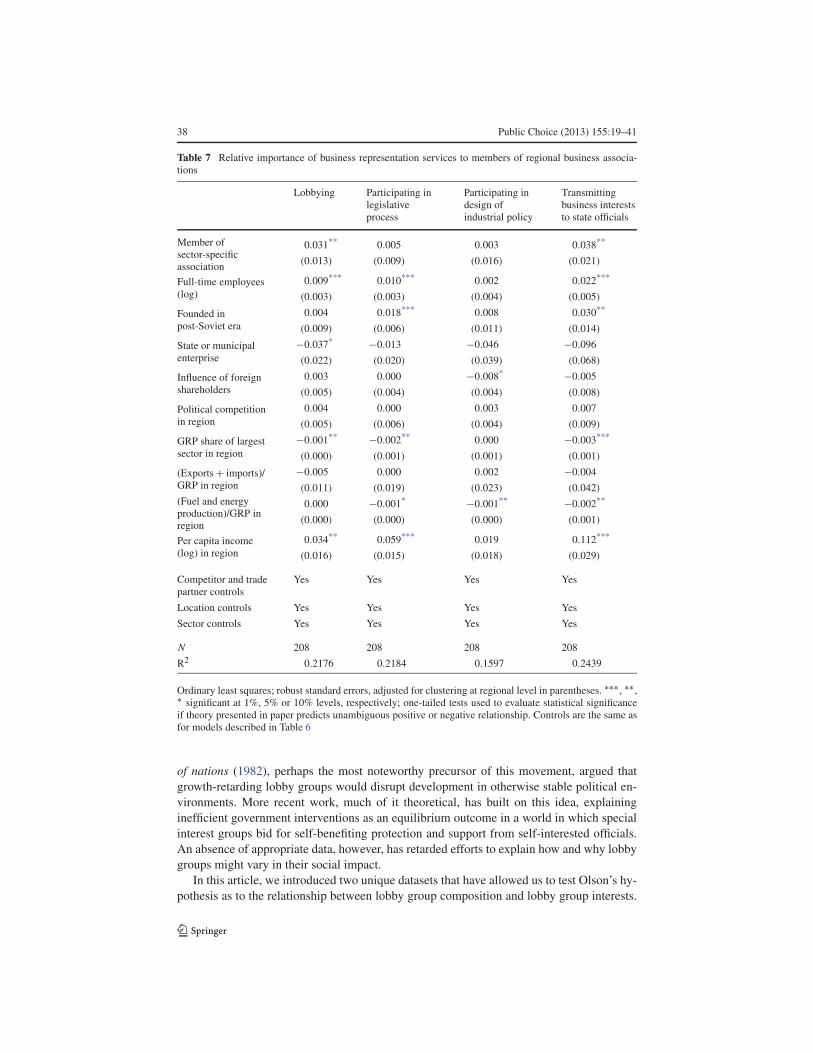
The relative importance of the t th service to the vth firm, RStv , is the ratio of the value (0–5)given by the firm to a particular service over the sum of the values given to all ten services.Sv is a dummy variable for the vth firm’s membership in a regional, sector-specific lobby.Because we restrict the analysis only to firms whose “most important” association was aregional lobby, the coefficient β is a measure of the difference between members of sector-specific and members of multi-sector associations. Fv and Rv are vectors of the same firmand region-specific characteristics which we have controlled for in previous regressions.The first three columns of Table 7 present the results for each of the three business rep-
resentation services: lobbying, participating in the legislative process and participating inthe design of industrial policy. The numerator for the dependent variable used in the resultspresented in the fourth column is the sum of a respondent’s values for all three of theserepresentation services.We are most interested here in the coefficient on the dummy variable capturing whether
or not the firm’s “most important” regional association is sector-specific. Here, we observethat the coefficient on Sv is positive across all four columns. And in the cases of lobbyingand the aggregated measure of representation services, the results are statistically significantat the 5% level. Members, in other words, of narrower, less-encompassing associations aremore apt to ascribe the value added of their association to these representation services.Multi-sector association members, in other words, are more apt to credit services that wemight less readily associate with un-productive rent-seeking.
7 Conclusion
Over the past two decades, social scientists’ interest in exploring the institutional sourcesof long-run economic performance has grown dramatically. Olson’s The rise and decline
22The services were the same as those listed in Table 3, with the exception that “helping develop smallbusiness” was not included.
38 Public Choice (2013) 155:19–41
Table 7 Relative importance of business representation services to members of regional business associa-tions
Lobbying Participating inlegislativeprocess
Participating indesign ofindustrial policy
Transmittingbusiness intereststo state officials
Member ofsector-specificassociation
0.031** 0.005 0.003 0.038**
(0.013) (0.009) (0.016) (0.021)
Full-time employees(log)
0.009*** 0.010*** 0.002 0.022***
(0.003) (0.003) (0.004) (0.005)
Founded inpost-Soviet era
0.004 0.018*** 0.008 0.030**
(0.009) (0.006) (0.011) (0.014)
State or municipalenterprise
−0.037* −0.013 −0.046 −0.096(0.022) (0.020) (0.039) (0.068)
Influence of foreignshareholders
0.003 0.000 −0.008* −0.005(0.005) (0.004) (0.004) (0.008)
Political competitionin region
0.004 0.000 0.003 0.007
(0.005) (0.006) (0.004) (0.009)
GRP share of largestsector in region
−0.001** −0.002** 0.000 −0.003***(0.000) (0.001) (0.001) (0.001)
(Exports+ imports)/GRP in region
−0.005 0.000 0.002 −0.004(0.011) (0.019) (0.023) (0.042)
(Fuel and energyproduction)/GRP inregion
0.000 −0.001* −0.001** −0.002**(0.000) (0.000) (0.000) (0.001)
Per capita income(log) in region
0.034** 0.059*** 0.019 0.112***
(0.016) (0.015) (0.018) (0.029)
Competitor and tradepartner controls
Yes Yes Yes Yes
Location controls Yes Yes Yes Yes
Sector controls Yes Yes Yes Yes
N 208 208 208 208
R2 0.2176 0.2184 0.1597 0.2439
Ordinary least squares; robust standard errors, adjusted for clustering at regional level in parentheses. ∗∗∗ , ∗∗,∗ significant at 1%, 5% or 10% levels, respectively; one-tailed tests used to evaluate statistical significanceif theory presented in paper predicts unambiguous positive or negative relationship. Controls are the same asfor models described in Table 6
of nations (1982), perhaps the most noteworthy precursor of this movement, argued thatgrowth-retarding lobby groups would disrupt development in otherwise stable political en-vironments. More recent work, much of it theoretical, has built on this idea, explaininginefficient government interventions as an equilibrium outcome in a world in which specialinterest groups bid for self-benefiting protection and support from self-interested officials.An absence of appropriate data, however, has retarded efforts to explain how and why lobbygroups might vary in their social impact.In this article, we introduced two unique datasets that have allowed us to test Olson’s hy-
pothesis as to the relationship between lobby group composition and lobby group interests.

Public Choice (2013) 155:19–41 39
Based on the surveys of business associations and industrial enterprises across the RussianFederation, we show that managers of less encompassing associations clearly regard tar-geted government interventions more favorably. And as confirmation of this result, we showthat members of these more narrowly comprised lobbies share the same perspective. Weare, however, unable to distinguish whether this latter relationship reflects (a) firms select-ing into like-minded lobbies or (b) firms’ preferences having been shaped those lobbies.Lastly, we demonstrate that members of less-encompassing lobbies are more likely to placegreater value on their association’s lobbying and business representation services. We be-lieve that these findings amount to the most direct confirmation of Olson’s view that lobbygroup composition and lobby group interests are related.
Acknowledgements The authors thank Jim Leitzel, Iikka Korhonen and Peter Murrell for providing help-ful feedback. The comments received from colleagues in seminars at the Higher School of Economics, theBank of Finland Institute for Economies in Transition and Middlebury College are also gratefully acknowl-edged. Will Pyle would also like to recognize Irina Perova, Alexei Grazhdankin, and the Levada AnalyticalCentre for their professional assistance in designing and administering the surveys. Important financial assis-tance was provided by the National Council for Eurasian and East European Research, the William DavidsonInstitute, and the Fulbright-Hays Faculty Research Abroad Fellowship Program. Much of the research forthis article was conducted while Will Pyle was a visiting researcher at the Bank of Finland’s Institute forEconomies in Transition.
References
Ansolabehere, S., de Figueuredo, J., & Snyder, J. (2003). Why is there so little money in U.S. politics?Journal of Economic Perspectives, 17(1), 105–130.
Baldwin, R., & Robert-Nicoud, F. (2007). Entry and asymmetric lobbying: why governments pick losers.Journal of European Economic Association, 5(5), 1064–1093.
Becker, G. (1983). A theory of competition among pressure groups for political influence. Quarterly Journalof Economics, 93(3), 371–400.
Berkowitz, D., & DeJong, D. (2003a). Policy reform and growth in post-Soviet Russia. European EconomicReview, 47(2), 337–352.
Berkowitz, D., & DeJong, D. (2003b). Regional integration: an empirical assessment of Russia. Journal ofUrban Economics, 53(3), 541–559.
Bischoff, I. (2003). Determinants of the increase in the number of interest groups in western democracies:theoretical considerations and evidence from 21 OECD countries. Public Choice, 114(1/2), 197–218.
Bombardini, M., & Trebbi, F. (2011). Votes or money? Theory and evidence from the US Congress. Journalof Public Economics, 95(7–8), 587–611.
Bradshaw, M., & Vartapelov, K. (2003). A new perspective on regional inequalities in Russia. EurasianGeography and Economics, 44(6), 403–429.
Campos, N., & Giovannoni, F. (2007). Lobbying, corruption and political influence. Public Choice, 131(1/2),1–21.
Chowdhury, A. (2003). WTO accession: what’s in it for Russia? (BOFIT Online 10). Bank of Finland.Coate, S. (2004). Pareto improving campaign finance policy. American Economic Review, 94(3), 628–655.Coates, D., & Heckelman, J. (2003). Absolute and relative effects of interest groups on the economy. In
J. Heckelman & D. Coates (Eds.), Collective choice: essays in honor of Mancur Olson (pp. 129–142).New York: Springer.
Coates, D., Heckelman, J., &Wilson, B. (2011). Special interest groups and growth. Public Choice, 147(3/4),439–457.
DiMaggio, P., & Powell, W. (1991). Introduction. In W. Powell & P. DiMaggio (Eds.), The new institutional-ism in organizational analysis (pp. 1–40). Chicago: University of Chicago Press.
Doner, R., & Schneider, B. R. (2000). Business associations and economic development: why some associa-tions contribute more than others. Business and Politics, 2(3), 261–288.
Frye, T. (2002). Capture or exchange? Business lobbying in Russia. Europe-Asia Studies, 54(7), 1017–1036.Felli, L., & Merlo, A. (2006). Endogenous lobbying. Journal of European Economic Association, 4(1), 180–
215.
40 Public Choice (2013) 155:19–41
Golikova, V. (2009). Business associations: incentives and benefits from the viewpoint of corporate gover-nance. In T. Dolgopyatova, I. Iwasaki & A. Yakovlev (Eds.), Organization and development of Russianbusiness: a firm-level analysis. New York: Palgrave Macmillan.
Gosudarstvennaia promyshlennaia politika Rossii (2004). Chamber of commerce of the Russian Federation.http://www/tpprf.ru/ru/main/prompolmain/. Accessed on April 4, 2004.
Gray, V., & Lowery, D. (1988). Interest group politics and economic growth in the U.S. states. AmericanPolitical Science Review, 82(1), 109–131.
Grossman, G., & Helpman, E. (1994). Protection for sale. American Economic Review, 84(4), 833–850.Grossman, G., & Helpman, E. (1996). Electoral competition and special interest politics. Review of Economic
Studies, 63(2), 265–286.Grossman, G., & Helpman, E. (2001). Special interest politics. Cambridge: MIT Press.Guriev, S., Yakovlev, E., & Zhuravskaya, E. (2010). Interest group politics in a federation. Journal of Public
Economics, 94(9–10), 730–748.Guriev, S., & Rachinsky, A. (2005). The role of oligarchs in Russian capitalism. Journal of Economic Per-
spectives, 19(1), 131–150.Hanson, P., & Bradshaw, M. (2000). Regional economic change in Russia. Cheltenham: Edward Elgar.Hanson, P., & Teague, E. (2005). Big business and the state in Russia. Europe-Asia Studies, 57(5), 657–680.Heckelman, J. (2007). Explaining the rain: the rise and decline of nations after 25 years. Southern Economic
Journal, 74(1), 18–33.Horgos, D., & Zimmermann, K. (2009). Interest groups and economic performance: some new evidence.
Public Choice, 138(3/4), 301–315.Houser, D., & Stratmann, T. (2008). Selling favors in the lab: experiments on campaign finance reform. Public
Choice, 136(1–2), 215–239.Jankowski, R. (1988). Preference aggregation in political parties and interest groups: a synthesis of corporatist
and encompassing organization theory. American Journal of Political Science, 32(1), 105–125.Jankowski, R. (1989). Preference aggregation in firms and corporatist organizations: the enterprise group as
a cellular encompassing organization. American Journal of Political Science, 33(4), 973–996.Larcinese, V., Puglisi, R., & Snyder, J. (forthcoming). Partisan bias in economic news: evidence on the
agenda-setting behavior of U.S. newspapers. Journal of Public Economics.Lehmbruch, B. (1999). Managing uncertainty: hierarchies, markets and ‘networks’ in the Russian timber
industry, 1991–1998 (BOFIT Discussion Papers, No. 4). Bank of Finland.Lehner, F. (1983). Pressure politics and economic growth: Olson’s theory and the Swiss experience. In
D. Mueller (Ed.), The political economy of growth. New Haven: Yale University Press.Goldberg, P., &Maggi, G. (1999). Protection for sale: an empirical investigation. American Economic Review,
89(5), 1135–1155.Martin, C. J. (1995). Nature or nurture? Sources of firm preference for national health reform. American
Political Science Review, 89(4), 898–913.Martin, C. J., & Swank, D. (2004). Does the organization of capital matter? Employers and active labor
market policy at the national and firm levels. American Political Science Review, 98(4), 593–611.Mayda, A. M. (2006). Who is against immigration? A cross-country investigation of individual attitudes
toward immigrants. Review of Economics and Statistics, 88(3), 515–530.Mayda, A. M., & Rodrik, D. (2005). Why are some people (and countries) more protectionist than others?
European Economic Review, 49(6), 1393–1430.McFaul, M. (1993). Russian centrism and revolutionary transitions. Post-Soviet Affairs, 9(3), 196–222.Milligan, K., & Rekkas, M. (2008). Campaign spending limits, incumbent spending, and election outcomes.
Canadian Journal of Economics, 41(4), 1351–1374.Murrell, P. (1984). An examination of the factors affecting the formation of interest groups in OECD. Public
Choice, 43(2), 151–171.Olson, M. (1982). The rise and decline of nations. New Haven: Yale University Press.O’Rourke, K., & Sinnott, R. (2001). The determinants of individual trade policy preferences: international
survey evidence. In Brookings trade forum—2001 (pp. 157–196).O’Rourke, K., & Sinnott, R. (2006). The determinants of individual attitudes toward immigration. European
Journal of Political Economy, 22(4), 838–861.Potters, J., & Sloof, R. (1996). Interest groups: a survey of empirical models that try to assess their influence.
European Journal of Political Economy, 12(3), 403–442.Pyle, W. (2005). Contract disputes and the channels for inter-firm communication. Journal of Law, Economics
and Organization, 21(2), 547–575.Pyle, W. (2006). Collective action and post-communist enterprise: the economic logic of Russia’s business
associations. Europe-Asia Studies, 58(4), 491–521.Pyle, W. (2011). Organized business, political competition and property rights: evidence from the Russian
Federation. Journal of Law, Economics and Organization, 27(1), 2–31.

Public Choice (2013) 155:19–41 41
Rosser, J. B. (2007). The rise and decline of Mancur Olson’s view of the Rise and Decline of Nations.Southern Economic Journal, 74(1), 4–17.
Rutherford, T., & Tarr, D. (2006). Regional impacts of Russia’s accession to the World Trade Organization.World Bank Working Paper 4015.
Rutherford, T., & Tarr, D. (2008). Poverty effects of Russia’s WTO accession: modeling “real” householdswith endogenous productivity effects. Journal of International Economics, 75(1), 131–150.
Slinko, I., Yakovlev, E., & Zhuravskaya, E. (2005). Laws for sale: evidence from Russia. American Law andEconomics Review, 7(1), 284–318.
Solanko, L. (2008). Unequal fortunes: a note on income convergence across Russian regions. Post-CommunistEconomies, 20(3), 287–302.
Stratmann, T. (2005). Some talk: Money in politics. A (partial) review of the literature. Public Choice,124(1/2), 135–156.
Sulakshin, S., & Romanikhin, A. (2003). Ot ‘profsoyuza oligarkhov’ k profsoyuzu tovaroproizvoditelei. Vo-prosy Ekonomiki, 1, 96–103.
Zudin, A. (2006). Biznes, assotsiatsii i gosudarstvo: sravnitelnyi analiz razvitiya otnoshenii na zapade i vopostsotsialisticheskikh stranakh. Moscow: Tsentr Politicheskikh Tekhnologii.