The Competitive Challenge of Emerging Markets
30
The Competitive Challenge of Emerging Markets
Transcript of The Competitive Challenge of Emerging Markets

The Competitive Challenge of Emerging Markets


The Competitive Challenge of Emerging Markets:
China and India
By
Peter Enderwick

The Competitive Challenge of Emerging Markets: China and India By Peter Enderwick This book first published 2020 Cambridge Scholars Publishing Lady Stephenson Library, Newcastle upon Tyne, NE6 2PA, UK British Library Cataloguing in Publication Data A catalogue record for this book is available from the British Library Copyright © 2020 by Peter Enderwick All rights for this book reserved. No part of this book may be reproduced, stored in a retrieval system, or transmitted, in any form or by any means, electronic, mechanical, photocopying, recording or otherwise, without the prior permission of the copyright owner. ISBN (10): 1-5275-4106-1 ISBN (13): 978-1-5275-4106-1

This book is dedicated to Ronin, Ellery and Kira, all are destined to live through ‘interesting times’ and have the opportunity to assess the predictions for 2050.


TABLE OF CONTENTS List of Tables ............................................................................................. xi List of Figures........................................................................................... xii List of Boxes ........................................................................................... xiii Acknowledgements ................................................................................. xiv Chapter 1 .................................................................................................... 1 Introduction 1.1 Introduction 1.2 Rationale for the Book 1.3 What is an Emerging Market and a Large Emerging Market? 1.4 Demise of BRICs 1.5 Characteristics of Emerging Markets 1.5.1 Economic Characteristics 1.5.2 Technological Characteristics 1.5.3 Sociocultural Characteristics 1.5.4 Political Characteristics 1.5.5 Nature of Business Systems 1.5.6 Dynamism of the Business Environment 1.5.7 Institutional Differences and Change 1.5.7 Opportunities in Emerging Markets 1.5.8 Markets 1.5.9 Low Cost Production and Assembly 1.5.10 Learning Opportunities 1.5.11 Reverse Innovation 1.6 Why the Focus on China and India? 1.7 Conclusions Chapter 2 .................................................................................................. 31 Emerging Economies in the World Economy 2.1 Introduction 2.2 The Re-Emergence of Emerging Markets 2.3 Economic Development Models of China and India 2.4 Evolution of Emerging Markets

Table of Contents viii
2.4.1 Economic Evolution 2.4.2 Macroeconomic Stability 2.5 Conceptualizing Emerging Market Evolution 2.6 Obstacles to Emerging Market Evolution 2.6.1 External Factors Global Protectionism
Military and Strategic Threats 2.6.2 Internal Factors
Inequality Continuing Reform Sustainable Growth
2.7 Conclusions Chapter 3 .................................................................................................. 70 The Attraction of Emerging Markets 3.1 Introduction 3.2 Markets 3.2.1 Markets Size and Income Levels 3.2.2 Market Segmentation 3.2.3 Changing Consumer Behaviour 3.2.4 Competing in Emerging Markets 3.3 Low Cost Production
Made in China 2025 Make in India
3.4 Learning Opportunities 3.5 Reverse Innovation 3.6 Entering Emerging Markets 3.7 Conclusions Chapter 4 ................................................................................................ 112 The Challenges of Doing Business in Emerging Markets 4.1 Introduction 4.2 Risk in Large Emerging Markets 4.2.1 Volatility 4.2.2 Country Risk 4.2.3 Social Risk 4.2.4 Informational Risks 4.3 Corruption and Opacity 4.4 Economic Diversity 4.4.1 Economic Inequality in China 4.4.2 Economic Inequality in India

The Competitive Challenge of Emerging Markets: China and India ix
4.5 Competition in Large Emerging Markets 4.6 Institutional and Market Failures 4.6.1 Labour Market Failures 4.6.2 Product Market Failures 4.6.3 Financial Market Failures 4.6.4 Infrastructure Market Failures 4.6.5 Intellectual Property Rights Failures 4.7 Disadvantages of Foreignness 4.8 Market-Making Investments 4.9 Conclusions Chapter 5 ................................................................................................ 147 The Competitive Challenge of Emerging Market Firms 5.1 Introduction 5.2 The Size, Growth and Importance of Emerging Markets 5.3 Explaining the Rise of Emerging Market Multinationals (EMNEs) 5.3.1 Process Models 5.3.2 Alternative Sources of Competitive Advantage 5.3.3 Springboard Models 5.3.4 Linkage, Leverage and Learning 5.4 Comparing Emerging and Developed-Market MNEs 5.5 Responding to the Competitive Challenge of Emerging Market Multinationals 5.6 Conclusions Chapter 6 ................................................................................................ 176 The Future of Emerging Markets 6.1 Introduction 6.2 Predicting the Future of Emerging Markets 6.3 Emerging Markets and Future Consumption 6.4 Emerging Markets and Future Production 6.5 The Future of ‘Factory Asia’ 6.6 Emerging Markets and Learning 6.7 Can Other Emerging Markets Emulate the Success of China and India? 6.8 Policy and Management Considerations 6.9 Conclusions Chapter 7 ................................................................................................ 225 Final Thoughts 7.1 Introduction 7.2 The Demise of BRICs?

Table of Contents x
7.3 The Growing Role and Significance of Asia 7.4 EMNE Upgrading 7.5 Protectionism and Emerging Markets 7.6 The Future of Globalization and Global Leadership References .............................................................................................. 243
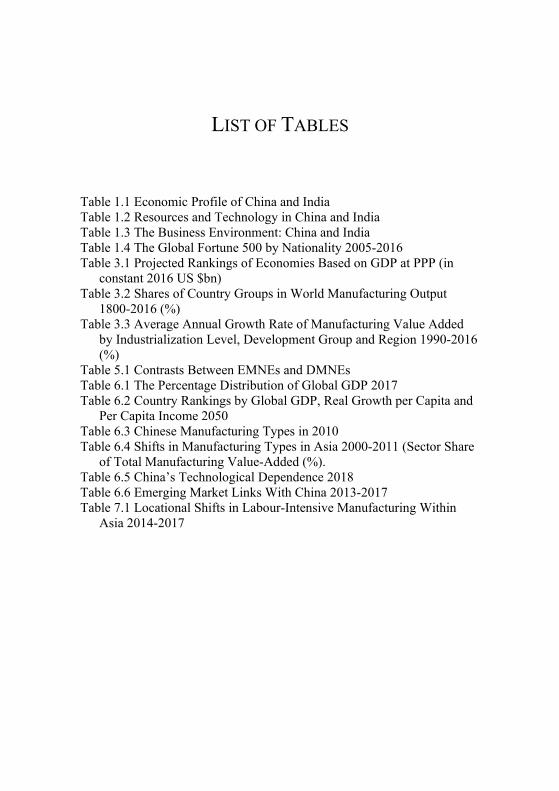
LIST OF TABLES Table 1.1 Economic Profile of China and India Table 1.2 Resources and Technology in China and India Table 1.3 The Business Environment: China and India Table 1.4 The Global Fortune 500 by Nationality 2005-2016 Table 3.1 Projected Rankings of Economies Based on GDP at PPP (in
constant 2016 US $bn) Table 3.2 Shares of Country Groups in World Manufacturing Output
1800-2016 (%) Table 3.3 Average Annual Growth Rate of Manufacturing Value Added
by Industrialization Level, Development Group and Region 1990-2016 (%)
Table 5.1 Contrasts Between EMNEs and DMNEs Table 6.1 The Percentage Distribution of Global GDP 2017 Table 6.2 Country Rankings by Global GDP, Real Growth per Capita and
Per Capita Income 2050 Table 6.3 Chinese Manufacturing Types in 2010 Table 6.4 Shifts in Manufacturing Types in Asia 2000-2011 (Sector Share
of Total Manufacturing Value-Added (%). Table 6.5 China’s Technological Dependence 2018 Table 6.6 Emerging Market Links With China 2013-2017 Table 7.1 Locational Shifts in Labour-Intensive Manufacturing Within
Asia 2014-2017

LIST OF FIGURES Figure 2.1 Historical Shares of World GDP by Nation Figure 2.2 National and Regional Shares of World GDP 1500-2000 Figure 2.3 The Growth of Emerging Economies 1996-2014 Figure 2.4 Dynamics of Emerging Market Evolution Figure 2.5 Income Shares in China and India 1980-2015 Figure 3.1 Share of World GDP at PPPs Figure 3.2 GDP per capita in PPP terms for G7 and E7 Economies 2016
and 2050 Figure 5.1 The Four Stages of Global Competition for Emerging Market
Firms Figure 6.1 E7 and G7 Growth 2014-2050 (PPP) Figure 6.2 Relative Size of G7 and E7 Economies 2014 and 2050 (PPP) Figure 6.3 Key Economies’ Share of World GDP in PPP Terms Figure 6.4 Poverty Levels 1820-2015 Figure 6.5 The Distribution of Global Income Growth 1988-2008 Figure 6.6 China’s Middle-Class Consumers 2015 and 2013 Figure 6.7 Indian Household Income Profiles 2005 to 2030 Figure 6.8 Trade by Development Status 2000-2014 Figure 6.9 Regional Shares of Global GDP (%) 1970-2014 Figure 6.10 Contribution to Global Output and Consumption Growth % Figure 7.1 The Manufacturing Smile Curve

LIST OF BOXES Box 1.1 The Return of the Frisbee Box 2.1 India’s Antiquated Labour Laws Box 3.1 IKEA Taps into India’s Growing Consumer Market Box 3.2 Augmented Reality in the Beautytech Market: A Benefit or Threat
to Retailers? Box 3.3 The Indian Car Market: Where Small Always Seems Better Box 3.4 Land Rover vs Land Wind – Dealing With Copy Products Box 3.5 India as a Global Hub for Small Car Production Box 3.6 Beyond Catch-Up: Haier A Global Leader in the Digital Era Box 3.7 Gillette in India: Can Reverse Innovation Be of Value in
Developed Markets? Box 3.8 Capturing Solar Power to Open New Markets Box 3.9 The Difficulties of Disentangling Global Value Chains Box 4.1 Patent Challenges When Manufacturing Can Occur Offshore Box 4.2 Tackling Corruption Through Demonetization Box 5.1 Building Competitive Advantage in China’s Mobile Payments
Market Box 5.2 Using Foreign Partnerships to Develop Strategy Box 5.3 Great Wall and the Hydrogen Car Box 6.1 Fab-Bag – Competing With Global Beauty Products Box 6.2 Duplicating German Facilities in China Box 6.3 The Global Impact of Industry Domination Box 6.4 The Dynamics of Locational Choice in Apparel Sourcing Box 6.5 China’s Plan to Dominate AI Box 6.6 Delphi Reinvents Itself Box 6.7 Pearl River Piano Group Box 6.8 Struggling Against the Chinese Competitive Challenge in the
Clothing and Footwear Industries Box 6.9 Betting on Technology: The New Supply Chain Model of Li and
Fung Box 6.10 Xiaomi: Strong Technically, Weak in Marketing Box 7.1 Targeting Huawei

ACKNOWLEDGEMENTS I would like to acknowledge my sincere appreciation to the Faculty of Business, Economics and Law at AUT University for granting me study leave in the first half of 2019 which provided me the time and freedom to write this book, and to my wife Martha for extending that freedom to within our home.
Peter Enderwick Hamilton New Zealand
August 2019.

CHAPTER 1
INTRODUCTION
1.1 Introduction
This book addresses a topic that continues to be of critical importance to the global economy, the growing role and influence of emerging economies, particularly the economies of China and India. The rapid growth of these two economies over the past four or so decades has had far reaching implications. Exports of manufactured products, outsourcing of service tasks, international tourist flows, and cross-border investment are just some of the areas where these large emerging economies have attained massive significance. In many ways their growth has been positive - increasing consumer welfare through lower prices and greater choice, adding to the global stock of intellectual capital, stimulating recovery from the Global Financial Crisis, and providing rapidly growing markets for international businesses. Of course, the rise of these two massive economies, with a combined population of 2.7 billion, has also created anxiety and adjustment struggles. Job security for many is now tenuous, commodity prices have been driven up, wages for the least skilled have stagnated, international competition has intensified, pollution levels are threatened by rising global output, several industries have struggled to survive in the developed economies, and rising protectionism is evident in a number of sectors.
For students of the world economy these are more than interesting times. The resurgence of what are termed the emerging economies, countries that long dominated global output but lost their position following the Industrial Revolution, has wide reaching and complex implications for the world economy and the balance of geo-political power.
1.2 Rationale for the Book
While there are a vast number of books and papers that address the economic renaissance of China and India, there is a need for a text that

Chapter 1 2
offers a systematic and robust discussion of the many positions and perspectives that characterize this area of study. Many of the existing studies adopt a single-country perspective or a highly selective focus on one aspect of the evolution of emerging economies. It is the concurrent development of the large emerging economies, particularly China and India, together representing 36 percent of the world's population that is such a unique and profound development. While other economies have emerged and reached development status in the past century - Japan, Singapore and South Korea for example - this falls well short of the scale of China and India, and adjustment by the West to their ascendance was managed with relative ease. In addition, the separate consideration of either China or India is somewhat artificial: they are complementary in the sense that one offers diverse manufacturing capability; the other contract service capability. They also compete in markets for resources, particularly energy resources, and in aspiring to upgrade, as with the 2014 Indian government initiative, Made in India.
There has been a surge in research interest on emerging economies (Sharma 2013; Wright et al. 2005). This work has provided novel insights into the home market conditions of emerging economies, in particular the influence of institutional weaknesses (Khanna and Palepu 1997; Peng et al. 2008) and government policies (Wang et al. 2012) enabling a more insightful understanding of the challenges of operating in such markets. Research has also focused on a subsequent stage of evolution in emerging markets, the rapid internationalisation of emerging market firms (Mathews 2006; Luo and Tung 2018; Peng 2012). This book provides a timely opportunity to examine this body of research.
It also provides an opportunity to reflect on the significant changes that have occurred in the global economy over the past decade and what these mean for doing business in emerging economies. Four key trends are apparent. The first is the continuing and growing importance of emerging economies. China and India, as well as several other emerging economies, have continued to experience higher than average rates of economic growth and deeper integration within the global economy. From 2009 China has been the world's leading exporting nation with a 13.2 percent share of world merchandise trade in 2016. India was the eighth largest exporter of commercial services in 2016. China's degree of global economic integration is also apparent from its foremost position as a trader in intermediate goods in 2015. Intermediate goods reflect the domestic value added that is embodied in goods exported for further value adding in other countries (WTO 2017).

Introduction 3
Generally, developing countries have increased their participation in world trade. Their share of merchandise trade has steadily increased reaching 41 percent in 2016 while for commercial services the share was 36 percent. Trade between developing countries, so-called ‘South-South trade’ also grew strongly. By 2015 more than half of all developing country exports were destined for other developing countries, with more than two-thirds of manufactured exports following this route. In contrast, the share of the least developed economies remains very low with a collective trade share of less than one percent (WTO 2017).
In several instances emerging economies have come to dominate an industry globally. This is certainly the case for China which is the dominant producer of solar energy panels and electric vehicles, a major supplier of wind turbines, and responsible for more than 80 percent of all the shipping containers produced in the world. China's size as a market and as a producer of products such as motor vehicles is also reshaping industry strategy globally.
These changes are elements of a broader shift that is occurring as economic power is captured by developing economies (the ‘South’) seemingly at the expense of the wealthy 'North' (the developed economies). This shift is reflected in rising purchasing power in developing nations, patterns of foreign direct investment flows, offshoring of tasks, and the restructuring of industries (Dicken 2015). Long term forecasts suggest that by 2050 China and India will be the two largest economies in the world as measured by GDP in purchasing power parity (PPP) terms, with six of the top seven economies being currently termed emerging economies (PWC 2017).
A second key development has been the slowing of economic growth, particularly since the Global Financial Crisis (GFC) in 2008. While most economies experienced a slowing of growth rates following the GFC, the emerging economies showed the fastest rates of recovery and convergence with long-term underlying growth levels. For example, between 2007 and 2011 only four of the G7 group of economies (Germany, Canada, Japan, Italy, France, UK and US) regained their pre-recession output levels. In comparison, all members of the E7 group of major emerging economies (China, India, Brazil, Russia, Mexico, Turkey and Indonesia) were producing more in 2011 than in 2007. As a result, the G7's share of global output fell by 4 percent between 2010 and 2016, while developing countries increased their share to 39 percent and the E7 to 20 percent (Standard Chartered 2018). This ability to recover rapidly and higher
Chapter 1 4
average growth rates, underpin predictions of the future economic dominance of emerging economies, with the E7 outweighing the G7 as early as 2020.
A third significant change has been globalization. While the global economy has continued to evolve over the past decade, it has revealed several subtle changes in character. While recovery in trade in tangible goods and foreign investment flows has been slow, the global growth in knowledge intensive activities such as data and innovation transfer has boomed. This has increased the information intensity of global exchanges (MGI 2016). It is also increasingly apparent that contemporary globalization, while emphasizing efficiency, has contributed to rising income inequality, adversely affecting the middle classes in developed economies (Milanovic 2016). Globalization is also bringing increased rates of technological change, and in some cases, such as the car industry, disruptive changes. More generally, new business models are increasingly evident, particularly platform-based options that have eased barriers to entry and facilitated rapid scaling up of output (Parker et al. 2016). Businesses increasingly capture and employ detailed information on transactions, encouraging the harnessing of 'big data' (Simon 2015). At the same time, consumers enjoy greater bargaining power where they are increasingly informed about product choices, costs, and the ethical nature of production processes (Simonson and Rosen 2014).
These changes in the nature and impact of globalization have contributed to both consumer sovereignty and social anxiety and a questioning of the social contract in developed economies. This is a fourth feature of contemporary globalization and is manifested in reconsideration of its value and associated costs, a revisiting of existing trade agreements, rejection of major economic initiatives, the weakening of regional integration, and the rise of global protectionist measures. Such concerns have been readily apparent in Western Europe and the United States (Clarke et al. 2017; Graceffo 2017).
These changes in globalization need to be incorporated into an analysis of the growth and prospects of emerging economies. The distinctive features of this book are that it offers a dynamic conceptualisation of the advancement of emerging markets while considering the international business implications of this evolution.

Introduction 5
1.3 What is an Emerging Market and a Large Emerging Market?
Defining an emerging market is not straightforward and several approaches have been proposed. The first, and the original purpose, was the perspective of an emerging market as one that offered potential investors higher rates of risk, but also returns. In the mid-1980s the International Finance Corporation, a subsidiary of the World Bank, pressed for increased capital investment in developing countries. Several institutional investors began to target these markets and a year later the MSCI began its first emerging market index. Classifications such as these distinguished between the more established, and usually larger emerging markets that were displaying high and consistent growth rates, and so-called 'frontier markets' that while highly risky, had the potential to possibly be classified as emerging in the future.
This view of emerging markets as investment opportunities was based on both their higher than average growth rates and their youthful and rapidly growing populations that would power employment and consumer spending. From the investment perspective, while risky, these markets were characterised by high growth, lower than average debt to GDP ratios, and relatively high levels of foreign reserves. Clearly, this perspective offers few insights into what emerging means in a dynamic sense, rather it focuses on the potential for higher than average growth rates and investment returns.
Beyond the capital investment perspective, an international business view has evolved that adopts a broader conception of what emerging means. Using World Bank income-based classifications, an emerging market is one that has not attained the levels of per capita income enjoyed by the developed economies. Equally, the above average growth rates of emerging economies mean that they are not included within the group of least developed economies. This puts them in the broader, and numerically most sizeable group, developing economies. The critical question then is what distinguishes them within this broader group: what differentiates emerging from developing?
Several criteria have been identified. The first is an above average economic growth rate, and a rate that is maintained over a significant period. Volatility in growth rates with frequent setbacks and crises is unlikely to ensure an economy is emerging in the sense of making the transition from developing to developed.
Chapter 1 6
In addition, several other accompanying characteristics would be expected. Economic development brings decreasing dependence on agricultural production as resources are moved into more productive manufacturing or service industries. Accompanying economic development are likely social changes including increased urbanisation and the emergence of an increasingly affluent middle-class driving consumer spending and investment in education and health care. There is no requirement that an emerging economy is one that emulates the market and institutional arrangements of developed, particularly Western, economies. The simple grouping of the BRIC nations (Brazil, Russia, India and China) demonstrates the possible heterogeneity in industrial structures, political processes, and economic systems that are consistent with emerging status.
A significant advantage of this broader approach to defining an emerging market is that is does not rely solely on income levels. Certain economies, particularly exporters of valuable commodities, can enjoy high levels of income, but not experience the accompanying economic and social changes. For example, economies such as Qatar and the United Arab Emirates would be considered as developed using just World Bank income groupings.
A further advantage is its usefulness in international business strategy. Understanding the evolution of emerging markets, and particularly the challenges they present, becomes far more important to international business investment with its much longer-term commitment and illiquid assets, when compared with international portfolio investment. International businesses seeking markets for products or new locations to produce, need a far more detailed and nuanced understanding of these locations than is offered simply by expected rates of return. For this reason, subsequent chapters set out the opportunities, challenges, and competitive reactions that are likely to be experienced when doing business in emerging markets.
It is important to note that other definitions of emerging markets have also been proposed. One of the most widely used conceptions is based on institutional dimensions. Khanna et al. (2005) argue that emerging markets can be defined in institutional terms by the difficulty that buyers and sellers face when undertaking transactions. Economic systems require institutional mechanisms to facilitate market exchanges. Such institutions, both formal and informal (North 1990), provide valuable intermediary services that support market processes. Institutions such as consumer

Introduction 7
protection, quality certification and equity access, help to overcome information asymmetries and anticipation of transaction difficulties.
For Khanna and Palepu, emerging markets are those that lack efficient institutions impeding the effective functioning of markets. This they term 'institutional voids'. Institutional voids may arise in economies in transition such as China, Russia and Vietnam, where the introduction of market processes occurs in the absence of supporting institutions, since such institutions were unnecessary when economic activities were state directed. It takes a long time to develop credible institutions in areas such as banking, auditing and legal systems. Voids may also exist in states where government control is weak and which might have experienced civil unrest or dictatorial rule, or may lack the capability to guarantee property rights, ownership protection, and effective contract enforcement.
While this definition appears valuable in distinguishing emerging markets from more developed ones, it is subject to several weaknesses. First, it is apparent that there are many alternative institutional forms and local, often informal, variants may emerge to assume the role traditionally played by formal institutions in Western economies (Mair et al. 2012). Indeed, emerging market firms often develop innovative responses to such voids based on family ownership (facilitating trust), business groups (enabling the creation of internal capital markets), and reputation (signaling reliability and fortitude) (Khanna and Rivkin 2006; Gao et al. 2017).
Second, it is not only emerging markets that face institutional voids or weaknesses, they may also be found in developed economies, often as a result of government controls or regulations. For example, while Germany was ranked 24/190 countries in the 2018 Ease of Doing Business index, it rated only 114/190 on the ease of starting a new business. Similarly, Italy scores badly in areas such as paying taxes and enforcing contracts. This suggests that all economies are likely to experience some degree of institutional weaknesses, and it is not clear what level of failing distinguishes an emerging economy from a developed or developing economy, even when emerging markets are described as dysfunctional (Gao et al. 2017).
Third, the approach of institutional voids fails to consider the problem of institutional redundancy which occurs when events render existing institutions ineffective. This might occur, for example, when regional or global pressures mean that domestic institutions no longer provide effective solutions. Under such circumstances regional or global
Chapter 1 8
institutions, such as trade arrangements, may substitute. Alternatively, dissatisfaction with such provisions may encourage the increased use of informal political mechanisms.
All these approaches are certainly more useful than a default view of emerging markets as simply developing economies that have yet to 'emerge'. This book adopts an international business perspective that focuses on the attractions and challenges of doing business in emerging economies. This suggests that large emerging markets such as China or India, while sharing the evolving characteristics discussed above, also feature a sizeable population. In practical terms the World Bank in July 2017 categorized upper middle-income economies, the income group that correspondents most closely with 'emerging economies', as those with per capita incomes between almost US$4000 and $12000.
1.4 The BRICs Grouping
A further change that has occurred over the past 15 years is the declining utility of the acronym BRICs - Brazil, Russia, India and China. The term, first popularized in 2001 by Jim O'Neill of Goldman Sachs, was a widely adopted gauge of the growing power of emerging economies, particularly the four large emerging markets that were forecast to dominate global business in the future. For several reasons, the term, while catchy, is of much less value today. It was always a tenuous foundation for categorization, based as it was solely on population size and potential economic impact. Deeper analysis reveals significant differences between these economies. Major variations are evident in their industrial structures (Brazil with its dependence on agricultural and natural resources), Russia (energy products), India (services) and China (manufacturing), as well as their economic and political systems (command, state-driven and authoritarian). Any similarities between these four large emerging markets such as growth rates, increasing liberalisation or emerging consumer groups, were likely to be specific to just a single point in time. In the early 1980s, Russia was at the centre of the relatively isolated Soviet Bloc, Brazil was dealing with a debt crisis, China was just opening to the world, and India was still suffering the so-called ‘Hindu Rate of Growth’ and yet to embark on radical economic reform. Equally, we should not expect a high level of similarity between these economies 20 years in the future.
The importance of the BRICs has also been eclipsed by the rise of other geographically dispersed emerging economies. Other groupings that have been highlighted include MINT (Mexico, Indonesia, Nigeria and Turkey)
Introduction 9
and the 'Next Eleven' (Bangladesh, Egypt, Indonesia, Iran, South Korea, Mexico, Nigeria, Pakistan, the Philippines, Turkey and Vietnam) (O'Neill 2011), but success stories appear increasingly disparate. In the period 2008-2017 Ethiopia, Uzbekistan, Qatar and Turkmenistan were amongst the fastest growing economies in the world, all experiencing average GDP growth in excess of 8 percent over the period (MGI 2018). In part their growth was stimulated by the development of other emerging economies, particularly China, and its demand for energy and other resources. In the case of Ethiopia, China has been a major investor, outsourcing work from its clothing and textiles sector.
The BRIC countries have also displayed marked differences in economic performance. China's growth rate, while slowing from the double-digit rates experienced in the 2000s, remains strong. India suffered a significant slowdown in 2016, while Brazil is experiencing massive economic and political unrest as a result of a slowing of growth due to falling commodity prices and a wide-reaching corruption scandal. Russia's growth rate since 2013 has averaged around one percent per annum as a result of weak energy prices and trade sanctions. An optimistic assessment would suggest that in economic growth terms, the BRIC group has fractured into two, with China and India still displaying levels of growth capable of assuring their continuing economic influence. It is difficult to say the same of Brazil and Russia. Indeed, a recent analysis of high performing developing countries suggests that there are greater similarities between countries within geographic regions than between regions, with the strongest performers all being found within Asia (MGI 2018).
There is also speculation that the growth prospects of emerging economies will be more adversely affected by the rapidly unfolding Fourth Industrial Revolution (the blurring of the digital and physical realities as a result of new technologies including robotics, 3D printing, nanotechnology and the Internet of Things) than the advanced economies. The higher negative impact is the result of the concentration in emerging economies of the types of tasks that are vulnerable to automation, as well as their weakness in digitally complementary resources (an effective business environment, skilled workforces, and accountable governments) (World Bank 2016).
For businesses seeking to enter emerging markets a more meaningful categorization may be the existence of a global middle class, individuals earning between $11 and $110 per person per day in 2011 purchasing power parity (PPP) terms. Such individuals, and the households they comprise, are lifted out of poverty and power an economy through their

Chapter 1 10
ability to buy consumer durables and a range of services. There were an estimated 3.2 billion middle class consumers at the end of 2016, responsible for about $35 trillion in expenditure, a third of global GDP. Future growth of the middle class will be regionally concentrated, with Asia accounting for nearly 90 percent (Kharan 2017).
Table 1.1 Economic Profile of China and India
China India
Population (2018) 1.39 billion 1.32 billion
Share in world population (2013) 19% 17.1% Share in world territory (2013) 7.1% 2.4% Population growth rate (2017) 0.41 1.17 Population below poverty line (2011) 3.3% 21.9% Median population age (2017) 37.4 27.9 GDP (PPP) 2017 $23.12
trillion $9.45 trillion
GDP per capita (PPP) 2017 $16,600 $7200 GDP per capita (MER) 2017 $8116 $1717 GDP real growth rate 2015-2017 % 6.8% 7.3% GDP real growth rate compared to world rate 2015-2017
195% 209%
Gross national savings as % of GDP (2017) 45.4% 28.6% Reserves of foreign exchange and gold (2017)
$3.194 trillion
$407.2 billion
Debt as a % of GDP (2016) 44.3% 68.9% Taxes and other revenues as a % of GDP (2017)
22.4% 10.2%
Inflation rate 2016-2017 1.9% 4.1% Share of primary industry to GDP (2014) 9.2% 19.5% Share of secondary industry to GDP (2014)
42.6% 27.5%
Share of tertiary industry to GDP 2014 48.2% 53.0% Share of total merchandise exports (2016) 13.2% 1.7% Exports of goods and services as % of GDP (2016)
19.6% 19.2%
High tech exports as % of manufactured exports (2016)
25.2% 7.13%
Stock of Inward FDI (2017) $1.524 trillion
$367.5 billion

Introduction 11
Stock of Outward FDI (2017) $1.342 trillion
$156.1 billion
Number of international migrant stock (2015)
10 million 16 million
Value of remittances from international migrants (2017)
$61 billion $65 billion
Sources: CIA Factbook; BRICs Joint Statistical Publication 2016
1.5 Characteristics of Emerging Markets
If emerging economies are considered as the sub-group of developing economies that show strong and persistent evidence of economic development, several characteristics that they are likely to share can be identified.
1.5.1 Economic Characteristics
In economic terms, emerging markets enjoy above average rates of economic growth and in many cases, the very highest rates achieved. China’s sustained double-digit growth rate during the 1980s and 1990s, was the fastest sustained growth period ever recorded. However, growth rates have declined to a more modest 7 percent since 2005. India's growth was historically modest but increased during the late 1980s to peak in 1989 but fell to just 2 percent in the crisis year of 1991. Liberalization has enabled average growth since 2000 at almost 6 percent. Such growth is not regular and most emerging economies are characterised by high levels of growth volatility. Volatility can be triggered by outside events such as the Asian Financial Crisis of 1997 or the Global Financial Crisis of 2008, or by domestic policies such as a raising of interest rates. A common fear is the danger of inflation and price bubbles in housing, commodity or stock markets. China experienced an inflation rate greater than 7 percent in 2008 and 2011 but rates have been curtailed to less than 2 percent in recent years. Similarly, India saw rates of 11 percent in 2009 and 10 percent in 2012 but these have fallen to below 4 percent since 2014.
Also significant is the contribution that emerging markets now make to global economic growth. This is a result of both their higher than average growth rates and their increasing weight in the global economy. For example, of a world GDP growth rate in 2018 of 3.7 percent, 1.2 percent, or 33 percent of the total, was attributable to China, with a further 1.7
Chapter 1 12
percent (45 percent of world GDP growth) due to other emerging economies, and just 10 percent attributable to growth in the United States.
It is also important to note that the benefits of economic growth in emerging markets are not enjoyed universally or equally. China's strong growth has brought significant inequality with a marked rural-urban income gap; incomes are, on average, almost three times higher in urban areas, creating a strong incentive for internal migration (Fan et al. 2011). While India does not have such a high level of inequality, there are sizeable differences between states in both income levels and economic growth rates, and little evidence of convergence. These differences in growth are important to international businesses since they suggest that levels of disposable income and spending, as well as wage levels, are likely to vary considerably within an emerging economy.
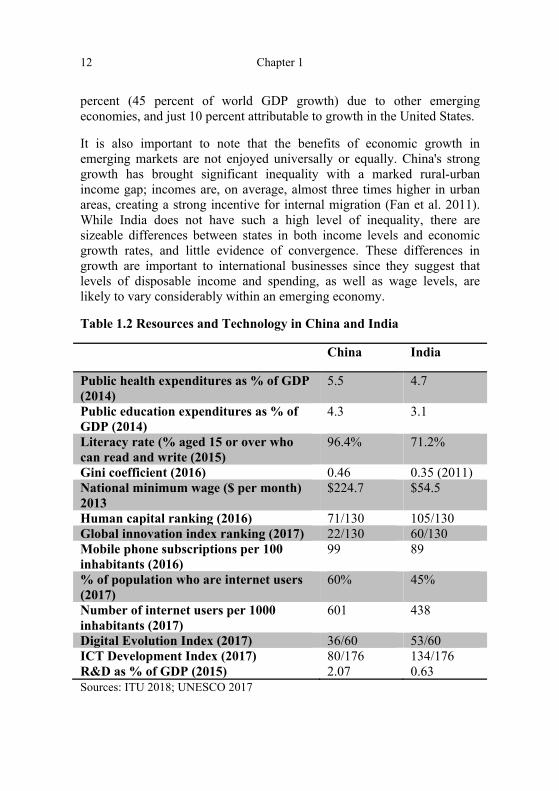
Table 1.2 Resources and Technology in China and India
China India
Public health expenditures as % of GDP (2014)
5.5 4.7
Public education expenditures as % of GDP (2014)
4.3 3.1
Literacy rate (% aged 15 or over who can read and write (2015)
96.4% 71.2%
Gini coefficient (2016) 0.46 0.35 (2011) National minimum wage ($ per month) 2013
$224.7 $54.5
Human capital ranking (2016) 71/130 105/130 Global innovation index ranking (2017) 22/130 60/130 Mobile phone subscriptions per 100 inhabitants (2016)
99 89
% of population who are internet users (2017)
60% 45%
Number of internet users per 1000 inhabitants (2017)
601 438
Digital Evolution Index (2017) 36/60 53/60 ICT Development Index (2017) 80/176 134/176 R&D as % of GDP (2015) 2.07 0.63 Sources: ITU 2018; UNESCO 2017
Introduction 13
1.5.2 Technological Characteristics
A further characteristic of emerging economies is growing commitment to technological upgrading. In many cases they are still heavily dependent on advanced economies for much of their technology, but the more mature emerging countries are now making considerable investments in research and development (R&D). China is now the second largest spender on R&D after the United States. It has increased its R&D expenditure as a percentage of GDP from 0.56 percent in 1996 to 2.07 percent in 2015. Over the same period India's commitment has remained the same at 0.63 percent. These can be compared with the United States and Sweden which in 2015 committed 2.79 percent and 3.26 percent of GDP to R&D. In terms of the number of researchers per million inhabitants, the United States had 4,231 in 2018, China had 1,113, and India just 156. The top research-intensive economies are distinguished by a high proportion of total R&D spending from the business sector. This is apparent when we examine the proportion of total R&D spending accounted for by government: 11.3 percent in the United States in 2018; 15.8 percent in China and 61 percent in India (UNESCO: http://uis.unesco.org/apps/ visualisations/research-and-development-spending/).
More specific measures of technological activity such as patenting and high-tech exports show the extraordinary rise of China. In recent years China has been the main driver of new patents and in 2015 accounted for 38 percent of all patents registered, compared with 20 percent for the United States. A ranking of countries in terms of patenting activity in 2015 has China as number one, the United States number two, and India fourteenth. Due to the high numbers of applications filed in China, the patent offices of emerging economies have seen their combined share of the world total increase from 17 percent in 2005 to 44 percent in 2015 (WIPO 2016).
As Table 1.1 shows, China also performs well in terms of high-tech exports as a proportion of all manufactured exports (25 percent), with levels comparable to more advanced economies including France, the United Kingdom and South Korea, and higher than both Germany and the United States. However, it is important to understand that many of China's high-technology exports are produced by foreign-funded firms and not exclusively by Chinese manufacturers. China is now firmly integrated into global value chains and was, for example, the major source of high-tech imports into the EU in 2017 (Eurostat 2018).

Chapter 1 14
Technological conditions in China and India are improving rapidly. Both countries recognize the importance of developing capability in higher-value activities. To encourage innovation both China and India have invested in science and technology parks. India has some of the world's leading software technology parks. China now has 17 national high technology innovation parks and almost 150 regional ones. It also has more than 5000 high tech start-up incubators. Both countries have been successful in attracting R&D investments from major multinational enterprises. Major MNE spenders in China include IBM, Motorola, Nokia, Sony, NEC and Samsung. India has attracted significant R&D investments in the software sector and engineering including GE, IBM, Texas Instruments, Hitachi and Cummins. At the same time Chinese and Indian companies are increasing their R&D spending. The Chinese telecommunications and networking companies Huawei and ZTE were amongst the top patent applicants in 2017. Huawei spends 14 percent of revenue on R&D, a figure that is greater than Microsoft or Amazon, and close to Google (Alphabet). It has established R&D centres in twenty-one overseas locations including Russia, France, the US, Canada, Pakistan and the UK. India's Dr Reddy, a major pharmaceutical manufacturer spends 9.5 percent of operating income on R&D and maintains research centres in the United States, the United Kingdom, and the Netherlands as well as India.
Emerging market firms have also become more aggressive in augmenting their technological assets through international mergers and acquisitions (M&As). This may be a natural consequence of the economic evolution of emerging markets: they increasingly have the funds to buy desired technologies. Other motives include the wish to achieve developed country status and to build on government initiatives such as Made in China 2025, the One Belt, One Road project, or India's Make in India campaign.
China has been the most aggressive cross-border acquirer with the number and value of such deals spiking after 2014. In 2016 Chinese firms spent six times more on foreign acquisitions than foreign firms spent acquiring Chinese businesses. Chinese companies were also involved in some of the largest deals (McKinsey and Co. 2017). However, despite this growth, Chinese companies still spend less as a percentage of GDP on foreign acquisitions than do US or European companies.
Recent Chinese acquisitions have become larger, more focused on technology and gaining majority control, and more likely to involve private sector firms. The targeted sectors have shifted from traditional

Introduction 15
energy and commodity sectors to more technology-intensive firms such as German robot manufacturer Kuka. Also striking is the declining role of Chinese state-owned enterprises in foreign acquisitions. While such firms are involved in some of the largest deals, and are more likely to be repeat acquirers, private sector firms now account for the largest number of deals.
The rapid growth of Chinese outward investment has attracted policy responses. A few deals have been denied approval, particularly in the United States, and often on grounds of national security. In other cases, specific remedies or additional conditions have been imposed before approval has been granted. At the same time the Chinese authorities have become wary of so-called ‘irrational deals’ that fall outside the core business of the buyer, such as the purchase of Italy's AC Milan soccer team. This topic is considered in more detail in Chapter 5.
1.5.3 Sociocultural Characteristics
Sociocultural conditions, when characterised by ethnic or cultural fragmentation, can present formidable challenges for developing economies. The experience of the Balkan region in the 1990s or Indonesia and Myanmar today, illustrate how debilitating such tensions can be with negative impacts on economic development. As well as destroying domestic business, conflict and sometimes government responses to it, discourage often much needed foreign investment and aid. Outward migration, often of the most highly educated, further weakens growth prospects. Countries may face sanctions or find themselves ostracized in economic forums.
China and India are well positioned in terms of sociocultural accord. China comprises 92 percent Han Chinese, the largest ethnic group in the world. The small ethnic minority population is found mainly in the border regions of the northwest. While China experiences thousands of protests each year, these are usually localised, often focusing on land transactions involving officials or poor workplace conditions and are rapidly resolved (Chan et al. 2014). More substantial demonstrations are sometimes seen in the Special Administrative Region (SAR) of Hong Kong. Ethnically, India is predominantly Indo-Aryan, accounting for 72 percent of the population. In terms of religious composition almost 80 percent of Indians are Hindu, and 14 percent are Muslim. Generally, these groups coexist successfully. However, as India modernizes there have been widespread protests in recent years, with a focus on women's rights and safety as well as environmental concerns.

Chapter 1 16
Both China and India have large diaspora populations that are spread out across the world. There are some 16 million Indians outside of India, with sizeable populations found in the United Arab Emirates and the United States. China's outflows have occurred over a much lower time period and there are an estimated 46 million overseas Chinese. Many have settled in the United States and Japan as well as dominating the business community in many South East Asian countries including Malaysia, Singapore, Taiwan and Indonesia. This diaspora is important in economic development terms as they facilitate trade relations and remit huge amounts of funds. As Table 1.1 illustrates, in 2017 both China and India each received more than $60 billion in remittances.
The structural changes affecting emerging economies mean that both China and India are experiencing increased urbanisation, even though levels are still lower than those found in other emerging economies. Between 2006 and 2016 China's rural population declined from 55.6 percent to 43 percent, as a result of 30 years of rapid industrialization. Continuing wage differentials and attractive employment opportunities mean that urbanisation is likely to continue. China has more than 160 cities with populations greater than one million residents, and six cities with more than ten million people. India has a higher rural population, 67 percent of the total population in 2017. India has fewer mega cities, with 40 having populations greater than one million and just two (Delhi and Mumbai) with more than ten million. Continuing internal migration might reduce upward pressure on wages, although in the case of China work is being diverted to less prosperous regions, while India's service economy relies primarily on skilled labour.
Examining fertility rates makes clear why India is expected to outgrow China in the longer run. China's fertility rate has fallen from 5.7 in 1960 to just 1.6 in 2016. India has also seen a marked decline, from 5.9 to 2.3 over the same period. China's rate is too low despite the relaxation of the long standing one-child policy in 2015. Projections suggest that by 2030, a quarter of China's population will be aged 60 or more. Such a low fertility rate impedes economic development because of a shrinking labour force and rapidly ageing population. The Chinese authorities are considering a range of possible measures designed to push up the birth rate including tax incentives and paternity leave.