The Comparative Analysis of Economic Forecasting Model on China's Logistics Engineering Industry
6
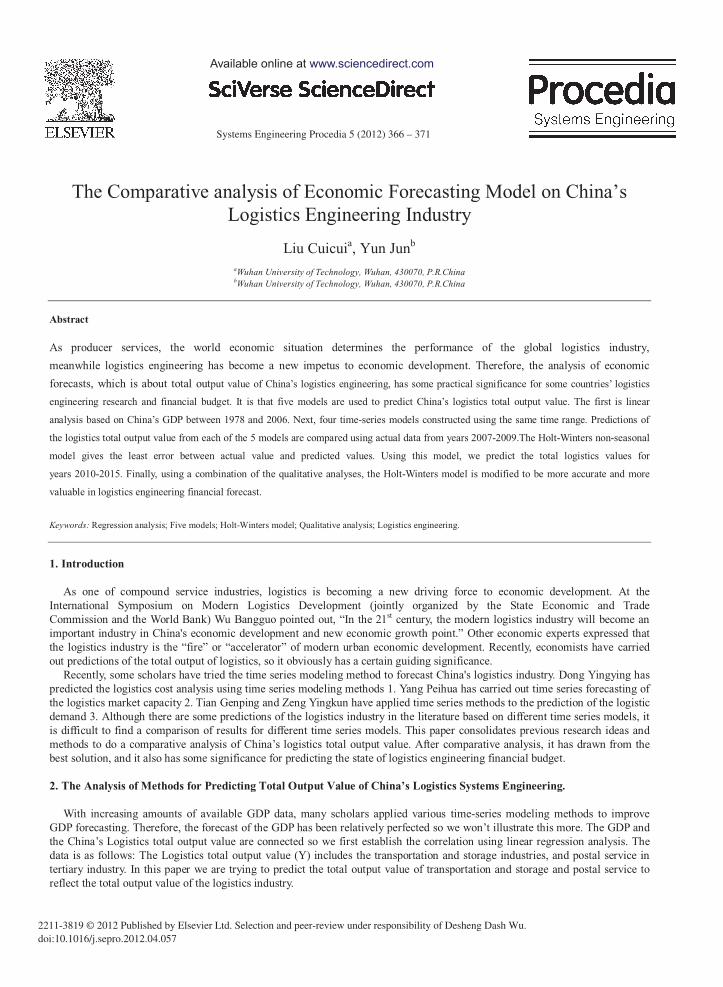
Systems Engineering Procedia 5 (2012) 366 – 371 2211-3819 © 2012 Published by Elsevier Ltd. Selection and peer-review under responsibility of Desheng Dash Wu. doi:10.1016/j.sepro.2012.04.057 The Comparative analysis of Economic Forecasting Model on China’s Logistics Engineering Industry Liu Cuicui a , Yun Jun b a Wuhan University of Technology, Wuhan, 430070, P.R.China b Wuhan University of Technology, Wuhan, 430070, P.R.China Abstract As producer services, the world economic situation determines the performance of the global logistics industry, meanwhile logistics engineering has become a new impetus to economic development. Therefore, the analysis of economic forecasts, which is about total output value of China’s logistics engineering, has some practical significance for some countries’ logistics engineering research and financial budget. It is that five models are used to predict China’s logistics total output value. The first is linear analysis based on China’s GDP between 1978 and 2006. Next, four time-series models constructed using the same time range. Predictions of the logistics total output value from each of the 5 models are compared using actual data from years 2007-2009.The Holt-Winters non-seasonal model gives the least error between actual value and predicted values. Using this model, we predict the total logistics values for years 2010-2015. Finally, using a combination of the qualitative analyses, the Holt-Winters model is modified to be more accurate and more valuable in logistics engineering financial forecast. Keywords: Regression analysis; Five models; Holt-Winters model; Qualitative analysis; Logistics engineering. 1. Introduction As one of compound service industries, logistics is becoming a new driving force to economic development. At the International Symposium on Modern Logistics Development (jointly organized by the State Economic and Trade Commission and the World Bank) Wu Bangguo pointed out, “In the 21 st century, the modern logistics industry will become an important industry in China's economic development and new economic growth point.” Other economic experts expressed that the logistics industry is the “fire” or “accelerator” of modern urban economic development. Recently, economists have carried out predictions of the total output of logistics, so it obviously has a certain guiding Recently, some scholars have tried the time series modeling method to forecast China's logistics industry. Dong Yingying has predicted the logistics cost analysis using time series modeling methods 1. Yang Peihua has carried out time series forecasting of the logistics market capacity 2. Tian Genping and Zeng Yingkun have applied time series methods to the prediction of the logistic demand 3. Although there are some predictions of the logistics industry in the literature based on different time series models, it is difficult to find a comparison of results for different time series models. This paper consolidates previous research ideas and methods to do a comparative analysis of China’s logistics total output value. After comparative analysis, it has drawn from the best solution, and it also has some significance for predicting the state of logistics engineering financial budget. significance. 2. The Analysis of Methods for Predicting Total Output Value of China’s Logistics Systems Engineering. With increasing amounts of available GDP data, many scholars applied various time-series modeling methods to improve GDP forecasting. Therefore, the forecast of the GDP has been relatively perfected so we won’t illustrate this more. The GDP and the China’s Logistics total output value are connected so we first establish the correlation using linear regression analysis. The data is as follows: The Logistics total output value (Y) includes the transportation and storage industries, and postal service in tertiary industry. In this paper we are trying to predict the total output value of transportation and storage and postal service to reflect the total output value of the logistics industry. Available online at www.sciencedirect.com
Transcript of The Comparative Analysis of Economic Forecasting Model on China's Logistics Engineering Industry
Systems Engineering Procedia 5 ( 2012 ) 366 – 371
2211-3819 © 2012 Published by Elsevier Ltd. Selection and peer-review under responsibility of Desheng Dash Wu.doi: 10.1016/j.sepro.2012.04.057
The Comparative analysis of Economic Forecasting Model on China’sLogistics Engineering Industry
Liu Cuicuia, Yun Junb
aWuhan University of Technology, Wuhan, 430070, P.R.ChinabWuhan University of Technology, Wuhan, 430070, P.R.China
Abstract
As producer services, the world economic situation determines the performance of the global logistics industry,
meanwhile logistics engineering has become a new impetus to economic development. Therefore, the analysis of economic
forecasts, which is about total output value of China’s logistics engineering, has some practical significance for some countries’ logistics
engineering research and financial budget. It is that five models are used to predict China’s logistics total output value. The first is linear
analysis based on China’s GDP between 1978 and 2006. Next, four time-series models constructed using the same time range. Predictions of
the logistics total output value from each of the 5 models are compared using actual data from years 2007-2009.The Holt-Winters non-seasonal
model gives the least error between actual value and predicted values. Using this model, we predict the total logistics values for
years 2010-2015. Finally, using a combination of the qualitative analyses, the Holt-Winters model is modified to be more accurate and more
valuable in logistics engineering financial forecast.
Keywords: Regression analysis; Five models; Holt-Winters model; Qualitative analysis; Logistics engineering.
1. Introduction
As one of compound service industries, logistics is becoming a new driving force to economic development. At theInternational Symposium on Modern Logistics Development (jointly organized by the State Economic and Trade Commission and the World Bank) Wu Bangguo pointed out, “In the 21st century, the modern logistics industry will become an important industry in China's economic development and new economic growth point.” Other economic experts expressed that the logistics industry is the “fire” or “accelerator” of modern urban economic development. Recently, economists have carried out predictions of the total output of logistics, so it obviously has a certain guiding
Recently, some scholars have tried the time series modeling method to forecast China's logistics industry. Dong Yingying has predicted the logistics cost analysis using time series modeling methods 1. Yang Peihua has carried out time series forecasting of the logistics market capacity 2. Tian Genping and Zeng Yingkun have applied time series methods to the prediction of the logisticdemand 3. Although there are some predictions of the logistics industry in the literature based on different time series models, itis difficult to find a comparison of results for different time series models. This paper consolidates previous research ideas and methods to do a comparative analysis of China’s logistics total output value. After comparative analysis, it has drawn from the best solution, and it also has some significance for predicting the state of logistics engineering financial budget.
significance.
2. The Analysis of Methods for Predicting Total Output Value of China’s Logistics Systems Engineering.
With increasing amounts of available GDP data, many scholars applied various time-series modeling methods to improveGDP forecasting. Therefore, the forecast of the GDP has been relatively perfected so we won’t illustrate this more. The GDP and the China’s Logistics total output value are connected so we first establish the correlation using linear regression analysis. Thedata is as follows: The Logistics total output value (Y) includes the transportation and storage industries, and postal service in tertiary industry. In this paper we are trying to predict the total output value of transportation and storage and postal service to reflect the total output value of the logistics industry.
Available online at www.sciencedirect.com
367 Liu Cuicui and Yun Jun / Systems Engineering Procedia 5 ( 2012 ) 366 – 371
* Corresponding author. Tel: +13995526759, +15327282257.E-mail address:[email protected]; [email protected]
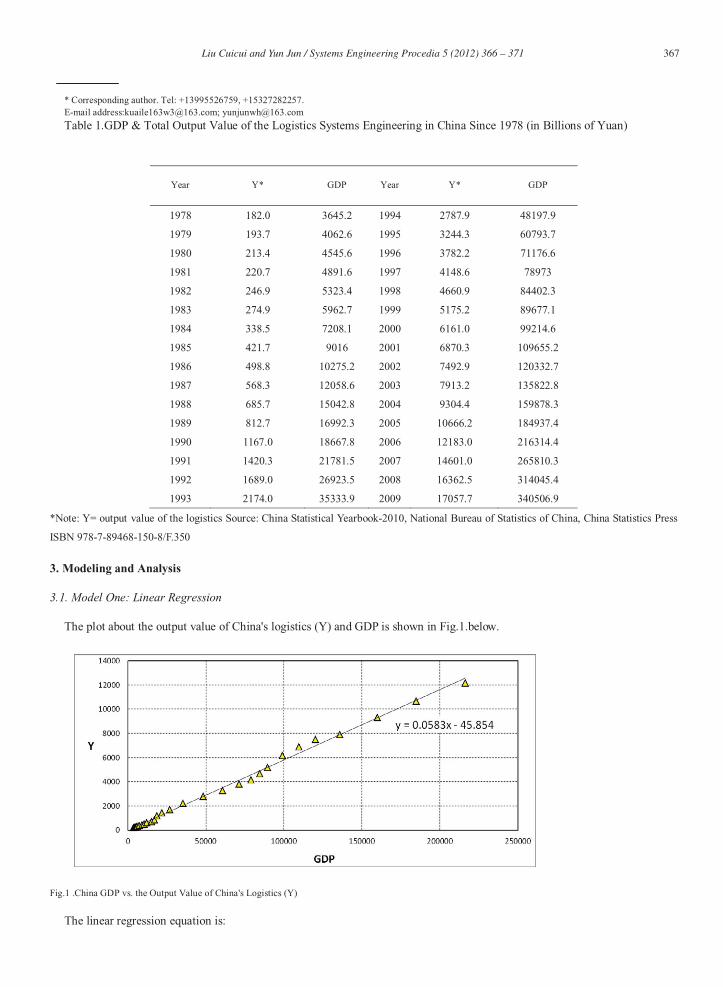
Table 1.GDP & Total Output Value of the Logistics Systems Engineering in China Since 1978 (in Billions of Yuan)
Year Y* GDP Year Y* GDP
1978 182.0 3645.2 1994 2787.9 48197.9
1979 193.7 4062.6 1995 3244.3 60793.7
1980 213.4 4545.6 1996 3782.2 71176.6
1981 220.7 4891.6 1997 4148.6 78973
1982 246.9 5323.4 1998 4660.9 84402.3
1983 274.9 5962.7 1999 5175.2 89677.1
1984 338.5 7208.1 2000 6161.0 99214.6
1985 421.7 9016 2001 6870.3 109655.2
1986 498.8 10275.2 2002 7492.9 120332.7
1987 568.3 12058.6 2003 7913.2 135822.8
1988 685.7 15042.8 2004 9304.4 159878.3
1989 812.7 16992.3 2005 10666.2 184937.4
1990 1167.0 18667.8 2006 12183.0 216314.4
1991 1420.3 21781.5 2007 14601.0 265810.3
1992 1689.0 26923.5 2008 16362.5 314045.4
1993 2174.0 35333.9 2009 17057.7 340506.9
*Note: Y= output value of the logistics Source:
3. Modeling and Analysis
China Statistical Yearbook-2010, National Bureau of Statistics of China, China Statistics Press
ISBN 978-7-89468-150-8/F.350
3.1. Model One: Linear Regression
The plot about the output value of China's logistics (Y) and GDP is shown in Fig.1.below.
Fig.1 .China GDP vs. the Output Value of China's Logistics (Y)
The linear regression equation is:
368 Liu Cuicui and Yun Jun / Systems Engineering Procedia 5 ( 2012 ) 366 – 371
45.854 0.0583Y GDP (1)
eS = (59.2289) (0.000717)
t = (-0.7741) (81.25)
2R =0.995 DW=0.5628 F=6602.082
Where: eS and t represent the standard deviation of parameter estimates and test values respectively.2
R is the squared residual term. It is mainly in order to facilitate comparison between different fitting results (the following are the same). The prediction results for this model for years 2006-2009 are shown in Table 2.
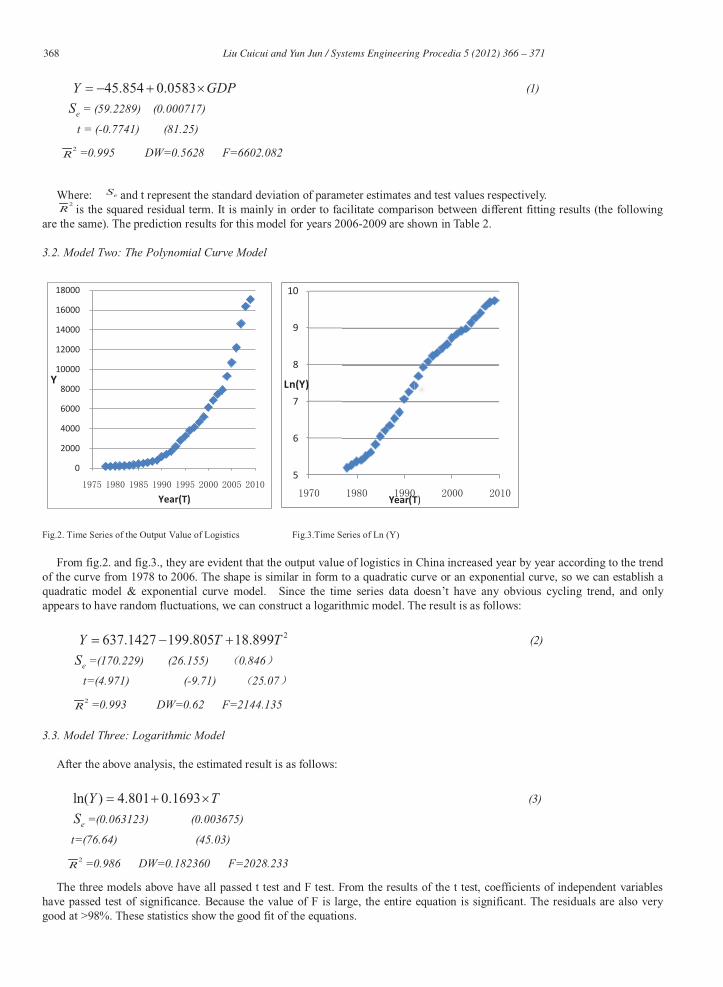
3.2. Model Two: The Polynomial Curve Model
0
2000
4000
6000
8000
10000
12000
14000
16000
18000
Y
Year(T)
5
6
7
8
9
10
Ln(Y)
Year(T)
Fig.2. Time Series of the Output Value of Logistics Fig.3.Time Series of Ln (Y)
From fig.2. and fig.3., they are evident that the output value of logistics in China increased year by year according to the trend of the curve from 1978 to 2006. The shape is similar in form to a quadratic curve or an exponential curve, so we can establish aquadratic model & exponential curve model. Since the time series data doesn’t have any obvious cycling trend, and only appears to have random fluctuations, we can construct a logarithmic model. The result is as follows:
2637.1427 199.805 18.899Y T T (2)
eS =(170.229) (26.155) 0.846
t=(4.971) (-9.71) 25.07
2R =0.993 DW=0.62 F=2144.135
3.3. Model Three: Logarithmic Model
After the above analysis, the estimated result is as follows:
ln( ) 4.801 0.1693Y T (3)
eS =(0.063123) (0.003675)
t=(76.64) (45.03)
2R =0.986 DW=0.182360 F=2028.233
The three models above have all passed t test and F test. From the results of the t test, coefficients of independent variables have passed test of significance. Because the value of F is large, the entire equation is significant. The residuals are also very good at >98%. These statistics show the good fit of the equations.
369 Liu Cuicui and Yun Jun / Systems Engineering Procedia 5 ( 2012 ) 366 – 371
3.4. Model Four: Holt-Winters Non-Seasonal Model
In terms of time series data for a single target, if there is no clear trends or seasonal variation, this model generally adopts exponential smoothing to fit and forecast. Since the time series data of China's logistics has an obvious time trend but noseasonal trends, we choose to use the linear trending of the Holt-Winters non-seasonal forecasting model to make predictions.
ty ty, smoothed series , witht tt ky a b k
Note: ta is the intercept, and tb is the slope. These parameters are defined by the following recurrence formula:
1 1
1 1
1-
- + 1t t t t
t t t t
a Ay A a b
b B a a B b(4)
Where k>0, A=1 B=1 is damping factor. Predictive values are calculated by Yt+k=at+btk. Predicted results are shown in Table2.
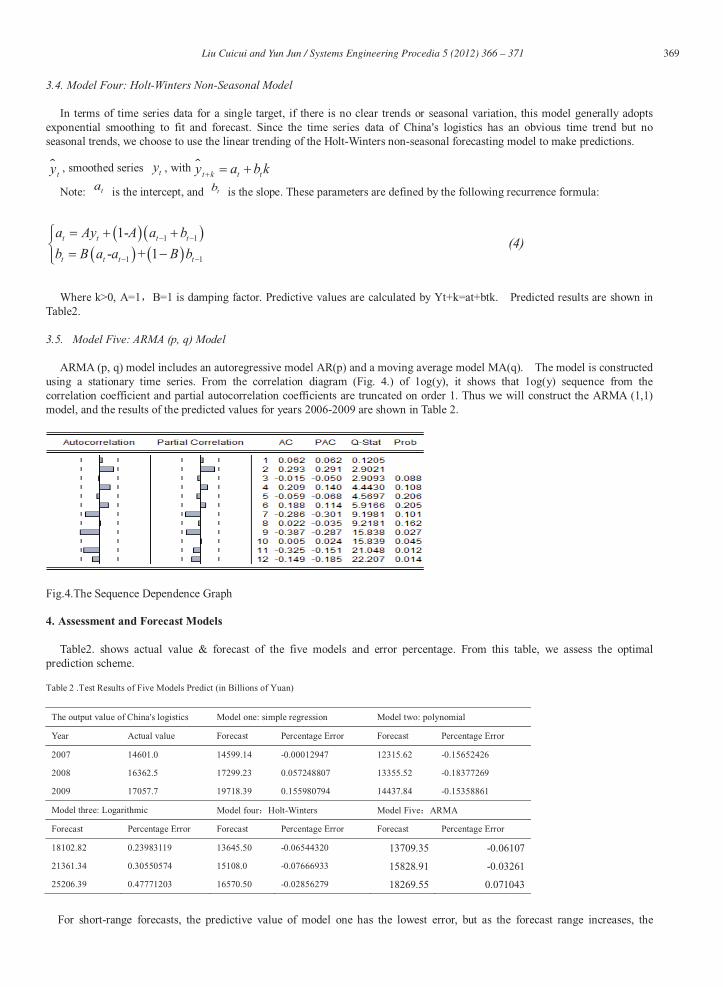
3.5. Model Five: ARMA (p, q) Model
ARMA (p, q) model includes an autoregressive model AR(p) and a moving average model MA(q). The model is constructedusing a stationary time series. From the correlation diagram (Fig. 4.) of 1og(y), it shows that 1og(y) sequence from the correlation coefficient and partial autocorrelation coefficients are truncated on order 1. Thus we will construct the ARMA (1,1) model, and the results of the predicted values for years 2006-2009 are shown in Table 2.
Fig.4.The Sequence Dependence Graph
4. Assessment and Forecast Models
Table2. shows actual value & forecast of the five models and error percentage. From this table, we assess the optimal prediction scheme.
Table 2 .Test Results of Five Models Predict (in Billions of Yuan)
The output value of China's logistics Model one: simple regression Model two: polynomial
Year Actual value Forecast Percentage Error Forecast Percentage Error
2007 14601.0 14599.14 -0.00012947 12315.62 -0.15652426
2008 16362.5 17299.23 0.057248807 13355.52 -0.18377269
2009 17057.7 19718.39 0.155980794 14437.84 -0.15358861
Model three: Logarithmic Model four Holt-Winters Model Five ARMA
Forecast Percentage Error Forecast Percentage Error Forecast Percentage Error
18102.82 0.23983119 13645.50 -0.06544320 13709.35 -0.06107
21361.34 0.30550574 15108.0 -0.07666933 15828.91 -0.03261
25206.39 0.47771203 16570.50 -0.02856279 18269.55 0.071043
For short-range forecasts, the predictive value of model one has the lowest error, but as the forecast range increases, the
370 Liu Cuicui and Yun Jun / Systems Engineering Procedia 5 ( 2012 ) 366 – 371
absolute error increases more and more, and in 2009, the percentage error is beyond 15%. The predictive of models two and three is the worst, and the absolute error percentage is higher than 15% for all three years. Prediction results of models four and fiveare relatively better, with an of absolute error percentage <8%. The predictive value of model four is always lower than the actualvalue; however the percentage error of model five is lower early on and then higher than the actual value later. Comparing the model stability of model four and five, for the fitting results that is similar to some subtle differences between models is difficult to distinguish. To overcome the above shortcomings, the following evaluation methods --- Bias Proportion, this method measures the predictive value of the mean value and the actual sequence deviation from the mean, indicating systematic errors. The expression of Bias proportion is as follows:
Bias Proportion2
2
y
(y ) /tt
y
y n= (5)
Where: y , y represent the mean of y and y respectively, y is the predicted value y is the true value, n is the number of samples.
ty , ty represent the predicted value and real value respectively. The following is the bias proportion of model four and five obtained through the Eviews operation. The time t is from 1978 to 2006.
Bias Proportion of model four =0.006895> Bias Proportion of model five=0.421046, Shows that the system error of model five is much larger than the model four. So we select model four, the Holt-Winters no seasonal model, as the model to forecastthe data from 2010 to 2015. This prediction is shown in Table 3.
Table 3.Output Logistics of Holt-Winters Non-seasonal Prediction Model (in Billions of Yuan)
Year 2010 2011 2012 2013 2014 2015
18033Forecast 19495.5 20958 22420.5 23883 25345.5
5. Conclusion
Although the percentage error of model four is within 8%, it is always lower than the actual value. Based on the rapid development of China's logistics industry, and the growth of e-commerce industry, trends in the logistics industry will continue to expand. Thus we define the correction factor:a=average (-0.06544320, -0.07666933, -0.02856279) =
Table 4.Output Logistics of Holt-Winters Non-seasonal Prediction Model (in Billions of Yuan)
-0.0568918 -0.057. The modified results are shown below:
Year 2010 2011 2012 2013 2014 2015
19123.01 Forecast 20673.91 22224.81 23775.72 25326.62 26877.52
Using the data for output value of logistics engineering in China from 1978-2006, we modeled this data using 1) linear regression, 2) a polynomial model, 3) a logarithmic curve model, 4) a Holt-Winters non-seasonal model, and 5) an ARMA (1,1) model. We then analyzed and compared each model. The Holt-Winters non-seasonal model was the best fit. Based on this model,we conducted conservative prediction values. According to the percentage of error, we carried out a qualitative analysis and then revised it. In order to predict more accurately and realistically the total output value of the logistic, it is better to combine the advantages and disadvantages of several models’ features. For example, with a combination the linear regression about GDP and with Holt-Winters non-seasonal model, accurate predictions can be made. How to make a better analysis based on random factors so that the error of the predicted result could be as small as possible, is a key point to be improved in the future. Using the model to forecast is the first step. The model may need modification. For example if predicted values are always greater than the actual values, we can add this average difference to make the forecast more accurate. So we not only use quantitative models to predict, but also qualitative analysis with random factors to revise the forecast. How to predict more effectively, it is needed to timely grasp of the engineering logistics system updates data, and notice the external macro-environment system.
References
1.Dong Yingying. The Structural Analysis of Logistics Cost in China Based on the Time-series Model [J] Logistics Technology, 2010,08:93-96
2.Tian Genping, ZENG Yingkun Application of Logistics Requirement Forecast Based on Time- ser ies [J] Logistics Sci-Tech,2007,09:96-99
3.Yang Peihua. stimulating factor time series based on the logistics market capacity prediction [J] Consumer Guide, 2009,09:26,27
4.Mo Hong. Empirical Research on Formal Institutional factors of Development of Logisticis Industry in China——JiangSu Provicen as an example [D]
2008,09

371 Liu Cuicui and Yun Jun / Systems Engineering Procedia 5 ( 2012 ) 366 – 371
5.Zhou Qiao. Comparative Analysis about the Fitting and Prediction Model for the Time Series Data of Hubei Province’s GDP [J].Graduate of Zhongnan
University of Economics 2009,04:24-31
6.Gao Tiemei, Econometric analysis and modeling [M] Tsinghai University Press, 2006:51