Statistical Forecasting in Nestlé Middle East - sas.com holding costs The supply chain trade-off...
21
2/20/2018 Statistical Forecasting in Nestlé Middle East SAS Analytics Day Istanbul February 2017
Transcript of Statistical Forecasting in Nestlé Middle East - sas.com holding costs The supply chain trade-off...
2/20/2018
Statistical Forecasting in Nestlé Middle East
SAS Analytics Day
Istanbul February 2017

2
Customer service level & freshness
Inventory holding costs
The supply chain trade-off
Logistics

3
The need for forecasting
✓ At Nestlé, most of our production is driven by "Make to Stock", and not "Make to Order".
✓ We often have to produce large batches mainly to reduce the cost per unit.
We need to forecast the future orders of our customers to have the right volumes of the right product, at the right location, at the right moment in time.
4
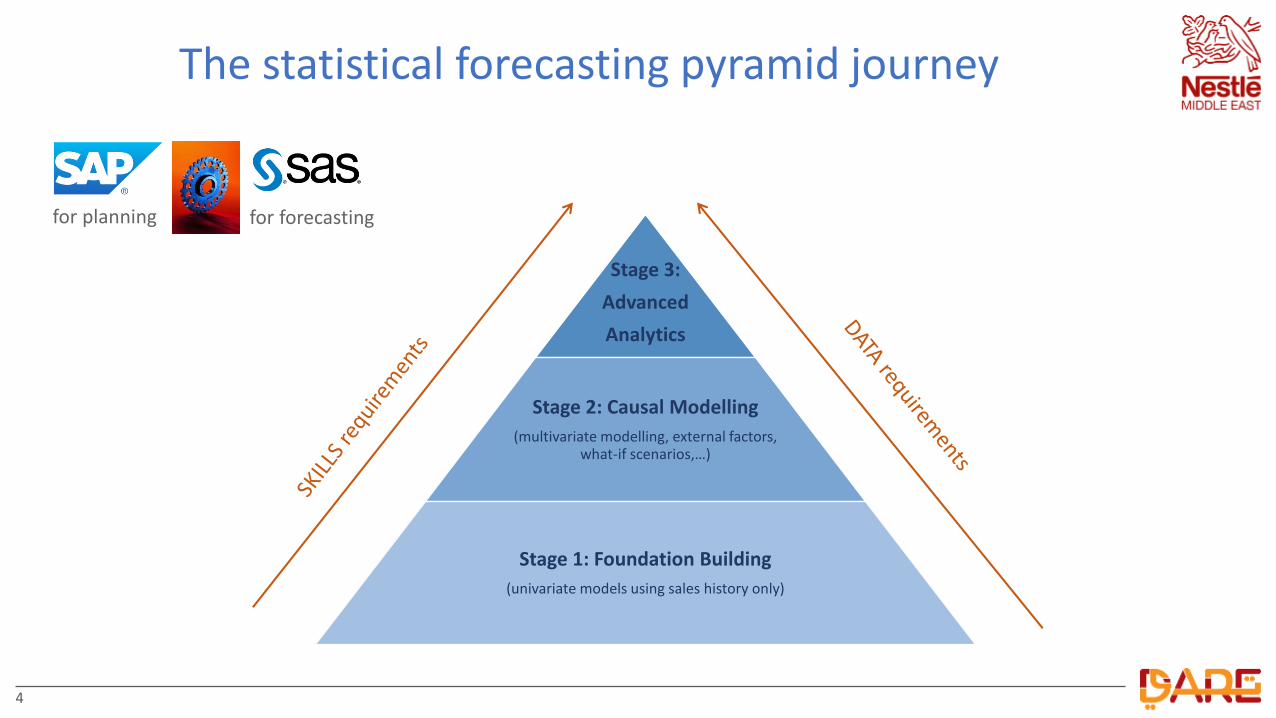
The statistical forecasting pyramid journey
Stage 3:
Advanced
Analytics
Stage 2: Causal Modelling
(multivariate modelling, external factors, what-if scenarios,…)
Stage 1: Foundation Building
(univariate models using sales history only)
for planning for forecasting
5
PRELIMINARY WORK
BEFORE STARTING THESAS ANALYTICS JOURNEY
IN YOUR COMPANY
6
Key Success Factors
✓ Choose the right people
✓ Kick-off the project with a senior manager sponsor
✓ Define a clear structure and process to integrate SAS in the planning platform
✓ Classify the products and define a strategy for each cluster
✓ Define the best forecasting level and hierarchy to answer business needs

7
✓ Statistical Modeling / Forecasting (what statistics can and cannot achieve), no real need for Ph.Ds
✓ Business Understanding
✓ Data Management and Programming
StatisticsForecasting
Business Understanding
Data Management
The demand forecast analyst ideal profile

8
DA
BU DP
BU DP
BU DPBU
DP
People structure and organisation
DA
BU DP
BU DP
BU DPBU
DP
Centralized Structure
Demand Analyst (DA) BU Demand Planner (DP)
▪ Setup the system▪ Gathers the data▪ Does the modelling▪ Prepares the business cases
▪ Classifies the products▪ Validates the models
De-centralized Structure
Demand Analyst (DA) BU Demand Planner (DP)
▪ Setups the system▪ Gathers the data▪ Trains and coaches the DPs
▪ Classifies the products▪ Does the modelling▪ Supports in business cases ▪ More integrated in the business
approach
9
Fore
cast
Per
form
ance
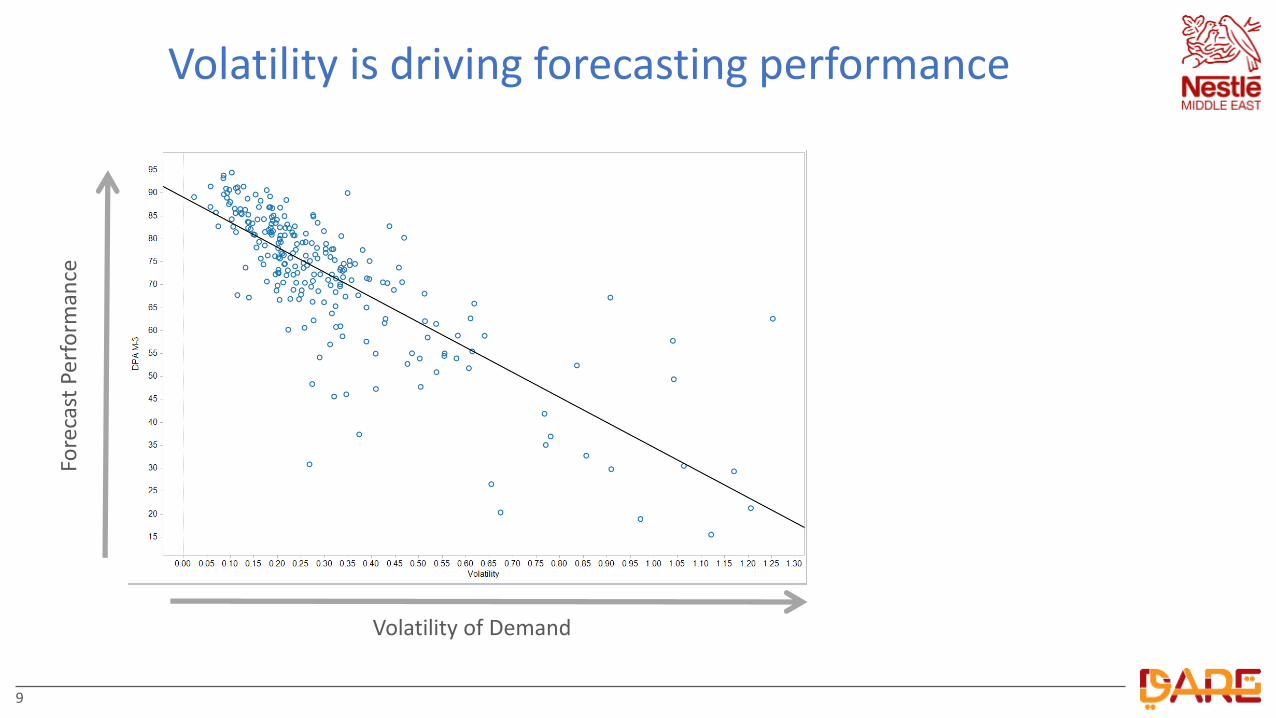
Volatility of Demand
Volatility is driving forecasting performance

10
Animal farm classification
I am high demand, easy to forecastYour most precious animal, take special care of me, I am a reliable friends.
Low demand, easy to forecastthrough statistical models. I am a nice animal, easy to take care, never create problems. Just visitme from time to time.
I am low demand but difficult to forecastsorry! I jump all over the place, no way to calm me. But we are so many, no big deal if you miss one of us ☺ Forecast me statistically, don’t waste precious time and don't worry too much about low DPA.
I am high demand and difficult to forecastwith univariate modelling, sorry !I am of high value and difficult to manage. Keep a close eye on me in your planning cycle! Use stats forecast as a reference only! Investigate possibility of using causal modelling

11
One possible forecasting strategy…
Horse Mule Jack Rabbit Mad Bull
Short-term:1-3 months horizon
SAS / Judgemental SAS SAS / Judgemental Judgemental
Medium-term 4-12 months horizon
SAS SAS SAS / Judgemental Judgemental / SAS Causal
Long-term: SAS SAS SAS SAS
12
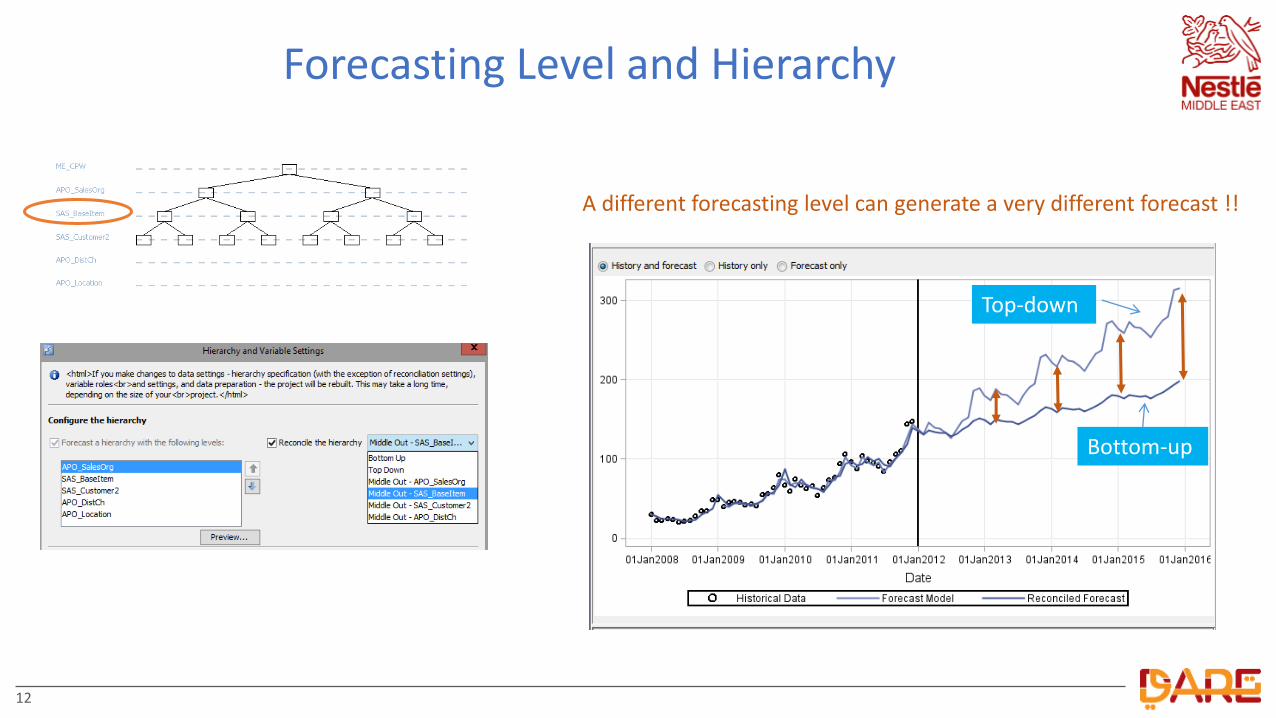
Forecasting Level and Hierarchy
Bottom-up
Top-down
A different forecasting level can generate a very different forecast !!
13
INTEGRATIONin the planning cycle

14
SAS can forecast 5 years of monthly forecast for thousands of time series in less than a minute
Use it as a quick win to show the value of stats vs. judgmental,
Quick win: long-term forecasting
nobody except you has a clue in your organisation !

15
Futu
re
Fore
cast
sP
ast
KP
Is
DPA M-3 Bias M-3
Data and insight: The stats dashboard

16
Data and insight: SAS vs. bottom-up expected growths bubble chart
Bubble size is proportionalto the volume
Y=X line
LEGEND :
Alert Product C

17
Senior manager sponsor testimony

18
CAUSAL FORECASTINGfor Mad Bulls

19
Identify causal factors impacting our demand

20
Causal customer level planning
Once all data are integrated, we can do if-scenario analysis, playing with the causal factor to see which one impacts more the demand
21
THANK YOU FOR YOUR ATTENTION