The China Economic Risk Matrix - rhg.com
113
e China Economic Risk Matrix AUTHORS Logan Wright Lauren Gloudeman Daniel H. Rosen SEPTEMBER 2020 A Report of the CSIS Trustee Chair in Chinese Business and Economics
Transcript of The China Economic Risk Matrix - rhg.com

The China Economic Risk Matrix
AUTHORS
Logan WrightLauren Gloudeman Daniel H. Rosen
SEPTEMBER 2020
A Report of the CSIS Trustee Chair in Chinese Business and Economics

The China Economic Risk Matrix
AUTHORS
Logan Wright Lauren Gloudeman Daniel H. Rosen
SEPTEMBER 2020
A Report of the CSIS Trustee Chair in Chinese Business and Economics

The China Economic Risk Matrix | I
About CSIS
The Center for Strategic and International Studies (CSIS) is a bipartisan, nonprofit policy research organization dedicated to advancing practical ideas to address the world’s greatest challenges.
Thomas J. Pritzker was named chairman of the CSIS Board of Trustees in 2015, succeeding former U.S. senator Sam Nunn (D-GA). Founded in 1962, CSIS is led by John J. Hamre, who has served as president and chief executive officer since 2000.
CSIS’s purpose is to define the future of national security. We are guided by a distinct set of values—nonpartisanship, independent thought, innovative thinking, cross-disciplinary scholarship, integrity and professionalism, and talent development. CSIS’s values work in concert toward the goal of making real-world impact.
CSIS scholars bring their policy expertise, judgment, and robust networks to their research, analysis, and recommendations. We organize conferences, publish, lecture, and make media appearances that aim to increase the knowledge, awareness, and salience of policy issues with relevant stakeholders and the interested public.
CSIS has impact when our research helps to inform the decisionmaking of key policymakers and the thinking of key influencers. We work toward a vision of a safer and more prosperous world.
CSIS is ranked the number one think tank in the United States as well as the defense and national security center of excellence for 2016-2018 by the University of Pennsylvania’s “Global Go To Think Tank Index.”
CSIS does not take specific policy positions; accordingly, all views expressed herein should be understood to be solely those of the author(s).
© 2020 by the Center for Strategic and International Studies. All rights reserved
Center for Strategic & International Studies1616 Rhode Island Avenue, NWWashington, D.C. 20036202-887-0200 | www.csis.org

Wright, Gloudeman, and Rosen | II
Acknowledgments
The authors wish to thank the Smith Richardson Foundation for providing funding for this research, as well as the leadership and staff of the Trustee Chair in Chinese Business and Economics, and particularly Scott Kennedy and Alyssa Perez, for their assistance and guidance in the preparation of this report. The authors also wish to thank the individuals who participated in the brainstorming session held at the Center for Strategic and International Studies headquarters in September 2019. Invaluable research assistance was provided by our colleagues at the Rhodium Group, particularly Feng Xiaodong. Nora Delaney produced modeling and statistical work which served as the critical foundation for the financial stress indicator detailed within this report.

The China Economic Risk Matrix | III
Contents
Executive Summary 1
Chapter 1: The Case for Monitoring China’s Financial Risks 3
Rapid Credit Expansion, But Without Crisis 4
The Deleveraging Campaign and a New Era of Financial Risks 6
Short-term and Long-term Threats 10
The Need for New Monitoring and Diagnostic Tools 11
Objectives of the Project and Plan of the Book 12
Chapter 2: Indicators of Vulnerability, Indicators of Stress 15
Vulnerability and Stress 15
Creating a Unified Indicator of Economic Risk in China 16
Financial Conditions Indexes (FCIs) and Financial Stress Indexes (FSIs) 17
The Need for China-specific Indicators of Financial Stress 18
A China-specific FSI for the Risk Matrix: Methodology 20
Approach 20
Step 1: Variable Selection 21
Step 2: Processing Data 24
Step 3: Weighting the Variables: The “Dependent Variable Problem” 24
Identifying Financial Stress 26
Outcome: A China-specific Financial Stress Index 30
Chapter 3: Beijing’s State Capacity in Crisis Management 32
Key Elements of Beijing’s Capacity to Manage Financial Stress 32
Where Beijing’s Crisis Management Tools May Fall Short 35
Toward Better Indicators of Crisis 38
Chapter 4: The China Economic Risk Matrix 39
Methodology 40

Wright, Gloudeman, and Rosen | IV
Property 41
Importance for Financial Stability 41
Indicators Selected and Explanation 43
Historical Range of Property Risk 44
Crisis Scenarios and Closest Historical Analogy 45
Banks 46
Importance for Financial Stability 46
Indicators Selected and Explanation 47
Historical Range of Debt and Credit Risk 49
Crisis Scenarios and Closest Historical Analogy 49
External Pressure 54
Importance for Financial Stability 54
Indicators Selected and Explanation 56
Historical Range of External Pressure Risk 57
Crisis Scenarios and Closest Historical Analogy 58
Openness/Capital Account Liberalization 58
Importance for Financial Stability 58
Indicators Selected and Explanation 59
Historical Range of Openness Risk 60
Crisis Scenarios and Closest Historical Analogy 61
Applications of the Risk Matrix 61
Chapter 5: The Risk Matrix and Past Episodes of Financial Stress 64
The Interbank Market Crisis of June 2013 64
The View from the Risk Matrix 66
Currency Depreciation and Capital Outflows in 2015-2016 66
The View from the Risk Matrix 70
Deleveraging, the Default of Baoshang Bank, and Counterparty Risk 71
The View from the Risk Matrix 76
Lessons from Recent Episodes of Financial Stress 77
Chapter 6: The Outlook for China’s Financial Risks 79
The Covid-19 Economic Correction and the Risk Matrix 80
The Risk Matrix Assessment of China’s Post-Covid-19 Conditions 82
The Great Wave of Speculative Money Rolls On 83
Illiquidity Within China’s Property Sector 84

Wright, Gloudeman, and Rosen | V
Geographic Counterparty Risk: Connections Between Local Governments and Their Banks 87
The Slow-motion Banking Crisis Keeps Accelerating 89
External Risks and Forced Decoupling 90
Watch Lists 92
Chapter 7: Implications for the United States: China’s Slowdown and Competing Narratives 93
Decoupling and Managing Economic Risks from China 95
The Importance of Credible Economic Narratives 97
About the Authors 100
Appendix to Chapter 2 101
Appendix to Chapter 4 104

Wright, Gloudeman, and Rosen | 1
Executive Summary
As the global economy continues to struggle during the Covid-19 pandemic, China’s return to economic growth in the second quarter of 2020 was a rare positive surprise. Conventional wisdom credits China’s quick recovery to the distinct characteristics of China’s economy: a high degree of state control, directed flows of credit, and a high level of domestic policy credibility in responding to economic downturns.
But those same elements have also pushed China’s financial system deep into a gauntlet of systemic financial risks. Throughout the past decade, China’s financial system has ballooned in size much faster than its real economy. Economic growth has been facilitated by the largest single-country credit expansion in over a century. Yet until the Covid-19 outbreak, China had not faced a rapid slowdown, nor a financial crisis.
Despite rising inefficiency, China’s financial system has served as the shock absorber that has helped China’s economy recover from the virus outbreak and maintain growth. But as even Beijing acknowledges, a tree cannot grow to the sky, and the slow-motion credit risks now accelerating within China’s banking system are breaking through the calm surface of economic data. China’s financial system is highly vulnerable to the threats of falling property prices, defaults on loans and corporate bonds, tightening interbank market conditions, and capital outflows. But it is difficult to determine when these medium-term vulnerabilities will catalyze short-term financial stress and when that stress will become too severe for Beijing to handle.
The answer in this report, drawing from a previous CSIS report, Credit and Credibility, is that China’s financial system becomes most vulnerable when Beijing’s credibility erodes and implicit guarantees on assets are suddenly questioned. In some cases, credibility weakens during attempts to reform China’s system, while other events may force Beijing to react to rising credit risks and defaults. Building on the earlier work, this report explores the specific conditions and markets in which changes in government credibility can have a significant impact on systemic stability in China.
The opacity shrouding China’s outlook calls for more effective indicators of meaningful stress within China’s financial system, and the case for these tools—a China Economic Risk Matrix, similar to a threat matrix in security parlance—is detailed in Chapter 1. Most emerging economies that have seen similar credit expansions have faced crises or sharp economic retrenchment. It is more important than ever to develop new China-specific diagnostic instruments to assess why the same results have not occurred in China.

The China Economic Risk Matrix | 2
There are important differences between longer-term sources of financial vulnerability and short-term indicators of more acute financial stress, which are discussed in Chapter 2. China is underrepresented in traditional cross-country comparisons of financial vulnerabilities because the asset prices and interest rates that are most important in China are different from those in other countries. But it is difficult to design a model to determine the probability of events that have not yet occurred—such as a financial crisis. A China-specific financial stress indicator (FSI) is necessary to incorporate critical variables from China’s financial markets while managing the problem of defining financial stress in an economy that has not yet faced a debilitating crisis.
Chapter 3 assesses Beijing’s policy tool kit to offset potential economic or financial calamity and the extent of Beijing’s control over China’s financial system. There is a clear tension between the goal of financial reform, which requires market pricing of credit risks, and Beijing’s persistent determination to maintain financial stability. Beijing will struggle to control outcomes in markets with large numbers of participants, where incentives of different state organs are in conflict, or where prices are not transparent.
The China Economic Risk Matrix is the combination of indicators of financial vulnerability that threaten to overwhelm Beijing’s policy tools to manage them, along with the China-specific financial stress indicator. Chapter 4 details the design of the broader risk matrix, the reasons for the selection of indicators of vulnerability—property market conditions, banks, debt and credit risks, external pressure, and openness to capital flows—and the historical evolution of those threats to stability over the past two decades.
China has already faced several episodes of financial stress, including the interbank market crisis of 2013, the currency devaluation and capital outflows of 2015 and 2016, and the fallout of the deleveraging campaign in the form of Baoshang Bank’s default in 2019 and eventual bankruptcy. The risk matrix can effectively diagnose and characterize the sources of pressure that built during these periods. Chapter 5 provides snapshots of China’s vulnerabilities during those incidents while also explaining why these instances of financial stress did not produce larger crises.
The Covid-19 outbreak may represent the most significant threat to China’s financial stability so far, producing China’s first economic contraction since the reform and opening era began in 1978. The outbreak has led to unemployment, enterprise closures, and unpaid loans. This has accelerated the slow-motion deterioration of credit quality within China’s banking system, as detailed in Chapter 6. The scenarios for financial stress that could intensify are areas where Beijing’s credibility is clearly threatened, while policy tools in response are ineffective to manage the financial consequences. No government has clear policies to counter a rapid drop in property prices, nor an easy solution to widespread banking system distress spreading to problems at local governments and their state-owned firms.
The reality of growing financial system risk in China requires U.S. strategies that prepare for China’s slowdown rather than assume that Beijing’s narrative of stability will hold. But a weaker China can still enact policies costly to U.S. economic interests and long-term competitiveness, and should China continue moving away from a reform path, limited decoupling steps will be necessary, as outlined in Chapter 7. But the case for a broader financial decoupling and reducing U.S. investment in China is far more tenuous.
Much of China’s external influence is driven by a carefully sustained narrative of state competence and internal economic success and the perception of inexorable growth. The China Economic Risk Matrix is designed to detect when pressures within China’s financial system should change that view.
Wright, Gloudeman, and Rosen | 3
Chapter 1: The Case for Monitoring China’s Financial Risks
Analyzing China’s economy can feel like an exercise in futility. The political system presents a certain version of economic reality via official data, while media reports and market prices provide another. A glowing macroeconomic picture of stable and high rates of GDP growth contrasts with micro-level stories of bankruptcy, defaults, and redundancies. Measures of economic performance in China are often not directly comparable to those in other countries. Those that are can be discontinued by government authorities when the comparisons are not to their liking. New stories capture the media narrative every year—ghost cities, new energy vehicles, solar panels, the African swine flu, local government debt, the trade war, the Covid-19 outbreak—and the old narratives and problems are just as easily forgotten. Many aspects of the economy look unsustainable in the long term, but it is difficult to identify any particular problem that Chinese authorities cannot manage effectively in the short term. The potential for economic crisis in China is always present, but a crisis is never quite there.
This fog hangs over the Chinese economy at a time when its direction is of increasing importance to the United States. How the Chinese economy develops has implications for U.S. employment conditions and investment activity as well as for its assessment of China’s potential as a peer competitor. The uncertainty about China’s outlook also occurs during a period of rising bilateral political tensions within a highly interconnected economic relationship that is now being reassessed. Even amid talk of decoupling, the Covid-19 outbreak has highlighted the importance of China’s manufacturing sector and its role in U.S. supply chains for masks and personal protective equipment. Much of the commentary surrounding the trade dispute between the United States and China over the past two years has focused on the importance of U.S. consumer markets for China’s export industries. Generating far less attention, but carrying far greater significance for U.S. economic interests, is the state of China’s financial system and credit conditions, which will influence the U.S. trade balance, U.S. Treasury bond prices, global commodity prices, and global inflationary and deflationary forces. Abrupt shifts in the stability of China’s financial system will influence U.S. economic and security interests, potentially in multiple directions. Understanding when those risks might materialize, particularly in the context of an increasingly politicized U.S.-China bilateral relationship and a global economy slowly recovering from the Covid-19 outbreak, is more important for U.S. interests than ever before.
In this environment, China’s financial system is the laboratory in which changing conditions in China’s broader economy can be observed. For years since the global financial crisis, China’s financial

The China Economic Risk Matrix | 4
system has served as an effective shock absorber for stress that might have otherwise slowed economic growth. Because firms facing financial pressure continued to receive cheap credit from state-owned banks, they did not exit or declare bankruptcy as firms might have been forced to do in a market-driven system. Instead, they continued to manufacture and produce goods regardless of demand conditions in the broader economy. China has been an investment-driven economy over the past two decades, less influenced by changes in consumer demand than by shifts in aggregate credit conditions within the domestic banking system. China’s financial system expanded to offset pain that otherwise would have slowed growth in the broader economy, created unemployment, and damaged the widespread perception of China’s inevitable economic and political rise. The economic and political risks that arise in advanced economies when there are natural fluctuations in the business cycle were neutralized, but the risks shifted to China’s financial system. Monitoring conditions within that financial system has become essential to understanding China’s economy itself and assessing when instability might test Beijing’s capacity to respond.
Rapid Credit Expansion, But without CrisisChina has seen the largest single-country credit expansion in the last century but has not yet experienced a debilitating financial crisis or a slowdown in economic growth. Total banking system assets are, as of the end of June 2020, $44.0 trillion, having more than quadrupled in size since the global financial crisis at the end of 2008. This asset expansion represents over one-third of global GDP, and there is no comparable precedent for this scale of credit growth in a single country in recent history.
0%
5%
10%
15%
20%
25%
30%
35%
40%
45%
50%
0
10
20
30
40
50
60
70
80
90
100
2001
2002
2003
2004
2005
2006
2007
2008
2009
2010
2011
2012
2013
2014
2015
2016
2017
2018
2019
Global GDP China Bank Assets % of Global GDP (RHS)
Figure 1.1: China's Banking System Assets vs. Global GDP
Trill
ion
USD Percent
Source: People’s Bank of China, World Bank (database).

Wright, Gloudeman, and Rosen | 5
Our previous study, Credit and Credibility, aimed to explain the reasons for China’s stability in the face of rising financial vulnerabilities.1 Conventional explanations for China’s unprecedented period of stability are incomplete and unsatisfying. Typically, they focus on China’s high savings rate, which might prevent a contraction of domestic liabilities, or the fact that China’s debt is internal rather than external in nature, so that resources can be repurposed from different parts of the state system, without external creditors to force defaults. Other explanations for China’s stability emphasize the innovative capacity of China’s officials or political aspects of control within China’s bureaucracy through which administrative orders can be given outside of traditional legal channels, preventing rapid asset sales and other market mechanisms.
However, none of these explanations are compelling when China’s economic record is subject to a thorough examination. High savings rates do not necessarily prevent financial crises, as redirecting resources within China’s financial system requires longer-term adjustments via tools such as tax policies. Similarly, the fact that China’s debt is domestically held offers little protection against the financial risks that emerge within domestic markets, and Chinese authorities are not trying to resolve all of these financial risks. Reform and controlling the growth of the financial system require defaults and some level of credit risk to emerge, not a simple mechanism where liquidity is provided upon regulators’ discovery of any degree of credit stress. Yet Chinese authorities cannot know when the market’s reasonable pricing of new credit risks might spill over into broader financial contagion. Similarly, administrative controls on market participants and even changing market rules are not usually effective in changing outcomes: China’s experience trying to manage the collapse of the 2015 equity market bubble is illustrative. When there are large numbers of market participants involved, such as within China’s property market, administrative controls are only minimally effective.
Instead, Credit and Credibility argued that the key anchor of stability within China’s financial system was the credibility of China’s government interventions themselves and the signal they sent to market participants that any instability in financial markets would be countered by a meaningful and sufficient government response. Those implicit guarantees can prevent rapid asset sales because market participants will simply wait for a government bailout rather than protect themselves by de-risking. However, China’s credibility is now under threat from the rapid growth of the informal banking system. Financial stability within the entire system increasingly depends upon implicit guarantees of government intervention being extended into risky and peripheral asset markets. Beijing has little intention of providing support for risky products such as peer-to-peer investment networks and other “shadow” financing instruments. Regulators continue to introduce new controls over those informal financing channels. But investors still think most investment products are implicitly guaranteed because Beijing values political and financial stability and the government typically intervenes to help investors in the case of credit events that might create broader contagion or crisis.
Beijing’s credibility is now under threat not only from its stated desire to de-risk the financial system but from the inevitable slowdown in credit growth itself. From 2007 to 2016, credit growth in China’s economy averaged over 18 percent, much faster than average nominal GDP growth over the same interval of 13.5 percent. The financial system cannot grow at a pace divorced from the underlying economy it is financing indefinitely, but that is exactly what was taking place in China until 2016.
1. Logan Wright and Daniel Rosen, Credit and Credibility: Risks to China’s Economic Resilience (Washington: CSIS, October 2018), https://www.csis.org/analysis/credit-and-credibility-risks-chinas-economic-resilience.

The China Economic Risk Matrix | 6
Nominal growth in the economy was cut basically in half starting in 2012, but the Chinese financial system continued expanding at a rapid rate. Rather than accepting a slowdown in economic growth, local governments and state-owned enterprises encouraged banks to maintain the flow of credit, which kept production and output growth high even as demand growth slowed. The net result was that risks were building within China’s financial system.
The Deleveraging Campaign and a New Era of Financial RisksBy the summer of 2016, Beijing was growing uncomfortable with these risks within the financial system, worried that they would become systemic in nature. Rather than being funded via stable plain vanilla deposits, China’s financial system was increasingly dependent on deposit-like wealth management products (WMPs) and other forms of wholesale borrowing from counterparty banks. In turn, most new lending was not easily under the control of Chinese regulators, as such lending was extended through informal financing channels, with loans reclassified into obscure innovations such as “trust beneficiary rights” and “directional asset management plans” to avoid hefty provisioning and capital requirements.
As a result, Chinese authorities started an aggressive “deleveraging” campaign, which was primarily designed to reduce the potential for systemic risks emerging within the financial system. While it was broadly labeled “deleveraging,” the campaign did not have a strict objective to reduce credit growth below GDP growth. Rather, its aim was to reduce the potential for unforeseen risks to produce a financial crisis that would be beyond authorities’ control. State media referred to these as “black swans,” risks that cannot be foreseen, and as “grey rhinos,” risks that can be foreseen but are overlooked.2
The first element of the campaign was a monetary tightening effort in which the central bank guided short-term money market rates higher starting in late 2016 and made these short-term rates more volatile, reducing the attractiveness of borrowing in China’s interbank market to take speculative positions in riskier asset markets such as high-yield corporate bonds. In late 2017, however, this monetary tightening campaign reached its limits as prices in China’s bond market dropped sharply, increasing the costs for China’s Ministry of Finance and for local governments to borrow above sustainable levels. As a result, the deleveraging campaign morphed into a regulatory tightening effort in which stronger rules enforced by China’s newly created Financial Stability and Development Committee, organized directly under the State Council, sought to limit banks’ reliance upon WMPs and other forms of shadow financing channels. The lynchpin of this regulatory tightening effort was a series of asset management rules implemented in April 2018 which effectively required banks to mark the assets providing returns to WMP investors to their current market value while also prohibiting banks from guaranteeing the returns of WMPs.
The deleveraging campaign resulted in a significant reduction in the overall pace of credit growth within China’s financial system as well as a squeeze on shadow financing channels. Banks were unable to sell as many WMPs at the same interest rates as in the past and could not easily generate returns via higher-risk shadow lending or investments to provide promised higher interest rates. As a result, WMPs contracted, and in the absence of a key source of funding growth, banks withdrew their claims
2. Both terms were referenced in a People’s Daily editorial on July 17, 2017, and covered within Sidney Leng, “Beijing watches out for ‘grey rhino’ and ‘black swan’ in the jungle of financial risks,” South China Morning Post, July 17, 2017, https://www.scmp.com/news/china/economy/article/2103186/beijing-watches-out-grey-rhino-and-black-swan-jungle-financial.
Wright, Gloudeman, and Rosen | 7
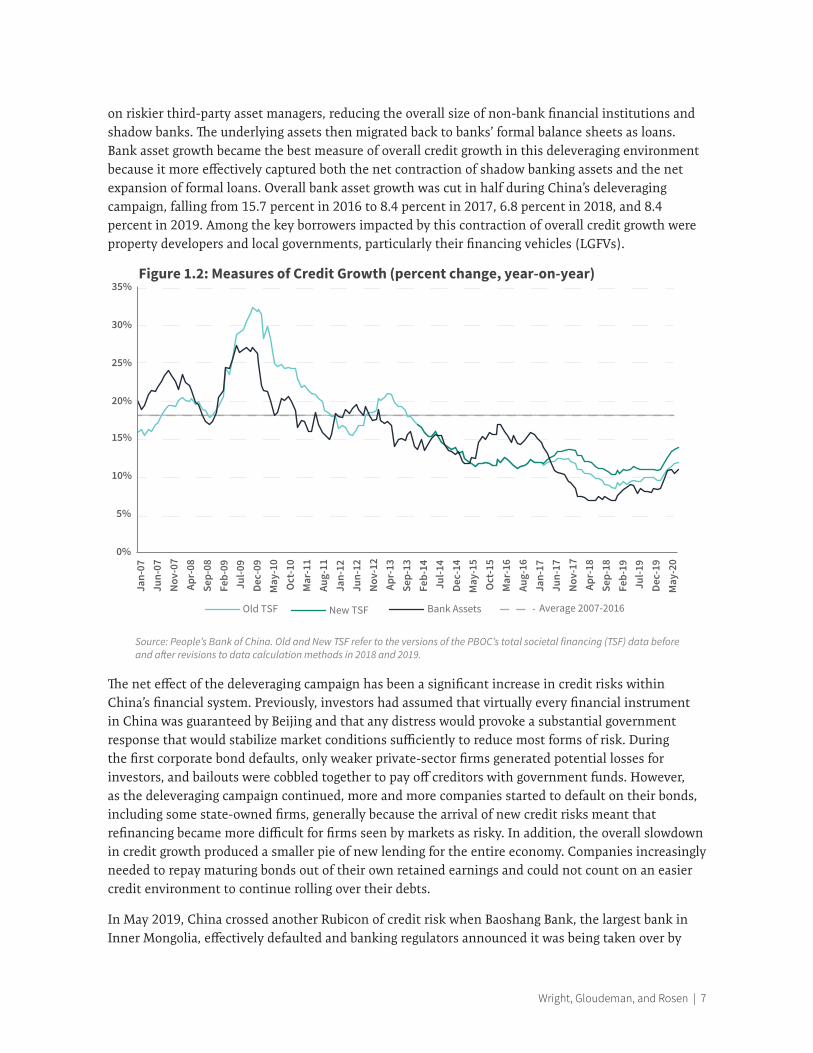
on riskier third-party asset managers, reducing the overall size of non-bank financial institutions and shadow banks. The underlying assets then migrated back to banks’ formal balance sheets as loans. Bank asset growth became the best measure of overall credit growth in this deleveraging environment because it more effectively captured both the net contraction of shadow banking assets and the net expansion of formal loans. Overall bank asset growth was cut in half during China’s deleveraging campaign, falling from 15.7 percent in 2016 to 8.4 percent in 2017, 6.8 percent in 2018, and 8.4 percent in 2019. Among the key borrowers impacted by this contraction of overall credit growth were property developers and local governments, particularly their financing vehicles (LGFVs).
The net effect of the deleveraging campaign has been a significant increase in credit risks within China’s financial system. Previously, investors had assumed that virtually every financial instrument in China was guaranteed by Beijing and that any distress would provoke a substantial government response that would stabilize market conditions sufficiently to reduce most forms of risk. During the first corporate bond defaults, only weaker private-sector firms generated potential losses for investors, and bailouts were cobbled together to pay off creditors with government funds. However, as the deleveraging campaign continued, more and more companies started to default on their bonds, including some state-owned firms, generally because the arrival of new credit risks meant that refinancing became more difficult for firms seen by markets as risky. In addition, the overall slowdown in credit growth produced a smaller pie of new lending for the entire economy. Companies increasingly needed to repay maturing bonds out of their own retained earnings and could not count on an easier credit environment to continue rolling over their debts.
In May 2019, China crossed another Rubicon of credit risk when Baoshang Bank, the largest bank in Inner Mongolia, effectively defaulted and banking regulators announced it was being taken over by
0%
5%
10%
15%
20%
25%
30%
35%
Jan-
07Ju
n-07
Nov
-07
Apr-
08Se
p-08
Feb-
09Ju
l-09
Dec-
09M
ay-1
0O
ct-1
0M
ar-1
1Au
g-11
Jan-
12Ju
n-12
Nov
-12
Apr-
13Se
p-13
Feb-
14Ju
l-14
Dec-
14M
ay-1
5O
ct-1
5M
ar-1
6Au
g-16
Jan-
17Ju
n-17
Nov
-17
Apr-
18Se
p-18
Feb-
19Ju
l-19
Dec-
19M
ay-2
0
Old TSF New TSF Bank Assets Average 2007-2016
Figure 1.2: Measures of Credit Growth (percent change, year-on-year)
Source: People’s Bank of China. Old and New TSF refer to the versions of the PBOC’s total societal financing (TSF) data before and a�er revisions to data calculation methods in 2018 and 2019.

The China Economic Risk Matrix | 8
China Construction Bank temporarily. This was the first major bank default in China since Hainan Development Bank’s failure in 1998 and the first time that depositors in the bank faced actual credit risks. As a result of these losses, there was a significant reassessment of the credit risks building within China’s banking system. Large banks were unaware where other time bombs were ticking within China’s more than 4,000 smaller banks and consequently reduced their interbank lending, cut off several counterparties, and tightened collateral requirements. Often banks were cut off simply because they had not filed their annual reports on time. Unable to count on implicit guarantees, and with an absence of solid information about other financial institutions, larger banks that were typically net lenders within the interbank market began reducing their own risks and cutting back on lending.
This created immediate consequences for the smaller banks that had been expanding rapidly based on the same interbank funding channels that were now contracting. The Bank of Jinzhou, for example, a city commercial bank from a medium-sized town in northeastern Liaoning province, quickly found itself unable to sell interbank negotiable certificates of deposit (NCDs) to other banks, and the People’s Bank of China (PBOC) was forced to step in and effectively guarantee the bank’s interbank borrowing. It is probable that the Bank of Jinzhou received special treatment because it was listed on the Hong Kong stock exchange. Hengfeng Bank, a large regional lender based in Shandong province, found itself under similar pressure and was forced to restructure three months after Baoshang’s takeover. The Bank of Harbin and Bank of Gansu have also been restructured within the past year, and there have been several media reports of smaller banks facing runs on deposits in the early months of 2020. Other banks that are just as reliant on wholesale funding as Baoshang and the Bank of Jinzhou may default or require restructuring in the near future.
In addition to the slow-motion train of defaults within the banking system, state-owned enterprises and local governments have started to default on bonds more frequently in both onshore and offshore markets. Of the 412 bond defaults identified since 2014, 104 have been from local or central state-owned enterprises.3 As shadow banking channels contracted, LGFVs began defaulting on some shadow loans from non-bank financial institutions, leading to unrecognized losses among third-party asset managers such as trust companies and asset management firms. In December 2019, an LGFV in Hohhot, Inner Mongolia, made a late interest payment on a domestic bond issue.4 Earlier in the year, the Qinghai provincial government had already defaulted on an offshore dollar-denominated bond issued in Hong Kong.5
3. Rhodium Group, China Markets Research Corporate Bond Default Database.
4. Ina Zhou, “China Local Government Unit Escapes Default With Late Payment,” Bloomberg, December 9, 2019, https://www.bloomberg.com/news/articles/2019-12-10/china-lgfv-secures-investor-approval-on-late-bond-repayment.
5. “Qinghai Provincial Misses Coupon Payment on 2020 Dollar Bond,” Bloomberg, August 22, 2019, https://www.bloomberg.com/news/articles/2019-08-22/qinghai-provincial-is-said-to-miss-dollar-bond-coupon-payment.
Wright, Gloudeman, and Rosen | 9
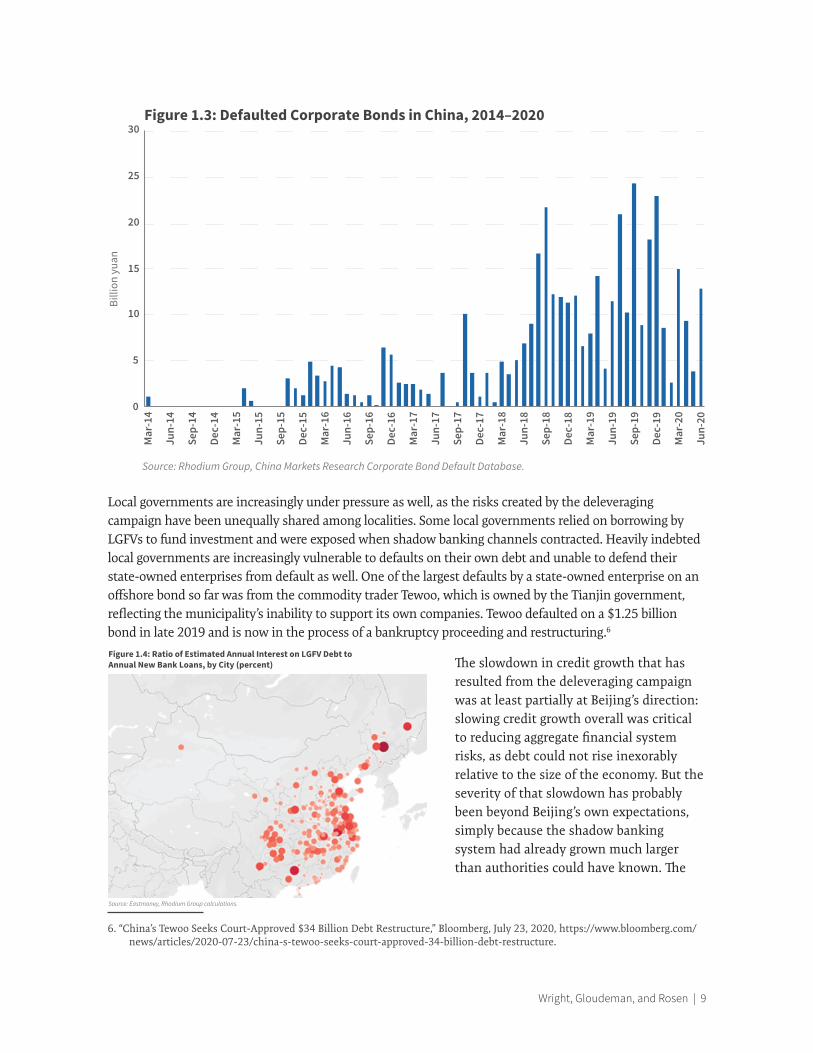
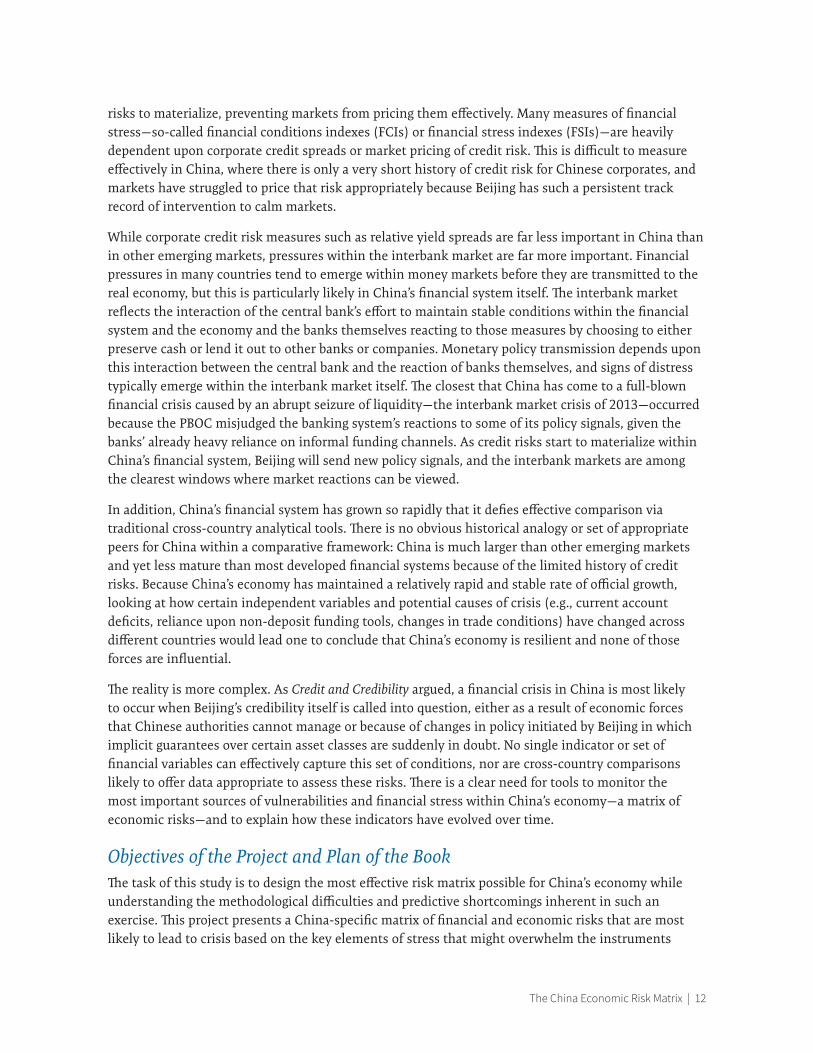
Local governments are increasingly under pressure as well, as the risks created by the deleveraging campaign have been unequally shared among localities. Some local governments relied on borrowing by LGFVs to fund investment and were exposed when shadow banking channels contracted. Heavily indebted local governments are increasingly vulnerable to defaults on their own debt and unable to defend their state-owned enterprises from default as well. One of the largest defaults by a state-owned enterprise on an offshore bond so far was from the commodity trader Tewoo, which is owned by the Tianjin government, reflecting the municipality’s inability to support its own companies. Tewoo defaulted on a $1.25 billion bond in late 2019 and is now in the process of a bankruptcy proceeding and restructuring.6
The slowdown in credit growth that has resulted from the deleveraging campaign was at least partially at Beijing’s direction: slowing credit growth overall was critical to reducing aggregate financial system risks, as debt could not rise inexorably relative to the size of the economy. But the severity of that slowdown has probably been beyond Beijing’s own expectations, simply because the shadow banking system had already grown much larger than authorities could have known. The
6. “China’s Tewoo Seeks Court-Approved $34 Billion Debt Restructure,” Bloomberg, July 23, 2020, https://www.bloomberg.com/news/articles/2020-07-23/china-s-tewoo-seeks-court-approved-34-billion-debt-restructure.
0
5
10
15
20
25
30
Mar
-14
Jun-
14
Sep-
14
Dec-
14
Mar
-15
Jun-
15
Sep-
15
Dec-
15
Mar
-16
Jun-
16
Sep-
16
Dec-
16
Mar
-17
Jun-
17
Sep-
17
Dec-
17
Mar
-18
Jun-
18
Sep-
18
Dec-
18
Mar
-19
Jun-
19
Sep-
19
Dec-
19
Mar
-20
Jun-
20
Figure 1.3: Defaulted Corporate Bonds in China, 2014–2020Bi
llion
yua
n
Source: Rhodium Group, China Markets Research Corporate Bond Default Database.
Figure 1.4: Ratio of Estimated Annual Interest on LGFV Debt to Annual New Bank Loans, by City (percent)
Source: Eastmoney, Rhodium Group calculations.

The China Economic Risk Matrix | 10
tools used to control shadow banking activity were fairly blunt: higher short-term money market rates and regulatory limits on certain forms of credit growth.
As a result of this sharp contraction in credit growth—by most measures it has been cut by more than half, particularly for corporate borrowers—the deleveraging campaign has reduced systemic risks on the funding side of banks’ balance sheets but has increased the credit risk within China’s financial asset markets. Now, private firms, state-owned firms, local government financing vehicles, and even banks are at risk of defaulting on their debts. Beijing has relaxed and extended deadlines for the asset management rules on banks for a year because of the pressure that the shadow banking contraction has exerted on the economy as a whole, particularly following the effects of the Covid-19 outbreak on both domestic and external demand.7
As Credit and Credibility argued, the most important risks within China’s financial system will likely emerge when Beijing’s credibility itself is challenged—and implicit guarantees give way to concerns about defaults and losses. This process is inevitable when reform requires a more market-based pricing of credit risk. After all, if Beijing’s guarantees in one particular asset class can be rolled back, it is possible to see other guarantees revoked. Credit risks throughout China’s financial system are now increasing from implied levels very close to zero to a level of risk that must be measured and priced. The most significant threats to financial stability in China will occur when markets and investors start to question Beijing’s commitment to the stability of asset categories previously considered safe.
Short-term and Long-term ThreatsOver the long term, the rapid credit growth within China’s financial system relative to the size of the economy, underpinned by implicit and explicit guarantees from the government, is unsustainable. But the inflection point at which unsustainable trends start to trigger more immediate stress within China’s financial system is extremely difficult to predict. Over the short term, with a horizon of six months to one year, it is always difficult to identify any particular threat or source of stress that would overwhelm China’s administrative and bureaucratic capacity to respond and prevent a crisis from spreading. The Covid-19 outbreak is a prime example. This was an unexpected event which caused a rapid contraction in China’s economy (real GDP declined by 6.8 percent year-on-year in the first quarter of 2020). Still, the expectation of government support for the financial system was strong, as Beijing asked banks to exercise forbearance with borrowers to prevent even more defaults than have already occurred.
Many of the longer-term threats to China’s economy, such as the risk of an imploding asset bubble within the property market, do not necessarily metastasize in a moment of financial stress. Within China’s financial system, it is difficult to envision an episode of acute market turmoil similar to the start of the Asian financial crisis (the breaking of the Thai currency peg) or the global financial crisis (the bankruptcy of Lehman Brothers). As sources of vulnerability within the economy develop, the risk of crisis rises. Whether and when that crisis will materialize is very difficult to foresee.
China has not seen a financial crisis in the last two decades. The Covid-19 outbreak caused the economy’s first contraction since the post-1978 reform period, but this was a shock largely exogenous
7. “China extends transitional period for new asset-management rules,” Xinhua, August 1, 2020, https://news.cgtn.com/news/2020-08-01/China-extends-transitional-period-for-new-asset-management-rules-SAQKfrX5zW/index.html.

Wright, Gloudeman, and Rosen | 11
to the operations of China’s economy and financial markets. The pandemic hit the entire global economy. The Asian financial crisis pressured China’s economy considerably, but the financial system at that time was only a fraction of its current size. Analysts tend to “fight the last war” when looking for potential sparks of a crisis. China’s conditions are often evaluated in comparative terms to other countries during the Asian financial crisis, which was essentially a balance of payments crisis where countries running current account deficits could not sustain their fixed exchange rate regimes. China’s shadow banking system is sometimes compared to the structures that created significant losses within U.S. institutions during the subprime crisis. Japan’s deflationary adjustment of the 1990s, following the bursting of its real estate bubble, is also used as a potential frame for a crisis in China.
There are parallels between the conditions in China and all of these crisis episodes, but the basic analytical problem remains the same: it is difficult to predict or diagnose the character of a financial crisis that has never occurred. While there are clearly no perfect solutions to this analytical challenge, the objective of this study is to partially fill this void by designing new tools to detect changes in the financial conditions that are most likely to overwhelm Beijing’s capacity to respond—and which could trigger broader financial contagion. Monitoring when vulnerabilities are mutating into more acute financial stress in China remains an arduous but increasingly important task.
The Need for New Monitoring and Diagnostic ToolsThe case for more effective tools to monitor financial conditions in China can be easily summarized. China is the world’s second-largest economy, and its banking system is the world’s largest within a single country. Since the global financial crisis, China’s economic expansion has represented around 40 percent of global growth, and China’s credit growth made up an even larger proportion of global credit expansion during that interval. At this point, if there are abrupt changes in the capacity of China’s banking system to expand at close to its current rates, this would represent a significant shift in global credit growth, with implications for supply chains, trade flows, and financial asset prices around the world. From major commodity-exporting countries to policymakers in developed economies, there is a significant need for tools to monitor both early warning and coincident indicators of stress within China’s financial system.
In addition, even as the financial system itself has evolved in ways more difficult for Beijing to control, evidence of financial stress is unlikely to be revealed within conventional economic data. China’s GDP data, and the underlying output data upon which GDP data are based, are unusually stable and rarely reveal significant shifts in economic activity. While there is an extensive debate about the accuracy of GDP data and whether or not it is overstating China’s economic performance, what is less controversial is that the volatility of China’s GDP data before the Covid-19 outbreak had been the lowest among the 20 largest economies of the world as far back as economic data can be collected. There are open questions about how China’s political messaging, which has emphasized the country’s rapid recovery from the outbreak, could influence future GDP data. As a result, secondary tools to detect changes in economic activity and financial risks are urgently necessary.
Conditions within every financial system are different, but most studies of financial crises tend to engage in cross-country comparisons while searching for common factors that produce instances of crisis in different markets. Placing China within these cross-country frameworks presents a number of analytical challenges. To start with, certain prices that move more actively in market-driven systems are controlled in China, either through administrative tools, window guidance, or the failure of credit
The China Economic Risk Matrix | 12
risks to materialize, preventing markets from pricing them effectively. Many measures of financial stress—so-called financial conditions indexes (FCIs) or financial stress indexes (FSIs)—are heavily dependent upon corporate credit spreads or market pricing of credit risk. This is difficult to measure effectively in China, where there is only a very short history of credit risk for Chinese corporates, and markets have struggled to price that risk appropriately because Beijing has such a persistent track record of intervention to calm markets.
While corporate credit risk measures such as relative yield spreads are far less important in China than in other emerging markets, pressures within the interbank market are far more important. Financial pressures in many countries tend to emerge within money markets before they are transmitted to the real economy, but this is particularly likely in China’s financial system itself. The interbank market reflects the interaction of the central bank’s effort to maintain stable conditions within the financial system and the economy and the banks themselves reacting to those measures by choosing to either preserve cash or lend it out to other banks or companies. Monetary policy transmission depends upon this interaction between the central bank and the reaction of banks themselves, and signs of distress typically emerge within the interbank market itself. The closest that China has come to a full-blown financial crisis caused by an abrupt seizure of liquidity—the interbank market crisis of 2013—occurred because the PBOC misjudged the banking system’s reactions to some of its policy signals, given the banks’ already heavy reliance on informal funding channels. As credit risks start to materialize within China’s financial system, Beijing will send new policy signals, and the interbank markets are among the clearest windows where market reactions can be viewed.
In addition, China’s financial system has grown so rapidly that it defies effective comparison via traditional cross-country analytical tools. There is no obvious historical analogy or set of appropriate peers for China within a comparative framework: China is much larger than other emerging markets and yet less mature than most developed financial systems because of the limited history of credit risks. Because China’s economy has maintained a relatively rapid and stable rate of official growth, looking at how certain independent variables and potential causes of crisis (e.g., current account deficits, reliance upon non-deposit funding tools, changes in trade conditions) have changed across different countries would lead one to conclude that China’s economy is resilient and none of those forces are influential.
The reality is more complex. As Credit and Credibility argued, a financial crisis in China is most likely to occur when Beijing’s credibility itself is called into question, either as a result of economic forces that Chinese authorities cannot manage or because of changes in policy initiated by Beijing in which implicit guarantees over certain asset classes are suddenly in doubt. No single indicator or set of financial variables can effectively capture this set of conditions, nor are cross-country comparisons likely to offer data appropriate to assess these risks. There is a clear need for tools to monitor the most important sources of vulnerabilities and financial stress within China’s economy—a matrix of economic risks—and to explain how these indicators have evolved over time.
Objectives of the Project and Plan of the BookThe task of this study is to design the most effective risk matrix possible for China’s economy while understanding the methodological difficulties and predictive shortcomings inherent in such an exercise. This project presents a China-specific matrix of financial and economic risks that are most likely to lead to crisis based on the key elements of stress that might overwhelm the instruments

Wright, Gloudeman, and Rosen | 13
Beijing has typically used to control financial and economic conditions. These indicators are designed to be China-specific and not to be used across different countries. The case for this approach has been the subject of Chapter 1.
The creation of a risk matrix necessarily involves the separation of indicators of financial and economic vulnerabilities from indicators of financial stress. As Chapter 2 explains, indicators of China’s vulnerability are more commonly identified and more easily comparable to other countries that have faced financial crises in the past. Instances of financial stress in China are far rarer and more acute. Areas of vulnerability for China’s financial system include property markets, banking sector stress, problems in debt sustainability and high interest rates, and changes in external conditions such as the trade protectionism China has confronted in recent years. To monitor financial stress, one of the project’s objectives is to develop an FSI specific to China, by evaluating the previous periods in which China’s financial system has been acutely stressed most directly, in an attempt to enable monitoring of the critical markets beyond Beijing’s instruments of control.
Beijing’s capacity to monitor and stabilize financial conditions in the event of observed stress is the subject of Chapter 3. While vulnerabilities within the financial system have developed quickly, Beijing’s policy tools have not evolved significantly to counter them. Obviously Chinese authorities have every intention of responding to the potential for financial crisis, and they have an expansive and far less legally restricted tool kit to do so than authorities in other countries. Yet the challenge for Beijing will emerge when its stated objective of deepening financial reform conflicts with attempts to maintain financial stability: reform requires the introduction of new credit risks and withdrawing government guarantees, but authorities can never be sure when market pricing of these risks potentially generates broader contagion and the risk of crisis.
The presentation of the China Economic Risk Matrix itself, and the indicators involved, occurs in Chapter 4. The chapter first provides the key indicators of economic and financial conditions and how those indicators are operationalized for presentation within a unified framework alongside the China-specific FSI. At the same time, there are clear methodological difficulties for such a unified presentation of risks, including how to posit a degree of equivalence between indicators of vulnerability and the China-specific FSI. The chapter will provide graphical presentations of the variables assessing China’s financial vulnerabilities within the risk matrix and how those have changed over time.
Following the creation of the risk matrix, Chapter 5 evaluates key episodes of financial and economic risk in China’s recent past. These include the 2013 interbank market crisis and balance of payments pressures following China’s shock depreciation of the currency in 2015–2016. Then the risk matrix framework will be updated for the most pressing recent shock to China’s financial system: the default of Baoshang Bank in May 2019 and the corresponding emergence of counterparty solvency risk within China’s banking system, which is still an ongoing and developing threat to systemic stability.
The forward-looking applications of the risk matrix then follow. Chapter 6 begins with a discussion of the profound vulnerabilities in China’s economy created by the Covid-19 outbreak and China’s policy response. The chapter then describes the most important variables worth watching in the near future given the scenarios for crisis highlighted by the results displayed within the risk matrix. Most importantly, none of these scenarios are likely to be revealed within the data that China officially produces, underscoring the importance of alternative indicators of financial stress developed within

The China Economic Risk Matrix | 14
this project. Variables worthy of scrutiny include liquidity conditions within the property sector, Beijing’s approach to managing bank bailouts and restructurings, the potential for geographically concentrated credit risks to emerge across multiple institutions, and external pressure from the United States and from changing external financial conditions.
The final chapter discusses the potential implications for the United States from these findings. A slowdown in Chinese growth should be the base case for U.S. strategic planning, alongside contingency plans and preparations for a potential financial crisis in China. At the same time, Chinese policies adverse to U.S. interests are unlikely to change overnight, even in the event of a slowdown, which underscores that measures to insulate the U.S. economy against rising financial risks from China are necessary. As the credibility of China’s narrative of inexorable economic growth fades, it will be more important than ever to restore U.S. policy credibility to serve as a contrary and competitive example to like-minded market democracies, particularly during the uneven recovery from the Covid-19 outbreak.

Wright, Gloudeman, and Rosen | 15
Chapter 2: Indicators of Vulnerability, Indicators of Stress
Vulnerability and StressMost of the longer-term trends in China’s economy that analysts describe as “unsustainable” or “imbalanced” are really indicators of China’s increasing economic vulnerability. These include rising property prices, risky liabilities structures within the banking system, a rise in credit relative to the size of the economy, or the growth in debt among local governments. All of these factors are essentially longer-term threats to financial stability, but they are not short-term problems that are indicative of a financial crisis. These variables may be the proximate triggers of crises, but they are not indicators of crisis in themselves.
An entirely different set of conditions in China indicate acute financial stress. These typically include high money market interest rates, bankruptcies or insolvencies of financial institutions, defaults on corporate bonds, and sharply widening credit spreads between assets considered risky and those considered safe. These indicators may respond to a number of different stimuli, some of which may be linked closely to China’s long-term financial system vulnerabilities. Other indicators may move based on policy or regulatory changes that are prudent in nature but may nonetheless spook financial market participants for short periods.
Most of the discussion of potential causes of financial crises in China focuses on the rising vulnerabilities, with far less focus given to the mechanics of how those vulnerabilities contribute to more acute instances of financial stress. Indicators of vulnerability receive more attention usually because there are historical comparisons available, and China’s financial system appears similar to other emerging markets or developed economies that have faced financial crises in the past. Indicators of financial stress in China are not often directly comparable to those in other developed economies, which means that it is difficult for external observers to clearly identify financial contagion in China as the potential precursor of a broader crisis.
One of the objectives of this study is to bridge that gap and develop more complex and China-focused diagnostic tools to determine when longer-term problems become more acute short-term threats and when longer-term vulnerabilities are growing in combination to produce a greater potential for short-term financial stress.

The China Economic Risk Matrix | 16
Creating a Unified Indicator of Economic Risk in ChinaEven if necessity is the mother of invention, the need for better indicators of economic risk in China does not make it any easier to create them. In any exercise of this scope, methodological compromises are inevitable. This chapter explains those compromises and the drawbacks that those choices entail.
When discussing the China Economic Risk Matrix in this report, this refers to the entire set of indicators of both financial vulnerability and financial stress. However, most of this chapter discusses how this project created only one component of the risk matrix, a China-specific financial stress index (FSI). This FSI will be combined with other indicators of China’s financial vulnerability when the construction of the broader risk matrix is detailed in Chapter 4.
Constructing the China Economic Risk Matrix involved these deliberate choices, which entail some unavoidable trade-offs.
▪ China-specific, not comparative across countries: The objective is to create a set of indicators that diagnoses financial stress effectively within China’s financial system, not to create a broader framework that can be applied to other economies. Existing comparative cross-country approaches are not as useful in studying China’s economy and financial system because key economic indicators in China show little variance compared to other economies. The drawback to this approach is a narrower range of data and time in which stress can be measured, since China’s financial system has developed so quickly in recent years.
▪ Diagnostic, not predictive: The aim of this study is not to create indicators that will predict economic or financial crises—such a project will almost certainly fail. Some of the differences between diagnostic and predictive tools are discussed when breaking down the differences between financial conditions indexes and financial stress indexes below. Credit and Credibility already outlined the case for expecting more financial stress in China, albeit without certain time frames. The risk matrix is designed to gauge the severity of stress in China’s financial system, diagnose where financial stress is occurring within the meaningful areas of China’s financial system, and point out when contagion is occurring in multiple areas simultaneously. This may be interpreted more as a flood warning system in multiple sectors rather than a prediction that a particular dam will break.
▪ Combines indicators of economic vulnerability and indicators of financial stress: The risk matrix attempts to incorporate both indicators of longer-term vulnerability and indicators of acute short-term stress within a single snapshot or visualization of current risks but does not combine these arithmetically in any way. There are drawbacks to this approach in attempting to present these indicators on the same scale when they are not directly comparable.
▪ Combines deductive and inductive approaches to variable selection: The authors’ professional experience is leveraged in analyzing China’s financial system to understand the key China-specific facts that drive the inductive selection of financial stress and vulnerability indicators. But the study also uses deductive approaches to assess where to look for financial stress in sectors where changes in Beijing’s credibility are likely to have greater impact within China’s financial markets, based on the expected behavior of markets more generally and the approach from Credit and Credibility. This is admittedly inconsistent but necessary in designing any China-specific economic risk indicator because without an obvious financial crisis in China’s past, one has to use episodes of past financial stress to calibrate where a future calamity may begin, or other variables that are

Wright, Gloudeman, and Rosen | 17
correlated with that stress. This approach in creating the China-specific financial stress indicator is detailed below.
Financial Conditions Indexes (FCIs) and Financial Stress Indexes (FSIs)The objective of this study is to create a broader set of indicators that helps understand the interplay of different financial risks in China in order to track financial conditions over time and understand when long-building financial vulnerabilities become acute risks in the future. Indicators for gauging financial conditions are not new, having primarily served to offer “early warning” indications of financial instability in order to predict and prevent financial crises. Financial stress can lead to negative spillovers into the real economy, so diagnostic tools assessing vulnerabilities in current conditions can help policymakers take preventative actions.
Economists have developed measures of systemic risk to continuously track conditions in a given financial system, including financial conditions indexes (FCIs) and financial stress indexes (FSIs). Both indexes offer a snapshot of financial conditions by summarizing the information embedded in a selection of relevant variables into a unified measure of financial stress.8 Literature suggests they differ in a few ways. For one, FCIs look at financial conditions with the objective of understanding the impact on the real economy.9 In one of the most widely cited works on FCIs, Hatzius et al. (2010) defines financial conditions as “the current state of financial variables that influence economic behavior and (thereby) the future state of the economy” and the function of FCIs as summarizing the information contained within these variables.10 FSIs, by contrast, focus on financial stress more narrowly, without explicit attention to real economy spillovers as an objective.11 FSIs are meant to track the level of stress exerted on actors in the economy due to uncertainty and changing expectations in financial markets.12 The FSI therefore can help diagnose the severity of financial distress at a point in time, with extreme values indicating financial crisis.
FCIs and FSIs typically differ also in terms of the variables they include. FSIs generally include variables related to market-based prices, “reflecting the assumption that markets are the best and quickest aggregators of available information.”13 FCIs expand upon market price-based components to include volume-based components, such as stocks, flows, and trading volumes.14 FCIs may include nonfinancial macroeconomic indicators. Therefore, an FCI often has an FSI component, with additional variables which “may include anything that characterizes the supply or demand of financial instruments relevant for economic activity.”15
8. Philip J. Monin, “The OFR Financial Stress Index,” Office of Financial Research, U.S. Department of Treasury, February 26, 2019, 5, https://www.mdpi.com/2227-9091/7/1/25/pdf.
9. Monin, “The OFR Financial Stress Index,” 4.
10. Jan Hatzius, Peter Hooper, Frederic S. Mishkin, Kermit L. Schoenholtz, and Mark W. Watson, “Financial Conditions Indexes: A Fresh Look after the Financial Crisis,” NBER Working Paper No. 16150, July 2010, 1, https://www.nber.org/papers/w16150.pdf.
11. Monin, “The OFR Financial Stress Index,” 4.
12. Lixin Sun and Yuqin Huang, “Measuring the instability of China’s financial system: Indices construction and an early warning system,” Economics, Discussion Papers 10, no. 2016-19 (January 2016): 1-41, http://www.economics-ejournal.org/econom-ics/discussionpapers/2016-4.
13. Monin, “The OFR Financial Stress Index,” 5.
14. Ibid., 5.
15. Hatzius et al., “Financial Conditions Indexes,” 1.

The China Economic Risk Matrix | 18
Both indexes are created with similar approaches. First, observable financial indicators are selected as variables. Second, the indicators are aggregated into an index using one or a combination of methods ranging from a simple average of variables to more complex statistical methods. The end result is a summary measure containing information about financial conditions embedded in the underlying variables which reflects the level of financial stress (in the case of the FSI).
The Need for China-specific Indicators of Financial StressWhile research on FSIs and FCIs dates back to the 1980s and 1990s, the development of new FSIs accelerated after the global financial crisis in 2008—an acknowledgement of the need to better understand and monitor real-time acute financial stress. But there is still no clear consensus on what exactly constitutes financial stress. The U.S. Treasury’s Office of Financial Research (OFR) defines financial stress broadly as “disruptions to the normal functioning of financial markets,” which typically has the following characteristics:
▪ Uncertainty about fundamental asset values, or investor behavior, which can generate volatility;
▪ Information asymmetries around asset and credit quality, which can lead to moral hazard and can be observed in changing spreads;
▪ Reduced desires to hold risky assets, which can cause those asset prices to fall rapidly or safe haven asset prices to rise; and
▪ Weaker demand for illiquid assets, especially if demand for liquidity increases unexpectedly, which can be measured in funding spreads.16
As such, FSIs have been created for different purposes. There are five prominent measures used to track the U.S. financial system, several of which were created by regional banks.17 Some FSIs are regionally focused: an EU-focused FSI may consider the union’s financial stability as a whole as well as interlinkages across member states. Others compare financial stress in country groups based on the level of economic development, assuming that advanced economies share certain characteristics in the functioning of markets and transmission of monetary policy, for example.
China is not as well represented in the range of literature on FSIs or FCIs. While indicators of long-building financial vulnerabilities, imbalances, and excesses in China’s economy are well known, financial stress indicators are underdeveloped. There are several reasons for this.
For one, most approaches in international economics to financial risk or financial stress detection are assembled for the purpose of global cross-country comparisons rather than for novel single-country cases. This means that variable selection is often standardized for comparison, focusing on the most common indicators rather than the most relevant for a given economy. This is understandable: preventing financial stress from spilling over and wreaking havoc globally is one crucial purpose of FSIs. In anticipating potential crises, for example, the International Monetary Fund (IMF) monitors and assesses country systemic risks across different country groupings: emerging markets, low-income countries, and advanced economies.18
16. Monin, “The OFR Financial Stress Index,” 4.
17. Brian Reinbold and Paulina Restrepo-Echavarria, “Financial Conditions Indexes,” Federal Reserve Bank of St. Louis, Economic Synop-ses, no. 17, 2017, https://research.stlouisfed.org/publications/economic-synopses/2017/11/03/financial-conditions-indexes/.
18. Ashvin Ahuja, Murtaza Syed, and Kevin Wiseman, “Assessing Country Risk—Selected Approaches—Reference Note,” IMF, June 2017, https://www.imf.org/en/Publications/TNM/Issues/2017/06/01/Assessing-Country-Risk-Selected-Approaches-44959.

Wright, Gloudeman, and Rosen | 19
Drawing on observations from past crises, emerging market analyses tend to focus on “sudden stops” of capital flows into an economy as a trigger event that can potentially spread across markets, countries, or regions. But even the IMF notes that traditional approaches do not take into account evolving sources of vulnerability, or channels of contagion. Vulnerabilities are typically grouped into “sectors”: fiscal, external, non-financial, financial, and asset prices.
In addition, financial variables conventionally selected for FSI inclusion are not the most relevant variables in China specifically. Typically, these approaches rely upon short-term and long-term interest rates and corporate credit spreads as key indicators of financial stress.19 U.S.-centric FCIs, for example, commonly include short-term U.S. Treasury rates, long-term U.S. Treasury rates, credit spreads, dollar value, and equity prices.20 The IMF’s cross-country FCI adds real estate prices and equity prices and values to more conventional financial market variables such as corporate spreads, local debt spreads, interbank spreads, and short-term interest rates.21 There is a clear case for including these conventional variables in assessing financial risk in China as well, but their relative significance is far different: short-term interest rates are likely more important, while corporate credit spreads are less important given the limited history of corporate bond defaults in China.
But as Chinese authorities’ use of monetary policy and other financial instruments has evolved over time, determining whether an indicator is a fair gauge of financial stress in China is not straightforward. China’s financial markets are younger and less developed than other advanced economies, certainly for an economy of its size and global financial reach. Additionally, the deepening of China’s financial system and addition of new financing channels and institutions has complicated the transmission of monetary policy, liquidity provision, and linkages between different market participants. Likewise, China’s financial technocrats have relied upon a changing set of tools to manage financial conditions over time, with some key rates or instruments (e.g., the one-year PBOC sterilization bill) fading into obsolescence and others gaining prominence (e.g., the loan prime rate or LPR).
Another complication arises from the fundamental objective of an FSI or an FCI: determining the impact of financial conditions on the state of the economy. As described above, FCIs typically gauge macroeconomic impact by measuring changes or co-movements in financial conditions and indicators relative to changes in real GDP or other macroeconomic variables. However, China’s economy is unique in that its GDP data (as well as other critical data series such as industrial value-added growth) is extraordinarily smooth, with little variance. Prior to the Covid-19 outbreak in early 2020, China’s real GDP growth had not moved outside the 6.0 to 7.0 percent range for more than four years. In addition, post-1978 China has not yet faced a systemic financial crisis.
The lack of variance on the outcome of financial stress has several implications for this report’s approach, labeled the “dependent variable problem” throughout this discussion. Incorporating independent variables that derive from stable or smoothed headline indicators would likewise reveal little variation. An FSI is interested in (if not explicitly predicated on, as the FCI is) the relationship between a change in the independent variable or principal component and the outcome
19. Hatzius et al., “Financial Conditions Indexes,” 7.
20. Reinbold and Restrepo-Echavarria, “Financial Conditions Indexes.”
21. IMF, “Online Annex 1.1 Technical Note,” in Global Financial Stability Report—A Decade after the Global Financial Crisis: Are We Safer? (Washington, DC: October 2018), https://www.imf.org/~/media/Files/Publications/GFSR/2018/Oct/CH1/doc/Annex1-1.ashx.

The China Economic Risk Matrix | 20
it causes as the dependent variable. In China’s case, despite key instances of acute financial distress, macroeconomic indicators have not faltered, and in fact they have barely moved at all over the past four years, moving only in a limited range for the past decade. This unique condition informs the approach to creating a new and China-specific FSI.
To tackle this fundamental problem, this report draws upon a notable China-focused approach developed by Sun and Huang (2016), who produced both an FCI and FSI for China. Their approach is based on several characteristics of China’s financial markets: dominance of the banking sector in the financial system, size and importance of other financial markets including three main money markets, two stock markets, and three bond markets, each of which is regulated differently and features a different mix of participants. The authors’ FSI contains eight variables covering four markets: (1) banks’ risk spread, banks’ non-performing loan ratios, and banks’ loan-to-deposit ratios; (2) Shanghai stock market index for stock markets; (3) exchange rate and foreign reserves for foreign exchange markets; and (4) risk spread and sovereign spread for debt markets.22 For Sun and Huang’s China FCI, additional variables reflect macro-financial linkages and monetary and credit supplies. These include non-performing loans (NPLs), money supply growth, consumer price inflation, national housing prices, the stock market index, and changes in foreign reserves. Their approach to dealing with the historical absence of an economic downturn in China (the “dependent variable problem”) is discussed in the next section.
A China-specific FSI for the Risk Matrix: MethodologyBased on the authors’ professional experience, the indicators chosen are assessed to reflect characteristics of financial stress in China. Variables were also chosen because they reveal limits in China’s state capacity to stabilize financial conditions. This China-specific FSI will then be combined with other variables to create the risk matrix of vulnerabilities specific to China’s economy and financial system. These additional indicators of vulnerability generally concern the property sector, banking sector, debt and credit, foreign pressure, and China’s openness to capital flows.
APPROACHCreation of the risk matrix’s China-specific FSI involves two steps: (1) selection of variables and (2) aggregation of the variables into an index. But because of the lack of variation on the dependent variable—in this case, GDP or key headline macroeconomic indicators—this approach is shaped by gauging the severity of financial stress in China rather than connecting the dots between financial stress and real economy outcomes. After all, there is no history of financial crises or a sharp slowdown in economic growth in China (prior to Covid-19, which will be discussed in more detail in Chapter 6). If the FSI is designed to diagnose financial stress in China, how can it predict something that has not occurred and cannot therefore be identified causally?
This approach starts with variable selection. Based on the deductive assessment of the likely proxies for financial instability in China (established in this report and within Credit and Credibility), 14 indicators were selected for FSI inclusion. The variables are converted to monthly frequency, then detrended to ascertain deviations from the trend. These deviations are normalized from the trend and rescaled so all variables are comparable. To weight different variables, three intermediate models based
22. Sun and Huang, “Measuring the instability of China’s financial system,” 13.

Wright, Gloudeman, and Rosen | 21
on three known but distinct instances of acute financial stress in China were created, which indicate how certain variables behave during periods characterized by types of financial stress. Each stress event produces its own intermediate dependent variable or outcome, which are all equally weighted into the aggregate FSI to reflect the ultimate dependent variable, financial stress. Figure 2.1 offers a summary of the model schema.
STEP 1: VARIABLE SELECTIONThe variable selection is based on important distinctions between the operations of China’s financial markets from those in other developed economies. First, China’s interbank market reveals key sources of financial stress, partially by design from Beijing or the PBOC. Historically, the central bank has allowed interbank rates to fluctuate more than other market rates in order to gauge funding or credit demand. Therefore, funding conditions in China’s money markets are heavily represented within this selection. Second, pressures from foreign exchange (FX) and balance of payments flows serve as enabling conditions to reduce or amplify financial stress in most emerging markets, but particularly in China. A measure of FX trading volumes within the FSI is therefore included. Third, state intervention is assumed to be more active and frequent in response to market-driven signals, unlike market-driven systems, where intervention is rare. Therefore, credit spreads and other measures of credit risk are less
Figure 2.1: China Economic Risk Matrix FSI Model Schema
Source: Rhodium Group.
Data Processing• HP filter, standardization, fill data gaps
• All data (historical and new) inputted each time the model is run
Stress Dummy AssignmentAssign event specific dummy variables to daily observations based on
qualitative judgments. For example, the date 2013-06-17 would be assigned to the 2013 interbank crisis dummy variable.
Intermediate ModelsTrain dummy variable prediction based on
Aggregate Intermediate DVsEqual weight applied to each intermediare indicator (unless otherwise specified)
Visualize FSIShow current FSI level relative to historical levels
Interbank Stress (2013)DV: TRUE/FALSE interbank
crisis “type” of stress
FX Stress (2015)DV: TRUE/FALSE FX crisis
“type” of stress
Deleveraging (2017-18)DV: TRUE/FALSE deleveraging
crisis “type” of stress

The China Economic Risk Matrix | 22
relevant as typical indicators of stress within China’s financial system because there is only a short history of credit defaults and more market-driven pricing of credit risk.
The variable selection process will by necessity involve some selection bias: it is based on the professional assessment of the functions of China’s financial markets stated above. Fourteen variables are included: interbank rates, spreads, bank asset growth, indicators of shadow banking activity, currency-related indicators, government and corporate bond spreads, and a monetary policy indicator (OMO) (see appendix for variable details). These variables are separated into categories of likely sources of systemic financial risk and capture elements of important financial markets in China, with a focus on interbank funding conditions, where financial stress in China’s system tends to be most observable.
RISK MATRIX CHINA FSI VARIABLES: ▪ 7-day repo market rate for banks and non-banks (R007): R007 is a market-determined interest
rate for bank and non-bank borrowers in China’s money markets that reflects the availability of short-term liquidity. The repo market is a crucial source of interbank wholesale funding and a key factor influencing interest rates throughout China’s financial system and economy. The R007 rate rises in times of stress as banks and non-bank financial institutions demand more funding in order to cover their liabilities and lend in lower volumes or at higher rates.
▪ 7-day repo market rate for banks (DR007): The DR007 is the interbank repo market rate for depository institutions only (banks). It is of the same duration and exhibits dynamics similar to the R007 but is only available to depository institutions.
▪ Spread between bank and non-bank repo rates (R007-DR007 spread): This measure helps to isolate stress among non-bank financial institutions (NBFIs) that are more leveraged and tend to hold riskier assets. In periods of stress, the spread will widen as NBFIs seek more funding, causing non-bank funding rates to rise under high demand. A relatively lower funding rate for banks amid high liquidity demand could indicate perceptions in China’s money markets concerning the implicit government guarantees behind banks’ liabilities or perceived creditworthiness of those institutions.
▪ Spread between yields on 10-year China Development Bank bonds (CDBs) and central government bonds (CGBs): Ten-year CGBs are highly liquid and frequently traded, and therefore more easily saleable. CGBs are often used by financial institutions as a liquidity management tool. Ironically, however, the most liquid instrument in China’s interbank market is usually the 10-year CDB bond. The CDB is a quasi-governmental entity that issues a substantial volume of bonds. Hence, when liquidity conditions ease, the spread between CDB and CGB yields will often narrow, as more institutions demand CDB bonds to use as collateral in repo transactions or to borrow from the central bank. Financial institutions tend to sell liquid assets such as CDB bonds first to cover liabilities in times of stress, causing the interest rate, or yield, to increase compared to CGBs. This widens the spread between the yields on the two securities.
▪ Spread between yields on 5-year AAA-rated and AA-rated corporate bonds: The interest rate spread between AAA and AA bond yields reflect different levels of risk and liquidity. Firms that issue AAA bonds are less likely to default, and AAA bonds are more frequently traded and more liquid. In times of stress, there is usually a flight to quality, and lower-rated corporate bonds are sold first, or cannot be auctioned in the primary market, increasing the yield spread between the two securities.

Wright, Gloudeman, and Rosen | 23
▪ 3-month Shanghai Interbank Offered Rate (SHIBOR): SHIBOR is a 3-month interbank reference rate set via a weighted average of a selection of banks’ daily bids of rates at which they are willing to lend to other banks in the market. The 3-month SHIBOR rate is particularly relevant for the pricing of interbank negotiable certificates of deposit (NCDs).
▪ Shanghai Stock Exchange (SSE) overnight repo rate: This rate is the cost of overnight borrowing through the Shanghai Stock Exchange. Compared to the interbank repo market, the exchange repo market is much smaller and more volatile, as it is not smoothed by central bank open market operations. This makes it a useful measure of short-term liquidity conditions, particularly for non-bank financial institutions.
▪ Change in USD-CNY exchange rate: This variable measures the change in value of the dollar compared to the Chinese yuan—an immediate gauge of whether or not China is facing capital outflows or other instances of financial stress that may add to pressure on the currency. In times of financial stress, overseas and domestic investors tend to exchange yuan for dollars to invest in safer overseas assets in expectation that the yuan will drop in value, resulting in a higher USD-CNY exchange rate.
▪ Spread between Chinese yuan and offshore yuan (CNY-CNH spread): China’s central bank intervenes in both the onshore yuan (CNY) and offshore yuan (CNH) markets to stabilize the currency, but it allows market forces more leeway offshore. The difference between the two is useful in gauging the market’s view of financial and economic conditions in China. A wider spread indicates greater stress and a higher likelihood of outflows.
▪ Difference between 7-day interbank deposit rates and repo rates: This measures the emergence of counterparty risk within China’s banking system. Repo rates are priced based on trades involving collateral, while interbank deposit rates are uncollateralized and based on the credit quality of the bank offering the deposit. Therefore, when this spread rises, it suggests financial stress because banks’ credit quality is in question.
▪ Net injection of liquidity via PBOC open market operations (OMO): China’s central bank intervenes in the interbank market to control liquidity conditions by either removing or injecting short-term funding. The net injection variable measures how much more liquidity the PBOC has added than it has removed. In times of stress, banks and non-banks redeem more assets to pay off liabilities, absorbing liquidity and causing interest rates to rise. The PBOC will respond by injecting more liquidity to stabilize interest rates.
▪ Spread between yields on 3-month negotiable certificates of deposit (NCDs): This is a measure of credit stress more specific to banks. When lower-rated banks are facing funding pressures, they will be unable to place interbank NCDs with other banks at the same yields as higher-rated banks. As a result, when this spread widens, it indicates rising financial stress within the banking sector.
▪ Volume of daily FX trading: This is a measure of the overall volume of foreign exchange trading, which tends to rise during periods that China’s currency is under pressure, with more foreign currency demanded. It can also rise when the yuan is strengthening, but this is less frequent.
▪ Bank asset growth: This variable measures the rate at which banks create new loans, acquire bonds, and extend other forms of credit. It is a useful measure of the overall growth of credit within China’s financial system because it includes some of banks’ activities in lending to non-bank financial institutions. In times of stress, banks tend to lend less and roll over fewer old loans
The China Economic Risk Matrix | 24
that come due, leading to slower asset growth. As banks curtail lending, overleveraged borrowers may be forced to default on debts.
STEP 2: PREPROCESSING THE DATAThese indicators vary in important ways: they feature different time series start dates, report at different frequencies, and involve different units. In order to assemble a long enough sample for the index to reflect changes in financial stress over time, the following steps were taken to reshape the variables before using them within the model.
▪ Sources: The authors obtained publicly available data series from Bloomberg and EastMoney and other reports directly from China’s financial authorities.
▪ Fill missing data: Differing start dates of data series impact how the model can be trained. Missing values after series start dates are interpolated, carrying the last observation forward. Missing data preceding series start dates is set to 0, the mean series value.
▪ Standardize frequency: Most variables in the FSI are daily with the exception of bank asset growth, which is monthly. All data was converted to monthly frequency: daily price variables are averaged, while daily and weekly quantity variables are summed.
▪ Detrending: The Hodrick-Prescott (HP) filter is used in order to capture deviation in variables not attributable to a long-run trend or cyclicality. The HP filter is a popular method of deriving a time-varying trend—meaning that the trend and its interpretation change over time—in the construction of an FCI.23 Using the HP filter allows establishment of a long-term trend, and the deviation of the variable from the trend can be used in the index. (For smoothing parameters, a lambda of 270,400 for daily data and 14,400 for monthly data was used.24)
▪ Standardization: Z-scores were calculated for the HP “gaps” or deviation in each variable at each datapoint from its long-term trend. This allows for comparison of variables with different units and rebasing on like terms with a mean of zero and a standard deviation of one. Use of z-scores also allows preservation of skewed or tail events. The combined use of the HP filter and standardization is consistent with the conceptual interpretation of the indicators: deviation of financial conditions away from an equilibrium state.25
STEP 3: WEIGHTING THE VARIABLES: THE “DEPENDENT VARIABLE PROBLEM”After selecting and preparing the variables, the team developed a way to weight the variables within the index in relation to the dependent variable, financial stress. However, as previously discussed, because China has not faced a distinct financial crisis or a sharp decline in economic growth (until this year), there are still difficulties in specifying the dependent variable itself. In other words, which historical financial variable movements are useful for identifying periods of financial stress in China, as it should be defined?
23. Céline Gauthier, Christopher Graham, and Ying Liu “Financial Conditions Indexes for Canada,” Bank of Canada, Staff Working Papers 4, no. 22, 2004, 5, https://pdfs.semanticscholar.org/3e3d/8f6dd651cdaa90920adb24a8ba8ace85bea0.pdf.
24. Some resources suggest that lambda = 100 * (#_periods_per_year ^ 2) is optimal, while others suggest that lambda = 1600 * (#_periods_per_quarter ^ 4) is optimal. Others, like the OECD’s approach, run the HP filter twice at different lambdas to achieve a smooth detrended cycle. Ronny Nilsson and Gyorgy Gyomai, “Cycle Extraction: A Comparison of the Phase-Av-erage Trend Method, the Hodrick-Prescott and Christiano-Fitzgerald Filters,” OECD, Statistics Working Papers, no. 2011/04, https://dx.doi.org/10.1787/5kg9srt7f8g0-en.
25. Xiaochun Jiang et al., “The Synergy of Financial Volatility between China and the United States and the Risk Conduction Paths,” Sustainability 11, no. 4151 (2019), https://www.mdpi.com/2071-1050/11/15/4151/pdf.

Wright, Gloudeman, and Rosen | 25
APPROACHES TO WEIGHTING FSI VARIABLESThe literature generally points to two broad categories of methodology (in FCI construction specifically, but applicable to FSIs as well):26
1. Weighted sum approach: Weights are derived for variables based on estimates of their relative impacts on real GDP. Weights can be derived through a number of approaches, such as structural macroeconomic models, vector autoregression (VAR) models, and aggregate demand equations. Lodge and Soudan (2019) use a weighted sum approach to demonstrate the role of credit growth in the ongoing stability of China’s financial system. Sun and Huang (2016) use a VAR model to weight the impact of industrial production growth on a one-unit shock from the financial indicator. While this approach is widely used and offers some flexibility, it still suffers from the “dependent variable problem,” in that there is insufficient variance in the outcome variable (GDP growth, industrial production growth) to register sensitivity to financial stress.
2. Principal component analysis (PCA) approach: This method extracts a common factor from a group of several financial variables that captures the greatest common variation in the set—the goal is to reduce the number of variables needed to explain an outcome. PCA can be used to identify characteristics of high-correlation events while avoiding instability in predicting relatively static outcome variables, such as GDP. However, it measures potential relationships between kinds of events rather than how they relate to a measurable outcome. The PCA approach can be used in combination with a weighted sum approach. Drawing from the literature, PCA appears to be the most standard approach to avoiding specifying a dependent variable (sometimes in conjunction with a dynamic factor model).
This study employs a slightly different approach to manage the lack of a clearly specified dependent variable than those above. This study utilizes machine learning techniques to derive intermediate dependent variables based on three distinct stress events, which are weighted and aggregated into the FSI. This approach can be thought of as a hierarchical network of models estimating relationships with intermediate dependent variables (liquidity stress among banks and NBFIs, capital outflows and balance of payments pressures, and evidence of counterparty solvency risk among banks), which in turn are used to construct a weighted estimate of the ultimate dependent variable, financial stress. The advantage of this approach is that it offers flexibility in merging the understanding of financial stress and instability in China with the quantitative rigor of the model. The disadvantage of this approach is that qualitative judgements still had to be made about the primary outcome of the model, in that the model must be told what financial stress should look like in China, based on experiences in the recent past.
26. See Hatzius et al., “Financial Conditions Indexes”; and Gauthier, Graham, and Lie, “Financial Conditions Indexes for Canada.”

The China Economic Risk Matrix | 26
Figure 2.1: Summary of Selected Modeling Approaches PCA DYNAMIC FACTOR MACHINE LEARNING
1. Unsupervised learning approach does not require a dependent variable.2. PCA describes variation across variables of interest.3. Output is primarily descrip-tive, rather than predictive.
1. Dynamic factor approach predicts variation in time series as linear combinations of random walks.2. Approach is useful for predicting series with a high degree of variability and complex relationships with explanatory variables.3. Approach must specify a continuous dependent variable.4. Complex implementation does not lend itself to intuitive comprehension.
1. Machine learning approach is regression-based.2. Approach focuses on predictive accuracy rather than isolating and measuring a causal effect.3. Model is trained on pre-speci-fied instances of observed finan-cial stress.4. Model returns a given selection of daily data’s predicted similarity to observed stress events.
Source: Rhodium Group.
The weighting approach has two main steps: (1) identifying known periods of financial stress and (2) training the model to produce coefficients of variables during episodes of stress.
Identifying Financial StressThere were three major financial stress events in China that must be considered in any attempt to derive a view of financial instability: the interbank market crisis of 2013, the balance of payments and foreign exchange crisis of 2015–2016, and the impacts of the deleveraging campaign in 2017–2018. These occurrences are detailed earlier in this report and discussed at length in Chapter 5 when assessing past instances of financial stress.
These stress events are treated as the intermediate dependent variables in the model and are assigned binary variables, meaning that variable behavior during an identified period over a certain threshold indicates financial stress and outside that period does not. Using a binary dependent variable offers a more straightforward understanding of what is being measured, since the model is being asked to measure similarity to identified stress events. Using a binary dependent variable also allows for modelling stress as a function of all relevant financial variables, which could address some endogeneity issues when using a financial measure as a dependent variable. Because the model scores predictions of stress similarity between 0 and 1, the binary approach translates well into the FSI, since low instances of association with stress events are predicted to take proportionally low values of similarity to stress events (and vice versa), without needing to indicate what level of similarity constitutes “stress.”27 Full details on this study’s technical approach can be found in the appendix to this chapter.
27. By contrast, using a non-binary outcome variable would create additional complications for the model. The first is that for each type of stress, one financial measure would need to be chosen that solely captures that kind of stress. Additionally, once the outcome is measured, a way to relate it numerically to the FSI would need to be defined. This could take the form of a threshold or scale. The challenge is to ensure that a particular kind of stress is being measured and not just variable fluctuation, which may be volatile even in times that do not represent stress.

Wright, Gloudeman, and Rosen | 27
For each stress event, variables are qualitatively assigned based on whether financial stress was observable (see Table 2.2). The following three charts visualize selected variables during identified periods of financial stress.
Table 2.2: Variable Assignments for Three Financial Stress Events
Source: Rhodium Group.
SERIES FOREIGN EXCHANGE INTERBANK DELEVERAGING
R007 to DR007 Spread x xR007 x xDR007 x xCDB to CGB 10Y Spread xCorp Bond 5Y Spread xSHIBOR 3M x xInt Dep 7d vs Repo xOMO Net xBank Asset Growth 12m xSSE Repo ON x xChange in USD to CNY xNCD 5Y Spread xFX Trading xCNY to CNH Spread x
-4
-2
0
2
4
6
8
10
Apr-
13
May
-13
Jun-
13
Jul-1
3
Aug-
13
Sep-
13
Oct
-13
R007 SHIBOR 3M OMO Net SSE Overnight Repo (2d lag) Interbank Deposits 7D vs Repo (1d lag)
Figure 2.3: Deviation from Trend in Selected Variables During 2013 Interbank Crisis
Note: shaded area represents ‘interbank stress’ dummy variable
Source: Rhodium Group.

The China Economic Risk Matrix | 28
After training and tuning the model using the specifications detailed in the appendix, three subindexes of the FSI were derived: interbank stress, FX stress, and deleveraging stress. The below visualizations show what these individual subindexes indicate about how these three types of financial stress fluctuate over time.
-8
-6
-4
-2
0
2
4
6
8Ju
n-15
Jul-1
5
Aug-
15
Sep-
15
Oct
-15
Nov
-15
Dec-
15
Jan-
16
Feb-
16
Mar
-16
CDB-to-CGB 10Y Spread Change in USD-to-CNY CNY-to-CNH Spread FX Trading
Figure 2.4: Deviation from Trend in Selected Variables During 2015 FX Crisis
Note: shaded area represents ‘FX stress’ dummy variable
Source: Rhodium Group.
-12
-10
-8
-6
-4
-2
0
2
4
6
Jan-
17
Feb-
17
Mar
-17
Apr-
17
May
-17
Jun-
17
Jul-1
7
Aug-
17
Sep-
17
Oct
-17
Nov
-17
Dec-
17
Jan-
18
Feb-
18
Mar
-18
Apr-
18
May
-18
Jun-
18
Jul-1
8
Aug-
18
R007-to-DR007 Spread CDB-to-CGB 10Y Spread Corp Bond 5Y Spread
SHIBOR 3M NCD 5Y Spread Bank Asset Growth
Figure 2.5: Deviation from Trend in Selected Variables During 2017-2018 Deleveraging Stress
Note: shaded area represents ‘deleveraging stress’ dummy variable
Source: Rhodium Group.

Wright, Gloudeman, and Rosen | 29
Figure 2.6: Snapshot of Financial Stress Intermediate Subindexes: Interbank StressFe
b-07
Aug-
07
Feb-
08
Aug-
08
Feb-
09
Aug-
09
Feb-
10
Aug-
10
Feb-
11Au
g-11
Feb-
12
Aug-
12
Feb-
13Au
g-13
Feb-
14
Aug-
14
Feb-
15Au
g-15
Feb-
16
Aug-
16
Feb-
17
Aug-
17
Feb-
18
Aug-
18
Feb-
19
Aug-
19
Feb-
20Ju
n-20
0
10
20
30
40
50
60
70
80
90
100
Source: Rhodium Group.
Figure 2.7: Snapshot of Financial Stress Intermediate Subindexes: FX Stress
0
10
20
30
40
50
60
70
80
90
100
Feb-
07
Aug-
07
Feb-
08
Aug-
08
Feb-
09
Aug-
09
Feb-
10
Aug-
10
Feb-
11Au
g-11
Feb-
12
Aug-
12
Feb-
13Au
g-13
Feb-
14
Aug-
14
Feb-
15Au
g-15
Feb-
16
Aug-
16
Feb-
17
Aug-
17
Feb-
18
Aug-
18
Feb-
19
Aug-
19
Feb-
20
Jun-
20
Source: Rhodium Group.

The China Economic Risk Matrix | 30
Outcome: A China-specific Financial Stress IndexThe three financial stress subindexes are equally weighted into a total FSI for China, as shown below in Figure 2.9. As the area overlay of the three subindexes shows, the type of stress seen during China’s deleveraging campaign in 2017–2018 is also prominent in historical periods prior to that, when shadow financing channels were slowing sharply, and indicative of financial system stress compared with FX and interbank stress. By far the most severe stress indicated by the FSI occurred during the interbank crisis of 2013, which reflects the study’s assumptions about the importance of interbank dynamics to financial conditions in China. Nonetheless, this should be helpful in identifying periods of broader financial system stress in the future as well.
In periods of global financial stress, the FSI shows lower, stable levels of stress relative to domestic events. Former PBOC advisor Yu Yongding argues that the turning point for China’s economy during the global financial crisis came in Q4 2008, with downgrades to industrial production, CPI, and GDP growth.28 The biggest hit to the economy came from the collapse in external demand, which led to overcapacity in industrial production and exposed the limitations of China’s investment and export-driven growth model. China followed with a 4 trillion yuan ($575 billion) stimulus package that ended up being much larger when including credit extended to local governments and related companies—the largest stimulus in the world at the time, equivalent to around 13 percent of China’s 2008 GDP. This injection papered over limitations in the financial system but also shows how insulated China was from the global financial system at the time.
The present-day reading shows a transition from post-deleveraging financial stress to easier conditions in early 2020 before the Covid-19 pandemic spread, which was consistent with the monetary easing
28. Yu Yongding, “China’s Policy Responses to the Global Financial Crisis,” (Richard Snape Lecture, November 25, 2009, Produc-tivity Commission, Melbourne), https://www.pc.gov.au/news-media/lectures/yongding/2009-yongding.pdf.
Figure 2.8: Snapshot of Financial Stress Intermediate Subindexes: Deleveraging StressFe
b-07
Aug-
07
Feb-
08
Aug-
08
Feb-
09
Aug-
09
Feb-
10
Aug-
10
Feb-
11Au
g-11
Feb-
12
Aug-
12
Feb-
13Au
g-13
Feb-
14
Aug-
14
Feb-
15Au
g-15
Feb-
16
Aug-
16
Feb-
17
Aug-
17
Feb-
18
Aug-
18
Feb-
19
Aug-
19
Feb-
20
Jun-
20
0
10
20
30
40
50
60
70
80
90
100
Source: Rhodium Group.

Wright, Gloudeman, and Rosen | 31
that was already underway earlier this year. Deleveraging-related stress in this model peaked in mid-2018, but Chinese authorities started easing financial conditions with a series of liquidity injections as early as January 2018. While shadow banking activity has continued shrinking within overall credit growth, the PBOC has kept up efforts to cut borrowing costs economy-wide to spur economic activity, driving the decline in the FSI through 2019. In the first half of 2020, volatility has clearly picked up, and China’s coronavirus policy response has caused each of the stress components to pick up periodically. Additional stress within the non-bank financial sector has materialized, as many trust companies are unable to repay investors, and smaller banks are starting to face bank runs as faith in banks’ creditworthiness has eroded since the failure of Baoshang Bank in May 2019.
This chapter has detailed this study’s approach to producing an index of acute, short-term stress within China’s financial system. However, one of the reasons that China has not had a financial crisis or a prolonged economic downturn so far is that Beijing, like any government, responds to financial stress and attempts to manage the consequences. Policy responses to financial and economic stress affect all FCIs and FSIs, and disentangling policy responses from the conditions they create is the subject of considerable methodological debate. However, some financial problems are easier to manage than others, even for countries with expansive policy tools at their disposal. The next chapter describes how Beijing can respond to financial stress and which types of problems are most difficult for China to manage.
0
10
20
30
40
50
60
70
80
90
100
Jan-
07Ju
n-07
Nov
-07
Apr-
08Se
p-08
Feb-
09Ju
l-09
Dec-
09M
ay-1
0O
ct-1
0M
ar-1
1Au
g-11
Jan-
12Ju
n-12
Nov
-12
Apr-
13Se
p-13
Feb-
14Ju
l-14
Dec-
14M
ay-1
5O
ct-1
5M
ar-1
6Au
g-16
Jan-
17Ju
n-17
Nov
-17
Apr-
18Se
p-18
Feb-
19Ju
l-19
Dec-
19M
ay-2
0
FX Stress Interbank Stress Deleveraging Stress FSI
Figure 2.9: The Risk Matrix China-specific Financial Stress Index
Source: Rhodium Group.

Wright, Gloudeman, and Rosen | 32
Chapter 3: Beijing’s State Capacity in Crisis Management
Over the past three decades, a long and uninterrupted period of rapid growth, ending only with this year’s Covid-19 outbreak, has bolstered the reputation of China’s leaders as savvy managers of what is now the world’s second-largest economy. Some of this reputation has been well earned. There were Deng Xiaoping’s radical moves to reinvigorate economic reforms with the Southern Tour in 1992. And there were Zhu Rongji’s efforts to restructure the economy and financial system following the Asian financial crisis, just as China was entering the World Trade Organization and was primed for a wave of foreign investment. China’s rapid response to the global financial crisis in 2008, with an extensive stimulus effort driven by the banking system and local governments, fed this narrative as well. The story went that China’s leadership, with checks and balances in a one-party system, had a larger tool kit at its disposal than Western counterparts and could set economic priorities years in advance.
And yet, even a quick examination of China’s recent history in the area of economic policy reveals some important caveats to this dominant narrative:
The financial system has evolved and grown faster than regulators’ capacity to manage it. While most commentaries focus on the competence of a technocratic leadership, substantially less attention has been directed at the policy tools deployed by Chinese officials in managing economic and financial stress. Those methods and levers of influence over the economy and financial system warrant far more careful scrutiny, precisely because they have not evolved significantly over the past five years as the threats within the financial system have proliferated. The challenges confronting China’s leaders and financial technocrats in managing a crisis are fundamentally different today than in the previous three decades. But the leadership’s basic approach to managing financial stress and the policy tools available to financial technocrats have not caught up to the rising complexity of China’s financial system itself.
Political leaders’ priorities can exacerbate financial risks rather than control them. While the nature of China’s political system and its lack of legal constraints may offer some temporary advantages in managing financial crises, it also creates obstacles to effective management. As Credit and Credibility and Chapter 1 of this report argue, China has seen financial risks accumulate precisely because China’s leaders are trying to avoid the political risks that would result from bankruptcies, unemployment, and slower growth. As a result, financial institutions tend to accrue additional risky assets and bad loans in the performance of national service, storing up

The China Economic Risk Matrix | 33
some of the risks that are now materializing within China’s banking system. These risks are rising even faster because banks are exercising forbearance toward borrowers in the aftermath of the Covid-19 outbreak.
Financial technocrats are not always the key decisionmakers in a crisis. In addition, technocrats themselves are not necessarily the only decisionmakers when instances of financial market stress occur. During the 2015 equity market boom and bust, and the ill-fated politically driven attempt to bail out investors at unrealistic stock market values, leading technocrats from the central bank and the Ministry of Finance were opposed to the key decisions that were made for political reasons.29 Technocratic expertise is less relevant when political objectives are prioritized.
There are no precedents for managing the consequences of a credit expansion of this size. Once the levels of debt and complexity in China’s financial system reach a certain level, problems become more difficult to manage effectively. Losses must be taken, and it is often political decisions rather than decisions based on economic efficiency that will determine where the costs will be borne. No one can be confident that China has reached an unsustainable level of debt (any level of debt can be serviced if interest rates are low enough), but it is notable that China’s technocrats have attempted to push back on rapid rates of credit growth throughout the post-crisis period. As the shadow banking system grew, bureaucratic conflicts and competition among regulators actually encouraged its growth, as Chinese authorities wanted to see greater competition between new institutions and the older state-owned banks. The net result has been the largest single-country credit expansion in over a century, relative to global GDP. Even if China’s financial technocrats were politically empowered and the world’s most skilled, the scale of this expansion means they have no precedents or experiences from which to draw.
This study attempts to clarify Beijing’s capacity to manage financial stress as well as the policy tools that Chinese authorities have used in the past and can use in the future when battling a potential financial crisis. This is not an exhaustive, historical account of Beijing’s management of previous cases of financial stress but an attempt to demonstrate the policy tools at Beijing’s disposal, along with their advantages and shortcomings. Based on that analysis, the study attempts to explain the types of financial threats that Beijing is least equipped to control, particularly when its credibility is under threat, as discussed in Chapter 1.
Beijing’s policy tools are far more limited in number and blunt in effect than conventional wisdom might suggest. These instruments have a strong track record of effectiveness, with some notable exceptions (the 2015 equity market and balance of payments crises, for example). But while Beijing’s policy instruments may compare favorably to tools available to Western and emerging economy policymakers in some respects, in qualitative terms, they are not that different.
Ultimately, any policy response in a crisis depends upon whether market participants see it as credible: a crisis can be defined as a loss of credibility in some element of market order. And China’s financial system itself is most vulnerable precisely when perceptions of Beijing’s implicit and explicit guarantees are changing, which is a critical component of financial reform. In this context, Beijing’s track record of maintaining economic and financial stability is not necessarily an asset. It may add to the risk of crisis
29. Lingling Wei, “China’s Response to Stock Rout Exposes Regulatory Disarray,” Wall Street Journal, August 4, 2015, https://www.wsj.com/articles/chinas-response-to-stock-rout-exposes-regulatory-disarray-1438670061.

Wright, Gloudeman, and Rosen | 34
if or when Beijing shifts course and signals its willingness to permit more market instability in the service of reform. There are other threats that Beijing’s policy tools may be poorly equipped to manage. To understand why those threats are now becoming more prominent, it is necessary to examine the nature of Beijing’s crisis management capacity more closely.
Key Elements of Beijing’s Capacity to Manage Financial StressWhen most analysts look at China’s economic policy approach, there is a presumption of a more aggressive state-led approach than is common in Western or other developed financial systems. “When they want to do something, they can usually do it” is how many might describe the Chinese state’s capacity to manage economic problems. This presumes both the will to act and a capacity to intervene in markets.
This view of China’s capacity has always been problematic given the divergence of interests within China’s political system itself. Identifying the actors that provide administrative direction is not always straightforward: market reformers within China’s financial bureaucracies often are more comfortable with market-directed adjustments than the top leadership or more conservative bureaucrats in Beijing, who prefer to project “stability” through their actions.
In addition, China’s interventions in financial markets are typically more subtle, operating through implicit guarantees of certain institutions, window guidance to banks, or more conventional central bank actions to inject liquidity into the financial system. It is only during periods of acute financial stress—the interbank market crisis of June 2013 or the equity market boom and bust of 2015—that blunter administrative controls are deployed.
Nonetheless, there are several elements that form the core of Beijing’s response to financial stress. Some of these have been on display in the economic policy response to the Covid-19 outbreak this year. Chinese authorities have developed a strong track record of responding quickly and meaningfully to instances of financial stress, as discussed in Credit and Credibility. The elements of administrative control can best be described as follows:
Authority to compel economic transactions by key players in financial markets: While unthinkable in developed market economies, the possibility that Beijing might order certain financial institutions to buy or sell certain securities is a factor that hangs over China’s financial markets. This tool does not always produce the intended results, but it can short-circuit or stop an aggressive credit liquidation cycle before asset sales impact financial stability. One recent example is the push for banks to allow distressed borrowers to extend payments on their loans during the Covid-19 outbreak. Forcing banks to post additional provisions or reduce profits because of a rise in explicitly recognized non-performing loans might have triggered a broader credit crunch. The benefit of repeated interventions like this is that when periods of financial stress arise, market participants often wait for the government to help rather than de-risking their own portfolios by selling assets quickly. The expectation of administrative intervention can effectively prevent a crisis by preventing the asset sales or risk aversion that could trigger broader financial system stress.
Obviously, there are also significant limitations to these administrative controls and expectations of government intervention. Market forces will usually reassert themselves even if administrative

The China Economic Risk Matrix | 35
measures drive prices temporarily. None of these tools are specific to China’s political system, as several other emerging markets have exercised similar degrees of control over financial actors within their own systems, so this is not a unique element in Beijing’s tool kit.
In addition, the recent track record of such administrative interventions is poor. Instructions to banks during the interbank market crisis in 2013 had the effect of exacerbating short-term liquidity stress, as some of the larger banks involved thought that Beijing’s intention was to squeeze the smaller banks more forcefully, causing them to withdraw funds from the interbank market. Property market controls on speculative purchases have not been particularly effective in slowing a runup in prices, nor have limits on developers cutting prices stopped property markets from selling off. During the bursting of China’s stock market bubble in 2015, instructions to brokerages to essentially ignore large sell orders and for large state funds to assist in buying stocks only had the effect of propping up the market temporarily at levels that major equity indices have still failed to regain even five years later. Overall, however, Beijing still tends to respond more reactively to episodes of financial stress rather than proactively to prevent stress when faced with evidence of growing financial system vulnerabilities.
Absence of meaningful legal constraints for crisis management: While policymakers in developed economies face legal constraints when trying to contain financial crises, China’s legal system does not act as a meaningful brake on the Chinese Communist Party’s range of action. If China’s leadership chooses to take a particular course in a crisis, it is difficult to imagine a situation where existing laws or regulations would prevent it from doing so.
One example can be found in the creation of the China Investment Corporation (CIC), China’s de facto sovereign wealth fund, which involved the issuance of around $205 billion in “special” Ministry of Finance (MOF) bonds that would effectively fund the purchase of an equivalent amount of foreign exchange reserves that the CIC would then manage. While there were laws that prevented the PBOC from “buying” government bonds from the MOF (in an effort to prevent deficit monetization), these did not create any meaningful constraint on the CIC’s activity. Essentially, policy banks were compelled to buy the bonds from the MOF, and then they were sold on to the PBOC, preventing the central bank from making the purchase directly. Similarly, during the equity market bailout of 2015, the PBOC did not have the legal authority to purchase stocks directly, so it did so through another organization, the China Securities Finance Corporation (CSFC), which bought shares with liquidity created from the central bank balance sheet.
This lack of legal constraints is both a blessing and a curse for Chinese authorities during a crisis. On the positive side, it broadens the scope for potential policy support, which boosts confidence in Beijing’s ability to take swift, far-reaching steps in a crisis. But it also makes Beijing’s actions far less predictable, raising uncertainty about the response and the prospects for it to succeed. Unsuccessful administrative interventions can damage Beijing’s policy credibility, particularly if authorities are operating outside of transparent legal constraints.
Capacity to inject liquidity directly into troubled financial institutions: This is not specific to China, and a key element of any central bank’s arsenal in crisis management is the ability to deploy liquidity to institutions facing financial distress. While this may involve lending to these institutions based on the collateral they provide, it can also involve funding in the absence of collateral through the printing of money. China’s central bank has used this tool in several

Wright, Gloudeman, and Rosen | 36
instances to respond to short-term liquidity stress and solvency problems within financial institutions. This can have a calming effect, preventing excessive risk aversion and withdrawals of funding in other asset markets. Banks that are confident that they will ultimately receive official support are more likely to continue lending, and consequently even vulnerable institutions can continue operating.
During the Asian financial crisis, China’s central bank relied heavily upon “relending” operations to provide short-term funding to larger banks facing significant volumes of non-performing loans. In 2013, to calm markets following an abrupt liquidity squeeze, the PBOC not only provided funds but instructed policy banks and larger commercial banks to lend into the interbank market and bring short-term money market rates lower. More recently, when Baoshang Bank faced pressing liquidity problems, the PBOC not only arranged for a larger bank (China Construction Bank) to take over its operations but also may have used its own balance sheet to assume some of Baoshang’s interbank assets and liabilities.30
While liquidity support to troubled financial institutions can help to relieve pressure over the short term, these operations do little to correct the problems that produced these liquidity problems in the first place. Beijing has no incentive to respond to every instance of financial distress, only those cases where excessive risk aversion may threaten broader policy objectives or systemic financial stability. But determining which forms of risk aversion reflect healthy repricing of market risks and which forms are potentially destabilizing is extremely difficult in real time.
A selective approach to transparency in the use of crisis management tools: Upon first glance, this appears to be more of a drawback than an advantage, but there are circumstances in which China’s reluctance to provide information to the market about its crisis management efforts may be helpful in avoiding crisis as well. There is an extensive literature on the linkages between policy transparency and the management of financial crises. This study will not weigh in separately on this debate, but it is important to note that China does use transparency quite selectively, with authorities withholding information from the public and markets, at least for limited periods of time. This must be taken into account when assessing Beijing’s crisis management toolbox.
Market participants, both foreign and domestic, do not necessarily have the same level of visibility into key prices in China’s financial markets as in more developed financial systems. Some domestic market participants may not have as much experience managing defaults, credit risks, and liquidity problems, leading them to miss important indicators of risk. It is commonly assumed that financial regulators have asymmetric information relative to market participants and, should they see potential sparks of broader financial contagion, can take action quietly to prevent them, either by injecting liquidity or extending trading hours to allow institutions to find additional funding before the end of the trading day.
30. In May 2019, the “other assets” listed on the balance sheet of the People’s Bank of China suddenly expanded by 434 billion yuan and then rose a further 249 billion yuan in June 2019 before returning to the April 2019 levels in July. It cannot be clearly established that this expansion of the PBOC balance sheet was tied to the bailout of Baoshang Bank and other troubled financial institutions, but the transactions are probably related, given the stability of the “other assets” line and the timing of these changes.
The China Economic Risk Matrix | 37
When the PBOC provided liquidity (reportedly as much as 2 trillion yuan) to the China Securities Finance Corporation to buy equities to support the market in 2015, they did not announce this operation was funded via the central bank’s balance sheet nor the size of the operation. This ambiguity was useful for the PBOC’s purposes in this instance, because markets could assume that there may have been more support waiting in the wings; disclosing a limit on the volume of the PBOC’s potential assistance might have been destabilizing if markets assumed no further assistance was forthcoming. Similarly, should the PBOC be able to take over a financial institution facing imminent default or bankruptcy and arrange that another institution take over its obligations, performing these actions quickly and quietly, outside of the glare of markets or the press, may be helpful in avoiding a panicked reaction within markets.
However, there is an obvious flip side to this lack of transparency, which is that fear tends to spread in financial markets where information is limited. In such an environment, market participants are more likely to believe that authorities are concealing bad news. This can have a negative impact on the credibility of the authorities, even when they are providing accurate information to the market.
The Chinese government’s handling of the Covid-19 outbreak in January 2020, while not a crisis that was financial in nature, illustrates the risks of withholding information from the public and markets. Even after the government was able to contain the spread through draconian lockdowns, doubts remained about whether official information about the virus could be trusted. When good information is not available, bad information tends to proliferate: this is true in public health crises as well as financial panics. Concealing the extent of policy support for distressed financial markets may be useful in some circumstances, but it can also exacerbate financial stress by undermining government credibility.
Of all of the policy tools to manage financial stress discussed above, none are unique to China or its political system. Politicians in many developing economies exert blunt controls over state-owned and state-managed financial institutions, and many governments conceal their attempts to support markets or financial institutions in the middle of a crisis. Chinese authorities have developed a strong track record of intervening in the economy and in markets to limit financial contagion. That history has provided Beijing with a certain degree of credibility. This will not disappear overnight, but it will be tested increasingly as new risks to the financial system accumulate.
Where Beijing’s Crisis Management Tools May Fall ShortBeijing’s policy levers in times of financial stress may appear stronger at first glance than the arsenal available to policymakers in other major economies. However, in crises with certain characteristics, these tools are likely to be found wanting. The equity market boom and bust in 2015 highlights some of Beijing’s constraints in particular financial market conditions—where there are large numbers of participants and market participants are responding to pricing signals. After several attempted interventions in July 2015, equity market prices still remain below the levels Beijing attempted to support at that time, even five years later.
There are several traits of economic sectors or financial markets where Beijing’s instruments of administrative control are unlikely to be very successful, and they will probably share several of the following characteristics:

Wright, Gloudeman, and Rosen | 38
▪ Financial markets with large numbers of participants;
▪ Market participants responding to market signals rather than administrative orders;
▪ Conflicting incentives among Beijing policymakers, or between Beijing and local governments;
▪ Markets featuring participants with a high degree of variance of levels of state support and control;
▪ Unclear or hidden pricing signals for critical assets; and
▪ Dependence upon foreign demand or external financing.
Looking at these characteristics, the sector that shares most of these traits is China’s property market. Real estate represents the majority of China’s household wealth, according to most household finance surveys, and property prices have been rising almost uninterruptedly since the market was liberalized in 1998.31
However, this record of appreciation does not mean that China was content to let property prices rise. Beijing attempted to control speculation in the housing market using several rounds of administrative controls. Most of these, however, have been ineffective. This is largely because there are too many market participants for Beijing to control, and investors have come to place considerable trust in the importance of the property sector itself for China’s economic growth. Even when authorities in Beijing imposed restrictions on investment-oriented housing purchases and raised down payment requirements for purchases of second and third homes, investors largely shrugged them off because local governments had the opposite incentives in place. They needed to sell land to raise revenue, and this required rising property prices. Property investors saw this divergence of incentives and recognized that even though local governments were likely to comply with Beijing’s directives, when the economy slowed, they would turn to the property sector first to boost growth. Over time, that disconnect between central and local incentives has been a solid bet for property investors.
On the flip side, however, Beijing is likely to face significant difficulties in controlling property prices should they start declining quickly. Authorities in Beijing are likely aware of these limits, which explains why they have taken such a strong interest in attempting to reduce the economy’s dependence upon the property sector in recent years. In the event that property prices start declining and expectations of further declines build, there is no recent history to reference within the market if investment-driven demand suddenly vanishes. And even if Beijing cuts down payment requirements and mortgage rates or offers subsidies, it is difficult to convince people to buy assets that they think will decline in value.
In addition, China’s local property markets are highly fragmented, which prevents one-size administrative solutions. Pricing data and transaction volume data is not necessarily comparable across cities, so Beijing may not necessarily know which areas of the country are in need of greater support. Inventory levels are usually self-reported by developers, so when prices start falling, inventory growth can rise very quickly. In addition, Beijing still does not necessarily want to see
31. Gan Li’s China Household Finance Survey places the proportion of real estate assets relative to net worth consistently over 50 percent since 2011, with some ancillary studies relying upon the data placing this proportion as high as 75 to 80 percent. See, for example, Sheng Li, Jie Li, and Alice Y. Ouyang, “Housing and Household Wealth Inequality: Evidence from the People’s Republic of China,” Asian Development Bank Institute, Paper no. 671, February 2017, https://www.adb.org/sites/default/files/publication/229996/adbi-wp671.pdf. In 2020, the People’s Bank of China conducted a survey of 30,000 urban households that found that real estate reflected 60 percent of household assets, with findings summarized briefly in “Av-erage net worth of Chinese urban household nears 3 mln yuan: survey,” Xinhua News Agency, April 26, 2020, http://www.xinhuanet.com/english/2020-04/26/c_139009659.htm.

The China Economic Risk Matrix | 39
prices rise quickly, which means that they will be reluctant to provide strong support to the market when prices start to fall, even if local governments are clamoring for more help. On the plus side for Beijing, foreign capital in the property sector is generally insignificant, but a downturn in prices could cause domestic investors to seek higher returns abroad, increasing capital outflows. Cycles in the property sector strike at the heart of some of Beijing’s vulnerabilities in containing financial stress. There is no strong record of policymakers in any country being able to deflate a sizable property bubble without negative consequences.
China’s property sector is also tightly linked to financial stability; many loans have been extended based on land as the available form of collateral. There is only a very short history of defaults on mortgage loans, since property prices have continued rising over time: banks are far less concerned with the creditworthiness of household borrowers in an environment where prices of the underlying collateral remain strong. But these asset values remain untested in the event of a sustained downturn in the property market. Many local governments have borrowed via their financing vehicles based on the implied promise that land sales will be sufficient to allow these localities to cover their companies’ debts. Falling property prices and land prices could quickly change those calculations and produce additional defaults in short order. Just as in Japan, once land and property prices had corrected, the effectiveness of Tokyo’s bureaucrats in containing financial stress appeared to falter, simply because once the losses had accumulated, there was far less flexibility for policymakers in deciding how they would be distributed throughout the financial system. Beijing is also likely to struggle to manage the fallout within the financial system should property prices begin a longer-term decline or fall suddenly and sharply.
Tensions within the interbank market in pricing credit risks highlight Beijing’s dilemma: financial reform or financial stability? The other key source of stress that cuts to the limits of Beijing’s state capacity is the emergence of credit risk within financial instruments in China’s interbank market. For most of the previous decade, Beijing’s implicit guarantees were presumed to extend to the vast majority of assets within China’s financial system. Now, however, credit risks are rising within corporate bonds, both onshore and offshore, within non-bank financial institutions, and within commercial banks themselves, after the default of Baoshang Bank in May 2019 and the restructuring of three other banks.
When any individual default occurs, market participants cannot be certain whether this reflects problems specific to the institution that defaulted or whether Beijing is attempting to reform the system by introducing new credit risks. Both are distinctly possible, and Beijing has an incentive to keep these situations ambiguous to gauge the market reaction to new forms of credit risk, just as they did following the default of Baoshang Bank. However, the interbank market is a complex beast with thousands of participants and no central counterparty in the pledged repo market, which is where the highest trading volumes occur.32 Following Baoshang’s default, many banks started reducing their lists of trusted counterparties and tightening collateral standards, which amplified the stress within the interbank market. Banks also started withdrawing interbank deposits from other institutions, which left some banks scrambling for funding to avoid a contraction of their balance sheets.
32. A central counterparty acts as a facilitator of interbank market transactions by providing clearing and settlement services in many developed financial systems, recording transactions and holding collateral for institutions engaged in trading on both sides. This central counterparty can also enforce collateral standards accepted for trading and settlement to minimize riskier transactions within the market. China’s stock exchange repo market has a central counterparty, and corporate bonds must meet collateral standards to trade there, but the interbank pledged repo market does not—transactions are negotiated informally and over the counter.
Wright, Gloudeman, and Rosen | 40
Beijing and the central bank could not monitor this process, because it is essentially impossible to know how thousands of market traders are thinking about risk at any given moment. Chinese authorities can only monitor the results of this process of repricing risk, and it is always difficult to know when the corresponding credit risks are producing a healthy outcome versus a potentially destabilizing outcome.
In addition, Beijing cannot control external changes in funding conditions for China’s financial system. China’s central bank can certainly take steps to counteract any external pressures, but Beijing still cannot “fight the Fed,” in market parlance, should U.S. interest rates rise or fall, potentially causing capital outflows or inflows into China. Throughout the period from 2003 to 2011, China saw persistent capital inflows as the yuan appreciated and struggled to manage the consequences of those inflows for domestic asset prices, particularly property and land prices (and two rounds of inflation in 2007 and 2011). When those inflows reversed in earnest starting in early 2013, liquidity within China’s domestic financial system was suddenly scarcer than in the past, which caused Chinese interbank traders to place far greater influence on PBOC actions to provide liquidity; these outflows placed the central bank in a more passive position, needing to respond to external conditions. In March 2020, during the Covid-19 crisis, the sudden surge in dollar financing costs caused trade credit channels to tighten, hurting China’s exporters. China likely repatriated dollar funds and sold U.S. Treasuries to offset some of the domestic funding pressures resulting from the external shock.
In addition, China is in greater need of foreign inflows, particularly into its equity and bond markets, than ever before. But Beijing’s state capacity does not extend to the perceptions of foreign investors, who continue to be highly concerned about China’s capital controls, even if they are attracted to the possibility of investing in China. Instead, Chinese authorities have attempted to place mild diplomatic pressure on the organizations responsible for global equity and bond indices, in hopes that changes in their own criteria for inclusion will introduce more passive inflows into China’s financial markets. This strategy may be successful up to the point that investors become concerned about the extent of their exposures in China, given the still limited reforms within the financial system itself. But the broader point is that Beijing cannot directly control how foreign investors perceive their actions and that other events such as the Hong Kong protests, the U.S.-China trade dispute, or the growing concern about Chinese technology companies and their linkages with the state can also implicate inflows into China’s financial markets.
Toward Better Indicators of CrisisEvery government will respond to a financial crisis by using the most powerful tools in its arsenal to stabilize conditions. But China’s predicament is that even reform-minded policy changes by the government itself may change perceptions of the government’s commitment to stability in markets. Beijing’s priority in reforming the financial system involves the withdrawal of implicit and explicit guarantees of asset prices and for markets to price the risk of default more accurately. Naturally, this involves financial losses, and the fear of additional losses that causes some lenders to withdraw funding from less creditworthy borrowers now that government guarantees are absent.
As a result, the tools available to Beijing to counter financial crises are not the only part of the story, as there is also a clear need for indicators when China’s state capacity is changing or suddenly deemed less credible by market participants. The development of these indicators—a combination of indicators of vulnerability and indicators of financial stress—is the core concept behind the China Economic Risk Matrix detailed in the next chapter.

The China Economic Risk Matrix | 41
Chapter 4: The China Economic Risk Matrix
The first three chapters have discussed the need for more precise quantitative indicators of China’s financial risks, the key differences between indicators of financial stress and vulnerability, Beijing’s state capacity in managing financial pressures, and the importance of government credibility working in concert with policy tools. This chapter explains the design of this study’s approach, organized around a scheme called a “risk matrix,” similar to a threat matrix in national security parlance. The China Economic Risk Matrix is designed to present both indicators of stress and vulnerability within a unified visual framework, even as the differences between these indicators have been described.
In addition to the China-specific financial stress indicator (FSI) detailed in Chapter 2, the risk matrix incorporates five key areas of risk in which rapid changes in Beijing’s credibility can have significant implications for financial stability and which operate at the boundaries of Beijing’s state capacity: property, banks, debt or credit, external pressure, and openness (capital account liberalization). In other words, these are the areas most deserving of scrutiny in assessing meaningful threats to China’s financial stability rather than threats that Beijing can easily manage using its existing policy tools.
Each section below discusses why these sets of indicators were selected, why changes in government credibility are important within these areas, and why Beijing’s traditional tools to manage these risks are likely to fall short. These threats interact with one another as well, even if they are not directly correlated. Stress in the property sector does not necessarily produce balance of payments pressures or banking system difficulties, but this can happen. The most likely direct implication of property sector stress will occur within the banks. Similarly, banking sector pressures may not produce incentives to open the economy wider to foreign participation so that banks can raise more capital from foreign investors, but that is also a possibility. A banking crisis when China’s capital account is closed is probably more manageable than a banking crisis when the capital account is more liberalized and outflows are more likely to intensify domestic financial pressures. The idea of a unified presentation of these risks is to show that China’s vulnerabilities are more likely to drive instances of financial stress when multiple sets of these indicators are flashing warning signs. The following chapter provides historical examples of financial stress in China and evaluates them using the risk matrix to explain the causes of stress and some of the forces that prevented a financial crisis from materializing at the time.

Wright, Gloudeman, and Rosen | 42
MethodologyThis study assembles distinct indicators that arguably best capture evidence of financial vulnerability or stress within these areas. This study determines what manipulation of the data is consistent with the concept of rising financial and economic risk at the core of this exercise. That manipulation differs by variable and can include, for example, interest rate spreads, stock values, flow values, indexes, and annual or monthly growth, among others. See the appendix to this chapter for a summary table of details on all of the variables chosen. Our approach to aggregating the information contained in these variables into their respective category indexes is relatively straightforward and consistent with accepted methodologies in constructing composite indexes and FCIs:
▪ Frequency: All data is converted to monthly by averaging daily data or duplicating quarterly data.
▪ Standardization: The sample mean is adjusted and standardized for the sample deviation for each individual indicator.
▪ Rebasing: The z-scores of all indicators are rebased to range from 0 to 100 for comparability and visualization.
▪ Inverse directionality: In cases where indicator values and criteria point in different directions (e.g., a lower value corresponds with higher risk), an alternative formula is used to invert the value.
▪ Aggregation: The rebased scores are averaged into a category index.
▪ Missing data: Data is processed only if a contiguous time series is reported. If a time series starts reporting after the start date of the indicator, it is treated as blank and is effectively excluded from the category index average.
▪ Date range: For simplicity and to gather as comprehensive a data set as possible, January 2007 is taken as the earliest start date for all series, and June 2020 is taken as the latest end date. However, some series start later and end earlier; date ranges are detailed below.
▪ Notably, no additional weightings or statistical analysis techniques were attached as was done with the FSI.
In Chapter 5, all indices are presented as a unified snapshot at different points in time. For demonstration purposes, all indicators are layered as below to show variation and concentration of risk over the entirety of the time series.
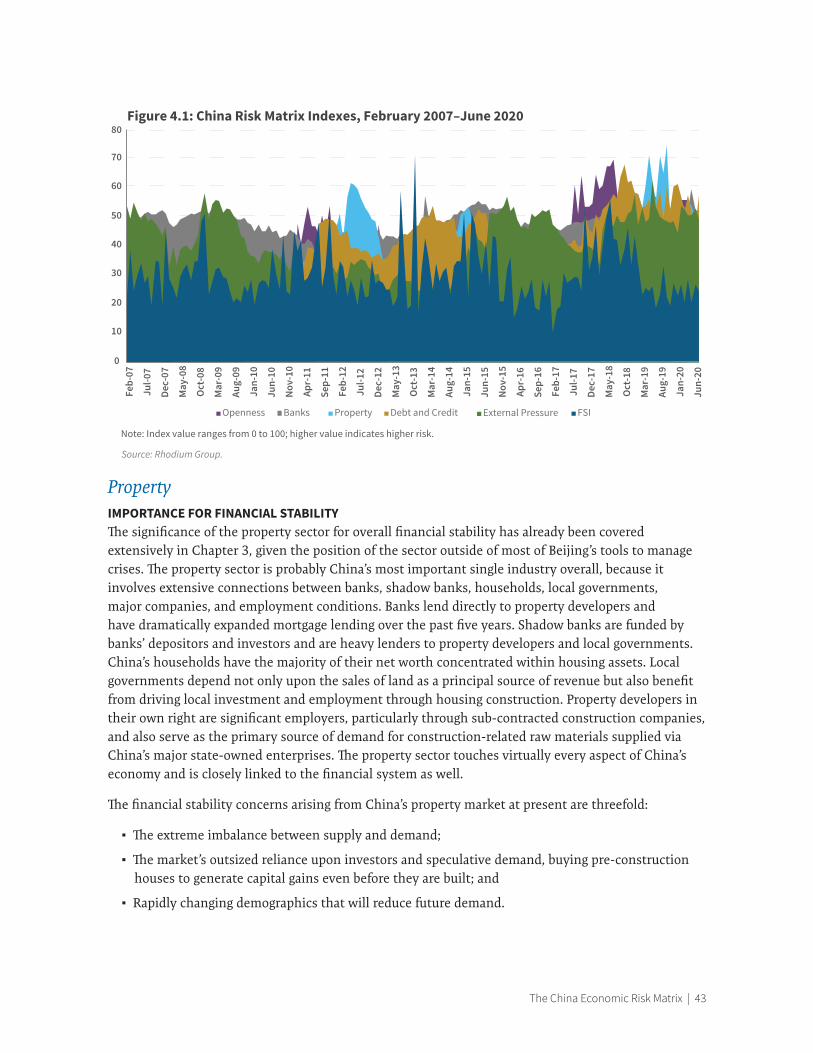
The China Economic Risk Matrix | 43
PropertyIMPORTANCE FOR FINANCIAL STABILITYThe significance of the property sector for overall financial stability has already been covered extensively in Chapter 3, given the position of the sector outside of most of Beijing’s tools to manage crises. The property sector is probably China’s most important single industry overall, because it involves extensive connections between banks, shadow banks, households, local governments, major companies, and employment conditions. Banks lend directly to property developers and have dramatically expanded mortgage lending over the past five years. Shadow banks are funded by banks’ depositors and investors and are heavy lenders to property developers and local governments. China’s households have the majority of their net worth concentrated within housing assets. Local governments depend not only upon the sales of land as a principal source of revenue but also benefit from driving local investment and employment through housing construction. Property developers in their own right are significant employers, particularly through sub-contracted construction companies, and also serve as the primary source of demand for construction-related raw materials supplied via China’s major state-owned enterprises. The property sector touches virtually every aspect of China’s economy and is closely linked to the financial system as well.
The financial stability concerns arising from China’s property market at present are threefold:
▪ The extreme imbalance between supply and demand;
▪ The market’s outsized reliance upon investors and speculative demand, buying pre-construction houses to generate capital gains even before they are built; and
▪ Rapidly changing demographics that will reduce future demand.
Openness Banks Property Debt and Credit External Pressure FSI
Figure 4.1: China Risk Matrix Indexes, February 2007–June 2020
Note: Index value ranges from 0 to 100; higher value indicates higher risk.
0
10
20
30
40
50
60
70
80Fe
b-07
Jul-0
7
Dec-
07
May
-08
Oct
-08
Mar
-09
Aug-
09
Jan-
10
Jun-
10
Nov
-10
Apr-
11
Sep-
11
Feb-
12
Jul-1
2
Dec-
12
May
-13
Oct
-13
Mar
-14
Aug-
14
Jan-
15
Jun-
15
Nov
-15
Apr-
16
Sep-
16
Feb-
17
Jul-1
7
Dec-
17
May
-18
Oct
-18
Mar
-19
Aug-
19
Jan-
20
Jun-
20
Source: Rhodium Group.

Wright, Gloudeman, and Rosen | 44
China’s property market has changed significantly over the past five years. In particular, demographic drivers of demand have eroded, as fewer Chinese young people are coming into the housing market because of lower birthrates following the one-child policy in the 1980s as well as urbanization trends that tend to reduce fertility rates. Household debt levels have risen sharply in China from 2014 to 2019, by around $4.6 trillion, very close to the rise in U.S. household debt from 2003 to 2008 ($5.1 trillion from Q3 2003 to Q3 2008).33 Similarly, China’s household debt-to-income ratio is now close to levels in the United States before the financial crisis, at 128 percent at the end of 2019. But while these drivers of demand have shifted, supply has risen to new all-time highs, with new starts at the highest levels ever in 2019 in terms of new floor space constructed. This imbalance between supply and drivers of demand creates significant vulnerabilities within the sector overall, with potential implications for financial stability.
Specifically, demand since 2016 has been overwhelmingly driven by investors rather than fundamental demand from owner-occupiers. The primary evidence of this trend is the rise in pre-construction sales of housing and the deviation of trends in pre-construction sales from sales of completed housing units. Pre-construction sales now account for 89 percent of total residential housing sales as of June 2020, compared to only 77 percent in 2015 and 64 percent in 2006.34 After the deleveraging campaign started in 2016, property developers found themselves needing to repay shadow lenders who were suddenly unable to roll over or extend new loans. As a result, developers needed to raise cash, and they did so by slowing down existing construction and spending while at the same time breaking ground on new projects, which allowed developers to raise cash immediately from pre-construction sales. In China’s system, buyers typically pay 10 percent down to remove an apartment from the market, in a pre-deposit, and then pay a further 20 percent down payment at the time of closing, whereupon they are granted a mortgage loan from a bank for the remaining 70 percent. But the developer can collect 100 percent of the purchase price of a unit upon that closure of the sale, without escrow requirements for the funding. Then the homebuyer is promised delivery of the completed house by a certain date, usually one to two years in the future. Essentially this allows developers to collect cash up front and promise delivery of apartments later. Under the deleveraging campaign, however, developers used this newly raised cash to repay old debt from shadow lenders. Therefore, to complete the units that they had already promised to homebuyers, developers started breaking ground on even more new projects and raising even more cash via pre-construction sales. As a result, there was a clear divergence in sales behavior: presales growth surged in 2018 and 2019, while sales of existing units declined.
The point of highlighting these unusual Ponzi-type financing elements now operating within the property sector is to illustrate the types of events that could trigger broader financial stress within the banking and non-bank sectors as well as a slowdown in economic activity. Clearly, this imbalance within new housing starts and sources of demand creates conditions for property prices to fall on a nationwide basis. And because of the market’s dependence upon investors, falling prices could quickly destroy a key source of demand if those investors suddenly thought that further price gains were unlikely to materialize. Throughout the roughly two decades of China’s private housing market, periods of declining prices have been very short lived, lasting for only six to nine months,
33. Data from the People’s Bank of China, multiple years’ series of “Sources and Uses of Credit Funds of Financial Institutions,” http://www.pbc.gov.cn/eportal/fileDir/defaultCurSite/resource/cms/2020/07/2020071415425893972.htm; and the U.S. Federal Reserve.
34. Data from China’s National Bureau of Statistics, accessed via CEIC. “CN: Floor Space Sold: ytd: Residential: Existing House (China)” and “CN: Floor Space Sold: ytd: Residential: House in Advance (China).”

The China Economic Risk Matrix | 45
and have occurred only three times in history: in late 2008, in late 2011, and for most of 2014. Investors have consequently been relatively confident in property as an asset class: it is one of the most significant retail investment bubbles that has not yet burst. In addition, should investment-driven demand falter, it is likely that developers will see a slowdown in overall sales revenues and therefore will need to slow construction activity overall. Developers will then need to cut prices further to generate sufficient revenues to maintain construction on the houses they have already sold and promised to Chinese homebuyers.
As a result, the indicators selected within the risk matrix to determine where stress within the property sector is likely to strain China’s state capacity to respond are heavily linked to movements in property prices, particularly when property prices are changing quickly. China’s leadership is creative in responding to crises and financial stress, but some problems are easier to manage than others. If nationwide property prices decline by 30 to 40 percent, as a hypothetical example, the set of solutions to prop up demand in the world’s largest housing market is fairly limited. Government authorities may convince themselves that they can restart demand by reducing required down payments on mortgage loans, undoing local government purchase restrictions, and even offering subsidies to buyers in certain cities. These measures have been effective in the past. But home ownership rates are already very high—the outright need for new housing in China is much smaller than in the past, even if most people would prefer to live in a larger or higher-quality house. And it is difficult to convince investors to purchase something that they think will decline in value over time. Just as it was difficult for Chinese authorities to control housing prices when they were rising, it will similarly be difficult for Beijing to control prices if they start falling rapidly nationwide.
INDICATORS SELECTED AND EXPLANATION70-city property price index: Data concerning movements in China’s property prices are scarce and prone to different interpretations. The problems in assembling a nationwide index are easy enough to understand, as most of China’s property sales occur on new construction rather than existing or older units. As China’s cities have expanded, however, more new construction occurs closer to the outskirts of new cities and in new development zones rather than in the city center. Thus, even within the same city, it can be difficult to make comparisons in property prices over time. The differences are magnified when looking across cities. For example, average prices in one large city might be lower in a single month compared to a smaller city simply because the buildings that were sold in that month were farther away from the city center, not because average prices in that city were lower overall.
The National Bureau of Statistics produces a series of price indices for 70 major cities in China and announces the results monthly. The data are supposed to cover new residential construction in these cities. Bloomberg produces a weighted average for these cities’ price movements nationwide. For the risk matrix, a six-month moving average of the nationwide price movements was used, annualized by multiplying by two. Then the rate of change of these prices was used to assess inflection points (when price rises slow or when price declines accelerate). While these price series overall tend to understate the actual magnitude of price changes, they do usually indicate the direction of prices accurately and can be used in combination with other indicators.
Secondary market prices: In addition to primary market prices, trends in secondary market property prices can be assessed, which are likely to be central to scenarios of financial distress, as described above. Two sets of secondary market price indicators are used here. The first is based on monthly price

Wright, Gloudeman, and Rosen | 46
trends among existing structures from the National Bureau of Statistics. The second is based on weekly transaction price and volume data for 96 cities from the housing data provider Fangjia.com, with a weighted average nationwide price index based on prices multiplied by floor space sold.
Developers’ average sales prices: Data compiled from WIND for 21 listed property developers is used to calculate their average sales prices and determine short-term trends in property prices offered by major developers, based on their publicly disclosed results. Only a small selection of developers for limited time frames is available because of inconsistent data reporting over time.
Supply-demand imbalances: To assess the degree of fundamental imbalance between demand and supply within China’s housing market, national housing starts are looked at on a floor space basis, using a 12-month rolling sum from data provided by the National Bureau of Statistics. Then national sales in floor space terms are evaluated on a 12-month rolling sum basis to assess the extent of the gap accumulating between housing promised and actual national sales volumes.
Developers’ bond defaults: To assess the extent of financial pressure building within the property sector, a database was assembled of all corporate bond defaults by property developers, based on media reports and disclosures by bond clearinghouses, to measure the principal of those defaulted bonds over time. Should more developers default on their publicly traded bonds, the financial pressure to start cutting property prices to repay debt will likely rise.
Land sales: Land sales can be a useful indicator of developers’ financial conditions. Typically, developers will acquire more land when they are more optimistic about the property market and will curtail purchases when they are more concerned about the outlook or when they need to preserve cash. As a result, a slowdown in new land purchases on a 3-month moving average basis, measured via an average of land sales indicators provided by the National Bureau of Statistics, can serve as a proxy for developers’ building financial stress.
HISTORICAL RANGE OF PROPERTY RISK
0
10
20
30
40
50
60
70
80
Feb-
07Ju
l-07
Dec-
07M
ay-0
8O
ct-0
8M
ar-0
9Au
g-09
Jan-
10Ju
n-10
Nov
-10
Apr-
11Se
p-11
Feb-
12Ju
l-12
Dec-
12M
ay-1
3O
ct-1
3M
ar-1
4Au
g-14
Jan-
15Ju
n-15
Nov
-15
Apr-
16Se
p-16
Feb-
17Ju
l-17
Dec-
17M
ay-1
8O
ct-1
8M
ar-1
9Au
g-19
Jan-
20Ju
n-20
Figure 4.2: Property Risk Index
Note: Index value ranges from 0 to 100; higher value indicates higher risk.
Source: Rhodium Group.

The China Economic Risk Matrix | 47
The property risk indicator is roughly consistent with the cycles in China’s property sector, which correspond to changes in China’s construction activity and overall shifts in economic growth. The indicator rises sharply in 2012, indicating the large inventory accumulation from China’s post-crisis building boom, and rises again in late 2014, when China’s economy slowed and commodity demand correspondingly suffered. The risk indicator dropped when the property market led China’s recovery in 2016, as would be expected. Notably, risk in China’s property sector has risen to higher levels in 2019 than seen in 2014, although this is probably a consequence of rising corporate bond defaults by developers. The indicator has declined slightly so far in 2020 but remains at historically elevated levels.
The data series included in the property risk index vary widely in date range. All series are current and reported as of June 2020. As for start dates, data on implied unfinished property stock reported by developers starts at the January 2007 beginning of the full sample. Secondary market price data starts in December 2011. Both land sales data and 70-city price data start reporting in early 2012. Developers’ average sales prices started reporting in January 2018, and the earliest developer bond default on record is July 2018 (though zero is used for datapoints prior to the first default to indicate a lack of apparent financial stress from developers).
CRISIS SCENARIOS AND CLOSEST HISTORICAL ANALOGYThe closest that China has come to a rapid decline in property prices and the potential for broader financial fallout occurred in 2014 and early 2015. The downturn in the property market started with a slowdown in shadow credit availability, which forced developers to start cutting prices. Within six months, overall construction activity had started to slow as developers needed to discount units to repay debt, slowing construction on existing units. As a result, there was a significant decline in Chinese commodity demand in late 2014 and early 2015, and this period coincided with a rapid rise in the dollar globally because U.S. economic prospects were improving and expectations emerged that the Federal Reserve would start raising interest rates for the first time since the global financial crisis. China’s industrial output growth slowed sharply in late 2014 and early 2015 without demand from property construction, and there was evidence of rising unemployment and underemployment as well. The corresponding decline in global commodity prices also created deflationary momentum in China and fed expectations of capital outflows that ended up producing market pressures for China’s currency to depreciate.
The downturn in property prices ended around August 2015, ironically because of the government’s attempts to support the equity market, which was facing its own boom and bust cycle at that time. The funding that was used by both brokerages and the China Securities Finance Corporation to buy flagging stocks in a futile attempt to prop up equity prices mostly allowed retail equity market investors to exit the market and move that funding into the property sector. Secondary market housing prices bottomed out in the summer of 2015 and rose very sharply after that time.
The key crisis scenario involving the property sector is a collapse of prices and transaction volumes, which will lock up considerable volumes of household, corporate, and financial sector assets in illiquid forms. This would have implications for household consumption, financial system stability, and bank solvency as well, given the strong linkages between the property sector and financial assets throughout China’s system. Global commodity prices are also likely to decline under these conditions. This scenario is discussed in far more detail in Chapter 6.

Wright, Gloudeman, and Rosen | 48
BanksIMPORTANCE FOR FINANCIAL STABILITYThe second major set of indicators of China’s financial vulnerabilities involves risks within the banking sector. China’s financial system is dominated by banks—they hold an estimated 91 percent of total financial assets and are the primary financial institution used by most households and corporates in China.35 Banks are central to any financial system, and problems at banks end up producing broader credit contractions within the economy, as an insolvency at a bank damages future credit conditions for borrowers and creates liquidity problems among depositors and investors. Bank distress can arise on both the asset side and liabilities side of the balance sheet, and these problems are often intertwined. There is an extensive literature available on the causes and patterns of different types of banking crises, and China has been at the forefront of discussions of potential banking crises for over a decade.
However, unlike problems in the property market, China has an extensive record of managing risks within the banking system. Beijing has already led a large-scale bailout of state-owned lenders following the Asian financial crisis, extending to the early-2000s. The core of the effort was a recapitalization using direct funding from the Ministry of Finance and foreign exchange reserves from the People’s Bank of China. Then four “asset management companies” were created to purchase non-performing assets from the banks themselves, cleaning up banks’ balance sheets. Subsequently, the banks were listed on foreign equity exchanges in Hong Kong to demonstrate their full commercialization, with partnership with foreign strategic investors to assist in risk management. While this plan was relatively well executed in the 2000s, China did not really manage the non-performing loan problem of the 1990s but grew out of the problem instead. The economy expanded rapidly over the subsequent decade, and so the 1.4 trillion yuan in non-performing loans that were carved out of banks with the creation of the asset management companies fell from 14 percent of GDP in 2000 to only 3.4 percent of GDP in 2010.
Now, China’s banking system is over 25 times larger in total assets than it was when the last bailout was initiated: the old tactics will not work again. The banking system alone has added $34.6 trillion in new assets since 2008, while GDP has only risen by $9.5 trillion. In addition, the banking system is far more complex than it was in the late-1990s. There are now thousands of banks operating in multiple jurisdictions, and financial transparency is low. Most of the smaller banks depend upon financing not from stable deposits but from interbank or wholesale funding or from shadow financing instruments such as wealth management products. From 2012 to 2016, China saw shadow banking products expand dramatically, with funding from banks redirected into third-party non-bank financial institutions engaged in riskier lending or leveraged speculative investments into financial markets. A more aggressive deleveraging campaign launched in late 2016 to reduce financial risks ended up shrinking the size of both non-deposit liabilities and non-loan assets within China’s banking system but at the cost of reducing overall credit growth to the economy. Shorter-term funding risks to banks were replaced by longer-term credit risks produced by a slowing economy and weaker credit growth.
Even as China has experience in managing banking crises, authorities have no experience in managing a financial system of this size and global significance. The point of the previous discussion is not to
35. Data from People’s Bank of China. Reported within “China financial institutions report asset growth,” Xinhua, March 23, 2020. http://www.xinhuanet.com/english/2020-03/23/c_138908580.htm.

The China Economic Risk Matrix | 49
relitigate the recent history of China’s banking system (see Chapter 2 of Credit and Credibility) but to highlight the importance of government credibility in stabilizing this system. Until Baoshang Bank’s failure in May 2019, depositors were generally not alarmed by asset quality problems at banks because they expected some form of government support in the event of any problems—and this extended even to interbank and corporate depositors.
Baoshang’s default and eventual restructuring changed that calculus for many investors and depositors, as will be discussed extensively in Chapter 5. Suddenly, counterparty solvency risk needed to be priced. Previously held assumptions that banks were state-guaranteed and could not fail were questioned. Market focus shifted to the characteristics of banks themselves, the quality of their loans, and the stability of their funding bases. So far, five commercial banks have formally been restructured, including Baoshang’s failure last May, and Baoshang itself has been declared bankrupt. Generally, these bailouts have involved a combination of funding provided to new shareholders from the PBOC itself or from larger banks to take over and assume the obligations of smaller and weaker banks in a “convoy system” similar to what Japan used in the 1990s.
But there is no guarantee that this pattern will persist in the future. Regulators could choose to shift from bailouts to “bail-ins,” involving refinancing or recapitalization from banks’ own depositors or investors, or pursue a more uniform, regulation-based approach to future default events. As a result, the banking system is one area where Beijing’s credibility is currently changing, and therefore the banking sector itself is vulnerable to potential shocks. The indicators within the risk matrix are designed to capture the precursors and variables correlated with those potential shocks, as markets increasingly question where government support for the banking system begins and ends.
INDICATORS SELECTED AND EXPLANATIONOverdue loans and estimated non-performing assets: Asset quality problems are obviously a potential indicator of default or insolvency but measuring non-performing assets in China is a problematic exercise. Banks have strong incentives not to report assets as non-performing because this would require additional provisions and would cut into profits. Many banks choose to hide non-performing loans and other bad assets via off-balance-sheet vehicles. As a result, the banking regulator’s officially reported level of non-performing loans of 2.1 percent in June 2020 is widely considered to be unrealistically low, given the significant expansion of China’s banking system in recent years relative to the size of the economy.36
To circumvent this problem, a measure of non-performing assets is used that includes banks’ overdue loans, those that have not been repaid for 60 or 90 days, and restructured loans, alongside official non-performing loan totals for individual banks. This is done for as many banks as possible, where annual report data is available. A system-wide non-performing loan ratio is then recalculated based on these estimates. One drawback of this approach is that this indicator can only be calculated on a quarterly or yearly basis, with the broadest range of data available only annually.
Change in banks’ wholesale liabilities: Many banks face defaults because of pressure on their funding bases rather than the performance of their assets. Often the fastest-growing and riskiest banks are those that rely upon interbank or wholesale funding to expand their balance sheets
36. Data from the China Banking and Insurance Regulatory Commission.

Wright, Gloudeman, and Rosen | 50
faster than ordinary deposit growth would provide.37 Within China in particular, the growth of interbank or wholesale funding has been a common factor that has caused other banks to pull back lending in the event of tighter liquidity conditions within money markets. This study assembles a system-wide estimate of wholesale funding based on banks’ non-deposit, non-bond, and non-equity liabilities as a proportion of total funding, calculated monthly, and assigns more risk when wholesale funding is shrinking.
Change in shadow banking assets: Banks are likely to face additional financial pressure when they struggle to use non-bank financial institutions as off-balance-sheet vehicles to hold non-performing or problematic assets. When assets within those non-bank institutions start to contract, this usually means these loans have migrated back to banks’ formal loan books, requiring additional provisioning and capital if the asset must be classified as non-performing. As a result, the change in shadow banking assets is worth monitoring, proxied here through four measures: banks’ claims on non-bank financial institutions, banks’ claims on other banks, and the monthly changes in trust loans and entrusted loans within the PBOC’s total societal financing (TSF) data.
Bank failures or restructurings: Ever since Baoshang’s default, additional banks have required emergency assistance or a restructuring. A few defaults can be isolated events, tied to one-off factors involving risky lending practices or a problematic shareholder. But multiple defaults in rapid succession usually point to a broader crisis tied to macroeconomic or financial sector conditions. The indicator used here is a simple count of the number of banks to default on depositors (beyond the protection of the deposit insurance system) or to undergo a government-administered restructuring for any reason.
Media reports of bank runs: As banking sector stress intensifies, more depositors within banks start to question the government’s commitment to their own money. They can grow particularly fearful if other banks have been “bailed in” or have used their own shareholders or depositors’ funding to restructure the bank. The result can be a rapid withdrawal of deposits out of fear. More of these bank runs have been occurring in China this year, but usually at smaller city or rural commercial banks. This indicator tracks a simple count of media reports of bank runs over time, using Baidu search frequencies. Ultimately, bank runs cannot always be confirmed, but the trend in media coverage is just as important for questions of credibility of government guarantees within the banking system.
37. See, for example, Joon-ho Hahm, Hyun Song Shin, and Kwanho Shin, “Non-Core Bank Liabilities and Financial Vulnerability,” NBER Working Paper no. 18428, September 2012, https://www.nber.org/papers/w18428.pdf.

The China Economic Risk Matrix | 51
HISTORICAL RANGE OF BANK RISK
The Bank Risk Index points to moderating vulnerability in the banking sector immediately after the global financial crisis, following China’s significant credit expansion. However, vulnerability started to rise in 2014 and 2015, given the increase in non-performing loans during the economic slowdown of those two years. Since the deleveraging campaign has driven a contraction in China’s shadow banking activities starting in 2017, risk has risen continuously, and bank defaults and restructurings in 2019 have placed banking risk at its highest levels so far.
Most indicators in the Bank Risk Index share the earliest January 2007 start date in the sample. These include overdue loans indicators (except for year-on-year growth, which starts in January 2008), wholesale liabilities indicators, and shadow banking assets (except for year-on-year growth, which starts in January 2008). Baidu media reports of terms related to bank runs start in January 2011. Instances of bank failures or restructurings are new in China’s modern history, so prior to the first instance, zero is used to indicate a lack of bank failure-related stress. Data on non-performing loans (NPLs) ends in December 2019, but all other series end in June 2020.
CRISIS SCENARIOS AND CLOSEST HISTORICAL ANALOGYGiven the size and complexity of China’s banking system at present, it is possible to envision a number of scenarios leading to crisis, driven by either large pressures from rising debt and non-performing assets driving a credit contraction or from a sudden loss of funding on the liabilities side as interbank and corporate depositors lose faith in one bank or many at once. Some of these are discussed in more detail in Chapter 6. Baoshang Bank’s failure in May 2019 marked the first time that a Chinese bank had failed since 1998 and the first time that Chinese corporate or interbank depositors faced haircuts on their investments in a bank. The net result was a rapid reassessment of banks’ counterparty lists as
30
35
40
45
50
55
60
65
Feb-
07Ju
l-07
Dec-
07M
ay-0
8O
ct-0
8M
ar-0
9Au
g-09
Jan-
10Ju
n-10
Nov
-10
Apr-
11Se
p-11
Feb-
12Ju
l-12
Dec-
12M
ay-1
3O
ct-1
3M
ar-1
4Au
g-14
Jan-
15Ju
n-15
Nov
-15
Apr-
16Se
p-16
Feb-
17Ju
l-17
Dec-
17M
ay-1
8O
ct-1
8M
ar-1
9Au
g-19
Jan-
20Ju
n-20
Figure 4.3: Bank Risk Index
Note: Index value ranges from 0 to 100; higher value indicates higher risk.
Source: Rhodium Group.

Wright, Gloudeman, and Rosen | 52
the prospect of losses on interbank and corporate deposits suddenly became plausible. Immediately following the fallout from Baoshang’s failure, smaller banks highly dependent upon interbank funding were unable to sell negotiable certificates of deposit in the market, causing them to lose an important source of funding growth. Interbank deposits—direct placements from one bank to another—also contracted at city commercial banks that had typically relied upon this funding.
The Bank of Jinzhou was the next bank to effectively fail and require government support, as the PBOC had to effectively issue temporary guarantees on its interbank negotiable certificates of deposit so that the bank could continue to operate. Soon after, both Hengfeng (often called Evergrowing Bank) and Harbin Bank similarly faced restructurings. But interbank financing conditions for smaller banks have generally improved, and there is not a broader credit crunch underway, particularly following the central bank’s efforts to relax monetary conditions following the Covid-19 outbreak. The following chapter will discuss the risk matrix’s evaluation of the Baoshang Bank default across the entire set of indicators, but the default remains the most significant credit event within China’s financial system since the interbank market crisis of June 2013. The consequences of the Baoshang default and eventual bankruptcy are still developing, particularly in the wake of the Covid-19 outbreak and its economic fallout.
Debt and CreditIMPORTANCE FOR FINANCIAL STABILITYDebt and credit stress are the origins of financial risks, driven by the actions of individual borrowers. In a world of financial transactions, both borrowers and lenders make assumptions that the future will behave much like the recent past. If an investment project generated returns in the past, both borrower and lender assume those conditions will probably continue in the future and will lend and borrow based on expectations of those future conditions. But even in normal economic cycles, this can lead to a misallocation of financial resources as the balance of supply and demand in the economy change over time, caused by multiple decisions of borrowers and lenders based on their own risk assessments.38 When there are more dramatic shocks, such as the Covid-19 outbreak, the resulting imbalances and financial pressures on individual borrowers can be more severe. But when borrowers default on loans, this impacts not only the direct lender, who then needs to decide whether to roll over, extend, or write off the loan (and provision for the hit to profits), but also other borrowers and lenders involved in the same industry, who will start to evaluate their own risks.
Within China’s financial system, the primary credit risks can be found within local government-linked companies and within state-owned firms, who generally make investments on the basis of policy decisions. Other sectors may also feature firms that have borrowed far too much and are at risk of default on their assets, but many local government financing vehicles (LGFVs) and state firms are merely the implementation arms of government-directed policy lending. Public works projects or other infrastructure may generate returns to the local economy over time, but they are not designed to deliver financial returns commensurate with their costs. Some projects such as highway or bridge construction will generate revenues in the form of tolls, but others will provide minimal returns. Consequently, the factor that prevents these local government companies from defaulting on their loans and bonds is implied government support from localities or the central government. Implicit or
38. This is only a very brief summary of some of the concepts developed in Hyman Minsky, Stabilizing an Unstable Economy (New York: McGraw Hill, 2008).

The China Economic Risk Matrix | 53
explicit guarantees keep credit flowing from banks to these firms and on to local governments driving infrastructure spending.
Within China’s corporate bond market, defaults are a fairly new phenomenon, starting only in 2014. The majority of defaults have occurred among private firms that have borrowed excessively relative to returns within their industries. While this is common in every economy, the actual recognition of those losses has only started in China’s financial system in recent years. In 2018 and 2019, however, credit risks arose from state-owned firms defaulting on both onshore and offshore bonds, and LGFVs started to default as well. Corporate bond defaults have risen virtually every year since 2016, and default rates in China are now comparable to those in more developed economies and financial systems.
Beijing has ample capacity to manage the risk of individual corporate defaults. No individual company is likely large enough to dwarf China’s fiscal and financial resources to manage losses. Authorities would only need to guarantee the debts of the firms involved in the event of widespread credit stress. Historically, participants in China’s financial markets have generally assumed that these guarantees cover state-owned firms, banks, and local governments and their related companies—Beijing did not need to clarify its direct support for these companies.
It is not in China’s interest to guarantee all debt within the financial system from all state-owned firms (or private firms). Therefore, Chinese authorities have maintained a stance of deliberate ambiguity in managing the consequences of corporate bond defaults or defaults on loans by state-owned firms. Generally, these risks have been managed on an ad hoc basis when they manifest rather than using a clear and transparent approach to delineating the levels of state support. Sometimes local governments will step in and provide guarantees, and sometimes other larger state-owned firms will provide support. Not all firms receive bailouts, but banks are usually called upon to extend new credit even to failing firms so that they can continue operating. A particular problem arises with so-called “zombie” firms, whose profits or operating cash flows are insufficient to manage the interest service costs on their debt and require continued new loans from banks just to maintain their survival.
As a result, the level of credit risk within China’s financial system is a function of the perceived level of Beijing’s support for distressed firms. The lines where Beijing’s support begins and ends have been redrawn significantly over the past two years, now that banks, LGFVs, and state-owned and private firms have all explicitly defaulted on their obligations. How those guarantees are clarified will be a critical variable in determining how much credit risk appears within China’s financial system.
The macroeconomic backdrop is likely to produce a steadily rising level of credit risks and individual company defaults in China, and the Covid-19 outbreak and its resulting economic slowdown may accelerate these risks. Interest rates offered by China’s banks to companies are too high for firms to generate sufficient returns to repay their debts. On average, listed companies posted a return on assets of 4.82 percent in 2019, while the average corporate borrowing rate remained above that level, at 5.92 percent at the end of that year.39 These higher interest rates effectively provide profits to the banking sector. As a result, Beijing’s guarantees on corporate credit also indirectly support the banks: as long as state-owned firms can obtain new loans to repay the old, then banks can continue to book interest
39. Average calculation of returns on assets based on Eastmoney averages of listed company results, and average lending rates provided by People’s Bank of China within Q4 2019 Monetary Policy Report.

Wright, Gloudeman, and Rosen | 54
income from the old loans being repaid. This provides profits for the banks, which allows them to add to their capital levels and continue expanding loans to the rest of the economy as well.
But China’s rapid growth in overall credit, combined with the high rates of interest on corporate borrowing relative to firms’ profits, has created conditions where defaults are likely to continue rising unless “zombie” firms are cut off and allowed to fail. Unlike many developed economies, China’s aggregate debt burden bears higher interest rates because corporate debt is a larger proportion of the total than lower-cost government debt. Ever since 2012, the aggregate annual interest costs on credit have been estimated to be higher than nominal GDP growth—a rough approximation of the economy’s capacity to manage credit risks.40 But since the Covid-19 outbreak, nominal GDP growth has fallen to near-zero levels. As a result, defaults are likely to rise in the coming years as more firms are unable to raise sufficient revenue to repay their debts. The key variables indicating the level of financial stress those defaults will generate are the credibility of Beijing’s guarantees to banks and firms and ultimately the size of the distressed debt pile that needs to be managed.
INDICATORS SELECTED AND EXPLANATIONTotal corporate bond defaults: The actual level of stated corporate bond defaults is an important indicator of overall credit risk building within China’s financial system. There is no official series on the level of corporate bond defaults, but the authors have compiled and maintained a list of defaulted issues based on media reports and statements from the major bond clearinghouses (who must report if companies have not made payments on time). The level of defaults is reported in terms of the principal on the impaired bonds as well as the proportion of bonds defaulted compared to maturing issues.
Interest burden as a proportion of credit: As a likely coincident variable to the rise in credit risks, the aggregate interest burden in China’s economy is calculated, measured as the average interest rate on credit from PBOC quarterly monetary policy reports multiplied by the total stock of credit. This estimated annual interest cost is then compared to the overall pace of annual credit growth to provide a ratio of how much new credit is likely being used to service the interest on older debt.
Interest burden as a proportion of nominal GDP: In addition, the same calculation is used of the annual interest burden in comparison to nominal GDP growth on an annualized basis as a rough proxy for the economy’s capacity to service its existing debt burden. Nominal GDP is used instead of real because this represents the actual payments that companies can make to banks rather than a measure adjusted for inflation.
Distribution of provincial credit: Credit is not distributed evenly across China’s provinces. Some provinces may be facing a much larger slowdown in credit growth relative to the size of the local economy, which can add to overall credit risks within the financial system. The PBOC provides credit growth measures by province, starting in December 2013. As a result, a calculation is included of the level of variance between the fastest level of provincial corporate credit growth relative to the slowest. When provinces are receiving more evenly distributed flows of credit, this likely indicates an environment where overall credit is expanding and financial risks are declining. But uneven rates of credit growth are typically associated with tightening credit conditions and rising credit risks within certain localities.
40. This calculation is based on total credit outstanding multiplied by the PBOC’s average borrowing rate on credit for that year, compared to the nominal growth in annual GDP provided by the National Bureau of Statistics.

The China Economic Risk Matrix | 55
HISTORICAL RANGE OF DEBT AND CREDIT RISK
The Debt and Credit Risk Index shows significant variation based on the overall level of interest rates, falling during the aftermath of the global financial crisis and rising as China normalized monetary policy in the years afterwards and needed to combat inflationary pressure. The index was then fairly steady through most of the period from 2012 to 2017 but did rise following the interbank market crisis of 2013, along with interest rates within China’s banking system. The Debt and Credit Risk Index has risen consistently since the deleveraging campaign began, as this has reduced shadow financing availability and made it more difficult for distressed firms to refinance. The rise in vulnerability is consistent with the persistent acceleration in corporate bond defaults and more recently the fall in nominal GDP growth.
Three series in the Debt and Credit Index (corporate bond defaults, interest-to-nominal GDP, and interest-to-new credit) start in January 2007. Within the sample, the data concerning the aggregate interest burden data ends in May 2020. Quarterly data on the skew of provincial credit growth in China start in October 2014 and end in June 2020.
CRISIS SCENARIOS AND CLOSEST HISTORICAL ANALOGYThe most plausible scenario for a credit risk-induced financial crisis in China is likely a sudden withdrawal of local government support for a locality’s LGFVs and other state-owned companies. A major default or two among corporate bonds or loans from these firms would cause banks to suddenly question the financial capacity of the local government altogether, which could cause a withdrawal of interbank funding from banks operating within that jurisdiction. Even healthy firms operating within the distressed city or county, or those doing business with the local government, would then likely be unable to issue bonds at market rates. Property prices would likely start to fall within the locality
0
10
20
30
40
50
60
70
80
Feb-
07Ju
l-07
Dec-
07M
ay-0
8O
ct-0
8M
ar-0
9Au
g-09
Jan-
10Ju
n-10
Nov
-10
Apr-
11Se
p-11
Feb-
12Ju
l-12
Dec-
12M
ay-1
3O
ct-1
3M
ar-1
4Au
g-14
Jan-
15Ju
n-15
Nov
-15
Apr-
16Se
p-16
Feb-
17Ju
l-17
Dec-
17M
ay-1
8O
ct-1
8M
ar-1
9Au
g-19
Jan-
20Ju
n-20
Figure 4.4: Debt and Credit Risk Index
Note: Index value ranges from 0 to 100; higher value indicates higher risk.
Source: Rhodium Group.

Wright, Gloudeman, and Rosen | 56
as well if investors questioned the capacity of the local government to keep property construction underway. In effect, this would represent a sudden rise in “geographic counterparty risk,” given the high degree of interconnections between banks, local governments, property markets, and state-owned and controlled firms. This risk is discussed in far more detail in Chapter 6, as it represents a form of vulnerability that may be unique to China’s financial system.
There is no clear evidence that this type of across-the-board withdrawal of funding based on credit risk has occurred within any particular locality, but there are two cases that are worth monitoring. Liaoning Province has suffered mightily ever since a sharp slowdown in China’s property market in 2014 and 2015. The province revised its GDP and industrial data sharply down for those years, effectively stating that the province as a whole had not seen nearly enough activity to service its debt—this was a cry for help from the central government. The net result was that Liaoning-based companies have received far less credit than those in other provinces ever since the GDP revision, and firms from Liaoning have seen a net contraction of corporate bond funding for the last three years. Overall credit in Liaoning outside of government-backed special revenue bonds has contracted by 0.5 percent year-on-year as of June 2020.41 Tianjin has similarly faced default issues, with the local government unable to prevent a $1.25 billion offshore bond default by one of its state-owned commodity traders, Tewoo. Tianjin relied heavily upon LGFVs to build infrastructure and commercial real estate projects in its Binhai and Yujiapu development districts, and the debt burden from its LGFVs alone consumes a significant proportion of all new credit flowing into the city (estimated at 66 percent).42 But neither of these provinces have faced a complete withdrawal of funding or a sharp contraction in credit outright contraction so far, even if participants in China’s financial markets are now far more aware of the risks developing within those localities.
External PressureIMPORTANCE FOR FINANCIAL STABILITYExternal forces are also beyond the reach of China’s state capacity and can potentially add to pressure on both China’s economy and its financial system. As a result, China is likely to be more vulnerable to instances of financial stress when certain external pressures are rising. At the same time, these variables are difficult to measure, as this pressure includes not only quantitative metrics such as actual capital flows but political perceptions that can trigger changes in economic decisionmaking both inside and outside China. Generally, external pressures on China that can meaningfully influence financial stability can be categorized along three lines:
▪ China’s short-term reliance upon dollar financing;
▪ Vulnerability to capital outflows and pressure on China’s currency to depreciate; and
▪ Media and political narratives that can discourage capital inflows or drive outflows.
41. Calculation made by the Rhodium Group based on PBOC provincial credit data for Q3 2019 through Q2 2020. Cal-culation is based on estimated provincial stock of credit. The Q2 2020 provincial credit data can be found at “Ag-gregate Financing to the Real Economy by Province,” People’s Bank of China, http://www.pbc.gov.cn/diaochatongji-si/116219/116319/3959050/3959051/index.html.
42. Bart Carfagno, Allen Feng, and Logan Wright, “Local Government Debt: Running Faster Just to Stand Still,” Rhodium Group, Chi-na Markets Research, May 15, 2019, https://rhg.com/research/local-government-debt-lgfv-running-faster-just-to-stand-still/.

The China Economic Risk Matrix | 57
China’s reliance upon the dollar for financing is extensive, particularly in terms of trade credit. Reducing that reliance over time has been one of China’s objectives in pushing for RMB internationalization, but this has been generally ineffective. During a broad squeeze in dollar financing globally, such as what took place in March 2020 following the Covid-19 outbreak, trade credit lines were cut as financial conditions tightened, causing importers to hoard dollars.43 Many Chinese entities borrow in dollars via overseas bond markets, including banks, property developers, and LGFVs. But outside of banks, these firms generally hold no dollar-denominated revenue streams, which leaves them vulnerable to sudden changes in dollar funding conditions. Moreover, when the Federal Reserve acts to ease dollar funding strains, China does not receive direct support via a swap line between the Fed and the PBOC. This leaves China vulnerable to changes in global funding conditions. A rise in the broad value of the dollar has been increasingly correlated with rising financial risks in global markets in recent years.44
In addition, Beijing has no meaningful control over the Federal Reserve’s monetary policy. When the Fed eased policy aggressively following the global financial crisis, China and other emerging market central banks blamed the Fed for driving capital inflows into emerging markets and increasing liquidity circulating within China. At the same time, when the Fed raises interest rates, this can drive capital outflows from China by reducing the yield differentials between U.S. and Chinese assets while also creating depreciation pressure on China’s currency.
China’s financial system is vulnerable to rapid and large-scale capital outflows, but Beijing has taken steps to minimize the threat posed by these outflows. A traditional balance of payments crisis results when a country faces balance of payments outflows that overwhelm the country’s defenses in the form of foreign exchange reserves. This happened in several countries during the Asian financial crisis. China holds over $3 trillion in foreign exchange reserves, and it would appear unlikely that any rapid surge in outflows could overwhelm that position and China’s capacity to defend the currency. But China’s holdings of reserves continue declining as a proportion of China’s domestic money supply, meaning that there is always more domestic currency being created that could potentially be exchanged for foreign currency in the event of acute financial stress.
The capital outflows from China are hardwired and inevitable, even if China does try to control those capital flows. China holds the largest single-country money supply in the world, at $30.5 trillion.45 Households and corporates will continue to diversify their assets into foreign currency, seeking higher returns, simple diversification, or corporate investment opportunities abroad. But the inflows back to China are contingent upon the performance of domestic financial markets, the regulation and reform of those financial markets, and the prospects for appreciation or depreciation of China’s currency. Even though China also sees large trade-related inflows that typically support the currency, capital flows are the most important proxy to watch in determining external pressure on China’s financial system. Should foreign exchange reserves from China continue to dwindle to levels well below $3 trillion, the prospect that China could not defend its currency from capital outflows rises in probability. This is
43. See Egemen Eren, Andreas Schrimpf, and Vladyslav Sushko, “US dollar funding markets during the Covid-19, crisis – the international dimension,” BIS Bulletin, no. 15, May 12, 2020, https://www.bis.org/publ/bisbull15.pdf.
44. See, for example, Stefan Avdjiev, Wenxin Du, Catherine Koch, and Hyun Song Shin, “The dollar, bank leverage and the devia-tion from covered interest parity,” BIS Working Papers no. 592, July 2017, https://www.bis.org/publ/work592.pdf.
45. “Money Supply,” People’s Bank of China, n.d., http://www.pbc.gov.cn/diaochatongjisi/resource/cms/2020/07/2020071415491528469.htm.

Wright, Gloudeman, and Rosen | 58
exactly what the PBOC tries to avoid in controlling capital outflows at the margin and attempting to encourage inflows from foreign investors with additional reform measures and openness to foreign financial institutions (more on openness in the next section). Beijing’s policy credibility is essential in this process, not only in presenting an image of financial stability to investors to encourage capital inflows but in downplaying the need for strict capital controls even in the event of a rise in outflows by demonstrating that these flows are manageable.
However, markets respond not only to raw utilitarian incentives but also to media narratives and broader perceptions of risk. The importance of narrative in economic decisionmaking is well documented but generally overlooked,46 and events such as the U.S.-China trade war, the growing global pushback against China’s aggressiveness in foreign policy, and sanctions targeting Chinese individuals on issues such as human rights abuses in Xinjiang can all contribute to a financial market narrative that translates into lower levels of investment in China’s markets. These variables are difficult to measure, of course, but the net result of political tension between China and the rest of the world is likely to be slowing direct investment in China and reduced capital inflows over time because of the perceived political costs of these investments. And while China can seek to influence and push back against these media narratives, they have only limited tools to do so.
INDICATORS SELECTED AND EXPLANATIONValue of dollar index (DXY): There has been a variety of recent research explaining the linkages between the broad value of the dollar and the corresponding risk within the global financial system. This transmits to China’s financial system not only through contractions in trade credit but also the need for additional hedging by Chinese firms who have borrowed in dollars.
U.S.-China interest rate differentials: Because China manages its exchange rate carefully against the dollar, capital flows can move in either direction, in and out of China, based on interest rate differentials between the two countries. If U.S. interest rates are higher (usually associated with a stronger dollar, but not always), this may accelerate capital outflows from China and reduce portfolio inflows into China as well. The measure is calculated based on a simple difference of the 10-year yields on U.S. Treasuries and Chinese government bonds.
Balance of payments outflows under capital and financial account: This is an expanded measure of China’s capital outflows, including direct investment in and out of China, portfolio flows in and out of China, and the activities of banks in cross-border financial flows. The measure is calculated quarterly and also includes the net change in “errors and omissions” under China’s balance of payments, which usually consists of uncategorized capital flows rather than trade flows in China, given their historical correlation with other measures of capital flows.
Foreign exchange reserves as a proportion of the money supply: This is a broad measure of China’s potential vulnerability to capital outflows because the domestic money supply represents the pool of domestic currency that could be exchanged for foreign currency if the central bank remained committed to defense of the exchange rate at a certain level. If reserves fell too low, the central bank would likely be compelled to abandon that defense and allow the market to force the exchange rate to depreciate before it found an equilibrium. This is historically what occurs within a traditional balance
46. Robert J. Schiller, Narrative Economics: How Stories Go Viral and Drive Major Economic Events (Princeton: Princeton University Press, 2019).

The China Economic Risk Matrix | 59
of payments crisis in emerging market countries, but China starts from a much stronger position in defense of its currency than most other emerging markets. The ratio is calculated as the dollar value of China’s money supply at the exchange rate at the time compared to the size of foreign exchange reserves in dollar terms.
China’s external bank-to-bank borrowing: These capital flows between banks are among the categories that can reverse the fastest, as they did in 2011 when European banks repatriated their own capital and recalled funds from China’s banks. Chinese banks borrow in dollar wholesale funding markets, and the Bank for International Settlements produces a quarterly data series concerning the size of that borrowing.
Media discussion of U.S.-China tensions: The simple view expressed via this measure of online discussion terms linked to U.S.-China political tensions is that leadership in any country often reacts to media coverage of political events. The terms used here include “trade war,” “decoupling,” “sanctions on China,” and other terms. This study uses a search function provided by Baidu to evaluate the relative use of the terms.
Change in rate of export growth: Obviously, China’s manufacturing sector will face additional pressures when there are trade restrictions imposed or broader weakness in the global economy. The measure here is designed to capture inflection points in export growth or where the rate of growth or decline accelerates or slows. Pressure is likely to be stronger when the rate of decline in exports is accelerating.
HISTORICAL RANGE OF EXTERNAL PRESSURE RISK
0
10
20
30
40
50
60
70
Feb-
07Ju
l-07
Dec-
07M
ay-0
8O
ct-0
8M
ar-0
9Au
g-09
Jan-
10Ju
n-10
Nov
-10
Apr-
11Se
p-11
Feb-
12Ju
l-12
Dec-
12M
ay-1
3O
ct-1
3M
ar-1
4Au
g-14
Jan-
15Ju
n-15
Nov
-15
Apr-
16Se
p-16
Feb-
17Ju
l-17
Dec-
17M
ay-1
8O
ct-1
8M
ar-1
9Au
g-19
Jan-
20Ju
n-20
Figure 4.5: External Pressure Risk Index
Note: Index value ranges from 0 to 100; higher value indicates higher risk.
Source: Rhodium Group.
Wright, Gloudeman, and Rosen | 60
The range of the External Pressure Risk Index follows a fairly predictable pattern, rising sharply during the global financial crisis and then falling consistently until 2013. Throughout this period, China faced relatively large capital inflows and balance of payments surpluses, and there was little pressure on the RMB to depreciate. Capital outflows picked up starting in 2014, along with the dollar index, and the shock RMB depreciation in 2015–2016 saw capital outflows accelerate and external debt repaid, while U.S. interest rates also rose relative to China’s interest rates. The recent rise in the index is a byproduct of the U.S.-China trade conflict and the resurgence of capital outflows as the RMB has weakened since May 2018.
Almost all indicators in the External Pressure Risk Index start in January 2007, the earliest point in the sample. This includes data on interest rates, capital account flows, FX reserves-to-money supply, BIS interbank liabilities, and the second-derivative change in China’s export growth. All but the BIS series run to June 2020, while BIS data ends in December 2019. Baidu media searches related to U.S.-China tension start in January 2011 and end in June 2020.
CRISIS SCENARIOS AND CLOSEST HISTORICAL ANALOGYChina has often faced capital outflows for short periods of time, which have added to pressure on the domestic financial system. During the Asian financial crisis, even though China employed active capital controls, there were still outflows from the country and meaningful consequences for China’s exporters as well. The sudden depreciation of the currency in August 2015 fed significant capital outflows and ended up draining China’s official reserves by over $650 billion over the next 18 months, but this was partially the result of China’s own decisionmaking, even though the consequences were unintended. China has been vulnerable to tightening external funding conditions both in late 2011, when European banks withdrew their own wholesale funding to Chinese banks, and in June 2013, when China’s interbank market liquidity squeeze coincided with the so-called “taper tantrum” triggering outflows from emerging markets worldwide. More recently, the Covid-19 outbreak and the corresponding squeeze in dollar funding conditions caused a sudden surge in dollar costs and additional hedging needs for Chinese borrowers and trading firms.
But beyond these examples, the pressure that is currently building within political circles concerning Western foreign policy toward China, including the often-discussed U.S.-China “trade war,” may end up being the most important for medium-term financial flows. The consequences of the broader developed market pushback against China’s foreign policy and external economic engagement are still developing, but a harder turn toward decoupling initiatives could pressure not only investment and portfolio inflows into China but also trigger additional trade protectionism and resistance to economic engagement with China on multiple fronts. China has the capacity to manage and attempt to mitigate this external pressure through diplomacy, but the current trendlines suggest that China will face an external environment less conducive to domestic financial stability in the years ahead.
Openness/Capital Account LiberalizationIMPORTANCE FOR FINANCIAL STABILITYOpenness to financial market flows, via direct investment, portfolio securities, and banking activities, is perhaps the most obscure of the measures of vulnerability within the risk matrix. China exerts controls over cross-border financial flows and has the capacity to manage openness in the event of rising financial stress (usually by closing down channels for outflows). However, the more open that China’s financial markets and economy become to all types of participation from foreign actors, the more difficult it will be for Chinese authorities to actually control the outcomes of the decisions of

The China Economic Risk Matrix | 61
multiple market actors simultaneously. A commitment to greater openness and foreign participation within China’s economy and financial system necessarily involves surrendering a degree of control over that system. Beijing must maintain credibility that its financial system will continue opening even in the event of short-term destabilizing capital outflows because controls on those outflows would also discourage future inflows.
Therefore, the degree of openness should also be linked to the degree of vulnerability of China’s financial system. Openness of the capital account more closely links domestic financial pressures to foreign markets. Financial pressures within China’s property markets create enormous complications for policymakers in Beijing. But outside of the holders of the offshore bonds of these developers, there are few direct linkages between that financial stress and the global financial markets outside of China. A series of defaults by commodity importers, in contrast, would instantly be felt by banks and other firms internationally.
At the same time, China’s financial markets are not currently as open as those in Western economies, and there are still meaningful controls on transactions under the capital and financial account. These capital controls are widely credited with insulating China’s economy from the worst effects of the Asian financial crisis, and controls on outbound investment were tightened in late 2016 when outflows intensified. Capital controls are generally viewed in Beijing as effective against rapid, large-scale institutional outflows but are unlikely to be effective over the medium and long term. Most households and businesses can diversify savings into foreign assets by converting RMB into foreign currency, even if it takes them longer to do so.
Likewise, if China’s financial markets were far more open to foreign participation, a banking crisis in another country would probably result in that country’s banks within China curtailing credit and repatriating capital. Should foreigners hold more Chinese bonds in the future, then changes in their behavior driven by external factors could trigger changes in China’s domestic interest rates. From 2003 to 2011, Beijing was actually battling the adverse consequences of too many capital inflows and those inflows’ effects on credit creation and asset and goods price inflation, even though capital controls were still in place. The degree of openness amplifies the potential for financial instability, largely through increasing the possibilities of stress that are outside Beijing’s capacity to manage.
INDICATORS SELECTED AND EXPLANATIONCapital flows as a proportion of GDP: This is a simple measure of the degree of China’s openness to capital flows relative to the size of its economy calculated using the quarterly balance of payments data from the State Administration for Foreign Exchange. Despite the growing global importance of China’s economy, capital flows have been declining both in gross terms and relative to the size of China’s economy over the past four years, particularly since capital controls were tightened at the end of 2016.
Foreign bond holdings as a proportion of the total: This is a raw measurement of the degree of foreign holdings within China’s bond market, measuring the degree of openness to foreign investment and the extent to which these flows might reverse. It is calculated as the total level of foreign bond holdings compared to the total value of China’s bonds outstanding, including government, policy bank, and corporate bonds.
The IMF’s Annual Reports on Exchange Arrangements and Exchange Restrictions database: The International Monetary Fund produces an annual measure of all countries’ openness to capital flows, and these assessments can be coded every year to assess overall changes. Capital market

Wright, Gloudeman, and Rosen | 62
opening steps are coded as adding to potential pressures, while capital account restrictions are viewed as reducing vulnerability.
Qualitative assessment of openness: Because of the ambiguity of some of the variables involved, quantifying the degree of openness to financial flows remains difficult for any researcher. One comprehensive attempt to do this has been the Rhodium Group and Asia Society’s China Dashboard, which produces a comprehensive score of China’s reform progress in various sectors, including cross-border investment, which should be roughly comparable to an overall assessment of China’s openness as described above.
HISTORICAL RANGE OF OPENNESS RISK
The Openness Risk Index varies less than other measures of vulnerability within the risk matrix, which is logical, as China’s overall capital account liberalization has been incremental and piecemeal, without breakthrough changes over the past decade. In particular, capital flows have continued to decline as a proportion of GDP over time, in part because GDP has risen quickly over the past decade. There is a meaningful increase in openness risk starting in 2017, reflecting a marginal rise in foreign bond ownership in China as well as incremental liberalization steps to permit additional capital inflows via the Bond Connect program. Liberalization of foreign equity limits in several of China’s financial sectors has also seen the degree of openness expand in 2020.
IMF data on exchange arrangements starts at the earliest date in this study’s sample, January 2007. Cross-border investment flows to GDP start in January 2011. Two series—foreign share of bond holdings and the China Dashboard score of cross-border investment reform—start only in April 2017. All Openness Risk Index variables end in March 2020.
Jun-
20
0
10
20
30
40
50
60
70
80
Mar
-07
Sep-
07
Mar
-08
Sep-
08
Mar
-09
Sep-
09
Mar
-10
Sep-
10
Mar
-11
Sep-
11
Mar
-12
Sep-
12
Mar
-13
Sep-
13
Mar
-14
Sep-
14
Mar
-15
Sep-
15
Mar
-16
Sep-
16
Mar
-17
Sep-
17
Mar
-18
Sep-
18
Mar
-19
Sep-
19
Mar
-20
Figure 4.6: Openness Risk Index
Note: Index value ranges from 0 to 100; higher value indicates higher risk.
Source: Rhodium Group.

The China Economic Risk Matrix | 63
CRISIS SCENARIOS AND CLOSEST HISTORICAL ANALOGYThe potential for capital outflows weakening China’s currency defenses and inviting a speculative attack on the yuan remains one of the most significant fears among China’s technocrats after watching the experiences of other Asian economies during the late-1990s. But the closest scenario to an open capital account creating pressure for crisis in China’s economy is the August 2015 currency depreciation, where China’s policymakers were initially cautious in reimposing capital controls because of the upcoming inclusion of the RMB into the IMF’s Special Drawing Rights (SDR) basket, which required demonstrations of openness and of foreign investors’ capacity to freely use China’s currency in international markets.
It was only in late 2016 that China tightened capital controls in response to outflows, primarily targeting foreign direct investment and mergers and acquisitions offshore. China still carefully manages the volatility of its currency today, cautious about inviting additional speculation on the currency to depreciate, which could trigger capital outflows in a self-fulfilling cycle. The balance of payments pressures in 2016 finally ended when Beijing squeezed the offshore currency market, which reduced opportunities for speculation, and when the dollar started weakening, producing some short-term stability within China’s exchange rate, which then drove capital outflows to relent.
Consequently, there are few clear examples where greater openness to capital flows has driven financial stress within China, because capital controls have always operated in some form and because the degree of foreign participation within China’s financial markets has remained limited. Capital controls may persist, but absent a sustained political crisis between China and the West, foreign participation within China’s financial system is likely to continue rising. This rise in foreign participation will help China’s central bank to stabilize the currency but will also present new challenges for Beijing in managing the domestic financial system.
Applications of the Risk MatrixHaving outlined the risk matrix and its principal elements—both indicators of vulnerability and indicators of financial stress—this study now turns to applying the risk matrix to concrete examples. The next chapter examines historical cases of financial stress in China—the interbank market crisis of June 2013, the yuan depreciation and capital outflows of 2015–2016, and the Baoshang Bank default in 2019—and uses the risk matrix to evaluate why they did not fuel a broader financial crisis. Chapter 6 looks forward, assessing China’s current financial conditions following the Covid-19 outbreak and examining several future scenarios for financial stress in light of the findings from the risk matrix.

Wright, Gloudeman, and Rosen | 64
Chapter 5: The Risk Matrix and Past Episodes of Financial Stress
The framework of the risk matrix can highlight episodes of financial stress in China’s recent history, which can help to explain why none have produced a broader financial crisis. For the creation of our China-specific financial stress indicator (FSI), the models used to measure financial stress were trained principally on three events, representing the most significant moments of systemic stress in China over the past 20 years. Those events are the interbank market crisis of June 2013, the balance of payments pressures caused by China’s sudden currency depreciation in 2015 and 2016, and the deleveraging campaign of 2017–2018, the effects of which are still developing following the failure of Baoshang Bank in May 2019. It can be reasonably argued, of course, that the effects of the Covid-19 outbreak will dwarf all of these previous episodes of stress, given the severity of the resulting hit on China’s economy. The outbreak has sparked the first outright economic contraction since the reform and opening period began in 1978. The potential impact of Covid-19 on China’s financial stability will be discussed extensively in the next chapter, including an evaluation of the indicators of stress and vulnerability via the risk matrix.
The rest of this chapter will detail the findings of the risk matrix for each of these three past episodes of financial stress and will explain why the threats were severe but did not create broader contagion or why Beijing was capable of managing the fallout using its policy tools. In discussing China’s deleveraging campaign, the analysis in this chapter will focus on both the initial measures to tighten controls over shadow banking activity and the consequences of that effort: Baoshang Bank’s default and takeover. Then the chapter will conclude with a combined analysis of these incidents and what they suggest about the potential for more fundamental systemic threats.
The Interbank Market Crisis of June 2013The events of the summer of 2013 were the closest that China’s financial system has come to a 2008-style “Lehman moment,” or a sudden re-evaluation of market-wide perceptions of systemic stability. The episode resulted from a policy experiment by the PBOC that exposed the fragility of China’s financial system. The central bank attempted to restrict the banking system from using wealth management products (WMPs) as liabilities and prevent banks from redirecting those funds toward third-party asset managers and shadow banks, who then engaged in riskier lending. The PBOC’s lack of visibility into the banking system’s reliance on WMPs and shadow assets was the ultimate problem that resulted in an acute squeeze in interbank market liquidity in late June 2013. Pressuring

The China Economic Risk Matrix | 65
the system thus had a much larger impact than the central bank had expected because the informal banking system had become larger than the PBOC anticipated. The net result was a shock that resulted in all lenders suddenly vanishing from the interbank market, forcing the central bank to quickly reverse itself and provide emergency short-term funding to prevent a systemic crisis.
June is always a difficult month for China’s interbank market. Liquidity is usually tight because banks need to dress up their financial statements at the end of the quarter. In addition, many companies need to sell yuan and buy dollars to pay overseas dividends, which drives a temporary capital outflow from the banking system during the month. Complicating domestic funding conditions, the Federal Reserve was openly contemplating paring back its level of balance sheet expansion during the summer of 2013, and this caused a rise in the dollar globally and a capital outflow from emerging markets, an episode labeled as the “taper tantrum.”47 All of these conditions made China’s interbank market more vulnerable to potential shocks.
The surprise for the market struck on June 6, 2013, with a sudden default on an interbank payment between Industrial Bank and Everbright Bank.48 The amount was not large, at 6 billion yuan, and interbank payments had faced technical defaults in the past, but because of the backdrop of tighter liquidity conditions, overnight money market rates shot up immediately. And in contrast to previous instances in which the PBOC would quickly intervene in order to calm market tensions, the central bank instead maintained a persistently hostile stance and even reportedly warned banks in a meeting on June 17 that they needed to clean up the imbalances between their shadow assets and shadow liabilities: more short-term funding would not be forthcoming. Banks reacted quickly to the prospect of an unfriendly PBOC unwilling to help even in the face of rapidly deteriorating market conditions. Lenders started to hoard cash, driving short-term money market rates even higher. This accelerated pressure on WMPs as well: investors redeemed more of the products, which meant that banks needed even more cash to meet those redemptions. When interbank rates rose above the rates offered by WMPs, it became logical for WMP investors to redeem their products and seek higher returns in the interbank market itself or other financial markets that were suddenly starved of funding. (There is a lengthy discussion of the interbank market crisis available in Chapter 2 of Credit and Credibility.)
The crisis reached a crescendo from June 20 to 25. On June 20, overnight interbank market rates skyrocketed to somewhere between 20 and 30 percent. Given the paucity of actual bids at these rates, this effectively meant that there was no liquidity in the market at any price. Banks were all struggling to obtain cash to meet demand for redemptions, and there were no lenders in the market. Even after the PBOC staunched that bleeding through a quiet policy reversal by providing short-term funding late in the trading day, the sell-off then shifted from money markets to the equity market. Investors needing cash were trying to sell virtually anything liquid. After a 10 percent drop in the stock market in just over 36 hours, the PBOC was forced to call off their experiment and reverse course. The market had just learned that there were clear limits to any PBOC threats of austerity.
47. For a review of the “taper tantrum” period, see Ratna Sahay et al., “Emerging Market Volatility: Lessons from the Taper Tan-trum,” International Monetary Fund, Staff Discussion Note 14/09, September 2014, https://www.imf.org/external/pubs/ft/sdn/2014/sdn1409.pdf.
48. David Keohane, “Swimming Naked in China,” Financial Times, June 10, 2013, https://ftalphaville.ft.com/2013/06/10/1529962/swimming-naked-in-china/.

Wright, Gloudeman, and Rosen | 66
THE VIEW FROM THE RISK MATRIXThe risk matrix shows that only a few of the indicators of vulnerability were flashing warning signs in the summer of 2013, even as the event marked the high-water mark for the financial stress indicator. The dollar was rising slightly and capital outflows were intensifying, which is one reason that China’s interbank market was susceptible to a sudden shock when the PBOC delivered one. But the property market was generally recovering at that time, and there was no obvious evidence of stress within China’s credit markets, nor a rise in non-performing loans. And China’s financial system was not seeing the same volumes of capital outflows relative to the following three years, as the interbank market crisis took place before pledges to liberalize the capital account had started to become more important to China’s policymakers. Wholesale funding by
banks was rising at the time and was one of the reasons that the PBOC thought that they needed to act to reduce banks’ reliance upon unstable financing channels. Immediately after the crisis, wholesale funding started to decline as banks became more cautious in lending to one another, which could have exacerbated vulnerabilities. There was a limited rerun of the crisis in December 2013, when short-term rates spiked once again, only to see the PBOC react faster to calm the tension.
The net result might have been different had a sudden tightening of short-term interbank rates occurred at the same time as a broader downturn in the property market or a non-performing asset problem within the banking system. A rise in short-term funding rates remains a key indicator of the severity of liquidity pressure and concern between banks about lending to one another. If funding rates between banks are elevated, they will need to pass on those funding costs to borrowers in the form of higher lending rates. In the event this were paired with a broader non-performing asset problem, the liquidity concerns present in June 2013 might have spilled over into counterparty solvency risks, as occurred after the failure of Baoshang Bank in May 2019. Such a spillover could have resulted in a far greater fragmentation of funding conditions across the banking system, with even creditworthy banks and firms needing to pay higher interest rates or finding themselves suddenly cut off from financing. These are the conditions that usually produce more dramatic sell-offs in financial asset markets, and they would require a more concerted response from Beijing than a simple commitment from the PBOC to provide additional short-term funding.
Currency Depreciation and Capital Outflows in 2015–2016China’s stock market boom and bust from late 2014 to 2015 was one of the most important stories in financial markets that year. Beijing’s failed bailout attempt of the equity market was also seen as indicative of the broader problems that China’s authorities faced in regulating financial markets
0
20
40
60
80Openness
Banks
Property
Debt and Credit
External Pressure
FSI
Jun-13 Jul-13
Figure 5.1: Snapshot of the Risk Matrix During China’s 2013 Interbank Crisis
Source: Rhodium Group.
The China Economic Risk Matrix | 67
effectively. Rules for trading were quickly changed to arrest the market slide, including reports that brokerages were rejecting large sell orders, and there were clear signs investors had lost confidence in the regulatory and legal environment for trading.49 Bailouts for equity investors were arranged via previously unused government entities, including the China Securities Finance Corporation (CSFC).50 Years after a similar bubble in 2006 and 2007, China’s stock market still appeared to be driven by speculative behavior, with little presence of foreign or domestic institutional investors or fundamental investors. The stock market boom and bust captured the majority of the international media attention on China, largely because it was viewed as a window into China’s financial system that was easily explicable to international audiences.
But the larger threat to China’s financial stability in 2015 occurred after the stock market sell-off had ended, sparked by a sudden depreciation of China’s exchange rate on the morning of August 11. That day, the currency’s daily fixing price (yuan per dollar) was adjusted to reduce the yuan’s value relative to the dollar by 1.9 percent. Immediately, markets anticipated a larger depreciation and started to sell the Chinese currency. While the PBOC may have been attempting to implement a technical reform of its exchange rate regime to bring the actual spot rate of the currency more closely in line with the daily fixing rate (a move helpful for IMF approval of the yuan’s inclusion in the Special Drawing Rights (SDR) currency basket later that year), the market reaction was framed by the recent experience of the stock market’s boom and bust. It was a common view within financial markets at that time that China’s authorities were initiating a policy-led depreciation of the currency, even if they were attempting to frame the action as a technical step toward reform.
Over the following two days, China’s authorities did little to clarify the situation, and when the exchange rate’s daily fixing was set even weaker on the morning of August 12 (with the value of the yuan a full 3.5 percent lower than the August 10 fixing), the currency had swung dramatically, all the way from its closing price on August 10 of 6.21 per dollar to a level above 6.40 per dollar in the afternoon of August 12.51 These were significant and unprecedented moves in the context of China’s heavily managed exchange rate regime. Other Asian and emerging market currencies similarly started to depreciate against the dollar, in expectation that they would need to compete with suddenly cheaper Chinese exports in global markets.52 Fears of another Asian financial crisis quickly spread. The PBOC hastily called a press conference for the morning of August 13 to try to reassure market participants.53 However, little clarification of the future policy direction was offered, even as the central bank attempted to calm the market by maintaining the currency’s daily fixings at stable rates in the following days.
The result of this sudden creation of new currency risk for the yuan was a flood of risk aversion resulting in sales of China’s domestic currency and the purchase of foreign assets, producing a
49. Patrick Chovanec, “China Destroyed Its Stock Market in Order to Save It,” Foreign Policy, July 15, 2015, https://foreignpolicy.com/2015/07/16/china-destroyed-its-stock-market-in-order-to-save-it/.
50. Pete Sweeney, “Beijing’s stock rescue has $800 billion bark, small market bite,” Reuters, July 23, 2015, https://www.reu-ters.com/article/china-markets-rescue/update-1-beijings-stock-rescue-has-800-billion-bark-small-market-bite-idUSL-3N1032IU20150723.
51. Historical data provided by Bloomberg terminal.
52. “China Rattles Markets With Yuan Devaluation,” Bloomberg, August 11, 2015, https://www.bloomberg.com/news/arti-cles/2015-08-11/china-weakens-yuan-reference-rate-by-record-1-9-amid-slowdown.
53. Jamil Anderlini, “China defends new currency regime,” Financial Times, August 13, 2015, https://www.ft.com/content/d42526ee-418c-11e5-b98b-87c7270955cf.

Wright, Gloudeman, and Rosen | 68
significant capital outflow. Chinese corporates who had borrowed in dollars for regular operating or trading purposes needed to hedge their risks in borrowing a suddenly more expensive currency, and consequently they bought dollars while attempting to actively reduce their foreign currency debts. Speculators added to bets against the Chinese currency, borrowing in offshore yuan (CNH, distinct from onshore CNY) and buying dollars or other foreign currencies. As the offshore currency weakened below the value of the yuan onshore, this created further incentives to buy dollars and sell yuan onshore and then sell dollars and buy yuan back offshore, to earn a quick arbitrage profit. This added to the capital outflows facing China.
Quickly, the volume of dollar purchases in the onshore market had overwhelmed the central bank’s ready stores of liquid foreign currency. As of the end of July 2015, before the sudden depreciation, the PBOC held $3.65 trillion in foreign exchange reserves, but most of those were invested in foreign asset markets since the regular need for intervention in the domestic foreign exchange market was small.54 Suddenly, the PBOC’s available cash for intervention was running dry quickly, and balance of payments data suggests that the central bank effectively converted around $88 billion in foreign exchange reserves into commercial banks’ own holdings of dollars, providing dollars to the market quickly (although the transaction has not been confirmed). This action prevented commercial banks’ dollar demand from forcing the PBOC to sell its foreign bonds and equities more aggressively.55 Temporary controls on certain speculative transactions were introduced in September 2015 in an attempt to reduce the cross-border arbitrage flows.56 In total, the capital and financial account outflow in the last six months of 2015 reached an estimated $428 billion, a significant shift from the previous 12 years, when China had been accumulating foreign exchange reserves.57
The PBOC’s sudden depreciation of the currency had unleashed a rapid wave of capital outflows, precisely because the currency’s direction was viewed by investors as policy-driven rather than market-determined. When the credibility of the PBOC’s commitment to yuan stability was questioned, markets needed to reprice all assets denominated in the domestic currency in order to manage their risks. The currency risk produced by the August move itself was manageable, but the market viewed the sudden shift within the context of the equity market’s recent meltdown, and Beijing’s struggle to contain the damage. It appeared that a troubled Chinese economy had forced policymakers to take the desperate step of weakening the exchange rate to support China’s exporters.58 Throughout this period, the dollar had been appreciating globally because the Federal Reserve was expected to raise interest rates later in the year. Consequently, China’s currency was increasingly viewed by investors as a one-way bet, with nowhere to go but down.
54. Data sourced from “Gold and Foreign Exchange Reserves,” People’s Bank of China, http://www.pbc.gov.cn/diaochatongjisi/resource/cms/2016/01/2016010716554214736.htm.
55. This still unknown transaction is revealed within balance of payments data from the State Administration of Foreign Ex-change, which shows an $87.8 billion rise in the category of “Non-reserve: Other Investment: Asset: Other Receivable.” This likely reflects a transfer of foreign exchange from SAFE to commercial banks in some form.
56. These were controls on forward transactions involving required reserves for certain FX deposit balances. The IMF’s Annual Report on Exchange Arrangements and Exchange Restrictions database labeled them as “The PBC imposed a 20% unre-munerated deposit requirement on resident banks’ foreign exchange sales in currency forwards, currency derivatives, and currency swaps. The deposits must be place with the People’s Bank of China for one year.”
57. Estimates based on the non-reserve capital and financial account deficit provided by balance of payments data from the State Administration of Foreign Exchange while also adding outflows under “errors and omissions”, which are usually highly correlated with the direction of the currency and the overall activity of speculative capital flows.
58. See, for example, Paul Krugman, “Bungling Beijing’s Stock Markets,” New York Times, August 14, 2015, https://www.nytimes.com/2015/08/14/opinion/paul-krugman-bungling-beijings-stock-marketshtml.html.

The China Economic Risk Matrix | 69
Capital outflows of this magnitude can strain any domestic financial system, and China’s was no different. In order to offset domestic liquidity pressure resulting from a sudden dearth of domestic currency deposits, the central bank was forced to cut banks’ reserve requirements on August 24, freeing up additional funding.59 Should the outflows have continued for a longer period of time, rising short-term funding rates would have produced higher corporate borrowing rates as well, potentially forcing more firms to default on bonds and loans. Moreover, capital outflows can be self-fulfilling, particularly if they create market fears that the central bank is no longer capable of defending its currency. A significantly weaker currency would also be fundamentally deflationary, by reducing the global prices that China would be able to pay for its imports, which include major commodities. As a result, there was a considerable threat to China’s financial stability if balance of payments pressures required the central bank to raise domestic interest rates to prevent further outflows. As a highly indebted and investment-driven economy, rising short-term and long-term borrowing costs in China would quickly cause a sharp slowdown in economic growth.
China’s international payments problems then entered a second phase. In November 2015, the IMF went forward with its plan to include China’s currency in the SDR currency basket, which was a considerable stamp of legitimacy for the RMB in light of the volatility in China’s financial markets and the sudden change of the regulatory and legal environment. The first days of January 2016 caused the credibility of Chinese regulators to face even more new questions, as a controversial “circuit breaker” system to prevent dramatic swings in China’s equity markets quickly faltered, producing temporary trading suspensions and another sharp sell-off in China’s currency as well.60 Speculation about a larger currency adjustment persisted in markets, producing additional dollar sales.
In order to reduce that speculative pressure, the central bank took the controversial step of reducing liquidity in the offshore RMB or CNH market by instructing state-owned commercial banks not to lend out the currency for short-term purposes in the same volumes as in the past.61 This was temporarily successful in increasing the costs of speculative bets against the currency but was also contrary to the PBOC’s medium-term goal of promoting RMB internationalization. In order to protect domestic markets, the central bank had to deprive the offshore RMB pool of funding. In late December 2015, the central bank also unveiled a new pricing mechanism for the currency, claiming that it would move based on the prices of a trade-weighted basket of currencies rather than solely against the dollar.62
However, the system did not really go into effect until the days following the Chinese New Year holiday in February 2016. The balance of payments pressures did not really end for China until early 2017, but the most acute phase had stopped by late February 2016, when officials from the Federal Reserve indicated that concerns about international conditions (China’s slowdown among them) would create more caution before interest rates would be raised.63 In combination with the new
59. Samuel Shen and Koh Gui Qing, “China cuts rates, reserve ratio after stocks plummet again,” Reuters, August 25, 2015, https://www.reuters.com/article/china-markets/china-cuts-rates-reserve-ratio-after-stocks-plummet-again-idINKCN-0QU0BB20150825.
60. Bradley Hope and Dan Strumpf, “The Problem With Circuit Breakers,” Wall Street Journal, January 7, 2016, https://www.wsj.com/articles/the-problem-with-circuit-breakers-1452205576.
61. Gabriel Wildau, “China targets offshore renminbi short selling with new reserve ratio,” Financial Times, January 17, 2016, https://www.ft.com/content/eb9f5eda-bd91-11e5-a8c6-deeeb63d6d4b.
62. Sonali Das, “China’s Evolving Exchange Rate Regime,” International Monetary Fund, Working Paper, No. 19-50, March 2019, https://www.imf.org/en/Publications/WP/Issues/2019/03/07/Chinas-Evolving-Exchange-Rate-Regime-46649.
63. See, for example, coverage of then Federal Reserve Chair Janet Yellen’s congressional testimony in Patrick Gillespie, “Janet
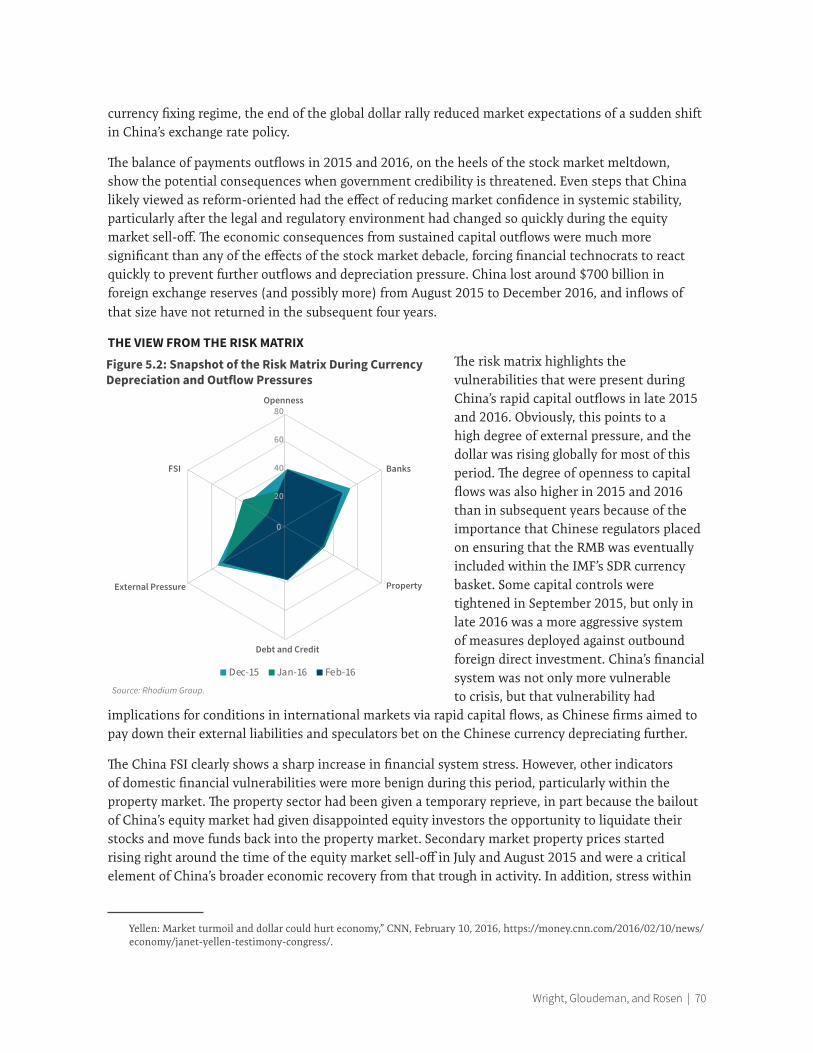
Wright, Gloudeman, and Rosen | 70
currency fixing regime, the end of the global dollar rally reduced market expectations of a sudden shift in China’s exchange rate policy.
The balance of payments outflows in 2015 and 2016, on the heels of the stock market meltdown, show the potential consequences when government credibility is threatened. Even steps that China likely viewed as reform-oriented had the effect of reducing market confidence in systemic stability, particularly after the legal and regulatory environment had changed so quickly during the equity market sell-off. The economic consequences from sustained capital outflows were much more significant than any of the effects of the stock market debacle, forcing financial technocrats to react quickly to prevent further outflows and depreciation pressure. China lost around $700 billion in foreign exchange reserves (and possibly more) from August 2015 to December 2016, and inflows of that size have not returned in the subsequent four years.
THE VIEW FROM THE RISK MATRIXThe risk matrix highlights the vulnerabilities that were present during China’s rapid capital outflows in late 2015 and 2016. Obviously, this points to a high degree of external pressure, and the dollar was rising globally for most of this period. The degree of openness to capital flows was also higher in 2015 and 2016 than in subsequent years because of the importance that Chinese regulators placed on ensuring that the RMB was eventually included within the IMF’s SDR currency basket. Some capital controls were tightened in September 2015, but only in late 2016 was a more aggressive system of measures deployed against outbound foreign direct investment. China’s financial system was not only more vulnerable to crisis, but that vulnerability had
implications for conditions in international markets via rapid capital flows, as Chinese firms aimed to pay down their external liabilities and speculators bet on the Chinese currency depreciating further.
The China FSI clearly shows a sharp increase in financial system stress. However, other indicators of domestic financial vulnerabilities were more benign during this period, particularly within the property market. The property sector had been given a temporary reprieve, in part because the bailout of China’s equity market had given disappointed equity investors the opportunity to liquidate their stocks and move funds back into the property market. Secondary market property prices started rising right around the time of the equity market sell-off in July and August 2015 and were a critical element of China’s broader economic recovery from that trough in activity. In addition, stress within
Yellen: Market turmoil and dollar could hurt economy,” CNN, February 10, 2016, https://money.cnn.com/2016/02/10/news/economy/janet-yellen-testimony-congress/.
Openness
Banks
Property
Debt and Credit
External Pressure
FSI
Dec-15 Jan-16 Feb-16
Figure 5.2: Snapshot of the Risk Matrix During Currency Depreciation and Outflow Pressures
Source: Rhodium Group.
0
20
40
60
80
The China Economic Risk Matrix | 71
the banking sector was only moderate during this period, in part because short-term interest rates had fallen precipitously in early 2015 in order to facilitate issuance of large volumes of local government bonds at low yields. Lower short-term interest rates reduced immediate funding stress for banks but also facilitated the rise of shadow banking channels that fed speculation in the equity market, commodity futures, and corporate bonds in 2016. The rise in speculative activity and shadow banking kept economy-wide credit growth at high levels and prevented balance of payments pressures from producing more acute financial stress. But the speculative excess also forced China’s financial authorities to embark upon a more aggressive deleveraging campaign to reduce financial risks later that year.
Deleveraging, the Default of Baoshang Bank, and Counterparty RiskThe speculative excess within China’s banking sector drove authorities to embark upon a far more aggressive campaign to reduce systemic risks within China’s financial system. Until 2012, China’s banking system had been highly inefficient but generally stable. The key source of funding was stable deposits, and loans were made to state-owned enterprises. Trade surpluses and capital flows pushed liquidity into China’s banking system, and capital outflows were not very large. But by 2016, wealth management products (WMPs), rather than deposits, had become the marginal source of funding growth for China’s banks. Significant volumes of new funds were being channeled into shadow banking products and other unregulated forms of finance. Structures in China started to resemble the off-balance-sheet vehicles that had contributed to the financial crisis in the United States, and Chinese authorities became alarmed about the risks growing within the financial system.
The “deleveraging” campaign in response to these risks took place in several phases, as was discussed in greater detail in Chapter 1. First, there was an attempt to tighten monetary conditions gradually by guiding short-term interest rates higher without sudden shocks that might trigger a repeat of the June 2013 interbank market crisis. Guiding short-term rates higher, and making these funding rates slightly more volatile, helped to reduce the attractiveness of leveraged speculative investments by shadow banking institutions. Second, authorities implemented regulatory tightening measures by restricting banks’ capacity to use WMPs as a funding channel and by requiring banks to move some of their off-balance-sheet assets back onto their formal loan books over a period of three years (which has now been extended to four under the pressure of the Covid-19 outbreak). These steps were powerful but blunt measures targeting the informal banking system and ended up producing a sharp slowdown in credit growth. Total bank asset growth slowed from 15.7 percent in 2016 to only 8.4 percent in 2017 and 6.8 percent in 2018. Because the shadow banking sector had been larger than regulators could know, the deleveraging campaign produced a sharp slowdown in credit growth and economic activity.
The deleveraging campaign and the much slower wholesale funding and credit growth it produced was the background to the still-unfolding story of China’s first bank default and formal bankruptcy in this century. China’s financial pressures finally hit the domestic banking sector in May 2019, with the sudden default and takeover of Baoshang Bank, the largest bank in Inner Mongolia. The collapse of the bank was unexpected and fraught with political intrigue as well because its largest shareholder was the Tomorrow Group, a conglomerate controlled by Xiao Jianhua, who had been arrested in Hong Kong in early 2017 and reportedly carried over the mainland border—he has not been seen in public since that

Wright, Gloudeman, and Rosen | 72
time.64 But Baoshang was also a highly risky financial institution heavily dependent upon interbank or wholesale funding. It was also known within the interbank market as an important lender to non-bank financial institutions. When traders at these riskier third-party asset managers would find themselves short of funding at the end of a trading day, they were often instructed by their colleagues to ask traders working at Baoshang for the money.
On May 24, 2019, a Friday evening after markets had closed, it was suddenly announced that Baoshang Bank would be taken over by China Construction Bank and would eventually be restructured. The fate of depositors in Baoshang under this restructuring was unknown at first, but media reports began to leak that corporate and interbank depositors in Baoshang would actually face haircuts on their claims on the bank.65 This was a significant step, as it marked the first time that creditors to a bank would face actual credit risk. Previously, all banks were presumed to be basically guaranteed by the state, so even a claim on a risky bank was presumed to face no default risk. During the interbank market crisis in June 2013, the PBOC’s actions had created a new form of counterparty liquidity risk: because of the PBOC’s actions, banks could not be certain that their trading counterparties had enough cash on hand to trade today or tomorrow, even if their eventual survival was not seen at risk. Now, traders had to grapple with counterparty solvency risk and the prospect that their counterparties may no longer be able to pay them back at any point in the future because the risks they had already taken would force them into bankruptcy or default.
The most significant implication of the Baoshang default was the abrupt change in government credibility. As the credibility of government guarantees on the solvency of banks was now being questioned, market participants could only guess at the reason any bank might be targeted by regulators in the future. A bank was now considered riskier if it engaged in lending to certain non-bank financial institutions or perhaps if it had problematic shareholders who might run afoul of the current political climate in Beijing. The net result of this fear was that banks significantly reduced their lists of acceptable trading counterparties in order to minimize their own credit risks. Often the reasons were trivial—banks that had not yet released annual reports were removed from counterparty lists (fearing undisclosed losses), as were banks that were thought to have traded actively with Baoshang in the past. In addition, markets started distinguishing banks’ creditworthiness based on the identity of their primary shareholders: other banks partially owned by the Tomorrow Group or other companies that had been targets of corruption investigations were suddenly viewed more skeptically, regardless of their underlying performance.
The net result of this rise in counterparty solvency risk was that several banks were suddenly unable to attract funding from the interbank market using their primary funding instrument: negotiable certificates of deposit (NCDs). These certificates of deposit were typically issued for short periods, three or six months, but no underlying collateral was provided. They were popular for China’s banks as a funding instrument because banks could find investors throughout the interbank market if prices were attractive. For WMPs, in contrast, banks could only sell them to their existing customer bases or using their branch networks, which were limited for smaller banks. Most of the issuers of
64. Michael Forsythe, “Billionaire Is Reported Seized From Hong Kong Hotel and Taken Into China,” New York Times, January 31, 2017, https://www.nytimes.com/2017/01/31/world/asia/xiao-jianhua-china-hong-kong-billionaire.html.
65. “In China’s Baoshang debt repayment, haircuts of 30% possible: sources,” Reuters, May 28, 2019, https://www.reuters.com/article/us-china-banks-baoshang-bank-debt-idUSKCN1SZ0IE.

The China Economic Risk Matrix | 73
NCDs were therefore city commercial banks or joint stock banks, and most of the buyers of NCDs were larger state-owned banks looking for higher returns than they could find via short-term repo lending. Therefore, the yield that smaller and riskier banks needed to offer on their NCDs to larger banks was effectively a measure of their underlying creditworthiness. Higher-risk banks needed to sell NCDs at higher yields than lower-risk banks. Similarly, smaller banks sometimes struggled to sell all of the NCDs they offered to the marketplace, so the sell-through rate could also be viewed as a measure of creditworthiness.
Immediately after the failure of Baoshang Bank, many smaller banks found themselves unable to sell NCDs in the market at attractive prices. NCD yields on riskier banks rose quickly, and the sell-through rates on NCDs sold by smaller banks or banks with lower credit ratings fell very sharply. The interbank market had effectively designated several city commercial banks or joint stock banks as risky, particularly those that had relied heavily upon NCDs for funding in the past. Significant proportions of the interbank funding markets were drying up. Consequently, smaller banks suddenly found themselves lacking a key funding channel. They needed to either replace the funding from somewhere else, perhaps from the central bank itself, or just accept weaker asset and credit growth in the future. Most banks that were affected by the resulting squeeze ended up using a combination of both adjustments, and asset growth among smaller banks has slowed since Baoshang’s default.
The PBOC was not entirely prepared for the fallout from regulators’ sudden decision to take over Baoshang. The process through which Baoshang defaulted and was taken over by authorities should be understood as two entirely separate decisions from China’s financial technocrats. The first decision was
Figure 5.3: Daily Sell-through Rates of Interbank NCDs by Bank Credit Rating, May 1–July 24, 2019 (percent, 5-day moving average)
0%
10%
20%
30%
40%
50%
60%
70%
80%
90%
100%
5-M
ay
12-M
ay
19-M
ay
26-M
ay
2-Ju
n
9-Ju
n
16-J
un
23-J
un
30-J
un
7-Ju
l
14-J
ul
21-J
ul
28-J
ul
AAA AA+ AA AA-Source: Eastmoney, RHG Calculations.
First day of trading post-Baoshang

Wright, Gloudeman, and Rosen | 74
to stop the operations of Baoshang Bank and to place it under the control of China Construction Bank, a decision that was supposedly necessary because there was no larger bank in Inner Mongolia that could assume the assets of Baoshang on its balance sheet immediately. Baoshang had reportedly been borrowing extensively in the NCD market during the same week it defaulted, and the takeover may have been designed to staunch the bleeding and the continued accumulation of new credit risks. The second decision by Chinese authorities was to impose haircuts on interbank and corporate depositors, which effectively changed the market’s perceptions of implicit guarantees for banks. This second decision touched off the rapid switch to reducing counterparty lists in China’s interbank market. The decision to impose haircuts was not inevitable—Japanese regulators never did so throughout the country’s banking crisis in the 1990s—but seemed to be designed to gauge the market’s reaction to the sudden introduction of new credit risk within banks themselves.
The results were easy for the PBOC to see but more difficult to manage. During the following weeks, the Bank of Jinzhou quickly found itself unable to sell NCDs. The Bank of Jinzhou was generally considered among the riskiest of China’s publicly traded and listed banks on the Hong Kong stock exchange, given its rapid rate of asset growth since 2012 and its reliance upon interbank funding.66 The bank had recently been in a public dispute with its auditors, reportedly related to the accounting of some non-performing assets. The bank was already in the market spotlight, while shares had been suspended from trading since April 2019, after the bank did not publish its financial reports on time.67 Quickly, the PBOC was forced to issue “credit risk mitigation warrants” for the Bank of Jinzhou’s NCDs as a stopgap measure, before regulators effectively negotiated a restructuring of the entire institution in late July and a winddown of its riskier lending portfolio.68 Haircuts were not imposed on the interbank or corporate depositors in the Bank of Jinzhou (at least as of this writing).
After a week of watching the resulting market turmoil in China’s interbank market, Chinese authorities started leaking different messages about the cause of Baoshang’s problems through the domestic press. The linkages between Baoshang and its primary shareholder were highlighted to explain that the restructuring was unlikely to be repeated in the future, with the implication being that they were linked to the political complications of this particular bank.69 The problem for the PBOC was that this message was not particularly reassuring. The fact that haircuts had been imposed, even if they were imposed for political reasons, meant that banks needed to remain vigilant about similar risks in the future, including both financial and political factors. Even if Baoshang’s takeover was politically charged, the PBOC and CBIRC had already indicated their reservations about the growth of interbank funding channels as a source of banks’ liabilities, imposing regulatory ceilings on the level of interbank funding overall. Even if market participants expected that troubled institutions would eventually be bailed out, investors became concerned that a large number of bank failures would be too much for
66. “Bank of Jinzhou says in talks with possible investors, renewing contagion worry,” Reuters, July 26, 2019, https://www.reuters.com/article/us-china-economy-bank-of-jinzhou/china-bank-of-jinzhou-says-in-talks-with-possible-investors-re-newing-contagion-worry-idUSKCN1UK106.
67. “Bank of Jinzhou Auditors Resign Citing Loan Inconsistencies,” Bloomberg, June 2, 2019, https://www.bloomberg.com/news/articles/2019-06-03/bank-of-jinzhou-auditors-find-inconsistencies-in-loan-documents-jwfpuhkm.
68. Wu Hongyuran and Teng Jing Xuan, “Exclusive: Who Will Save Troubled Bank of Jinzhou?,” Caixin Global, July 26, 2019, https://www.caixinglobal.com/2019-07-26/exclusive-who-will-save-troubled-bank-of-jinzhou-101444077.html.
69. “China says small bank risks manageable after takeover of troubled Baoshang,” Reuters, June 8, 2019, https://www.reuters.com/article/us-china-banks-regulator-baoshang/china-says-small-bank-risks-manageable-after-takeover-of-troubled-baoshang-idUSKCN1TA03A.

The China Economic Risk Matrix | 75
regulators to handle. If a counterparty bank fell to the end of a long line of defaulted institutions in need of restructuring, a delayed policy response or bailout would still produce financial losses for the lender. Thus, it made more sense for banks to protect themselves by restricting lending to potentially troubled institutions.
The impact of Baoshang’s default is still ongoing, and the bank formally started bankruptcy proceedings in August 2020. In addition to the Bank of Jinzhou, Hengfeng Bank—a large regional lender in Shandong province—and the Bank of Harbin in northeastern China were also restructured in 2019. In April 2020, the Bank of Gansu in China’s northwest suddenly faced a bank run and was restructured under the control of different provincial shareholders.70 Media reports of multiple bank runs at smaller city and rural commercial banks have proliferated in the summer of 2020, with several institutions potentially facing liquidity pressure from rising non-performing loan rates following the economic consequences of the Covid-19 outbreak.
However, the stress produced by Baoshang’s takeover has not been as acute in 2020 as in the weeks immediately following the default in May 2019. The impact on banks’ funding conditions has been more gradual but still significant. Smaller city commercial banks are still struggling to sell NCDs to the market, and some have stopped trying altogether. This has left these banks more vulnerable to a sudden squeeze in financing or a sharp rise in non-performing loans.
70. Hong Liang and Timmy Shen, “Bank of Gansu Moves a Step Closer to State Bailout,” Caixin, April 21, 2020, https://www.caixinglobal.com/2020-04-21/bank-of-gansu-moves-a-step-closer-to-state-bailout-101545400.html.
-200 -150 -100 -50 0 50 100
Guangdong Nanyue BankBank of Yingkou
Bank of JilinBaoshang Bank
Fudian BankBank of FuxinChengdu RCB
Harbin BankBank of Guizhou
Bank of ChengduBank of NanjingChongqing RCBIndustrial Bank
Bank of HangzhouBank of Tianjin
China Everbright BankHengfeng Bank
China Zheshang BankChina Merchants Bank
Shengjing Bank
Q2 2019 Q3 2019 Q4 2019 Q1 2020 Q2 2020
Figure 5.4: Top 20 Banks Facing NCD Contractions by Quarter, Post-Baoshang
Billion yuan
Source: Eastmoney, RHG Calculations.

Wright, Gloudeman, and Rosen | 76
At some point during a banking crisis, the incentives for government institutions responding to the crisis will usually change. When the banking system is generally assumed to be stable, it is logical to portray any solvency problems at banks as isolated phenomena and to bail out or provide resources to the troubled institutions. This is how the PBOC first started to portray the problem within China’s banking system in June and July 2019. Even a few bank failures can be generally overlooked, as the particulars of each default are always different and can be attributed to specific factors that are unlikely to be repeated, such as the political complications with Baoshang’s shareholders. But after bank defaults accumulate in larger numbers, it becomes more apparent to market participants that a larger problem is afoot throughout the entire banking system. As a result, government authorities may change their approach and try to reduce their own obligations to troubled banks and shift toward requiring depositors, shareholders, or bondholders to make good on the banks’ losses. This is generally described as a transition from bailouts to bail-ins. China’s leadership may not choose to impose more haircuts on depositors or shareholders in troubled banks, but should they do so, the likely result will be slower credit growth in the economy overall as banks see interbank funding conditions tighten further. With more reports of stress within non-bank financial institutions and bank runs at city commercial banks now accumulating, the consequences of Baoshang Bank’s default are still unfolding.
THE VIEW FROM THE RISK MATRIXThe risk matrix highlights how the stress from the deleveraging campaign and the Baoshang event in 2019 was generally limited to the banking system itself. Importantly, debt and credit risks had been rising throughout the financial system as China’s credit growth continued to outpace economic growth, and the deleveraging campaign forced banks to finally recognize additional assets previously held off balance sheet as non-performing. The introduction of counterparty risk, however, did not trigger an acute rise in observable financial stress in the form of higher short-term money market rates. They rose briefly, but not aggressively, following Baoshang’s default, and the PBOC countered the stress with short-term injections of liquidity. The primary implication of Baoshang’s failure was that banks
themselves were considered less creditworthy. Trading via repo transactions, which are collateralized by real assets and less risky, remained far more active than trading among uncollateralized NCDs.
In terms of external pressure, the dollar was rising around the time of Baoshang’s default because of the breakdown in U.S.-China trade negotiations and the sudden imposition of tariffs in early May 2019, as the second figure above shows. This made it especially unlikely that China’s authorities chose the date for Baoshang’s default actively, and it was more likely that events tied to financial risks within the bank forced their hand. If China was already under pressure from the United States, it would not be in China’s political interests for authorities to cast an even brighter international spotlight on problems within China’s financial system. But the outflows resulting from the rising
0
20
40
60
80Openness
Banks
Property
Debt and Credit
External Pressure
FSI
Jun-18 Jul-18 Aug-18 Sep-18
Figure 5.5: Snapshot of the Risk Matrix During Deleveraging: June 2018–September 2018
Source: Rhodium Group.
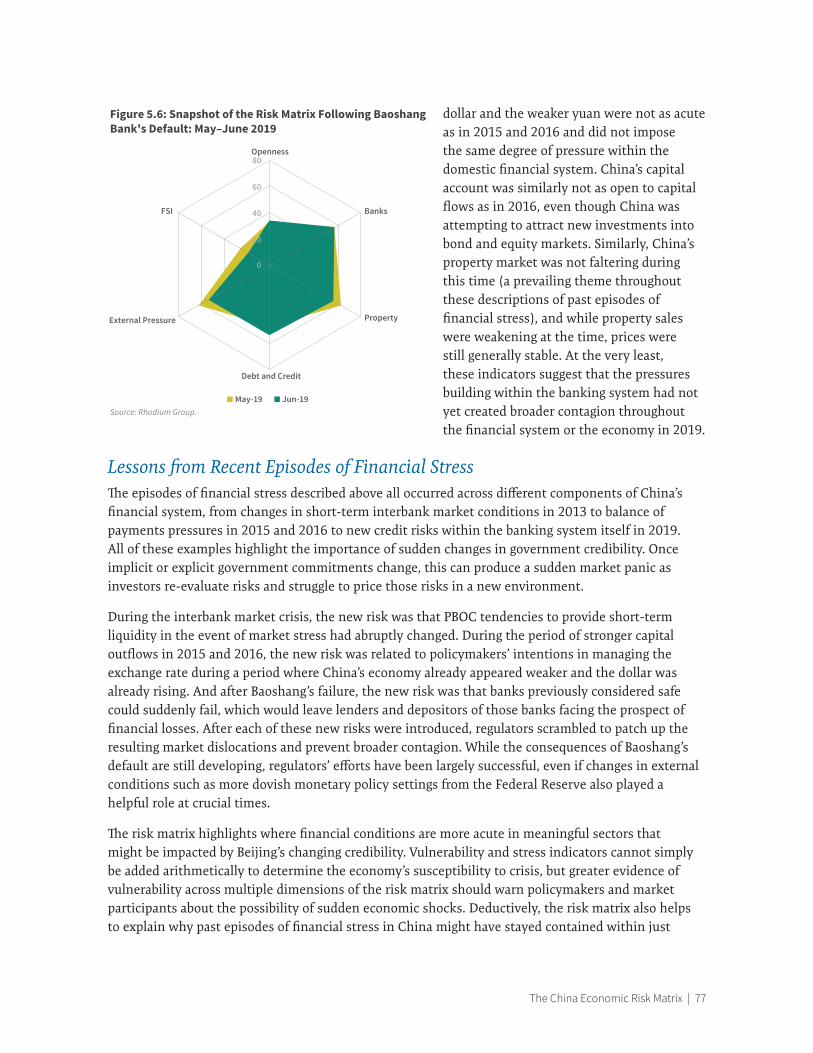
The China Economic Risk Matrix | 77
dollar and the weaker yuan were not as acute as in 2015 and 2016 and did not impose the same degree of pressure within the domestic financial system. China’s capital account was similarly not as open to capital flows as in 2016, even though China was attempting to attract new investments into bond and equity markets. Similarly, China’s property market was not faltering during this time (a prevailing theme throughout these descriptions of past episodes of financial stress), and while property sales were weakening at the time, prices were still generally stable. At the very least, these indicators suggest that the pressures building within the banking system had not yet created broader contagion throughout the financial system or the economy in 2019.
Lessons from Recent Episodes of Financial StressThe episodes of financial stress described above all occurred across different components of China’s financial system, from changes in short-term interbank market conditions in 2013 to balance of payments pressures in 2015 and 2016 to new credit risks within the banking system itself in 2019. All of these examples highlight the importance of sudden changes in government credibility. Once implicit or explicit government commitments change, this can produce a sudden market panic as investors re-evaluate risks and struggle to price those risks in a new environment.
During the interbank market crisis, the new risk was that PBOC tendencies to provide short-term liquidity in the event of market stress had abruptly changed. During the period of stronger capital outflows in 2015 and 2016, the new risk was related to policymakers’ intentions in managing the exchange rate during a period where China’s economy already appeared weaker and the dollar was already rising. And after Baoshang’s failure, the new risk was that banks previously considered safe could suddenly fail, which would leave lenders and depositors of those banks facing the prospect of financial losses. After each of these new risks were introduced, regulators scrambled to patch up the resulting market dislocations and prevent broader contagion. While the consequences of Baoshang’s default are still developing, regulators’ efforts have been largely successful, even if changes in external conditions such as more dovish monetary policy settings from the Federal Reserve also played a helpful role at crucial times.
The risk matrix highlights where financial conditions are more acute in meaningful sectors that might be impacted by Beijing’s changing credibility. Vulnerability and stress indicators cannot simply be added arithmetically to determine the economy’s susceptibility to crisis, but greater evidence of vulnerability across multiple dimensions of the risk matrix should warn policymakers and market participants about the possibility of sudden economic shocks. Deductively, the risk matrix also helps to explain why past episodes of financial stress in China might have stayed contained within just
Figure 5.6: Snapshot of the Risk Matrix Following Baoshang Bank's Default: May–June 2019
Source: Rhodium Group.
0
20
40
60
80Openness
Banks
Property
Debt and Credit
External Pressure
FSI
May-19 Jun-19

Wright, Gloudeman, and Rosen | 78
one or two markets. Notably, none of the highlighted instances of financial stress has coincided with a property market downturn, where falling prices would constrain Beijing’s policy response. Any of these episodes might have spiraled further should the property market have weakened simultaneously, given the likely impact on China’s economic growth and perceptions of government credibility. And as the next chapter details, China now faces an entirely new type of challenge in maintaining financial stability amid the economic fallout of the Covid-19 outbreak.

The China Economic Risk Matrix | 79
Chapter 6: The Outlook for China’s Financial Risks
The Covid-19 outbreak hit China in early 2020 and produced the type of economic adjustment that the risk matrix was designed to diagnose and assess. The analysis in the previous chapters focused on the risks of an endogenous shock to China’s economy, occurring primarily as a result of developments within China’s financial system itself, although external pressure through rising U.S. interest rates or the dollar can play a role in such developments. The Covid-19 outbreak was an exogenous shock to China’s system and the global economy. It could not have been easily predicted, and the economic consequences could not have been readily anticipated.
The global virus outbreak and the corresponding shutdowns of economic activity have produced a record contraction in China’s economy, with a year-on-year decline in GDP of 6.8 percent in the first quarter and a much sharper correction in industrial output, fixed asset investment, and household consumption. After years of apparent stability, one no longer has to guess what a sharp slowdown in China would look like, nor what its implications for stability within the financial system would be. The virus outbreak has provided a clear picture.
The critical questions concerning the Covid-19 outbreak and China’s medium-term financial stability are closely tied to the severity of this economic shock and the efficacy of policy measures to counter it. This study anticipates three scenarios when assessing the impact of the virus on China’s financial system:
1. The virus outbreak proves to be a temporary shock whose medium-term effects were mitigated by the deployment of counter-cyclical policy measures by China’s authorities. A V-shaped recovery in both industrial production and domestic demand is likely, and previous trend growth will resume with minimal consequences for the financial system.
2. The Covid-19 outbreak has increased the medium-term potential for a financial crisis in China, but counter-cyclical policy to counter those risks, including forbearance on regulatory measures, is also stronger than it would have been in the absence of the outbreak. Financial risks remain elevated, but the stronger policy response may prevent the economic slowdown from having broader systemic consequences.
3. Covid-19 accelerates trends that were already underway. The virus outbreak becomes the straw that breaks the camel’s back for China’s financial system, which was already highly imbalanced and unable to cope with the economic pressures that the outbreak created.
Wright, Gloudeman, and Rosen | 80
Only time will tell which of these scenarios becomes reality for China’s financial system, but the impact of the Covid-19 outbreak has already been severe.
The Covid-19 Economic Correction and the Risk MatrixIronically, the framework provided within the risk matrix would suggest, at first glance, that the Covid-19 outbreak would be associated with a reduced risk of financial crisis rather than adding to that risk. In response to the outbreak, government assistance to the financial sector increased, and China’s authorities promised additional financial support for firms and institutions in distress. The net result was to increase the credibility of government guarantees rather than reduce belief in those guarantees. Under these circumstances, this study expects financial stability to be reinforced because expectations within China’s financial system that Beijing will be there to provide support and prevent the spread of contagion have been reinforced. As discussed in Credit and Credibility, a belief in Beijing’s commitment and ability to respond to financial stress has been a critical bulwark of stability in the financial system as a whole.
This warrants a closer look at how Beijing’s response to the Covid-19 outbreak, even as it bolsters its credibility, may be increasing risks in the financial system that have been building for years. In 2019, the PBOC revealed that under a stress test in which GDP growth slowed below 4.15 percent, several banks would fail capital and liquidity-related ratio tests, suggesting that they would require additional capital or other support for their balance sheets (perhaps through sales of non-performing assets).71 With GDP contracting in the first half of 2020, even more banks are likely to face such pressure.
China’s primary economic policy response to Covid-19 has been to fund additional infrastructure spending. This, however, requires local governments to take on more debt and banks to lend more. China’s banking regulators have also encouraged banks to extend and roll over loans to companies under pressure from the economic shutdown, but a specific support plan from Beijing for banks that do so, incurring losses or accumulating more non-performing loans in the process, has not yet been announced. These forbearance measures have formally been extended until the first quarter of 2021.
As the economic crisis following the Covid-19 outbreak intensified, the central bank guided short-term money market rates lower and eased liquidity conditions, as would be expected from any central bank under similar economic circumstances. Consequently, both private sector firms and distressed smaller banks faced reduced risks of default and more favorable conditions when seeking interbank market financing. At the same time, however, banks were also suddenly facing large volumes of borrowers that were unable to repay principal and interest on their loans. Corporate bond defaults also started to rise. Falling producer prices pushed up real borrowing costs for companies and made it more difficult for them to service their debt. Revenues were also slow to recover, particularly for smaller businesses and private sector firms.
Beijing found it far easier to encourage state-owned enterprises to restart production than to guide consumers, who were concerned about their jobs and incomes, to spend. Even after the initial rebound in industrial production in Q2 2020, which pushed China’s economy back to positive
71.This stress test was described in Standard and Poor’s Global Ratings, “China Banks May Not Be As Resilient As Numbers Suggest,” January 30, 2020, https://www.spglobal.com/ratings/en/research/articles/200130-china-banks-may-not-be-as-re-silient-as-numbers-suggest-11332557.
The China Economic Risk Matrix | 81
year-on-year GDP growth, the recovery in household consumption has lagged considerably. This was primarily a byproduct of falling employment within manufacturing sectors, particularly for exporters, as well as small businesses that were reluctant to restart activity fully after the virus had depressed the economy. The net result was a sharp rise in savings among China’s household sector and reduced discretionary spending, particularly for major purchases.
Although Beijing’s perceived commitment to the overall stability of the economy and the financial system may have been strengthened with the policy response to the Covid-19 outbreak, this did not extend to the shadow banking system specifically. Shadow banking institutions, such as trust companies and asset management companies, had already been under pressure from China’s deleveraging campaign starting in late 2016. In 2018, regulatory efforts designed to restrict these institutions from receiving funding channeled directly from banks intensified. Even after the Covid-19 outbreak, Beijing did not relax controls over these institutions, imposing new requirements on trust companies that limited the concentration of lending to individual borrowers.
Trust companies have faced significant pressure in this year: 6 of China’s 68 trust firms have had investors protesting outside of their offices, demanding compensation for dozens of defaulting products.72 Regional banks have consolidated their operations under guidance from regulators in order to avoid pressures from non-performing loans. Other smaller banks have similarly faced bank runs—sudden withdrawals of deposits based on a loss of credibility in the institution—across China.
The banks facing runs have been relatively small so far, but in combination with the five commercial banks in China that have been formally restructured following Baoshang Bank’s failure and eventual bankruptcy, China appears to be facing rising levels of defaults in multiple areas of its financial system—among non-banks, in corporate bonds, within private and state-owned companies, and among banks themselves.
None of these threats appear to be systemic in nature so far. But importantly, the credibility of implicit government guarantees on these assets and institutions appears to be eroding. This is exactly the set of conditions that would be expected to be associated with a rising risk of financial crisis in China because rising credit risks within asset classes where government guarantees are suddenly questioned can quickly spill into contagion.
This contagion has not materialized for the time being, even as China’s economy expands at a much slower rate in both nominal and real terms than at any point over the past three decades. Beijing has demonstrated that it is capable of containing the immediate fallout of the Covid-19 outbreak and its aftermath for the financial system. But the economic effects of the outbreak do appear to be exacerbating credit risks that were already problematic before the virus hit, which were highlighted in Credit and Credibility.
72. “There were nearly 100 trust defaults in the second quarter, and the market is concerned about how to assign responsibility,” China Business News, July 14, 2020, https://m.yicai.com/news/100699903.html.

Wright, Gloudeman, and Rosen | 82
THE RISK MATRIX ASSESSMENT OF CHINA’S POST-COVID-19 CONDITIONS
The risk matrix discussed in the previous chapters is a diagnostic tool, capable of identifying when both stress and vulnerabilities are rising within China’s financial system and interacting with one another. As a result, it is logical that after the Covid-19 outbreak, these indicators of vulnerability rose, while indicators of financial stress receded, particularly those tied to short-term funding rates. However, the risk matrix cannot predict the form that a crisis will take—its most useful function is to provide an indication of the time frame in which policymakers, analysts, and market participants should be attentive to the prospect of financial and economic turmoil.
In assessing the prospects for China to manage or mitigate severe risks, it is more important than ever to understand the most probable scenarios for financial contagion. Risks of crisis are more likely to accelerate when China’s government credibility changes rapidly and previously safe assets and institutions are suddenly considered risky—this includes China’s commercial banks and the value of China’s currency as well. Since May 2019 and the failure of Baoshang Bank, banks’ creditworthiness has been questioned within China’s interbank market, causing other banks to withhold funding from riskier institutions. Should that same pattern of risk aversion begin to be applied geographically to entire local governments or to a broader set of asset classes, such as bonds issued by state-owned enterprises, then a large volume of assets are at risk of repricing and liquidation.
The belief in government guarantees within China’s financial system has driven a persistent “flight to risk” rather than a “flight to quality” in times of financial stress. If the government is expected to bear the losses, it makes sense for investors to seek additional risk and the corresponding yield that these assets would provide. This approach has persisted, even in the sharp economic downturn of early 2020. In July, rising risks within the shadow banking system produced a surprising flow of new money into China’s equity market. If shadow banking products could default, the thinking went, then the risk was the same as picking stocks, and many equity market funds were offering even higher returns. Based on Beijing’s actions in 2015, market participants expected the government to respond to any widespread sell-off in the equity market with another bailout package.
But as the credibility of government guarantees gradually erodes as defaults rise and riskier investments are not rescued, that flight to risk will probably shift to a flight to quality, as is typical within developed markets. The risk matrix identifies evidence of vulnerability and instances of financial stress and points to a number of weak points within China’s financial system which could lead to disorderly contagion and panic.
0
20
40
60
80Openness
Banks
Property
Debt and Credit
External Pressure
FSI
Jan-20 Feb-20 Mar-20
Figure 6.1: Snapshot of the Risk Matrix During the Covid-19 Outbreak
Source: Rhodium Group.

The China Economic Risk Matrix | 83
The Great Wave of Speculative Money Rolls OnSpeculation in Chinese asset markets is nothing new, but in a weakening economy with more money sloshing around the financial system, the potential for destabilizing booms and busts is higher. In the 2000s, the cause of speculative activity was simple: financial repression was widespread and deposit rates were fixed at low levels, so it made little sense to leave money in the bank. Virtually any other economic activity or choice of investment in China, with GDP growing at double-digit nominal rates at the time, would have generated significantly higher returns than a bank deposit at 2 to 4 percent. At the same time, deposits within the banking system rose very quickly as China ran large trade surpluses and saw investment inflows for the vast majority of the first decade of this century. Almost all exporters and investors were able to convert their foreign earnings or investments into RMB deposits. As a result, while the PBOC could control formal loans from the banking system to keep tabs on the probable resulting inflation, deposits continued to seek out higher returns elsewhere, primarily through investments in property, stocks, and a growing shadow banking sector. The great wave of speculative money washing around the Chinese financial system was born.
Of course, speculative investment frenzies have their limits. Eventually prices rise too high and there is no investor ready to purchase assets in anticipation of further gains. China saw dramatic booms and busts in the equity market in 2007 and 2015, while property prices have faced only a few isolated six to nine month corrections over the previous two decades, without a significant bust. Shadow banking products are starting to default in greater numbers in recent years, after less regulated sectors such as peer-to-peer lenders collapsed earlier in the deleveraging process, in 2017 and 2018.73
The growth of the shadow banking system over the past decade caused financial repression to start breaking down. By 2012, investors could choose between wealth management products (WMPs) offering higher interest rates, trust products, or other options, most of which were typically offered by banks themselves. Because these non-bank institutions were offering investors higher rates of return, they needed to deliver those returns from riskier sectors of the economy. But with China’s economy slowing starting in 2012, and interest rates on bonds falling (when nominal GDP growth rates were cut in half from 2010 and 2011 levels), fewer investments in the real economy could provide those returns. More speculative money was chasing fewer profitable opportunities.
As a result, the speculative “wall of money” in China would often shift between different investment options that were fashionable at the time, from lending to property developers via trust products, to margin lending to equity investors, to a frenzy of speculation in commodities futures.74 Financial innovations such as WMPs offered via mobile phones and electronic wallets facilitated a faster flow of money between these alternatives for speculative investment.
73. See, for example, Zhang Shu and Elias Glenn, “Beijing struggles to defuse anger over China’s P2P lending crisis,” Reuters, August 12, 2018, https://www.reuters.com/article/us-china-lenders-p2p-insight/beijing-struggles-to-defuse-anger-over-chi-nas-p2p-lending-crisis-idUSKBN1KX077.
74. Because of the speculative activity fueled by non-bank financial institutions, futures trading in a single contract in Chi-na’s steel rebar markets reached $47 billion in a single day in April, higher than trading volumes on the Shanghai equity market. See Ruby Yuan and Manolo Serapio, “China commodity exchanges crack down on speculation as rebar volumes soar,” Reuters, April 22, 2016, https://www.reuters.com/article/us-china-commodities-futures/china-commodity-exchang-es-crack-down-on-speculation-as-rebar-volumes-soar-idUSKCN0XJ0TP.
Wright, Gloudeman, and Rosen | 84
Seeking higher returns on foreign assets overseas was also an option for Chinese investors—even if capital controls imposed after large outflows in 2015 and 2016 made this more difficult. The net result was that within domestic markets there was a constant oscillation of speculative funding moving back and forth between the “hot” asset markets of the day. The speculative wave of money was always chasing quick returns to repay investors in shadow banking products. And consequently, speculative investors were less concerned about the damage that boom and bust cycles in several markets might create, based on a widespread perception that any problem too large would cause Beijing to step in and clean up the mess.
These dynamics still exist today, with the most obvious recent example being the shift into the equity market in late June and early July 2020 in response to defaults on shadow banking products. Now that WMPs need to have their assets marked to market in real time following asset management rules implemented in April 2018, investors can see that they face the possibility of losses on those instruments, reducing their attractiveness.75 The result is a more restive, unstable wave of speculative money looking for the next opportunity within China’s financial markets.
Beijing, of course, would prefer that all of this credit is ultimately channeled to the “real economy.” But with credit demand from legitimate private borrowers depressed following the Covid-19 outbreak, and real interest rates at high levels, borrowing for investment makes less sense than borrowing for speculation. Early in 2020, money market rates fell sharply, and companies started borrowing money at low short-term rates—not to make new investments but to buy structured deposits offering 4 to 5 percent returns from different smaller banks, a purely financial arbitrage.
The most significant risk resulting from this rapidly moving wave of speculation is that too much money chasing asset price movements creates catastrophic busts after the short-term booms. Historically, Beijing has been highly reactive to these dynamics, continuing to bail out investors who could not exit quickly enough after the wave of speculative money moved on—the equity market in 2015 is a prime example. But in the wake of Covid-19, the potential for such speculative booms and busts is higher than ever. Credit demand—outside of firms rolling over existing debt—remains depressed, and more money is circulating around the financial system than before, as a result of monetary easing efforts.
Under these circumstances, new instances of financial stress are likely. The key questions will be how large those booms and busts become, where the speculative wave of money will rise and crest, and which assets will be caught in the undertow as the wave moves on. Beijing has stronger incentives to support investors in some speculative asset markets relative to others. Investors in deposit-like WMPs offered by banks are more likely to receive assistance than investors in peer-to-peer networks, for example.
Illiquidity Within China’s Property SectorThe property sector offers a particular challenge. The sector is vitally important for China’s economy as a whole, and most participants assume that it is essentially “too big to fail.” But at the same time, Beijing has no interest in seeing property prices rise further and the property sector consuming ever-larger proportions of domestic financial resources. Furthermore, if property prices
75. Wu Xiaomeng and Fran Wang, “Banks scale back wealth management products after new rules,” Caixin Global, May 16, 2018, https://www.caixinglobal.com/2018-05-16/banks-scale-bank-wealth-management-products-after-new-rules-101251066.html.

The China Economic Risk Matrix | 85
fall steeply nationwide, Beijing has no meaningful options to eliminate investors’ losses—it can only mitigate them.
China’s property market is highly imbalanced at present—supply in the form of new starts is near all-time highs, while drivers of demand have been hollowed out. Home ownership rates are very high by global standards—above 80 percent in most household finance surveys and as high as 96 percent in one recent survey of 30,000 urban households conducted by the PBOC.76 Household debt levels have risen sharply over the past five years, and household debt-to-income ratios in China stood at 128 percent at the end of 2019, similar to U.S. levels before the global financial crisis.77 Household formation rates have declined sharply, however, because of China’s demographic changes. There have been far fewer births over the past two decades than the previous two (roughly 326.4 million from 2000–2019 compared to 426.6 million from 1980–1999), so fewer new buyers are emerging to purchase China’s new housing stock.78 Meanwhile, as noted earlier, a large proportion of current households already own their houses.
76. There have been multiple years of similar findings from Gan Li’s China Household Finance Survey. See, for example, Gan Li, “Findings from China Household Finance Survey,” (Texas A&M University and Southwestern University of Fi-nance and Economics, January 2013), http://people.tamu.edu/~ganli/Report-English-Dec-2013.pdf, and “Average net worth of Chinese urban household nears 3 mln yuan: survey,” Xinhua, April 26, 2020, http://www.xinhuanet.com/en-glish/2020-04/26/c_139009659.htm.
77. Logan Wright and Allen Feng, “COVID-19 and China’s Household Debt Dilemma,” Rhodium Group, May 12, 2020, https://rhg.com/research/china-household-debt/.
78. Demographic data from China’s National Bureau of Statistics.
Figure 6.2: Residential Property, New Starts and Sales, Annualized (million sqm, 12-month rolling sum)
0
200
400
600
800
1,000
1,200
1,400
1,600
1,800
Jan-
05
Aug-
05
Mar
-06
Oct
-06
May
-07
Dec-
07
Jul-0
8
Feb-
09
Sep-
09
Apr-
10
Nov
-10
Jun-
11
Jan-
12
Aug-
12
Mar
-13
Oct
-13
May
-14
Dec-
14
Jul-1
5
Feb-
16
Sep-
16
Apr-
17
Nov
-17
Jun-
18
Jan-
19
Aug-
19
Mar
-20
Starts Completions Sales Implied Unfinished
Source: National Bureau of Statistics.

Wright, Gloudeman, and Rosen | 86
A simple illustration highlights these imbalances and their likely effect over the next decade. China’s population data lists 163.3 million citizens aged 11 to 20. If one assumes that 70 percent of those 163.3 million eventually acquire urban residency permits (currently far higher than China’s urbanization rate) and 80 percent of those urban residents eventually marry or form households interested in purchasing property, this translates into new demand for just 45.7 million households over the next decade. Meanwhile, in 2019, China’s new residential housing starts reached 1.67 billion square meters.79 At an estimated average house size of 90 square meters (the actual average size is unknown), that equates to around 18.6 million new houses started. If this pace continues, China would meet housing demand for the coming decade in just three years. And that does not include resales of houses that come back onto the market from people moving or passing away over that time frame.
This shows that investment-driven purchases, rather than fundamental demand, are driving China’s property markets. Investors believe that property prices will continue to rise, in part because there have been no significant corrections in property prices over the past two decades and in part because of a belief that it is the safest asset in China’s financial system. The belief that prices will continue to rise cannot persist forever, but it is difficult to predict when investors will realize that further price gains are no longer achievable and will move to sell their property holdings. This is especially true when large volumes of speculative money is moving in and out of asset classes within China’s financial system and might move back into property markets when equities or shadow banking products appear less secure.
China does not have the same types of financial derivatives tied to housing-related loans that were behind the 2003–2008 U.S. housing bubble and the resulting financial crisis. It is also important to note that housing markets tend not to collapse all at once. Nor do they offer clear market pricing signals when they weaken. The greater risk associated with China’s housing bubble is that all of these investment-driven property holdings essentially become illiquid, with no apparent market price available for most houses. An extended period in which transaction volumes in the housing market fall has perverse effects on market conditions. Central to this concern is that property represents 60 to 80 percent of the net worth of Chinese households, according to several household finance surveys.80 When a market fails to clear on a regular basis, asset holders within that market will often seek clarification of the current valuation of their assets. But the larger concern is that even if property values need to be marked down, there may be no indication how far prices need to fall before transactions can resume.
These periods of illiquidity have precedents in China, particularly in so-called “ghost towns” in the southwestern and northeastern regions of the country, where building outpaced population growth.81 Housing sales were often finalized in the pre-construction phase, so developers were able to build profitably and sell the houses on to investors rather than owner-occupiers. But the net result was that few people moved in and even fewer were willing to rent in these areas, and the resale values of houses in a number of communities plummeted. When transaction values declined sharply, it was unclear where market-clearing prices would settle because the markets in many of these cities had basically vanished. One of the biggest financial risks for China is that this dynamic plays out on a nationwide scale.
79. Data from China’s National Bureau of Statistics.
80. Gan Li’s China Household Finance Survey and results of PBOC household finance survey as reported in Xinhua April 26, 2020.
81. See, for example, discussions of the town of Shenmu in Inner Mongolia in “Credit crisis highlights transition urgency,” Xin-hua, August 12, 2013, http://europe.chinadaily.com.cn/business/2013-08/12/content_16886844.htm.

The China Economic Risk Matrix | 87
Should households face illiquidity and uncertain pricing for their primary assets, they are likely to react by either shifting assets to alternative channels or by selling properties at steep discounts. Invariably, the cost of price discovery can continue to rise within illiquid markets. The negative wealth effects involved can create costs for household consumption within China’s real economy while also discouraging new investment in housing construction, since so many units will have already been built. When a large proportion of household wealth suddenly becomes illiquid, the risk is not that a speculative wave of money will suddenly leave property and shift elsewhere: investments in property are locked in the houses themselves and cannot be redirected without a buyer on the other side.
Moreover, with a problem on this scale, it is difficult for Beijing to produce a meaningful policy response. Economists from Goldman Sachs estimated that the total value of China’s housing market had reached $52 trillion at the end of 2019, which is around 3.7 times the size of China’s economy.82 At the peak of Japan’s housing bubble, the market totaled four to five times GDP.83 More significantly, however, should such a large market become illiquid, there is little that authorities can do to restore confidence in asset values. Because of its size relative to China’s economy, Beijing could not reimburse investors for their losses—nor would they want to. China’s technocrats could take measures to try to prop up demand, but it is unclear how effective these measures would be in a market where expectations of falling prices have taken hold.
The prospect of illiquidity in China’s housing market is one of the most significant threats to economic stability in China and would surely create stress in other areas of the financial system. Property and land represent a significant proportion of collateral for corporate loans within China’s banking system. Should property prices fall, the risk is not that loans will need to be called in because the collateral is suddenly marked down but that new loans cannot be extended using property as collateral. As a result, illiquidity and uncertainty in property asset values can drive a sharper credit crunch within China’s formal banking system, with additional consequences for financial stability. And while Beijing can offset the effects of this credit crunch, it would have limited options to address the source of the crunch—falling nationwide property prices.
Geographic Counterparty Risk: Connections Between Local Governments and Their BanksChina’s property market is also significant because it is inextricably tied to the financial health of China’s local governments and local city and rural commercial banks. China has over 4,000 banks, and most of the smaller institutions exist as secondary fiscal authorities for localities. Local officials are often involved in appointing bank management, and banks correspondingly receive deposits from local state-owned enterprises and financing platforms while making loans to the same enterprises to fund local development projects. Rural commercial banks are often involved in extending loans to smaller businesses within their jurisdictions.
82. Stella Yifan Xie and Mike Bird, “The $52 Trillion Bubble: China Grapples With Epic Property Boom,” Wall Street Journal, July 16, 2020, https://www.wsj.com/articles/china-property-real-estate-boom-covid-pandemic-bubble-11594908517.
83. Estimate of $20 trillion in total Japanese land values in 1991 from Douglas Stone and William T. Ziemba, “Land and Stock Prices in Japan,” Journal of Economic Perspectives 7, no. 3 (Summer 1993): 149-165, https://www.jstor.org/sta-ble/2138448?seq=1.

Wright, Gloudeman, and Rosen | 88
However, rising debt levels at local governments themselves, combined with low volumes of Beijing-backed local government bonds issued to refinance debt, have placed many local state-owned firms and financing platforms on the brink of default. In some cases, these risks are well known within financial markets, while in others, defaults on loans or corporate bonds can occur suddenly. Since 2019 and Baoshang Bank’s failure, local government financing vehicles have defaulted on both onshore and offshore bonds, and earlier in 2020, a Qinghai provincial financing platform was declared bankrupt.84 Tianjin was similarly unable to prevent a default on an offshore $1.25 billion bond by one of its own commodity trading companies, Tewoo.85 For many of these localities, the choices are unpalatable: they can stop supporting their local companies and relieve themselves of pressing debt obligations by defaulting (while losing access to future bond market financing) or they can arrange a restructuring of the debt without addressing the underlying financial pressures that are generating defaults.
When financial markets start focusing on the health of local governments themselves, new risks can materialize because the lack of transparency on the fiscal state of local governments can drive markets to cut off virtually any firm operating within a troubled locality. After all, many of these state-owned firms and local government financing vehicles ultimately depend on credit support from local governments and are essentially guaranteed by the localities themselves. If a local government is suddenly viewed by markets or ratings agencies as too risky, then virtually the entire local economy can be cut off from funding.
There have been meaningful changes in credit conditions based on these geographic counterparty risks. Immediately after Baoshang Bank defaulted, several other banks within Inner Mongolia, or those thought to do business with Baoshang, were similarly cut off from interbank market funding as banks pared their lists of acceptable counterparties. When Liaoning Province faced a political scandal involving the provincial National People’s Congress, and a major steel company in the province defaulted on multiple bonds, virtually no bond from any company issued within the province could be sold at prevailing market yields.86 Financial market participants are well aware that northeastern and southwestern provinces have seen weaker growth and more defaults in recent years. Hubei Province, which includes Wuhan, the epicenter of the Covid-19 outbreak, also saw less new credit in 2020 than in the first half of 2019, even though Beijing probably would have preferred to see more loans channeled to troubled firms in the virus-hit province.87 The fiscal woes of provinces such as Qinghai and Liaoning are so well known within the Chinese financial system that net corporate bond issuance for all firms within the province has fallen over the last three years. In Liaoning, credit has contracted over the previous four quarters (Q3 2019 to Q2 2020) by an estimated 0.5 percent.88
84. Frank Tang, “China debt market feeling the heat in June with two big defaults and a government order to reduce risk,” South China Morning Post, June 26, 2020, https://www.scmp.com/economy/china-economy/article/3090752/china-debt-market-feeling-heat-june-two-big-defaults-and.
85. “China Suffers Biggest Dollar Bond Default By State-Owned Company in Two Decades,” Bloomberg, December 11, 2019, https://www.bloomberg.com/news/articles/2019-12-12/most-investors-accept-haircut-in-china-s-tewoo-bond-revamp.
86. Coco Feng and Fan Ruohong, “Specialty Steel Giant on Brink of Bankruptcy Is Rescued,” Caixin, July 10, 2017, https://www.caixinglobal.com/2017-07-10/specialty-steel-giant-on-brink-of-bankruptcy-is-rescued-101113443.html, and “Liaoning and the Politics of Data,” Rhodium Group, China Markets Research, January 4, 2017.
87. Statistic from PBOC provincial TSF data, August 6, 2020, http://www.pbc.gov.cn/goutongjiaoliu/113456/113469/4067959/index.html.
88. Estimates based on calculations from Q2 2020 PBOC provincial TSF data, August 6, 2020, http://www.pbc.gov.cn/goutongji-aoliu/113456/113469/4067959/index.html.

The China Economic Risk Matrix | 89
The acute risk posed by rising local government defaults is that interbank markets can quickly start to cut off funding for any related local banks and associated firms, driving a localized “sudden stop” in financing and placing rapid financial pressure on banks, firms, and the local government all at once, in a synchronized default of the entire local financial infrastructure. The lack of transparency associated with local government fiscal conditions creates incentives for lenders to act with a broad brush in trying to limit credit risks by trimming their counterparty lists. And while Beijing can make promises that banks or the provincial government will receive support, such support will need to be explicit and declared. In order to head off broader turmoil, Beijing will need to provide considerable fiscal resources, do so rapidly, and be transparent about its actions in the event of a broad-based credit crunch based on geographic counterparty risk.
The interconnections between fiscal and financial institutions at the local government level create a set of credit risks specific to China’s political structure. These linkages between institutions, and the solvency of the institutions themselves, are particularly vulnerable when government guarantees are in doubt.
The Slow-motion Banking Crisis Keeps AcceleratingAnother critical area of risk is contagion within the banking system itself, where continued bank failures could produce a broader credit crunch. China has faced banking system problems before, particularly in the late 1990s, following the Asian financial crisis. At that time, Premier Zhu Rongji and a number of financial reformers led an effort to recapitalize China’s major state-owned banks, carve out non-performing assets, pair the repaired banks with foreign strategic investors, and list them on international stock exchanges. This plan was largely successful, although China’s
- 70.1- 15.8
21.71.2
- 2.7- 0.7
- 10.421.742
25.749.6
61.2156.4
100.9172.4
126.7200209
138.8152.1
204157.8175
266.9314.1
520.5411.7
556.6785.1
974.31774.5
-500 0 500 1000 1500 2000LiaoningQinghai
TibetNingxiaHainan
Inner MongoliaHeilongjiang
GansuJilin
XinjiangGuizhouGuangxi
ShanxiChongqing
ShaanxiYunnanJiangxiTianjin
AnhuiHenanHubeiHebei
HunanFujian
SichuanShanghai
ShandongZhejiangJiangsu
GuangdongBeijing
Government Bonds Corporate Bonds
Figure 6.3: Total Net Corporate and Government Bond Financingby Province, Q1 2018–Q1 2020
Billion yuan
Source: People’s Bank of China.
Wright, Gloudeman, and Rosen | 90
economy grew so quickly that the previous volume of non-performing loans was no longer a significant cost.
The current slow-motion banking crisis poses a different threat because China has now seen formal defaults and bankruptcies of banks themselves, starting with Baoshang. Four banks in addition to Baoshang have now been restructured, and many smaller institutions have reportedly faced bank runs, with depositors withdrawing funds at the first sign of trouble due to uncertainty about any bailout or resolution. China’s government credibility and commitment to the solvency of any individual bank is now in question, which can cause additional runs and the need for further bailouts or restructurings.
Beijing must balance the objectives of permitting the market pricing of default risk at banks themselves along with managing the potential for broader contagion as questions emerge about more banks’ creditworthiness. The current banking system is far larger than in the late 1990s, with $44.0 trillion in assets as of the end of June 2020, and far more complex as well. Currently, in managing individual restructurings, Beijing is using liquidity from the central bank balance sheet or instructing larger banks to assume the obligations of smaller banks until other shareholders can be located. But interbank and corporate depositors have already faced haircuts and will be more cautious about lending to risky banks.
Scenarios for contagion to spread would involve credit risk at vulnerable banks driving healthier banks to withdraw interbank funding in the form of short-term liquidity or interbank deposits. For many smaller banks, interbank liabilities are around 30 percent or more of their total funding base, so a quick withdrawal of financing would require them to reduce new lending and investment. Beijing may struggle to respond to these developments immediately: after all, regulators will want to see the markets attempting to price credit risks, as they did after Baoshang’s failure. The PBOC’s attempts to stabilize the financial system depend upon large banks lending to small banks, as the central bank only conducts regular operations with 46 larger banks. Should those funding chains between larger banks and smaller banks become frayed or broken, the central bank may struggle to stabilize interbank market conditions. The net result would be a broader credit crunch throughout the economy as well as losses for bank depositors and shareholders. How Beijing manages the rising wave of bank defaults, and how losses are distributed, will be critical to prevent liquidity problems from spreading throughout the financial system and weakening China’s credit and investment-driven economy.
External Risks and Forced DecouplingIn the context of rising tensions between China and many of its economic partners, particularly the United States, it is also worth discussing the risks that may result from an escalation of the U.S.-China dispute to include financial transactions, for example, via sanctions. The lynchpin of those risks to China is the country’s dependence on the dollar for trade and finance. The dollar has a larger footprint within the global financial system than the U.S. economy itself. It is used for trade finance in particular, as well as for the vast majority of cross-border lending and international bond issuance.89
China runs large trade surpluses, which means that Chinese firms earn foreign currency, primarily in the form of dollars, and then sell those dollars for domestic currency to Chinese banks in order to pay
89. Bank for International Settlements, “US dollar funding: an international perspective,” Committee on the Global Financial System Papers, no. 65, June 18, 2020, https://www.bis.org/publ/cgfs65.htm.

The China Economic Risk Matrix | 91
expenses. Chinese importers obtain dollar letters of credit from both Chinese and overseas banks in order to purchase imports, a common form of trade credit. Chinese firms also borrow heavily in dollars in overseas bond markets, particularly in Hong Kong. The largest corporate offshore bond issuers are property developers, but local government financing vehicles have stepped up bond issuance in recent years as well. Banks themselves are key drivers of offshore dollar-denominated bond issues and wholesale borrowing from other banks. The bonds help to replenish capital, while the wholesale funding is used for a variety of purposes, including overseas expansion of Chinese firms, lending for policy measures such as the Belt and Road Initiative, intervention in the offshore currency market on the PBOC’s behalf, and more mundane purposes such as providing trade finance.
As a result of this widespread use of the dollar within the Chinese financial system, both on the mainland and overseas, China is vulnerable to rising dollar funding costs and tightening U.S. monetary policy from the Federal Reserve. China is also at risk from U.S. sanctions that might raise the costs of this dollar funding or affect access to dollar financing tools. Some limited sanctions have already targeted individuals in Hong Kong’s leadership in response to the national security law implemented in July 2020.90 It is also possible that U.S. sanctions could cut off access to dollar financing completely through instructions to U.S. banks to restrict correspondent relationships with Chinese banks. This would be an extreme step and is highly improbable because of its potential shocks to the global trading system—cutting off the world’s largest exporter and a major source of commodity demand from access to financing in the world’s primary reserve currency would have dramatic and instantaneous effects on global financial markets, the global trading system, and the global economy. It could also weaken the credibility of dollar financing tools elsewhere in the world if they were perceived as being used for political reasons.
Rather than the extreme option of cutting off China’s access to dollar financing, the more plausible threat to China’s financial stability is indirectly increasing the political costs of economic engagement with China overall and financial investment in China’s markets. Rising political risks may drive global commercial banks to restrict their own wholesale business with Chinese banks, leaving China’s banks operating in Hong Kong and overseas in need of dollar funding channels from other sources. There is already some evidence of this pullback in Hong Kong, given the competing pressures on financial institutions to manage the threat of U.S. sanctions along with the threat of potential retribution from Beijing.91 China’s central bank could certainly step in to provide short-term dollar financing in the event of any shortfall among Chinese banks, but this would place more pressure and market focus on China’s onshore exchange rate and its sustainability, given that China would need to lend to its banks via foreign currency swaps or other forward transactions out of its existing foreign exchange reserves.
A broad squeeze in dollar funding globally would also affect China, as it did in March during the Covid-19 outbreak and the corresponding selloffs in financial markets. Chinese corporates that issued bonds denominated in dollars but without streams of dollar revenues would likely face higher funding costs during such a squeeze, requiring short-term dollar funding to hedge against these risks. Banks
90. Demetri Sevastapulo and Katrina Manson, “Trump escalates anti-China campaign with Hong Kong sanctions,” Financial Times, August 8, 2020, https://www.ft.com/content/6822dffd-8cb8-494d-9a89-c6ee29a345d4.
91. Alexandra Stevenson, “In Showdown Between China and the West, HSBC Gets Caught in the Middle,” New York Times, August 3, 2020, https://www.nytimes.com/2020/08/03/business/hsbc-china-hong-kong-united-states.html#:~:text=And%20like%20Hong%20Kong%2C%20it,Huawei’s%20ambitions%20in%20the%20country.

Wright, Gloudeman, and Rosen | 92
would demand additional funding, which SAFE would likely provide. But the primary financial risk would be a weaker exchange rate and a perception that the PBOC’s long-term defense of China’s currency would be less sustainable over time. There is no doubt that the rise in political tensions between the United States and China has the potential to increase financial risks within China. But the United States would probably have to resort to extreme policy measures to deepen the stress that has been building since the Covid-19 outbreak.
Watch ListsThe scenarios described above reflect this study’s views of the most plausible narrative paths to financial crisis in China as of August 2020, incorporating the findings within the risk matrix. As China’s financial system continues growing at a rate much faster than the real economy, the number of plausible channels of financial distress will multiply. It is difficult to predict with precision how a future crisis would manifest itself, but the probability of some episode of financial stress is increasing, particularly in the aftermath of the Covid-19 outbreak and the resulting economic contraction. As discussed above, there is already evidence that vulnerabilities are building within China’s financial system, as investors and depositors withdraw funds from banks and non-bank financial institutions. The sources of stress that are likely to be most important for policymakers, market participants, and analysts to watch involve scenarios where doubts arise about implicit and explicit guarantees from Beijing that have fostered stability in the past. A crisis can occur when that loss of credibility in one market spills into others.
The banking system is central to all of these scenarios, given that most financial assets in China are concentrated within banks. Even shadow banking channels, which engage in riskier credit provision, are largely funded by banks and their depositors. Still, the property market appears to be the greatest potential source of risk because a sharp decline in China’s property prices would affect virtually every aspect of the economy—construction, raw materials demand, employment, household consumption, household wealth, and local government financial health. Beijing can draw upon no clear playbook to respond to a substantial nationwide decline in housing prices. Nor is there an obvious way for Chinese authorities to encourage purchases of empty units if expectations of price gains evaporate. When property markets weaken, this study has shown how local governments can lose their ability to support their own state-owned enterprises and financing vehicles, triggering a broader crisis. Interbank market lending, and other banks’ willingness to fund localities and provinces, will be a key variable to watch if geographic counterparty risks start to materialize.
As of now, property prices remain supported in most markets, and the speculative wave of money moves on from one bubble to the next. Data from the risk matrix suggests that the impact of the Covid-19 outbreak on China’s financial stability is likely to fall somewhere between the second and third options presented at the beginning of this chapter: the slowdown has accelerated financial risks that were already surfacing but may not in itself be enough to endanger systemic stability. Political tensions between the United States and China should be monitored, but mostly for the indirect effects on wholesale lending to Chinese banks and China’s access to dollar funding channels rather than as a direct source of acute financial risk in China. Still, it is clear that the financial and economic stress building within China has significant implications for U.S. interests. Policymakers in Washington will need to take this into consideration when assessing how much economic disengagement from China is needed and to make appropriate preparation for economic and political spillovers from China.

The China Economic Risk Matrix | 93
Chapter 7: Implications for the United States: China’s Slowdown and Competing Narratives
This report has shown that China faces more risks on its current path than is commonly understood and that the country has encountered incidents of stress within its financial system that could have spread to broader crises. Economic risk within China is mushrooming as the fallout from the Covid-19 outbreak continues to affect the financial system through rising defaults and overdue loans. The rest of the world has faced a sharper economic slowdown from the virus, and China appears to be the first major economy to have returned to expansion in 2020. In this context, it may seem counterintuitive to focus on the dangers facing China’s economy.
The risk matrix is not meant to predict outcomes—it is a diagnostic tool to detect when the credibility of China’s government as guarantor of economic and financial stability is showing cracks. But the change in the risk matrix’s measures of economic and financial vulnerability over time indicates that regardless of the short-term response to the Covid-19 outbreak, the balance of risks to China’s future economic trajectory is highly asymmetric. The decline in China’s potential growth rate and its financial fragility mean, as has been argued throughout this report, that a slowdown similar to Japan’s “lost decade” is a more likely path than continued stability or an acceleration in growth. The question is whether a sustained slowdown is already underway or whether it will not become evident until 2025 or 2030.
Credit and Credibility made a similar argument about China’s long-term growth outlook in late 2018, only months before the collapse of Baoshang Bank. The study argued that the challenges from China to U.S. interests—both greater risk and short-term competitive forces before financial gravity would assert itself—would intensify before improving. Based on events in the past two years, that prediction seems to have been accurate. Baoshang is now the first bank to be formally declared bankrupt since 1998.92 At that time, China was not facing the same degree of economic pressure that it now faces because of Covid-19, was not seeing the same level of non-performing assets and failing institutions in the financial system, and was operating within a far more accommodative external political
92. Hudson Lockett, Sherry Fei Ju, Sun Yu, “China allows first commercial bank to go bankrupt in almost 20 years,” Financial Times, August 7, 2020, https://www.ft.com/content/014d324f-0423-4345-ab54-532b98165e29.

Wright, Gloudeman, and Rosen | 94
environment. Both the internal and external environments are now worse for China, as the previous chapter detailed, and this affects the balance of risks facing China’s economy. It also has significant implications for the U.S. approach toward China over the next decade. These implications for U.S. interests are examined below.
First, the United States should plan for a slowdown in China and develop contingencies for a possible financial crisis. This scenario should be the base case for U.S. strategic and economic planning. China has been responsible for the largest single-country share of global growth over the past decade, but that will not persist forever. U.S. policymakers should not wait for economic conditions to worsen noticeably before exploring policy options to mitigate the risks to the United States of a slowdown or crisis in China, despite the uncertainty involved in any forecast. These risks could arise quickly in the form of falling global commodity prices, a rising U.S. trade deficit, or a sharp surge in demand for short-term dollar funding around the world. Continued steady growth in the years ahead is still a possibility, but the study team believes it is an increasingly remote one. Growing risks to the property market in China and obstacles to a continued construction boom are the most influential swing variables in China’s outlook over the next two to five years.
Second, the United States should not shy away from the debate over systemic competition, which has intensified in the response to the Covid-19 outbreak. Beijing has portrayed the level of control it exercises over economic actors as a critical advantage of its system over others, particularly in responding to the pandemic. But these same policy levers have also generated substantial economic and financial vulnerabilities in China that have accumulated over the past decade and are more visible in the current crisis. Specifically, when discussing its economy and the risks associated with continued economic engagement with China, the United States should not adopt China’s internal narrative that it is destined for an inexorable rise. Both hawks who are pushing for aggressive decoupling and those who believe that the United States should continue to nudge China in a reform-oriented direction will benefit from highlighting the risks of China’s current economic position rather than taking China’s high growth as a given, assuming that China will continue to rise in relative economic terms, or arguing that Beijing can solve any internal problems by deploying more financial resources. The United States should take a dual strategy in paring back engagement in areas where risks can be clearly identified in the economic, security, and data protection realms while also actively discussing with Chinese counterparts the need for more aggressive structural reform to bring China back in line with global market-oriented norms and prevent a crisis that could boomerang on the United States and like-minded nations.
Third, the challenge from China’s policy choices to U.S. interests will persist and may even increase if China faces financial and economic instability in the coming years. A slowdown will affect China’s external economic engagement directly (less capacity and bandwidth to lend and invest abroad) and indirectly (as more countries see the risks of relying on China). But the United States should not expect Beijing to pull up the tent on its Belt and Road Initiative at the first signs of trouble or rein in its foreign engagement overnight. Even if China is weakened economically, Beijing will probably still be able to continue most of its external economic initiatives and exercise controls within its own markets that will still require a coordinated response from the United States and its allies, including some targeted decoupling steps. A weakened China may actually double down on these policies rather than abandon them.

The China Economic Risk Matrix | 95
Fourth, maintaining U.S. credibility and a commitment to a market-oriented, democratic consensus is essential. The United States should not attempt to mimic China’s economic policy choices, feel that it must respond to each of them, or compete yuan-for-yuan with China’s external lending programs. The United States benefits from a clear distinction between market-oriented and democratic systems and China’s system, so that the consequences of China’s economic policies—both positive and negative—are readily apparent in the public eye when they materialize. Recognizing that any financial crisis in China is closely tied to China’s model itself will reduce the time it takes to change course, enabling a political environment for more aggressive structural reform within China while also taking steps to shield the rest of the world from the economic consequences of a slowdown in China.
Decoupling and Managing Economic Risks from ChinaA dominant assumption about China in current U.S. debates is that its economic growth will continue on its current trajectory, and if the economy slows at all, it will be modest and gradual. Expectations about China’s stability have fueled the idea of a “long-term strategic competition” with China, in the words of the a May 2020 document from the White House which outlines U.S. strategy toward China.93 The current debate about how much “decoupling” from China is necessary is based around an assumption that China will continue to promote polices that that “harm United States companies and workers, distort global markets, violate international norms” and aim to “transform the international order to align with [Chinese Communist Party] interests and ideology.”94
China’s divergence from a path toward market-oriented reforms over the past decade has been well documented. Despite a pledge at the Third Plenum of the 18th Party Congress in 2013 to pursue deeper structural reforms, progress has been slow and backtracked in some areas, even based on China’s own metrics of success.95 Consequently, if the management of China’s economy continues to diverge from global norms, producing distortions in global trade and financial markets, then there is a strong argument for the United States to scale back economic engagement and reduce the potential impact of these policies on the United States and its allies.
U.S. interests will still be under threat from a slowing China. A Chinese economy that is facing a greater risk of financial crisis does not change how U.S. economic interests are defined, as detailed in the White House’s China strategy document. Even if China’s economy weakens, some precautionary steps to shield the U.S. economy from China’s economic practices are still likely to be necessary. These include reducing reliance on China’s inclusion in supply chains, scrutinizing sources of funding for China’s direct investments in the United States, taking far less permissive attitudes about intellectual property infringement, reducing forced technology transfers to Chinese firms, and safeguarding Americans’ personal data.
A deceleration in China’s economic growth, even a gradual one, is likely to mean weaker Chinese demand for U.S. exports, wider trade deficits for the United States caused by a stronger dollar, and some depreciation of the Chinese currency. It would also suggest lower global commodity prices,
93. “United States Strategic Approach to the People’s Republic of China,” White House, May 2020, 16, https://www.whitehouse.gov/wp-content/uploads/2020/05/U.S.-Strategic-Approach-to-The-Peoples-Republic-of-China-Report-5.20.20.pdf.
94. Ibid., 1, 2.
95. See Rhodium Group and Asia Society Policy Institute’s “China Dashboard,” Rhodium Group and Asia Society Policy Institute, https://chinadashboard.asiasociety.org/china-dashboard/.

Wright, Gloudeman, and Rosen | 96
which may have implications for the health of investments in the U.S. energy sector. These effects would be more acute if China’s property market stalls and property construction slows dramatically, given the importance of residential construction for China’s demand for commodity imports. Financial market spillovers are possible, as weakness in China’s currency may spur a broader capital outflow from other emerging markets as well. Economic contingency plans to reduce transmission of these risks are necessary if China’s economy slows, just as they would be if stability and growth prevailed.
Even if China were to face a sudden financial crisis, many of the policies it has unveiled in recent years—Made in China 2025, the Belt and Road Initiative, a more aggressive military approach along its borders—would presumably remain in place. A Chinese leadership that is facing domestic financial distress may double down on its industrial policy plans, allow the exchange rate to fall to support exporters, or even pursue more rather than less overseas lending to preserve the credibility of its international ambitions. Foreign lending opportunities may look more attractive than those within the domestic market. The United States should continue to consider efforts to shield the U.S. economy from the impact of these policy choices, including through limited decoupling measures.
Financial decoupling steps, however, are far less necessary even in the face of China’s rising fragility, with the clear exception of measures to verify and audit information concerning Chinese institutions trading in U.S. markets. China continues to need capital inflows to maintain control over its exchange rate in the medium term; its money supply is almost 10 times the size of China’s reserves at present, historically a very high level for emerging markets managing their currencies against the dollar. Foreign inflows into China’s equity and bond markets are growing steadily at present, but their future will and should be decided by China’s own economic choices rather than U.S. attempts to limit those inflows.
As the risk matrix has demonstrated, China is vulnerable to sudden capital outflows. Despite any political tensions that result from decoupling measures, U.S. capital is likely to be welcome in China for many years, particularly within the distressed debt markets or troubled financial sectors. To attract continued capital inflows, China will need to facilitate more market opening and more transparent reform measures, rather than less, and liberalize controls on capital flowing out as well, to reassure investors that they can repatriate profits. The United States should encourage this process, even if there are additional risks for U.S. investors in buying Chinese assets vulnerable to a slowdown in growth. Once foreign portfolio flows are a significant factor in China’s bond and stock markets, the threat of a sudden capital outflow becomes much more of a concern to Beijing—this would not only affect China’s currency but also domestic interest rates and credit conditions. If foreign investors remain largely absent from China’s markets, there is little chance that Beijing will act to improve market operations on their behalf. Once foreigners are present and active, they become a powerful constituency influencing the range of Beijing’s policy choices. Consequently, Beijing is unlikely to follow through on threats to cut off American institutions from China’s markets or access to investment opportunities.
Faced with the reality of an unstable financial system and slowing growth, it is still more probable that China will opt for more aggressive structural reform—not because this is what Beijing desires but because it will become the only option that can deliver a path out of the abyss. The view that

The China Economic Risk Matrix | 97
China will ultimately choose structural reform out of necessity rather than by choice may seem far-fetched given the constraints of China’s political system and the recent direction of China’s policy choices. But it is equally difficult to see the case for Beijing continuing down a path that is likely to produce more bank failures, defaults, property price declines, and rising pressures on China’s households.
The Importance of Credible Economic NarrativesCredit and Credibility advised that competition with China’s state-led economic model would probably intensify before the final verdict on Beijing’s credibility is rendered. Similarly, some like-minded countries will see China’s vulnerabilities, and others will not or will view them as manageable. This makes the alignment of U.S. policies with allies far more difficult because all countries will make their own independent assessments of Beijing’s credibility as a partner. Few countries are emulating China’s economic model, but perceptions about the internal success of that model in China may influence assessments of China’s reliability as an economic partner and the cost-benefit analyses of engagement. This is despite the abundant warning signs that China may be a highly unreliable counterparty, with risks of both excessive debt accumulation in BRI recipient countries as well as the possibility that capital invested or lent by Chinese entities could be repatriated.
So far, the United States has struggled to challenge China’s most important internal and external narrative: that the country’s rise to become the world’s largest economy is inevitable. Internally, the message—reinforced with strong and stable GDP growth statistics—strengthens public support for the Chinese Communist Party’s rule and dovetails with stronger nationalist propaganda themes. Externally, the message of inevitability improves China’s diplomatic bargaining positions—deal with us now because we will only be stronger in the future—while also reinforcing China’s credibility as a partner on economic projects such as the Belt and Road Initiative. Even foreign governments interested in seeing China reform are more prone to emphasize China’s strengths rather than its weakness because it is easier to make the case that a strong Chinese economy can bear the costs of reform, and China’s economic record so far has supported that assumption of continued stability. The net result is that both those in favor of more engagement and security hawks within the United States end up corroborating China’s most important external message.
This narrative of China’s inexorable rise can and should be challenged, despite China’s strong record of economic growth over the past two decades. Even following the Covid-19 outbreak, growth in China continues to depend upon increasingly inefficient state-led and bank-financed investment. Facts on the ground in China’s financial system suggest that that the economy is more vulnerable to financial stress than is commonly assumed. As financial risks become more apparent following a decade of rapid credit growth and the shock of the Covid-19 outbreak, China’s potential growth and productivity growth are slowing. Demographic changes mean a shrinking labor force in the coming decade, and productivity has been hampered by a financial system that continues to keep bloated state-owned enterprises and local government firms afloat with new loans rather than channeling credit to the more productive private sector. The rise of economic vulnerabilities has been detailed in the preceding chapters.

Wright, Gloudeman, and Rosen | 98
The appearance of a nationwide financial crisis would be devastating for China’s narrative of inevitability, and Beijing will push back hard against those perceptions, both with policy measures to counter financial distress and with an aggressive public narrative emphasizing authorities’ control of the situation. The risk matrix illustrates that China’s internal risks are far more acute than external risks at this point, even though China faces a far more hostile external environment. Beijing’s internal messaging efforts are likely to be ineffective should a number of banks require restructuring, property prices fall substantially, and household net worth be reduced accordingly. External diplomacy would take a hit, as fewer countries would view China as a reliable economic partner, and over time, they would probably view policy-driven lending from China with greater suspicion. Perceptions will not change overnight, either inside or outside China. The mainstream intellectual bubble surrounding China’s inevitable rise will take longer to pop, but the prevailing view of strong and stable growth without economic or financial disruptions will also become more difficult for Beijing to maintain, particularly following the Covid-19 outbreak and its impact on the global economy.
U.S. policy credibility is essential in combating Beijing’s economic and political narratives and providing a lodestar for like-minded liberal and market-oriented democracies, particularly those within the Indo-Pacific who engage far more closely with China economically. A competing economic narrative and more effective public diplomacy to emphasize the hard-won success of market principles, policies, and reliable data will challenge Beijing’s external influence. Mimicking China’s strategies and state-driven approaches will not, instead risking reinforcing the perceived utility of interventionist policies.
But even as the credibility of China’s model shows cracks, there has been little to no coordinated U.S. response to defend an alternative. Defending market liberalism means investing at home—in education, research and development, innovation, and upgrades to degrading infrastructure—to ensure the U.S. system remains an attractive alternative. It also means exploring mechanisms to expand economic linkages via trade, supply chains, and investment with allies and like-minded nations, which will be more difficult to communicate effectively during a time when U.S. credibility has suffered following the virus outbreak. An approach focused on superficial issues such as blaming China for the Covid-19 outbreak within the text of a G-7 statement—as just one recent example—will not attract support among other market democracies.96 More consistent and multilaterally negotiated policy choices in defense of market-based responses to China’s industrial policies and their resulting distortions to global markets would be far more helpful in clarifying the consequences of China’s model.
Nowhere has this been more evident than in the contentious global debate over China’s response to Covid-19. China’s public messaging efforts have been focused not only on emphasizing China’s economic response as the first nation to emerge back to growth following the virus outbreak but also on downplaying news that the virus outbreak originated in China itself or that shipments of medical equipment from China were defective. Meanwhile, U.S. credibility has suffered considerably, as the virus has continued to spread in the absence of a nationwide strategy
96. John Hudson and Souad Mekhennet, “G-7 failed to agree on statement after U.S. insisted on calling coronavirus outbreak ‘Wuhan virus’,” Washington Post, March 25, 2020, https://www.washingtonpost.com/national-security/g-7-failed-to-agree-on-statement-after-us-insisted-on-calling-coronavirus-outbreak-wuhan-virus/2020/03/25/f2bc7a02-6ed3-11ea-96a0-df4c-5d9284af_story.html.

The China Economic Risk Matrix | 99
amid a cacophony of messages from senior officials and the dangerous politicization of a public health crisis. Beijing is most likely to face internal economic pressure when its own credibility falters within China’s financial markets in response to stress. To counter the narrative of China’s inevitable rise, the United States should redouble efforts to strengthen and maintain its own hard-won (and easily lost) policy credibility to defend a stronger position from which to highlight the links between the cracks in China’s financial system and the flaws in China’s economic model.

Wright, Gloudeman, and Rosen | 100
About the Authors
Logan Wright is director of China markets research at Rhodium Group, where he focuses on the impact of credit expansion on the Chinese financial system, China’s exchange rate policies, and the influence of the country on global currency and capital markets. He is well known for his views on China’s foreign assets and macroeconomic data. With almost two decades of professional experience analyzing China’s financial system, he monitors official institutions and real-time data closely to gauge implications for the banking system, real economy activity, and future policy directions. Dr. Wright holds a PhD from the George Washington University and a master’s in security studies and bachelor’s in foreign service from Georgetown University. He is based in Hong Kong, after living and working in Beijing for 14 years.
Lauren Gloudeman is associate director of the China Projects team at Rhodium Group, where she focuses on China’s trade dynamics, its economic reform agenda and implementation, and its macroeconomy and industrial activity. Previously, Lauren worked with the U.S.-China Economic and Security Review Commission, the Office of the U.S. Trade Representative in Beijing, and the Congressional-Executive Commission on China. She received a master’s degree in international economics and China Studies from the Johns Hopkins School of Advanced International Studies (SAIS) and the Hopkins-Nanjing Center, and a bachelor’s degree in philosophy and Chinese language from the University of Virginia.
Daniel H. Rosen is a founding partner of the Rhodium Group and leads the firm’s work on China and the world economy. Mr. Rosen’s specific client activities include analysis of China-U.S. policy dynamics, interpretation of Chinese economic data, and facilitation of meetings with senior Chinese officials, executives, and thought leaders both inside and outside China. His work contributes to client investment management, strategic planning, and policy assessment needs. Mr. Rosen is an adjunct associate professor at Columbia University, where he has taught a graduate seminar on the Chinese economy at the School of International and Public Affairs since 2001. From 2000 to 2001, Mr. Rosen was senior adviser for international economic policy at the White House National Economic Council and National Security Council, where he played a key role in completing China’s accession to the World Trade Organization and accompanied the president to Asia for summits and state visits. Mr. Rosen is a member of the Council on Foreign Relations and a board member of the National Committee for U.S.-China Relations.

The China Economic Risk Matrix | 101
Appendix to Chapter 2
Summary of Methodological CaveatsThis exercise is technical, complicated, and hampered by the shortcomings of China’s economic and financial system data. A number of assumptions were made throughout this approach that have uncertain impacts on the final result. First, the financial variables selected are assumed to contain the information needed about future instances of financial stress. There is obvious selection bias here, as this study deliberately diverges from traditional cross-country FSI approaches in variable selection but also makes qualitative assertions about which variables matter based on the authors’ professional experience monitoring China’s financial system.
Second, the approach assumes that the three “stress events” identified by date are representative of historical and future financial stress and instability in China and that future events would share some characteristics of co-movement in financial variables seen during those events in future. Ultimately, the only way to know is to test the FSI against future episodes of financial stress. Those possibilities will be discussed later in this report, particularly when discussing the impact of Covid-19 on growing stress within China’s financial system.
Table 2.1: Details of FSI VariablesSTRESS TYPE DESCRIPTION VARIABLE SERIES START FREQUENCY TRANSFORMATIONFunding Rates 7-day repo market
rate for banks and nonbanks
R007 1/2/2001 Daily 20dma
Funding Rates 7-day repo market rate for banks only
DR007 10/9/2006 Daily 20dma
Spread for banks vs other financial institutions
R007-DR007 Spread
10/9/2006 Daily spread only, no avg
Credit Stress Spread between China Devel-opment Bank 10-year bond yields and China government 10-year bond yields
CDB-CGB 10Y Spread
3/1/2006 Daily none

Wright, Gloudeman, and Rosen | 102
Credit Stress Yield spread for corporate bonds
Corp Bond 5Y Spread
4/22/2008 Daily Spread only, no avg
Funding Rates Shanghai inter-bank offering rate at 3M
SHIBOR 3M 10/9/2006 Daily 20dma
Funding Rates Shanghai Stock Exchange over-night repo rate
SSE Repo O/N 5/8/2006 Daily 20dma
FX Flows Change in USD-CNY exchange rate
Change in USD-CNY
1/16/2001 Daily 10day
FX Flows Difference be-tween Chinese yuan and offshore yuan
CNY-CNH Spread
8/23/2010 Daily 5dma
Funding Rates Difference be-tween interbank deposit 7-day rates and repo rates
Int. Dep. 7d vs. Repo
5/14/2009 Daily 10dma
Funding Rates Net injection of liquidity via PBOC open market operations
OMO Net 6/3/2002 Weekly Monthly avg
Credit Stress Risk spread between 5-year negotiable certif-icates of deposit yields
NCD 5Y Spread 10/9/2006 Daily Spread only
FX Flows Volume of daily FX trading
FX trading 1/1/2001 Monthly/daily, 10dma
From 2001-2014, use adjusted monthly fx settle-ment data; after, use reported daily FX trading
Credit Stress Bank asset growth Bank asset growth
1/1/2002 Monthly 12m rolling sum, yoy change
Source: Rhodium Group.
Technical Details on Model SpecificationTRAINING THE MODELRidge Regression Modeling was employed to derive coefficients between selected variables. This machine learning approach is similar to Ordinary Least Squares (OLS) regression, which seeks to minimize total error between predicted and observed values of the dependent variable. Unlike OLS, elastic net modeling does not seek to identify unbiased estimators, . Instead, it regularizes to maximize predictive accuracy, shrinking the magnitude of coefficients on estimators with less explanatory power.
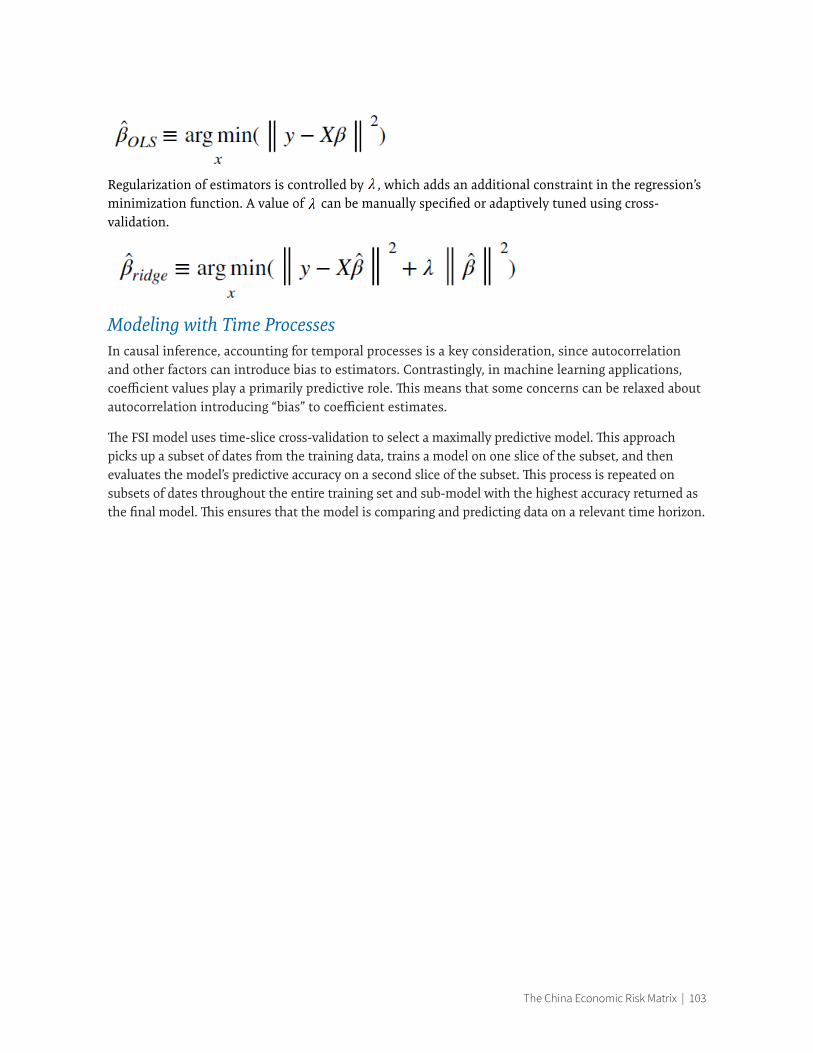
The China Economic Risk Matrix | 103
Regularization of estimators is controlled by , which adds an additional constraint in the regression’s minimization function. A value of can be manually specified or adaptively tuned using cross-validation.
Modeling with Time Processes In causal inference, accounting for temporal processes is a key consideration, since autocorrelation and other factors can introduce bias to estimators. Contrastingly, in machine learning applications, coefficient values play a primarily predictive role. This means that some concerns can be relaxed about autocorrelation introducing “bias” to coefficient estimates.
The FSI model uses time-slice cross-validation to select a maximally predictive model. This approach picks up a subset of dates from the training data, trains a model on one slice of the subset, and then evaluates the model’s predictive accuracy on a second slice of the subset. This process is repeated on subsets of dates throughout the entire training set and sub-model with the highest accuracy returned as the final model. This ensures that the model is comparing and predicting data on a relevant time horizon.
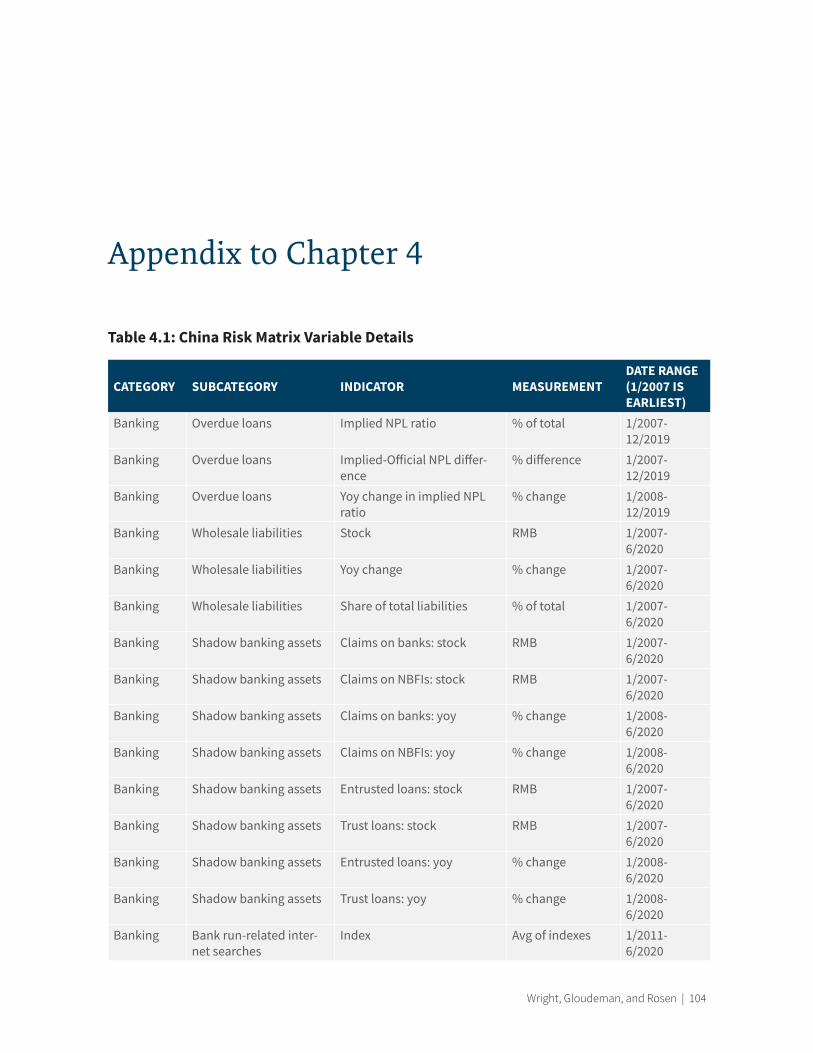
Wright, Gloudeman, and Rosen | 104
Appendix to Chapter 4
Table 4.1: China Risk Matrix Variable Details
CATEGORY SUBCATEGORY INDICATOR MEASUREMENTDATE RANGE (1/2007 IS EARLIEST)
Banking Overdue loans Implied NPL ratio % of total 1/2007-12/2019
Banking Overdue loans Implied-Official NPL differ-ence
% difference 1/2007-12/2019
Banking Overdue loans Yoy change in implied NPL ratio
% change 1/2008-12/2019
Banking Wholesale liabilities Stock RMB 1/2007-6/2020
Banking Wholesale liabilities Yoy change % change 1/2007-6/2020
Banking Wholesale liabilities Share of total liabilities % of total 1/2007-6/2020
Banking Shadow banking assets Claims on banks: stock RMB 1/2007-6/2020
Banking Shadow banking assets Claims on NBFIs: stock RMB 1/2007-6/2020
Banking Shadow banking assets Claims on banks: yoy % change 1/2008-6/2020
Banking Shadow banking assets Claims on NBFIs: yoy % change 1/2008-6/2020
Banking Shadow banking assets Entrusted loans: stock RMB 1/2007-6/2020
Banking Shadow banking assets Trust loans: stock RMB 1/2007-6/2020
Banking Shadow banking assets Entrusted loans: yoy % change 1/2008-6/2020
Banking Shadow banking assets Trust loans: yoy % change 1/2008-6/2020
Banking Bank run-related inter-net searches
Index Avg of indexes 1/2011-6/2020
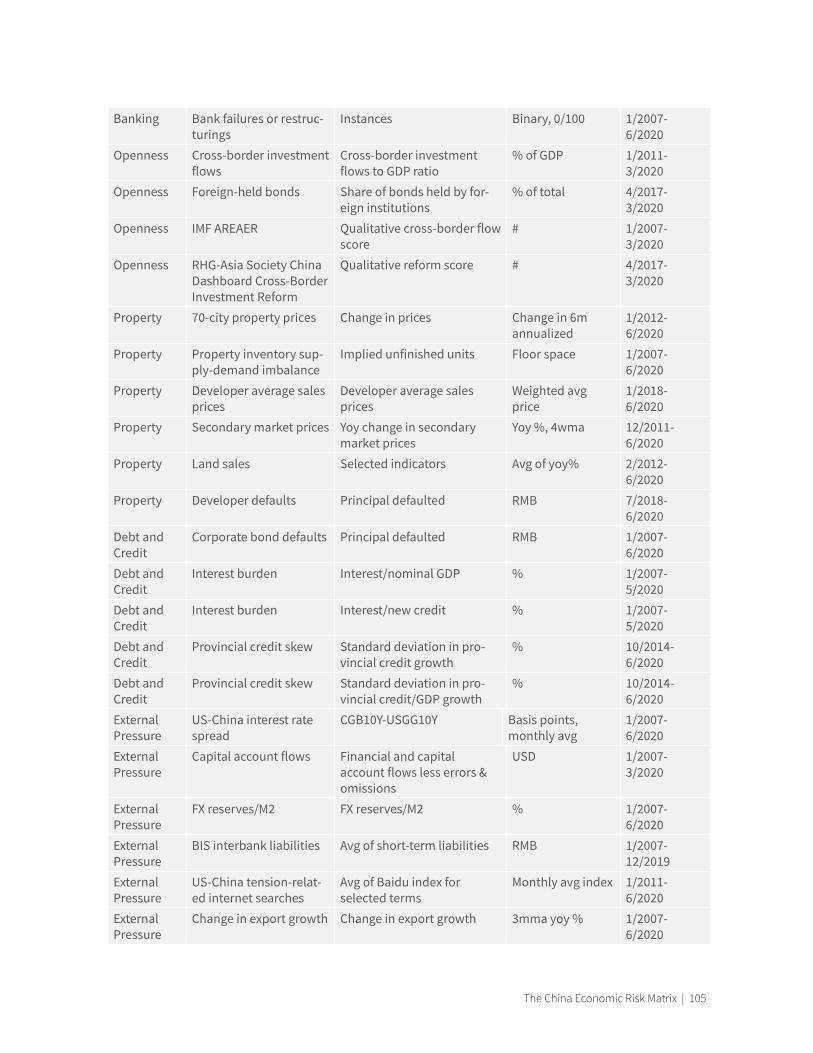
The China Economic Risk Matrix | 105
Banking Bank failures or restruc-turings
Instances Binary, 0/100 1/2007-6/2020
Openness Cross-border investment flows
Cross-border investment flows to GDP ratio
% of GDP 1/2011-3/2020
Openness Foreign-held bonds Share of bonds held by for-eign institutions
% of total 4/2017-3/2020
Openness IMF AREAER Qualitative cross-border flow score
# 1/2007-3/2020
Openness RHG-Asia Society China Dashboard Cross-Border Investment Reform
Qualitative reform score # 4/2017-3/2020
Property 70-city property prices Change in prices Change in 6m annualized
1/2012-6/2020
Property Property inventory sup-ply-demand imbalance
Implied unfinished units Floor space 1/2007-6/2020
Property Developer average sales prices
Developer average sales prices
Weighted avg price
1/2018-6/2020
Property Secondary market prices Yoy change in secondary market prices
Yoy %, 4wma 12/2011-6/2020
Property Land sales Selected indicators Avg of yoy% 2/2012-6/2020
Property Developer defaults Principal defaulted RMB 7/2018-6/2020
Debt and Credit
Corporate bond defaults Principal defaulted RMB 1/2007-6/2020
Debt and Credit
Interest burden Interest/nominal GDP % 1/2007-5/2020
Debt and Credit
Interest burden Interest/new credit % 1/2007-5/2020
Debt and Credit
Provincial credit skew Standard deviation in pro-vincial credit growth
% 10/2014-6/2020
Debt and Credit
Provincial credit skew Standard deviation in pro-vincial credit/GDP growth
% 10/2014-6/2020
External Pressure
US-China interest rate spread
CGB10Y-USGG10Y Basis points, monthly avg
1/2007-6/2020
External Pressure
Capital account flows Financial and capital account flows less errors & omissions
USD 1/2007-3/2020
External Pressure
FX reserves/M2 FX reserves/M2 % 1/2007-6/2020
External Pressure
BIS interbank liabilities Avg of short-term liabilities RMB 1/2007-12/2019
External Pressure
US-China tension-relat-ed internet searches
Avg of Baidu index for selected terms
Monthly avg index 1/2011-6/2020
External Pressure
Change in export growth Change in export growth 3mma yoy % 1/2007-6/2020

COVER PHOTO ADOBE STOCK
1616 Rhode Island Avenue NW Washington, DC 20036 202 887 0200 | www.csis.org