
Remaking American Power: Potential Energy Market...
78
A Report of the CSIS Energy and National Security Program and the Rhodium Group NOVEMBER 2014 AUTHORS John Larsen Sarah O. Ladislaw Whitney Ketchum Michelle Melton Shashank Mohan Trevor Houser Remaking American Power Potential Energy Market Impacts of EPA’s Proposed GHG Emission Performance Standards for Existing Electric Power Plants
Transcript of Remaking American Power: Potential Energy Market...
1616 Rhode Island Avenue NW| Washington DC 20036
t. (202) 887-0200 | f. (202) 775-3199 | www.csis.org
ROWMAN & LITTLEFIELD
Lanham • Boulder • New York • Toronto • Plymouth, UK
4501 Forbes Boulevard, Lanham, MD 20706
t. (800) 462-6420 | f. (301) 429-5749 | www.rowman.com
Cover photo: Shutterstock.com
A Report of the CSIS Energy and National Security Program and the Rhodium Group
NOVEMBER 2014
AUTHORS John LarsenSarah O. LadislawWhitney KetchumMichelle MeltonShashank MohanTrevor Houser
RemakingAmerican PowerPotential Energy Market Impacts of EPA’s Proposed
GHG Emission Performance Standards for Existing
Electric Power Plants
5 Columbus Circle | New York, NY 10019
t. 212-532-1157 | www.rhg.com
v*:+:!:+:!ISBN 978-1-4422-2866-5
Ë|xHSLEOCy228665z

Blank

Remaking American PowerPotential Energy Market Impacts of EPA’s Proposed GHG Emission Per for mance Standards for Existing Electric Power Plants
AUTHORS
John LarsenSarah O. LadislawWhitney KetchumMichelle MeltonShashank MohanTrevor Houser
A Report of the CSIS Energy and National Security Program and the Rhodium Group
November 2014
ROWMAN & LITTLEFIELDLanham • Boulder • New York • Toronto • Plymouth, UK

Center for Strategic & International Studies Rowman & Littlefi eld Rhodium Group
1616 Rhode Island Avenue, NW 4501 Forbes Boulevard 5 Columbus Circle
Washington, DC 20036 Lanham, MD 20706 New York, NY 10019
202- 887- 0200 | www .csis .org 301 -459 -3366 | www .rowman .com 212-532-1157 | www.rhg.com
About CSISFor over 50 years, the Center for Strategic and International Studies (CSIS) has worked to develop solutions to the world’s greatest policy challenges. Today, CSIS scholars are providing strategic insights and bipartisan policy solutions to help decisionmakers chart a course toward a better world.
CSIS is a nonprofi t or ga ni za tion headquartered in Washington, D.C. The Center’s 220 full- time staff and large network of affi liated scholars conduct research and analysis and develop policy initiatives that look into the future and anticipate change.
Founded at the height of the Cold War by David M. Abshire and Admiral Arleigh Burke, CSIS was dedicated to fi nding ways to sustain American prominence and prosperity as a force for good in the world. Since 1962, CSIS has become one of the world’s preeminent international institutions focused on defense and security; regional stability; and transnational challenges ranging from energy and climate to global health and economic integration.
Former U.S. senator Sam Nunn has chaired the CSIS Board of Trustees since 1999. Former deputy secretary of defense John J. Hamre became the Center’s president and chief executive offi cer in 2000.
CSIS does not take specifi c policy positions; accordingly, all views expressed herein should be understood to be solely those of the author(s).
About Rhodium GroupRhodium Group (RHG) combines policy experience, quantitative economic tools and on-the-ground research to analyze disruptive global trends. Our work supports the investment management, strategic planning and policy needs of clients in the fi nancial, corporate, non-profi t and government sectors. RHG principals have produced path breaking studies on China’s economic, social and political development, India’s emergence as a global player, advanced economy restructuring, global energy and natural resource market and policy dynamics, and cross-border investment. RHG has offi ces in New York, California and Washington, and associates in Shanghai and New Delhi.
© 2014 by the Center for Strategic and International Studies and the Rhodium Group. All rights reserved.
ISBN: 978- 1- 4422- 2866- 5 (pb); 978- 1- 4422- 2867- 2 (eBook)
| III
List of Acronyms iv
Defi nitions of Key Terms v
Ac know ledg ments vi
Executive Summary vii
1. Introduction 1
2. Background on the Clean Power Plan 4
3. Details of the Clean Power Plan 9
4. Analytic Approach 12
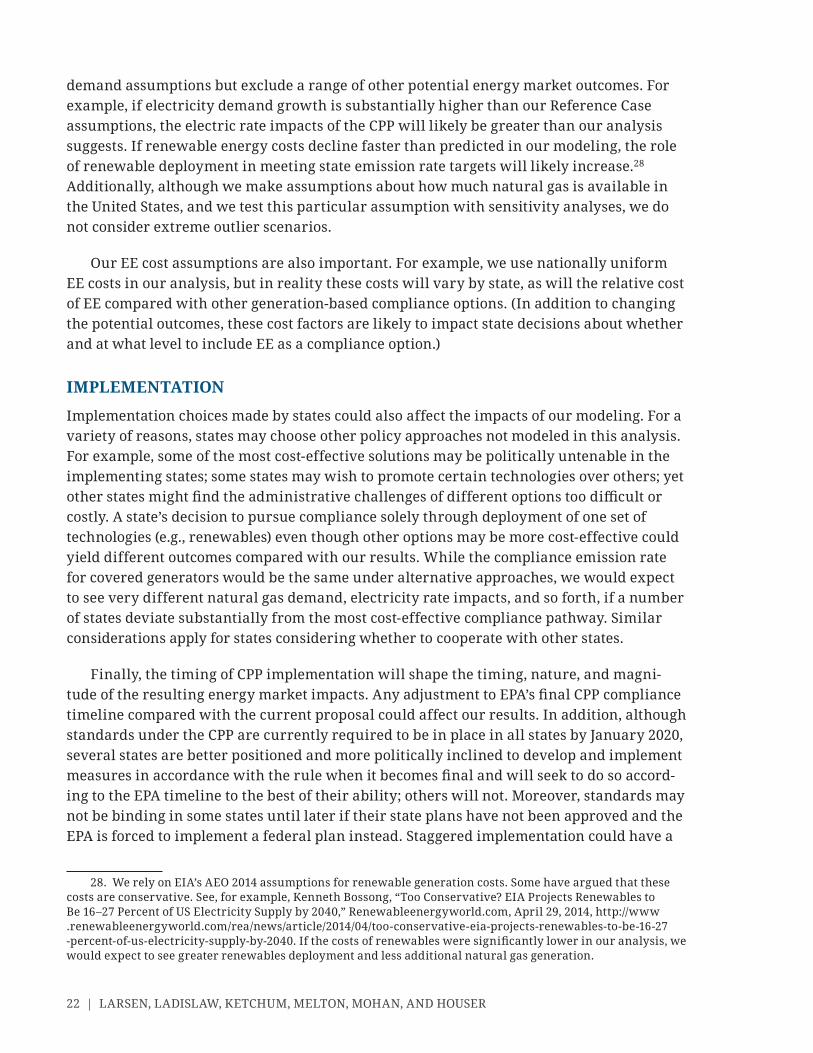
5. Key Findings 24
6. Conclusion 46
Appendix: Methodology 49
About the Authors 63
Contents
IV |
List of Acronyms
AEO Annual Energy OutlookBCF billion cubic feetBSER best system of emission reductionCAA Clean Air ActCCS carbon capture and sequestrationCO2 carbon dioxideCPP Clean Power PlanCT combustion turbineEE energy effi ciency (end- use effi ciency)EIA Energy Information AdministrationEMM Electricity Market Module (part of NEMS)EMV evaluation, mea sure ment, and verifi cationEPA Environmental Protection AgencyGHGs green house gaseslbs/MWh pounds per megawatt- hourIGCC integrated gasifi cation combined cycleINGAA Interstate Natural Gas Association of AmericaLNG liquefi ed natural gasMMBTU million British thermal unitsNEMS National Energy Modeling SystemNGCC natural gas combined cycleNSPS New Source Per for mance StandardsRGGI Regional Green house Gas InitiativeRHG- NEMS Rhodium Group– modifi ed version of NEMSRPS Renewable Portfolio StandardTCF trillion cubic feetTPS Tradable Per for mance StandardTSD technical support documentTWh terawatt- hours
| V
Abatement: A shorthand term used to refer to the amount of carbon dioxide emissions avoided relative to a reference case, for example by using lower emitting sources of electricity generation, greater effi ciency, or reduced demand.
Benefi t: A general term used to reference the fi nancial consequences of a par tic u lar policy or constraint, including decreases in energy expenditures or increases in fuel producer revenue.
Cost: A general term used to reference the fi nancial consequences of a par tic u lar policy or constraint, including increases in energy expenditures or decreases in fuel producer revenue.
Credit: Actions taken that both result in lower carbon dioxide emissions and count toward compliance under the Clean Power Plan are referred to as credited. The pro cess of deciding what actions count as credited can affect outcomes such as cost and abate-ment.
Energy Expenditures: The total cost of energy to consumers in all end- use sectors (resi-dential, commercial, industrial, and transportation). In other words, the sum of total consumption multiplied by price for each fuel by the sector in which it is consumed.
Electricity Expenditures: The total cost of electricity to consumers in all end- use sectors (residential, commercial, industrial, and transportation). In other words, total electric consumption multiplied by electricity rates.
Defi nitions of Key Terms
VI |
The CSIS Energy and National Security Program is a leader in understanding the shifting global and domestic energy landscape. Rhodium Group (RHG) is a research company that combines policy experience, quantitative economic tools, and on- the- ground research to analyze disruptive global trends, including in the energy sector. CSIS and RHG partnered to analyze the potential energy market impact of EPA’s proposed green house gas (GHG) emission per for mance standards for existing electric power plants, combining RHG’s quantitative analytical capabilities with CSIS’s policy insight and stakeholder convening ability.
CSIS and Rhodium Group are grateful for the invaluable assistance of Molly Walton. We would also like to thank our reviewers for providing comments that greatly strengthened the fi nal product: Erica Bowman, Bruce Phillips, Dan Steinberg, and other reviewers. Robert Nordhaus also provided invaluable comments on the legal issues surrounding 111(d). All errors that remain are our own.
Ac know ledg ments
| VII
On June 2, 2014, the Environmental Protection Agency (EPA) released its draft Clean Power Plan (CPP), a proposed rule to regulate carbon dioxide from the nation’s existing power generation facilities. As the central pillar of the Obama administration’s strategy for addressing climate change, the draft rule’s release was both highly anticipated and con-tentious.
This report seeks to help inform federal and state policymakers, energy producers, investors, and consumers about the potential impact of state and federal policy decisions associated with the Clean Power Plan as proposed. As policymakers, energy industry representatives, ratepayers, and regulators decide how to engage in the CPP pro cess in the months and years ahead, it is important that they understand the potential energy market impacts of policy design options and implementation choices. Our goal is to provide a balanced and mea sured set of quantitative estimates at the national and regional levels to inform ongoing policy deliberations both in Washington and in the states.
To that end, we model the draft CPP’s potential changes on both the electric power sector and energy markets more broadly. We assess how much generating capacity will likely retire, how much new capacity will be built, what changes will occur in the electric-ity generation mix, and what the resulting implications are for consumer energy bills and U.S. carbon dioxide (CO2) emissions. In addition to these “downstream” impacts, we assess the CPP’s “upstream” impacts as well, including potential changes in natural gas and coal production, price, and producer revenue at the national and regional levels.1
The major fi ndings of the study are as follows:
1. Implementation matters: State implementation decisions will determine the energy market and climate impacts of the CPP. Two extremely important design choices for states to make are the degree to which states cooperate in meeting the CPP’s CO2 emission targets and whether (and the extent to which) they rely on energy effi ciency to do so. Both design elements shape consumer costs at both a regional and national level. Interstate cooperation and energy effi ciency can substantially reduce
1. In this report, “downstream” refers to changes in energy consumption, such as changes in the national electric generation mix and consumer electric bills. “Upstream” refers to changes in energy production, such as coal mining and natural gas exploration and production.
Executive Summary
VIII | LARSEN, LADISLAW, KETCHUM, MELTON, MOHAN, AND HOUSER
impacts of the CPP on house hold and business energy bills, though energy effi ciency programs can also reduce overall emission reductions under the CPP.
2. Domestic shale gas helps make the proposed rule both more affordable and more effective. Because of relatively low- cost natural gas, we fi nd that the most cost- effective means of meeting CPP standards through changes in power generation is by switching from existing coal- fi red power plants to natural gas combined cycle (NGCC) plants. This is true across all policy design scenarios we model and remains true if shale gas resources are lower than currently expected and if liquefi ed natural gas (LNG) exports are higher than currently expected. This has signifi cant implica-tions for both coal and natural gas producers. Indeed, in economic terms, the upstream impacts of the CPP may well be of a bigger magnitude than the proposal’s downstream effects.
3. The CPP’s impact varies signifi cantly by region. Given regional differences in power generation, the CPP’s impact on electric power plants and electricity con-sumers varies signifi cantly across states. The upstream impacts are even more regionally heterogeneous and in some states signifi cantly larger than the down-stream effects. For example, a number of natural gas– producing states that poten-tially face the largest electricity price increases as a result of the CPP also stand to gain from an increase in natural gas demand nationwide. Yet these gains are highly sensitive to implementation design, both within and outside of state and regional boundaries.
4. CPP impacts in one region will be shaped both by state considerations and by implementation decisions made in other states. Because energy markets do not follow state lines, the impact of the CPP in one state will depend on implementation choices made in others. For example, including energy effi ciency crediting in state implementation plans could reduce consumer energy costs in the states in which those plans are adopted, but it could also affect coal and natural gas production revenue in other states. Likewise, the extent to which a state rich in renewable resources commercializes those resources will be shaped by the willingness of neighboring states to cooperate in developing implementation plans.
5. No matter which compliance options are chosen, new infrastructure is neces-sary to realize the benefi ts of the CPP in a cost- effective manner. The availability of electricity transmission lines and natural gas pipelines (including pipelines, gathering lines, pumping facilities, etc.) is necessary (though not suffi cient) for cost- effective CPP implementation. However, ensuring that there is adequate infra-structure to respond to CPP- driven changes in demand and supply will take plan-ning and investment to be realized; it is not automatic.
While natural gas offers a relatively low- cost means of achieving the CPP’s 2020– 2030 electric power sector emissions reduction targets, we recognize that there are concerns within the climate community about methane leakage in the natural gas production, transmission, and distribution system (not currently regulated by the EPA or covered by

REMAKING AMERICAN POWER | IX
the CPP)2 and the role of natural gas in the U.S. power sector beyond 2030. We do not dis-cuss these issues in the report, but we recognize that they are the subject of considerable interest and debate.
The June 2014 release of the CPP marked the beginning of a long pro cess that includes the gathering of and response to public comments, fi nalization of the rule, the development and approval of state implementation plans, inevitable legal challenges to the rule, and implementation. We recognize that the proposed rule analyzed in this report is likely to be different in many signifi cant ways from the rule as it is eventually implemented. Our goal is to help stakeholders more effectively participate in that pro cess by helping them better understand the potential energy market impacts of the CPP as it stands today.
2. Letter from a co ali tion of environmental organizations to President Barack Obama, September 18, 2014, http:// www .edf .org /sites /default /fi les /content /methane _ceo _sign -on _letter _fi nal .pdf .

| 1
1 Introduction
The U.S. energy sector is undergoing an unpre ce dented transition. Upstream, the combi-nation of hydraulic fracturing, horizontal drilling, and seismic imaging has unlocked
enormous quantities of natural gas from shale formations. Downstream, a diverse set of market, regulatory, and social trends are also reshaping electricity markets.1 Electricity demand growth is slowing, and regulatory and policy changes over the last several de cades have led to the rise of new market players and new market structures (e.g., merchant gen-erators, competitive wholesale markets, and the increasing regionalization of electric power markets).
Over the past couple of years, these upstream and downstream trends have converged as an increasingly competitive electric power sector responded to a shale- driven decline in natural gas prices by switching from coal to natural gas for power generation. And because natural gas emits less carbon dioxide (CO2) and other pollutants than coal when combusted, the upstream oil and gas revolution both shapes and is shaped by downstream environ-mental regulatory action. When analyzing the impact of such regulatory action, therefore, it is important to look beyond the electric power sector to understand the implications for the energy sector more broadly.
The most consequential environmental regulation affecting the electric power sector in the coming de cade is likely to be the U.S. Environmental Protection Agency’s (EPA) proposal to regulate CO2 emissions from existing fossil fuel– fi red electric power plants, released June 2, 2014.2 Once fi nalized and implemented— assuming it withstands legal challenges— the regulation, also known as the Clean Power Plan (CPP)— will affect power generators and market operators, fuel producers (e.g., natural gas and coal producers), and energy consumers for de cades to come.
Studies of EPA power sector green house gas (GHG) emission regulations have to date focused on the potential impact within the electric power sector itself.3 While providing
1. In this report, “downstream” refers to changes in energy consumption, such as changes in the national electric generation mix and consumer electric bills. “Upstream” refers to changes in energy production, such as coal mining and natural gas exploration and production.
2. EPA simultaneously released a proposal to regulate CO2 emissions from modifi ed power plants. We do not assess the impact of the proposed standard for modifi ed plants, and we expect the impact of that proposal to be minimal as proposed because it affects a very small number of sources. By comparison, the existing source proposal will affect just over half the total installed electric generating capacity in the United States.
3. See, for example, Clean Air Task Force, Power Switch: An Effective, Affordable Approach to Reducing Carbon Pollution from Existing Fossil- Fueled Power Plants (Washington, DC: Clean Air Task Force, 2014); and

2 | LARSEN, LADISLAW, KETCHUM, MELTON, MOHAN, AND HOUSER
important and useful information, these studies do not offer a complete picture of the energy sector consequences of the proposed rule. Potential changes in fossil fuel produc-tion, price, and revenue will play an important role in determining the regional economic impact of the proposed rule. Anticipating and preparing for these changes will be critical in making implementation as cost- effective as possible.
To assess both the upstream and downstream impacts of the CPP, we employed RHG- NEMS, a version of the National Energy Modeling System (NEMS) maintained by the Rho-dium Group (RHG). Developed by the Energy Information Administration (EIA) and used to produce the EIA’s Annual Energy Outlook (AEO),4 NEMS is a leading computer- based model-ing system used to project future energy supply, demand, and price conditions in the United States and to analyze the impact of macroeconomic, policy, market, or technology changes on those projections.5 As a comprehensive model of the U.S. energy system with detailed electric power sector and upstream oil, gas, and coal production repre sen ta tion, NEMS is particularly well suited to analyzing the broader energy market impact of the CPP. Although NEMS is a powerful tool that can be leveraged to assess a variety of policy- relevant questions, no model, NEMS included, provides a comprehensive assessment of all the issues related to the EPA proposal.
It is important to note that we model EPA’s proposed rule, which is subject to change as it goes through the federal rule- making pro cess. Once the rule is fi nal, moreover, the ultimate impact will depend a great deal on how states choose to meet the ultimate emis-sion per for mance targets set by EPA. Given the large amount of fl exibility EPA provides the states in the CPP, it is impossible to model each possible compliance pathway.
As a result, we crafted four policy scenarios (in addition to the Reference Case) that refl ect some of the most signifi cant implementation choices states will need to make. Spe-cifi cally, we model a tradable per for mance standard approach that allows generators to meet the emission rate goal at the least cost given different implementation decisions. While not exhaustive, we believe these scenarios do a reasonable job of bounding the range of potential energy system impacts of the current proposal. In addition, we include a handful of sensitivity analyses to test how different energy system assumptions might alter our results.
As noted above, the proposed rule is subject to revisions as EPA fi nalizes the CPP (taking account of public comment) and potentially by the courts. However, we believe it is impor-tant to provide analysis and to model the impacts at this early stage so that policymakers,
Daniel Lashof et al., Closing the Power Plan Carbon Pollution Loophole: Smart Ways the Clean Air Act Can Clean up America’s Biggest Climate Polluters (New York: Natural Resources Defense Council, March 2013). Other groups are also examining the proposed rule, including Resources for the Future and the Bipartisan Policy Council. Those reports are forthcoming.
4. U.S. Energy Information Administration, Annual Energy Outlook (Washington, DC: EIA, 2014), http:// www .eia .gov /forecasts /aeo /.
5. Documentation on the NEMS model is available online. Please see U.S. Energy Information Adminis-tration, “The National Energy Modeling System: An Overview,” October 2009, http:// www .eia .doe .gov /oiaf /aeo /overview /.

REMAKING AMERICAN POWER | 3
regulators, and the general public have a more complete picture of the proposal’s potential impact as they engage in the pro cess of commenting on the rule, understand how it will affect their region and state, and weigh the consequences of different design options. We hope that this deeper understanding will help states craft their optimal path forward.
We cover many but not all of the CPP’s potential electric power and energy market impacts in this analysis. We do not attempt to assess the CPP’s impact on other areas of interest for stakeholders, such as electricity system reliability, energy security, public health, technological innovation, the fi nancial solvency of electric generation asset own ers, fi scal implications for states resulting from changes in energy production, or the deploy-ment of distributed generation and/or microgrids.6 We also do not address legal issues that have been raised, which will undoubtedly be litigated.7
The report is structured as follows: We start with a brief background on the CPP. We then describe our analytical approach to conducting our assessment of the economic impacts of the proposal, as well as our core policy scenarios and sensitivities. Finally, we present and discuss national and regional results from our analysis and identify our conclusions. A full description of our methodological approach can be found in the appendix.
6. We also do not conduct a formal cost- benefi t analysis of the CPP. For a review of the potential costs and benefi ts, see U.S. Environmental Protection Agency, Regulatory Impact Analysis for the Proposed Carbon Pollu-tion Guidelines for Existing Power Plants and Emission Standards for Modifi ed and Reconstructed Power Plants (Washington, DC: EPA, June 2014), http:// www2 .epa .gov /sites /production /fi les /2014 -06 /documents /20140602ria -clean -power -plan .pdf .
7. For issues we are unable to address in this report, we provide references to other bodies of work that have dealt with one or more of these issues in greater detail. For more information, see http:// csis .org /program /remaking -american -power .

4 |
Background on the Clean Power Plan
On June 25, 2013, President Obama announced the Climate Action Plan, the fi rst compre-hensive U.S. plan for addressing climate change. GHGs, which include carbon dioxide,
methane, nitrous oxide, and fl uorinated gases, are key contributors to climate change. Because power plants are the largest single source of GHG emissions in the United States (32 percent of U.S. GHG emissions in 20121), President Obama made regulating GHG emis-sions from power plants a central pillar of the Climate Action Plan.2 The Climate Action Plan and a subsequent presidential memo directed EPA to issue rules that would limit CO2 emissions (the leading source of GHG emissions in the United States) from new and existing power plants under the authority of Section 111 of the Clean Air Act (CAA; see text box).3
EPA has been regulating CO2 emissions from various mobile and stationary sources since 2010, following a 2007 Supreme Court ruling that obligated EPA to regulate GHG emissions if it found that they posed a threat to public health and public welfare (EPA issued a so- called endangerment fi nding with regard to GHGs in 2010).4 EPA fi rst proposed to regulate CO2 emissions from power plants in 2012, when it issued a proposed rule, under Section 111(b) of the CAA, for new power plants (those not yet built).5 When the comment period closed on that proposal in June 2012, EPA had received a record 2.5 million com-ments. That proposed rule was never fi nalized.
At the president’s directive, EPA formally rescinded its previous proposal and issued a new proposal to set emission limits on new fossil fuel– fi red power plants on September 20,
1. U.S. Environmental Protection Agency, Inventory of U.S. Green house Gas Emissions and Sinks: 1990– 2012 (Washington, DC: EPA, 2014).
2. The three pillars include cutting carbon pollution in the United States, preparing the United States for the impacts of climate change, and leading international efforts to address global climate change.
3. Executive Offi ce of the President, The President’s Climate Action Plan, June 2013, http:// www .white house .gov /sites /default /fi les /image /president27sclimateactionplan .pdf. See also the implementation memo: Barack Obama, “Presidential Memorandum— Power Sector Carbon Pollution Standards,” June 25, 2013, http:// www .whitehouse .gov /the -press -offi ce /2013 /06 /25 /presidential -memorandum -power -sector -carbon -pollution -standards .
4. Massachusetts v. Environmental Protection Agency, 549 U.S. 497 (2007).5. “Standards of Per for mance for Green house Gas Emissions for New Stationary Sources: Electric Utility
Generating Units, Draft Rule,” Federal Register 77 (April 13, 2012): 22392– 22441, https:// www .federalregister .gov /articles /2012 /05 /04 /2012 -10825 /standards -of -performance -for -greenhouse -gas -emissions -for -new -stationary -sources -electric -utility .
2
REMAKING AMERICAN POWER | 5
Section 111 of the Clean Air Act
The Clean Air Act (CAA) of 1970 (as amended in 1977 and 1990) is a comprehensive law designed to control U.S. air pollution. The law gives EPA the authority to regu-late air pollutants by setting air quality standards and by setting emission stan-dards from major sources of pollution. Green house gases such as carbon dioxide are considered air pollutants under the CAA, and because EPA formally found that they endanger public health and welfare, EPA is undertaking to regulate major source categories of those emissions.
EPA’s principal authority to regulate green house gas emissions from stationary sources such as power plants is found in Section 111 of the CAA (42 U.S.C. § 7411). For the purposes of regulating green house gas emissions from power plants, there are two key subsections of Section 111.
Section 111(b) directs EPA to develop regulations that establish federal stan-dards of per for mance for new or modifi ed regulated stationary sources, in this case power plants. These are also known as New Source Per for mance Standards (NSPS). In the case of NSPS, permitting authorities (usually the states) have responsibility for enforcing the per for mance standards set by EPA.
Section 111 also stipulates that if a category of new stationary sources is regulated for a par tic u lar pollutant, then under Section 111(d) existing stationary sources in the same category must also be regulated under certain circumstances. If the pollut-ant is already regulated by another part of the CAA (such as Section 110 or 112), then existing stationary sources of that pollutant are not regulated again under Section 111. If, however, EPA sets out to regulate a category of new stationary sources of emissions and that pollutant is not regulated under Sections 110 or 112 of the CAA, EPA must regulate existing stationary sources of that pollutant under Section 111(d).* Carbon dioxide from power plants is not regulated under other stationary source provisions of the CAA— and therefore regulating carbon dioxide from new power plants requires EPA to regulate existing power plants as well.
The vast majority of pollutants and stationary sources are regulated by other sections of the CAA, and therefore EPA has exercised its authority under Section 111(d) only a handful of times over the past 40 years.
Unlike under the 111(b) provision, EPA does not set standards of per for mance for existing power plants under Section 111(d). Instead, EPA is required to set
* Under one reading of Section 111(d), as amended in 1990, if a source category (such as power plants) is regulated under Section 112 of the act, then that category is excluded from regulation under 111(d) even if a pollutant it emits is unregulated under other provisions of the act. Under this reading, power plants, which are now regulated under Section 112, would be exempt from 111(d). This interpretation is likely to be the basis of litigation.

6 | LARSEN, LADISLAW, KETCHUM, MELTON, MOHAN, AND HOUSER
mandatory guidelines that states must follow when setting their own standards of per for mance. A state’s plan for implementing the mandatory guidelines must be approved by EPA.
In setting these guidelines, EPA identifi es the emission level that existing sources within a state must meet in order for a state plan to obtain EPA approval, called an “emission guideline.” The guideline must refl ect “the degree of emission reduction achievable through the application of the best system of emission reduction” that EPA determines has been adequately demonstrated. In setting the “best system of emis-sion reduction” (BSER), EPA must take into account cost, energy needs, and other factors. In other words, EPA must determine what constitutes the best achievable, cost- effective emission reduction system that has been adequately demonstrated. EPA uses the guideline to set what it considers the minimum achievable emission reduc-tions and uses this (among other factors, such as whether the standards are enforce-able and whether the state followed certain procedural requirements) to evaluate state plans. As part of their plans, states establish the standard of per for mance, taking into account the BSER established by the EPA. If the state fails to submit a satisfactory plan, EPA must prescribe and enforce a federal plan for the state.
Because the language contained in Section 111(d) is broad and EPA has exercised its authority just a handful of times, the agency has used considerable discretion in interpreting how to set the BSER and the resulting emission guideline in its pro-posed rule regulating carbon dioxide from existing power plants. Among stakehold-ers and legal experts, there is no consensus about the scope of EPA’s 111(d) authority (including whether EPA has any authority at all to regulate power plants under Section 111(d)), what EPA can legally consider as part of determining BSER for reducing emissions from existing power plants (indeed, how much leeway EPA has to defi ne what constitutes “best” and “system”), and in turn how stringent and fl exible EPA’s guidelines and the states’ standards should be.
2013.6 EPA is currently reviewing comments on that proposed rule. Assuming it meets all statutory deadlines, EPA is expected to fi nalize the rule for new power plants no later than January 7, 2015.7
6. “Standards of Per for mance for Green house Gas Emissions from New Stationary Sources: Electric Utility Generating Units, Draft Rule,” Federal Register 79 (January 8, 2014): 1429– 1519, https:// www .federalregister .gov /articles /2014 /01 /08 /2013 -28668 /standards -of -performance -for -greenhouse -gas -emissions -from -new -stationary -sources -electric -utility. The draft proposal requires new fossil steam and integrated gasifi cation combined cycle (IGCC) coal plants to meet a maximum annual average emission rate of 1,100 pounds per megawatt- hour(lbs /MWh), which would almost certainly require the application of partial carbon capture and sequestration (CCS). The proposal also sets maximum annual average emission rates of 1,100 lbs/MWh and 1,000 lbs/MWh for small and large combustion turbine (including natural gas combined cycle units) generators, respectively.
7. This deadline is calculated on the basis of the CAA requirement that proposed NSPS be fi nalized no later than one year after the proposal is published in the Federal Register.
REMAKING AMERICAN POWER | 7
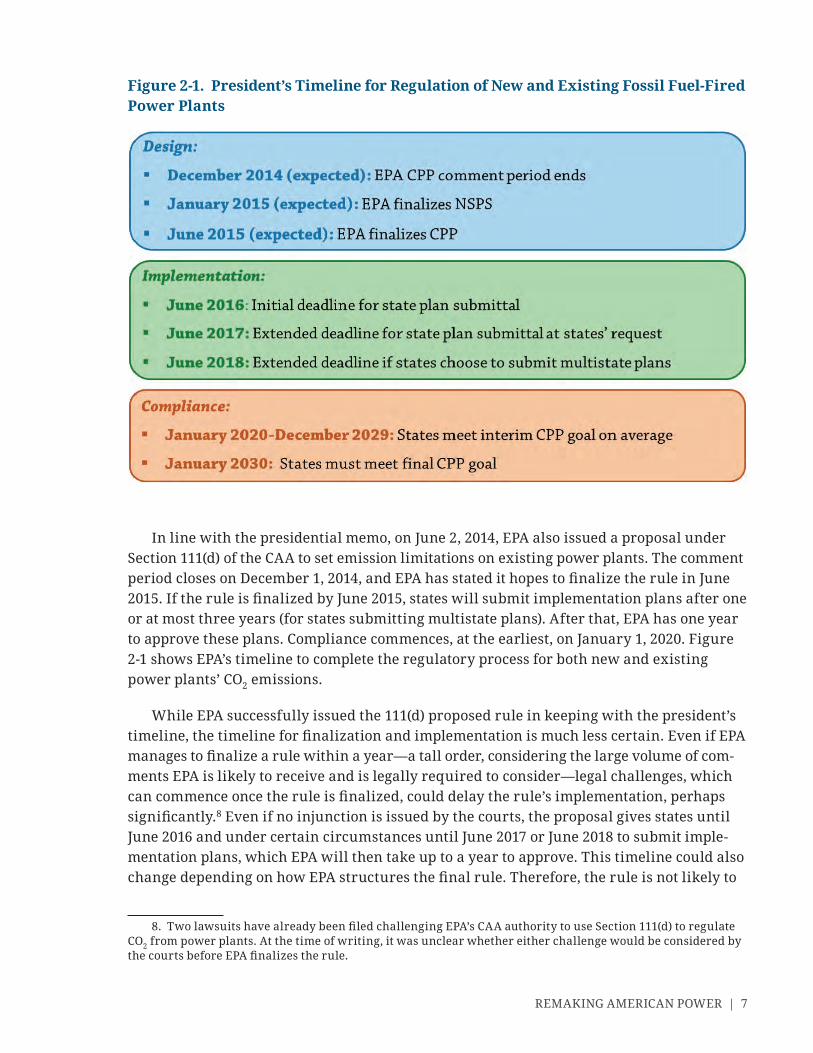
In line with the presidential memo, on June 2, 2014, EPA also issued a proposal under Section 111(d) of the CAA to set emission limitations on existing power plants. The comment period closes on December 1, 2014, and EPA has stated it hopes to fi nalize the rule in June 2015. If the rule is fi nalized by June 2015, states will submit implementation plans after one or at most three years (for states submitting multistate plans). After that, EPA has one year to approve these plans. Compliance commences, at the earliest, on January 1, 2020. Figure 2- 1 shows EPA’s timeline to complete the regulatory pro cess for both new and existing power plants’ CO2 emissions.
While EPA successfully issued the 111(d) proposed rule in keeping with the president’s timeline, the timeline for fi nalization and implementation is much less certain. Even if EPA manages to fi nalize a rule within a year— a tall order, considering the large volume of com-ments EPA is likely to receive and is legally required to consider— legal challenges, which can commence once the rule is fi nalized, could delay the rule’s implementation, perhaps signifi cantly.8 Even if no injunction is issued by the courts, the proposal gives states until June 2016 and under certain circumstances until June 2017 or June 2018 to submit imple-mentation plans, which EPA will then take up to a year to approve. This timeline could also change depending on how EPA structures the fi nal rule. Therefore, the rule is not likely to
8. Two lawsuits have already been fi led challenging EPA’s CAA authority to use Section 111(d) to regulate CO2 from power plants. At the time of writing, it was unclear whether either challenge would be considered by the courts before EPA fi nalizes the rule.
Figure 2- 1. President’s Timeline for Regulation of New and Existing Fossil Fuel- Fired Power Plants

8 | LARSEN, LADISLAW, KETCHUM, MELTON, MOHAN, AND HOUSER
be implemented by all states until 2019 at the earliest, assuming that legal challenges or other issues do not further delay implementation. While it is impossible to know what the ultimate timeline might be, it is important to note that any delays could alter the energy sector impacts identifi ed in this report.
| 9
Details of the Clean Power Plan
EPA’s proposal directs states to design and implement plans that put enforceable CO2 emission standards on existing fossil fuel– fi red power plants (including coal steam
units, oil steam units, gas steam units, and NGCC units) on the basis of EPA’s emission guidelines.1 EPA has set two emission rate (amount of CO2 emitted, denominated in pounds per megawatt hour) goals that each state must meet.2 The fi rst must be achieved, on average, between 2020 and 2029. The second, fi nal emission rate must be met by 2030 and each year thereafter. For example, under the current draft proposal, Texas has to meet a goal of 853 pounds of CO2 per megawatt hour on average between 2020 and 2029 and 791 pounds of CO2 per megawatt hour in 2030 and every year thereafter. However, EPA is silent regarding the possibility of implementing more stringent emission rate goals after 2030.
When EPA sets a new emission standard for a stationary source under the CAA, it must determine the “degree of emission limitation achievable through the best system of emis-sion reduction which (taking into account the cost of achieving such reduction and any non- air quality health and environmental impact and energy requirements) the [EPA] Administrator determines has been adequately demonstrated.” This “best system of emis-sion reduction” is commonly referred to as BSER. In its CPP proposal, EPA has concluded that the BSER comprises a host of cost- effective actions that plant owner- operators, states, and other actors can take to reduce CO2 emissions from covered sources. In the current draft version of the CPP, BSER is composed of four building blocks: (1) effi ciency gains at the individual power plant; (2) redispatch of generation from coal plants to existing natu-ral gas plants; (3) shifting generation away from existing fossil generating units to renew-ables or nuclear power; and (4) end- use energy effi ciency.3
1. Specifi cally, covered power plants include any power plant in operation or under construction as of January 8, 2014, that is capable of combusting at least 250 million British thermal units per hour and that relies on fossil fuels for more than 10 percent of total heat input and sells at least 30 percent of its potential electric output to the grid.
2. According to the CPP proposal, the 2030 goal refl ects the level of per for mance EPA has determined each state can achieve by that year and that can be maintained for each year thereafter. The 2020– 2029 interim goal provides more fl exibility (through averaging over the 10- year interim time period), refl ecting a phase- in period leading up to the 2030 goal.
3. In terms of renewables, shifting generation to both existing and new renewables can count toward compliance. However, existing hydropower does not count toward compliance, and only 6 percent of existing nuclear generation can count as part of a compliance plan. Both new nuclear and any new renewables (includ-ing new hydropower) can count under the draft proposal.
3
10 | LARSEN, LADISLAW, KETCHUM, MELTON, MOHAN, AND HOUSER
In order to set the state- specifi c emission rate guidelines, EPA applied its BSER determi-nation to each state, taking into account each state’s fl eet of existing plants covered by the rule and availability of cost- effective emissions reductions from each of the four building blocks.4 EPA calculated the level of reductions in emission rates achievable from each state’s existing fossil generation fl eet under each of the four building blocks and then added the total emissions reductions from each building block to get the total rate stan-dard.5 The product is a state- specifi c emission rate per for mance level that existing fossil fuel power plants across the state must meet on a fl eetwide basis.6 The emission rate is an annual average across a state’s entire covered fossil fl eet; it need not be met by each indi-vidual fossil unit in a state.
As implementers of the actual per for mance standards on existing power plants, states also have enormous fl exibility and discretion in setting enforceable standards of per for-mance and choosing how to achieve the emission reductions. In its proposed rule, EPA is agnostic as to which policies states should pursue to meet the required per for mance levels and has not directed states to take any one par tic u lar action or deploy any specifi c technol-ogy. States can use some, all, or none of EPA’s proposed building blocks. If the state chooses to meet its rate standard entirely through demand- side energy effi ciency and deployment of renewable resources, it is allowed to do so. Alternatively, a state could meet the goals by expanding its fuel- switching from coal to gas. EPA has signaled that it is open to essentially any steps that states take, as long as their plans meet EPA specifi cations for stringency (meaning the covered power plant fl eet in the state meets the per for mance level on aver-age), enforceability, and other procedural metrics.
In addition to fl exibility in terms of how states can meet their assigned per for mance levels, the CPP also includes the option for states to cooperate with any other state(s) they choose and will allow states to submit multistate compliance plans. Under the CPP, states may jointly submit a multistate plan that imposes consistent standards across the com-bined multistate jurisdiction.7 In practice, this requires an adjustment to the assigned state per for mances levels by calculating a weighted average emission standard based on the relative amounts of covered generation in each state. The result is a single standard that applies to all covered generators across the multistate footprint.
4. EPA used state level power plant data for the year 2012 in determining per for mance levels. This is the most recent year for which comprehensive data are available.
5. For example, EPA assumed that existing coal plants could improve overall plant effi ciency by 6 percent and that NGCC plants within a state could run at a maximum 70 percent capacity factor with the associated generation displacing generation from coal plants within the same state.
6. EPA’s use of a rate- based standard means that total state CO2 emissions could go up if electricity demand increases. This is unlike a mass- based standard, which would set a total cap on emissions from covered sources. EPA has offered states the option to convert the standard from a rate- to a mass- based standard.
7. For more detail, please see U.S. Environmental Protection Agency, Offi ce of Air and Radiation, State Plan Considerations: Technical Support Document for Carbon Pollution Guidelines for Existing Power Plants: Emission Guidelines for Green house Gas Emissions from Existing Stationary Sources: Electric Utility Generating Units (Washington, DC: EPA, June 2014), http:// www2 .epa .gov /carbon -pollution -standards /clean -power -plan -proposed -rule -state -plan -considerations .

REMAKING AMERICAN POWER | 11
Cooperation across states allows for regulatory consistency across a broader share of the U.S. power generation fl eet and expands the number and diversity of abatement options available to covered generating units, lowering the costs of compliance overall. Some states, such as members of the Northeast Regional Green house Gas Initiative (RGGI), already cooperate in multistate CO2 reduction programs.8 Under the CPP, multistate cooperation is not required, although EPA has proposed giving states pursuing this option more time to submit an implementation plan. There are no restrictions in the CPP as to which states may or may not cooperate with each other.
8. For more information, see Regional Green house Gas Initiative, “Regional Green house Gas Initiative: An Initiative of the Northeast and the Mid- Atlantic States of the U.S.,” www .rggi .org .
12 |
Analytical Approach
As mentioned in the Introduction, we employ a modifi ed version of the NEMS model (RHG- NEMS) to analyze the potential energy market impact of the CPP. The model’s
broad scope of coverage allows us to capture the impacts on both the electric power system directly and energy markets more widely, including upstream fossil fuel production and nonelectricity downstream sectors. RHG- NEMS includes modifi cations to the EIA’s version of NEMS that enable assessment of emission rate- based tradable per for mance standards (see the appendix for technical details on the model).
Compliance PathwaysAs already noted, while EPA set out specifi c emission guidelines for states, it did not pre-scribe a specifi c policy to achieve those targets. States have enormous fl exibility in select-ing compliance options, and they may pursue virtually any compliance pathway that establishes enforceable standards that meet or exceed their respective rate targets. Al-though there are many possible pathways toward compliance, all of them fall into three general categories: (1) market- based emission rate- based options; (2) market- based mass- based options; or (3) a portfolio approach.
Under the fi rst category, states could implement tradable per for mance standards (TPS) based on the emissions intensity of generation. Under such a system, higher carbon- intensity generators (such as coal units) would buy compliance credits from lower carbon- intensity generators (such as renewables or NGCC) to meet an emission rate goal on average across their generation fl eets (within a compliance jurisdiction, whether state or multistate). This approach does not put a hard ceiling on total CO2 emissions, allowing overall emissions to rise through greater electricity demand as long as the emission rate meets the target. This is the option we have modeled.
States could instead choose to translate emission rate goals into mass- based emission caps. Under such a program, the total CO2 emissions from regulated sources (in the case of the CPP, fossil fuel generators) within a given territory are capped at a specifi c level and reduced over time. Covered generators must hold allowances for each ton of CO2 they emit, with the total supply of allowances equaling the emission cap. How these allowances are distributed and priced is up to the states. This approach is the same one that has been used
4

REMAKING AMERICAN POWER | 13
in existing CO2 regulatory programs in California and the Northeast as well as other fed-eral programs in place to reduce criteria pollutants.1
A third general approach to reducing CO2 emissions is what EPA has called a “portfo-lio approach.” Under this approach, states can use one or more energy policies, such as a Renewable Portfolio Standard (RPS) or Energy Effi ciency Resource Standard, to meet their assigned goal (notably, this goal could be either a mass- based goal or a rate- based goal). States could also use integrated resource plan pro cesses commonly used by public utility commissions to determine what actions a utility will need to take to contribute to meet the state’s assigned goal. Any number of additional policies other than a mass- based or rate- based emission standard could also fall into this category (e.g., mandatory retire-ment of fossil plants over a certain age, subsidies for renewable or nuclear deployment, building codes).2 Under a portfolio approach, states could choose to meet their emission rate goal or translate the goal into a mass- based goal, but the defi ning difference is that decisions about generation are made under more or less comprehensive plans from the state, not by the market.3
The decision about which of the three broad pathways states choose to follow will shape the cost, abatement, and fuel mix impacts of the CPP. Which pathways states choose will be informed by state- level priorities, existing programs, policies, and regula-tory structures, a state’s natural resource endowments, and public sentiment, among other factors.
The CPP’s implementation fl exibility, while useful for the states, is diffi cult to model because of the uncertainty about which of the three types of compliance pathways states will adopt, much less the specifi c compliance tools under each rubric. For example, it is impossible to know which states (if any) will choose to include energy effi ciency (or how much and what kind of effi ciency they will credit) as part of their plan. Likewise, whether states will choose to pursue multistate compliance plans (and if so, which states will band together to do so) is also unknown. Finally, states have power to decide what approach to take in setting enforceable standards, and which approach each state will ultimately pursue will remain unclear for some time.
1. See, for example, California Environmental Protection Agency Air Resources Board, “Cap and Trade Program,” http:// www .arb .ca .gov /cc /capandtrade /capandtrade .htm; and U.S. Environmental Protection Agency, “Acid Rain Program,” http:// www .epa .gov /airmarkets /progsregs /arp /basic .html .
2. If states want to prioritize deployment of a par tic u lar technology or set of technologies (such as renewables or nuclear power) to meet their assigned goal, the portfolio approach allows them to do so. Given that the other approaches are broad and market- based, there is no guarantee under the rate- based and mass- based approaches that a par tic u lar technology (e.g., renewables or nuclear) will be deployed at a specifi c level.
3. For a more complete discussion of the various pathways states can take to implement the CPP, see U.S. Environmental Protection Agency, Offi ce of Air and Radiation, State Plan Considerations: Technical Support Document for Carbon Pollution Guidelines for Existing Power Plants: Emission Guidelines for Green-house Gas Emissions from Existing Stationary Sources: Electric Utility Generating Units (Washington, DC: EPA, June 2014), http:// www2 .epa .gov /carbon -pollution -standards /clean -power -plan -proposed -rule -state -plan -considerations .
14 | LARSEN, LADISLAW, KETCHUM, MELTON, MOHAN, AND HOUSER
Building Blocks in RHG-NEMSAlthough EPA relied on its four building blocks to establish state- specifi c targets (see Chapter 3), the proposal does not require states to use all four building blocks to meet their targets. It also does not prohibit states from relying on other options for reducing emissions from existing fossil plants that were not included in the building block approach, such as carbon capture and sequestration (CCS) retrofi ts or displacement of coal generation with new NGCC generation.4 Of the four building blocks considered in EPA’s proposal, RHG- NEMS easily accommodates two of them: (1) shifting generation from existing coal to existing natural gas generators and (2) increasing generation from zero- emitting (nuclear and renewable) generators. It is important to note, however, that RHG- NEMS is confi gured to allow only electric power– sector generators (supply- side options) to contribute toward compliance with the EPA targets. This means that distributed generation (such as rooftop solar photovoltaic and combined heat and power) do not directly contribute toward meet-ing state goals in our analysis.5
The building block dealing with effi ciency is more diffi cult to model using RHG- NEMS. We represented the demand- side energy effi ciency building block by imposing a fi xed amount of energy effi ciency savings in the model and then telling the model to (exog-enously) credit this “mandatory” energy effi ciency as one of the compliance options (see text box on EE crediting). Heat rate improvements at existing coal- fi red power plants are not explicitly represented as a compliance option, though the effect of not including this option is probably small.6
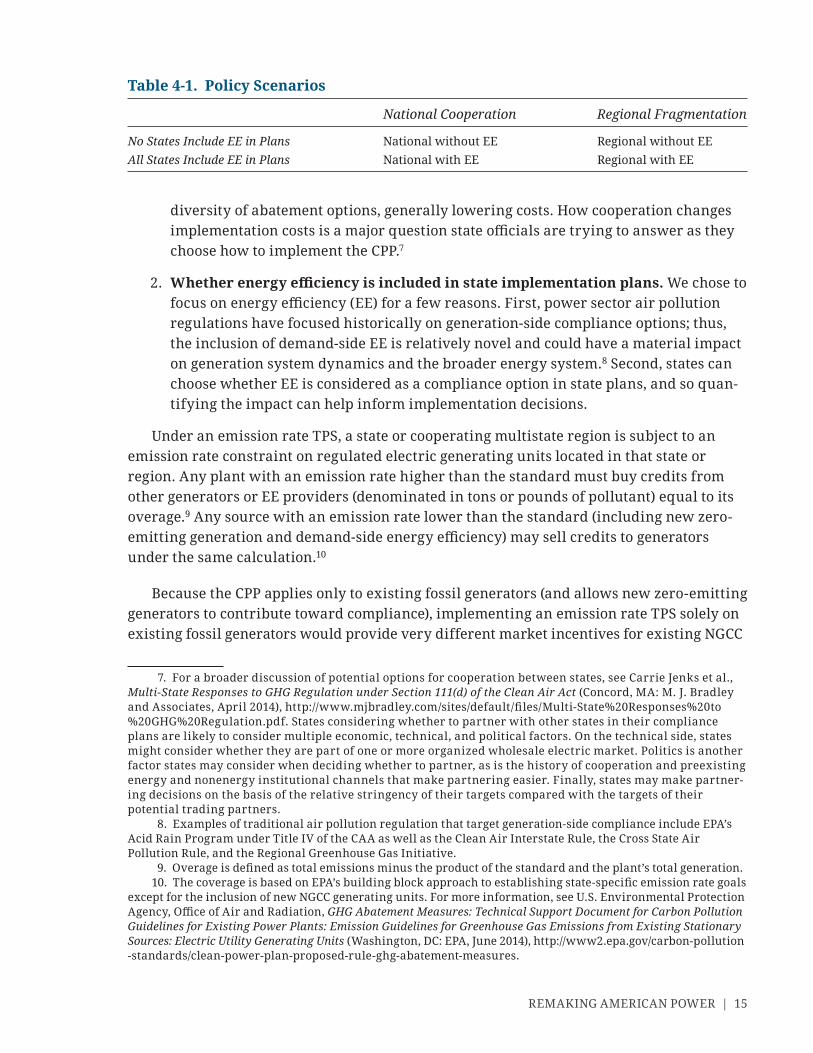
ScenariosAll policy scenarios used in this analysis employ an emission rate- based TPS. We use a TPS because it allows us to evaluate the least- cost pathway to achieve the emission rate goal specifi ed by EPA and because it requires the least additional speculation about policy and implementation choices. To help stakeholders begin to evaluate the potential impact of the CPP, we have selected a set of four implementation scenarios (see Table 4- 1) that focus on two important state- level design decisions:
1. The level of cooperation between states. We focus on cooperation as one of the key design elements because broader compliance markets provide states with greater
4. CCS retrofi tting of existing coal plants is a compliance option in RHG- NEMS, as is displacing existing fossil generation with generation from new fossil generators.
5. The CPP does contemplate allowing distributed generation, in par tic u lar renewable generation, to count toward compliance with the standard, but model limitations prevent us from doing the same in this analysis.
6. See Dallas Burtraw et al., “The Costs and Consequences of Clean Air Act Regulation of CO2 from Power Plants,” American Economic Review: Papers & Proceedings 104, no. 5 (May 2014): 557– 562. This study used an electric power system model to assess the impacts of a variety of CO2 reduction policies in the electric power sector and included existing coal plant heat rate improvements as a compliance option. The authors found that coal- to- gas switching was the primary compliance pathway for meeting an emission rate standard such as the ones established in EPA’s CPP proposal. Heat rate improvements played a minimal role.
REMAKING AMERICAN POWER | 15
diversity of abatement options, generally lowering costs. How cooperation changes implementation costs is a major question state offi cials are trying to answer as they choose how to implement the CPP.7
2. Whether energy effi ciency is included in state implementation plans. We chose to focus on energy effi ciency (EE) for a few reasons. First, power sector air pollution regulations have focused historically on generation- side compliance options; thus, the inclusion of demand- side EE is relatively novel and could have a material impact on generation system dynamics and the broader energy system.8 Second, states can choose whether EE is considered as a compliance option in state plans, and so quan-tifying the impact can help inform implementation decisions.
Under an emission rate TPS, a state or cooperating multistate region is subject to an emission rate constraint on regulated electric generating units located in that state or region. Any plant with an emission rate higher than the standard must buy credits from other generators or EE providers (denominated in tons or pounds of pollutant) equal to its overage.9 Any source with an emission rate lower than the standard (including new zero- emitting generation and demand- side energy effi ciency) may sell credits to generators under the same calculation.10
Because the CPP applies only to existing fossil generators (and allows new zero- emitting generators to contribute toward compliance), implementing an emission rate TPS solely on existing fossil generators would provide very different market incentives for existing NGCC
7. For a broader discussion of potential options for cooperation between states, see Carrie Jenks et al., Multi- State Responses to GHG Regulation under Section 111(d) of the Clean Air Act (Concord, MA: M. J. Bradley and Associates, April 2014), http:// www .mjbradley .com /sites /default /fi les /Multi -State %20Responses %20to %20GHG %20Regulation .pdf. States considering whether to partner with other states in their compliance plans are likely to consider multiple economic, technical, and po liti cal factors. On the technical side, states might consider whether they are part of one or more or ga nized wholesale electric market. Politics is another factor states may consider when deciding whether to partner, as is the history of cooperation and preexisting energy and nonenergy institutional channels that make partnering easier. Finally, states may make partner-ing decisions on the basis of the relative stringency of their targets compared with the targets of their potential trading partners.
8. Examples of traditional air pollution regulation that target generation- side compliance include EPA’s Acid Rain Program under Title IV of the CAA as well as the Clean Air Interstate Rule, the Cross State Air Pollution Rule, and the Regional Green house Gas Initiative.
9. Overage is defi ned as total emissions minus the product of the standard and the plant’s total generation.10. The coverage is based on EPA’s building block approach to establishing state- specifi c emission rate goals
except for the inclusion of new NGCC generating units. For more information, see U.S. Environmental Protection Agency, Offi ce of Air and Radiation, GHG Abatement Mea sures: Technical Support Document for Carbon Pollution Guidelines for Existing Power Plants: Emission Guidelines for Green house Gas Emissions from Existing Stationary Sources: Electric Utility Generating Units (Washington, DC: EPA, June 2014), http:// www2 .epa .gov /carbon -pollution -standards /clean -power -plan -proposed -rule -ghg -abatement -measures .
Table 4- 1. Policy Scenarios
National Cooperation Regional Fragmentation
No States Include EE in Plans National without EE Regional without EEAll States Include EE in Plans National with EE Regional with EE
16 | LARSEN, LADISLAW, KETCHUM, MELTON, MOHAN, AND HOUSER
generators as compared with new ones.11 We assume states would implement the CPP in such a way that provides the same market incentives to both new and existing generation to avoid unrealistic outcomes (for more information and discussion on this point, see the appendix).
We also assume that all existing RPSs, the Northeast RGGI cap- and- trade program, and California’s cap- and- trade program remain in place through the end of their currently defi ned targets (as they are treated in the AEO).12 In all of our scenarios, the CPP is the binding emission rate constraint in these regions after 2020.
In order to assess the impacts of each scenario, we mea sure them against a baseline “Reference Case” scenario. The Reference Case assumes that all policies currently in place remain in place and that there is no regulation of existing power plants.13 To create the Reference Case, we use EIA’s 2014 AEO Reference Case (AEO 2014), with one modifi cation: we include EPA’s proposed emission standards for CO2 from new power plants.14 Including these emission standards for new power plants in our Reference Case effectively prohibits the construction of any new coal plants unless they are equipped with CCS. Because the AEO 2014 Reference Case projects that fewer than 500 megawatts of new coal capacity without CCS will be built through 2040, this additional requirement does not fundamen-tally alter the AEO 2014 projections. In addition, although RHG- NEMS produces a forecast through 2040, we report results for the 2020– 2030 time frame given the focus of the EPA proposal (to 2030).
Differences between the Two Key Design DecisionsNATIONAL VERSUS REGIONAL SCENARIOS
The national and regional scenarios are based on different levels of trading between 22 regions.15 The 22 regions represent the major electricity market regions used in
11. Specifi cally, so long as the applicable emission rate goal is above the emission rate for NGCC units, then existing units would be incentivized to run more and generate compliance credits while new generators would not receive any incentive at all. This could effectively disincentivize new NGCC capacity additions, an outcome that most states would likely not pursue.
12. In the Reference Case, both California’s AB 32 and RGGI remain in place after 2020, but the stringency of those programs does not increase. In our policy cases, these programs transition to meeting EPA targets using tradable per for mance standards after 2020.
13. The AEO 2014 Reference Case is a scenario created by EIA to represent a set of technological and demographic conditions absent any major policy, price, resource, or other changes to the system.
14. While the inclusion of EPA’s NSPS proposal does not materially impact our Reference Case, we include it because EPA’s existing power plant regulations can be fi nalized only if EPA also fi nalizes per for mance standards for new sources. It is reasonable to expect that such rules on new sources will be in place (absent any successful legal challenge). NSPS is included in the Reference Case to avoid including the (minimal) impact of that rule in our existing source policy scenarios.
15. This analysis focuses on the lower 48 states. Although the CPP does cover Alaska and Hawaii, neither state’s electric power system is included in RHG- NEMS.
REMAKING AMERICAN POWER | 17
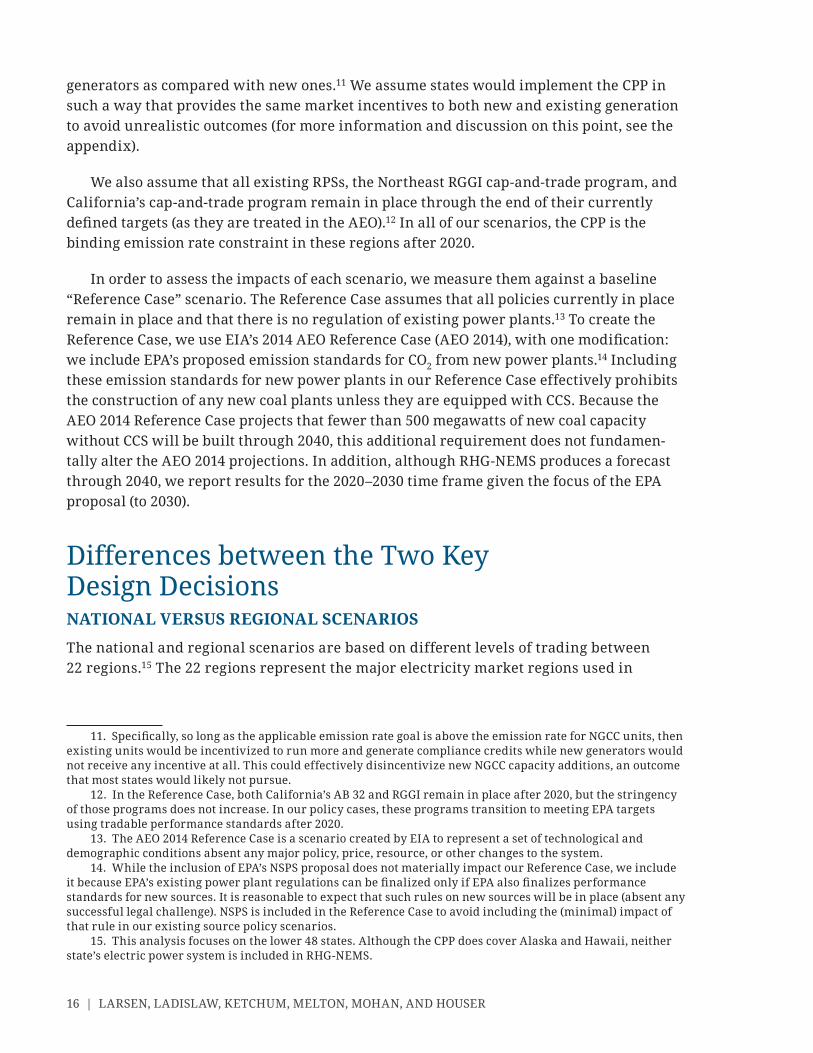
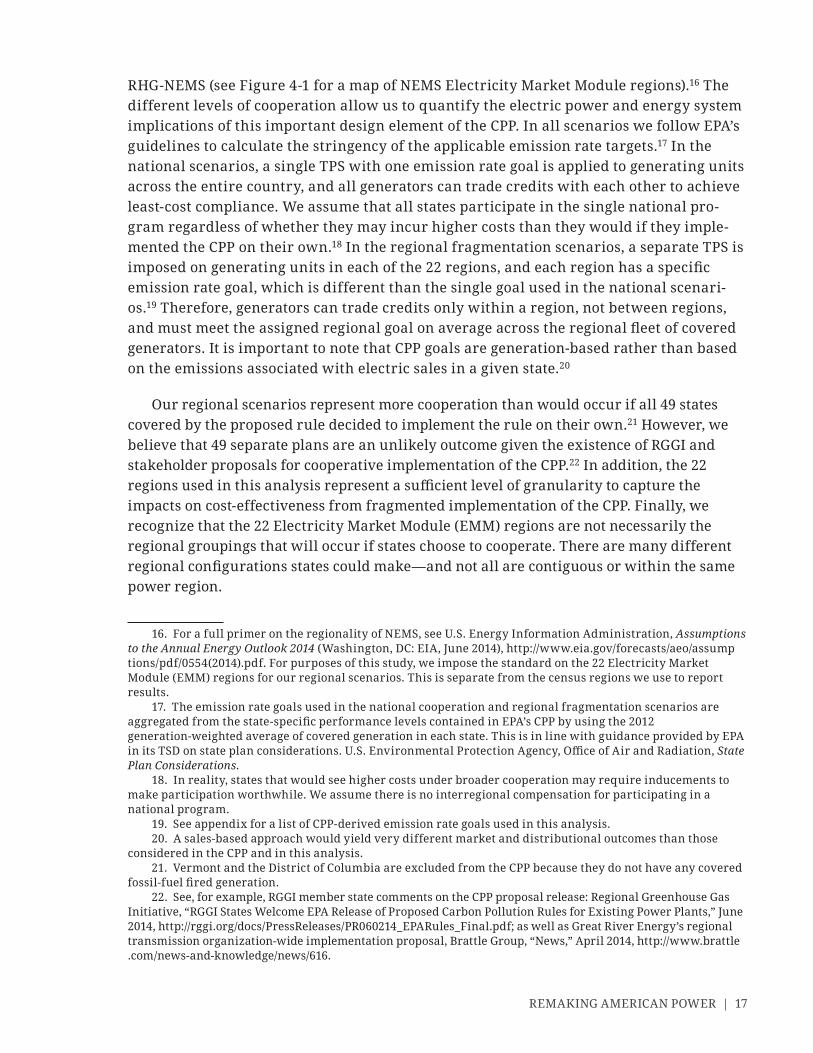
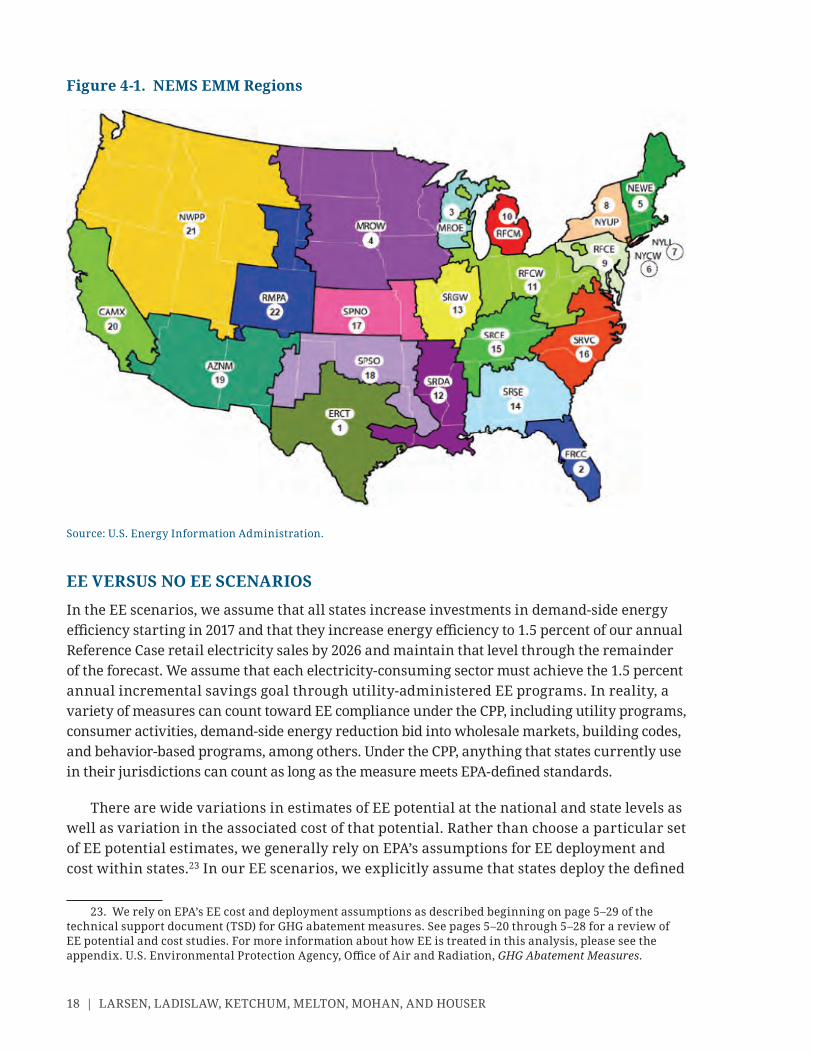
RHG- NEMS (see Figure 4-1 for a map of NEMS Electricity Market Module regions).16 The different levels of cooperation allow us to quantify the electric power and energy system implications of this important design element of the CPP. In all scenarios we follow EPA’s guidelines to calculate the stringency of the applicable emission rate targets.17 In the national scenarios, a single TPS with one emission rate goal is applied to generating units across the entire country, and all generators can trade credits with each other to achieve least- cost compliance. We assume that all states participate in the single national pro-gram regardless of whether they may incur higher costs than they would if they imple-mented the CPP on their own.18 In the regional fragmentation scenarios, a separate TPS is imposed on generating units in each of the 22 regions, and each region has a specifi c emission rate goal, which is different than the single goal used in the national scenari-os.19 Therefore, generators can trade credits only within a region, not between regions, and must meet the assigned regional goal on average across the regional fl eet of covered generators. It is important to note that CPP goals are generation- based rather than based on the emissions associated with electric sales in a given state.20
Our regional scenarios represent more cooperation than would occur if all 49 states covered by the proposed rule decided to implement the rule on their own.21 However, we believe that 49 separate plans are an unlikely outcome given the existence of RGGI and stakeholder proposals for cooperative implementation of the CPP.22 In addition, the 22 regions used in this analysis represent a suffi cient level of granularity to capture the impacts on cost- effectiveness from fragmented implementation of the CPP. Finally, we recognize that the 22 Electricity Market Module (EMM) regions are not necessarily the regional groupings that will occur if states choose to cooperate. There are many different regional confi gurations states could make— and not all are contiguous or within the same power region.
16. For a full primer on the regionality of NEMS, see U.S. Energy Information Administration, Assumptions to the Annual Energy Outlook 2014 (Washington, DC: EIA, June 2014), http:// www .eia .gov /forecasts /aeo /assu mp tions /pdf /0554(2014) .pdf. For purposes of this study, we impose the standard on the 22 Electricity Market Module (EMM) regions for our regional scenarios. This is separate from the census regions we use to report results.
17. The emission rate goals used in the national cooperation and regional fragmentation scenarios are aggregated from the state- specifi c per for mance levels contained in EPA’s CPP by using the 2012 generation- weighted average of covered generation in each state. This is in line with guidance provided by EPA in its TSD on state plan considerations. U.S. Environmental Protection Agency, Offi ce of Air and Radiation, State Plan Considerations.
18. In reality, states that would see higher costs under broader cooperation may require inducements to make participation worthwhile. We assume there is no interregional compensation for participating in a national program.
19. See appendix for a list of CPP- derived emission rate goals used in this analysis.20. A sales- based approach would yield very different market and distributional outcomes than those
considered in the CPP and in this analysis.21. Vermont and the District of Columbia are excluded from the CPP because they do not have any covered
fossil- fuel fi red generation.22. See, for example, RGGI member state comments on the CPP proposal release: Regional Green house Gas
Initiative, “RGGI States Welcome EPA Release of Proposed Carbon Pollution Rules for Existing Power Plants,” June 2014, http:// rggi .org /docs /PressReleases /PR060214 _EPARules _Final .pdf; as well as Great River Energy’s regional transmission organization- wide implementation proposal, Brattle Group, “News,” April 2014, http:// www .brattle .com /news -and -knowledge /news /616 .
18 | LARSEN, LADISLAW, KETCHUM, MELTON, MOHAN, AND HOUSER
EE VERSUS NO EE SCENARIOS
In the EE scenarios, we assume that all states increase investments in demand- side energy effi ciency starting in 2017 and that they increase energy effi ciency to 1.5 percent of our annual Reference Case retail electricity sales by 2026 and maintain that level through the remainder of the forecast. We assume that each electricity- consuming sector must achieve the 1.5 percent annual incremental savings goal through utility- administered EE programs. In reality, a variety of mea sures can count toward EE compliance under the CPP, including utility programs, consumer activities, demand- side energy reduction bid into wholesale markets, building codes, and behavior- based programs, among others. Under the CPP, anything that states currently use in their jurisdictions can count as long as the mea sure meets EPA- defi ned standards.
There are wide variations in estimates of EE potential at the national and state levels as well as variation in the associated cost of that potential. Rather than choose a par tic u lar set of EE potential estimates, we generally rely on EPA’s assumptions for EE deployment and cost within states.23 In our EE scenarios, we explicitly assume that states deploy the defi ned
23. We rely on EPA’s EE cost and deployment assumptions as described beginning on page 5– 29 of the technical support document (TSD) for GHG abatement mea sures. See pages 5– 20 through 5– 28 for a review of EE potential and cost studies. For more information about how EE is treated in this analysis, please see the appendix. U.S. Environmental Protection Agency, Offi ce of Air and Radiation, GHG Abatement Mea sures.
Figure 4- 1. NEMS EMM Regions
Source: U.S. Energy Information Administration.
REMAKING AMERICAN POWER | 19
amount of effi ciency before any other compliance option.24 We assume that all effi ciency savings are real and verifi able and generate credits toward compliance with the applicable TPS from 2020 onward (more on this point below). In the no EE scenarios, EE mea sures included in the Reference Case do occur, but the associated energy savings do not count toward compliance with the CPP goals (and no EE beyond the Reference Case occurs). While existing state EE policies are not explicitly modeled in RHG- NEMS, they are implicitly captured in the baseline demand forecast. In our EE scenarios, we quantify these Refer-ence Case energy savings and count them toward the 1.5 percent annual targets and allow those savings to count for compliance with emission rate goals.25
24. See appendix for more information on why we do this.25. For more information on this issue, see Daniel White et al., State Energy Effi ciency Embedded in Annual
Energy Outlook Forecasts: 2013 Update (Cambridge, MA: Synapse Energy Economics, November 2013).
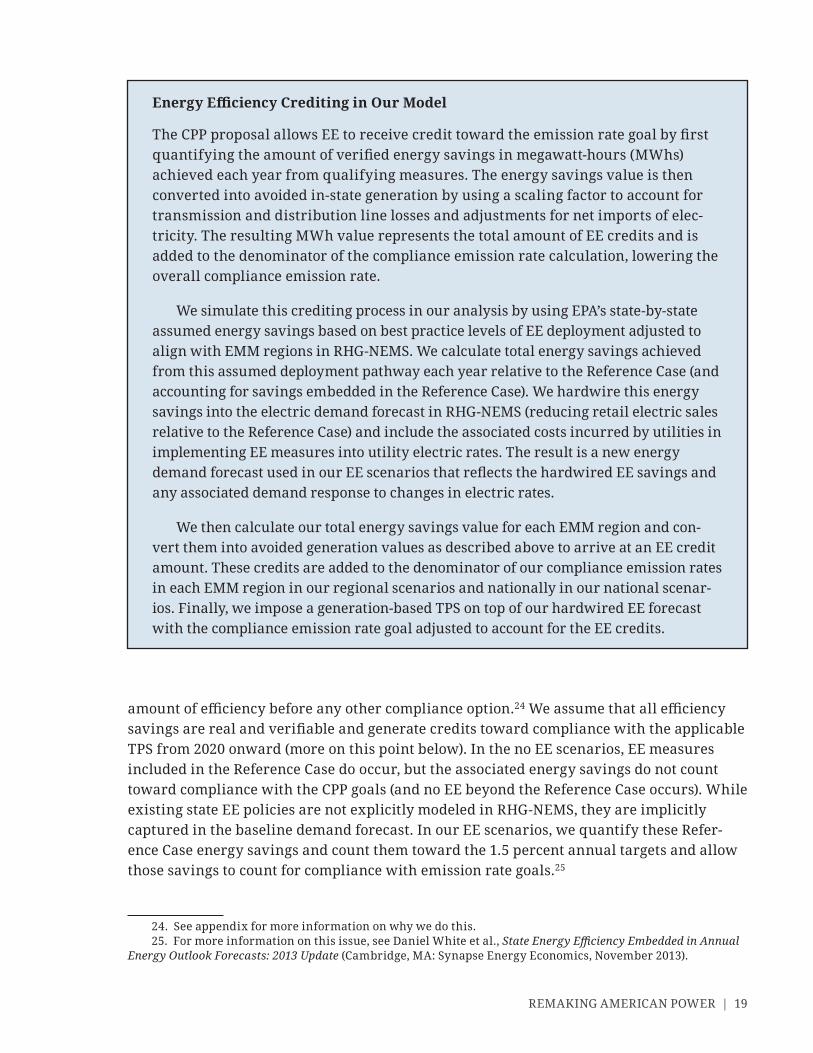
Energy Effi ciency Crediting in Our Model
The CPP proposal allows EE to receive credit toward the emission rate goal by fi rst quantifying the amount of verifi ed energy savings in megawatt- hours (MWhs) achieved each year from qualifying mea sures. The energy savings value is then converted into avoided in- state generation by using a scaling factor to account for transmission and distribution line losses and adjustments for net imports of elec-tricity. The resulting MWh value represents the total amount of EE credits and is added to the denominator of the compliance emission rate calculation, lowering the overall compliance emission rate.
We simulate this crediting pro cess in our analysis by using EPA’s state- by- state assumed energy savings based on best practice levels of EE deployment adjusted to align with EMM regions in RHG- NEMS. We calculate total energy savings achieved from this assumed deployment pathway each year relative to the Reference Case (and accounting for savings embedded in the Reference Case). We hardwire this energy savings into the electric demand forecast in RHG- NEMS (reducing retail electric sales relative to the Reference Case) and include the associated costs incurred by utilities in implementing EE mea sures into utility electric rates. The result is a new energy demand forecast used in our EE scenarios that refl ects the hardwired EE savings and any associated demand response to changes in electric rates.
We then calculate our total energy savings value for each EMM region and con-vert them into avoided generation values as described above to arrive at an EE credit amount. These credits are added to the denominator of our compliance emission rates in each EMM region in our regional scenarios and nationally in our national scenar-ios. Finally, we impose a generation- based TPS on top of our hardwired EE forecast with the compliance emission rate goal adjusted to account for the EE credits.
20 | LARSEN, LADISLAW, KETCHUM, MELTON, MOHAN, AND HOUSER
If states do pursue EE in their implementation plans, they will need to have substantial regulatory frameworks in place to ensure that investments in EE yield the expected energy savings. Within existing state EE programs as well as new EE programs that could be included in a CPP state plan, evaluation, mea sure ment, and verifi cation (EMV) protocols are used in an attempt to ensure that EE savings materialize. It is likely that states with substantial experience with EE programs already have most of the required regulatory framework in place to meet EPA’s EMV and other requirements if they choose to incorpo-rate EE into their compliance plans.26 Conversely, states without much experience manag-ing and regulating EE programs will need to make substantial investments in building up regulatory frameworks over a relatively short period of time if they intend to incorporate EE into their state implementation plans. If the regulatory frameworks, associated proto-cols, and enforcement are not suffi ciently robust, EE investments may end up supplying compliance credits but not yielding the expected energy savings. This would increase electricity rates and bills without proportionate CO2 reduction or consumer benefi ts.
There are a few reasons why states may not want to include EE crediting in their CPP implementation plans. First, if states with signifi cant EE program and/or regulatory experi-ence do not want to revise their EE regulations to meet EPA CPP requirements, they may wish to keep them as they are and maintain the energy savings but simply not include EE as a formal compliance option in their plans. States that do not have active EE programs or experience may be daunted by the task of building up the required EE regulatory infra-structure to meet EPA requirements and instead may opt to pursue plans that do not incor-porate EE. Finally, states may decide that other abatement options are preferred over EE on the basis of cost or other factors.
Our EE cases are not intended to represent the eco nom ical ly optimal level of EE to meet the CPP emission rate goals because we have exogenously stipulated a predetermined amount of energy savings. In some regions, generation- side compliance options (such as redispatch) may be lower cost. Still, the EE scenarios allow us to better understand how deploying EE as a compliance mechanism changes electric power and energy system dynamics as well as the overall impact on consumer electricity expenditures. It is impor-tant to note, however, that just as there are a variety of permutations of interstate coopera-tion in implementing the CPP, there are a multitude of ways that EE could be included in state plans. Some states may choose not to include EE at all, while others may choose to deploy EE at higher levels than those considered in this analysis. Moreover, other ways of incorporating EE into state implementation plans besides crediting it as a compliance resource in a TPS could result in different cost, benefi t, and fuel mix outcomes.27 More
26. For a review of existing state EE policies, see American Council for an Energy- Effi cient Economy, “The State Energy Effi ciency Scorecard,” http:// www .aceee .org /state -policy /scorecard .
27. For example, a state could implement a combination of appliance standards and building codes that could reduce its overall compliance emission rate to meet the standard, assuming all of those mea sures deliver real energy savings. Such alternative approaches will affect overall costs to consumers of CPP implementation. Indeed, there could be cases where effi ciency mea sures displace generators with emission rates below the emission rate goal; this could actually increase the cost of compliance.

REMAKING AMERICAN POWER | 21
detail on how we incorporated EE in our modeling and the cost assumptions used can be found in the appendix.
Sensitivity CasesIn addition to the four policy cases outlined above, we perform sensitivity analyses to test how different energy system assumptions could change our results. The main difference between the policy scenarios and the sensitivities is that the policy scenarios model how different policy choices by the states impact outcomes, while the sensitivities examine how factors beyond state and EPA control affect outcomes. Because natural gas plays such a signifi -cant role in meeting CPP emission rate targets in our four scenarios, we focus our sensitiv-ity analyses on natural gas. To do so, we test our National without EE scenario against the following three gas market sensitivities: (1) high natural gas and oil resources (resulting in lower natural gas prices); (2) low natural gas and oil resources (resulting in higher natural gas prices); and (3) expanded liquefi ed natural gas (LNG) exports ramping up to 9 billion cubic feet per day (bcf/d) in 2020 and 18 bcf/d in 2030. The fi rst two sensitivities are based on EIA’s AEO 2014 oil and gas resource side cases. We constructed the third sensitivity specifi cally for this analysis. More information on our sensitivity scenarios can be found in the appendix.
What Could Affect Our Results?Our analysis is intended to highlight potential energy market impacts of the CPP as currently designed and with current fuel and technology cost assumptions. Changes in either would materially affect our results.
STRINGENCY
Any changes to the proposed rule’s stringency will affect the ultimate energy market and consumer impacts of the rule. Changes to the stringency could result from EPA action as it fi nalizes the proposal or from court action due to legal challenges to the rule after it is fi nalized.
There are any number of reasons that stringency could change between the proposed rule and the actual implementation of the fi nal rule. For example, if the courts reject one of EPA’s building blocks (such as the fourth building block, energy effi ciency), the BSER would change, and as a result the level of each state’s emission rate target would be recalculated to refl ect just the remaining three building blocks.
FUEL AND TECHNOLOGY COSTS
Our assumptions about technology cost and per for mance, electricity demand, energy costs, and the natural gas resource base, among others, shape our results. Our sensitivity analy-ses examine how our core results may change under different natural gas resource and
22 | LARSEN, LADISLAW, KETCHUM, MELTON, MOHAN, AND HOUSER
demand assumptions but exclude a range of other potential energy market outcomes. For example, if electricity demand growth is substantially higher than our Reference Case assumptions, the electric rate impacts of the CPP will likely be greater than our analysis suggests. If renewable energy costs decline faster than predicted in our modeling, the role of renewable deployment in meeting state emission rate targets will likely increase.28 Additionally, although we make assumptions about how much natural gas is available in the United States, and we test this par tic u lar assumption with sensitivity analyses, we do not consider extreme outlier scenarios.
Our EE cost assumptions are also important. For example, we use nationally uniform EE costs in our analysis, but in reality these costs will vary by state, as will the relative cost of EE compared with other generation- based compliance options. (In addition to changing the potential outcomes, these cost factors are likely to impact state decisions about whether and at what level to include EE as a compliance option.)
IMPLEMENTATION
Implementation choices made by states could also affect the impacts of our modeling. For a variety of reasons, states may choose other policy approaches not modeled in this analysis. For example, some of the most cost- effective solutions may be po liti cally untenable in the implementing states; some states may wish to promote certain technologies over others; yet other states might fi nd the administrative challenges of different options too diffi cult or costly. A state’s decision to pursue compliance solely through deployment of one set of technologies (e.g., renewables) even though other options may be more cost- effective could yield different outcomes compared with our results. While the compliance emission rate for covered generators would be the same under alternative approaches, we would expect to see very different natural gas demand, electricity rate impacts, and so forth, if a number of states deviate substantially from the most cost- effective compliance pathway. Similar considerations apply for states considering whether to cooperate with other states.
Finally, the timing of CPP implementation will shape the timing, nature, and magni-tude of the resulting energy market impacts. Any adjustment to EPA’s fi nal CPP compliance timeline compared with the current proposal could affect our results. In addition, although standards under the CPP are currently required to be in place in all states by January 2020, several states are better positioned and more po liti cally inclined to develop and implement mea sures in accordance with the rule when it becomes fi nal and will seek to do so accord-ing to the EPA timeline to the best of their ability; others will not. Moreover, standards may not be binding in some states until later if their state plans have not been approved and the EPA is forced to implement a federal plan instead. Staggered implementation could have a
28. We rely on EIA’s AEO 2014 assumptions for renewable generation costs. Some have argued that these costs are conservative. See, for example, Kenneth Bossong, “Too Conservative? EIA Projects Renewables to Be 16– 27 Percent of US Electricity Supply by 2040,” Renewableenergyworld .com, April 29, 2014, http:// www .renewableenergyworld .com /rea /news /article /2014 /04 /too -conservative -eia -projects -renewables -to -be -16 -27 -percent -of -us -electricity -supply -by -2040. If the costs of renewables were signifi cantly lower in our analysis, we would expect to see greater renewables deployment and less additional natural gas generation.

REMAKING AMERICAN POWER | 23
negative effect on consumer impacts and alter the associated energy system outcomes at a state- by- state level. For example, if half the states in a power market have plans in place in the form of a carbon pricing program and standards are binding while the other half are delayed in getting their plans approved, then the generators in the fi rst group would be at a competitive disadvantage in the market compared with generators in the second group, leading to a distortion of wholesale and retail power prices. We also note that the EPA proposal is still a draft and has not been tested in the courts. Changes to the implementa-tion timeline (to say nothing of the content) as a result of court action will directly affect how states implement the guidelines and in turn the impacts on electric power markets and the broader energy system.
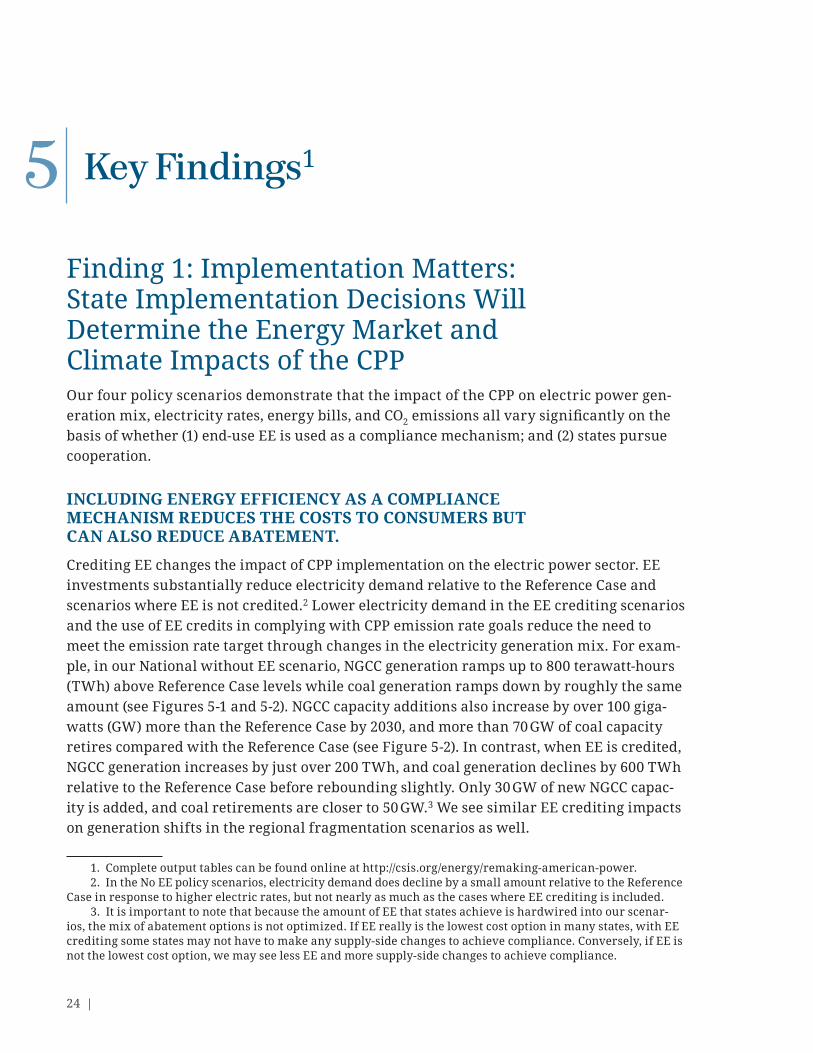
24 |
Key Findings1
Finding 1: Implementation Matters: State Implementation Decisions Will Determine the Energy Market and Climate Impacts of the CPPOur four policy scenarios demonstrate that the impact of the CPP on electric power gen-eration mix, electricity rates, energy bills, and CO2 emissions all vary signifi cantly on the basis of whether (1) end- use EE is used as a compliance mechanism; and (2) states pursue cooperation.
INCLUDING ENERGY EFFICIENCY AS A COMPLIANCE MECHANISM REDUCES THE COSTS TO CONSUMERS BUT CAN ALSO REDUCE ABATEMENT.
Crediting EE changes the impact of CPP implementation on the electric power sector. EE investments substantially reduce electricity demand relative to the Reference Case and scenarios where EE is not credited.2 Lower electricity demand in the EE crediting scenarios and the use of EE credits in complying with CPP emission rate goals reduce the need to meet the emission rate target through changes in the electricity generation mix. For exam-ple, in our National without EE scenario, NGCC generation ramps up to 800 terawatt- hours (TWh) above Reference Case levels while coal generation ramps down by roughly the same amount (see Figures 5- 1 and 5- 2). NGCC capacity additions also increase by over 100 giga-watts (GW) more than the Reference Case by 2030, and more than 70 GW of coal capacity retires compared with the Reference Case (see Figure 5-2). In contrast, when EE is credited, NGCC generation increases by just over 200 TWh, and coal generation declines by 600 TWh relative to the Reference Case before rebounding slightly. Only 30 GW of new NGCC capac-ity is added, and coal retirements are closer to 50 GW.3 We see similar EE crediting impacts on generation shifts in the regional fragmentation scenarios as well.
1. Complete output tables can be found online at http:// csis .org /energy /remaking -american -power .2. In the No EE policy scenarios, electricity demand does decline by a small amount relative to the Reference
Case in response to higher electric rates, but not nearly as much as the cases where EE crediting is included.3. It is important to note that because the amount of EE that states achieve is hardwired into our scenar-
ios, the mix of abatement options is not optimized. If EE really is the lowest cost option in many states, with EE crediting some states may not have to make any supply- side changes to achieve compliance. Conversely, if EE is not the lowest cost option, we may see less EE and more supply- side changes to achieve compliance.
5
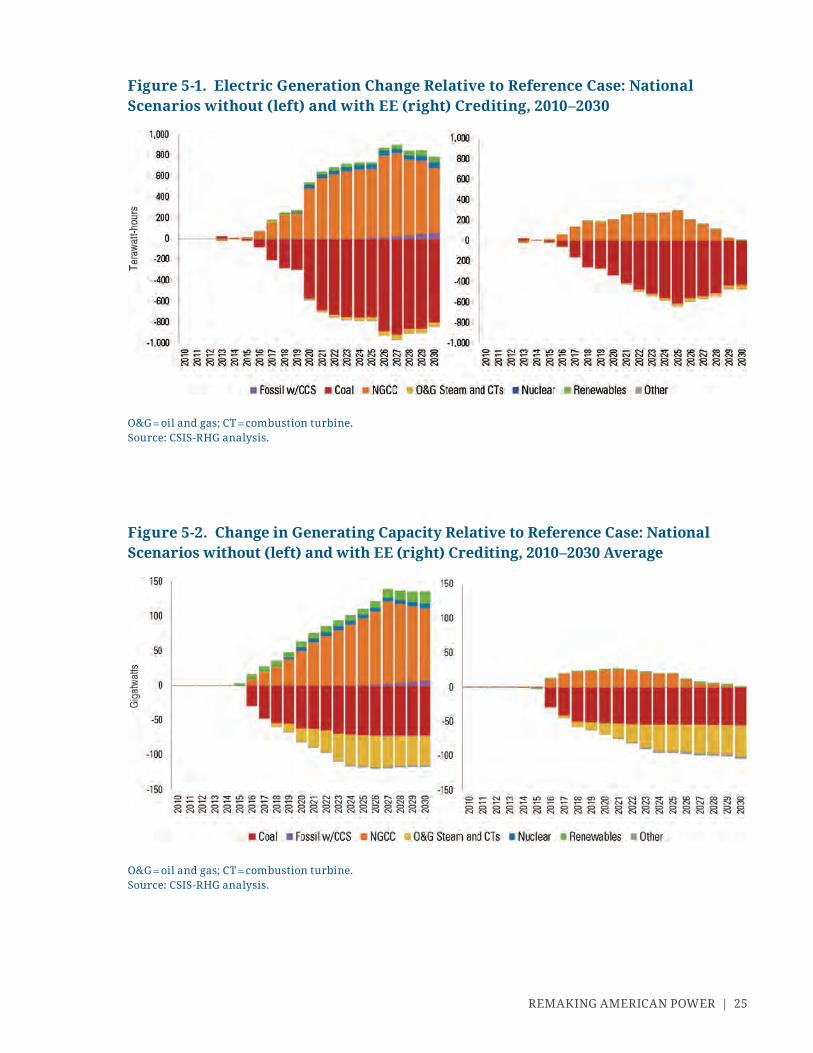
REMAKING AMERICAN POWER | 25
Figure 5- 1. Electric Generation Change Relative to Reference Case: National Scenarios without (left) and with EE (right) Crediting, 2010– 2030
O&G = oil and gas; CT = combustion turbine.Source: CSIS- RHG analysis.
Figure 5- 2. Change in Generating Capacity Relative to Reference Case: National Scenarios without (left) and with EE (right) Crediting, 2010– 2030 Average
O&G = oil and gas; CT = combustion turbine.Source: CSIS- RHG analysis.

26 | LARSEN, LADISLAW, KETCHUM, MELTON, MOHAN, AND HOUSER
Although electricity rates are higher when EE is included as a compliance mechanism, electricity bills are lower.
The electric rate impacts of the CPP are higher when EE is included (relative to the National without EE scenario and the Reference Case) because EE costs money to implement. These costs are typically borne by the utilities that are tasked with meeting EE require-ments, who in turn pass these costs on to consumers in the form of higher rates.4 For example, if a utility implements an EE program to incentivize the installation of high- effi ciency lighting in offi ce buildings and that program costs $5 million per year, the utility would seek to recover those costs through an electric rate case in line with a state’s public utility commission requirements. In the National without EE scenario, national average rate impacts are modest at just over 4 percent on average between 2020 and 2030. When EE crediting is included, rate impacts are 5.4 percent, refl ecting the cost of EE mea sures.5
Simultaneously, EE crediting incentivizes further investment in EE, which in turn lowers overall electricity demand. The net result is a decline in national consumer electric-ity expenditures (electric bills) of 2.4 percent on average between 2020 and 2030 in our National with EE case relative to the Reference Case (see Figure 5- 3). In our National with-out EE scenario, electricity expenditures increase by 2.8 percent relative to the Reference Case. Consumer benefi ts from lower expenditures are contingent on EE investments deliv-ering the intended energy savings. If not all of the energy savings from these investments materialize, consumers end up paying for EE without receiving the benefi t of lower bills.6 In addition, crediting EE savings that do not materialize reduces CO2 abatement. Robust state EMV protocols and enforcement are critical to ensuring that consumers and the environment receive the intended benefi ts of EE investments. It is likely that some EE
4. We rely on EPA’s EE cost and deployment assumptions. If other cost assumptions were used, rate impacts would be different. Two papers that attempted to empirically calculate the cost of EE found that each saved megawatt- hour cost less than the assumptions used by EPA. If we were to have used the costs from these studies, our rate impacts and consumer costs would be lower than reported here. See Megan Billingsley et al., The Program Administrator Cost of Saved Energy for Utility Customer- Funded Energy Effi ciency Programs (Berkeley, CA: Lawrence Berkeley National Lab, March 2014), http:// emp .lbl .gov /sites /all /fi les /lbnl -6595e .pdf; and Maggie Molina, The Best Value for America’s Energy Dollar: A National Review of the Cost of Utility Energy Effi ciency Programs (Washington, DC: American Council for an Energy- Effi cient Economy, March 2014), http:// www .aceee .org /research -report /u1402 .
5. There is considerable debate regarding the optimal way to assess the overall costs of EE programs. For example, one way to count EE costs is to include the costs that utilities incur when they implement EE mea sures. Another option is to include these utility costs as well as the costs consumers pay to participate in EE programs, such as the added cost a consumer would incur for buying a more effi cient appliance that they would not have purchased but for a rebate provided by the utility. Mea sur ing the total cost of EE depends on how the costs incurred by the utility are counted (sometimes referred to as “program administrator costs”) and whether and how the costs incurred by participants in EE programs are counted (when utility and participant costs are counted, it is sometime referred to as the “total resource cost” of EE). In this analysis, electric rate, electricity expenditure, and energy expenditure changes refl ect only the utility costs of EE and do not include participant EE costs of approximately $20 billion per year on average between 2020 and 2030. This is generally the approach used in most state programs.
6. This could happen if there is not suffi cient regulatory oversight of EE mea sures. For example, an EE ser vice provider might claim that the mea sures it had implemented saved 10 MWh per year, but the actual savings was 5 MWh. Without oversight, consumers would pay for the claimed savings but receive the benefi t only of the actual savings.
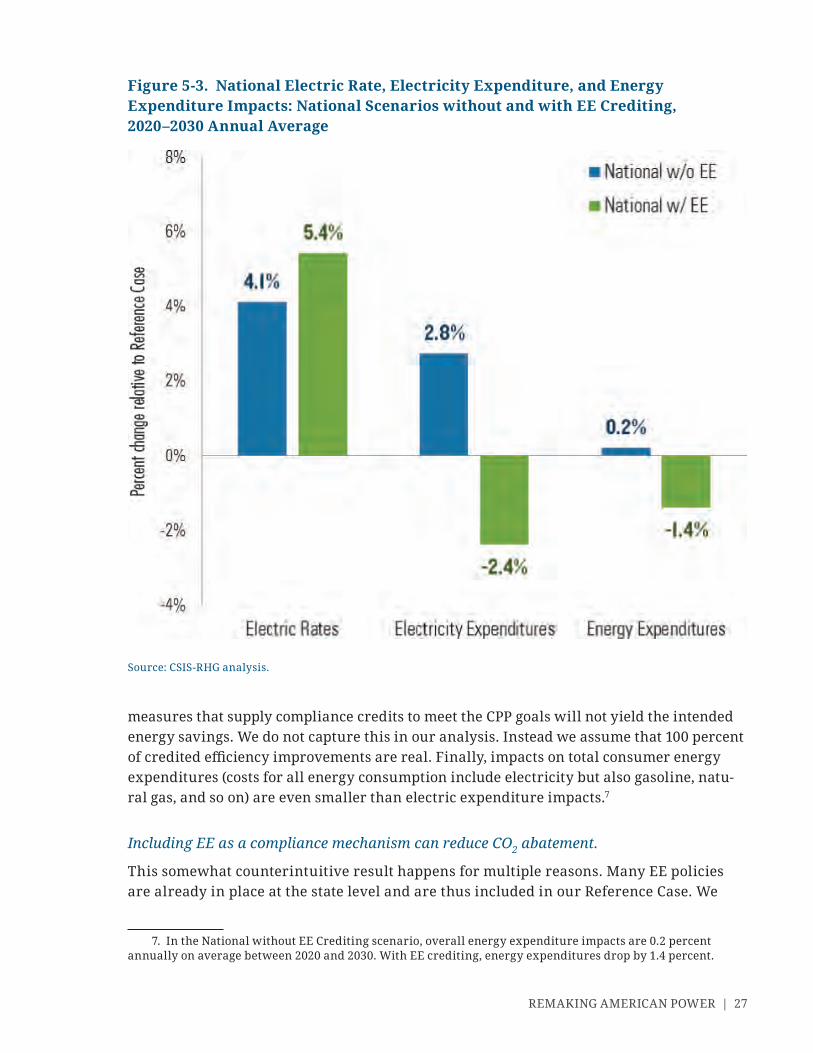
REMAKING AMERICAN POWER | 27
mea sures that supply compliance credits to meet the CPP goals will not yield the intended energy savings. We do not capture this in our analysis. Instead we assume that 100 percent of credited effi ciency improvements are real. Finally, impacts on total consumer energy expenditures (costs for all energy consumption include electricity but also gasoline, natu-ral gas, and so on) are even smaller than electric expenditure impacts.7
Including EE as a compliance mechanism can reduce CO2 abatement.
This somewhat counterintuitive result happens for multiple reasons. Many EE policies are already in place at the state level and are thus included in our Reference Case. We
7. In the National without EE Crediting scenario, overall energy expenditure impacts are 0.2 percent annually on average between 2020 and 2030. With EE crediting, energy expenditures drop by 1.4 percent.
Figure 5- 3. National Electric Rate, Electricity Expenditure, and Energy Expenditure Impacts: National Scenarios without and with EE Crediting, 2020– 2030 Annual Average
Source: CSIS- RHG analysis.
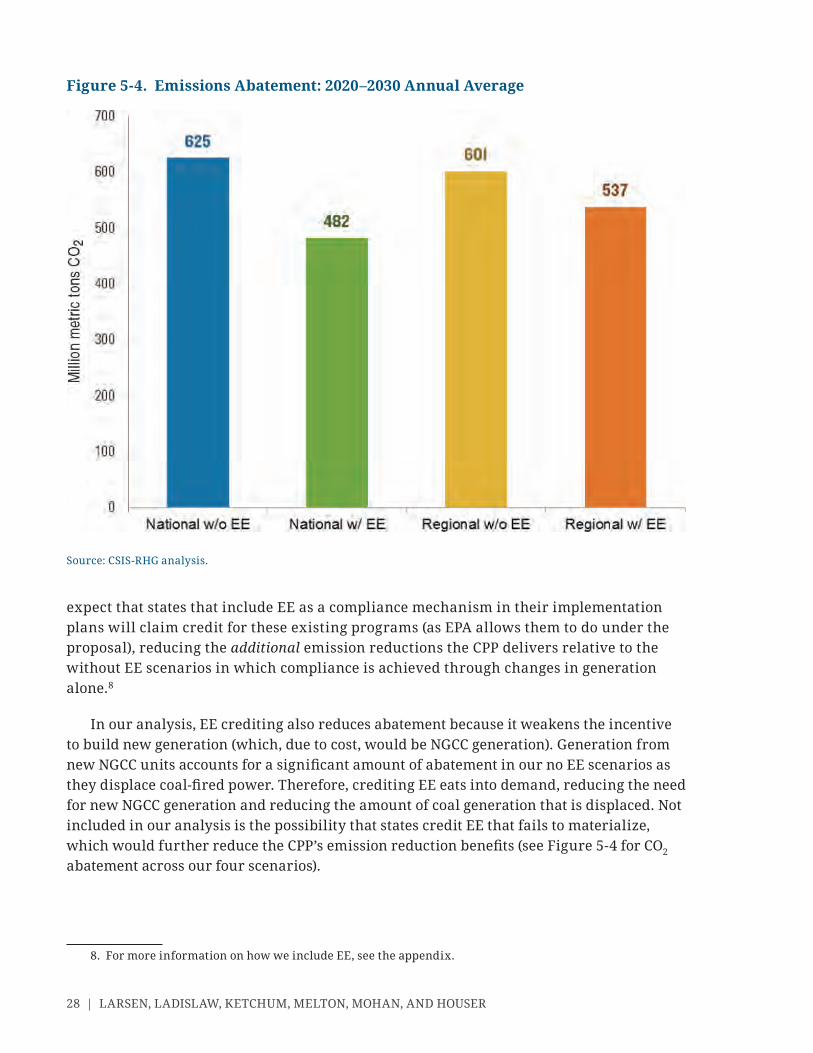
28 | LARSEN, LADISLAW, KETCHUM, MELTON, MOHAN, AND HOUSER
expect that states that include EE as a compliance mechanism in their implementation plans will claim credit for these existing programs (as EPA allows them to do under the proposal), reducing the additional emission reductions the CPP delivers relative to the without EE scenarios in which compliance is achieved through changes in generation alone.8
In our analysis, EE crediting also reduces abatement because it weakens the incentive to build new generation (which, due to cost, would be NGCC generation). Generation from new NGCC units accounts for a signifi cant amount of abatement in our no EE scenarios as they displace coal- fi red power. Therefore, crediting EE eats into demand, reducing the need for new NGCC generation and reducing the amount of coal generation that is displaced. Not included in our analysis is the possibility that states credit EE that fails to materialize, which would further reduce the CPP’s emission reduction benefi ts (see Figure 5- 4 for CO2 abatement across our four scenarios).
8. For more information on how we include EE, see the appendix.
Figure 5- 4. Emissions Abatement: 2020– 2030 Annual Average
Source: CSIS- RHG analysis.
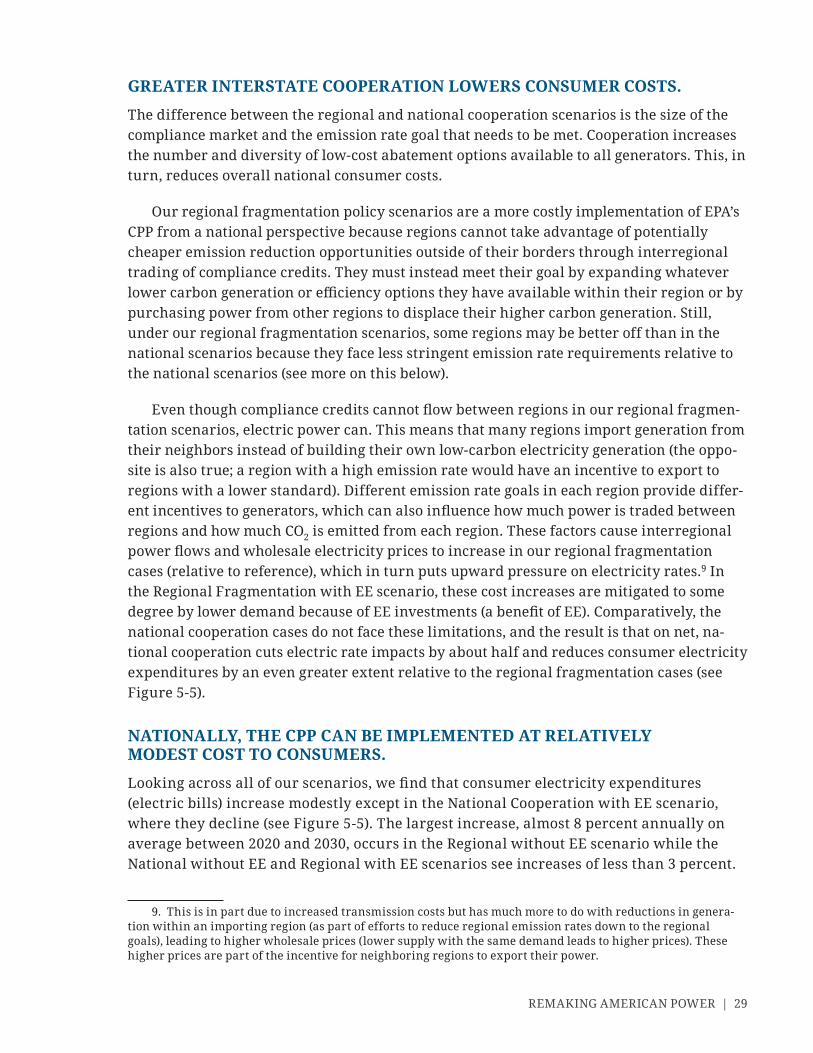
REMAKING AMERICAN POWER | 29
GREATER INTERSTATE COOPERATION LOWERS CONSUMER COSTS.
The difference between the regional and national cooperation scenarios is the size of the compliance market and the emission rate goal that needs to be met. Cooperation increases the number and diversity of low- cost abatement options available to all generators. This, in turn, reduces overall national consumer costs.
Our regional fragmentation policy scenarios are a more costly implementation of EPA’s CPP from a national perspective because regions cannot take advantage of potentially cheaper emission reduction opportunities outside of their borders through interregional trading of compliance credits. They must instead meet their goal by expanding what ever lower carbon generation or effi ciency options they have available within their region or by purchasing power from other regions to displace their higher carbon generation. Still, under our regional fragmentation scenarios, some regions may be better off than in the national scenarios because they face less stringent emission rate requirements relative to the national scenarios (see more on this below).
Even though compliance credits cannot fl ow between regions in our regional fragmen-tation scenarios, electric power can. This means that many regions import generation from their neighbors instead of building their own low- carbon electricity generation (the oppo-site is also true; a region with a high emission rate would have an incentive to export to regions with a lower standard). Different emission rate goals in each region provide differ-ent incentives to generators, which can also infl uence how much power is traded between regions and how much CO2 is emitted from each region. These factors cause interregional power fl ows and wholesale electricity prices to increase in our regional fragmentation cases (relative to reference), which in turn puts upward pressure on electricity rates.9 In the Regional Fragmentation with EE scenario, these cost increases are mitigated to some degree by lower demand because of EE investments (a benefi t of EE). Comparatively, the national cooperation cases do not face these limitations, and the result is that on net, na-tional cooperation cuts electric rate impacts by about half and reduces consumer electricity expenditures by an even greater extent relative to the regional fragmentation cases (see Figure 5- 5).
NATIONALLY, THE CPP CAN BE IMPLEMENTED AT RELATIVELY MODEST COST TO CONSUMERS.
Looking across all of our scenarios, we fi nd that consumer electricity expenditures (electric bills) increase modestly except in the National Cooperation with EE scenario, where they decline (see Figure 5- 5). The largest increase, almost 8 percent annually on average between 2020 and 2030, occurs in the Regional without EE scenario while the National without EE and Regional with EE scenarios see increases of less than 3 percent.
9. This is in part due to increased transmission costs but has much more to do with reductions in genera-tion within an importing region (as part of efforts to reduce regional emission rates down to the regional goals), leading to higher wholesale prices (lower supply with the same demand leads to higher prices). These higher prices are part of the incentive for neighboring regions to export their power.
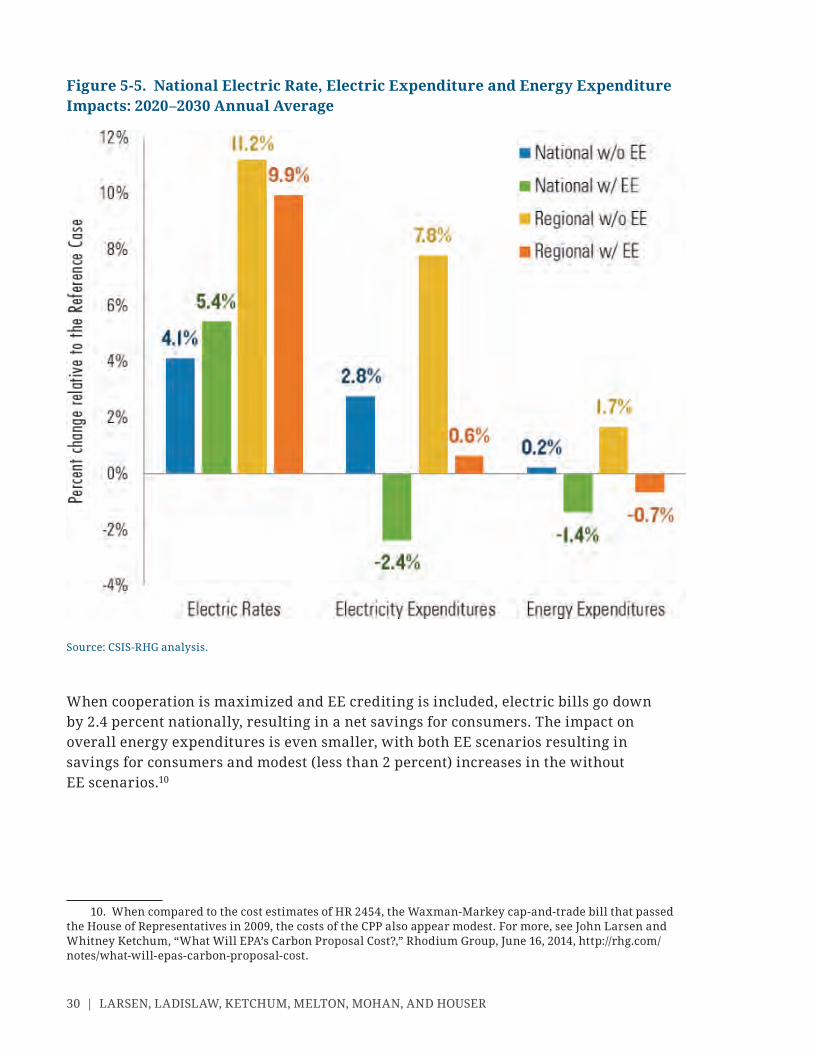
30 | LARSEN, LADISLAW, KETCHUM, MELTON, MOHAN, AND HOUSER
When cooperation is maximized and EE crediting is included, electric bills go down by 2.4 percent nationally, resulting in a net savings for consumers. The impact on overall energy expenditures is even smaller, with both EE scenarios resulting in savings for consumers and modest (less than 2 percent) increases in the without EE scenarios.10
10. When compared to the cost estimates of HR 2454, the Waxman- Markey cap- and- trade bill that passed the House of Representatives in 2009, the costs of the CPP also appear modest. For more, see John Larsen and Whitney Ketchum, “What Will EPA’s Carbon Proposal Cost?,” Rhodium Group, June 16, 2014, http:// rhg .com /notes /what -will -epas -carbon -proposal -cost .
Figure 5- 5. National Electric Rate, Electric Expenditure and Energy Expenditure Impacts: 2020– 2030 Annual Average
Source: CSIS- RHG analysis.
REMAKING AMERICAN POWER | 31
Finding 2: Shale Gas Helps Make the Proposed Rule Both More Affordable and More EffectiveREGARDLESS OF HOW THE CPP IS ULTIMATELY IMPLEMENTED, NATURAL GAS STANDS TO GAIN MARKET SHARE IN THE POWER SECTOR.
In each of our four scenarios, coal- to- gas fuel switching is the most cost- effective generation- side compliance pathway. No matter what compliance option states choose to meet EPA’s emission rate goals, there will likely be a signifi cant shift toward greater NGCC generation, largely coming at the expense of existing coal generation— the only difference in the scenarios is the magnitude of the shift.
The cost competitiveness of natural gas as a compliance strategy is due in large part to the North American shale boom that began in earnest in 2009. The ability to eco nom ical ly produce large volumes of natural gas from low- permeability shale formations has reduced domestic gas prices, making natural gas more competitive with coal long before the CPP was proposed. Natural gas is less carbon- intensive than coal, and the CPP shifts incentives toward lower carbon generators. Even though zero- emitting generators like renewables and nuclear power receive more credit under the CPP formula than NGCC units, NGCC units are more competitive in our analysis thanks to low technology costs and low natural gas costs (see Figure 5- 6).11 This holds true even in the higher gas price sensitivity analyses we conducted (see Figure 5- 7).12
NGCC generation increases the most in the scenarios without EE— as much as 660 TWh (a two- thirds increase in NGCC generation from current levels) above reference on average from 2020 through 2030— while coal generation declines by 770 TWh (see Figure 5- 6). Generation from nuclear power and renewables also increases above reference in the scenarios without EE but far less than natural gas generation (80 TWh on average from 2020 through 2030).
In scenarios where EE is included, the shift toward NGCC generation is much smaller, about 185 TWh on average in our National with EE crediting scenario (and 285 TWh in 2020 in the Regional with EE crediting case), and all but disappears by the end of the compliance period. With EE crediting, we see almost no change in zero- emitting generation relative to the Reference Case. This is because the CPP does not in itself prioritize zero- emission gen-eration options; the CPP is a lower emission plan, not a zero- emission plan. In fact, the CPP is
11. It is important to keep in mind that we allow only utility- scale renewable generation to get credit in the TPS. EPA’s CPP as proposed would allow states to credit distributed renewable generation, such as rooftop solar installations and commercial and industrial combined heat and power installations, toward compliance. Depending on how states choose to address these generation sources and their relative costs compared with utility generators, distributed generation could play a substantial role in the generation shift under the CPP. Though we do not quantify how big that role could be, it is likely that such an increase in distributed genera-tion would diminish the role of NGCC generation compared with our results.
12. We rely on EIA’s reference case cost and per for mance assumptions for generation technologies, including renewables and nuclear. If the costs for renewables and/or nuclear power were lower, we would expect to see these technologies play a larger role in the generation shift away from coal. The low natural gas and oil resource case sensitivity presents one potential option of how lower relative costs of renewables and nuclear power compared with coal would impact the generation shift.
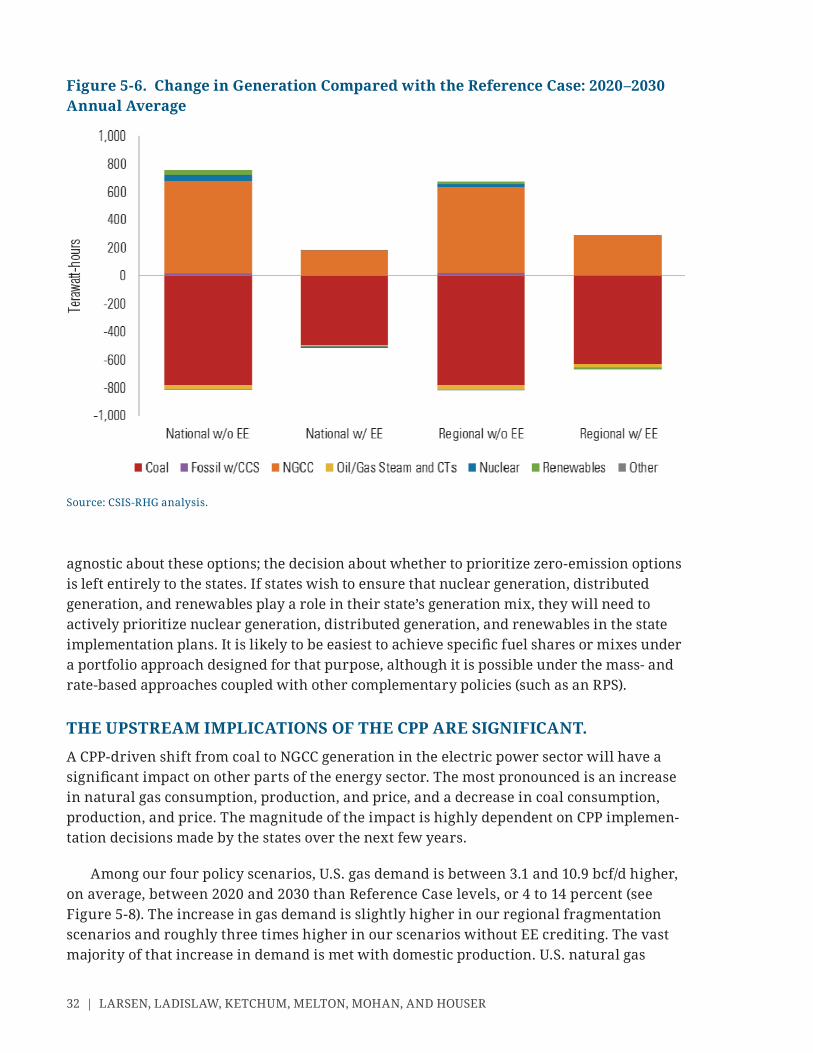
32 | LARSEN, LADISLAW, KETCHUM, MELTON, MOHAN, AND HOUSER
agnostic about these options; the decision about whether to prioritize zero- emission options is left entirely to the states. If states wish to ensure that nuclear generation, distributed generation, and renewables play a role in their state’s generation mix, they will need to actively prioritize nuclear generation, distributed generation, and renewables in the state implementation plans. It is likely to be easiest to achieve specifi c fuel shares or mixes under a portfolio approach designed for that purpose, although it is possible under the mass- and rate- based approaches coupled with other complementary policies (such as an RPS).
THE UPSTREAM IMPLICATIONS OF THE CPP ARE SIGNIFICANT.
A CPP- driven shift from coal to NGCC generation in the electric power sector will have a signifi cant impact on other parts of the energy sector. The most pronounced is an increase in natural gas consumption, production, and price, and a decrease in coal consumption, production, and price. The magnitude of the impact is highly dependent on CPP implemen-tation decisions made by the states over the next few years.
Among our four policy scenarios, U.S. gas demand is between 3.1 and 10.9 bcf/d higher, on average, between 2020 and 2030 than Reference Case levels, or 4 to 14 percent (see Figure 5- 8). The increase in gas demand is slightly higher in our regional fragmentation scenarios and roughly three times higher in our scenarios without EE crediting. The vast majority of that increase in demand is met with domestic production. U.S. natural gas
Figure 5- 6. Change in Generation Compared with the Reference Case: 2020– 2030 Annual Average
Source: CSIS- RHG analysis.
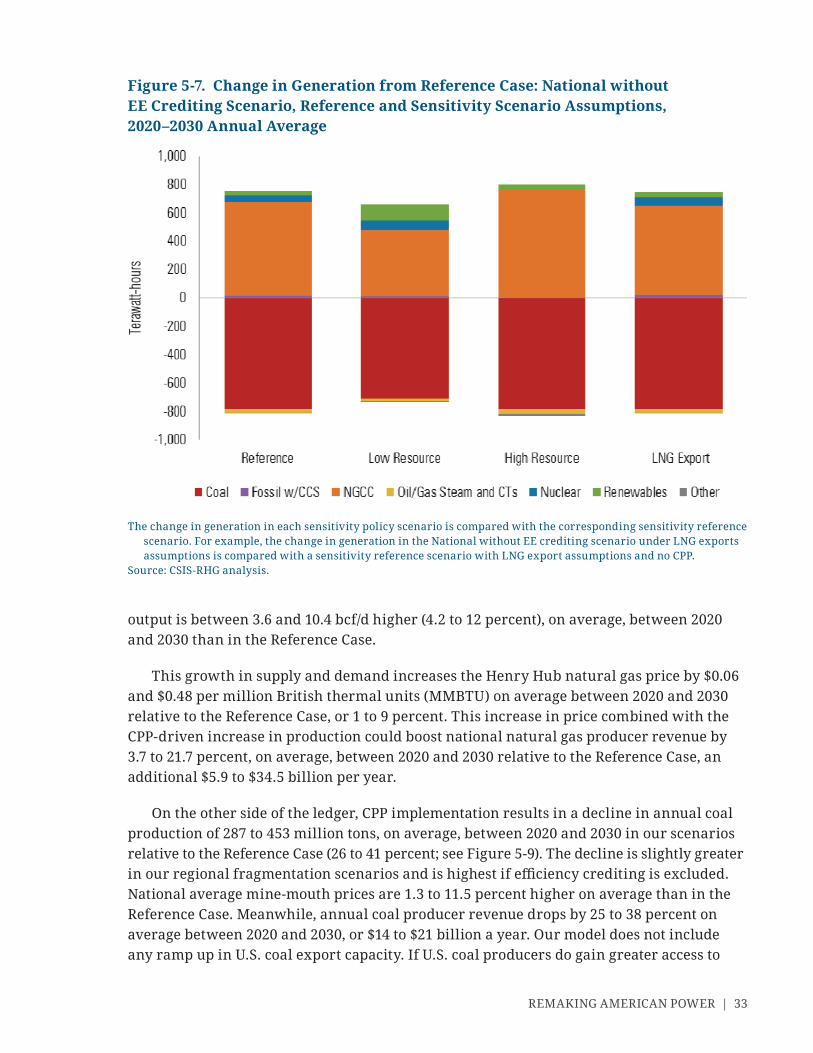
REMAKING AMERICAN POWER | 33
Figure 5- 7. Change in Generation from Reference Case: National without EE Crediting Scenario, Reference and Sensitivity Scenario Assumptions, 2020– 2030 Annual Average
The change in generation in each sensitivity policy scenario is compared with the corresponding sensitivity reference scenario. For example, the change in generation in the National without EE crediting scenario under LNG exports assumptions is compared with a sensitivity reference scenario with LNG export assumptions and no CPP.
Source: CSIS- RHG analysis.
output is between 3.6 and 10.4 bcf/d higher (4.2 to 12 percent), on average, between 2020 and 2030 than in the Reference Case.
This growth in supply and demand increases the Henry Hub natural gas price by $0.06 and $0.48 per million British thermal units (MMBTU) on average between 2020 and 2030 relative to the Reference Case, or 1 to 9 percent. This increase in price combined with the CPP- driven increase in production could boost national natural gas producer revenue by 3.7 to 21.7 percent, on average, between 2020 and 2030 relative to the Reference Case, an additional $5.9 to $34.5 billion per year.
On the other side of the ledger, CPP implementation results in a decline in annual coal production of 287 to 453 million tons, on average, between 2020 and 2030 in our scenarios relative to the Reference Case (26 to 41 percent; see Figure 5- 9). The decline is slightly greater in our regional fragmentation scenarios and is highest if effi ciency crediting is excluded. National average mine- mouth prices are 1.3 to 11.5 percent higher on average than in the Reference Case. Meanwhile, annual coal producer revenue drops by 25 to 38 percent on average between 2020 and 2030, or $14 to $21 billion a year. Our model does not include any ramp up in U.S. coal export capacity. If U.S. coal producers do gain greater access to

34 | LARSEN, LADISLAW, KETCHUM, MELTON, MOHAN, AND HOUSER
markets outside the United States, something not included in our model, that access could change the upstream coal production impacts of the CPP.
We test our natural gas fi ndings against a range of market sensitivities keyed to EIA’s AEO side cases where the shale gas resource base is lower and higher than assumed in the
Figure 5- 8. Change in Natural Gas Consumption and Production: 2020– 2030 Annual Average
The left- hand side of the fi gure represents billion cubic feet per day, and the right- hand side of the fi gure represents the percentage of billion cubic feet per day.
Source: CSIS- RHG analysis.
Figure 5- 9. Change in Coal Consumption and Production: 2020– 2030 Annual Average
The left- hand side of the fi gure represents million short tons, and the right- hand side of the fi gure represents the percentage of million short tons.
Source: CSIS- RHG analysis.
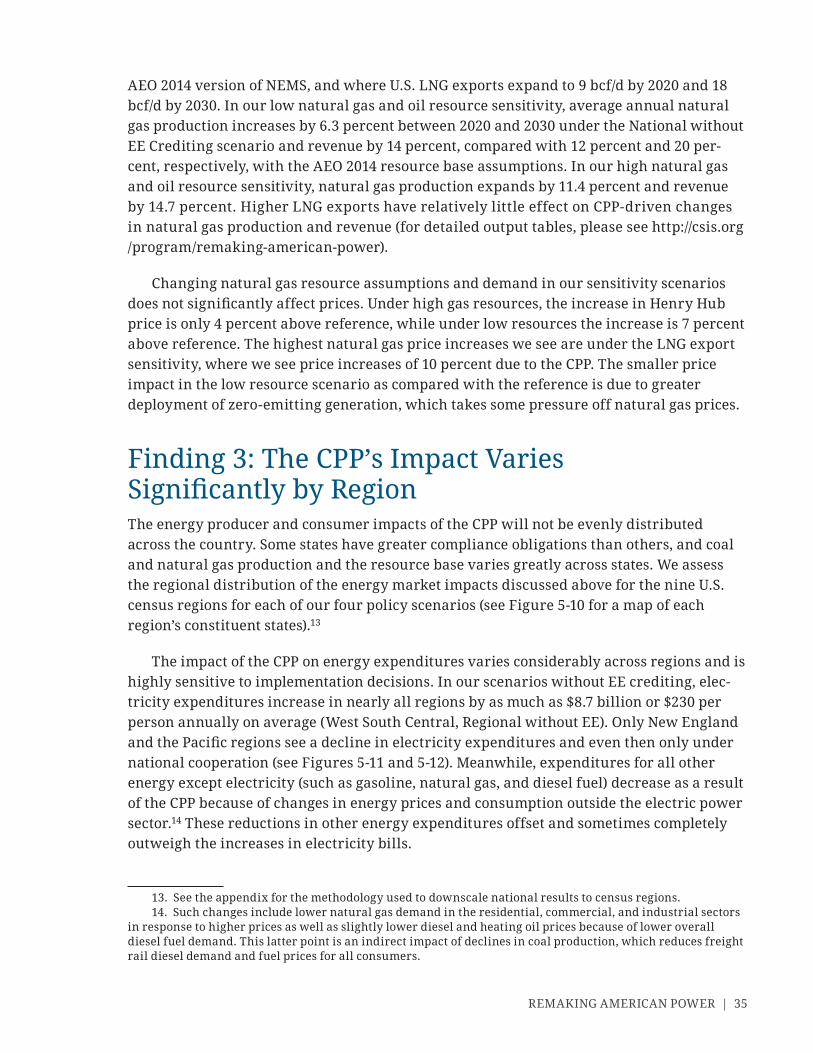
REMAKING AMERICAN POWER | 35
AEO 2014 version of NEMS, and where U.S. LNG exports expand to 9 bcf/d by 2020 and 18 bcf/d by 2030. In our low natural gas and oil resource sensitivity, average annual natural gas production increases by 6.3 percent between 2020 and 2030 under the National without EE Crediting scenario and revenue by 14 percent, compared with 12 percent and 20 per-cent, respectively, with the AEO 2014 resource base assumptions. In our high natural gas and oil resource sensitivity, natural gas production expands by 11.4 percent and revenue by 14.7 percent. Higher LNG exports have relatively little effect on CPP- driven changes in natural gas production and revenue (for detailed output tables, please see http:// csis .org /program /remaking -american -power) .
Changing natural gas resource assumptions and demand in our sensitivity scenarios does not signifi cantly affect prices. Under high gas resources, the increase in Henry Hub price is only 4 percent above reference, while under low resources the increase is 7 percent above reference. The highest natural gas price increases we see are under the LNG export sensitivity, where we see price increases of 10 percent due to the CPP. The smaller price impact in the low resource scenario as compared with the reference is due to greater deployment of zero- emitting generation, which takes some pressure off natural gas prices.
Finding 3: The CPP’s Impact Varies Signifi cantly by RegionThe energy producer and consumer impacts of the CPP will not be evenly distributed across the country. Some states have greater compliance obligations than others, and coal and natural gas production and the resource base varies greatly across states. We assess the regional distribution of the energy market impacts discussed above for the nine U.S. census regions for each of our four policy scenarios (see Figure 5-10 for a map of each region’s constituent states).13
The impact of the CPP on energy expenditures varies considerably across regions and is highly sensitive to implementation decisions. In our scenarios without EE crediting, elec-tricity expenditures increase in nearly all regions by as much as $8.7 billion or $230 per person annually on average (West South Central, Regional without EE). Only New En gland and the Pacifi c regions see a decline in electricity expenditures and even then only under national cooperation (see Figures 5- 11 and 5- 12). Meanwhile, expenditures for all other energy except electricity (such as gasoline, natural gas, and diesel fuel) decrease as a result of the CPP because of changes in energy prices and consumption outside the electric power sector.14 These reductions in other energy expenditures offset and sometimes completely outweigh the increases in electricity bills.
13. See the appendix for the methodology used to downscale national results to census regions.14. Such changes include lower natural gas demand in the residential, commercial, and industrial sectors
in response to higher prices as well as slightly lower diesel and heating oil prices because of lower overall diesel fuel demand. This latter point is an indirect impact of declines in coal production, which reduces freight rail diesel demand and fuel prices for all consumers.
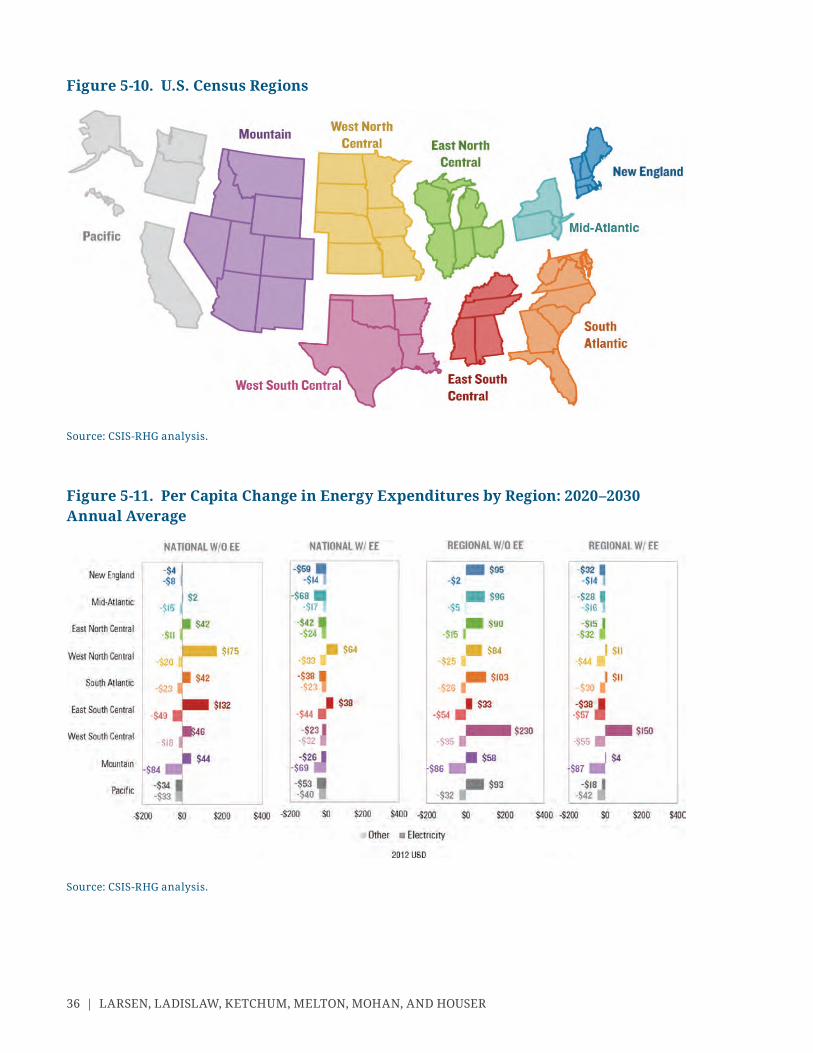
36 | LARSEN, LADISLAW, KETCHUM, MELTON, MOHAN, AND HOUSER
Figure 5- 10. U.S. Census Regions
Source: CSIS- RHG analysis.
Figure 5- 11. Per Capita Change in Energy Expenditures by Region: 2020– 2030 Annual Average
Source: CSIS- RHG analysis.
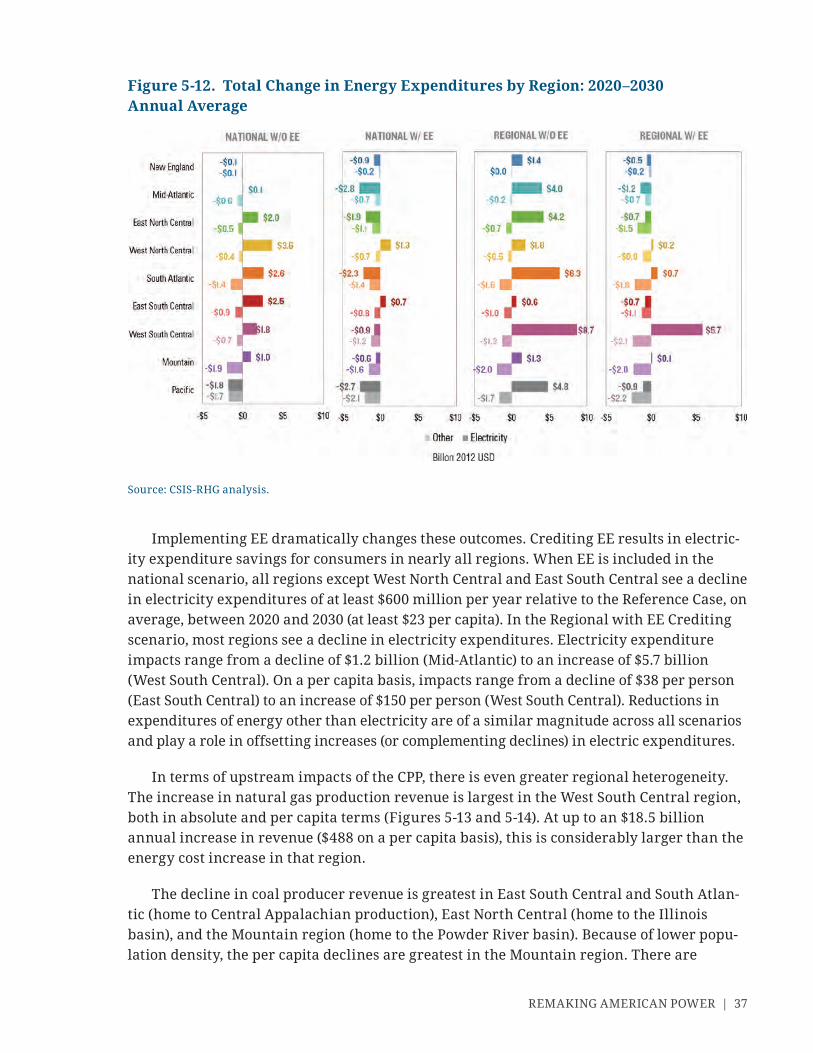
REMAKING AMERICAN POWER | 37
Figure 5- 12. Total Change in Energy Expenditures by Region: 2020– 2030 Annual Average
Source: CSIS- RHG analysis.
Implementing EE dramatically changes these outcomes. Crediting EE results in electric-ity expenditure savings for consumers in nearly all regions. When EE is included in the national scenario, all regions except West North Central and East South Central see a decline in electricity expenditures of at least $600 million per year relative to the Reference Case, on average, between 2020 and 2030 (at least $23 per capita). In the Regional with EE Crediting scenario, most regions see a decline in electricity expenditures. Electricity expenditure impacts range from a decline of $1.2 billion (Mid- Atlantic) to an increase of $5.7 billion (West South Central). On a per capita basis, impacts range from a decline of $38 per person (East South Central) to an increase of $150 per person (West South Central). Reductions in expenditures of energy other than electricity are of a similar magnitude across all scenarios and play a role in offsetting increases (or complementing declines) in electric expenditures.
In terms of upstream impacts of the CPP, there is even greater regional heterogeneity. The increase in natural gas production revenue is largest in the West South Central region, both in absolute and per capita terms (Figures 5- 13 and 5- 14). At up to an $18.5 billion annual increase in revenue ($488 on a per capita basis), this is considerably larger than the energy cost increase in that region.
The decline in coal producer revenue is greatest in East South Central and South Atlan-tic (home to Central Appalachian production), East North Central (home to the Illinois basin), and the Mountain region (home to the Powder River basin). Because of lower popu-lation density, the per capita declines are greatest in the Mountain region. There are
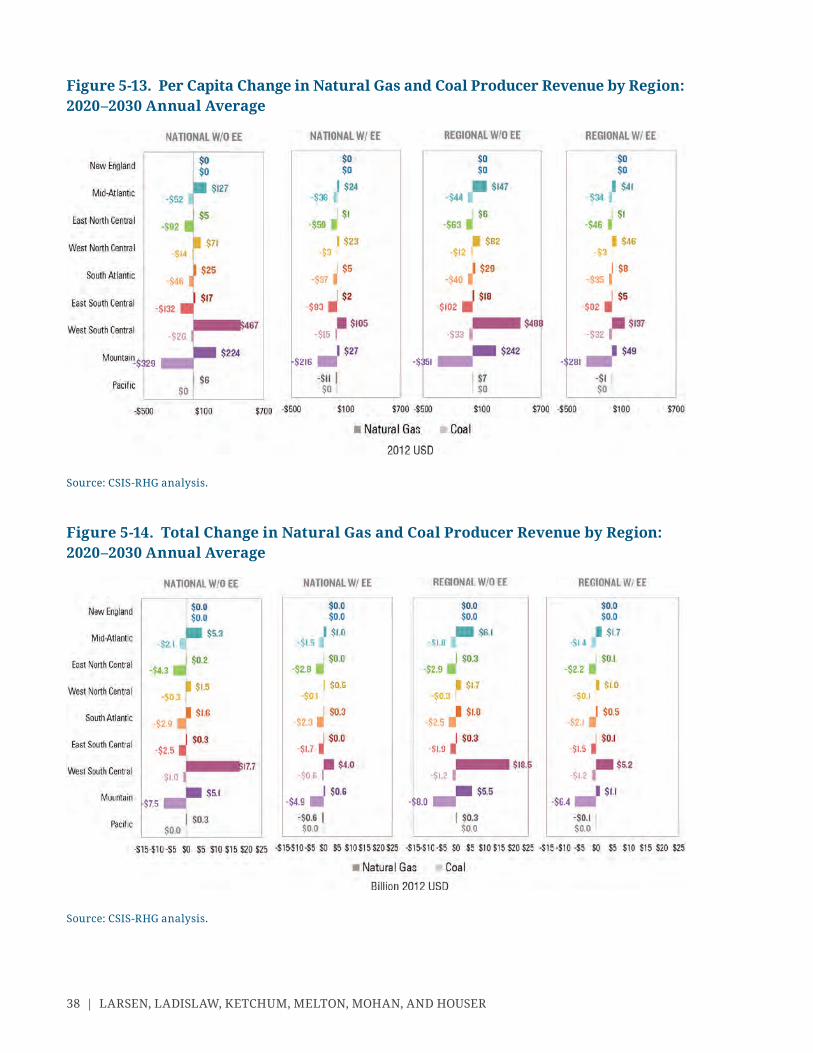
38 | LARSEN, LADISLAW, KETCHUM, MELTON, MOHAN, AND HOUSER
Figure 5- 14. Total Change in Natural Gas and Coal Producer Revenue by Region: 2020– 2030 Annual Average
Source: CSIS- RHG analysis.
Figure 5- 13. Per Capita Change in Natural Gas and Coal Producer Revenue by Region: 2020– 2030 Annual Average
Source: CSIS- RHG analysis.
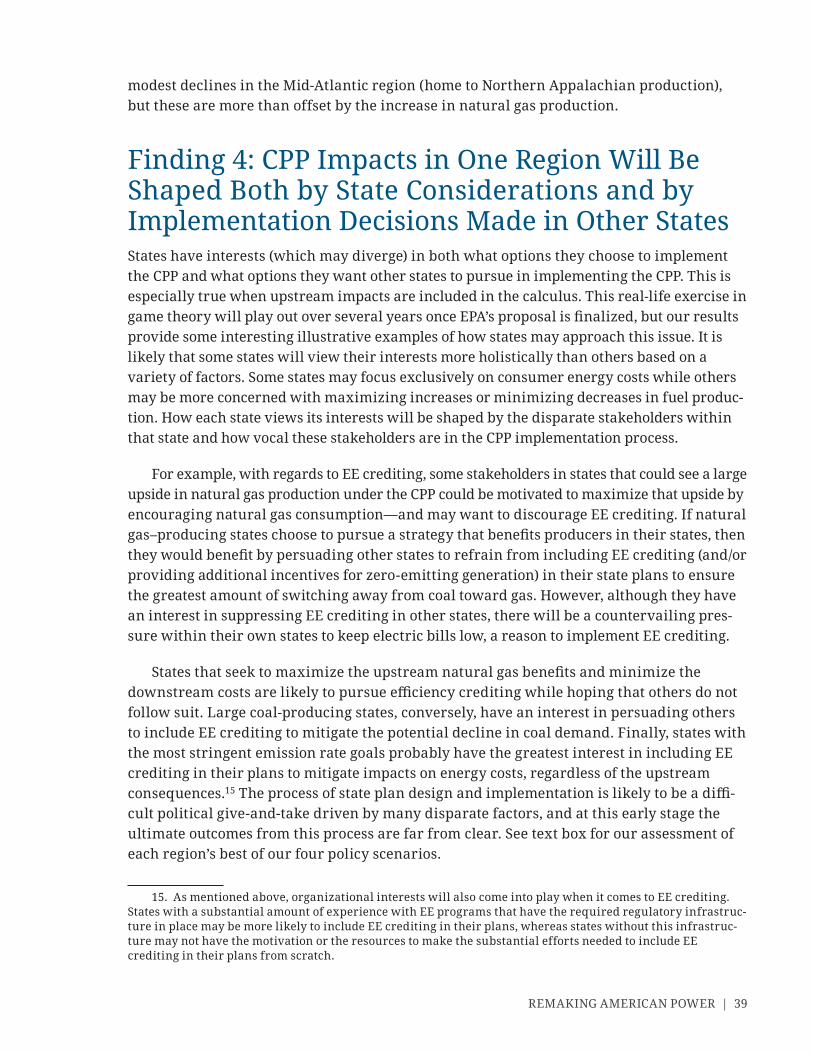
REMAKING AMERICAN POWER | 39
modest declines in the Mid- Atlantic region (home to Northern Appalachian production), but these are more than offset by the increase in natural gas production.
Finding 4: CPP Impacts in One Region Will Be Shaped Both by State Considerations and by Implementation Decisions Made in Other StatesStates have interests (which may diverge) in both what options they choose to implement the CPP and what options they want other states to pursue in implementing the CPP. This is especially true when upstream impacts are included in the calculus. This real- life exercise in game theory will play out over several years once EPA’s proposal is fi nalized, but our results provide some interesting illustrative examples of how states may approach this issue. It is likely that some states will view their interests more holistically than others based on a variety of factors. Some states may focus exclusively on consumer energy costs while others may be more concerned with maximizing increases or minimizing decreases in fuel produc-tion. How each state views its interests will be shaped by the disparate stakeholders within that state and how vocal these stakeholders are in the CPP implementation pro cess.
For example, with regards to EE crediting, some stakeholders in states that could see a large upside in natural gas production under the CPP could be motivated to maximize that upside by encouraging natural gas consumption— and may want to discourage EE crediting. If natural gas– producing states choose to pursue a strategy that benefi ts producers in their states, then they would benefi t by persuading other states to refrain from including EE crediting (and/or providing additional incentives for zero- emitting generation) in their state plans to ensure the greatest amount of switching away from coal toward gas. However, although they have an interest in suppressing EE crediting in other states, there will be a countervailing pres-sure within their own states to keep electric bills low, a reason to implement EE crediting.
States that seek to maximize the upstream natural gas benefi ts and minimize the downstream costs are likely to pursue effi ciency crediting while hoping that others do not follow suit. Large coal- producing states, conversely, have an interest in persuading others to include EE crediting to mitigate the potential decline in coal demand. Finally, states with the most stringent emission rate goals probably have the greatest interest in including EE crediting in their plans to mitigate impacts on energy costs, regardless of the upstream consequences.15 The pro cess of state plan design and implementation is likely to be a diffi -cult po liti cal give- and- take driven by many disparate factors, and at this early stage the ultimate outcomes from this pro cess are far from clear. See text box for our assessment of each region’s best of our four policy scenarios.
15. As mentioned above, or gan i za tion al interests will also come into play when it comes to EE crediting. States with a substantial amount of experience with EE programs that have the required regulatory infrastruc-ture in place may be more likely to include EE crediting in their plans, whereas states without this infrastruc-ture may not have the motivation or the resources to make the substantial efforts needed to include EE crediting in their plans from scratch.

40 | LARSEN, LADISLAW, KETCHUM, MELTON, MOHAN, AND HOUSER
High- Level Regional Findings: “Best Case” Scenarios
New En gland
Best Scenario: National with EE Crediting. New En gland has virtually no fossil fuel production and little to lose or gain upstream under any CPP implementation sce-nario. The region benefi ts from increased cooperation and effi ciency crediting as both reduce consumer energy costs.
Mid- Atlantic
Best Scenario: National without EE Crediting. The Mid- Atlantic sees a signifi cant increase in natural gas production revenues, enough to outweigh the decline in coal production revenue in all scenarios except National with EE Crediting. Consumer energy cost increases are modest or negative in all scenarios except Regional with-out EE Crediting.
East North Central
Best Scenario: National with EE Crediting. East North Central sees a net decline in fossil fuel production revenue across all scenarios because of signifi cant coal production losses. Broader cooperation and effi ciency crediting reduce consumer energy costs.
West North Central
Best Scenario: Regional with EE Crediting. West North Central sees a modest net increase in fossil fuel production revenue in all scenarios. Consumers’ electricity bills rise in all scenarios but least in the Regional with EE Crediting case as the regional emission rate target is above the national average.
South Atlantic
Best Scenario: National with EE Crediting. South Atlantic sees a decline in coal production revenue in all scenarios, mitigated but not outweighed by increased natural gas production revenue. The region sees less of an increase in consumer energy expenditures with broader cooperation and effi ciency crediting.
East South Central
Best Scenario: Regional with EE Crediting. Like South Atlantic, East South Central sees a decline in coal production revenue in all scenarios, mitigated but not out-weighed by increased natural gas production revenue. The region sees an increase
REMAKING AMERICAN POWER | 41
Choosing whether to cooperate in a multistate plan will signifi cantly impact consumer energy costs. The CPP requires emission rate goals to be adjusted when states band together to implement a multistate plan.16 Given that cooperation reduces national aver-age consumer costs, many states should be motivated to cooperate to some degree, espe-cially given that power markets often do not follow state boundaries. Even so, it is unlikely that states with high emission rate goals will want to partner with states with much lower emission rate goals as such cooperation would produce a multistate plan that is more stringent and costly for those states than if they acted alone. Conversely, states with relatively low emission rate goals will likely be highly motivated to cooperate with other states to reduce compliance costs and consumer impacts. Low- rate goal states will likely need to provide high- rate goal states with compensation or other inducements to encourage cooperation.
16. The current CPP proposal instructs states to combine emission rates into a single multistate emission rate goal by calculating the generation- weighted average of emission rates across cooperating states.
in electricity expenditures in all scenarios except Regional with EE because of a relatively high regional emission rate target.
West South Central
Best Scenario: National without EE Crediting. West South Central sees a large in-crease in natural gas production revenue that far outweighs the decline in coal production revenue. The region sees less of an increase in consumer energy costs with broader cooperation. EE crediting reduces energy costs within the region but if applied nationally reduces natural gas production revenue even more.
Mountain
Best Scenario: National without EE Crediting. The Mountain region sees a large increase in natural gas production revenue and an even larger decline in coal production revenue in all scenarios. Crediting effi ciency mitigates coal producer losses but has an even larger impact on natural gas producer gains. Broader coop-eration reduces consumer energy costs and provides opportunities for renewable energy exports to other regions.
Pacifi c
Best Scenario: National with EE Crediting. With almost no fossil fuel production, the Pacifi c region’s interests lie in minimizing consumer energy costs and maximizing opportunities for renewable energy trade with other regions.

42 | LARSEN, LADISLAW, KETCHUM, MELTON, MOHAN, AND HOUSER
Cooperation will also shape the ability of states with renewable and nuclear genera-tion to fully exploit those resources. Absent a multistate implementation plan or preexist-ing RPS, a state that imports wind power from a neighbor may not be able to claim credit against its CPP targets. Although the exporting state would be able to claim credit for that generation, it may have more renewable energy supply than required to meet its CPP target.
In the end, noneconomic factors such as a history of regional cooperative air regulation (as in the Northeast), the presence or absence of large multistate wholesale electric power markets (as in much of the Eastern Interconnect), and historical power- importing and - exporting relationships between states will be important factors in determining the actual level of cooperation under the CPP.
Finding 5: No Matter Which Compliance Options Are Chosen, New Infrastructure Is Necessary to Realize the Benefi ts of the CPP in a Cost- Effective MannerThe ability to meet CPP emission rate targets at relatively modest cost to consumers can be distilled into four words: cheap, abundant natural gas. Until recently, domestic natural gas was neither cheap nor abundant and the United States was projected to import natural gas at relatively high prices. However, success in unlocking the economic, technological, and commercial viability of tremendous unconventional natural gas resources within the United States has dramatically increased domestic natural gas production, both in tradi-tional producing regions around Texas, Louisiana, and Oklahoma and in new regions such as Pennsylvania and Ohio. Between 2006 and 2013, shale gas production increased by almost 900 percent.17 The result has been low, stable natural gas prices, hovering between $3 and $5 per MMBTU— a marked contrast with the years preceding 2009, when prices fl uctuated between $5 and $12 per MMBTU. EIA estimates put the U.S. natural resource base at 610 trillion cubic feet (TCF) of technically recoverable shale gas, not including conventional natural gas resources and 308 TCF of proved dry gas reserves. Abundant and cheap natural gas has resulted in natural gas capturing an increasing share of electricity generation (from 21 percent in 2008 to 27 percent in 2013).
However, if natural gas is to play a growing role in electricity generation, as forecast in our scenarios, cheap, abundant gas is a necessary condition but not a suffi cient one. The unpre ce dented pace and scale of domestic natural gas production has resulted in a need for rapid changes in the U.S. natural gas infrastructure system. In order to seamlessly and
17. Production levels rose from 3 billion cubic feet per day in 2006 to almost 27 billion cubic feet per day in 2013. Adam Sieminski, “Outlook for U.S. Shale Oil and Gas” (pre sen ta tion, Argus Americas Crude Summit, Houston, TX, January 22, 2014), 4, http:// www .eia .gov /pressroom /presentations /sieminski _01222014 .pdf .
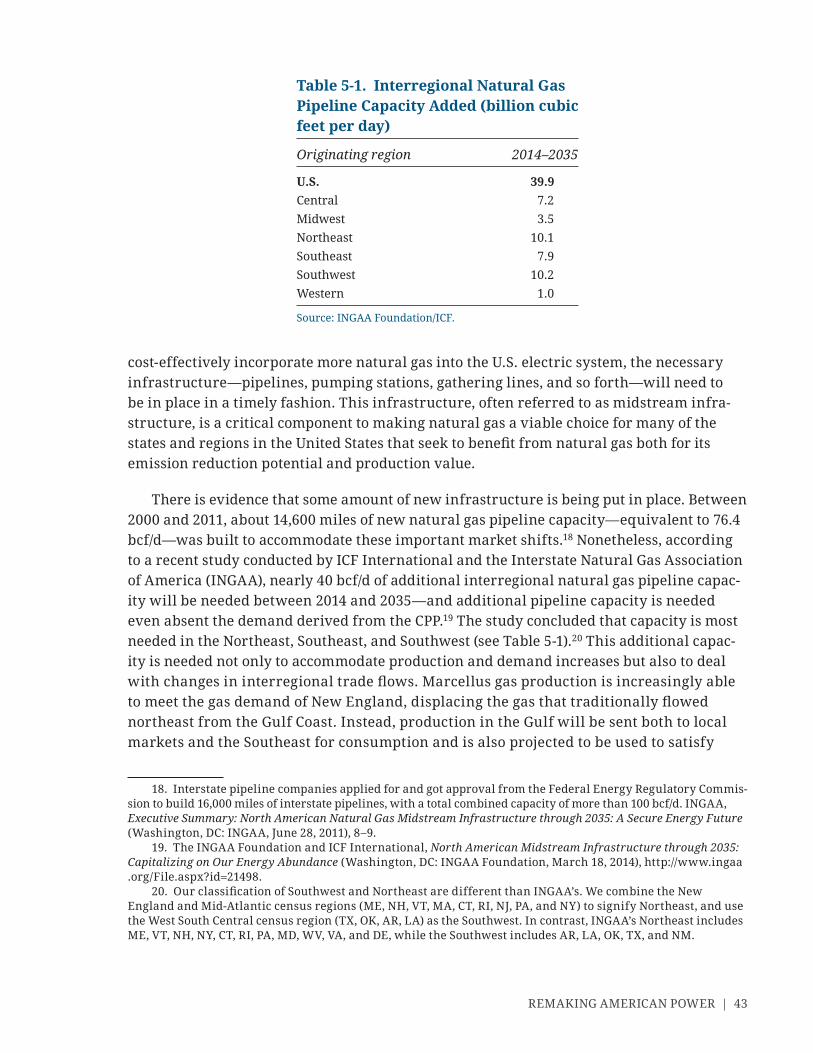
REMAKING AMERICAN POWER | 43
cost- effectively incorporate more natural gas into the U.S. electric system, the necessary infrastructure— pipelines, pumping stations, gathering lines, and so forth— will need to be in place in a timely fashion. This infrastructure, often referred to as midstream infra-structure, is a critical component to making natural gas a viable choice for many of the states and regions in the United States that seek to benefi t from natural gas both for its emission reduction potential and production value.
There is evidence that some amount of new infrastructure is being put in place. Between 2000 and 2011, about 14,600 miles of new natural gas pipeline capacity— equivalent to 76.4 bcf/d— was built to accommodate these important market shifts.18 Nonetheless, according to a recent study conducted by ICF International and the Interstate Natural Gas Association of America (INGAA), nearly 40 bcf/d of additional interregional natural gas pipeline capac-ity will be needed between 2014 and 2035— and additional pipeline capacity is needed even absent the demand derived from the CPP.19 The study concluded that capacity is most needed in the Northeast, Southeast, and Southwest (see Table 5- 1).20 This additional capac-ity is needed not only to accommodate production and demand increases but also to deal with changes in interregional trade fl ows. Marcellus gas production is increasingly able to meet the gas demand of New En gland, displacing the gas that traditionally fl owed northeast from the Gulf Coast. Instead, production in the Gulf will be sent both to local markets and the Southeast for consumption and is also projected to be used to satisfy
18. Interstate pipeline companies applied for and got approval from the Federal Energy Regulatory Commis-sion to build 16,000 miles of interstate pipelines, with a total combined capacity of more than 100 bcf/d. INGAA, Executive Summary: North American Natural Gas Midstream Infrastructure through 2035: A Secure Energy Future (Washington, DC: INGAA, June 28, 2011), 8– 9.
19. The INGAA Foundation and ICF International, North American Midstream Infrastructure through 2035: Capitalizing on Our Energy Abundance (Washington, DC: INGAA Foundation, March 18, 2014), http:// www .ingaa .org /File .aspx ?id=21498 .
20. Our classifi cation of Southwest and Northeast are different than INGAA’s. We combine the New En gland and Mid- Atlantic census regions (ME, NH, VT, MA, CT, RI, NJ, PA, and NY) to signify Northeast, and use the West South Central census region (TX, OK, AR, LA) as the Southwest. In contrast, INGAA’s Northeast includes ME, VT, NH, NY, CT, RI, PA, MD, WV, VA, and DE, while the Southwest includes AR, LA, OK, TX, and NM.
Table 5- 1. Interregional Natural Gas Pipeline Capacity Added (billion cubic feet per day)
Originating region 2014– 2035
U.S. 39.9Central 7.2Midwest 3.5Northeast 10.1Southeast 7.9Southwest 10.2Western 1.0
Source: INGAA Foundation/ICF.
44 | LARSEN, LADISLAW, KETCHUM, MELTON, MOHAN, AND HOUSER
export markets. Greater Rocky Mountain region production will be consumed on the West Coast, helping offset declines from Canada.21
Our model assumes that infrastructure will be fi nanced and built to enable rela-tively seamless natural gas delivery. Yet recent developments have challenged the valid-ity of this assumption. For example, in the winter of 2013– 2014, an unusual, prolonged, and geo graph i cally expansive cold snap (the so- called polar vortex) resulted in acute price spikes (and in some cases physical shortages because of infrastructure con-straints) in some energy markets, including natural gas and propane. In some cases, these commodity price spikes resulted in dramatic price increases in the electricity sector as well. This situation called into question the potential impacts of infrastructure constraints.22
In all CPP scenarios and sensitivity cases, gas demand and production is higher on a national basis and mostly higher on a regional basis compared with the Reference Case. The national level range is 1– 5 TCF (demand) and 3– 8 TCF (production) above the Reference Case.23 In the Northeast and Southwest (areas where INGAA already identifi ed signifi cant pipeline capacity needs), our modeling fi nds an increase in demand of 0– 1 and 0– 2 TCF above the Reference Case (respectively) and an increase in production of 1– 2 and 2– 5 TCF. This does not take into account infrastructure needed to move gas internally within a region. A more precise estimate of the pipeline infrastructure needs in and between each region is warranted, especially given that certain regions of the country, the Northeast in par tic u lar, are already struggling to put in place natural gas pipeline infrastructure to meet peak winter power generation demand.
The CPP will require a greater need for many types of infrastructure, not just natu-ral gas infrastructure. In several scenarios, additional electric power transmission lines are necessary to enable lower carbon power generation options to meet various regional power generation needs. This is particularly true in the scenarios where cooperation and energy effi ciency options are constrained. In scenarios without EE, stronger electric-ity demand requires more transmission lines. In scenarios with less cooperation, more transmission infrastructure is necessary to connect new generation (by contrast, in the scenarios with cooperation, instead of building new generation and new transmis-sion, states and regions can trade credits). Interestingly, these are the most expensive scenarios, suggesting, in part, that it is more expensive to force states and regions to trade electricity than it is for them to trade gas, even when infrastructure is assumed to be built.
21. The INGAA/ICF report provides much more detail about changing natural gas fl ows. See INGAA Foundation, 2014, 9– 10.
22. Sarah O. Ladislaw and Michelle Melton, “Polar Vortex, Propane Shortages, and Power Price Spikes: Perfect Storm or Signal for Broader Debate?,” CSIS Commentary, February 15, 2014, http:// csis .org /publication /polar -vortex -propane -shortages -and -power -price -spikes -perfect -storm -or -signal -broader -de .
23. Note we are comparing the gas increase in these scenarios to the EIA reference case relied on earlier in the study and not the ICF base case used in the INGAA study. It is safe to assume there are differences between the two baselines, but the comparison is meant to be illustrative.

REMAKING AMERICAN POWER | 45
These types of energy infrastructure commonly face economic, regulatory, and social challenges to being built, and those real- life challenges could constrain or alter some of the upstream and downstream impacts in the various CPP scenarios. Nonetheless, it is clear from our modeling that infrastructure will be necessary to achieve a low- cost, benefi t- maximizing, and disruption- minimizing CPP implementation. Thus, policymakers inter-ested in ensuring a smooth transition will need to ensure that the incentives for fi nancing and building natural gas infrastructure are aligned with the broader policy goals in the electricity sector.
46 |
Conclusion
The Clean Power Plan has the potential to remake the American electric power sector, with far- reaching implications for the energy sector as a whole. Given that the CPP is
not yet fi nal, and given the wide implementation latitude afforded to the states, it is not yet possible to defi nitively project its impact. However, based on the draft proposal, the follow-ing is clear:
1. Implementation matters: State implementation decisions will determine the energy market and climate impacts of the CPP. Two extremely important design choices for states to make are the degree to which states cooperate in meeting the CPP’s CO2 emission targets and whether (and the extent to which) they rely on energy effi ciency to do so. Both design elements shape consumer costs at both a regional and national level. Interstate cooperation and energy effi ciency can substantially reduce impacts of the CPP on house hold and business energy bills, though energy effi ciency programs can also reduce overall emissions reductions under the CPP.
2. Domestic shale gas helps make the proposed rule both more affordable and more effective. Because of relatively low- cost natural gas, we fi nd that the most cost- effective means of meeting CPP standards through changes in power generation is by switching from existing coal- fi red power plants to NGCC plants. This is true across all policy design scenarios we model and remains true if shale gas resources are lower than currently expected and if LNG exports are higher than currently expected. This has signifi cant implications for both coal and natural gas producers. Indeed, in economic terms, the upstream impacts of the CPP may well be of a bigger magnitude than the proposal’s downstream effects.
3. The CPP’s impact varies signifi cantly by region. Given regional differences in power generation, the CPP’s impact on electric power plants and electricity consum-ers varies signifi cantly across states. The upstream impacts are even more regionally heterogeneous and in some states signifi cantly larger than the downstream effects. For example, a number of natural gas– producing states that potentially face the largest electricity price increases as a result of the CPP also stand to gain from an increase in natural gas demand nationwide. Yet these gains are highly sensitive to implementation design, both within and outside of state and regional boundaries.
4. CPP impacts in one region will be shaped both by state considerations and by implementation decisions made in other states. Because energy markets do not
6
REMAKING AMERICAN POWER | 47
follow state lines, the impact of the CPP in one state will depend on implementation choices made in others. For example, including energy effi ciency crediting in state implementation plans could reduce consumer energy costs in the states in which those plans are adopted. It could also affect coal and natural gas production revenue in other states. Likewise, the extent to which a state rich in renewable energy re-sources commercializes them will be shaped by the willingness of neighboring states to cooperate in developing implementation plans.
5. No matter which compliance options are chosen, new infrastructure is neces-sary to realize the benefi ts of the CPP in a cost- effective manner. The availability of electricity transmission lines and natural gas pipelines (including pipelines, gathering lines, pumping facilities, etc.) is necessary (though not suffi cient) for cost- effective CPP implementation. However, ensuring that there is adequate infra-structure to respond to CPP- driven changes in demand and supply will take plan-ning and investment to be realized; it is not automatic.
Our study demonstrates that natural gas is likely to be the primary supply- side compli-ance option through which states and regions meet their CPP emission rate targets. The Obama administration considers natural gas a “bridge fuel” to a cleaner energy future, but how long natural gas will play this role remains unclear.1 While in the short- to medium- term, the benefi ts of meeting CPP targets by pursuing greater natural gas use appears relatively straightforward, the long- term role of natural gas in the electric system remains undecided because of the lingering question about how near- term reliance on natural gas affects options for further decarbonization post- 2030 and the larger energy sector debate about the impact of methane on the climate impact of gas use—issues not taken up in this report. The CPP proposal is silent about the role that natural gas will play in the electric system beyond 2030, and it is not clear where natural gas will fi t or what kind of role it will play if steeper emissions reductions are required to meet long- term GHG reduction goals.
At the same time, per sis tent concerns stemming from a lack of information about methane leakage from the natural gas production and distribution system have led to questions about the total climate impact of natural gas generation. These issues will need to be dealt with in order to fully reap the climate benefi ts of the rule. Industry and regula-tors are currently working on ways to reduce methane emissions throughout the natural gas value chain through a variety of programs, technology applications, investments, and potential and existing regulations.2 Complementary strategies for reducing such emissions can help ensure that the CPP achieves its desired climate objectives.
1. Barack H. Obama, State of the Union Address, White House Blog, January 28, 2014, http:// www .whitehouse .gov /the -press -offi ce /2014 /01 /28 /president -barack -obamas -state -union -address .
2. The federal government does not directly regulate methane from oil and natural gas systems as of November 2014. However, there has been signifi cant attention focused on the issue, and regulation on at least some methane emission sources is likely. The president’s Climate Action Plan specifi cally addressed reducing methane emissions. That plan called for developing an interagency methane strategy and pursing a collaborative (i.e., public- private) approach to reducing emissions. Following this, the administration released an interagency guidance strategy document that discussed steps for reducing methane emissions. The efforts to curb methane emissions are not limited to the oil and gas sector, although they have received much attention on this matter. Other agencies on the government’s interagency methane task force include the Department of Agriculture, the

48 | LARSEN, LADISLAW, KETCHUM, MELTON, MOHAN, AND HOUSER
Despite these uncertainties, it is clear that considering the upstream and downstream impacts of the CPP proposal provides a much more complex and nuanced picture of the likely impacts of various options for states as they consider the possible design options and state- level policy options at their disposal. Although the CPP is a complicated proposal and will be implemented in an already complex and dynamic system, it also holds signifi cant upside for the nation and for certain regions and stakeholders.
Department of Interior, the Department of Labor, and the Department of Transportation. The administration’s methane strategy lays out the future of regulatory action, including action on landfi lls, coal mines, agriculture, and oil and gas. Within the oil and gas sector, EPA is directed to determine how to best pursue methane emissions reductions (not limited to regulation). For more information, see White House, Climate Action Plan: Strategy to Reduce Methane Emissions, March 2014, http:// www .whitehouse .gov /sites /default /fi les /strategy _to _reduce _meth ane _emissions _2014 -03 -28 _fi nal .pdf. EPA has released fi ve white papers on methane and volatile organic com-pound emissions for public comment, but future regulation is uncertain. See U.S. Environmental Protection Agency, “White Papers,” http:// www .epa .gov /airquality /oilandgas /whitepapers .html. EPA is using these papers to determine its future course of action on methane emissions. Other agencies are pursuing similar strategies. Some private- sector companies are also working to reduce methane emissions. Six international energy compa-nies are voluntarily working with more than a dozen governments through a new UN framework to bring down methane emissions, although targets have not be announced. See William Mauldin, Amy Harder, and Erin Ailworth, “Six Energy Firms to Sign Pact to Cut Methane Emissions,” Wall Street Journal, September 22, 2014, http:// online .wsj .com /articles /six -energy -fi rms -to -sign -u -n -brokered -pact -to -cut -methane -emissions -1411417123 .
| 49
Reference Case, Policy, and Sensitivity Scenarios: Assumptions and Policy CharacterizationData tables and additional references can be found online at http:// csis .org /program /remak ing -american -power .
NEMS OVERVIEW
Our analysis of the Clean Power Plan relies on the RHG- NEMS model, a version of EIA’s National Energy Modeling System maintained by the Rhodium Group. EIA uses NEMS to produce its Annual Energy Outlook, which projects the production, conversion, consump-tion, trade, and price of energy in the United States through 2040. RHG- NEMS is an energy- economic model that combines a detailed repre sen ta tion of the U.S. energy sector with a macroeconomic model provided by IHS Global Insight. The version of RHG- NEMS used for this analysis is keyed to the 2014 version of the AEO. The Reference Case used in this analy-sis includes the same assumptions and generates the results as AEO 2014 with one excep-tion. We include EPA’s New Source Per for mance Standards for CO2 emissions from new fossil fuel– fi red power plants. This assumption prohibits the model from constructing new conventional coal units without CCS. Complete NEMS documentation is available on the EIA’s website at http:// www .eia .gov /reports /index .cfm ?t=Model Documentation. Documen-tation of the macroeconomic and energy sector assumptions used in the AEO 2014 version of NEMS is available at http:// www .eia .gov /forecasts /aeo /index .cfm .
RHG- NEMS is designed as a modular system, with a module for each major source of energy supply, conversion activity, and demand sector, as well as the international energy market and the U.S. economy (Figure A1). The integrating module acts as a control panel, executing other NEMS modules to ensure energy market equilibrium in each projection year. The solution methodology of the modeling system is based on the Gauss- Seidel algo-rithm. Under this approach, the model starts with an initial solution, energy quantities, and prices and then iteratively goes through each of the activated modules to arrive at a new solution. That solution becomes the new starting point, and the above pro cess repeats itself. The cycle repeats until the new solution is within the user- defi ned range of the previous solution. Then the model has “converged,” producing the fi nal output.
Appendix: Methodology
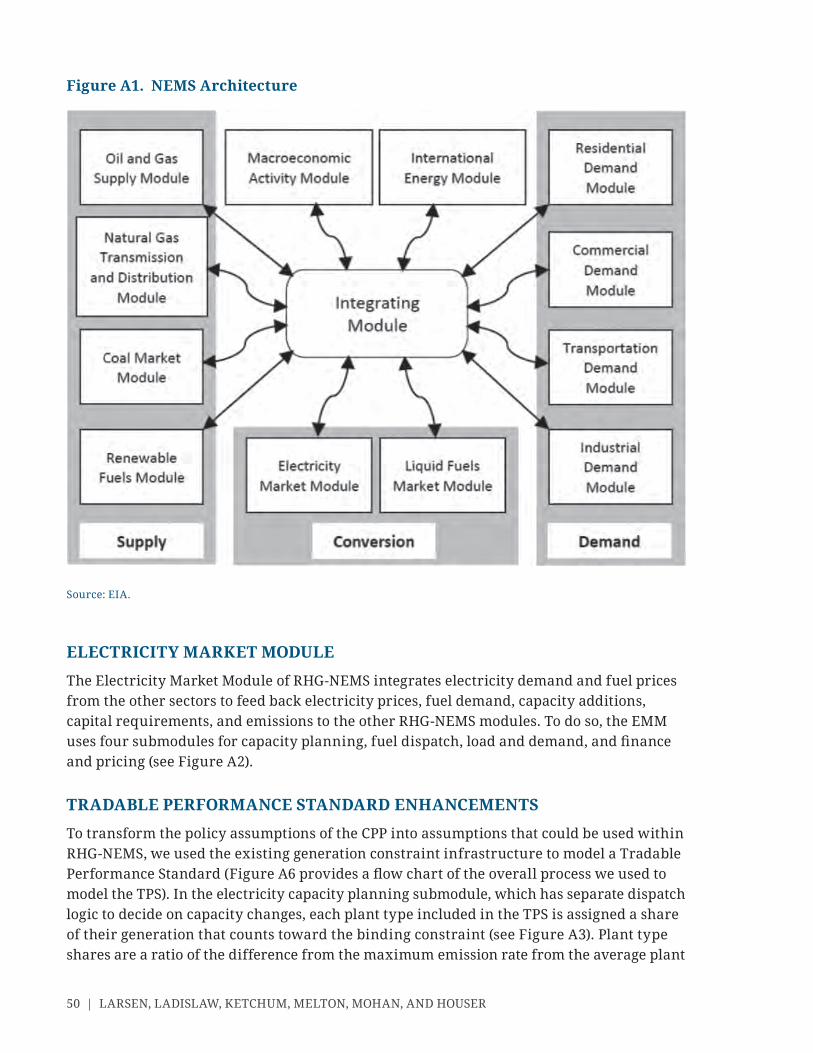
50 | LARSEN, LADISLAW, KETCHUM, MELTON, MOHAN, AND HOUSER
ELECTRICITY MARKET MODULE
The Electricity Market Module of RHG- NEMS integrates electricity demand and fuel prices from the other sectors to feed back electricity prices, fuel demand, capacity additions, capital requirements, and emissions to the other RHG- NEMS modules. To do so, the EMM uses four submodules for capacity planning, fuel dispatch, load and demand, and fi nance and pricing (see Figure A2).
TRADABLE PER FOR MANCE STANDARD ENHANCEMENTS
To transform the policy assumptions of the CPP into assumptions that could be used within RHG- NEMS, we used the existing generation constraint infrastructure to model a Tradable Per for mance Standard (Figure A6 provides a fl ow chart of the overall pro cess we used to model the TPS). In the electricity capacity planning submodule, which has separate dispatch logic to decide on capacity changes, each plant type included in the TPS is assigned a share of their generation that counts toward the binding constraint (see Figure A3). Plant type shares are a ratio of the difference from the maximum emission rate from the average plant
Figure A1. NEMS Architecture
Source: EIA.
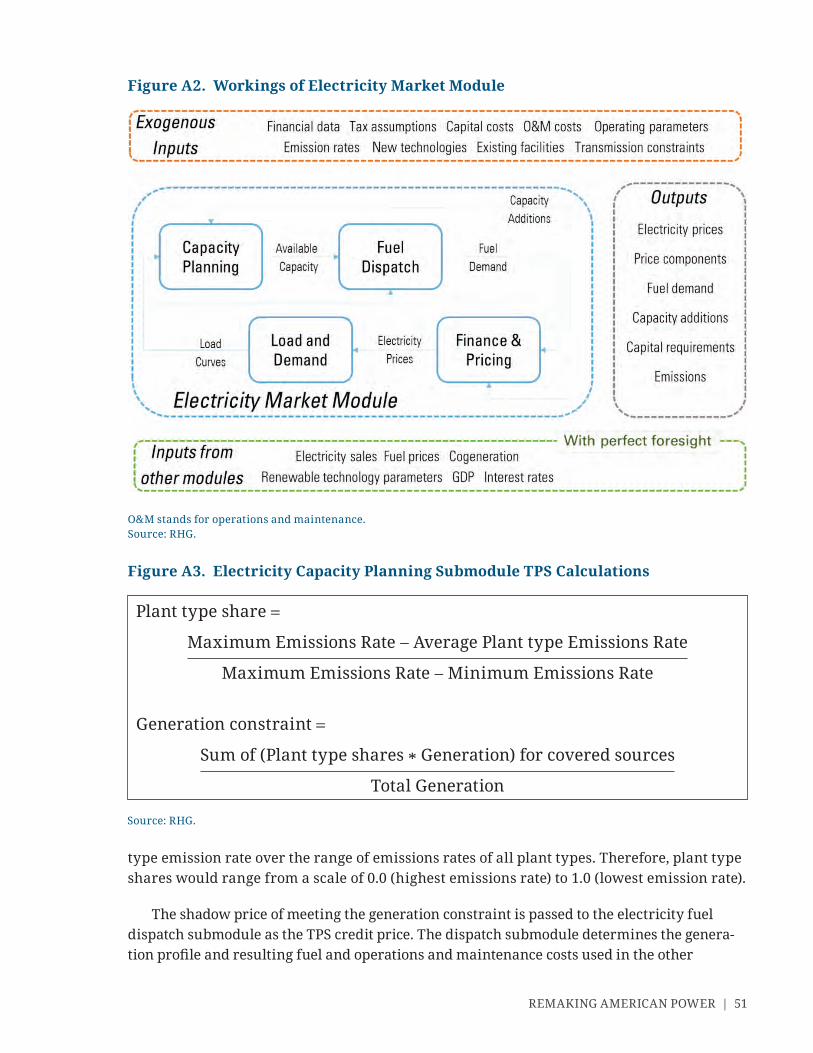
REMAKING AMERICAN POWER | 51
type emission rate over the range of emissions rates of all plant types. Therefore, plant type shares would range from a scale of 0.0 (highest emissions rate) to 1.0 (lowest emission rate).
The shadow price of meeting the generation constraint is passed to the electricity fuel dispatch submodule as the TPS credit price. The dispatch submodule determines the genera-tion profi le and resulting fuel and operations and maintenance costs used in the other
Figure A2. Workings of Electricity Market Module
O&M stands for operations and maintenance.Source: RHG.
Figure A3. Electricity Capacity Planning Submodule TPS Calculations
Plant type share =
Maximum Emissions Rate − Average Plant type Emissions Rate
Maximum Emissions Rate − Minimum Emissions Rate
Generation constraint =
Sum of (Plant type shares * Generation) for covered sources
Total Generation
Source: RHG.
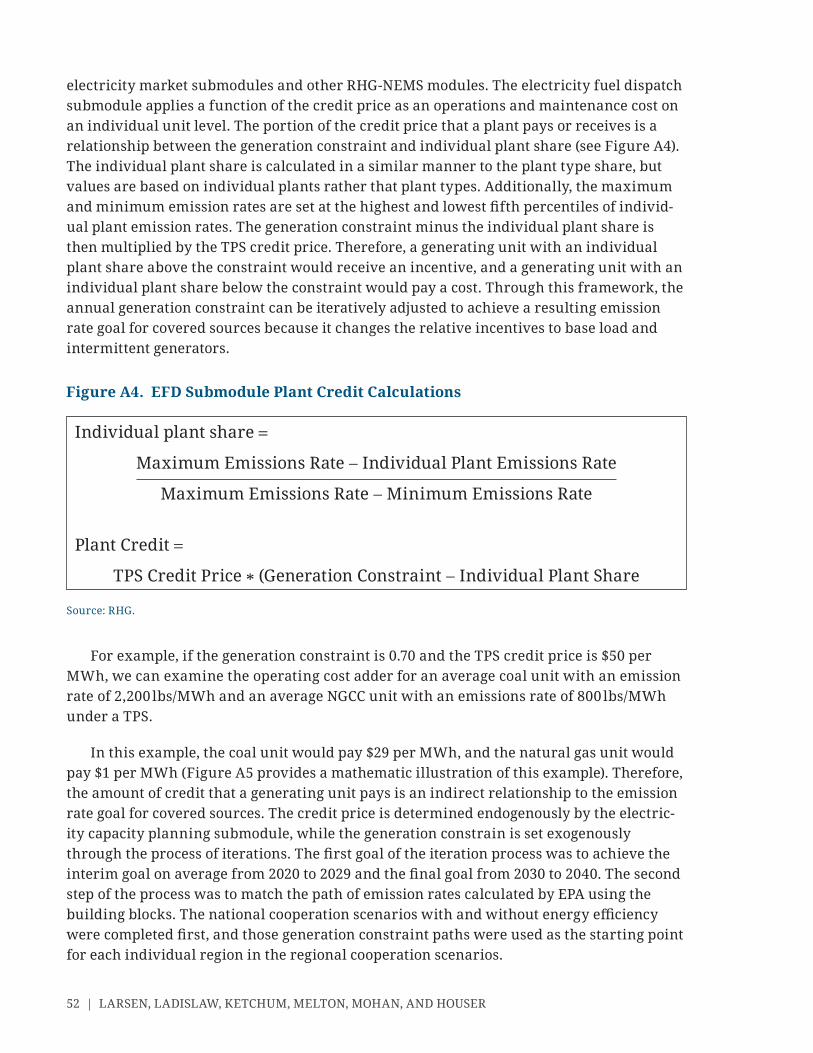
52 | LARSEN, LADISLAW, KETCHUM, MELTON, MOHAN, AND HOUSER
electricity market submodules and other RHG- NEMS modules. The electricity fuel dispatch submodule applies a function of the credit price as an operations and maintenance cost on an individual unit level. The portion of the credit price that a plant pays or receives is a relationship between the generation constraint and individual plant share (see Figure A4). The individual plant share is calculated in a similar manner to the plant type share, but values are based on individual plants rather that plant types. Additionally, the maximum and minimum emission rates are set at the highest and lowest fi fth percentiles of individ-ual plant emission rates. The generation constraint minus the individual plant share is then multiplied by the TPS credit price. Therefore, a generating unit with an individual plant share above the constraint would receive an incentive, and a generating unit with an individual plant share below the constraint would pay a cost. Through this framework, the annual generation constraint can be iteratively adjusted to achieve a resulting emission rate goal for covered sources because it changes the relative incentives to base load and intermittent generators.
For example, if the generation constraint is 0.70 and the TPS credit price is $50 per MWh, we can examine the operating cost adder for an average coal unit with an emission rate of 2,200 lbs/MWh and an average NGCC unit with an emissions rate of 800 lbs/MWh under a TPS.
In this example, the coal unit would pay $29 per MWh, and the natural gas unit would pay $1 per MWh (Figure A5 provides a mathematic illustration of this example). Therefore, the amount of credit that a generating unit pays is an indirect relationship to the emission rate goal for covered sources. The credit price is determined endogenously by the electric-ity capacity planning submodule, while the generation constrain is set exogenously through the pro cess of iterations. The fi rst goal of the iteration pro cess was to achieve the interim goal on average from 2020 to 2029 and the fi nal goal from 2030 to 2040. The second step of the pro cess was to match the path of emission rates calculated by EPA using the building blocks. The national cooperation scenarios with and without energy effi ciency were completed fi rst, and those generation constraint paths were used as the starting point for each individual region in the regional cooperation scenarios.
Figure A4. EFD Submodule Plant Credit Calculations
Individual plant share =
Maximum Emissions Rate − Individual Plant Emissions Rate
Maximum Emissions Rate − Minimum Emissions Rate
Plant Credit =
TPS Credit Price * (Generation Constraint − Individual Plant Share
Source: RHG.
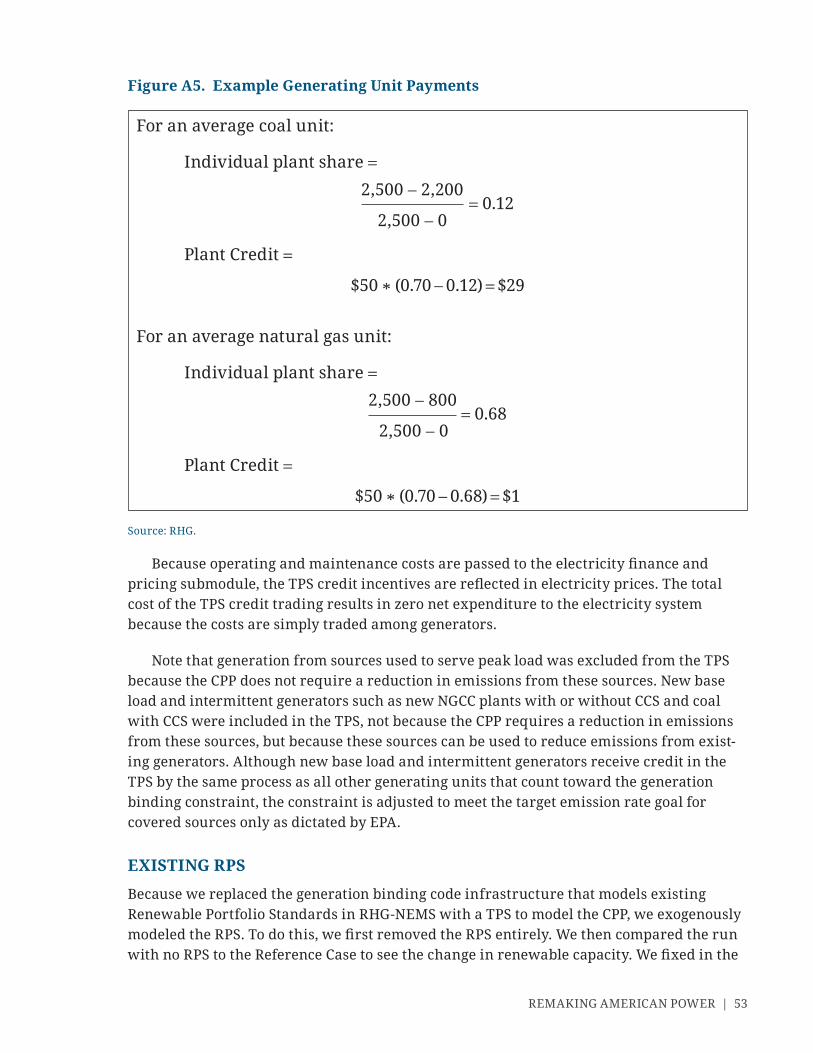
REMAKING AMERICAN POWER | 53
Figure A5. Example Generating Unit Payments
For an average coal unit:
Individual plant share =
2,500 − 2,200
2,500 − 0= 0.12
Plant Credit =
$50 * (0.70 − 0.12) = $29
For an average natural gas unit:
Individual plant share =
2,500 − 800
2,500 − 0= 0.68
Plant Credit =
$50 * (0.70 − 0.68) = $1
Because operating and maintenance costs are passed to the electricity fi nance and pricing submodule, the TPS credit incentives are refl ected in electricity prices. The total cost of the TPS credit trading results in zero net expenditure to the electricity system because the costs are simply traded among generators.
Note that generation from sources used to serve peak load was excluded from the TPS because the CPP does not require a reduction in emissions from these sources. New base load and intermittent generators such as new NGCC plants with or without CCS and coal with CCS were included in the TPS, not because the CPP requires a reduction in emissions from these sources, but because these sources can be used to reduce emissions from exist-ing generators. Although new base load and intermittent generators receive credit in the TPS by the same pro cess as all other generating units that count toward the generation binding constraint, the constraint is adjusted to meet the target emission rate goal for covered sources only as dictated by EPA.
EXISTING RPS
Because we replaced the generation binding code infrastructure that models existing Renewable Portfolio Standards in RHG- NEMS with a TPS to model the CPP, we exogenously modeled the RPS. To do this, we fi rst removed the RPS entirely. We then compared the run with no RPS to the Reference Case to see the change in renewable capacity. We fi xed in the
Source: RHG.
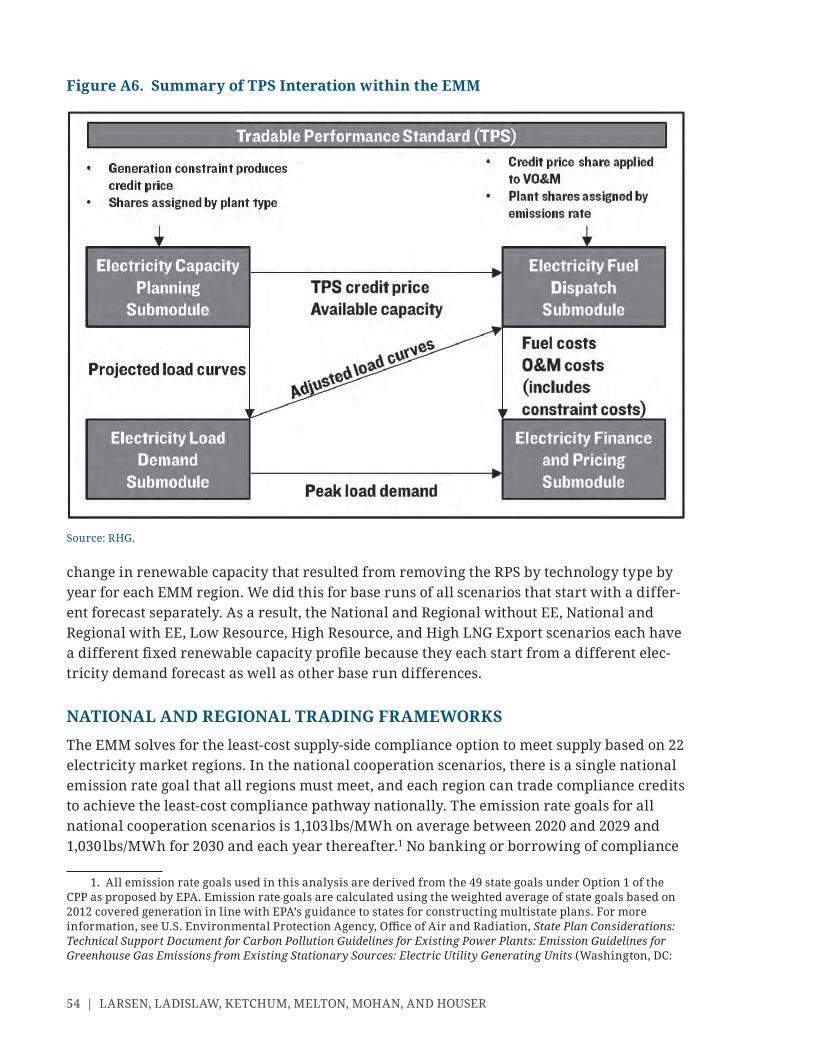
54 | LARSEN, LADISLAW, KETCHUM, MELTON, MOHAN, AND HOUSER
change in renewable capacity that resulted from removing the RPS by technology type by year for each EMM region. We did this for base runs of all scenarios that start with a differ-ent forecast separately. As a result, the National and Regional without EE, National and Regional with EE, Low Resource, High Resource, and High LNG Export scenarios each have a different fi xed renewable capacity profi le because they each start from a different elec-tricity demand forecast as well as other base run differences.
NATIONAL AND REGIONAL TRADING FRAMEWORKS
The EMM solves for the least- cost supply- side compliance option to meet supply based on 22 electricity market regions. In the national cooperation scenarios, there is a single national emission rate goal that all regions must meet, and each region can trade compliance credits to achieve the least- cost compliance pathway nationally. The emission rate goals for all national cooperation scenarios is 1,103 lbs/MWh on average between 2020 and 2029 and 1,030 lbs/MWh for 2030 and each year thereafter.1 No banking or borrowing of compliance
1. All emission rate goals used in this analysis are derived from the 49 state goals under Option 1 of the CPP as proposed by EPA. Emission rate goals are calculated using the weighted average of state goals based on 2012 covered generation in line with EPA’s guidance to states for constructing multistate plans. For more information, see U.S. Environmental Protection Agency, Offi ce of Air and Radiation, State Plan Considerations: Technical Support Document for Carbon Pollution Guidelines for Existing Power Plants: Emission Guidelines for Green house Gas Emissions from Existing Stationary Sources: Electric Utility Generating Units (Washington, DC:
Figure A6. Summary of TPS Interation within the EMM
Source: RHG.
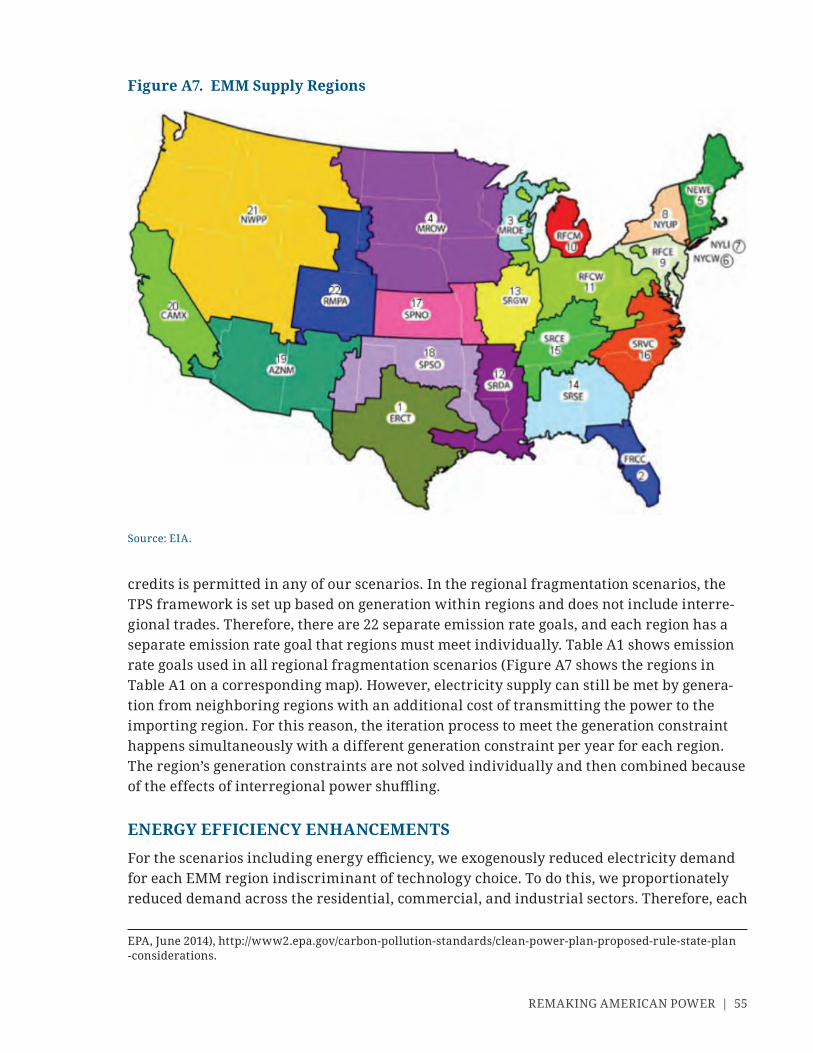
REMAKING AMERICAN POWER | 55
credits is permitted in any of our scenarios. In the regional fragmentation scenarios, the TPS framework is set up based on generation within regions and does not include interre-gional trades. Therefore, there are 22 separate emission rate goals, and each region has a separate emission rate goal that regions must meet individually. Table A1 shows emission rate goals used in all regional fragmentation scenarios (Figure A7 shows the regions in Table A1 on a corresponding map). However, electricity supply can still be met by genera-tion from neighboring regions with an additional cost of transmitting the power to the importing region. For this reason, the iteration pro cess to meet the generation constraint happens simultaneously with a different generation constraint per year for each region. The region’s generation constraints are not solved individually and then combined because of the effects of interregional power shuffl ing.
ENERGY EFFICIENCY ENHANCEMENTS
For the scenarios including energy effi ciency, we exogenously reduced electricity demand for each EMM region indiscriminant of technology choice. To do this, we proportionately reduced demand across the residential, commercial, and industrial sectors. Therefore, each
EPA, June 2014), http:// www2 .epa .gov /carbon -pollution -standards /clean -power -plan -proposed -rule -state -plan -considerations .
Figure A7. EMM Supply Regions
Source: EIA.

56 | LARSEN, LADISLAW, KETCHUM, MELTON, MOHAN, AND HOUSER
EMM region has a different amount of total energy effi ciency that leads to a demand reduc-tion irrespective of policy choice. We then applied the utility cost incurred to provide the energy effi ciency program as part of the operating cost that is included in the distribution utility revenue requirement. This ensures that the utility costs of EE mea sures are fully included in electric rates.
SENSITIVITY SCENARIOS
To analyze natural gas resource availability, we adapted the high and low oil and natural gas resource side case assumptions from the AEO 2014 as constructed by EIA. More infor-mation on these side cases can be found at http:// www .eia .gov /forecasts /aeo /index .cfm. We then used the same pro cess we used in the policy scenarios to fi x renewable capacity and create a TPS.
To analyze a future with increase LNG exports, we assumed that all current LNG export terminals proposed are approved. This leads to an increase in LNG exports of 9 bcf/d (7.7 out of Louisiana and Texas, 0.8 out of Mary land, and 0.5 out of Oregon) by 2020 and 18 bcf/d (an additional 6 out of Louisiana and Texas, an additional 1.5 out of Oregon, and 1.5 out of Mississippi) by 2030. To implement this in NEMS, we scaled up the capacity of LNG export terminal proposals by state to the 12 Natural Gas Transmission and Distribution Module regions presented in Figure A8. For example, terminal proposals for Louisiana and Texas were grouped together in the West South Central region. All sensitivity cases achieve a national cooperation goal with no energy effi ciency and go through the same iteration pro cess to achieve the TPS as the core policy scenarios.
Table A1. Regional Emission Rate Goals (lbs/MWh)
Region 2020–20292030
and later Region 2020– 20292030
and later
1 ERCT 853 791 12 SRDA 945 883 2 FRCC 794 740 13 SRGW 1,494 1,408 3 MROE 1,274 1,198 14 SRSE 993 923 4 MROW 1,389 1,338 15 SRCE 1,509 1,429 5 NEWE 614 565 16 SRVC 973 896 6 NYCW 635 549 17 SPNO 1,587 1,509 7 NYLI 635 549 18 SPSO 901 848 8 NYUP 635 549 19 AZNM 742 705 9 RFCE 1,030 913 20 CAMX 556 53710 RFCM 1,227 1,161 21 NWPP 1,266 1,20011 RFCW 1,499 1,394 22 RMPA 1,408 1,336
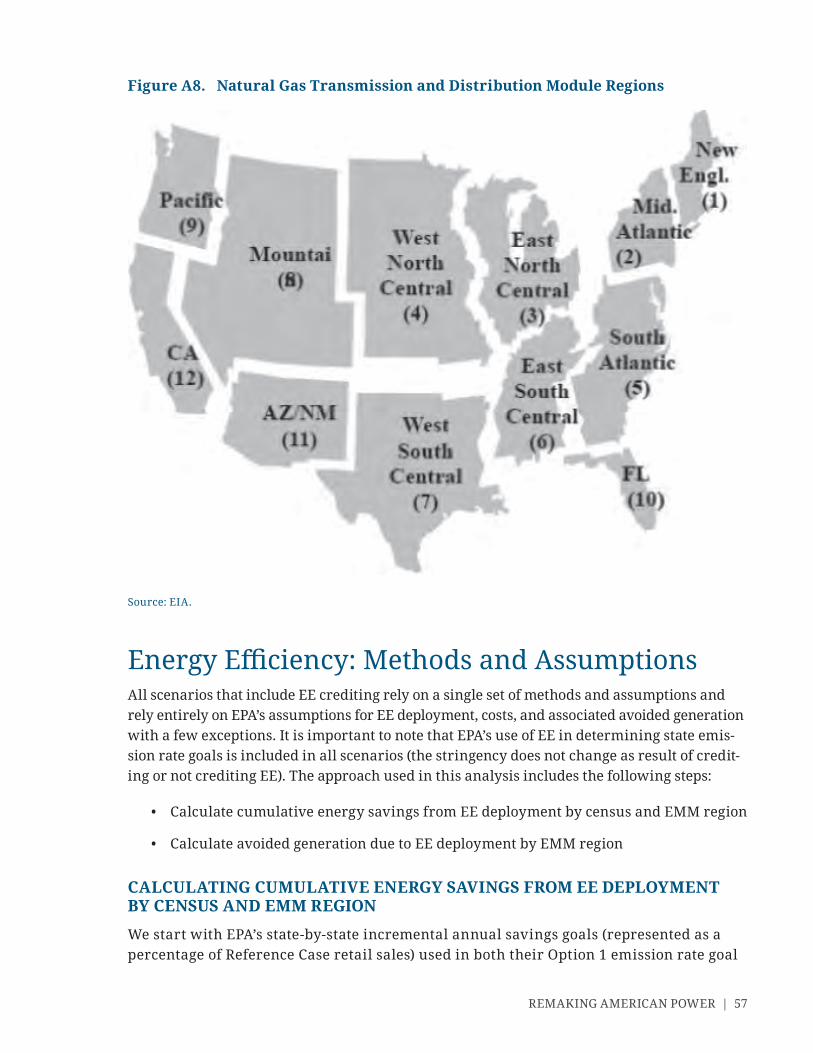
REMAKING AMERICAN POWER | 57
Energy Effi ciency: Methods and AssumptionsAll scenarios that include EE crediting rely on a single set of methods and assumptions and rely entirely on EPA’s assumptions for EE deployment, costs, and associated avoided generation with a few exceptions. It is important to note that EPA’s use of EE in determining state emis-sion rate goals is included in all scenarios (the stringency does not change as result of credit-ing or not crediting EE). The approach used in this analysis includes the following steps:
• Calculate cumulative energy savings from EE deployment by census and EMM region
• Calculate avoided generation due to EE deployment by EMM region
CALCULATING CUMULATIVE ENERGY SAVINGS FROM EE DEPLOYMENT BY CENSUS AND EMM REGION
We start with EPA’s state- by- state incremental annual savings goals (represented as a percentage of Reference Case retail sales) used in both their Option 1 emission rate goal
Figure A8. Natural Gas Transmission and Distribution Module Regions
Source: EIA.
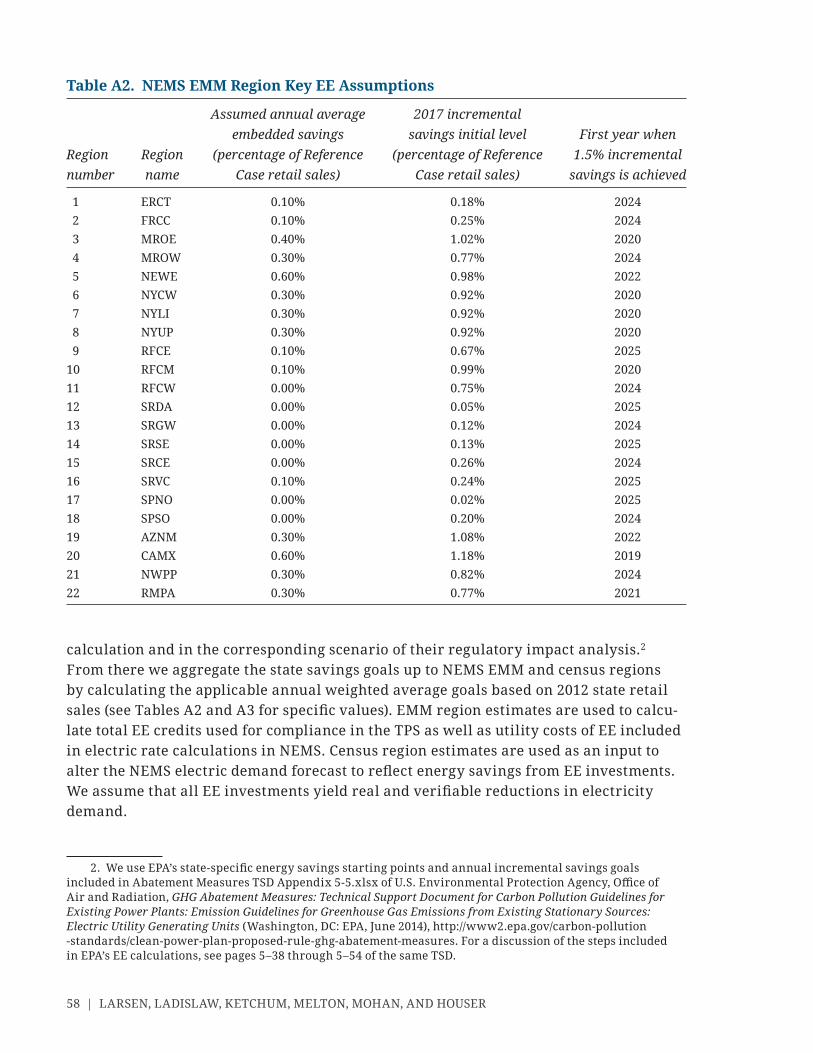
58 | LARSEN, LADISLAW, KETCHUM, MELTON, MOHAN, AND HOUSER
calculation and in the corresponding scenario of their regulatory impact analysis.2 From there we aggregate the state savings goals up to NEMS EMM and census regions by calculating the applicable annual weighted average goals based on 2012 state retail sales (see Tables A2 and A3 for specifi c values). EMM region estimates are used to calcu-late total EE credits used for compliance in the TPS as well as utility costs of EE included in electric rate calculations in NEMS. Census region estimates are used as an input to alter the NEMS electric demand forecast to refl ect energy savings from EE investments. We assume that all EE investments yield real and verifi able reductions in electricity demand.
2. We use EPA’s state- specifi c energy savings starting points and annual incremental savings goals included in Abatement Mea sures TSD Appendix 5- 5.xlsx of U.S. Environmental Protection Agency, Offi ce of Air and Radiation, GHG Abatement Mea sures: Technical Support Document for Carbon Pollution Guidelines for Existing Power Plants: Emission Guidelines for Green house Gas Emissions from Existing Stationary Sources: Electric Utility Generating Units (Washington, DC: EPA, June 2014), http:// www2 .epa .gov /carbon -pollution -standards /clean -power -plan -proposed -rule -ghg -abatement -measures. For a discussion of the steps included in EPA’s EE calculations, see pages 5– 38 through 5– 54 of the same TSD.
Table A2. NEMS EMM Region Key EE Assumptions
Region number
Region name
Assumed annual average embedded savings
(percentage of Reference Case retail sales)
2017 incremental savings initial level
(percentage of Reference Case retail sales)
First year when 1.5% incremental
savings is achieved
1 ERCT 0.10% 0.18% 2024 2 FRCC 0.10% 0.25% 2024 3 MROE 0.40% 1.02% 2020 4 MROW 0.30% 0.77% 2024 5 NEWE 0.60% 0.98% 2022 6 NYCW 0.30% 0.92% 2020 7 NYLI 0.30% 0.92% 2020 8 NYUP 0.30% 0.92% 2020 9 RFCE 0.10% 0.67% 202510 RFCM 0.10% 0.99% 202011 RFCW 0.00% 0.75% 202412 SRDA 0.00% 0.05% 202513 SRGW 0.00% 0.12% 202414 SRSE 0.00% 0.13% 202515 SRCE 0.00% 0.26% 202416 SRVC 0.10% 0.24% 202517 SPNO 0.00% 0.02% 202518 SPSO 0.00% 0.20% 202419 AZNM 0.30% 1.08% 202220 CAMX 0.60% 1.18% 201921 NWPP 0.30% 0.82% 202422 RMPA 0.30% 0.77% 2021
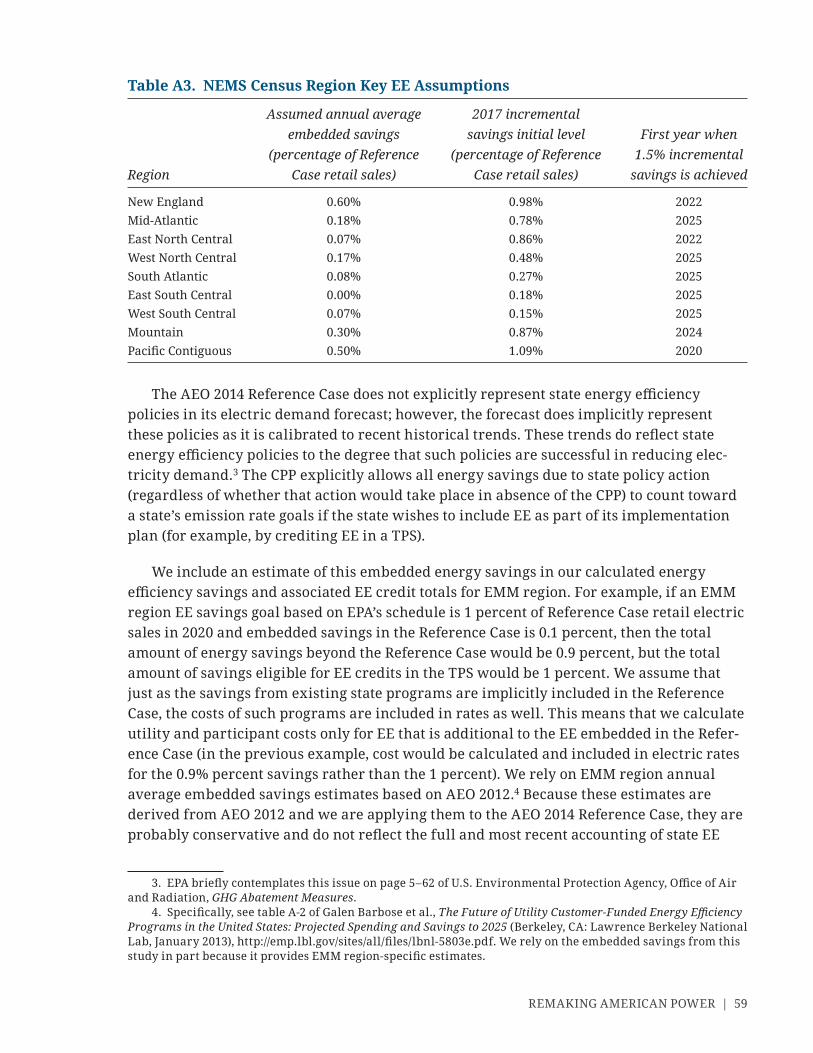
REMAKING AMERICAN POWER | 59
The AEO 2014 Reference Case does not explicitly represent state energy effi ciency policies in its electric demand forecast; however, the forecast does implicitly represent these policies as it is calibrated to recent historical trends. These trends do refl ect state energy effi ciency policies to the degree that such policies are successful in reducing elec-tricity demand.3 The CPP explicitly allows all energy savings due to state policy action (regardless of whether that action would take place in absence of the CPP) to count toward a state’s emission rate goals if the state wishes to include EE as part of its implementation plan (for example, by crediting EE in a TPS).
We include an estimate of this embedded energy savings in our calculated energy effi ciency savings and associated EE credit totals for EMM region. For example, if an EMM region EE savings goal based on EPA’s schedule is 1 percent of Reference Case retail electric sales in 2020 and embedded savings in the Reference Case is 0.1 percent, then the total amount of energy savings beyond the Reference Case would be 0.9 percent, but the total amount of savings eligible for EE credits in the TPS would be 1 percent. We assume that just as the savings from existing state programs are implicitly included in the Reference Case, the costs of such programs are included in rates as well. This means that we calculate utility and participant costs only for EE that is additional to the EE embedded in the Refer-ence Case (in the previous example, cost would be calculated and included in electric rates for the 0.9% percent savings rather than the 1 percent). We rely on EMM region annual average embedded savings estimates based on AEO 2012.4 Because these estimates are derived from AEO 2012 and we are applying them to the AEO 2014 Reference Case, they are probably conservative and do not refl ect the full and most recent accounting of state EE
3. EPA briefl y contemplates this issue on page 5– 62 of U.S. Environmental Protection Agency, Offi ce of Air and Radiation, GHG Abatement Mea sures.
4. Specifi cally, see table A-2 of Galen Barbose et al., The Future of Utility Customer- Funded Energy Effi ciency Programs in the United States: Projected Spending and Savings to 2025 (Berkeley, CA: Lawrence Berkeley National Lab, January 2013), http:// emp .lbl .gov /sites /all /fi les /lbnl -5803e .pdf. We rely on the embedded savings from this study in part because it provides EMM region- specifi c estimates.
Table A3. NEMS Census Region Key EE Assumptions
Region
Assumed annual average embedded savings
(percentage of Reference Case retail sales)
2017 incremental savings initial level
(percentage of Reference Case retail sales)
First year when 1.5% incremental
savings is achieved
New En gland 0.60% 0.98% 2022Mid- Atlantic 0.18% 0.78% 2025East North Central 0.07% 0.86% 2022West North Central 0.17% 0.48% 2025South Atlantic 0.08% 0.27% 2025East South Central 0.00% 0.18% 2025West South Central 0.07% 0.15% 2025Mountain 0.30% 0.87% 2024Pacifi c Contiguous 0.50% 1.09% 2020
60 | LARSEN, LADISLAW, KETCHUM, MELTON, MOHAN, AND HOUSER
programs.5 Crediting energy savings already included in the Reference Case results in less CO2 abatement than our scenarios without EE crediting.
To calculate the total energy savings achieved for each EMM and census region, we fi rst calculate an alternative electric demand forecast that excludes embedded savings con-tained in the Reference Case. We do this by applying the embedded savings percentage to all years of the Reference Case forecast beginning in 2013 and add each annual value to the Reference Case. We then apply the EPA EE savings targets starting in 2017 and ramping up by annual increments of 0.2 percent until incremental savings achieve 1.5 percent. We then hold savings at that level for the remainder of the forecast. We rely on EPA’s assumptions for mea sure life (20- year linear distribution) when calculating total cumulative energy savings from EE. We then subtract the resulting cumulative savings values from the alter-native electric demand forecast. This results in a new electric demand forecast for each EMM and census region that refl ects the total energy savings from EPA’s assumptions regarding EE deployment under the CPP.
CALCULATING AVOIDED GENERATION DUE TO EE DEPLOYMENT BY EMM REGION
As noted above, the census region EE savings estimate is used to adjust Reference Case electric demand in NEMS to refl ect EE deployment as well as utility EE costs. More detail is provided below on our approach for adjusting electric demand and electric rates in NEMS to refl ect EE deployment. EMM region estimates are used to calculate total EE credits amounts (in the form of avoided generation) that can be used for compliance with the CPP emission rate goals as represented in our analysis in the form of TPSs.
We follow EPA’s approach for accounting of EE savings within each state’s goal compu-tation.6 Specifi cally, we take our calculated annual cumulative EE savings relative to the revised Reference Case retail sales forecast (the forecast that does not include embedded savings) for each EMM region and scale each value upward to account for transmission and distribution losses to obtain an avoided generation value in MWhs. We then take the lesser of the avoided generation value or that multiplied by the EMM region’s generation share of electric sales (this helps ensure that that avoided generation is linked to a region’s own in- region generation) and add the fi nal value to the denominator of the adjusted emission rate for covered sources, the compliance emission rate goal for the TPS.
5. Indeed, a recent analysis by Synapse Economics based on AEO 2013 found the annual average embed-ded savings to by 0.29 percent, 60 percent higher than the 0.18 percent national average used in our analysis. Daniel White et al., State Energy Effi ciency Embedded in Annual Energy Outlook Forecasts: 2013 Update (Cam-bridge, MA: Synapse Energy Economics, November 2013).
6. For EPA’s review of this topic, see section 3, step 5, of U.S. Environmental Protection Agency, Offi ce of Air and Radiation, Goal Computation Technical Support Document (Washington, DC: EPA, June 2014), http:// www2 .epa .gov /carbon -pollution -standards /clean -power -plan -proposed -rule -goal -computation .
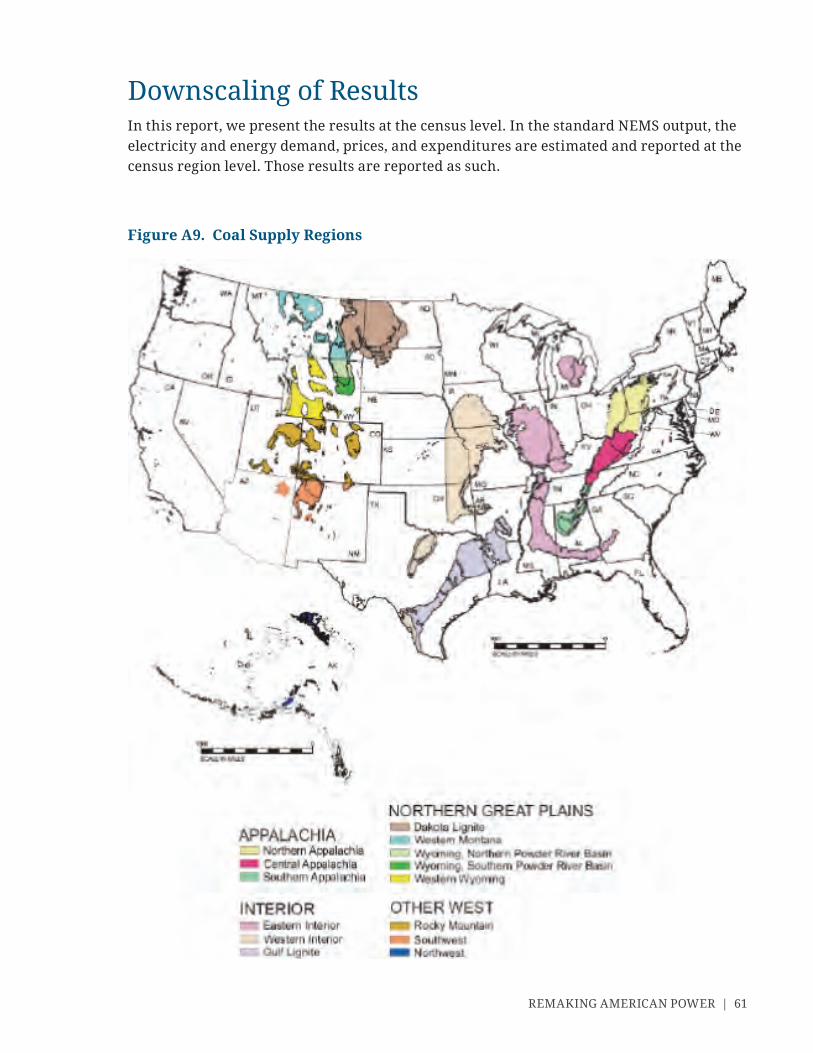
REMAKING AMERICAN POWER | 61
Downscaling of ResultsIn this report, we present the results at the census level. In the standard NEMS output, the electricity and energy demand, prices, and expenditures are estimated and reported at the census region level. Those results are reported as such.
Figure A9. Coal Supply Regions

62 | LARSEN, LADISLAW, KETCHUM, MELTON, MOHAN, AND HOUSER
That is the not the case with the coal and gas production and revenues. To present those results at the census level, we had to rescale the reported NEMS results from the reported regional disaggregation to the census level. The following describes how we rescaled the results for each fuel type:
1. Coal. NEMS estimates and reports coal production at 14 coal- supply region levels (Figure A9). EIA also has a database on the current mines and their production based in these regions, which are also classifi ed by state. Using the 2012 production level, we create a mapping of coal supply regions and census regions, for different coal types: anthracite, bituminous, lignite, and sub- bituminous. We apply this mapping, for each type of coal, to rescale the estimated future coal production by supply region to estimate the coal production in a census region.
2. Natural gas. As with coal, natural gas production is estimated and reported not at the census level but at oil and gas supply regions (Figure A8). Here we create a map-ping between the NEMS supply regions and census regions using the 2012 year- end proven reserves data by type of resource base: shale, coal- bed methane, onshore conventional, and offshore. We use this mapping to rescale the results to the census level.
| 63
John Larsen is a se nior analyst at Rhodium Group (RHG) and leads the fi rm’s U.S. power sector team. Previously, he worked for the U.S. Department of Energy’s Offi ce of Energy Policy and Systems Analysis, where he advised on electric power sector and economy-wide climate policy design. Prior to working in government, he led federal and congressional policy analysis in the World Resources Institute’s Climate and Energy Program.
Mr. Larsen is an adjunct professor in the Energy and Climate Program at the Krieger School of Arts and Sciences, Advanced Academic Programs at Johns Hopkins University, and holds a bachelor’s degree in environmental science from the University of Massachu-setts at Amherst and a master’s degree in urban and environmental policy and planning from Tufts University.
Sarah O. Ladislaw is a se nior fellow and director of the Energy and National Security Pro-gram at CSIS, where she concentrates on the geopolitics of energy, energy security, energy technology, and climate change. She has been involved with CSIS’s work on the geopolitics portion of the 2007 National Petroleum Council study and the CSIS Smart Power Commission, focusing particularly on energy security and climate issues. She has authored papers on U.S. energy policy, global and regional climate policy, and clean energy technology, as well as Eu ro pe an and Chinese energy issues. Ms. Ladislaw is also an adjunct professor at the George Washington University.
Prior to joining CSIS, Ms. Ladislaw was with the Department of Energy’s Offi ce of Policy and International Affairs, where she covered a range of economic, po liti cal, and energy issues in the Americas. Ms. Ladislaw also spent a short period of time working at Statoil as Se nior Director for International Affairs in the Washington offi ce. Ms. Ladislaw received her bachelor’s degree in international affairs/East Asian studies and Japa nese from the George Washington University and her master’s degree in international affairs/interna-tional security from the George Washington University.
Whitney Ketchum is a research analyst at Rhodium Group (RHG), employing a range of energy and economic models to analyze the impact of policy proposals on the U.S. electricity sector, energy market, and macroeconomy. Before joining RHG, she was a policy analyst at the Nicholas Institute for Environmental Policy Solutions at Duke University. She holds a bach-elor’s degree in environmental systems and molecular biology from the University of Califor-nia at San Diego and a master’s degree in environmental management from Duke University.
About the Authors

64 | LARSEN, LADISLAW, KETCHUM, MELTON, MOHAN, AND HOUSER
Michelle Melton is a research associate with the Energy and National Security Program at CSIS. She provides research and analysis on a wide range of projects associated with domes-tic and global energy trends, including the global oil market, unconventional fuels, U.S. en-ergy policy, Iraq, U.S. and international electricity markets, and global climate change. Prior to joining CSIS, Ms. Melton held a number of positions in the nonprofi t, private, and public sectors, including with Statoil, the Government Accountability Offi ce, and the Georgetown University Center on Education and the Workforce. She was also a Peace Corps volunteer in Zambia. Ms. Melton received master’s degrees in foreign ser vice and in international history from Georgetown University and a bachelor’s degree from Johns Hopkins University.
Shashank Mohan leads the development and management of Rhodium Group’s suite of economic models and other quantitative tools. He works across RHG’s practice areas to analyze the impact of policy proposals and structural developments on specifi c markets and broader economic trends. Prior to RHG, he worked with Columbia University’s Earth Institute and the World Bank and was a program assistant at the South Asia Institute. His background is in information technology, with a previous career in software engineering at Microsoft. Mr. Mohan holds a master’s degree from the School of International and Public Affairs at Columbia University and is a graduate of the Indian Institute of Technol-ogy in Kharagpur.
Trevor Houser is a partner with the Rhodium Group (RHG) and leads the fi rm’s Energy and Natural Resources practice. Mr. Houser’s work supports the investment management, strategic planning, and policy needs of RHG clients in the fi nancial, corporate, and govern-ment sectors. During 2009, Mr. Houser left RHG temporarily to serve as se nior adviser to the U.S. State Department, where he worked on a broad range of international energy, natural resource, and environmental policy issues. While in government, Mr. Houser negotiated seven bilateral U.S.-China energy agreements, including the U.S.-China Shale Gas Initiative and the establishment of the U.S.-China Clean Energy Research Center.
Mr. Houser is also a visiting fellow at the Peterson Institute for International Economics in Washington, and serves on the U.S. Trade Representative Trade and Environment Policy Advisory Committee. He is a member of the Council on Foreign Relations and the National Committee on U.S.- China Relations and serves on the Advisory Board of the Center for U.S.- China Relations at the Asia Society.

Blank

1616 Rhode Island Avenue NW| Washington DC 20036
t. (202) 887-0200 | f. (202) 775-3199 | www.csis.org
ROWMAN & LITTLEFIELD
Lanham • Boulder • New York • Toronto • Plymouth, UK
4501 Forbes Boulevard, Lanham, MD 20706
t. (800) 462-6420 | f. (301) 429-5749 | www.rowman.com
Cover photo: Shutterstock.com
A Report of the CSIS Energy and National Security Program and the Rhodium Group
NOVEMBER 2014
AUTHORS John LarsenSarah O. LadislawWhitney KetchumMichelle MeltonShashank MohanTrevor Houser
RemakingAmerican PowerPotential Energy Market Impacts of EPA’s Proposed
GHG Emission Performance Standards for Existing
Electric Power Plants
5 Columbus Circle | New York, NY 10019
t. 212-532-1157 | www.rhg.com
v*:+:!:+:!ISBN 978-1-4422-2866-5
Ë|xHSLEOCy228665z