The Chicago Alley Lighting Project - Chicago State … · The Chicago Alley Lighting Project ......
60
The Chicago Alley Lighting Project: Final Evaluation Report April 2000 Prepared by Erica N. Morrow Shawn A. Hutton Research and Analysis Unit Illinois Criminal Justice Information Authority George H. Ryan, Governor Peter B. Bensinger, Chairman Candice M. Kane, Executive Director
Transcript of The Chicago Alley Lighting Project - Chicago State … · The Chicago Alley Lighting Project ......
The Chicago Alley Lighting Project: Final Evaluation Report
April 2000
Prepared by
Erica N. Morrow Shawn A. Hutton
Research and Analysis Unit Illinois Criminal Justice Information Authority
George H. Ryan, Governor Peter B. Bensinger, Chairman
Candice M. Kane, Executive Director


Acknowledgements
The authors would like to thank Andrea Gibson and Patrick Cusack of the City of Chicago, Department of Streets and Sanitation; and Patrick McPhilimy of the Chicago Police Department for their assistance in the preparation of this report and Daniel Higgins of the Illinois Criminal Justice Information Authority for assistance in designing the study methodology.
Printed by the Authority of the State of Illinois, April 2000

i
Executive Summary
In October of 1998, the Mayor’s Office in the City of Chicago and the
Department of Streets and Sanitation began a multi-stage plan to reduce crime through
improved street and alley lighting. The first part of the plan sought to upgrade and
improve the city’s 175,000 streetlights, which illuminate the arterial and residential
streets. The second part of the plan involves repairing and upgrading the lighting in and
around viaducts and Chicago Transit Authority stations. The final part of the plan has
been to boost lighting levels in alleys across the city as a tool for public safety and
fighting crime. In the past, 90-watt lights illuminated most city alleys and the
Department of Streets and Sanitation have increased alley lighting levels by installing
new fixtures that can accommodate 250-watt bulbs. The intent of the City’s program was
to increase feelings of safety and decrease crime in the alleys surrounding Chicago’s
residential and arterial streets by increasing the wattage and number of alley lamps.
The Illinois Criminal Justice Information Authority was directed by the General
Assembly to undertake an evaluation to assess the impact of increased alley lighting on
crime. Specifically, this evaluation attempted to measure the effect of increased alley
lighting on crime rates in two eight square block areas, with particular emphasis on
crimes that were most likely to have occurred in alleys. The 28th political ward (Police
District 11), the area of West Garfield Park, served as the experimental area and received
increased alley lighting beginning in August 1998. The 16th political ward (Police
District 7), the area of Englewood, served as the control area and did not receive
increased alley lighting during the study period, but did receive some improvements

ii
afterwards in May 1999. Both the experimental area and the control area were very
similar with respect to demographics, socio-economic status and crime.
The evaluation’s aim was to assess the impact of increased alley lighting on crime
in the two areas, with particular emphasis on crimes that were most likely to have
occurred in alleys. The evaluation did not examine public fears or perceptions. While it
was not anticipated that alley lighting would deter all types of crimes, some crimes may
be more susceptible to the unique characteristics of an alley. Therefore, violent crimes
(homicide, criminal sexual assault, robbery, assault) and property crimes (burglary, theft,
motor vehicle theft, arson) were examined initially. Researchers also focused attention on
a third crime category called “non-Index crimes,” such as prostitution, damage and
trespass to property and vehicles, gambling, and drug/liquor/weapons violations.
Previous research suggests that these forms of non-Index crimes are the offenses that may
show the majority of change when additional lighting is installed, due to their nature.
Additionally, alley lighting can only plausibly affect crimes that occur after dark,
and only where the lighting was installed. Based on these factors, the basic research
question was whether increased alley lighting resulted in fewer alley crimes after dark in
the experimental area overall. These results were also compared to a control area. A
comparison between incidents reported during the daytime and those reported at night
was also made.
The evaluation first examined change in the experimental area that received
increased alley lighting over a one-year period prior to increased alley lighting and a one-
year period after. Then, change over a six-month period before and after increased alley
lighting was examined for both the experimental area and the control area that did not

iii
receive the increased lighting to determine differences between the two areas. Regardless
of whether the one year analysis revealed a localized impact on crime in the experimental
area, it is possible that improved alley lighting has an effect on the experimental area
when compared to another area of the city that did not receive the lighting. Finally,
variations in offenses that occurred during the day versus those that occurred at night
were examined, based on the reported time that the incident occurred.
The top figure on the next page shows the total number of incidents, as well as the
specific violent, property and non-Index crimes in the experimental area of West Garfield
Park for one year before and after alley lighting installation. The numbers and percentage
increases for this area are based on data that only represented those reported incidents
that took place at night and in alleys.
When the number of reported incidents for this one year analysis are examined,
the data indicated that there were 428 total incidents reported in the pre- installation
period and 519 total incidents in the post- installation period – an increase of 21 percent in
reported offenses between the pre- and post-period test.
Each of the three crime categories experienced an increase in the number of
reported incidents between the pre and post- installation period. Violent Index offenses
increased 14 percent (119 to 136), property Index offenses increased 20 percent (30 to
36) and non-Index offenses increased 24 percent (279 to 347).

iv
Since a majority of the alley offenses were non-Index crimes, a separate analysis
was conducted to examine which offenses contributed most to the 24 percent increase.
The figure below shows this breakdown.
Change in Reported Incidents in Experimental Area:One Year Pre- and Post-Installation of Alley Lights
Non-Index Offenses
6
50
0
18
161
44
2
47
1
19
243
35
0
50
100
150
200
250
300
Prostitution and SexCrimes*
Damage/Trespass toProperty
Damage/Trespass toVehicle
Weapons Violations Substance AbuseViolations**
Other***
Num
ber o
f Rep
orts
Pre Post
*Does not include Criminal Sexual Assault**Includes alcohol and drug violations***See appendix ASource: Chicago Police Dept.
Change in Reported Incidents in Experimental Area:One Year Pre-and Post-Installation of Alley Lights
All Offenses
119
30
428
136
36
347
519
279
0
100
200
300
400
500
600
Violent Index Offenses Property Index Offenses Non-Index Offenses Overall Total
Num
ber o
f Rep
orts
Pre PostSource: Chicago Police Dept.
v
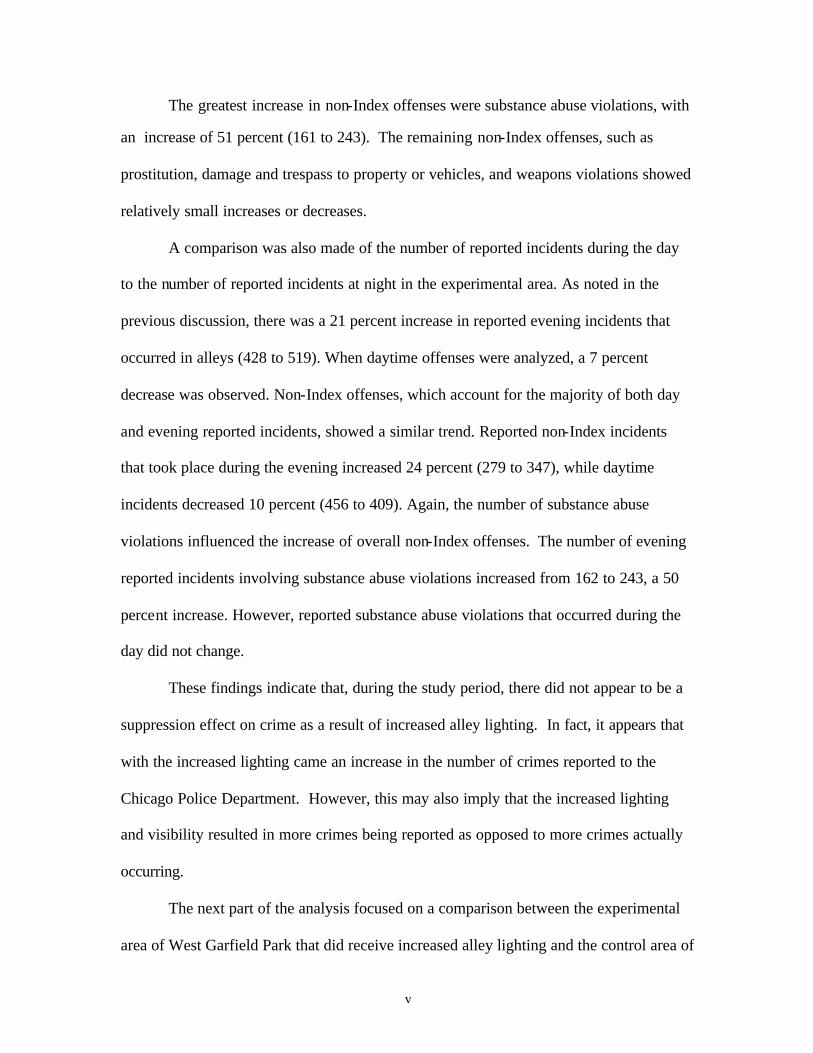
The greatest increase in non-Index offenses were substance abuse violations, with
an increase of 51 percent (161 to 243). The remaining non-Index offenses, such as
prostitution, damage and trespass to property or vehicles, and weapons violations showed
relatively small increases or decreases.
A comparison was also made of the number of reported incidents during the day
to the number of reported incidents at night in the experimental area. As noted in the
previous discussion, there was a 21 percent increase in reported evening incidents that
occurred in alleys (428 to 519). When daytime offenses were analyzed, a 7 percent
decrease was observed. Non-Index offenses, which account for the majority of both day
and evening reported incidents, showed a similar trend. Reported non-Index incidents
that took place during the evening increased 24 percent (279 to 347), while daytime
incidents decreased 10 percent (456 to 409). Again, the number of substance abuse
violations influenced the increase of overall non-Index offenses. The number of evening
reported incidents involving substance abuse violations increased from 162 to 243, a 50
percent increase. However, reported substance abuse violations that occurred during the
day did not change.
These findings indicate that, during the study period, there did not appear to be a
suppression effect on crime as a result of increased alley lighting. In fact, it appears that
with the increased lighting came an increase in the number of crimes reported to the
Chicago Police Department. However, this may also imply that the increased lighting
and visibility resulted in more crimes being reported as opposed to more crimes actually
occurring.
The next part of the analysis focused on a comparison between the experimental
area of West Garfield Park that did receive increased alley lighting and the control area of

vi
Englewood that did not receive the improvements during the study period. Again, the
data analyzed for this comparison included reported offenses that occurred during the
evening and in alley locations. Instead of using a one-year time span, the analysis was
conducted using six-month time periods before and after installation. As the alley lights
were already improved in the control area by the time analysis began, there were only six
comparable months of data in both the pre-installation and post- installation period for
both the experimental and the control areas.
The figures on the following page show the total number of incidents in each area
for six months before and after alley lighting installation. For the six month period prior
to the alley lighting improvement, the experimental area showed 205 reported incidents
in the pre-period and 287 in the post-period – a 40 percent increase. Each crime category
(violent Index, property Index and non-Index) showed an increase. The control area
crime counts also increased, with 166 reported incidents in the pre-installation period and
198 reported incidents in the post- installation period – a 19 percent increase. Each crime
category in the control area also showed an increase from the pre- installation to the post-
installation period.
Since many of the reported incidents that occurred in alleys and during the
evening were non-Index offenses, a separate analysis was conducted to examine which
offenses contributed most to the increase. The greatest increase in non-Index reported
incidents were substance abuse violations, with an increase of 60 percent (77 to 123) in
the experimental area. The control area experienced an increase of 73 percent (30 to 52)
for reported substance abuse violations.

vii
Change in Reported Incidents in Experimental Area:Six Months Pre- and Post-Installation of Alley Lights
All Offenses
57
13
205
75
23
135
189
287
0
50
100
150
200
250
300
350
Violent Index Offenses Property Index Offenses Non-Index Offenses Overall Total
Num
ber o
f Rep
orts
Pre PostSource: Chicago Police Dept.
Change in Reported Incidents in Control Area: Six Months Pre- and Post-Installation of Alley Lights
All Offenses
75
16
75
166
76
22
100
198
0
50
100
150
200
250
Violent Index Offenses Property Index Offenses Non-Index Offenses Overall Total
Num
ber o
f Rep
orts
Pre PostSource: Chicago Police Dept.

viii
While both the experimental and control areas experienced similar increases in all
offense categories between pre- and post- installation in the experimental area, the overall
increases in the experimental area appear to be more pronounced (40 percent increase
versus 19 percent increase in the control area).
A comparison was also made in the number of reported incidents during the day
to the number of reported incidents at night. This was done in both the experimental and
control areas for six months prior to improved alley lighting installation in the
experimental area and six months after. Both the experimental and control areas saw
increases in reported incidents at night and decreases in reported incidents during the day.
A breakdown of non-Index offenses showed that reported substance abuse violations
during the evening increased from 77 to 123 (60 percent) in the experimental area, but
daytime violations decreased from 187 to 152 (-19 percent). Reported substance abuse
violations in the control area increased from 30 to 52 (73 percent) during the evening, but
also decreased from 69 to 33 (-52 percent) during the day.
Since both the experimental area and the control area experienced increases in
reported incidents during the evening, while having decreases in reported daytime
incidents, it is difficult to ascertain whether increased alley lighting had any effect. Also,
both areas reported increases in all crime categories between the six months pre-
installation and the six months post- installation. However, the experimental area reported
a more pronounced increase in non-Index offenses during this time, resulting in a more
pronounced increased for overall reported incidents.
Based on the analysis, it is difficult to point to any conclusive evidence that
increased alley lighting had an effect on crime. The data indicate that reported offenses,

ix
and in particular reported substance abuse violations, in the experimental area increased
between the time prior to alley lighting improvements and after – suggesting that
improved alley lighting is related to an increase in reported crime. The comparison
between the experimental area and the control area showed that while both areas noted
increases in reported incidents, the increases were somewhat more significant in the
experimental area. The day to night comparison in the experimental area also shows that
reported evening incidents, those most likely to be affected by lighting changes, increased
after lighting installation. Although daytime reported property incidents increased slightly
for the experimental area, the remaining crime categories decreased, in particular non-
Index offenses (predominately substance abuse violations). While this may further
indicate that the increased lighting led to an increase in reported offenses, the control area
also showed increases in evening incidents and decreases in daytime incidents.
The more likely explanation for the increase in reported incidents in the
experimental area after installation of improved alley lighting is that more residents, and
also more police officers, are now more aware of criminal activity taking place. As
criminal activity becomes more visible, residents and patrolling officers are more likely
to report and address incidents. The pronounced increase in reported substance abuse
violations after increased lighting may show that while residents may have not taken
notice of drug activity before, the increased visibility may make them more likely to
report the activity. An additional impact of increased alley lighting that was not measured
in this study is the perceptions of residents. Improved lighting in areas that were
previously dark and vulnerable to crime may make residents feel more secure in their
neighborhoods.

x
The following table compares the experimental and controls areas in regard to
demographics and crime totals before and after the installation of alley lights.
Comparison Between the Experimental Area and Control Area
Experimental Area (District 11 – West Garfield Park)
Control Area (District 7 - Englewood)
Crime Rate
11,014 per 100,000 pop.
11,696 per 100,000 pop.
Resident Population
24,095
48,434
Demographics
99 percent African-American 53 percent age 21-64 46 percent male $17,170 median income
99 percent African-American 49 percent age 21-64 45 percent male $15,615 median income
Pre-Installation Post-Installation Pre-Installation Post-Installation
Total Crime Incidents Reported to Police (one-year prior and one-year after)
428
519
21% increase
N/A N/A
Total Crime Incidents Reported to Police (six months prior to experimental area installation and six months after)
205
287
40% increase
166
198
19% increase
xi
Table of Contents Introduction....................................................................................................................... 1 Literature Review ............................................................................................................. 2 The Present study.............................................................................................................. 7 Methodology..................................................................................................................... 8 Experimental Study Area............................................................................................. 9 Control Study Area .................................................................................................... 12 Data Acquisition........................................................................................................ 15 Crime Reports ............................................................................................................ 16 Crime Types............................................................................................................... 18 Study Time Periods – Hours ...................................................................................... 19 Study Design.............................................................................................................. 20 Geographic Data Selection ........................................................................................ 21 Statistical Analysis..................................................................................................... 23 Results of One Year Experimental Area Analysis ......................................................... 24 Results of Six Month Experimental and Control Analysis............................................. 29 Results of Analysis for All Offenses ......................................................................... 29 Results of Analysis for Non-Index Offenses ............................................................. 35 Summary......................................................................................................................... 39 Appendix A..................................................................................................................... 40 Appendix B..................................................................................................................... 41 References....................................................................................................................... 42
xii
List of Figures
Figure 1: City of Chicago by Ward and District Experimental and Control Study Sites.............................................................. 9 Figure 2: District 11; Experimental Study Site............................................................... 11 Figure 3: District 7; Control Study Site .......................................................................... 14 Figure 4: Change in Reported Incidents in Experimental Area: One Year Pre- and Post-Installation of Alley Lights – All Offenses .................................................................................................... 25 Figure 5: Change in Reported Incidents in Experimental Area: One Year Pre- and Post-Installation of Alley Lights – Non-Index Offenses ........................................................................................ 26 Figure 6: Change in Reported Incidents in Experimental Area: One Year Pre- and Post-Installation of Alley Lights – Day versus Night Comparison - All Offenses ................................................ 27 Figure 7: Change in Reported Incidents in Experimental Area: One Year Pre- and Post-Installation of Alley Lights – Day versus Night Comparison – Non-Index Offenses ................................... 28 Figure 8: Change in Reported Incidents in Experimental Area: Six Months Pre- and Post-Installation of Alley Lights – All Offenses .................................................................................................... 31 Figure 9: Change in Reported Incidents in Control Area: Six Months Pre- and Post-Installation of Alley Lights – All Offenses .................................................................................................... 32 Figure 10: Change in Reported Incidents in Experimental Area: Six Months Pre- and Post-Installation of Alley Lights – Day versus Night Comparison - All Offenses ................................................ 33 Figure 11: Change in Reported Incidents in Control Area: Six Months Pre- and Post-Installation of Alley Lights – Day versus Night Comparison - All Offenses ................................................ 34 Figure 12: Change in Reported Incidents in Experimental Area: Six Months Pre- and Post-Installation of Alley Lights – Non-Index Offenses ........................................................................................ 36

xiii
Figure 13: Change in Reported Incidents in Control Area: Six Months Pre- and Post-Installation of Alley Lights – Non-Index Offenses ........................................................................................ 36 Figure 14: Change in Reported Incidents in Experimental Area: Six Months Pre- and Post-Installation of Alley Lights – Day versus Night Comparison – Non-Index Offenses ................................... 37 Figure 15: Change in Reported Incidents in Control Area: Six Months Pre- and Post-Installation of Alley Lights – Day versus Night Comparison – Non-Index Offenses ................................... 38
List of Tables Table 1: District 11 Experimental Area 1997 Crime Totals ........................................... 12 Table 2: District 7 Control Area 1997 Crime Totals ...................................................... 15
Table 3: Alley Light Study Time Periods ....................................................................... 16 Table 4: Experimental and Control Area Alley Fixtures ................................................ 16
1
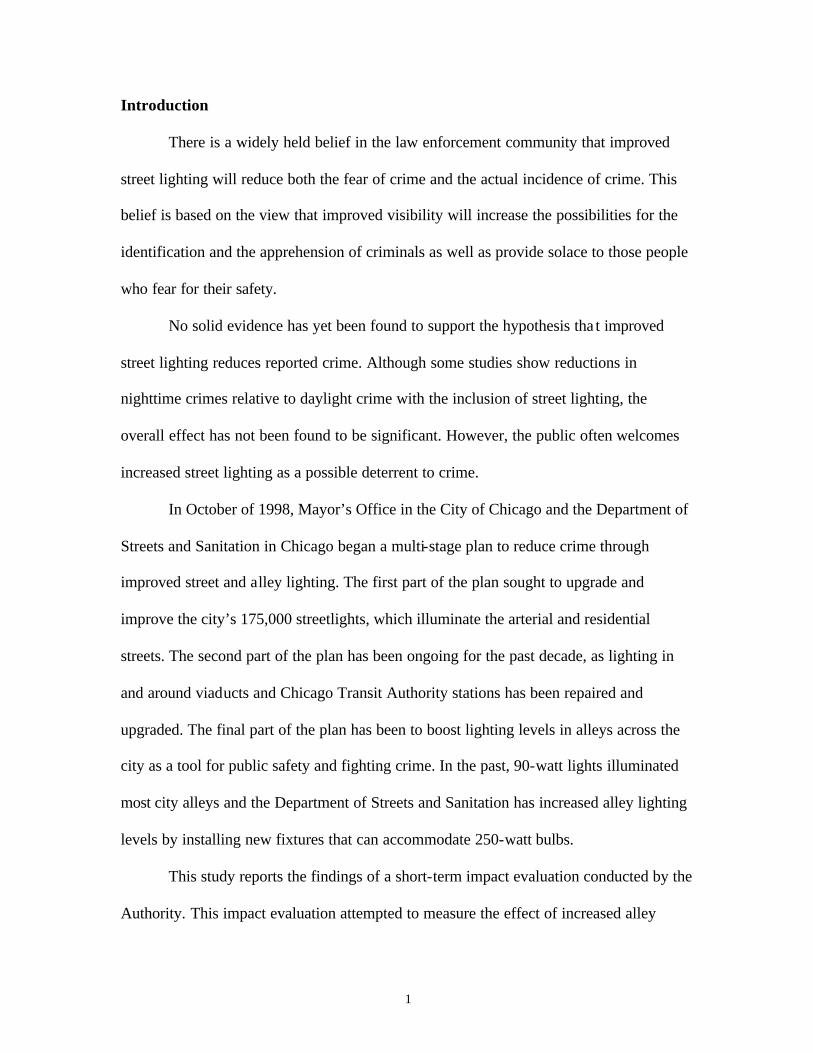
Introduction
There is a widely held belief in the law enforcement community that improved
street lighting will reduce both the fear of crime and the actual incidence of crime. This
belief is based on the view that improved visibility will increase the possibilities for the
identification and the apprehension of criminals as well as provide solace to those people
who fear for their safety.
No solid evidence has yet been found to support the hypothesis tha t improved
street lighting reduces reported crime. Although some studies show reductions in
nighttime crimes relative to daylight crime with the inclusion of street lighting, the
overall effect has not been found to be significant. However, the public often welcomes
increased street lighting as a possible deterrent to crime.
In October of 1998, Mayor’s Office in the City of Chicago and the Department of
Streets and Sanitation in Chicago began a multi-stage plan to reduce crime through
improved street and alley lighting. The first part of the plan sought to upgrade and
improve the city’s 175,000 streetlights, which illuminate the arterial and residential
streets. The second part of the plan has been ongoing for the past decade, as lighting in
and around viaducts and Chicago Transit Authority stations has been repaired and
upgraded. The final part of the plan has been to boost lighting levels in alleys across the
city as a tool for public safety and fighting crime. In the past, 90-watt lights illuminated
most city alleys and the Department of Streets and Sanitation has increased alley lighting
levels by installing new fixtures that can accommodate 250-watt bulbs.
This study reports the findings of a short-term impact evaluation conducted by the
Authority. This impact evaluation attempted to measure the effect of increased alley

2
lighting on crime rates in two eight-square block areas. Using the 28th ward (Chicago
Police Department District 11) as a pilot area, the Authority compared Index and non-
Index crime rates for a six-month period prior to lighting installation with a six-month
period after lighting installation. The results of this post- installation period were then
compared to a similarly sized area in the 16th ward (Chicago Police Department District
7) that did not have improved alley lighting and is similar to the pilot area with regards to
socio-economic, demographic, and crime data. Researchers also compared changes in the
crime rate during the day to changes in the crime rate at night in the pilot area.
The effort to improve the quality of alley lamps in Chicago began on October 20,
1998. The Authority acquired address- level data for all reported Index and non-Index
crimes for both the 11th and 7th Districts from the Chicago Police Department in
November 1999. This data covered the time periods of August 1, 1997 to July 31, 1999.
Literature Review The idea of improving street lighting is not only favored by many law
enforcement officials and government officials, it is also one of the most common
suggestions made by people fearful in their use of public spaces (Clarke and Mayhew
1980). Increasing the amount of street lighting in a neighborhood serves residents as a
means of both individual fear reduction and overall crime prevention through deterrence.
But, does empirical research support the idea that increasing street and alley light wattage
leads to a reduction in the number of criminal offenses that occur in a community?
Improving street and alley lighting has been suggested frequently as a measure
that would both increase the risks of detection and reduce fear. Using a rational choice
model, Siegel (1995) claimed that increased lighting should make areas more visible and

3
thus less attractive to potential offenders. The key issue is the assumption that potential
offenders will attempt to minimize their risks of apprehension and avoid areas that
increase the likelihood of their identification. At the same time, given that fear is greatest
after dark, it is also assumed that by reducing darkness, fear will also be reduced (Clark
and Mayhew 1980).
On the opposite end of the spectrum, if these same potential offenders are not
afraid of apprehension or identification by either residents or police, then there will be
little deterrent impact of increased lighting on crime. This does not, however, mean that
perceptions of safety or use of public space is not impacted; rather increased lighting may
very well have a positive effect on the fear of crime (Quinet and Nunn 1998).
While this idea is attractive in theory, evidence confirming it has had mixed
results in practice. Fleming and Burrows (1986) have reported that the evidence from the
large number of rather poorly done studies in the United States is far from conclusive and
they emphasize the conflicting results of these studies.
Some of the effects of increased lighting may be crime specific. An analysis done
by Hartley (1974) of four high-crime areas in the District of Columbia found a marked
reduction in all crimes following lighting improvements. In Kansas City, Wright and
Heilweil (1974) found that lighting improvements led to a reduction in the levels of
robbery and assault, but not property crimes.
In Atlanta, city installed streetlights led to a reduction in the number of burglaries
(City of Atlanta, 1975) while no other crime was significantly affected. In a study similar
to the one reported here, Painter (1994) examined incidences of assault, automobile
crimes, and personal threats and found that street lighting appeared to reduce the
4
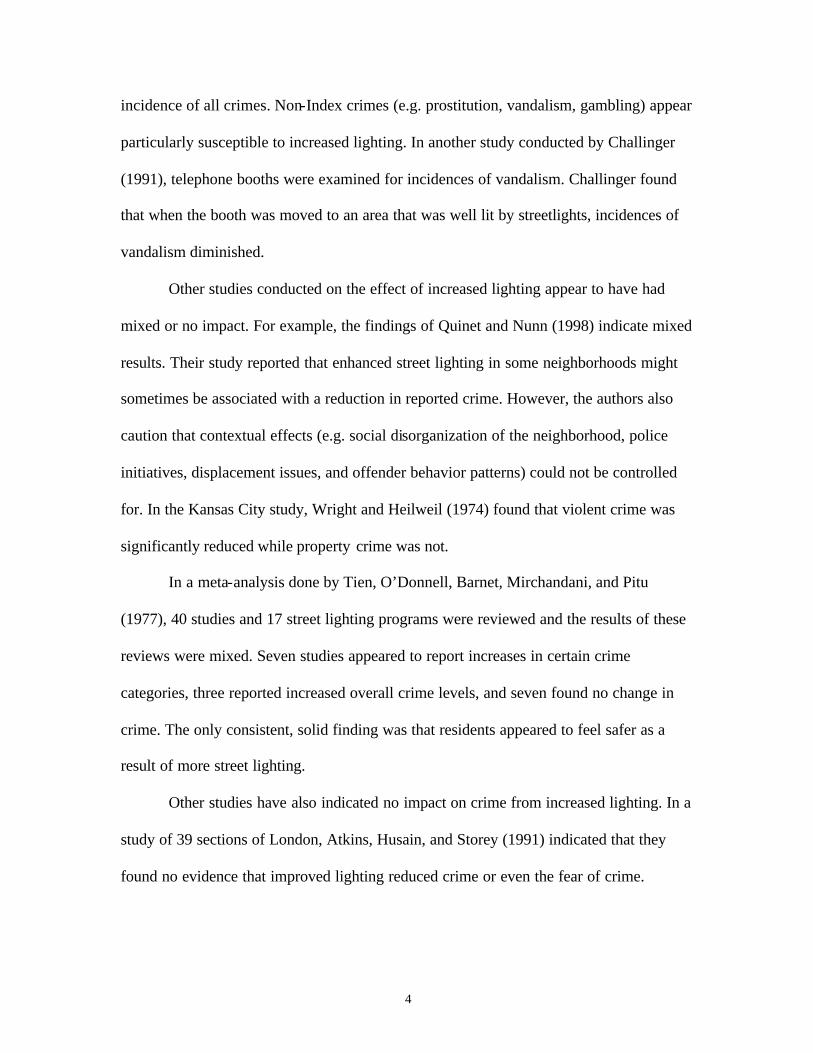
incidence of all crimes. Non-Index crimes (e.g. prostitution, vandalism, gambling) appear
particularly susceptible to increased lighting. In another study conducted by Challinger
(1991), telephone booths were examined for incidences of vandalism. Challinger found
that when the booth was moved to an area that was well lit by streetlights, incidences of
vandalism diminished.
Other studies conducted on the effect of increased lighting appear to have had
mixed or no impact. For example, the findings of Quinet and Nunn (1998) indicate mixed
results. Their study reported that enhanced street lighting in some neighborhoods might
sometimes be associated with a reduction in reported crime. However, the authors also
caution that contextual effects (e.g. social disorganization of the neighborhood, police
initiatives, displacement issues, and offender behavior patterns) could not be controlled
for. In the Kansas City study, Wright and Heilweil (1974) found that violent crime was
significantly reduced while property crime was not.
In a meta-analysis done by Tien, O’Donnell, Barnet, Mirchandani, and Pitu
(1977), 40 studies and 17 street lighting programs were reviewed and the results of these
reviews were mixed. Seven studies appeared to report increases in certain crime
categories, three reported increased overall crime levels, and seven found no change in
crime. The only consistent, solid finding was that residents appeared to feel safer as a
result of more street lighting.
Other studies have also indicated no impact on crime from increased lighting. In a
study of 39 sections of London, Atkins, Husain, and Storey (1991) indicated that they
found no evidence that improved lighting reduced crime or even the fear of crime.
5
As this review indicates, studies of the effects of increased lighting on crime
generally focus on street lighting rather than alley lighting. There do exist, however,
some studies that may have direct relevance to the effect of increased alley lighting.
These studies attempted to measure the positive effects of street lighting through a multi-
variable approach. This is similar to the situation surrounding this report, as the
researchers are attempting to measure a variable (alley lighting) that cannot be isolated
because of the possible interaction of other factors, such as district- level police initiatives
on the nearby streets or other intangible factors.
For example, Griswold (1984) attempted to examine commercial burglary through
lighting alone but finally concluded that the rates of burglary in his study were reduced
by a combination of security surveys and increased street lighting. Therefore, both the
improved security measures and the increased lighting may be needed to reproduce the
same success in future crime reduction and separating out any individual contributions of
the lighting may be impossible.
Likewise, Poyner and Webb (1987) examined shopping bag thefts in a city center
market but were unable to determine how significant the reduction in overall theft was
due to an intervening variable. Their study focused on increased lighting by a newly
installed lighting system, but at the same time, their research was also subjected to a
simultaneous widening of the spaces between market stalls in the markets. Hence, the
authors were unable to assess the impact of the lighting change on theft alone.
These contradictory research results of evaluative studies are not surprising.
Many factors influence the level of actual crime and perceived risk, of which lighting is
only one. The relative importance of these multiple factors is likely to vary between areas
6
so that while increased lighting is a major influence on crime in one location, its
significance elsewhere may be minimal (Ramsay 1989). In fact, it has been suggested
that in some circumstances, increased lighting may actually lead to an increase in the
level of certain property offenses (Fleming and Burrows 1986).
These contrasting findings may also be explained by variations in the temporal
and spatial coverage of individual studies. Painter (1994) has indicated that improved
illumination can bring very localized benefits over a short time, but should eventually
taper off. In addition to this finding, each of Painter’s small study areas included a narrow
walkway or railway tunnel, locations that are widely regarded as potential trouble spots
or where increased illumination would most likely be beneficial. The results, therefore,
indicate an area where crime incidences should go down substantially quicker and to a
greater degree than less well-targeted or larger areas.
The final possible influence on the outcome of these studies is their research
methodology. Various authors (Tien et al. 1979; Fleming and Burrows 1986) have drawn
attention to the practical difficulties that arise with this type of impact evaluation. When
large-scale, long-term evaluations are conducted, they often fall victim to imperfect data
or control of extraneous variables. Conversely, small-scale, short-term studies also appear
to suffer from inadequate sample sizes. Also, evaluations that are based on legal
definitions of crimes or reported offenses may generate different findings from those
based on unreported incidents or even nuisance violations that are not actual offenses.
As this review indicates, previous literature that focused on street lighting finds
mixed results concerning the impact of lighting on actual crime incidences, in part due to
the number of potential contaminating effects on the impact of lighting. The situation
7
appears even more complex when the effect of increased lighting in alleys is considered.
Thus, any evaluation of the impact of alley lighting should be sensitive to issues that may
be peripheral to street lighting studies. In other words, it is difficult to isolate the effects
of increased lighting, when many other external factors may have influenced crime.
The Present Study
This evaluation, funded in part by state General Revenue funds, presents the
results of a project that was initiated to increase feelings of safety and decrease crime in
the alleys surrounding Chicago’s residential and arterial streets by increasing both the
wattage and the number of alley lamps. Directed by the Illinois General Assembly, the
Authority was to assess the impact of increased alley lighting on crime in two eight-
square block areas. Particular emphasis was placed on crimes that were most likely to
have occurred in alleys and away from residential streets or arterial streets (streets that
form major thoroughfares). The evaluation did not examine public fears or perceptions.
The overall installation of Chicago’s street and alley light plan utilized 20 work
crews for more than a year to increase the 63,000 alley lamps across the city from 90-
watt to 250-watt bulbs. This installation plan was approved and quickly implemented
based on the initial results of a handful of scattered blocks. The incipient results prior to
this study were so encouraging that the Mayor of Chicago then asked the Chicago Police
Department to select an eight-square block area within the pilot ward where all the lights
could be converted to 250-watts as a potential crime deterrent. This eight-square block
location formed the original experimental area for both the city and for this study.
The city of Chicago set aside $3 million in budgeted funds to convert the
thousands of remaining alley lamp fixtures to the 250-watt level and to increase the
8
number of alley lights by placing one on every telephone pole in every alley of the city.
This served to increase the overall number of alley lamps from 46,000 in 1989 to the
63,000 today. The total effect is that the alley lamps are brighter than the residential
streetlights (which are 150 watts) and there are more of them. The arterial lights,
however, are still stronger than either alley or residential lights.
Methodology The goal of this research was to test whether the additional alley lighting would
reduce crimes that occurred in an alley. However, it was not anticipated that alley lighting
would deter all types of crimes. Some crimes may be more susceptible to the unique
characteristics of an alley than a street or building. Therefore, standard violent (homicide,
criminal sexual assault, robbery, assault) and property (burglary, theft, motor vehicle
theft, arson) Index crimes were examined, but initial data runs helped the researchers
focus attention on a third crime category called non-Index crimes. Non-Index crimes are
felonies and misdemeanors such as prostitution, criminal damage and trespass to property
and vehicles, gambling, and drug/liquor/weapons violations.
According to past research (Painter 1994), these forms of non-Index crimes are
the offenses that may show the majority of change when additional lighting is installed
due to their nature.
Additionally, alley lighting can only plausibly affect crimes that occur after dark.
Based on this fact, the basic hypothesis was whether increased alley lighting resulted in
fewer alley crimes after dark in the experimental areas overall. These results were also
compared to a control area, and then compared to daytime rates of crime. Figure 1 shows
the experimental and control areas of the evaluation, as well as the city wards and police
Districts.

9
Figure 1: City of Chicago by Ward and District Experimental and Control Study Sites
Study Area-Experimental
Experimental Study Area
The experimental area chosen for study was an eight-square block zone within the
Chicago Police Department’s 11th District (Harrison) and the city of Chicago’s 28th city
ward (Figure 2). This zone was also the initial area to receive increased alley lighting in
Chicago, with work beginning in August 1998. Carroll Avenue borders the area to the
north, Van Buren Street to the south, Pulaski Road to the east, and Cicero Avenue to the
west. Chicago is typically described as a city of neighborhoods rather than by District or
ward numbers. Although the study area is only a part of the entire Chicago community
Gray Areas = Wards Black-Lined Areas = Districts
Scale 1 inch=5.5 Miles
District 11 Experimental Study Site within Ward 28
District 07 Control Study Site within Ward 16

10
area referred to West Garfield Park, for purposes of this report, the study area itself will
be referred to as West Garfield Park.
West Garfield Park is a suitable experimental area in that it appears to reflect
signs of social disorganization. According to Wilson (1987), neighborhoods that are
characterized as socially disorganized exhibit such features of decay as vacant lots, empty
buildings, street-corner drug peddling, and high violent crime rates. Residents of the area
and business owners complain that drugs are ubiquitous in the neighborhood and the
landscape of West Garfield Park is littered with trash, empty land and decaying
structures. As an example, West Garfield Park typically reports the highest murder rate in
the city. In August of 1996, the 11th police District reported a total of 10 murders that
month and 72 in the first eight months of 1996, more than any other police District in the
city (Chicago Police Department Annual Report).
Utilizing census data specific to West Garfield Park as a Chicago community area
(within which the study area is located), for 1990, the overall resident population was
24,095 residents. Forty-six percent of the residents were male and almost all (99 percent)
were African-American. The age distribution of the neighborhood favored adults aged
21-64 years (53 percent) and the very young (27 percent under age 13).
More than half of the families in the neighborhood were headed by a female (55
percent) and more than one-third had an annual income below the poverty line. In fact,
the unemployment rate in the neighborhood was approximately three times (28 percent)
that of the whole Chicagoland area (the Chicago- land area is made up of Cook, Lake,
McHenry, Kane, DuPage, Kendall, Will, and Grundy Counties). The median family
income in West Garfield Park was $17,170. Most of the residences that existed in the

11
neighborhood were older, as 92 percent were built before 1980, and the median monthly
rent was low ($405 dollars a month). The average unit had six rooms and a median value
of $47,500 dollars. Figure 2 shows the geographic location of the study area.
Figure 2 - District 11 Experimental Study Site
West Garfield Park appeared to have one of the highest crime rates in Chicago. In
1997, the 11th District, of which West Garfield Park (the experimental study area) is a
part, reported a total of 69 murders, 191 criminal sexual assaults, 1,924 robberies, and
2,900 aggravated assaults. Property crimes were also high. Again in 1997, the 11th
District reported 1,099 burglaries, 3,310 thefts, 1,294 motor vehicle thefts, and 68 arsons.
Scale 1 inch=0.5 miles
11 Carroll Av.
Cicero Av. Pulaski Rd.
Van Buren St
-Shaded Area Indicates Experimental Study Site -11 Identifies District
12
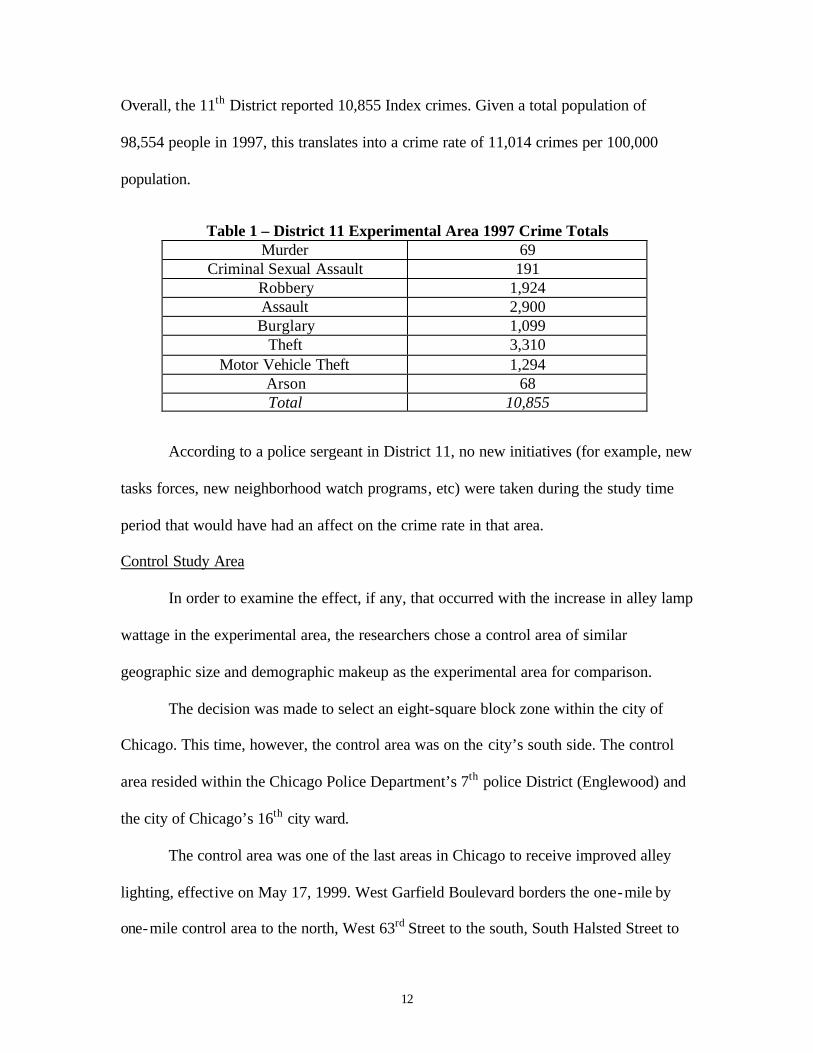
Overall, the 11th District reported 10,855 Index crimes. Given a total population of
98,554 people in 1997, this translates into a crime rate of 11,014 crimes per 100,000
population.
Table 1 – District 11 Experimental Area 1997 Crime Totals
Murder 69 Criminal Sexual Assault 191
Robbery 1,924 Assault 2,900 Burglary 1,099
Theft 3,310 Motor Vehicle Theft 1,294
Arson 68 Total 10,855
According to a police sergeant in District 11, no new initiatives (for example, new
tasks forces, new neighborhood watch programs, etc) were taken during the study time
period that would have had an affect on the crime rate in that area.
Control Study Area
In order to examine the effect, if any, that occurred with the increase in alley lamp
wattage in the experimental area, the researchers chose a control area of similar
geographic size and demographic makeup as the experimental area for comparison.
The decision was made to select an eight-square block zone within the city of
Chicago. This time, however, the control area was on the city’s south side. The control
area resided within the Chicago Police Department’s 7th police District (Englewood) and
the city of Chicago’s 16th city ward.
The control area was one of the last areas in Chicago to receive improved alley
lighting, effective on May 17, 1999. West Garfield Boulevard borders the one-mile by
one-mile control area to the north, West 63rd Street to the south, South Halsted Street to

13
the east, and South Laflin Street to the west. Again, although the control area lies within
the entire area referred to as Englewood, the name given to the control area itself will be
referred to as West Englewood during this analysis.
In almost every way, Englewood (within which the control area is located)
appeared identical to West Garfield Park. When the demographic statistics were
examined, the data indicate that the population in 1990 was 48,434 individuals. Almost
half (45 percent) of the residents were male and again almost all (99 percent) were
African-American. The age distribution of the neighborhood also favored adults aged 21-
64 years (49 percent) and the very young (27 percent under age 13).
More than half of the families in the neighborhood were headed by a female (59
percent), and 40 percent had an annual income below the poverty line. Similar to the
West Garfield Park statistics, the unemployment rate in the neighborhood was three times
(27 percent) that of the whole Chicago- land area (see previous definition) with a median
family income of $15,615. Almost 31 percent of the residents owned their residence and
the majority of those residences were built before 1980 (92 percent). The median monthly
rent was very low, at $384 dollars and the average residential unit had six rooms and a
median value of $41,363. Figure 3 shows the geographic location of the control area.

14
Figure 3 - District 7 Control Study Site
When the crime statistics for 1997 were examined in West Englewood, it appears
that the control District also had one of the higher crime rates in Chicago. In 1997 alone,
the 7th District, of which West Englewood is a part, reported a total of 55 murders, 188
criminal sexual assaults, 1,628 robberies, and 3,250 aggravated assaults. Property crimes
were also very high. In 1997, the 7th District reported 1,919 burglaries, 3,778 thefts,
1,566 motor vehicle thefts, and 78 arsons. Overall, the 7th District reported 12,462 Index
crimes. Given a total population of 106,542 people in 1997, this translates into a crime
rate of 11,696 crimes per 100,000 population.
Scale 1 inch=0.5 miles
Halsted St.
Garfield Blvd.
07
63rd St.
Shaded Area Indicates Control Study Site 07 Identifies District
Laflin St.

15
Table 2 – District 7 Control Area 1997 Crime Totals Murder 55
Criminal Sexual Assault 188 Robbery 1,628 Assault 3,250 Burglary 1,919
Theft 3,778 Motor Vehicle Theft 1,566
Arson 78 Total 12,462
Again, according to a police sergeant in District 7, no new initiatives were taken
during the study time period that would have an affect on the crime rate in that area.
Data Acquisition
The city’s alley lighting project began on October 20, 1998. The acquisition of
crime data by the Authority from the Chicago Police Department took place in November
1999. The Authority received address- level data for all reported violent and property
Index and non-Index crimes for both the 11th and 7th police Districts. These data cover
time periods from August 1, 1997 through July 31, 1999, which ensured that both the
one-year experimental comparison and the six-month experimental and control
comparisons were possible.
These dates were determined by the manner in which the alley lamp wattage was
increased and new alley lamps were installed within city wards. As mentioned earlier,
the difference between the very first pilot ward improvement and the final ward
improvement was only 311 days. Based on these time differences, the researchers
designed the pre-post study to be broken into two six-month periods for each District.
The time periods under examination are shown in Table 3.

16
Table 3: Alley Light Study Time Periods
District Testing Status Study Pre-Period Study Post-Period Installation Period
One Year Study Period 11th Experimental 8/97-7/98 8/98-7/99 8/98
Six Month Study Period 11th Experimental 2/98-7/98 8/98-1/99 8/98 7th Control 2/98-7/98 8/98-1/99 ----
The time periods that make up the pre- lighting and post- lighting improvements
are broken into relatively short six-month time periods due to the speed in which each
city ward received improved alley lighting. As only six months of Index and other
related crime data were available prior to the installation of the new alley lamps in the
experimental area, the control area required the same short time frame.
Table 4 illustrates the number of new, improved, and the total number of alley
lights in both the experimental area and the control area. It can be seen that the control
area showed a marked increase in the number of alley lamps installed.
Table 4 - Experimental and Control Area Alley Fixtures Study Area
Political Ward Police District New Fixtures
Experimental 28 11 364 (8/98) Control 16 7 35 (5/99)
Crime Reports
Throughout this study, reported incidents, which include criminal offenses, were
used as the basic unit of analysis. For instance, crimes reported to the police were used
rather than either calls for service or arrest statistics. There were theoretical grounds to
support the use of reported incidents for this type of study. In Illinois the number of
reported offenses (incidents) is generally five times more than the number of police-
recorded arrests. In addition, reported crime data is potentially stronger than calls for
17
service data because reported crimes do not completely rely on citizen complaints for
action and are more numerous than other types of recorded crime (i.e. arrest data)
because they do not require suspect apprehension.
Some studies (Weisburg and Green 1995) have touted the benefits of calls for
service data in studies associated with public safety initiatives, the logic being that calls
for service data offers a reasonable and effective measure of citizen’s demand for police
assistance. Calls for service (CFS) data has been employed with mixed results in a
number of street lighting studies. The overall effect seems to be that CFS data are of
variable importance because they do not measure actual crimes, but rather the effect of
police deployment. Thus, some police initiatives may not result in a decline in the
number of crimes but instead show an increase in the number of calls for police
assistance.
Arrest data, however, is the end result of a process involving a call for service, an
incident form being reported and completed, and then the final apprehension of a suspect
by the police. Arrest data, however, may not completely represent the total effect of a
crime prevention initiative such as improving alley lighting because it does not take into
account or measure the process of crime deterrence, only the resulting arrest.
Since this evaluation tested the hypothesis that reported crimes may increase due
to increased alley lighting, it utilized reported incidents as the dependent variable. These
data provide researchers with an accurate count of community- level crime based on the
most positive aspects of the previously discussed data sources. For instance, reported
incidents are those situations when a resident has placed a call to police for service (i.e.
call for service data), but do not necessarily result in an arrest (i.e. arrest data).
18
Crime Types
Reported offenses to the Chicago Police Department are categorized by crime
type using an extensive and detailed classification system. The Chicago Police
Department uses 290 crime types to cover all aspects of every potential offense.
For the purposes of this research these 290 categories were first reduced to only
142 offenses that were theoretically likely to occur in alleys. These 142 offenses were
then aggregated into four violent Index, four property Index, and 13 non-Index crime
types (See appendix A for complete list of offenses included in analysis).
These crime categories were selected for inclusion in this analysis for several
reasons. First, those crimes that were thought likely to occur in alleys were examined.
These criminal offenses were determined based on frequencies indicating what crimes are
most likely to take place in Chicago alleys. Second, those crimes that were possibly
influenced by changes in alley lighting were included, but condensed into broad
categories. Those crimes that were thought to be unaffected by alley lighting were not
included and thus excluded from examination. Overall, 46 percent of the 142 offenses
obtained from CPD were excluded. While this sounds like a great deal, these offenses
included such crimes as embezzlement, theft of labor services, sexual relations within
families, neglect of child, telephone threats, and driver’s license violations. Thus, many
offenses are those that had a negligible impact on alley or street crime.
Further, selecting the groups for inclusion was based on several additional factors.
First, it was necessary that a sufficient number of offenses occurred during nighttime. If
a particular type of crime occurred mostly during daylight hours, for example fraud or
embezzlement, then increasing the alley lamp wattage would contribute little to crime

19
prevention. Next, was the crime likely to happen outdoors? Those crime types that are
primarily indoor events (e.g. employee thefts, neglect of child) are also unlikely to be
affected by improved alley lighting, although the issue of access to the building under
cover of darkness may be necessary and its affect minimized. Finally, was the motivation
for the crime type likely to be affected by better lighting? Major crimes such as robbery
and personal violence are potentially motivated by the environmental conditions
surrounding the act. Improving the alley lighting could be expected to have a stronger
influence on this type of personal crime in comparison to any other single category of
crime type.
Study Time Periods-Hours
One of the primary control factors for this research was the necessity to classify
crimes according to whether they occurred after dark. It was imperative to only examine
those crime types that happened when the alley lighting photocells were activated. The
researchers learned that the city of Chicago alley lights become active when the amount
of light in the atmosphere is only one percent.
Researchers obtained official sunrise and sunset times for Chicago from the U.S.
Naval Observatory’s Astronomical Applications Department. These observations are the
“official” observations of the sunrise and sunset of each day. Researchers used the
average monthly sunrise and sunset observations as controls in the analyses. (See
appendix B for average sunrise and sunset times by month).
While the time reported for the offenses was known, many crimes could have
occurred in the victim’s absence and thus, the period between the actual crime and its
discovery by the victim could span several days. This is particularly possible for crimes

20
such as auto theft and criminal damage to property. In these situations the exact time of
the offense is less likely to be known precisely and a real possibility exists that the crime
began in darkness and carried over into daylight or vice versa.
Using only crimes that could be precisely determined by the amount of daylight
and darkness is a difficult task. As will be examined later, the use of alley lighting
(rather than traditional street lighting) as the dependent variable means that far fewer
crime types could be included in all analyses. Combined with the aggregated categories
of violent Index, property Index, and non-Index, the impact of actual temporal
designations of light and darkness was likely to be minimal.
Study Design
This study utilized a research design for contrasted groups in which two or more
groups are compared before and after the introduction of a treatment variable. This
design, a nonequivalent control group design, uses statistical techniques to test for
comparability between the contrasted groups before any causal inferences are drawn.
In this study, a measurement of the number of reported criminal incidents that took place
in alleys was taken prior to the alley lighting improvement in both districts. Then, using
the date of the experimental area lighting improvement as the dividing point, a
measurement of the number of reported alley crime incidents was taken. This
measurement constituted a posttest.
Researchers also included another comparison control area (West Englewood)
that was as similar as possible to the experimental area, in terms of crime and
demographic area characteristics.

21
Finally, an analysis was conducted to compare changes in the number of reported
incidents occurring during the day to those occurring at night in the experimental study
area.
Geographic Data Selection
Initially, the geographical experimental and control areas were selected based on
the time order in which their alley lighting was improved. Researchers were provided
with an accurate timetable of alley light improvements by ward. The experimental area
dictated the initial experimental time frame and the basis of the subsequent alley lighting
installation dates. Thus, the selection of the control District was determined by the initial
time selection of the experimental lighting area and that area’s matching characteristics.
Defining the eight by eight-square blocks under study required more
methodological care to ensure that the study areas only encompassed the selected block
areas. As police districts are large, unevenly shaped areas that do not match up with
wards, the areas under study would not be easily defined by the databases from which
either the alley lighting or the police data came. Instead, offense, or incident data for the
study areas would be included in a larger mass of all reported district offense data. The
information requested from the Chicago Police Department was geographically filtered to
select out only those specific areas selected for inclusion in this study.
The process of geographically matching numeric or tabular address data to
locations along a map is called geo-coding. Geo-coding is a useful tool for locating
individual crime positions according to street address, mapping geographical areas for
study, pinpointing specific crime locations, or analyzing crime changes on a street- level
map. In order to geo-code specific information the user must first have a street- level map
22
on computer file (the reference theme) and the exact street address for the item under
study (the area of interest) listed in a separate data file. These components are necessary
to make up a geo-coded data file. Therefore, the reported offense data requested from the
Chicago Police Department were to contain specific street addresses for every criminal
offense from 1997-1998 in both Districts 11 and 7.
These specific street addresses for all reported offenses in Districts 11 and 7 were
first geo-coded by batch matching (a process the computer uses to geo-code addresses in
the area of interest by matching them to the address data in the reference theme). The
batch matching process is the quickest method of geo-coding. The computer generally
manages to only match up those addresses that are both perfect in the reference theme
and the area of interest file. The overall average matching (or “hit”) rate for the batch
matching process in District 11 was 97 percent, and in District 7, the rate was 98 percent.
In order to increase this matching rate, the data was geo-coded by the interactive
process. This process is done to attempt to locate those addresses that for some reason
did not geo-code in the batch matching process. Generally, these unmatched locations
are the result of a spelling error in the street name, or an out-of-range street number. The
overall average return rate for the interactive matching process in District 11 was
improved to 98 percent and in District 7 to 99 percent.
Following the interactive and batch matching geo-coding processes, the original
tables of reported offenses from the Chicago Police Department now constituted
locatable points on a Chicago street- level map. Those geo-coded offenses that were
reported in the experimental and control areas were subsequently filtered into separate
files for analysis. These site specific files now included only those street addresses
23
within the selected study areas and contained information on the time the actual offense
was reported, the date the incident was reported, the primary offense that was reported,
and where the offense allegedly occurred.
Statistical Analysis
As this evaluation utilized a non-equivalent control group design that is not
dependent on a randomly drawn sample, there was no one inferential statistical test that
was appropriate. This research first examined change in the experimental area over a
one-year period, then change over a six-month period between the experimental area and
a control area, and finally the change during the day versus the change at night through
the use of raw counts and percent change.
The first issue sought to answer the question of whether improving the wattage of
alley lamps had an impact on the crime in the experimental area (District 11). Crime
which occurred one year before the exact lighting improvement date and crime that
occurred one year following the lighting improvement date were compared. Since the two
time periods under analysis were basically the same, District 11’s pre- installation counts
(before lighting) and post- installation counts (after lighting) were compared to determine
any differences.
The second analysis attempted to determine what effect improved alley lighting
had on crime by comparing a separate control area that did not have the improved alley
lighting to the experimental area. Regardless of whether the one year analysis revealed a
localized impact on crime in the specific experimental area it is possible that improved
alley lighting had an effect on the experimental area when compared to another area of
the city that did not receive improved alley lighting.

24
Finally, a third analysis was conducted, the findings of which are among the
results of the two previous analyses. In order to identify any reporting patterns that may
occur due to the increase in the alley light wattage, a day versus night comparison was
conducted. This analysis basically treated all reported offenses that did not fall into the
previously defined nighttime control category as daytime offenses. The daytime offenses
were then analyzed and compared to the nighttime category for violent Index, property
Index, and non-Index crimes in order to understand what types of crime were being
reported in the experimental area during different hours of the day.
In addition, this analysis would indicate the overall temporal crime patterns in the
experimental area. By examining when each of the three crime categories increased and
decreased, the researchers were able to further assess the impact of the improved alley.
Results of One Year Experimental Area Analysis
The study examined the potential effects of improving alley lighting in one eight-
by-eight block area on Chicago’s West Side. This area, West Garfield Park in police
District 11, was examined for all crimes that were reported in alleys and at night over a
period of two years. These incidents were examined one year before the alley lighting
was improved (pre- installation) and one year after (post- installation).
Figure 4 shows the total number of incidents, as well as the specific violent Index,
property Index and non-Index crimes in the experimental area for one-year pre- and post-
alley lighting installation. The raw counts and percentages for this area are based on
frequencies in each crime category, after selecting data that only represented those
reported incidents that took place at night and in alleys.

25
When the raw counts for this one-year analysis of the experimental area were
examined, the data indicate that there were 428 total incidents reported in the pre-
installation period and 519 total incidents in the post- installation period - an increase of
21 percent in reported offenses between the pre- and post-period test.
Each of the three crime categories experienced an increase in the number of
reported incidents between the pre-and post-installation period. The number of violent
Index offenses went up 14 percent (from 119 to 136) between the pre- and post- lighting
installation period, while property offenses reported increased by 20 percent (from 30 to
36) and the non-Index offenses reported to police increased by 24 percent (from 279 to
347).
The violent Index crime increases were predominately the result of more reported
criminal sexual assaults (up 55 percent, from 11 to 17), aggravated assaults (up 34
Figure 4 - Change in Reported Incidents in Experimental Area:One Year Pre-and Post-Installation of Alley Lights
All Offenses
119
30
428
136
36
347
519
279
0
100
200
300
400
500
600
Violent Index Offenses Property Index Offenses Non-Index Offenses Overall Total
Num
ber o
f Rep
orts
Pre PostSource: Chicago Police Dept.

26
percent, from 62 to 83), and homicides (from 2 to 4). The only violent Index crime to
decline was robbery (down 27 percent, from 44 to 32). The greatest property crime
increase was in motor vehicle theft (from 7 to 15, up 114 percent), while the greatest
decline was in arson (from 4 to 0).
Since a majority of the alley offenses were non-Index crimes, a separate analysis
was conducted to examine which offenses created the 24 percent overall increase in
reported offenses. Figure 5 shows the results of this analysis.
The raw counts of non-Index offenses indicate that there appeared to be an even
split between the number of reported incidents that rose and fell. The greatest increase in
non-Index reported offenses were substance abuse violations (up 51 percent), while the
greatest non-Index decline was in prostitution and other sex crimes (down 67 percent).
Figure 5 - Change in Reported Incidents in Experimental Area:One Year Pre- and Post-Installation of Alley Lights
Non-Index Offenses
6
50
0
18
161
44
2
47
1
19
243
35
0
50
100
150
200
250
300
Prostitution and SexCrimes*
Damage/Trespass toProperty
Damage/Trespass toVehicle
Weapons Violations Substance AbuseViolations**
Other***
Num
ber o
f Rep
orts
Pre Post
*Does not include Criminal Sexual Assault**Includes alcohol and drug violations***See appendix ASource: Chicago Police Dept.

27
Figure 6 illustrates a comparison in the number of reported incidents during the
day to the number of reported incidents at night in the experimental area.
As indicated in Figure 6, the one year nighttime analysis reported experimental
area incidents increasing by an overall average of 21 percent compared to a 7 percent
decrease in daytime reports. The only daytime increase in reported incidents was in
property Index offenses (10 percent). In comparison, nighttime reported incidents
showed increases of 24 percent (non-Index offenses), 20 percent (property Index
offenses), and 14 percent (violent Index offenses). These findings may suggest an
increase in the reporting of offenses created by better alley lighting.
With regard to violent Index offenses, criminal sexual assault and assault/battery
reports increased at night (up from 11 to 17, and up from 62 to 83, respectively), while
reports of robbery declined from 44 to 32. Property Index offenses also showed changes
at night. Theft reports increased from 19 to 21 at night, while motor vehicle theft reports
Figure 6 - Change in Reported Incidents in Experimental Area:One Year Pre- and Post-Installation of Alley Lights
Day Versus Night Comparison - All Offenses
-20%
-10%
0%
10%
20%
30%
Per
cent
Cha
nge
Day Night
Violent Index Offenses Property Index Offenses Non-Index Offenses Overall Total
Source: Chicago Police Dept.
122 to 118
119 to 136
60 to 66
30 to 36
456 to 409
279 to 347
638 to 593
428 to 519

28
went up from 7 to 15 reported incidents. The greatest overall increase in reported
incidents however came from the non-Index offenses.
Figure 7 shows a breakdown of the non-Index offense day versus night reported
incident changes. The greatest increase in nighttime reports was substance abuse
violations (50 percent, from 162 to 243). Weapons violation reports also increased
slightly (from 18 to 19). Again, increases in reported incidents may indicate that
community residents or police are more likely to witness these offenses at night and are
now reporting them more than before the alley lighting was improved.
The data indicate a 21 percent increase in the number of total reported incidents at
night in the experimental district following the improvement of the alley lights. It
appears that improved alley lighting resulted in an increase in the number of incident
reports to the Chicago Police Department. Therefore, the findings indicate that there did
Figure 7 - Change in Reported Incidents in Experimental Area:One Year Pre- and Post-Installation of Alley Lights Day Versus Night Comparison -Non Index Offenses
-150%
-100%
-50%
0%
50%
100%
Per
cent
Cha
nge
Day Night
Prostitution and Sex Crimes*
Damage/Trespass to Property
Damage/Trespass to Vehicle
Weapons Violations
Substance Abuse Violations**
Other***
*Does not include Criminal Sexual Assault**Includes alcohol and drug violations***See appendix A****Not calculable
Source: Chicago Police Dept.
10 to 8
6 to 2
32 to 35
50 to 47
1 to 0
0 to 1****
18 to 18
18 to 19
326 to 326
162 to 243
69 to 22
44 to 55

29
not appear to be a suppression effect on crime as a result of improved alley lighting. The
results imply that increased alley lighting in the experimental district did not lead to a
reduction in criminal offenses during the study period. Instead, increased alley lighting in
the experimental area appeared to lead to an increase in the total number of incidents
reported to the Chicago police. This may imply an increase occurred in the actual number
of offenses committed or an increase in the likelihood of a resident reporting an offense
due to heightened community awareness. Improved alley lighting may also increase the
likelihood of police viewing offenses as they are committed.
Results of Six Month Experimental and Control Analysis
This analysis compared the criminal offenses in the experimental area that
received improved alley lighting to another area that did not receive improved alley
lighting. A raw count was taken for the control area (West Englewood - District 7) and
compared to the experimental area (West Garfield Park - District 11). However, instead
of utilizing a one-year time span, these raw counts and the subsequent analysis were
conducted using six-month time periods because of the expedient manner in which the
city of Chicago upgraded their alley lights. As the alley lights were improved in the
control district by the time analysis began, there were only six comparable months of data
in both the pre- installation and post- installation period for both the experimental and the
control areas.
Results of Analysis for All Offenses
For the six month period prior to alley lighting improvement, the experimental
area experienced 205 reported incidents in the six month pre-period and 287 reported
incidents in the six month post-period, for a 40 percent increase. Each individual crime
30
category also increased by an average of 50 percent, with the property Index crimes
increasing by 77 percent.
The control district crime counts also increased. The control area experienced 166
reported incidents in the pre-installation period, and 198 reported incidents in the post-
installation period. This represented a 19 percent increase in the number of reported
incidents. The individual crime categories in the control area also increased by an average
of 23 percent, with property Index crimes increasing by 38 percent.
Figure 8 shows the total number of incidents, as well as the specific violent Index,
property Index and non-Index crimes in the experimental area for a six-month period pre-
and six month period post-alley lighting installation. The raw counts and percentages for
this area are again based on obtained frequencies of each crime category, after selecting
data that only represented those reported incidents that took place at night and in alleys.

31
When the raw counts for this six-month analysis of the experimental area are
examined, the data indicate that there were 205 total incidents reported in the pre-
installation period and 287 total incidents in the post- installation period - an increase of
40 percent in reported offenses between the pre- and post-period test. In the control area,
the increase in reported incidents was 19 percent. This finding may further support the
hypothesis that lighting leads to resident and/or police observing more crime and
reporting it.
A review of the individual crime categories indicates that each of the three crime
categories experienced a double-digit increase in the number of reported incidents
between the pre-and post- installation period. The number of violent Index offenses went
up 32 percent (from 57 to 75) between the pre- and post- lighting installation period,
Figure 8 - Change in Reported Incidents in Experimental Area:Six Months Pre- and Post-Installation of Alley Lights
All Offenses
57
13
205
75
23
135
189
287
0
50
100
150
200
250
300
350
Violent Index Offenses Property Index Offenses Non-Index Offenses Overall Total
Num
ber o
f Rep
orts
Pre PostSource: Chicago Police Dept.
32
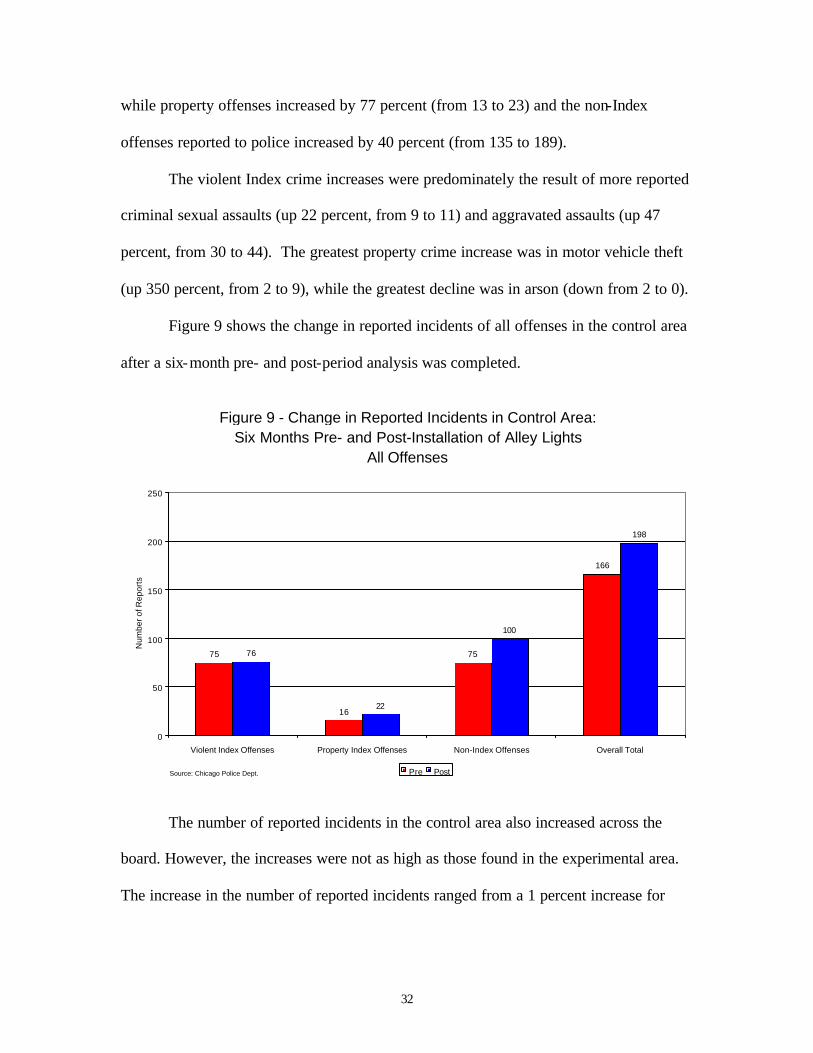
while property offenses increased by 77 percent (from 13 to 23) and the non-Index
offenses reported to police increased by 40 percent (from 135 to 189).
The violent Index crime increases were predominately the result of more reported
criminal sexual assaults (up 22 percent, from 9 to 11) and aggravated assaults (up 47
percent, from 30 to 44). The greatest property crime increase was in motor vehicle theft
(up 350 percent, from 2 to 9), while the greatest decline was in arson (down from 2 to 0).
Figure 9 shows the change in reported incidents of all offenses in the control area
after a six-month pre- and post-period analysis was completed.
The number of reported incidents in the control area also increased across the
board. However, the increases were not as high as those found in the experimental area.
The increase in the number of reported incidents ranged from a 1 percent increase for
Figure 9 - Change in Reported Incidents in Control Area: Six Months Pre- and Post-Installation of Alley Lights
All Offenses
75
16
75
166
76
22
100
198
0
50
100
150
200
250
Violent Index Offenses Property Index Offenses Non-Index Offenses Overall Total
Num
ber o
f Rep
orts
Pre PostSource: Chicago Police Dept.

33
violent Index offenses to an increase of 38 percent in reports of property Index offenses.
Overall, there was a 19 percent increase in all reported incidents in the control area.
In addition, a day versus night comparison was conducted over the six month pre-
installation and six month post-installation time period for both the experimental and
control districts. These analysis were done to help control for factors other than alley
lighting that may influence the number of incidents reported to police. The results of the
comparison in the experimental area are shown in Figure 10.
As indicated in Figure 10, the nighttime analysis reported experimental area
incidents increasing by an overall average of 40 percent compared to a 23 percent
decrease in daytime reports. The only daytime increase in reported incidents was again
in property Index offenses (from 29 to 30). In comparison, nighttime reported incidents
showed increases of 77 percent (from 13 to 23) for property Index offenses, 40 percent
Figure 10 - Change in Reported Incidents in Experimental Area:Six Months Pre- and Post-Installation of Alley Lights
Day Versus Night Comparison - All Offenses
-50%
0%
50%
100%
Per
cent
Cha
nge
Day Night
Violent Index Offenses
Property Index Offenses
Non-Index Offenses
Overall Total
Source: Chicago Police Dept.
77 to 51
57 to 75
29 to 30
13 to 23
259 to 200
135 to 189
365 to 281
205 to 287

34
(from 135 to 189) for non-Index offenses, and 32 percent (from 57 to 75) for violent
Index offenses.
With regard to violent Index offenses, criminal sexual assault and assault/battery
reports again increased substantially at night (up from 9 to 11 and up from 30 to 44
respectively), while property Index offenses showed mixed changes. Theft reports
increased by 56 percent at night (from 9 to 14), while motor vehicle theft reports went up
nearly five times (from 2 to 9).
Figure 11 indicates changes in the number of reported incidents during the day
compared to the changes found at night in the control area.
In the control area, the number of reported incidents during the day generally
decreased while reported incidents at night increased. Both the largest decrease during
the day (from 40 to 26 reported incidents) and the largest increase at night (from 16 to 22
Figure 11 - Change in Reported Incidents in Control Area:Six Months Pre- and Post-Installation of Alley Lights
Day Versus Night Comparison - All Offenses
-60%
-40%
-20%
0%
20%
40%
60%
Per
cent
Cha
nge
Day Night
Violent Index Offenses Property Index Offenses
Non-Index Offenses Overall Total
Source: Chicago Police Dept.
85 to 86 75 to 76
40 to 26
16 to 22
115 to 78
75 to 100
240 to 190
166 to 198

35
reported incidents) involved property Index offenses. Reported incidents involving non-
Index offenses decreased 32 percent during the day (from 115 to 78) and increased 33
percent at night (from 75 to 100). The number of reported criminal sexual assault
incidents decreased both during the day (from 4 to 1) and at night (from 6 to 5). Reported
robberies increased during the day (from 20 to 26) and decreased at night (from 18 to 17).
There was a decrease during the day in the number of reported thefts (from 31 to 21), and
a 50 percent increase in the number of thefts reported at night (from 10 to 15). The
number of reported incidents concerning motor vehicle theft decreased 56 percent (from
9 to 4) during the day, but did not change at all at night (5 reported incidents during each
time period). Overall, there was a 21 percent decrease in the number of reported incidents
during the day (from 240 to 190) and a 19 percent increase at night (from 166 to 198).
Results of Analysis for Non-Index Offenses
Since a majority of the alley offenses were non-Index crimes, a separate analysis
was conducted to examine which offenses created the 40 percent overall increase in
reported offenses. The greatest increase in non-Index reported incidents were substance
abuse violations (up 60 percent, from 77 to 123), and weapons violations (67 percent,
from 9 to 15).
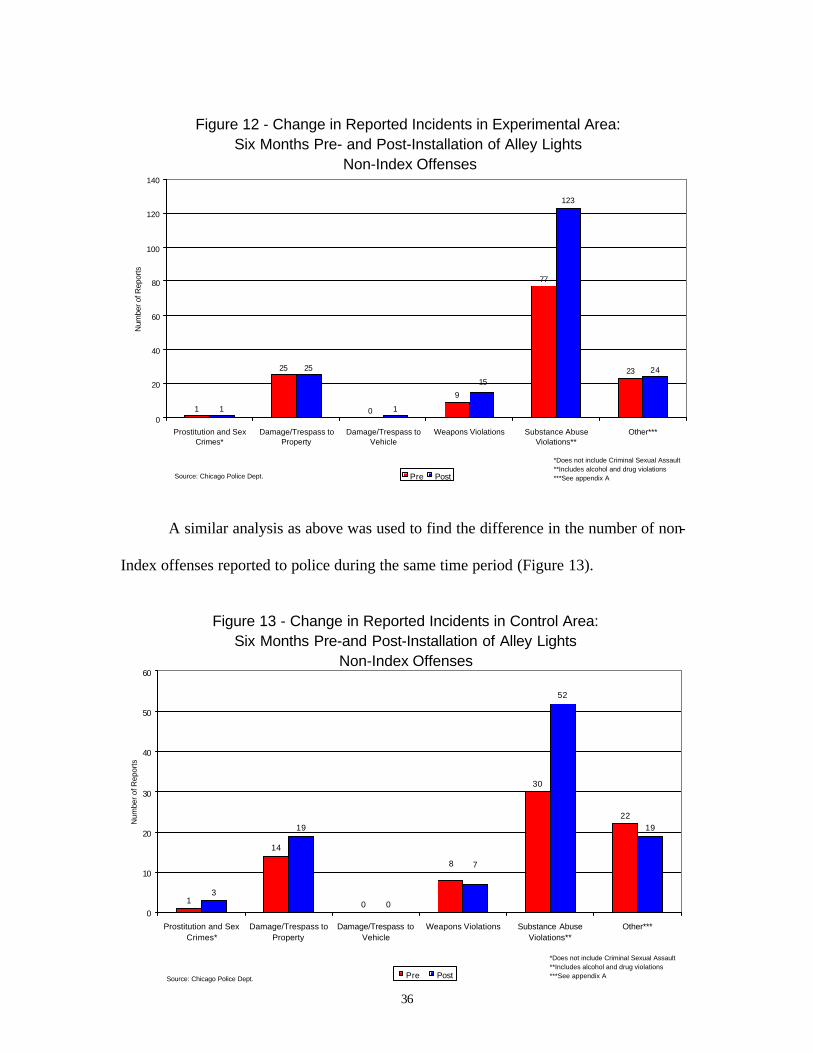
36
A similar analysis as above was used to find the difference in the number of non-
Index offenses reported to police during the same time period (Figure 13).
Figure 12 - Change in Reported Incidents in Experimental Area:Six Months Pre- and Post-Installation of Alley Lights
Non-Index Offenses
1
25
0
9
77
23
1
25
1
123
2415
0
20
40
60
80
100
120
140
Prostitution and SexCrimes*
Damage/Trespass toProperty
Damage/Trespass toVehicle
Weapons Violations Substance AbuseViolations**
Other***
Num
ber o
f Rep
orts
Pre Post
*Does not include Criminal Sexual Assault**Includes alcohol and drug violations***See appendix ASource: Chicago Police Dept.
Figure 13 - Change in Reported Incidents in Control Area:Six Months Pre-and Post-Installation of Alley Lights
Non-Index Offenses
1
14
0
30
22
3
19
0
52
19
8 7
0
10
20
30
40
50
60
Prostitution and SexCrimes*
Damage/Trespass toProperty
Damage/Trespass toVehicle
Weapons Violations Substance AbuseViolations**
Other***
Num
ber o
f Rep
orts
Pre Post
*Does not include Criminal Sexual Assault**Includes alcohol and drug violations***See appendix ASource: Chicago Police Dept.
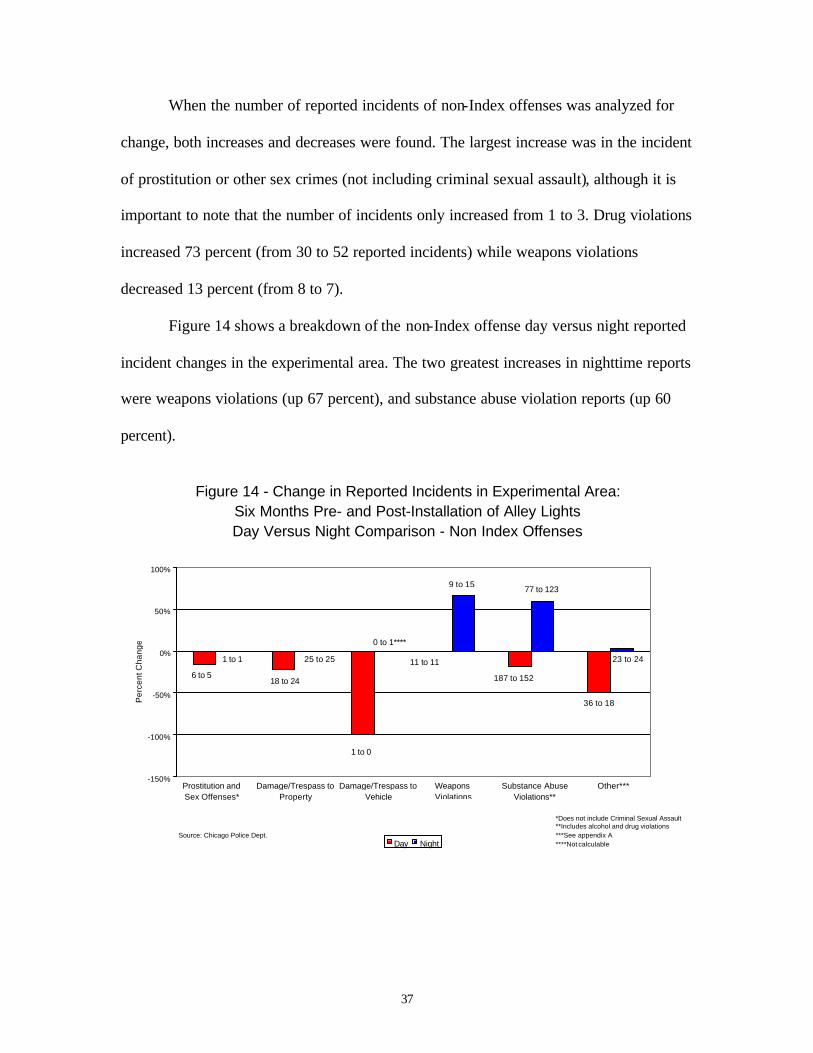
37
When the number of reported incidents of non-Index offenses was analyzed for
change, both increases and decreases were found. The largest increase was in the incident
of prostitution or other sex crimes (not including criminal sexual assault), although it is
important to note that the number of incidents only increased from 1 to 3. Drug violations
increased 73 percent (from 30 to 52 reported incidents) while weapons violations
decreased 13 percent (from 8 to 7).
Figure 14 shows a breakdown of the non-Index offense day versus night reported
incident changes in the experimental area. The two greatest increases in nighttime reports
were weapons violations (up 67 percent), and substance abuse violation reports (up 60
percent).
Figure 14 - Change in Reported Incidents in Experimental Area:Six Months Pre- and Post-Installation of Alley LightsDay Versus Night Comparison - Non Index Offenses
-150%
-100%
-50%
0%
50%
100%
Per
cent
Cha
nge
Day Night
Prostitution and Sex Offenses*
Damage/Trespass to Property
Damage/Trespass to Vehicle
Weapons Violations
Substance Abuse Violations**
Other***
*Does not include Criminal Sexual Assault**Includes alcohol and drug violations***See appendix A****Not calculable
Source: Chicago Police Dept.
6 to 5
1 to 1
18 to 24
25 to 25
1 to 0
0 to 1****
11 to 11
9 to 15
187 to 152
77 to 123
36 to 18
23 to 24

38
A final analysis was conducted to determine the change in reported incidents
during the day versus the change found at night looking at non-Index offenses in the
control district (Figure 15).
The reported number of damage/trespass to property incidents increased 77
percent during the day, from 13 to 23. The number of reported weapon violation incidents
increased slightly during the day (from 4 to 5), but decreased slightly at night (from 8 to
7). Finally, substance abuse violation incidents decreased 52 percent during the day (from
69 to 33) and increased 73 percent at night (from 30 to 52).
Figure 15 - Change in Reported Incidents in Control Area:Six Months Pre- and Post-Installation of Alley Lights Day Versus Night Comparison - Non Index Offenses
-150%
-100%
-50%
0%
50%
100%
150%
200%
250%
Per
cent
Cha
nge
Day Night
Prostitution and Sex Offenses*
Damage/Trespass to Property
Damage/Trespass to Vehicle
Weapons Violations
Substance Abuse Offenses**
Other**
*Does not include Criminal Sexual Assault**Includes alcohol and drug violations***See appendix ASource: Chicago Police Dept.
1 to 0
1 to 3
13 to 23
14 to 19
1 to 0
0 to 04 to 5
8 to 7
69 to 33
30 to 52
27 to 17
22 to 19

39
Summary
This evaluation found that reported incidents (offenses) increased between the
one-year pre- and one-year post-installation study periods in the experimental area of
West Garfield Park where alley lighting was improved. The evaluation also found that the
experimental area experienced more notable increases in reported incidents over a six-
month pre- installation and six-month post-installation study period in comparison to the
control area of Englewood, which did not receive the alley lighting improvements. A
comparison of reported incidents that occurred during the daytime as compared to
nighttime incidents found that generally, nighttime incidents increased during the study
periods and reported daytime incidents generally decreased, remained the same, or
increased only slightly.
While this evaluation could not provide a definitive explanation of these findings,
it is likely that some of the observed increase in reported incidents is due to increased
reporting of crime by residents, who may simply be more aware of offenses taking place
due to the improved alley lighting.
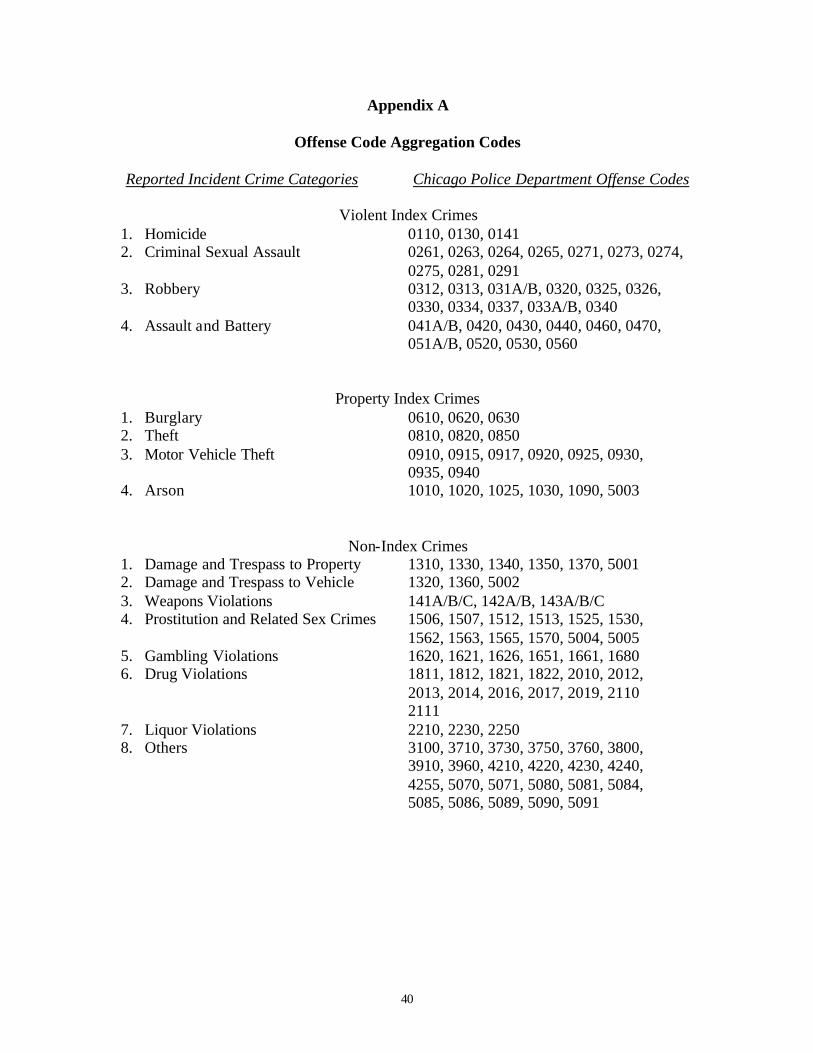
40
Appendix A
Offense Code Aggregation Codes Reported Incident Crime Categories Chicago Police Department Offense Codes
Violent Index Crimes
1. Homicide 0110, 0130, 0141 2. Criminal Sexual Assault 0261, 0263, 0264, 0265, 0271, 0273, 0274,
0275, 0281, 0291 3. Robbery 0312, 0313, 031A/B, 0320, 0325, 0326,
0330, 0334, 0337, 033A/B, 0340 4. Assault and Battery 041A/B, 0420, 0430, 0440, 0460, 0470,
051A/B, 0520, 0530, 0560
Property Index Crimes 1. Burglary 0610, 0620, 0630 2. Theft 0810, 0820, 0850 3. Motor Vehicle Theft 0910, 0915, 0917, 0920, 0925, 0930,
0935, 0940 4. Arson 1010, 1020, 1025, 1030, 1090, 5003
Non-Index Crimes 1. Damage and Trespass to Property 1310, 1330, 1340, 1350, 1370, 5001 2. Damage and Trespass to Vehicle 1320, 1360, 5002 3. Weapons Violations 141A/B/C, 142A/B, 143A/B/C 4. Prostitution and Related Sex Crimes 1506, 1507, 1512, 1513, 1525, 1530,
1562, 1563, 1565, 1570, 5004, 5005 5. Gambling Violations 1620, 1621, 1626, 1651, 1661, 1680 6. Drug Violations 1811, 1812, 1821, 1822, 2010, 2012,
2013, 2014, 2016, 2017, 2019, 2110 2111
7. Liquor Violations 2210, 2230, 2250 8. Others 3100, 3710, 3730, 3750, 3760, 3800,
3910, 3960, 4210, 4220, 4230, 4240, 4255, 5070, 5071, 5080, 5081, 5084, 5085, 5086, 5089, 5090, 5091

41
Appendix B
Month Median sunrise Median Sunset 1997
August 6:00 a.m. 7:51 p.m. September 6:32 a.m. 7:00 p.m. October 7:04 a.m. 6:09 p.m. November 6:41 a.m. 4:30 p.m. December 7:12 a.m. 4:21 p.m. 1998 January 7:16 a.m. 4:45 p.m.
February 6:47 a.m. 5:24 p.m. March 6:03 a.m. 5:57 p.m. April 6:11 a.m. 7:32 p.m. May 5:31 a.m. 8:04 p.m. June 5:15 a.m. 8:27 p.m. July 5:29 a.m. 8:24 p.m. August 5:59 a.m. 7:51 p.m. September 6:31 a.m. 7:00 p.m. October 7:03 a.m. 6:09 p.m. November 6:40 a.m. 4:30 p.m. December 7:11 a.m. 4:21 p.m.
1999 January 7:16 a.m. 4:45 p.m. February 6:47 a.m. 5:23 p.m. March 6:03 a.m. 5:57 p.m. April 6:11 a.m. 7:31 p.m. May 5:31 a.m. 8:04 p.m. June 5:15 a.m. 8:27 p.m. July 5:30 a.m. 8:24 p.m.

42

43
References
Boylan, A. B., and M. Grossman. 1999. City gets classic with lampposts. Chicago Tribune, 3/16/99 City of Atlanta. 1975. Street lighting project: Final evaluation report.
Washington DC: National Criminal Justice Reference Service. Challinger, D. 1991. Less telephone: How does it happen? Security Journal 2:11–119. The Chicago Fact Book Consortium (eds.) 1990. Local Community Fact Book –
Chicago Metropolitan Area, 1990. University of Illinois at Chicago. 99 & 195. Clarke, R.V.G., and P. Mayhew. (eds.) 1980. Designing out crime, London, HMSO. Fleming, R., and J. Burrows. 1986. The case for lighting as a means of preventing crime. Research Bulletin 22. Home Office Research and Planning Unit, London, 14-17. Griswold, D.B. 1984. Crime prevention and commercial burglary: A time series analysis. Journal of Justice. 12:493-501. Hartley, J.E. 1974. Lighting reinforces crime fight. Buttenheim Publishing Corporation, Pittsfield. Painter, K., and D.P. Farrington. 1990. “Women’s experience and fear of crime and the scope for public lighting as a means of crime prevention”. Paper presented to the Leeds City Conference on Crime and Lighting, Leeds, England. Painter, K. 1988. Lighting and crime prevention: The edmonton project. England. Poyner, B., and B. Webb. 1987. Successful crime prevention: Case studies. London: Tavistock Institute of Human Relations. Quinet, E.D., and S. Nunn. 1998. Illuminating crime: The impact of street lighting on calls for police service. Evaluation Review. 22:751-778. Ramsay, M. 1989. Crime prevention: Lighting the way ahead. Research Bulletin 27:18-
20. Siegel, L.J. 1995. Criminology: Theories, patterns, and typologies. 5th ed. New York: West.
44
Tien, J.M., V.F. O’Donnell, A. Barnet, A. Mirchandani, and B. Pitu. 1977. Street lighting projects: National evaluation program, Phase I summary report. Washington, DC National Institute of Law Enforcement and Criminal Justice. Wilson, W.J. 1987. The Truly Disadvantaged: The Inner City, the Underclass, and
Public Policy. Chicago: The University of Chicago Press. Wright, R., M. Heilweil, P. Pelletier, and K. Dickinson. 1974. The impact of street lighting on crime (part I). University of Michigan for the National Institute of Law Enforcement and Criminal Justice.