The characterization of beryl and emerald by visible and ... · the characterization of beryl ai{d...
24
THE AMERICAN MINERALOGIST, VOL.53, MAY_JUNE, 1968 THE CHARACTERIZATION OF BERYL AI{D EMERALD BY VISIBLE AND INFRARED ABSORPTION SPECTROSCOPY D. L. Woop eNn K. Nesseu, BeIl Telephone Laboratories, Incorporated, Murray Hill, I{ew Jersey Assrnecr Absorption measurements with polarized radiation in the visible, ultraviolet, and in- frared regions make possible a study of the centers responsible for the difierences among various types of beryl. The spectra of two types of water can be recognized with molecular vibrational fundamentals at 1542 cm-l(o), 3555 cm-1(o) and 3694 cm-r(e) for Type I, and at 1628 cm-l(e),3592 cm-r(e), and 3655 cm-r(o) for Type II. Many overtones and com- binations of these fundamentals also have been identified. The Tlpe I molecule is oriented in the channels with its C2 symmetry axis perpendicular to the crystal C6-axis,while the Type II molecule is rotated 90o by the action of a nearby alkali ion on the molecular electric dipole. Synthetic flux grown beryl contains no water, and hydrothermal beryI grown in the absence of alkali shows only the Type I spectra. Molecules of COz also are sometimes present in the channels, producing a vibrational absorption frequency of 2353 cm*r (4.25 p) in the ordinary ray. Green beryl (emerald) is colored by the Crs+ ion in octahedral Al3+ sites, giving rise to the broad bands at 4300 A and 6000 A and sharp lines at 4760 L,6800 A and 6830 A. These features can be accounted for in detail by the crystal field theory, and a nondestructive analysis for Cr3+ is possible from a measurement of the intensity of absorption. Chrome- free "emeralds," although deep green in color, have a somewhat different absorption spec- trum which can be attributed to octahedral V3+ substituted in the Als+ sites. PaIe green, blue, or yellow beryls are colored according to the relative intensities of three spectral features attributable to iron ions: (a) a broad band in the extraordinary tay at 6200 A due to Fe2+in a channel site, (b) an absorption edge near 4000 A in both o and e due to octahe- dral Fe3+ in the Al3+ site, and (c) narrow bands in both o and e at 4650 A and 3740 A due to Fe3+ in tetrahedral Sia+sites. Two other features, -also attributable to iron, do not produce any visible coloration: (d) a broad band at 8100 A in the ordinary ray due to Fe2+ in the octahedral Al3+ site, and (e) a set of broad components in the extraordinary ray centered around 8100 A due to Fez+ in a different channel site. These spectral features are interpreted on the basis of the crystal field theory. For pink beryl, the color is due to Mn2+, not Mn3+, but the four component bands in the spectrum at 3550 A(€), 4950 A(o), 5400 A(@) and 5550 A(e) could not be positively identified with the expected crystal field transitions' INrnooucrroN Beryl shows a number of characteristic absorption lines or bands in the optically transparent region ranging approximately from 0.25 micron (40,000 cm-l).The colors of the various types of beryls (including aquamarine, golden beryl, morganite, emerald, etc). originate from ab- sorptions in the 0.4 to 0.7 micron range, the causative agents being chromophoric transition metal ions. In the region beyond 4.5 microns there are absorptions due to vibrations of the crystal lattice, the so- called lattice modes. Finally, in the region from about 1 to 7 microns, there are absorptions originating from impurity moleculestrapped in the
Transcript of The characterization of beryl and emerald by visible and ... · the characterization of beryl ai{d...

THE AMERICAN MINERALOGIST, VOL.53, MAY_JUNE, 1968
THE CHARACTERIZATION OF BERYL AI{D EMERALD BY
VISIBLE AND INFRARED ABSORPTION SPECTROSCOPY
D. L. Woop eNn K. Nesseu, BeIl Telephone Laboratories, Incorporated,Murray Hill, I{ew Jersey
Assrnecr
Absorption measurements with polarized radiation in the visible, ultraviolet, and in-
frared regions make possible a study of the centers responsible for the difierences among
various types of beryl. The spectra of two types of water can be recognized with molecular
vibrational fundamentals at 1542 cm-l(o), 3555 cm-1(o) and 3694 cm-r(e) for Type I, and
at 1628 cm-l(e),3592 cm-r(e), and 3655 cm-r(o) for Type II. Many overtones and com-
binations of these fundamentals also have been identified. The Tlpe I molecule is oriented
in the channels with its C2 symmetry axis perpendicular to the crystal C6-axis, while the
Type II molecule is rotated 90o by the action of a nearby alkali ion on the molecular
electric dipole. Synthetic flux grown beryl contains no water, and hydrothermal beryI
grown in the absence of alkali shows only the Type I spectra. Molecules of COz also are
sometimes present in the channels, producing a vibrational absorption frequency of 2353
cm*r (4.25 p) in the ordinary ray.
Green beryl (emerald) is colored by the Crs+ ion in octahedral Al3+ sites, giving rise to
the broad bands at 4300 A and 6000 A and sharp lines at 4760 L,6800 A and 6830 A. These
features can be accounted for in detail by the crystal field theory, and a nondestructive
analysis for Cr3+ is possible from a measurement of the intensity of absorption. Chrome-
free "emeralds," although deep green in color, have a somewhat different absorption spec-
trum which can be attributed to octahedral V3+ substituted in the Als+ sites. PaIe green,
blue, or yellow beryls are colored according to the relative intensities of three spectral
features attributable to iron ions: (a) a broad band in the extraordinary tay at 6200 A due
to Fe2+ in a channel site, (b) an absorption edge near 4000 A in both o and e due to octahe-
dral Fe3+ in the Al3+ site, and (c) narrow bands in both o and e at 4650 A and 3740 A due to
Fe3+ in tetrahedral Sia+ sites. Two other features, -also attributable to iron, do not produce
any visible coloration: (d) a broad band at 8100 A in the ordinary ray due to Fe2+ in the
octahedral Al3+ site, and (e) a set of broad components in the extraordinary ray centered
around 8100 A due to Fez+ in a different channel site. These spectral features are interpreted
on the basis of the crystal field theory. For pink beryl, the color is due to Mn2+, not Mn3+,
but the four component bands in the spectrum at 3550 A(€), 4950 A(o), 5400 A(@) and 5550
A(e) could not be positively identified with the expected crystal field transitions'
INrnooucrroN
Beryl shows a number of characteristic absorption lines or bands in
the optically transparent region ranging approximately from 0.25 micron(40,000 cm-l).The colors of the various types of beryls (including
aquamarine, golden beryl, morganite, emerald, etc). originate from ab-
sorptions in the 0.4 to 0.7 micron range, the causative agents being
chromophoric transition metal ions. In the region beyond 4.5 microns
there are absorptions due to vibrations of the crystal lattice, the so-
called lattice modes. Finally, in the region from about 1 to 7 microns,
there are absorptions originating from impurity molecules trapped in the

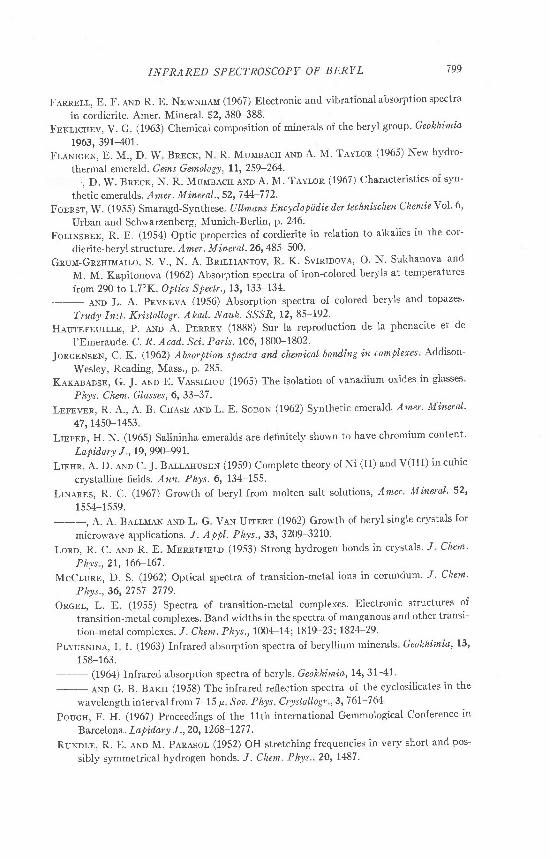
MoLECULAR vrBRATroNs HzO, COzcHROMOPHORES Fe,Cr
JVLAfTICE VIERATIONS
BeiA!2 SL6 0161zoF
o
D. L, WOOD AND K. NASSAU
l'rc. 1. Composite spectrum of beryl showing: the region of lattice vibrations (4.5p
toward longer wavelength), the region of molecular vibrations (water and COz from 0.84p
to 6.5p), and the region of chromophoric absorptions (0.3 to 7.1p), u'ith ordinary ray polar-
ization.
beryl channels. In Figure 1 is shown a composite spectrum il lustratingthe various regions with specific assignments.
Unpolarized room temperature absorption spectra of beryl have beenreported before but we have extended these measurements to includedata made with oriented sections, polarized radiation, and low temper-atures, so that we are able to extend the interpretation of these spectrain terms of the energy levels of the chromophoric ions. We also reviewhere the importance of the spectra of molecular species in the understand-ing of the structural details of beryl.
ExppntueNt,tl,
Specimens of beryl were obtained from a variety of sources, includingcommercial dealers, museums, private collections, and from various in-dividuals. A list of the 79 crystals studied is presented in Table I whichalso gives the origin and spectral characters of the group of crystals.Plane sections were cut and polished with the optic axis parallel to thepolished surfaces so that the ordinary (<,r) and extraordinary (e) ray spec-tra could be obtained from the single section by the use of polarized radi-ation. The orientation was conveniently accomplished by centering theoptic normal figure in a polarizing microscope using monochromatic il-lumination. Spectra were recorded in the ultraviolet-visible-near infraredrange on a Cary model 14 double beam spectrophotometer, and in thefarther infrared with a Perkin-Elmer model 421 double beam gratingspectrophotometer.
TnB SrnucruRE AND THE SyNTHESTs oF BERyL
The beryl structure (Bragg and West, 1926; Belov and Matveeva,1950) consists of a series of SiO+ and BeOa tetrahedra connected with A10o

INFRARED SPECTROSCOPY OF BERYL
TneLE 1. Bnnvr- Salpr-ns SruDrED
779
1. Synthetic crystals (Emeralds) (with Cr)a) Without water (show only lattice modes and Cr lines)
309* Chatham* (flux) M0* BTL" flux grown
413 Chatham (flux) 450 Gilson" flux grown
414 Chatham (flux) 476 Chatham (flux)
436 Nackenb (flux) 484+ BTL flux grown
437 Nacken (flux) 508 Gilson flux grown
438 Nacken (flux) 509 Gilson flux grown
439* Nacken (flux) 510 Gilson flux grorvn
b) With water (show lattice modes, water type I, and Cr lines)
435* Linde' hydrothermal457 Linde hydrothermal
485 Lechleitner*hydrothermal2. Natural crystals
a) Colorless (goshenite) (show lattice modes, water types I and II, some show COz,
some show Fe2+)
375 Mt. Antero, Colo. 481 Erongo Mts., S' W Africa
430 Unknown 483 Newry, Maine
431 Unknown 503 Unknown
432*+ Unknown 1309 Acworth, N. H.
433x* Unknown 10,202 Musinka, Siberia
M3** Brazil lO,297 Stoneham, Me.
444* Brazil 10,345 Pala, San Diego Co., Cal.
M5+* Brazil 18,818a Minas Geraes, Brazil
446+* Brazil 24,ll9b Erongo Mts., S. W. Africa
451x Unknown 24,ll9c Erongo Mts., S. W. Africa
b) Pale blue or green beryls (aquamarine) (show lattice modes, water types I and II,
Fe2+, Fe3+, some show COs)434* Brazil 505 Unknown
448** Madagascar 506 Unknown
480 N. Carolina 10,228 Audon-Tschilon, Siberia
486 Brazil 19,813 Klein Spitzkopje, S. W. Africa
504 Unknown 512 Ural Mts., Russia
513* Elba, I ta lyd
c) Dark green beryls (emerald) (show lattice modes, water types I and II, CC+, some
show Fe3+)415 Colombia 450d Colombia
416a Colombia 450e Colombia
416b Colombia 477 Braz\l
4l6c Colombia 478a Bruzil
416d, Colombia 478b Brazil
449 Brazil 2379a Colombia
450a Colombia 2379b Colombia
450b Colombiad) Dark green beryls (chromium-free emerald) (show lattice modes, water types I and
I I ,v)M9 Salininha, Brazil450c Salininha, Brazil

i80 D. L. WOOD AND K. NASSAU
Ttrrx, |-(continueil)
459a Salininha, Brazil459b Salininha, Brazil
e) Yellow to brown beryls (heiiodor)
Fe3+, some show CO2)477+* Brazil
29,611 Perm, Russia
(show lattice modes, water types f and II, Fe2+
514a Nertschinsk,Russia514b Nertschinsk,Russia
f) Pink beryls (morganite) (show lattice modes, water types I and II, Mn)49O Bruzll491 Brazil507 Unknown515 Madagascar
452 Unknown487 Brazil488 Brazil489 Brazil
& The synthetic techniques are summarized by Flanigen et al. (1967).b Nacken used both hydrothermal (Van Praagh, 1947) and flux (Foerst, 1955) tech-
niquesl our Nacken crystals are surely flux grown.
" Linares et aJ. 1962\.d Vorobyeveite (Rosterite), containing 0 l7/e Cs,0.05/6 Na, and0.02/6Li.* COz line absent.** COz line Dresent.
octahedra in the ratio of 6:3 : 2 to give the composition BeaAlrSioOrs. Allthe silicon tetrahedra occur in rings with hexagonal symmetry stackedabove each other in a staggered arrangement producing channels enclos-ing the c-axes. This is shown in the unit cell projection of Figure 2 looking
l .G - - - - - - - - 9 . r 9 i - - - - - - - -
O oxveer.r
Q rr-uvrr.ruvO srt-rcoNO BERYLLIUM
,< c6 Axts
Frc. 2. Projection of part of the structure of beryl on a plane perpendicular to the c axis.

INFRARED SPECTROSCOPY OF BERYL
down the hexagonal c-axis. The beryllium tetrahedra and aluminum
octahedra connect the rings together. Figure 3 shows a partial projected
cross-section of the oxygen walls of one of the channels.Based on the ionic radii of Table 2, it is clear that except perhaps for
Li+, alkali ions would be expected to enter only the hexagonal channels.
This has, in fact, been demonstrated in the case of Cs+ by Evans and
Mrose (1966). The presence of channel alkali ions is made possible be-
-l ^T,T" F-
781
-t- LEVEL oF SL AToMsrN SL6OTB RINGS
level or Be eruoA! AToMS
HrO tvee t s t reC = g ' i g i
__t_ \ zO TYPE E srrE
z .e i
F'rC. 3. Partial cross-section of the channels in beryl showing two types of molecular water
sites. The crystal c axis is vertical in the diagram'
cause of missing negative charges in the lattice produced, for example,
by the substitution of Fe2+ for Al3+ or by the omission of a Be2+ ion-
SmaIIer impurity ions such as Fe3+ and Cr3+ are expected to substitute
in the AI site on the basis of ionic radius. Various substitutions' some
quite complex, have been suggested, but usually with no evidence other
than that they are consistent with overall stoichiometry (Folinsbee,
1941; Deer et aI . ,1962).There are two major types of synthetic beryls, one produced by hydro-
thermal growth and the other from the flux. The hydrothermal technique,
approximating closely the growth process occurring in nature, has been
used by Nacken (Van Praagh,1947), Wyart and Sd6vincir (1957), Van

D. L. WOOD AND I(. NASSAU
Valkenburg and Weir (1957), and by Flanigen et a l . , (1965,1967); thelast group of authors did not use any alkali in its syntheses.
Several f lux techniques have been used. Fluxes have usually been basedon molybdenum oxide (Hautefeuil le and Perry, 1888; Espig, 1960;Lefever et al.,1962, used also by Nacken (Forest, 1955)), or on vanadiumoxide (Hautefeuil le and Perry, 1888; Linares et al., 1962 Linares, 1967).
Commercially available synthetic hydrothermal emeralds include theLinde product (Flanigen et al., 1965,1967) (solid growth on a thin seed)and the Lechleitner (thin overgrowth on a faceted natural beryl stone).Flux-grown synthetic emeralds prepared by undisclosed processes in-clude the Chatham, Gilson and Zerfass products. Based on the absence of
Tl.stn 2- DrlrnnsroNs or Rnr,rvelcn ro :rur Bpnvr, Srnucrrrnp
(ionic radii in A)
Lattice ions Channel sites
Be2+A13+si4+
0 . 3 50 . 5 10.+2
Radius at silicate ring level 1.4 ARadius between rings 2 5 A
Transition ions Alkali ionsMolecules (effective
overall dimensions)
Mn'?+ 0.80Fe2+ O 74Fe3+ 0.64cc+ 0.63
HzO
COzw+v4+v3+v2+
0 5 90 . 6 3o . 7 40 . 9 5
Li+Na+K+Rb+Cs+
0 . 6 80 . 9 4I J J
1 4 81 . 6 7
2 8x3.2x3.7 L2 . 8 x 2 . 8 x 5 0 A
water (see below) and the occasional presence of l i thium and moly-bdenum, the "Chatham created" emerald appears to be grown from alithium molybdate-type flux. Synthetic products are extremely useful inspectroscopic studies since they provide reference material of known com-position and growth conditions.
Larrrcn, VrenlrroNs AND CARBoN DroxrlB
From 4.5p on into the infrared are found a series of absorptions whichare present in all beryl specimens. These are best seen in synthetic f lux-grown specimens, (Fig. 4a) which have no other absorptions in this re-gion. These absorptions arise from overtones and combinations of a num-ber of frequencies originating in the vibrations of atoms and groups ofatoms of-the beryl structure. Well-recognized fundamental vibrationsnot shown in Figure 4 include the principal SiO+ bands at 8.2p, and 10.4p

INFRARED SPECTROSCOPY OF BERYL 783
(a )
wavELENGTH (MlCmNS)
and a band at 12.5 p originating in the hexagonal silicate rings (Schaeffer
et aI.,I934;Plyusnina ottd nukii, 1958; Saksena, 196l; Plyusnina, 1963)'
The intensities of the combinations and overtones decrease with decreas-
ing wavelength and they become unimportant below about 4'5 p in thin
samples. Plyusnina (1964) has described changes in the silicate group
vibrations caused by distortions due to the presence of alkali ions.
We have observed a strongly dichroic line at 4'25 p which is present in

784 D. L. WOOD AND K. NASSAT]
within the beryl structure and cannot be merely physically trapped invoids. Both CO and COz had been reported previously when beryl washeated (Biise, 1936) but the presence in the Iattice was not established.COz has also been reported recently for the closely related mineral cor-dierite by Farrell and Newnham (1967) and a similar infrared spectrumhas been observed.
The linear COz molecule is approximately 5 A lo.tg and 2.8 A u..orr,so there is adequate room for it in the channels between the sil icate rings.Based on the dichroism, the molecule is oriented with its length perpen-dicular to the Co axis (Wood and Nasasu , 1967). Confirmation of thepresence of COz was obtained by heating two specimens showing this line,free of any occlusions visible under the micrscope, to 1300.C. Both COand COz were detected by mass-spectrometry in addition to water andhydrogen in the evolved gas. The CO and hydrogen may have been pro-duced by the reduction of COz and H2O in contact with the molybdenumcrucible used. we estimate that the amount of structural co2 present inthese channels is at least 0.1 percent by weight. In addition to the COr,CO, H2, and the H:O discussed below, other molecules reported in theliterature to be obtained by heating beryl are He, A, Nr, H2S and CHa,(Bdse, 1936; Aldritch and Nier, 1948). In the absence of clear-cut evi-dence such as dichroic absorption bands, one cannot positively Iocatesuch molecules within the structure as distinct from physical entrap-ment by inclusion in voids and cracks.
Waran Sppc:rna
The occurrence of water in beryl in the form of free molecules. hasIong been recognized. A detailed study by Wickersheim and Buchanan(1959) demonstrated that varying amounts of more than one type ofspectrum were involved. one of these spectra (crystal 13) was interpretedas possibly demonstrating OH- (Wickersheim and Buchanan, 1959;Wickersheim and Buchanan, 1965), but was subsequently recognized asnot being beryl (Wickersheim and Buchanan, 1968).
We have examined 17 synthetic and 62 naturally occurring berylcrystals summarized in Table 1 and from the spectra can comment on theoccurrence of various types of water spectra.
Water spectrum, Type 1. All the naturally occurring beryls in our col-lection gave an infrared spectrum which was termed water Type I. Theintensity of this spectrum varied from one crystal to another, but ex-tremes were rare. This spectrum is also observed in the Linde hydrother-mally grown emerald which is known to be free of alkali. We have iden-tified the 16 lines in this spectrum as belonging to water molecures

INFRARED SPECTROSCOPY OF BERYL
aligned with the molecular symmetry axis perpendicular to the hexagonalCo axis and the fl-fl direction parallel to the Co axis (Wood and Nassau'1967) as shown in Figure 3. The fundamental vibrations are the deforma-tion v2 at 1542 cm-l with perpendicular polari zation in the crystal (ordin-
ary ray), the symmetric stretching v1 at 3555 cm-l also with perpendic-
ular polarization, and the asymmetric stretching vs at 3694 cm-l withparallel polarization (extraordinary ray),
The assignments of the fundamental and the various combinationbands of Type I water are included with the spectrum in Figure 4b re-
corded from a natural beryl, ft445 from Brazil. An cr-polarized combiningfrequency (Wickersheim and Buchanan, 1965) of 170 cm-r is observedon each side of the e-polarized lines and the low frequency componentdisappears at 4.2oK (Wood and Nassau, 1967). This is interpreted as a
more or less "free" rotation or libration of the water molecules. There islittle shift in this combining frequency on lowering the temperature, sothat the suggestion that many rotational levels are involved (Boutin
et al.,1965) cannot apply. The Type I water appears to be present atIeast to some extent in all the natural beryl spectra we have seen in theIiterature.
Water spectrwm, Type 11. We have observed a second type of spectrum(Wood and Nassau, 1967) termed Water Type II, which is present inmany of the naturally occurring beryls, but in greatly varying intensity.For the lowest concentration specimen (#445) it was essentially absent,and this was also true of all the synthetic beryls tested. The strongest
Water Type II spectrum observed was in crystal ff489, the spectrum of
which is shown in Figure 4c.Alt the lines in the spectrum of Type II water can be identified as be-
Ionging to water molecules aligned with the molecular symmetry axisparallel to the hexagonal G axis as shown in Figure 3. Here the funda-mental vibrations are the deformation vz at 1628 cm-l with e-polariza-tion in the crystal, the symmetrical stretching v1, at 3592 cm-1 also with
e-polarization, and the asymmetric stretchingvt at 3655 with a polariza-
tion. The assignment of the fundamentals and the various combinationsare included in Figure 4c, where the designations for the Type I waterbands are omitted for clarity.
We have also shown (Wood and Nassau, 1967) that the intensity ofthe type II water spectrum increases as the amount of alkali present inthe beryl increases, and this has been interpreted in terms relating to theresults of Bakakin and Belov (1952) and of Feklichev (1963). The TypeII spectrum arises from water molecules which are adjacent to alkallmetal ions in the channel, and they are rotated from the perpendicular
/ 6 J

786 D. L. WOOD AND K. NASSAU
to the parallel position by the electric field of the charged alkali ion. Asexpected, the tighter binding due to the charged alkali ion produces ahigher rotational combining frequency in the Type II spectrum; thedeformation frequency z2 is also raised slightly, undoubtedly reflecting acloser approach of the water protons to the walls of the channel in thisspectrum (Wood and Nassau, 1967).
Location of the water molecules. The infrared spectrophotometric resultsare consistent with the Iocation of the water molecules in the channels andbetween the sil icate rings as Feklichev (1963) concluded. It is diff icult toaccept the proposal of Bakakin and Belov (1962) that the water moleculesare within the rings because of their size. The water molecule is irregularin shape but is not less than 2.8 A in one plane and,3.2 A to S.7 A in theothers. Since the void within the ring has a diameter of about 2.8 A, thefit would be so tight as to drastically modify the water molecular fre-quencies. Such a modification is not observed, and we believe that thewater is located between the rings. This is supported by recent X-raystudies bv Gibbs (unpublished results) and by Vorma et al., (1965).
The Type II spectrum then arises from water molecules between therings but with an alkali ion nearby to rotate the molecular dipole andproduce dichroism opposite to that of the Type I spectrum.
Vorma et al., (1955) and Evans and Mrose (1966) have suggested thatthe alkali ions are also located between the rings in the same position asthe water molecules and at the level of Be and Al ions. This would requirethat the orienting effect of the alkali ion on Type II water moleculesshould extend over 4.6 A, and, if an alkali ion occurred with an HzOmolecule on each side, both would give the Type II spectrum. The in-tensity ratio of Type I and Type II HrO absorption bands would thendepend on the statistical distribution of alkali ions and water moleculesin the channels. We have not attempted to evaluate the alkali positionor distribution on the basis of the spectra since we feel that neither theanalyses nor the assumptions about the alkali distribution are sufficientlyreliable to make a quantitative interpretation meaningful. Our qualita-tive results do not conflict with those cited above, and we tentativelyaccept the conclusion that the alkali and the water are both in the posi-tions between the rings. As Evans and Mrose (1966) have shown, Cs+ions fit closely in the voids; one would expect Li+ ions to take uncenteredpositions along the walls of the void because of their small size. An un-centered alkali ion would be expected to give a slightly different Type IIH2O spectrum than a centered one but no evidence for this has beenfound.

INFRARED SPECTROSCOPY OF BDRYL
Bind.ing of the water molecules. It would be natural to speculate that,
since the Type I water is bound in the voids between the rings with the
H-H line parallel to the channel axis, the binding force must be due to
hydrogen bonding with the oxygen ions of the silicate rings. This is in-
consistent, however, with the infrared spectrum since hydrogen bonding
is known to drastically shift the oH stretching frequencies (Rundle and
parasol, 1952;Lord and. Merrif ield, 1953) and no such shift is observed.
It must be concluded that the silicate oxygen atoms are mostly covalently
bonded, and that the orienting forces on the Type I molecule are due to
more remote electrostatic charge distributions.
Another factor favoring unbonded water molecules in the Type I site
is the following. If the structure of the channel is examined closely, one
finds that a water molecule just f its with one H-atom next to the oxygen
of one silicate ion in the ring above, and the other H-atom next to the
oxygen of a silicate ion in the ring below the water molecule' These
oxygen ions are rotated slightly with respect to each other, with a line
thiough their centers making an angle of approximately 18o with the Ce
axis. If the water molecule were hydrogen bonded to these likely looking
sites, it then would have its H-H axis inclined to the crystal C6 axis by
the same 180. The dichroic ratio of more than 25 to I observed in the
absorption lines of the Type I site, however, requires that the H-H line
be at an angle smaller than 4" to the Co axis of the crystal, so that this
model of the water site involving hydrogen bonding cannot be correct.
A number of attempts were made to modify the beryl infrared spectra
by various treatments. Heating of crystal 1446 produced a weight loss of
1.6 percent near 900oC, bfiff443 did not give off gases even at 1200oC
andlt still retained the water infrared bands af ter this treatment. A tem-
perature of 1350oC was necessary to release water and coz from the
latter crystal and left a residue which no longer showed any water spec-
tra. This high temperature stability appears to originate from a blocking
of the channel by the alkali ions. These ions are presumably quite tightly
bound. in the immediate neighborhood of the lattice ions for which they
provide charge comPensation.The water is liberated gradually during heating, and differential ther-
mal analysis on sample #446 did not show any discontinuities between
room temperature and 1000oC. Heating crystal fr443 to 1000'C in air, or
to 1200oC in vacuum, produced no appreciable changes in the water and
CO2 spectra. The presence of an electric field parallel to the C axis during
heating did not reiult in appreciable current flow as it does in the case of
quartz (Wenden, 1967; Wood, 1960) nor did it produce any changes in
the spectrum. we were unable to introduce water into flux-grown emer-

788 D. L. WOOD AND K. NASSAU
ald even after 5 days under hydrothermal conditions at 35g'c and g,000psi since neither the weight nor the spectrum was changed by this treat-ment' The high stability of beryl with respect to these treatments indi-cates that the spectra described here can be used with some assurance toevaluate the conditions prevalent during the genesis of crystalline beryl.
TUB Cnnouruu Spncrnulr
The chromium ions replace the octahedrally coordinated aluminumions, and this substitution occurs with no charge d.iscrepancy and verylittle size misfit. According to the structure refinement of Belov andMatveeva (1950), the octahedron is only slightly distorted, and it wasnecessary in an earlier report (wood, 1960) to invoke the influence ofnext nearest neighbors in order to explain the large ground state splittingof the cr3+ ion. rt has been found more recently by Gibbs (unpublishedresults) however, that the octahedron is actually appreciably distorted,and the ground state splitting is probably due entirely to this distortion.The full details of the interpretation of the porarized absorption spectraand their variation with temperature and magnetic field have been re-ported by one of us (Wood, 1965), where references to earlier work mayalso be found.
The polarization of the absorption spectrum is the cause of the colorchange of emerald in polarized light (pleochroism) from yellowish-greenfor the ordinary ray to bluish-green for the extraordinary ray. The ab_sorption coefficients for crystals of known chromium content have beenmeasured, and it is therefore possible to estimate the concentration in anunknown sample by the nondestructive absorption measurement whichhas been described in detail for ruby even for unoriented samples (Doddet al., 1964). rf ,4 is the absorbance defined by A:logrolsf I for a givenpolarization of incident light of intensity rs and transmitted intensity ,I,and I the thickness of the sample in cm., then a:A/t is related to theconcentration c in weight percent chromium by a:0.434 prc. The ab-sorption coeffi.cients p are given for the ordinary ray and extraordinaryray for emerald in Table 3.

(a) eenvl No,+rob (cr^3+)
(b)eenvL No.+sea (v3+)
INFRARED SPECTROSCOPY OF BERYL 789
o.3 0.4 0.5 0.6 0.7 0.8
wAVELENGTH (urcnoNs)
Frc. 5. Spectra of two dark green beryI crystals in the visible region of the spectrum:
(a) emerald 1416b color due to cr3+ in the Al3+ site; (b) chrome-free emerald 1459a colored
nearly the same but with V3+ in the AI3+ site. Dashed lines, extraordinary ray; full lines,
ordinary ray.
CnnouB-FnEE EMERALDS
Recently a source of emeralds has been discovered (Selig, 1965) in the
state of Bahia in Brazil where beryl of green color very similar to that of
"true" emerald is found, but these crystals do not contain sufficient
chromium to account for the color (Leiper, 1965; Pough, 1967). From the
Tesr-B 3. ArsonpttoN CorllrcrrNts or Elmner,o
Irom | /t logo I o/ I :O.434 pc with I in cm and c in weight percent chromium
p , A Polarization
tzoItoodl
4160435059706300
C
@
@
e
31345 l
40

790 D. L. WOOD AND K. NASSAIJ
absorption coefficients just discussed for chromium in beryl the minimumdetectable amount by optical absorption (logtolo/ I:0.05) or by visualobservation of the color in a 2-cm thick piece of material would be 0.0012percent or 12 ppm. Of course, the minimum concentration to visiblycolor a crystal less than 2 cm thick would be correspondingly greaterthan 12 ppm. The analysis reported for the material from Salininha,Bahia, shows one quarter of this amount or 3 ppm (Leiper, 1965). Ouranalyses for "chrome-free emeralds" also show that the Cr content is lessthan this minimum detectable amount, and the crystals would be color-Iess if some other chromophore was not present.
The spectrum of the chrome-free emeralds in the visible region is alsodifferent from that for ordinary emeralds as a comparison of Figure 5bwith Figure 5a shows. There are two broad bands, one in the red and onein the violet in both spectra, but the frequencies and relative intensitiesare quite different for the two kinds of crystal. Probably the most im-portant difference is the absence of the sharp R lines of chromium whichare prominent in the spectrum of ordinary emerald. In a material whosecoloration involved both chromium and another chromophore, the pres-ence of these sharp lines would characterize the chromium, while therelative intensities of the broad bands would be different from that ofordinary emerald.
The analyses given in Table 4 show that one element common to allthe chrome-free emerald samples is vanadium, and we believe that it ispossible to account for the green color on the basis of trivalent vanadiumsubstituted in the Al3+ octahedral sites. The crystal f ield energy levelsfor this ion are known for AIzOa (McCIure, 1962) and for glasses (Kaka-badse and Vassil iou, 1965) as well as for solutions (Orgel, 1955) andtransitions 3T1(3F)-+3T2(3F) and 3T1(3F)---+3A2(3F) occur in the visibleregion. In the case of ALOa it is known that the crystal field is higher forthe Cr3+ ion than for the same ion in the octahedral site in beryl (Wood,1965), and it is safe to assume that the same will be the case for the V3+ion. Thus on this basis one would expect that the crystal f ield parameterDq would be about 1650 cm-1 in beryl, and this would predict from theory(Liehr and Ballhausen, 1959) that the V3+ bands would lie at 16,500 cm-land 24,000 cm-l, which compares favorably with the observed values of15,300 cm+l and 25,000 cm-l.
The fine structure present in the higher frequency band may be due tothe presence of several singlet levels which may mix through spin-orbitcoupling with the triplet giving composite levels to which transitions ofconsiderable intensity may take place (Liehr and Ballhausen, 1959). Theenergy levels of V2+, V4+ and V5+ are also known for octahedral coordina-tion, and their spectra do not resemble those of Figure 5b.

79r
oF
O Rt s : iO v
INFRARED SPECTROSCOPY OF BERYL
ad <
u > -c t <
a -q i <
gE rb '+ 3ao
O
O
Q
- . ' S o c i, 1 t r 4 ( ) . q t
. ^z * :@- bA '^.F. cs O. 9 = , 9 > Q - f F* : u
. 9 ca - > c . :o J lF q < . a n
,t E ,9 4..s ?" i -9" -
bA
s4 , 9 i A i5
- E " c ' r
;5
' , a - - o t > , 1i 1 = g t r r b i - "d - ^52 g
N - Aa - d ( J b b
*< z^ .eo v j
(,
= r n dJ i r J ' ' i< r / i . =+ ' E
a
d
x G l Ci 6 r ! ' i< ' i i . =+ - E
a
x r i d6 i . ' 7+ - ?
a
d i F i t r- d
a
, - r .=
F i d
F . P- ,=o
\o qd 0?
J o q+ F d
6 Z
r i i
Fl L)
-o
J O H
+ = t s t q
. H E KH A 5
sEs,+ : i - d
a
rl
zrlti&
z
r.l
E
F

792 D. L, WOOD AND K. NASSAU
The fact that vanadium may color beryl green may seem inconsistentwith the fact that synthetic beryl grown from a lithium vanadate orVzOs, flux is colorless (Linares et al., 1962) but we believe that this is amatter of the valence of the vanadium available to the growing crystal inthe flux. If only the colorless pentavalent ion is present in the flux, then itmay be accepted into the trivalent sites available only with difficulty. Itmust require, then, special conditions for the formation of the trivalentvanadium in the flux growth of chrome-free emerald. The fact that allchrome-free emeralds so far examined are very high in alkali and mag-nesium (Table 4) is not required for the explanation of the color, but itmay have importance in the growth conditions establishing the trivalentvanadium ion during the genesis of the crystal. Many chromium con-taining emeralds show suficient vanadium content that the origin of theircolors should be attributed to both chromium and. vanadium.
InoN SpBcrna
Many beryl crystals contain appreciable iron concentrations, and thiscan impart a blue, green, or yellow color as in aquamarine or heliodor. Itmay also leave the crystal colorless as in some goshenites, or it may modifythe color due to other chromophores. Any variety of beryl, includingvorobyeveite chara.cterized by a high Cs content, may exhibit iron colorsin addition to their other properties. We have characterized fi.ve differentspectral features attributable to iron ions, and these can be shown to beindepe_ndent of each other. The five features are: (1) a strong band at8100 A for the ordinary ray, (2) an €-component at the same wave-Iength_, (3) an e-component at 6200 A, 1+; u broad edge absorption near4000 A, and (5) l ine absorptions at 3740 A and 4650 A.
6,000 to 8,000 A region. Most crystals whatever their color have a strongabsorption near 8100 A in the ordinary ray as shown in Figure 6 and thisfeature has been studied by Grum-Grzhimailo et at. (1956, 1962). Theseworkers have attributed the band to the Fe2+ ion, and in octahedralcoordination this transition would correspond to 5T2(5D)->uE(uD) in thelow spin configuration (Tanabe and Sugano, 1954). This would be theonly spin-allowed transition expected in the spectral region covered, andthe energy separation involved implies a crystal field parameter value ofDq:tZlS cm-1 (Liehr, unpublished results). This is a reasonable valuefor a divalent 3d transition metal ion with octahedral oxygen coordina-tion (Jlrgensen, 1962). It is very unlikely that the transition could arisefrom tetrahedral Fe2+ replacing Be2+ or Sia+ from the point of view of boththe magnitude oI Dq and the ionic radius. Tetrahedral Fe2+ would be ex-pected to have the transition 5T2->58 near 6000 cm-r instead of 12.350

INFRARED SPECTROSCOPY OF BERYL 793
cm-l (Tanabe and Sugano, 1954) and Fe2+ has an ionic radius of 0'74 A
compared with 0.35 for Be2+ and.O.42 A for Sia+. Thus the nearly octahed-
ral site of Al3+ with ionic rad.ius 0.51 A is the most tikely substitutional
site for Fe2+. It therefore seems reasonable to attribute this band to 5Tz
--+5E of octahedral Fe2+ substituted for Al3+ in the structure.
In some crystals there is also a component of absorption in the extra-
ordinary ray in the same wavelength range, but the ratio of intensity of
absorption for e and cu polarizations varies from one crystal to another.
Comparison of Figures 6 and 7 shows this to be the case (and Figs. 1 and
2 of Grum-Grzhimailo et aI., (1956) confirm it). The e-polarized absorp-
WAVELENGTH (MICRONS)
Fro. 6. Absorption spectrum of golden beryl {448 Dashed curve, extraordinary ray; fullcurve, ordinary ray.
tion therefore arises from a different center than that of the o-spectrum.
The frequency is appropriate to the 5Tz--+5E of an Fe2+ ion, and because
the line is so broad we suggest that the ion responsible is located in the
axial channel ways, probably at the level of the rings (Fig. 3) where the
ionic distances would be smallest. This would lead to changes in the
spectrum if water molecules or alkali ions were nearby, but we have found
no definite evidence of such an effect.The third feature of the iron absorption is the broad band near 6200 A
which is found as a shoulder in the e-spectrum in blue beryls. Such beryls
look blue for the extraordinary ray, but yellow or colorless in the ordi-
nary ray because the 6200 A band removes the red transmitted light.
Figure 7 shows how this comes about, and comparison with Figure 8

794 D, L. WOOD AND K. NASSAU
where the band is absent shows that it is an independent feature. Againbecause the band is so broad we suggest that it arises from Fe2+ in theaxial channels, but difierent from the preceding type, perhaps in a hy-drated form. rt is certainly not Fe3+ or Fez+ in octahedral or tetrahedralsites.
3,000 to 5,000 h region. One of the short wavelength features of thespectra of iron containing beryls is the broad absorption edge from 3200A to +SOO A i.r Figu.e 6 which is missing from Figure 8, and, *hi.h .urrr.,
WAVELENGTH (MrcRoNs) 1 l 13
Frc. 7. Absorption spectrum of blue beryl 1506. Dashed curve, extraordinary ray; fulrcurve, ordinary ray.
a yellow color when it alone is present. When both the 6200 A band ofblue beryls and the short wavelength absorption edge of yelow berylsare present, the crystal has a greenish color, and all shades between blueand yellow are possible. When both features are absent as in the spec-trum of Figure 8, the crystal appears colorless even though the 8100 Aband is very strong. This is because there is essentially no absorption inthe region to which the eye is sensitive (-4200 A to -6800 A). The shortwavelength edge of Figure 6 can be assigned to Fe s+, not only becauseferric salts are usually yellow or brown, but also because of heat treat-ment experiments whose results are shown in Figure 9. Here a yellowberyl fr447 was heated for 16 hours at 520oC in an atmosphere of flowinghydrogen gas. Before this strongly reducing treatment the short wave-
-"1*I(,
- l r r
tld
t, (= 2 5 Cm-r

INFR-ARED SPECTROSCOPY OF BERYL 795
length cut-off was above 4000 A, and the 3100 A peaks due to Fe2+ were
rather weak. After the treatment the short wavelength edge was shifted
by a very considerable amount to 3500 A or below, while the Fe2+ ab-
sorptions at 8100 A beca-e more intense in both the e and (, spectra'
Heat treatment in air at the same temperature does not change the edge.
Thus both the Fe3+ short wavelength edge and the 8100 A Fe2+ assign-
ments were confirmed by the decrease of the Fe3+ absorption and the in-
crease in Fe2+ absorption in the reduced crystal.
The nature of the short wavelength absorption edge of Fe3+ in an
octahedral site in oxide crystals has been d.iscussed by clogston (1960),
wickersheim and Lefever (1962), and by wood and Remeika (1967),
and it is generally understocd to arise from an allowed charge transfer
transition involving the motion of an electron from the 02- ligands to the
central metal ion. Because it is a very strong absorption, its presence
may be characteristic of only a small fraction of the ferric iron present.
On the basis of charge and ionic radius the most likely site is that of the
octahedral Al3+, but this evidence is not conclusive.
The last feature of the iron absorption spectrum consists of two lines
at3740 A and 4650 A in the ultraviolet and violet regions. These lines
presumably arise from crystal field 3d-3d transitions in the ferric ion.
wAVELENGTH (vtcnous)
Frc. 8. Absorption spectrum of colorless beryl 1503. Dashed curve, extraordinary ray; full
curve, oronary ray.
'91*9o
-l-l l6

796 D. L. WOOD AND K. NASSAA
BERYL NO 447
- UNTREATED
-HEAT TREATED
\.-- ur'rrneare o
i- ti HEAr TREATED
i \ /)-- _'0 3 0 5 o . 7 o . 9 r r
W A V E L E N G T H ( M I C R O N S )
Frc. 9. Changes in the absorption spectrum due to heating golden beryl ffM7 at S20oCin 1 atmosphere of pure H:. Dashed curves, extraordinary ray; full curves, ordinary ray.
Because of their high frequency it is likely that they are characteristic oftetrahedrally coordinated Fe3+ and correspond to the 6,4.2--+4T1 (4650 A)and 6Az--+aT, (3740 A) transitions of the 3d5 configuration (Liehr andBallahusen, 1959). on the basis of size alone the Sia+ site is more likely,but no conclusive evidence against the Be2+ site exists. These Fea+ linesdo not contribute color to the crystal; they can be seen in the c,r and espectra of Figure 7.
Because the characteristic absorption coefficients for the various kindsof iron are not known individually, we have not been able to correlatethe iron concentration determined by direct analysis with the five spec-tral features just discussed. Every natural crystal has very likely some ofeach type of center and probably there is a great disparity of the absorp-tion per ion making the correlation diffi.cult. The five types of iron aresummarized in Table 5.
PrNr Bpnyrs
Finally, we would l ike to add a few comments about pink beryl (Mor-ganite). Analysis shows that all pink crystals in our collection (Table r)
tIzorLtoqco

INFRARED SPECTROSCOPV OF BERVL
Taslr 5. Frve Tvpns ol IRoN rN Brnvr
797
Optical characteristicObserved
Possible assignment coloration
8100 A o broad band, single component
8100 A e broad band, more than one component
6200 A e broad band, single component
4000 A o and e edge absorption
3740 ir o,4650 A , and €, narrow bands
Fd+ in oct. AI site none
Fe2+ in channel site A none
Fe2+ in channel site B Blue
FeB+ in oct. Al site Yellow
Fe3+ in tet. Si site none
have one foreign element in common, namely manganese' The possi-
bility thereiore exists that manganese may be the chromophoric ion'
There are at least two Iikely valence states, Mn2+ and 1y[1a+, and two
types of coordination: octahedral when substituted for Al3+, and tetra-
hedral when substituted for Be2+ or Sia+. The observed spectrum with
for tetrahed,ral coordination (5Tr---+rE), and a single broad band near
wavELENGTH (MTCRONS)
Frc. 10. Absorption spectrum of pink beryI 1487. Dashed curve,curve, ordrnary ray.
t29FqEoo@
extraordinary ray; full

798 D, L. WOOD AND K. NASSAU
7000 A for octahedral coordination (sE--+sfz). Neither of these fits theobservations so that Mn3+ can be eliminated.
For Mn2+, on the other hand, one expects three bands near the ob-served positions for the octahedrally coordinated ion, and a similar setfor the tetrahedral ion but at somewhat higher frequency (uArrnTr,6Ar--+aTz, 6Ar-+aAr, aE). The difficulty with four observed components isremoved if the reduced symmetry of the site is considered, but the rel-ative positions of the bands do not agree well with the predictions ofcrystal f ield theory. The spacing from the 3550 A component to the otherthree is too large for the separation between the 4950 A and 5550 A co--ponents. It is possible that there is a superposition of more than one typeof spectrum in our crystals, including the possibil i ty of ions in the axialvoids, and we do not feel confident that a reliable crystal field analysiscan be made at this time. we do feel confident, however. that the color iscaused by the manganese ion.
AcrNowtnncurNr
rt is a pleasure to acknowledge the help of the following in obtaining crystals: L G.van vitert, Bell Technical Lahoratoriesl F. H. pough, v. Manson, of the New york Mu-seum of Natural History;L. Movd of the National Museum of canada, ottawa; J. s. whiteof the smithsonian Institution, washington, D. c., G R. crowningshierd, R. T. Liddicoat,Jr., and B' Krashes of the Gemolo3ical Institute of Amerr'ca; Linde company, Division ofunion carbjde; created Gemstones, Incorporated; ancl M R. Benedict company. valu-able technical assistance was provided by Miss D. M. Dodd, Miss B. E. prescott, w. E.Burke, D. L. Nash, E. M. Kelly, and A. J. Caporaso
Rrlrnrncrs
Amnrrcu, L. T aNo A. o. Nrnn (1948) The occurrence of He3 in natural sources of helium.Phys. Rea ,74, 1590 1594.
Bex,trrN, v. v. eno N. V. Brr.ov (1962) crystal chemistry of beryr.Geokhimi.ya,420 433.Brr.ov, N. V eNo R. G. Merv'rva (1950) Determination of the parameters of beryl by the
method of partial projection Doht. Ahod..Ifaafr. SS.IR, 7J,2gg-3\2.Bcisn, R. (1963) optische und spektrographische untersuchugen an Beryllen, insbesondere
bei hdheren Temperaturen. N eues J ahrb. M,ineral, Abt A, B eilage. 20, 467 -57 0.BourtN, H., G. J. Semono aNo H. R. DauNon (1965) Low frequency motions of H:O
molecules in crystals. f . Chem. phys.,42, 1469 1470.Bnecc, W. L. aNo J. Wrsr (1926) The structure of beryl, BeaAhSioOri. proe. Roy. Soc.
(London), Al l l , 691-714cr,ocsroN, A M (1960) rnteraction of magnetic crystals with radiation in the range 10a
105 cm-t . J Appl . Phys. ,3t ,198S-20SS.Drrn, W. A., R. A Howrr ,lNo J Zussuan (1962), Rock-Jorming M.ineroLs, Vol. 1, John
Wiley & Sons, New York, 256.Doon, D' M., D. L. woon, aNo R. L. BanNs (1964) spectrophotometric determination of
chromium concentration in ruby. J . A p pl. p hy s. 35, 1 183-1 186.Esrrc, H. (1960) The synthesis of emeralds Chem. Technih,12,327-331.Evems, H. T' Jn. .LNl M. E. Mnosn (1966) crystal chemical studies of cesium bervr
(abstt.) Geol,. Soc. Amer. Meet., p.63.
INFRARED SPECTROSCOPY OF BERYL
I.annrll, E. F. ern R. E. Nnwrw.tu (1967) Electronic and vibrational absorption spectra
in cordierite. Amer. Mineral. 52' 380-388.
Fnrrrcurv, V. G. (1963) Chemical composition of minerals of the beryl group. Geokhimi'a
1963,391-401.Fr.enrcett, E. M., D. W Bnrcr, N R. Munn,lcn nNl A. M. Tevr-on (1965) New hydro-
thermal emerald. Gems Getnology, 11,259-264.
D. W. Brucx, N. R. MuMsacn eno A. M. T,lvr'on (1967) Characteristics of syn-
thetic emeralds . Amer. M ineral., 52, 7 M-7 72.
Fonnsr, W. (1955) Smaragd-Synth ese. (Jllmans Eneyclopiidie d.er technischen Chemi'eYol' 6,
Urban and Schwarzenberg, Munich-Berlin, p' 246.
Folrrsnrn, R. E. (1954) Optic properties of cordierite in relation to alkalies in the cor-
dierite-beryl structure. Amer. MineraI. 26' 485-500'
Gnuu-Gtznrulrr.o, S. V., N. A. Bnrr,rr,lxrov, R' K. Svrtroove, O. N' Sukhanova and
M. M. Kapitonova (1962) Absorption spectra of iron-colored beryls at temperatures
from 290 to 1 7oK. Optics Spectr., 13' 133-134.--- AND L. A. Pevxnvl (1956) Absorption spectra of colored beryls and topazes'
Trudy In:t. Kristallogr. Akad. Nauh..S,SSR, 12, 85-192.
Hlurnnnurlr-u, P. .lxo A. Prnnnv (1888) Sur la reproduction de Ia phenacite et de
I'Emeraude. C. R. Acad.. Sci. Paris.lC6' 18fi)-1802.
JoncrNsax, C. K. (1962) Absorption spectra ond chemical bonding in eomplexes Addison-
Wesley, Reading, Mass., p. 285.
Kexnsensr, G. J. aNo E. Vassrr,tou (1965) The isolation of vanadium oxides in glasses
P hys. Ckem. Glasses, 6, 33-37.
LEIE\.ER, R. A., A. B. Cnasn ann L E. SoloN (1962) Synthetic emerald' Amer' Mineral"
41,1450 1453
LrEpER, H. N. (1965) Salininha emeralds are definitely shown to have chromium content'
Laliilary J, 19, 990-991.
Lrmn, A. D. axo C J. Bar.r.arrusrx (1959) Complete theorv of Ni (II) and V(III) in cubic
crystalline fields. Anq. P hys. 6, 134-155.
LrNanes, R. C. (1967) Growth of beryl from molten salt solutions, Amer' Minerol' 52'
1554 1559.--, A. A. Bar-r,ueN eNn L. G Ve.N UmBnr (1962) Growth of beryl single crystals for
microwave applications. I. A p pl. P hys., 33, 3209-3210.
Lono, R. C. eNn R. E. Mrnnrnrnr-o (1953) Strong hydrogen bonds in crystals J Chem'
Phys ,21, 166-t67.
McCr-unr, D. S. (1962) Optical spectra of transition-metal ions in corundum' I' Chem'
Phys. ,36,2757 2779.
oncnr, L. E. (1955) Spectra of transition-metal complexes. Electronic structures of
transition-metal compiexes. Band widths in the spectra of manganous and other transi-
ti on-metal compl exes. J . C h em. P hy s., lOO4-14 ; l8l9-23 ; 1824-29.
Pr.r-usNrNa, I i. (1963) Infrared absorption spectra of beryllium minerals Geokhimia, 13,
158-163.--- (1964) Infrared absorption spectra of beryls' Geokhimia, 14,31-41.
eNn G. B. Barn (1958) The infrared reflection spectra of the cyclosilicates in the
wavelength interval from 7 -15 p Sott. P hys. Crystall,ogr , 3, 7 6l-7 64.
Poucn, F. H. (1967) Proceeclings of the 11th international Gemmological Conference in
Barcelona. Lapidory J .,20, 1268-1277 .
R.uxnrr, R. E. eNn M. Penesor- (1952) OH stretching frequencies in very short and pos-
sibly symmetrical hydrogen bonds. -I. Chem. Phys.,2A, 1487.
799

800 D. L. WOOD AND K. NASSAU
SrrsrNa, B' D. (1961) Infrared absorption studies of some silicate structures. Trans. Fara-doy Soc.,57,242-258.
Srr,rc, B L. (1965) Caraniba emerald mine. Gems Mineral,s, 22_24.Scnallrrn, c., F. Marossr .q.xo wrnrz (1934) Das ultrarote Reflexionsspeletrum von
Silikaten, Z. Phys., 89, 210-233.TrNeer, Y. eNo S. Sucaxo (1954) On the absorption spectra of complexions. f. phys. Soc.
Japan., 9, 7 66-779.VeN Pnucn, G. (1947) Synthetic quartz crystals GeoI. Mag.,g4,gg_gg.ver't ver,rcNsuno, A. aNo c. E. wnrn (1957) Beryl studies 3Beo.Alzos.6Sioz. (abstr.).
Bull. Geol. S oc. A mer, 68, 1808.vonu,l, A., T. G. sarreul eNn r. Hnerare (1965) Alkali position in the beryl structure.
C. R. Soc. Geol. Fin.37,719-124.wnNnnN, H. E. (1957) ronic diffusion and the properties of qtattz in the direct current
resistivity. Amer. Mineral, 42, 859-888.Wrcrrnsuoru, K. A. ann R. A. BucneNeN (1959) The near infrared spectrum of beryl.
Amer. Mineral,. M, MO-444.-- AND -- (1965) Some remarks concerning the spectra of water and hydroxyl
groups in beryl .r. Chern. P hys ., 42, 1468-1469.--- AND -- (1968) The near infrared spectrum of beryl, a correctj.on. Amer.
Mineral.53.347.Woon, D. L. (1960) Infrared absorption of defects in quartz. J. phys.
326-336.--- (1965) Absorption fluorescence andZeeman effect in emerald. -I.
3404-3410.--- rNo K. Nrssau (1967) rnfrared spectra of foreign molecules in b eryl. J. chem. phys.,
47,2220-2228.--- AND J P. Rno-rxa (1967) Etrect of impurities on the optical properties of yttrium
iron garnet. -I. I ppl. Phys.,38,1038-1045.wvanr, J. eNo S. Scivnrcxn (1957) Synthese hydrothermale du beryl. BuJl.. soc. Franc.
M iner al. Cristalo gr., 80, 395.
Manuscri'pt recei'oeal, seprenber 11, 1967 ; accepreit for publicotion, December 15, 1962.
Chem. Solid.s, 13,
Chem. Phys. ,42,