The Changing Face of Farming
17
The Changing Face of Farming Presented by: George Collier ICL Limited, Chartered Accountants www.iclca.co.nz
description
The Changing Face of Farming . Presented by: George Collier ICL Limited, Chartered Accountants www.iclca.co.nz. What Business Are Farmers In?. ROA & Increase In Land Value . 2014 Estimate. Assets, Equity & Debt 2001-2014 Central Otago Farming Business Balance Sheet . - PowerPoint PPT Presentation
Transcript of The Changing Face of Farming
The Changing Face of Farming
Presented by:
George CollierICL Limited, Chartered Accountants
www.iclca.co.nz

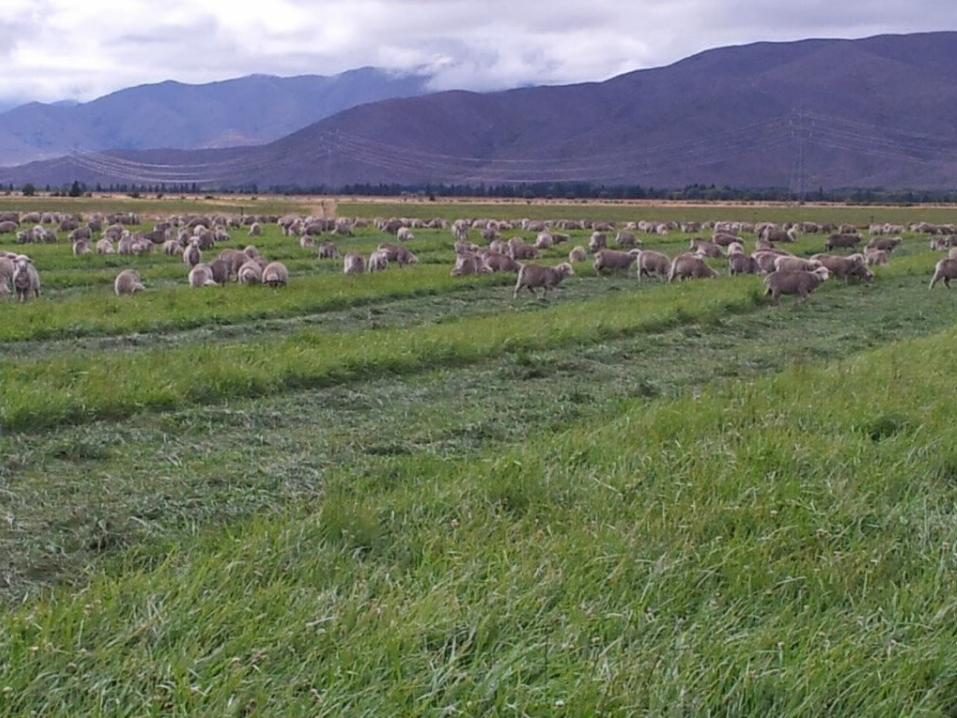
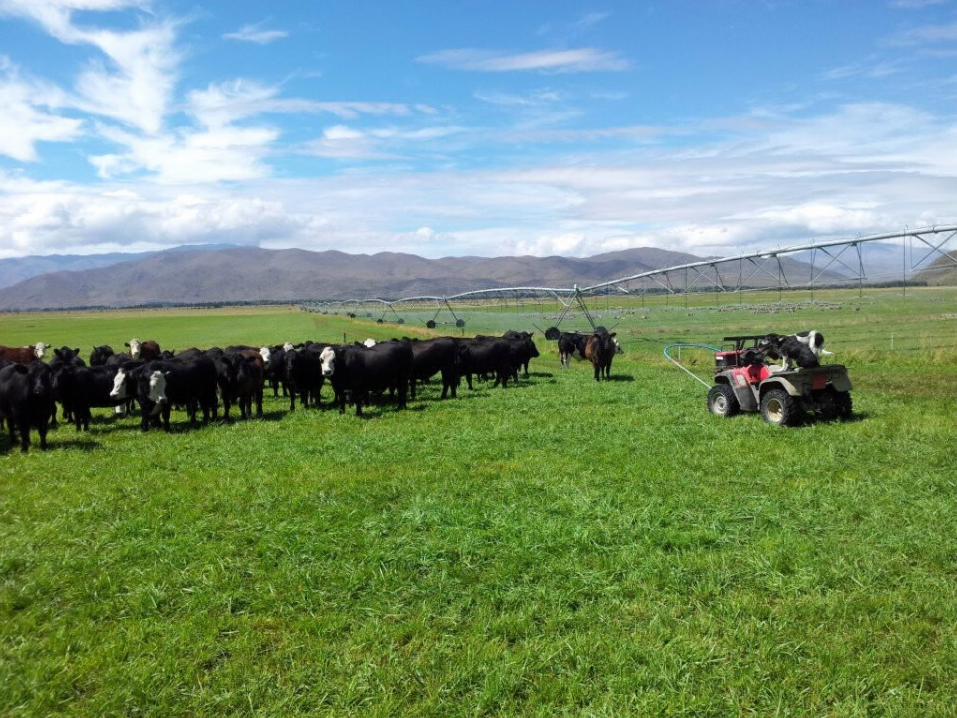
What Business Are Farmers In?
Operating Business Grass Growing & Grass Harvesting Business Land Ownership Business
Provides Choices Over Time
Capital Growth
Profitability
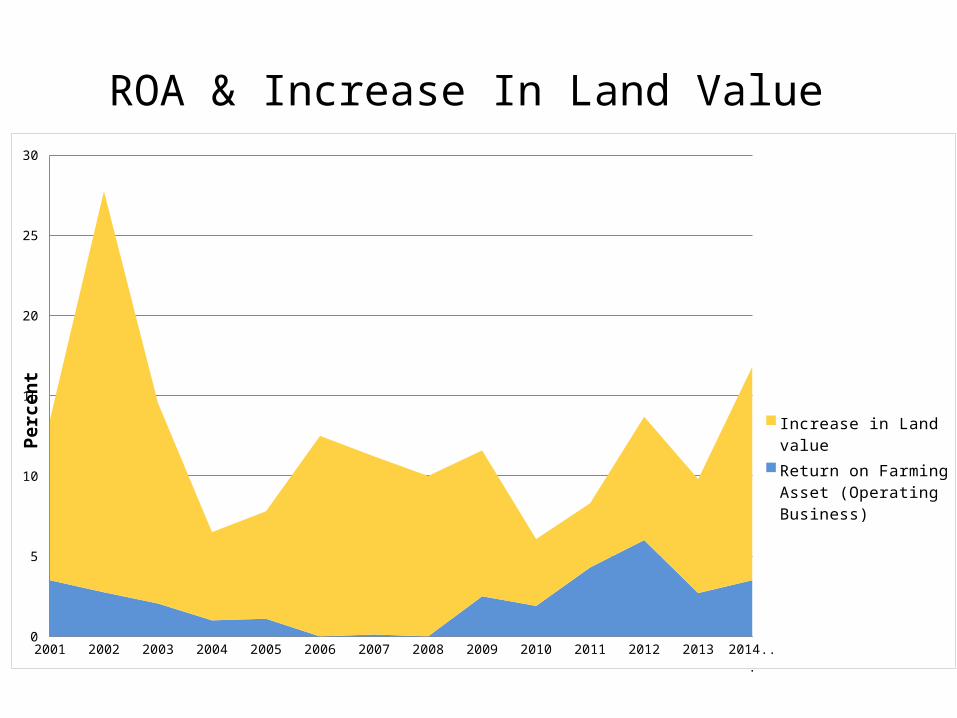
ROA & Increase In Land Value
2014Estimate
2001 2002 2003 2004 2005 2006 2007 2008 2009 2010 2011 2012 2013 2014 Estimate
0
5
10
15
20
25
30
Increase in Land value
Return on Farming Asset (Operating Business)
Perc
ent
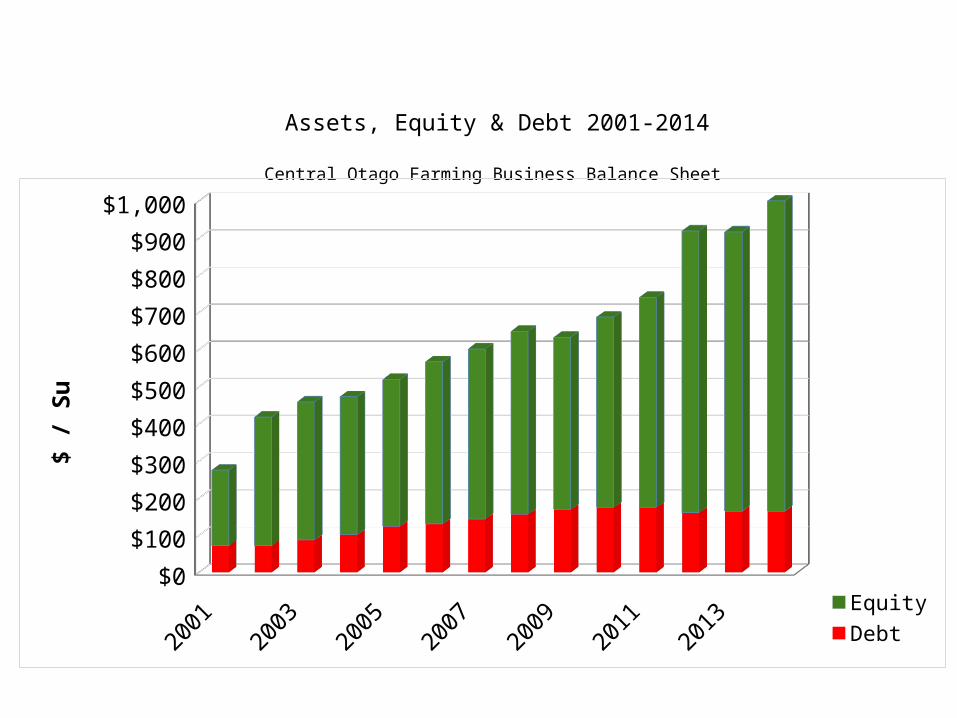
Assets, Equity & Debt 2001-2014
Central Otago Farming Business Balance Sheet
2001 2002
2003 2004
2005 2006
2007 2008
2009 2010
2011 2012
2013
2014 Estimate
$0$100$200$300$400$500$600$700$800$900
$1,000
EquityDebt
$ / S
u
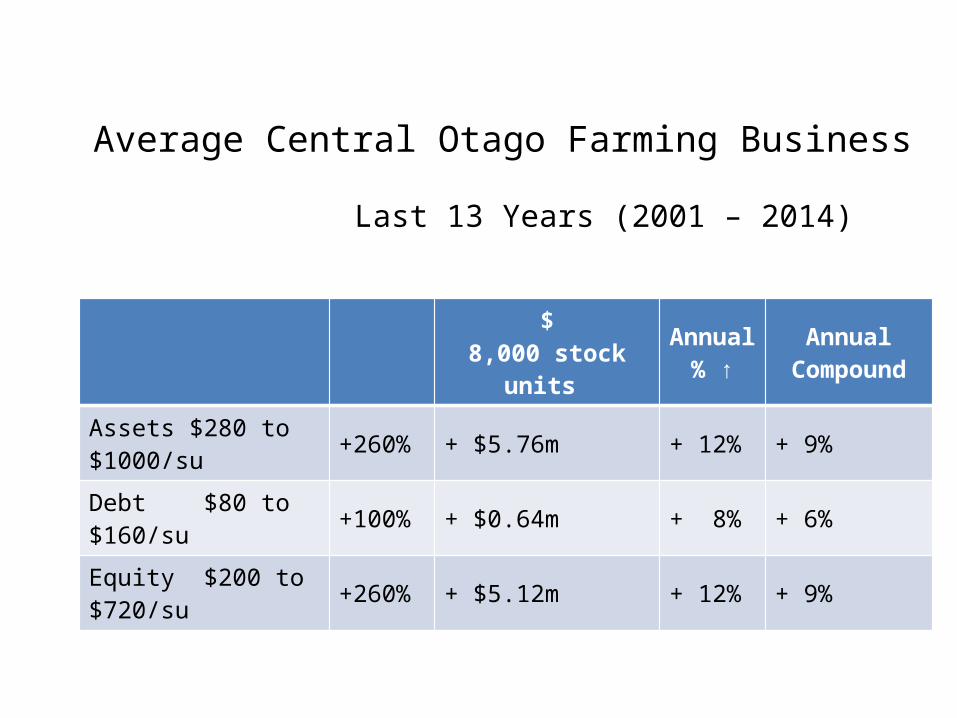
Average Central Otago Farming Business
Last 13 Years (2001 – 2014)
$8,000 stock units
Annual % ↑
Annual Compound
Assets $280 to $1000/su +260% + $5.76m + 12% + 9%
Debt $80 to $160/su +100% + $0.64m + 8% + 6%
Equity $200 to $720/su +260% + $5.12m + 12% + 9%

Land Values → Providing 85% of Increase in Wealth Over Time
• Land Value Driver – Shift from land reliable water nutrient caps.
• Access to reliable water is now driving land value.
• Nutrient Caps will limit land value in future.
Land Value Drivers Old NewReturns Access to Debt/Capital Cost of Debt/Capital Access to Water Access to Reliable Water Ability for Land Use Charge Nutrient Limits

Value of Water & Its Impact On Land Price
2011 2012 2013 2014 2015
Dryland Irrigable Dryland Irrigated Unreliable Irrigated Nutrient Cap
Irrigation Equity Potential
Dryland Equity Potential(Access to Water)
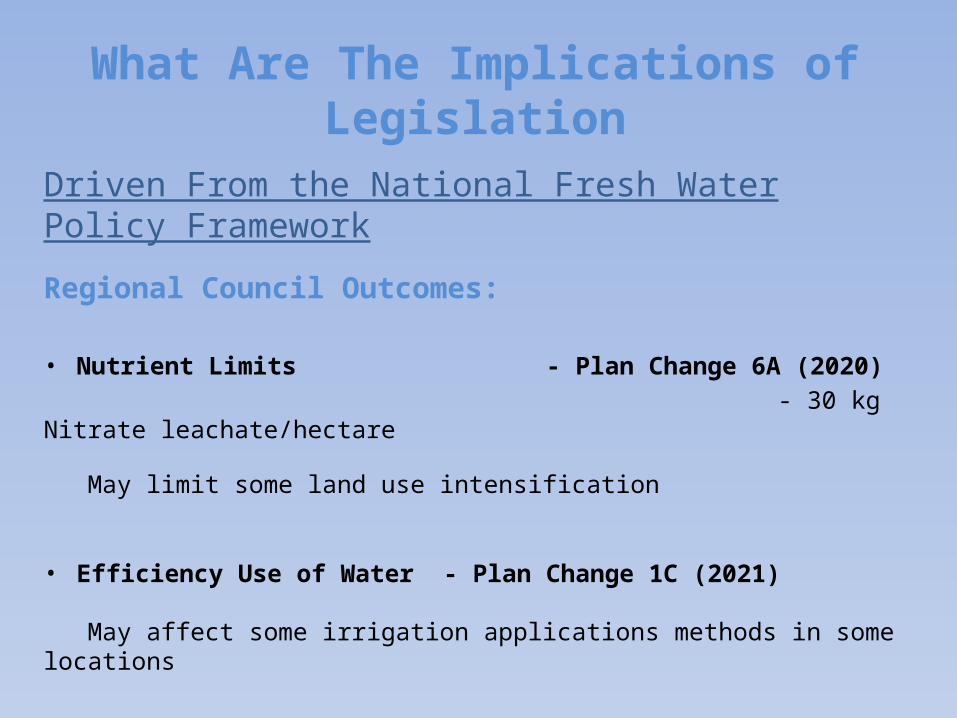
What Are The Implications of Legislation
Driven From the National Fresh Water Policy Framework
Regional Council Outcomes:
• Nutrient Limits - Plan Change 6A (2020) - 30 kg Nitrate leachate/hectare
May limit some land use intensification
• Efficiency Use of Water - Plan Change 1C (2021)
May affect some irrigation applications methods in some locations

Irrigation Efficiency(The Amount of Water Applied That Stays In The Soil)
Centre Pivot 90%
Roto-Rainer 80%
Big Gun 75%
K-Line 70%
Border Dyke 55%
Winter Flood 45%
• Increased efficiency leads to more intensive farming systems
Increased production is essential
• Differences within the catchment depending on the ability to reuse the water
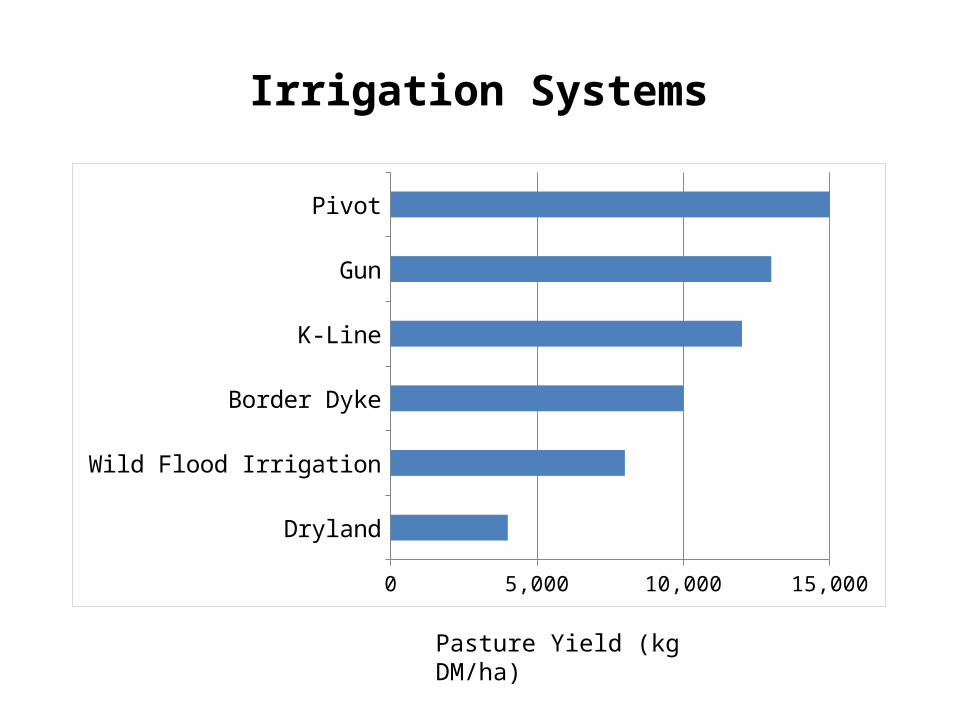
Irrigation Systems
Dryland
Wild Flood Irrigation
Border Dyke
K-Line
Gun
Pivot
0 2,000 4,000 6,000 8,000 10,000 12,000 14,000
Pasture Yield (kg DM/ha)

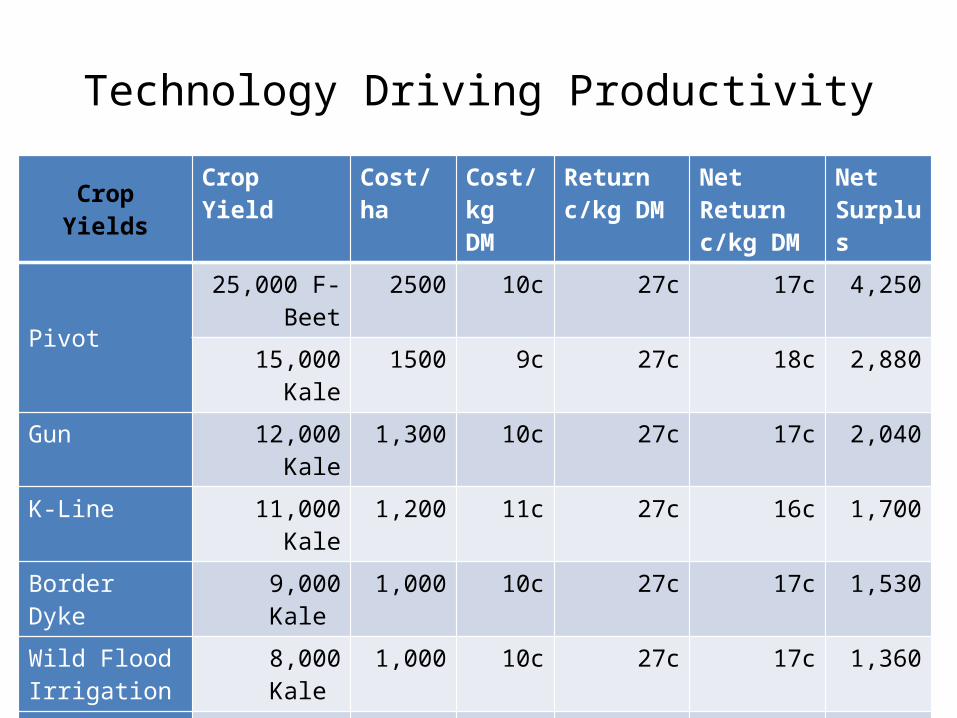
Technology Driving Productivity
Crop Yields Crop Yield Cost/ha Cost/kgDM
Return c/kg DM
Net Return c/kg DM
Net Surplus
Pivot25,000 F-Beet 2500 10c 27c 17c 4,250
15,000 Kale 1500 9c 27c 18c 2,880
Gun 12,000 Kale 1,300 10c 27c 17c 2,040
K-Line 11,000 Kale 1,200 11c 27c 16c 1,700
Border Dyke 9,000 Kale 1,000 10c 27c 17c 1,530
Wild Flood Irrigation
8,000 Kale 1,000 10c 27c 17c 1,360
Dryland 5,000 Kale 800 16c 27c 11c 700
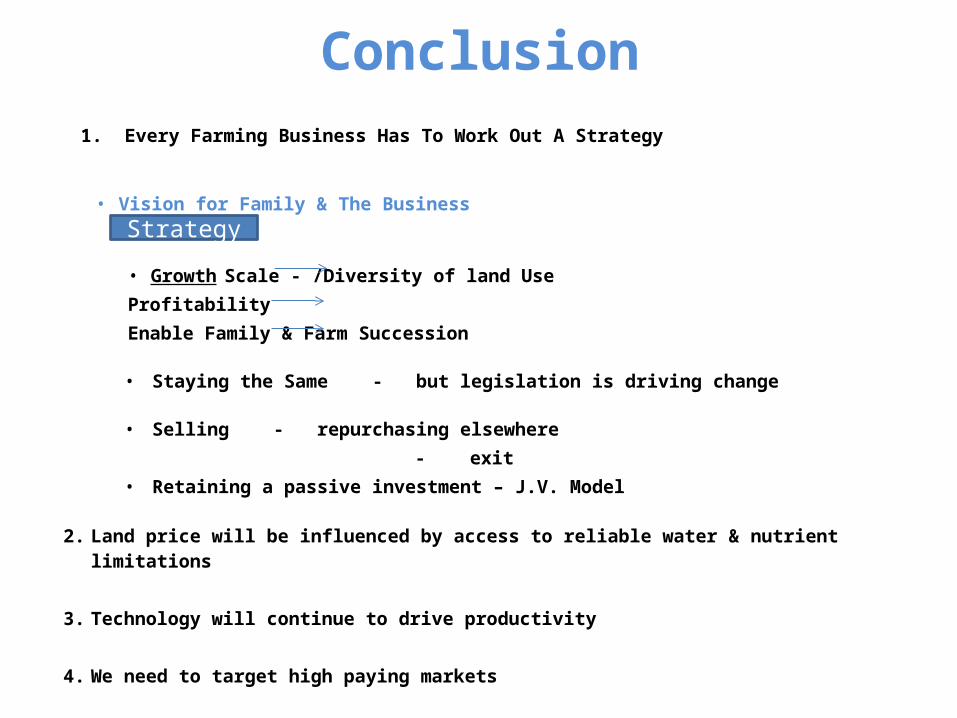
Conclusion 1. Every Farming Business Has To Work Out A Strategy
• Vision for Family & The Business
• Growth Scale - /Diversity of land Use ProfitabilityEnable Family & Farm Succession
• Staying the Same - but legislation is driving change
• Selling - repurchasing elsewhere - exit
• Retaining a passive investment – J.V. Model
2. Land price will be influenced by access to reliable water & nutrient limitations
3. Technology will continue to drive productivity
4. We need to target high paying markets
Strategy