The challenges, dynamics and activities in the … · The challenges, dynamics and activities in...
18
The challenges, dynamics and activities in the building sector and its energy demand in Germany D2.1 of WP2 from Entranze Project Written by: Judit Kockat, Clemens Rohde Fraunhofer ISI Reviewed by: Carine Sebi Enerdata December 2012
Transcript of The challenges, dynamics and activities in the … · The challenges, dynamics and activities in...
The challenges, dynamics and activities in the building sector and its energy
demand in Germany
D2.1 of WP2 from Entranze Project
Written by:
Judit Kockat, Clemens Rohde
Fraunhofer ISI
Reviewed by:
Carine Sebi
Enerdata
December 2012
The challenges, dynamics and activities in building sector and its energy demand in Germany
2
ENTRANZE Project
Year of implementation: April 2012 – September 2014
Client: EACI
Web: http://www.entranze.eu
Project consortium:
EEG Energy Economics Group, Institute of
Energy Systems and Electrical Drives at
Vienna University of Technology
NCRC National Consumer Research Centre
Fraunhofer
ISI
Fraunhofer Society for the advancement
of applied research
CENER National Renewable Energy Centre
eERG end use Efficiency Research Group,
Politecnico di Milano
Oeko Öko-Institut
SOFENA Sofia Energy Agency
BPIE Buildings Performance Institute Europe
Enerdata Enerdata
SEVEn SEVEn, The Energy Efficiency Center
The challenges, dynamics and activities in building sector and its energy demand in Germany
3
The ENTRANZE project
The objective of the ENTRANZE project is to actively support policy making by provid-
ing the required data, analysis and guidelines to achieve a fast and strong penetration
of nZEB and RES-H/C within the existing national building stocks. The project intends
to connect building experts from European research and academia to national decision
makers and key stakeholders with a view to build ambitious, but reality proof, policies
and roadmaps.
The core part of the project is the dialogue with policy makers and experts and will fo-
cus on nine countries, covering >60% of the EU-27 building stock. Data, scenarios and
recommendations will also be provided for EU-27 (+ Croatia and Serbia).
This report provides an overview of the building stock of Germany and its related ener-
gy demand. It includes main buildings characteristics, space heating and cooling sys-
tems and energy consumption and is based on data collection that was carried out dur-
ing WP2.
Acknowledgement:
The authors and the whole project consortium gratefully acknowledge the financial and
intellectual support of this work provided by the Intelligent Energy for Europe – Pro-
gramme.
with the support of the EUROPEAN COMMISSION
Executive Agency for Competitiveness and Innovation Intelligent Energy for Europe
Legal Notice:
The sole responsibility for the content of this publication lies with the authors. It does
not necessarily reflect the opinion of the European Union. Neither the EACI nor the
European Commission is responsible for any use that may be made of the information
contained therein.
All rights reserved; no part of this publication may be translated, reproduced, stored in
a retrieval system, or transmitted in any form or by any means, electronic, mechanical,
photocopying, recording or otherwise, without the written permission of the publisher.
Many of the designations used by manufacturers and sellers to distinguish their
products are claimed as trademarks. The quotation of those designations in whatever
way does not imply the conclusion that the use of those designations is legal without
the consent of the owner of the trademark.
The challenges, dynamics and activities in building sector and its energy demand in Germany
4
Content
The ENTRANZE project ........................................................................................................................... 3
Content ........................................................................................................................................................ 4
List of figures .............................................................................................................................................. 5
1. Building characteristics ..................................................................................................................... 7
1.1 Building sector ............................................................................................................. 7
1.2 Residential sector ........................................................................................................ 9
1.3 Service sector ............................................................................................................ 11
2. Space heating and cooling systems ................................................................................................. 11
3. Energy consumption ........................................................................................................................ 13
4. Conclusions ....................................................................................................................................... 15
5. References ......................................................................................................................................... 16
6. Appendix ........................................................................................................................................... 18
The challenges, dynamics and activities in building sector and its energy demand in Germany
5
List of figures
Figure 1: Decomposition of buildings by type (2008) .................................................................... 7
Figure 2: Breakdown of floor area by ownership structure (2008) ................................................ 8
Figure 3: Dynamics of building construction ................................................................................. 9
Figure 4: Residential dwellings according to construction date (2008) ......................................... 9
Figure 5: Breakdown of ownership & tenure (2008).................................................................... 10
Figure 6: U-values by construction period (multifamily and single family, 2008) ........................ 10
Figure 7: Decomposition of service building areas by type (2008) ............................................. 11
Figure 8: Dwelling stock according to space heating systems by energy (2008) ....................... 12
Figure 9: Dwellings according to centralisation of heat supply (2008) ........................................ 12
Figure 10: Sales of energy efficient and renewable systems in recent years ............................. 13
Figure 11: Total energy consumption of the building sector (2008) ............................................ 14
Figure 12: Total energy consumption by end-use (2008, real climate) ....................................... 14
Figure 13: Specific consumption by age and by type of dwellings .............................................. 15
List of tables
Table 1: Decomposition of buildings by type (stock and floor area, 2008) ................................... 7
Table 2: Total energy consumption by sector (2008) .................................................................. 18
The challenges, dynamics and activities in building sector and its energy demand in Germany
6
Some definitions/scope of country report
The common database year of these country reports is 2008. This year has been cho-
sen because it is one of the most recent years with enough available data. And year
2009 has been avoided because of structural effects caused by the global crisis.
The building sector, as it is subject of this report, refers to two main categories of
buildings: residential buildings and non-residential buildings. Whereas residential build-
ings are relatively homogenous and can further be divided into single/two-family hous-
es and apartments blocks, non residential buildings are more heterogeneous. They
refer to buildings in the service or tertiary sector and include several building categories
(esp. office buildings, hospitals, schools and universities, hotels and restaurants, build-
ings in wholesale and retail trade). Within the residential stock, we consider only per-
manently occupied dwellings.
Floor area: The floor area as it is reported in the following sections is the net floor ar-
ea; it does not include the common areas in multifamily buildings (e.g. corridors, etc.).
Specific consumption for space heating is calculated at normal climate: it corre-
sponds to the energy consumption required to heat one dwelling on average, it is cal-
culated in final energy.
Climate correction (normal climate): Making climatic corrections enable to monitor
energy indicator trends that are independent on the year-to-year variations in the winter
climate. The climatic corrections are made only for the part of the final consumption
corresponding to space heating.
Central heating systems: it includes district heating, block heating, individual boiler
heating and electric heating; a central heating system implies that all rooms are well
heated, as opposed to room heating, where generally a stove provides heat to the main
room only.
The challenges, dynamics and activities in building sector and its energy demand in Germany
7
1. Building characteristics
1.1 Building sector
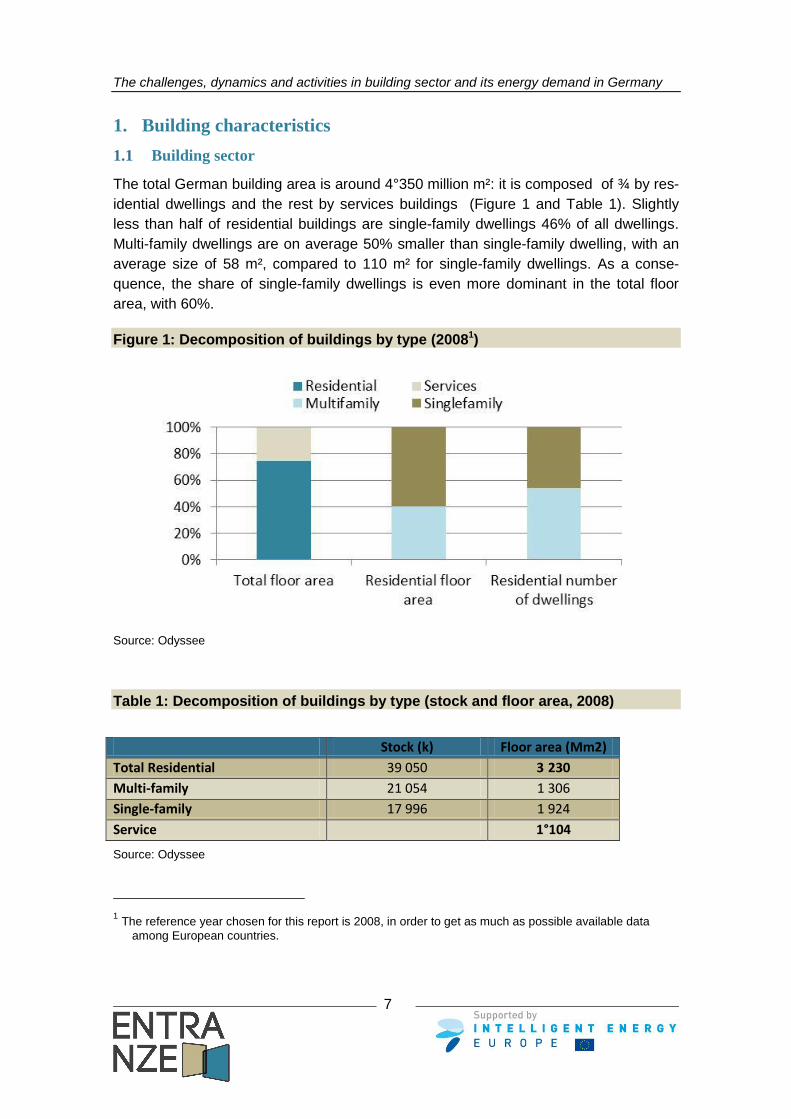
The total German building area is around 4°350 million m²: it is composed of ¾ by res-
idential dwellings and the rest by services buildings (Figure 1 and Table 1). Slightly
less than half of residential buildings are single-family dwellings 46% of all dwellings.
Multi-family dwellings are on average 50% smaller than single-family dwelling, with an
average size of 58 m², compared to 110 m² for single-family dwellings. As a conse-
quence, the share of single-family dwellings is even more dominant in the total floor
area, with 60%.
Figure 1: Decomposition of buildings by type (20081)
Source: Odyssee
Table 1: Decomposition of buildings by type (stock and floor area, 2008)
Stock (k) Floor area (Mm2)
Total Residential 39 050 3 230
Multi-family 21 054 1 306
Single-family 17 996 1 924
Service 1°104
Source: Odyssee
1 The reference year chosen for this report is 2008, in order to get as much as possible available data
among European countries.
The challenges, dynamics and activities in building sector and its energy demand in Germany
8
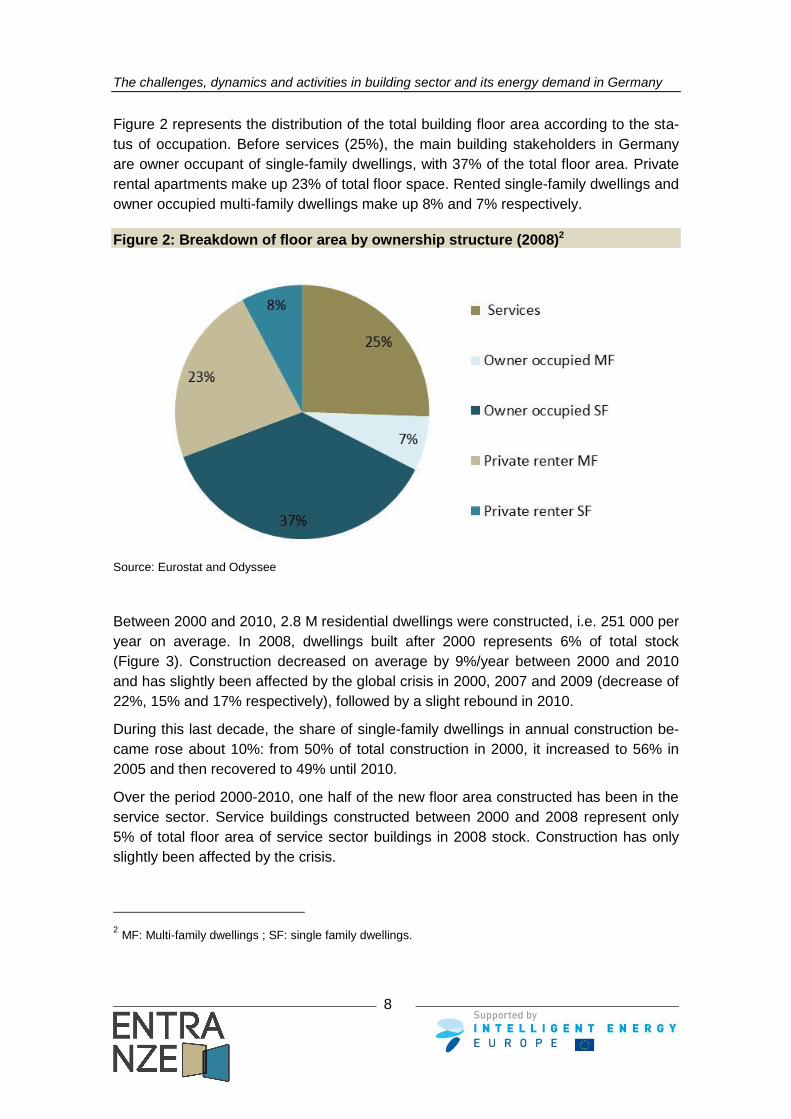
Figure 2 represents the distribution of the total building floor area according to the sta-
tus of occupation. Before services (25%), the main building stakeholders in Germany
are owner occupant of single-family dwellings, with 37% of the total floor area. Private
rental apartments make up 23% of total floor space. Rented single-family dwellings and
owner occupied multi-family dwellings make up 8% and 7% respectively.
Figure 2: Breakdown of floor area by ownership structure (2008)2
Source: Eurostat and Odyssee
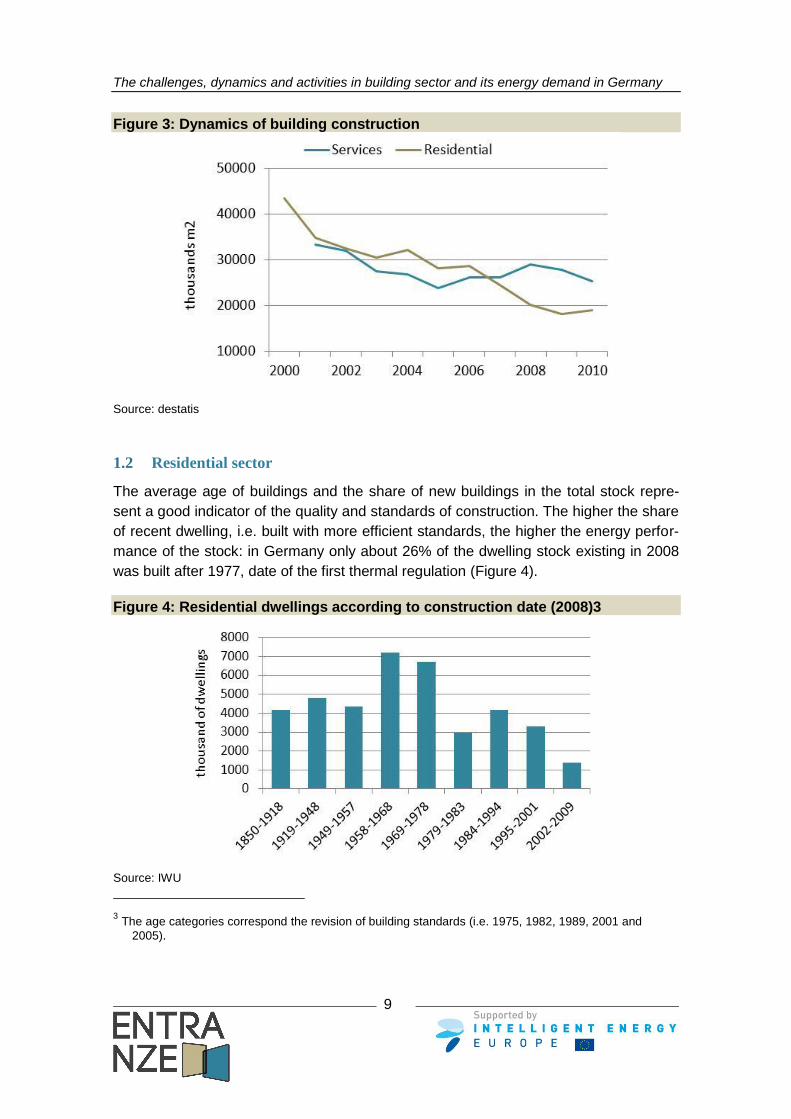
Between 2000 and 2010, 2.8 M residential dwellings were constructed, i.e. 251 000 per
year on average. In 2008, dwellings built after 2000 represents 6% of total stock
(Figure 3). Construction decreased on average by 9%/year between 2000 and 2010
and has slightly been affected by the global crisis in 2000, 2007 and 2009 (decrease of
22%, 15% and 17% respectively), followed by a slight rebound in 2010.
During this last decade, the share of single-family dwellings in annual construction be-
came rose about 10%: from 50% of total construction in 2000, it increased to 56% in
2005 and then recovered to 49% until 2010.
Over the period 2000-2010, one half of the new floor area constructed has been in the
service sector. Service buildings constructed between 2000 and 2008 represent only
5% of total floor area of service sector buildings in 2008 stock. Construction has only
slightly been affected by the crisis.
2 MF: Multi-family dwellings ; SF: single family dwellings.
The challenges, dynamics and activities in building sector and its energy demand in Germany
9
Figure 3: Dynamics of building construction
Source: destatis
1.2 Residential sector
The average age of buildings and the share of new buildings in the total stock repre-
sent a good indicator of the quality and standards of construction. The higher the share
of recent dwelling, i.e. built with more efficient standards, the higher the energy perfor-
mance of the stock: in Germany only about 26% of the dwelling stock existing in 2008
was built after 1977, date of the first thermal regulation (Figure 4).
Figure 4: Residential dwellings according to construction date (2008)3
Source: IWU
3 The age categories correspond the revision of building standards (i.e. 1975, 1982, 1989, 2001 and
2005).
The challenges, dynamics and activities in building sector and its energy demand in Germany
10
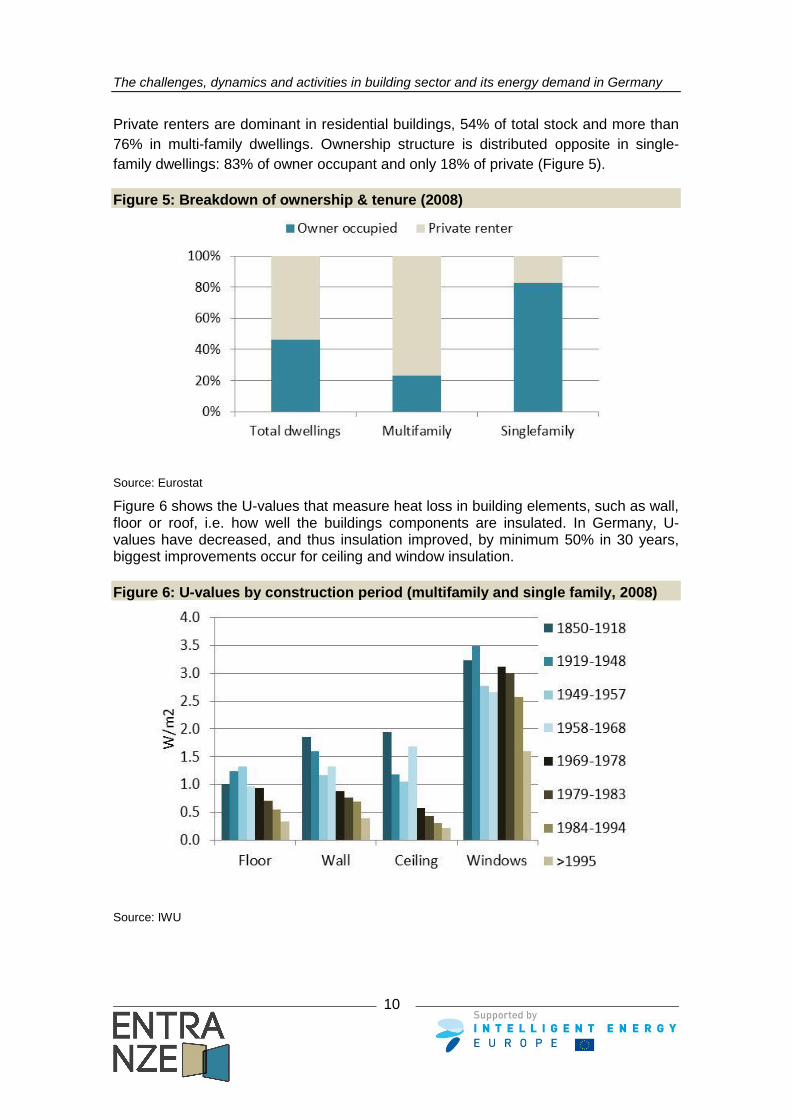
Private renters are dominant in residential buildings, 54% of total stock and more than
76% in multi-family dwellings. Ownership structure is distributed opposite in single-
family dwellings: 83% of owner occupant and only 18% of private (Figure 5).
Figure 5: Breakdown of ownership & tenure (2008)
Source: Eurostat
Figure 6 shows the U-values that measure heat loss in building elements, such as wall, floor or roof, i.e. how well the buildings components are insulated. In Germany, U-values have decreased, and thus insulation improved, by minimum 50% in 30 years, biggest improvements occur for ceiling and window insulation.
Figure 6: U-values by construction period (multifamily and single family, 2008)
Source: IWU
The challenges, dynamics and activities in building sector and its energy demand in Germany
11
1.3 Service sector
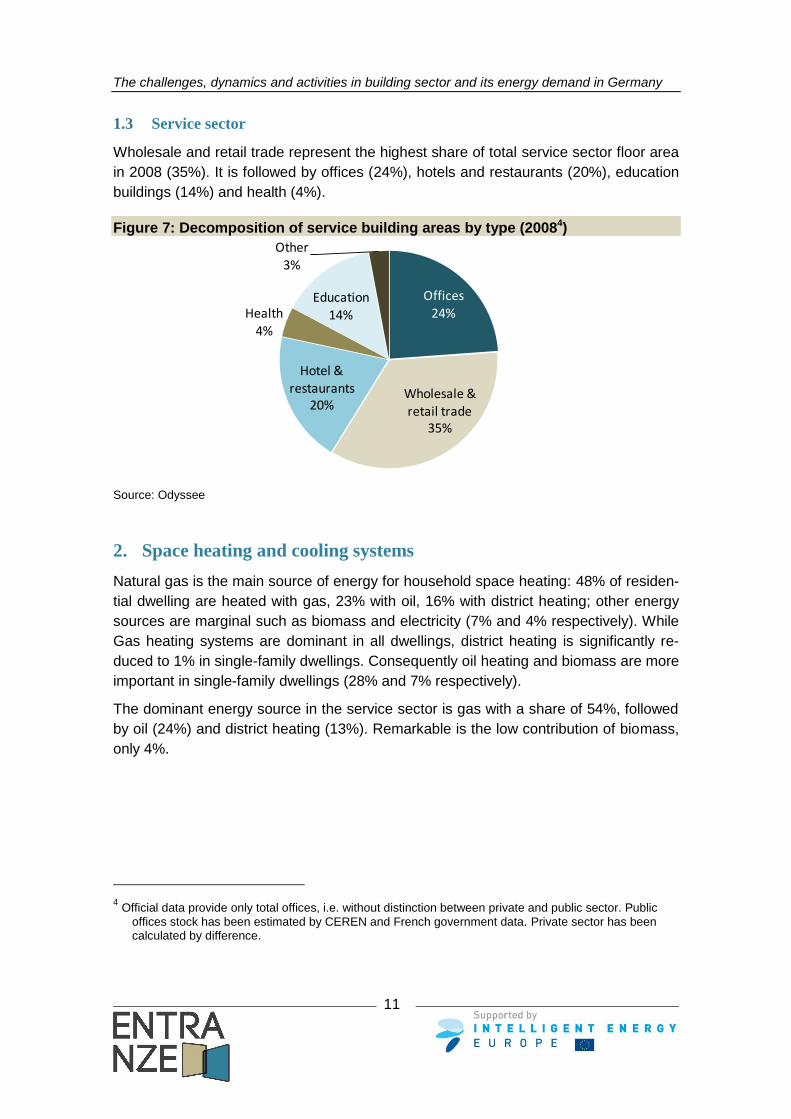
Wholesale and retail trade represent the highest share of total service sector floor area
in 2008 (35%). It is followed by offices (24%), hotels and restaurants (20%), education
buildings (14%) and health (4%).
Figure 7: Decomposition of service building areas by type (20084)
Source: Odyssee
2. Space heating and cooling systems
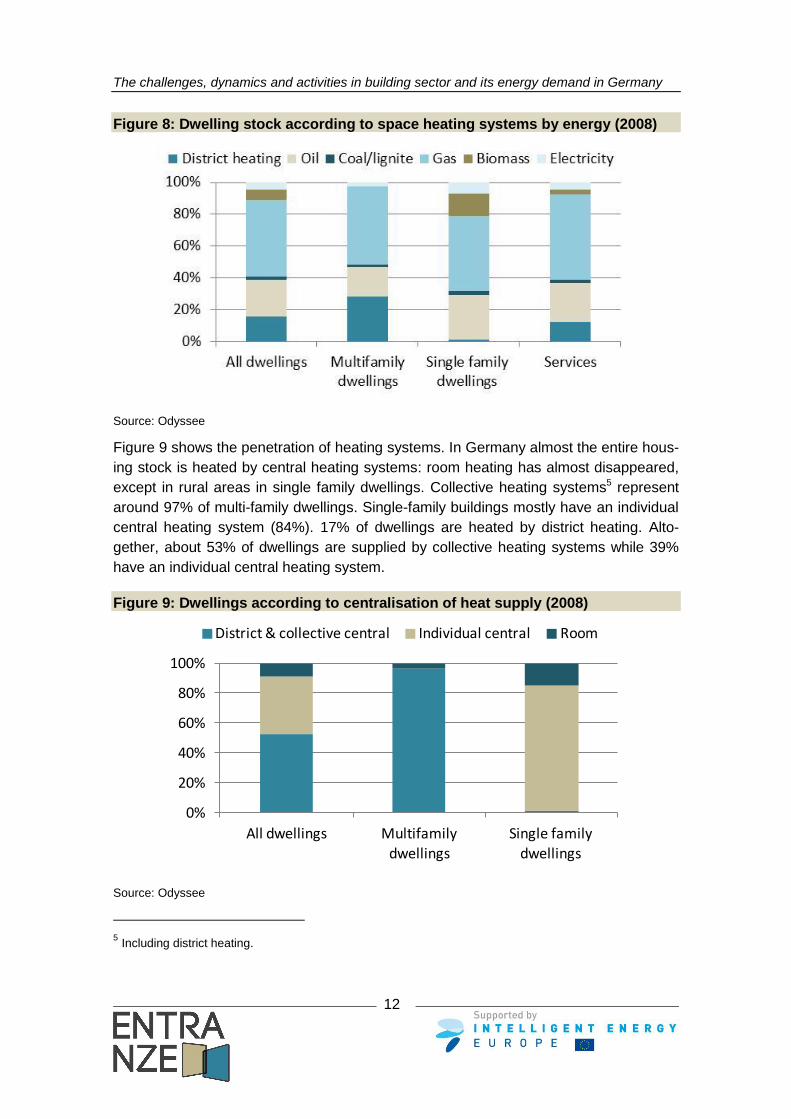
Natural gas is the main source of energy for household space heating: 48% of residen-
tial dwelling are heated with gas, 23% with oil, 16% with district heating; other energy
sources are marginal such as biomass and electricity (7% and 4% respectively). While
Gas heating systems are dominant in all dwellings, district heating is significantly re-
duced to 1% in single-family dwellings. Consequently oil heating and biomass are more
important in single-family dwellings (28% and 7% respectively).
The dominant energy source in the service sector is gas with a share of 54%, followed
by oil (24%) and district heating (13%). Remarkable is the low contribution of biomass,
only 4%.
4 Official data provide only total offices, i.e. without distinction between private and public sector. Public
offices stock has been estimated by CEREN and French government data. Private sector has been calculated by difference.
Offices
24%
Wholesale &
retail trade35%
Hotel & restaurants
20%
Health
4%
Education
14%
Other3%
The challenges, dynamics and activities in building sector and its energy demand in Germany
12
Figure 8: Dwelling stock according to space heating systems by energy (2008)
Source: Odyssee
Figure 9 shows the penetration of heating systems. In Germany almost the entire hous-
ing stock is heated by central heating systems: room heating has almost disappeared,
except in rural areas in single family dwellings. Collective heating systems5 represent
around 97% of multi-family dwellings. Single-family buildings mostly have an individual
central heating system (84%). 17% of dwellings are heated by district heating. Alto-
gether, about 53% of dwellings are supplied by collective heating systems while 39%
have an individual central heating system.
Figure 9: Dwellings according to centralisation of heat supply (2008)
Source: Odyssee
5 Including district heating.
0%
20%
40%
60%
80%
100%
All dwellings Multifamily dwellings
Single family dwellings
District & collective central Individual central Room
The challenges, dynamics and activities in building sector and its energy demand in Germany
13
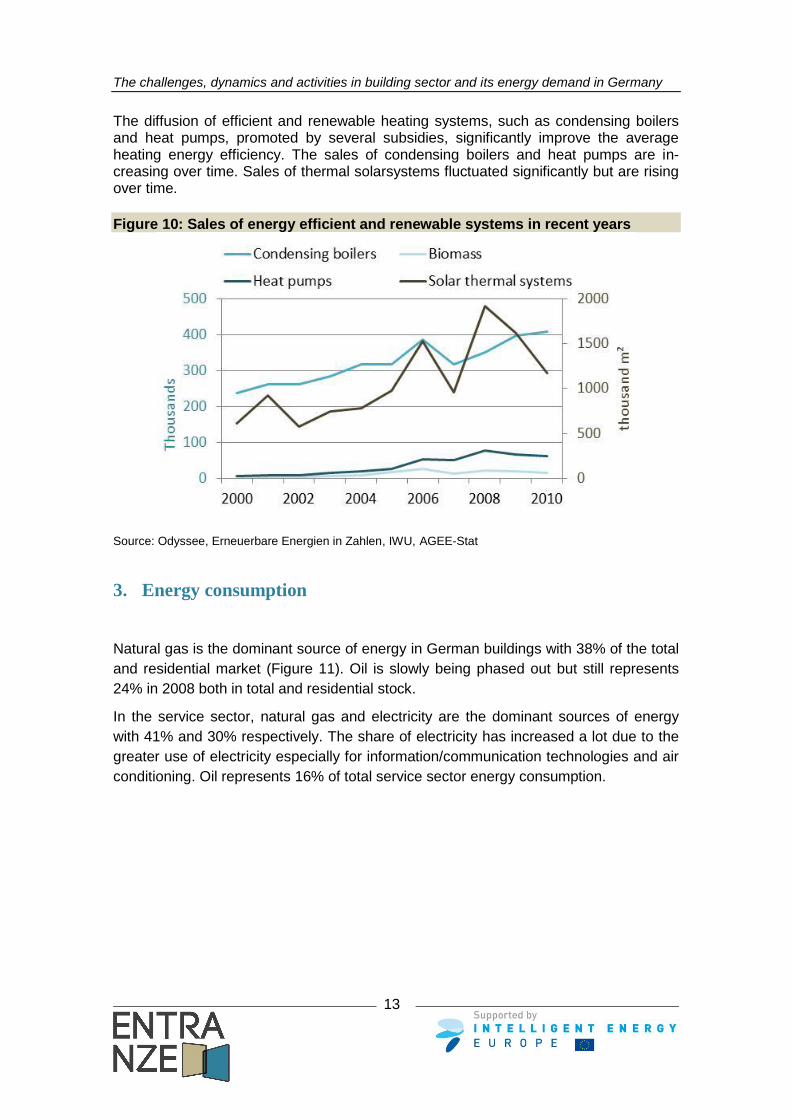
The diffusion of efficient and renewable heating systems, such as condensing boilers and heat pumps, promoted by several subsidies, significantly improve the average heating energy efficiency. The sales of condensing boilers and heat pumps are in-creasing over time. Sales of thermal solarsystems fluctuated significantly but are rising over time.
Figure 10: Sales of energy efficient and renewable systems in recent years
Source: Odyssee, Erneuerbare Energien in Zahlen, IWU, AGEE-Stat
3. Energy consumption
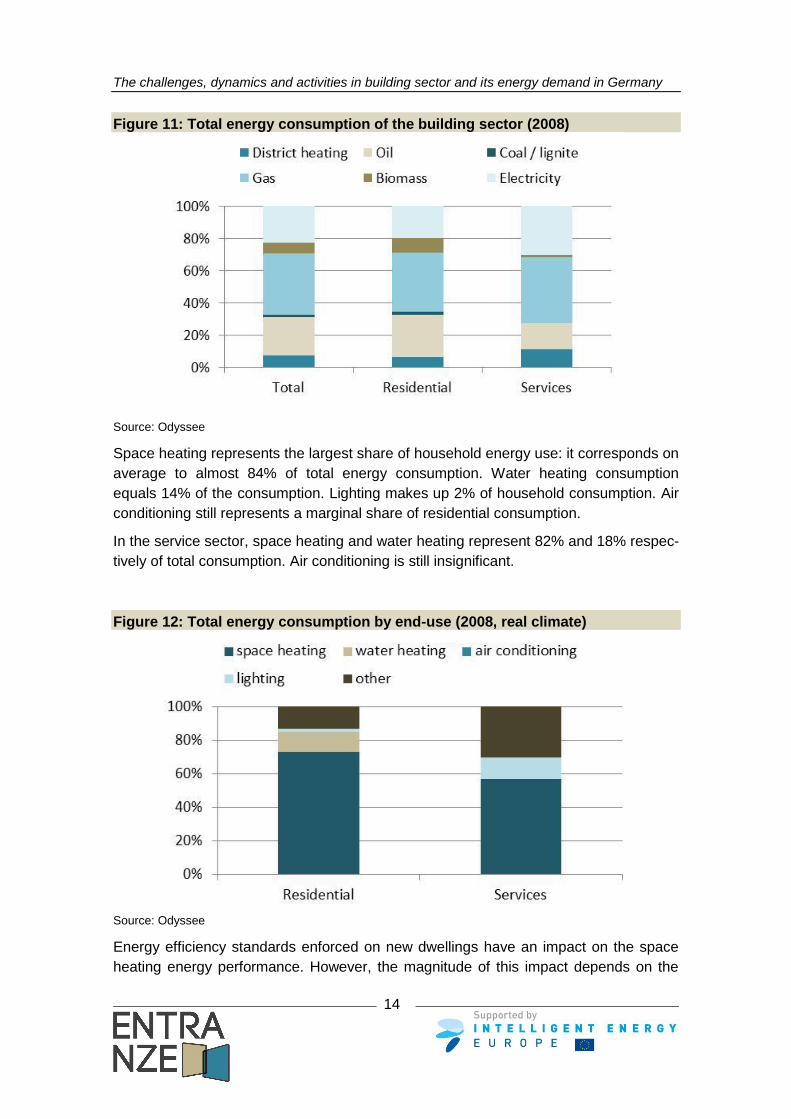
Natural gas is the dominant source of energy in German buildings with 38% of the total
and residential market (Figure 11). Oil is slowly being phased out but still represents
24% in 2008 both in total and residential stock.
In the service sector, natural gas and electricity are the dominant sources of energy
with 41% and 30% respectively. The share of electricity has increased a lot due to the
greater use of electricity especially for information/communication technologies and air
conditioning. Oil represents 16% of total service sector energy consumption.
The challenges, dynamics and activities in building sector and its energy demand in Germany
14
Figure 11: Total energy consumption of the building sector (2008)
Source: Odyssee
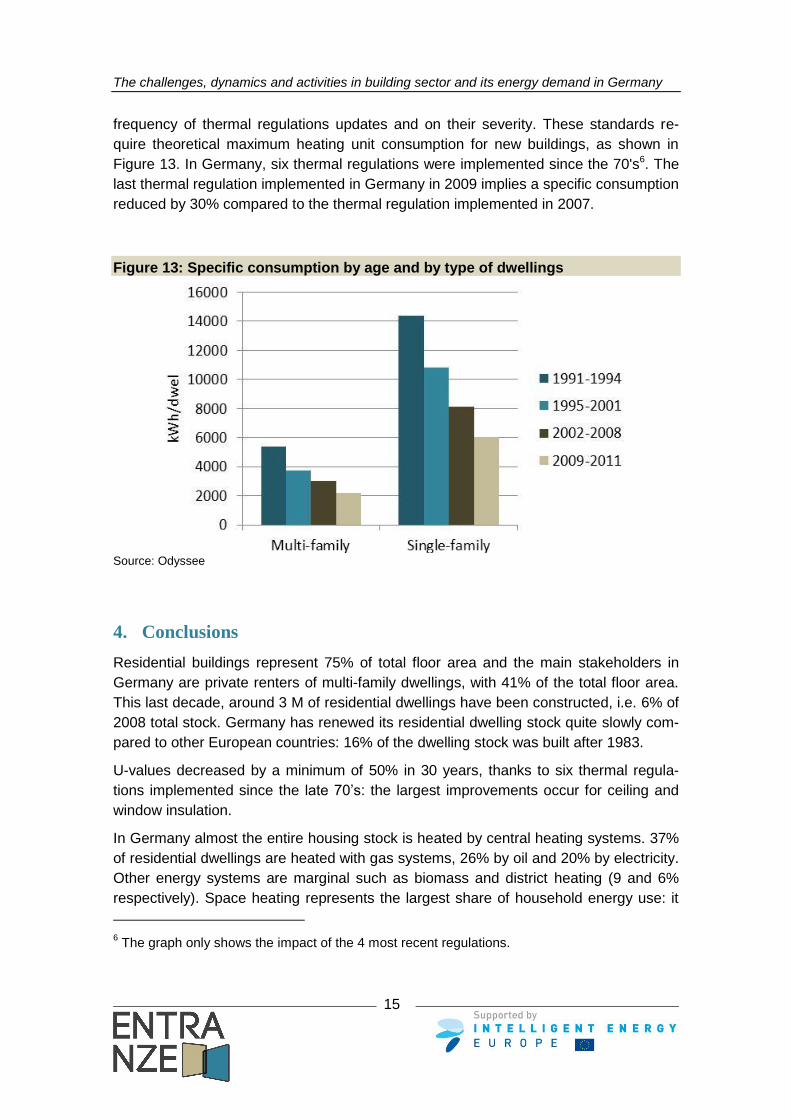
Space heating represents the largest share of household energy use: it corresponds on
average to almost 84% of total energy consumption. Water heating consumption
equals 14% of the consumption. Lighting makes up 2% of household consumption. Air
conditioning still represents a marginal share of residential consumption.
In the service sector, space heating and water heating represent 82% and 18% respec-
tively of total consumption. Air conditioning is still insignificant.
Figure 12: Total energy consumption by end-use (2008, real climate)
Source: Odyssee
Energy efficiency standards enforced on new dwellings have an impact on the space
heating energy performance. However, the magnitude of this impact depends on the
The challenges, dynamics and activities in building sector and its energy demand in Germany
15
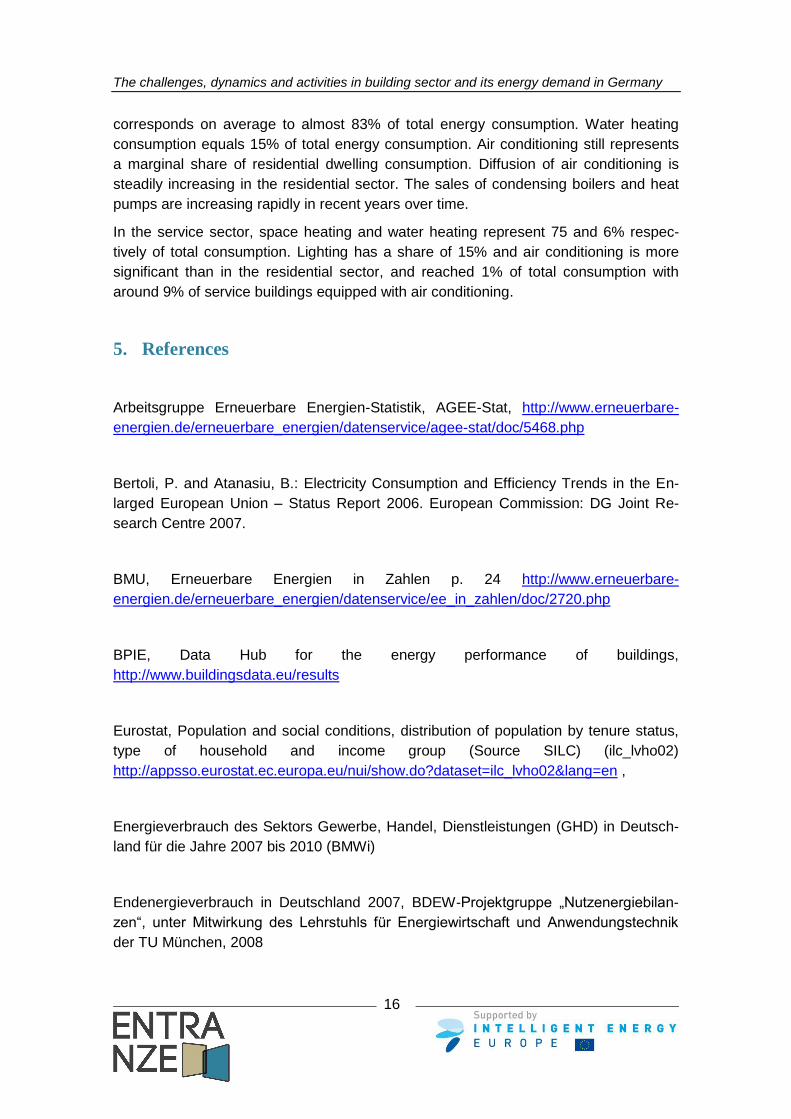
frequency of thermal regulations updates and on their severity. These standards re-
quire theoretical maximum heating unit consumption for new buildings, as shown in
Figure 13. In Germany, six thermal regulations were implemented since the 70's6. The
last thermal regulation implemented in Germany in 2009 implies a specific consumption
reduced by 30% compared to the thermal regulation implemented in 2007.
Figure 13: Specific consumption by age and by type of dwellings
Source: Odyssee
4. Conclusions
Residential buildings represent 75% of total floor area and the main stakeholders in
Germany are private renters of multi-family dwellings, with 41% of the total floor area.
This last decade, around 3 M of residential dwellings have been constructed, i.e. 6% of
2008 total stock. Germany has renewed its residential dwelling stock quite slowly com-
pared to other European countries: 16% of the dwelling stock was built after 1983.
U-values decreased by a minimum of 50% in 30 years, thanks to six thermal regula-
tions implemented since the late 70’s: the largest improvements occur for ceiling and
window insulation.
In Germany almost the entire housing stock is heated by central heating systems. 37%
of residential dwellings are heated with gas systems, 26% by oil and 20% by electricity.
Other energy systems are marginal such as biomass and district heating (9 and 6%
respectively). Space heating represents the largest share of household energy use: it
6 The graph only shows the impact of the 4 most recent regulations.
The challenges, dynamics and activities in building sector and its energy demand in Germany
16
corresponds on average to almost 83% of total energy consumption. Water heating
consumption equals 15% of total energy consumption. Air conditioning still represents
a marginal share of residential dwelling consumption. Diffusion of air conditioning is
steadily increasing in the residential sector. The sales of condensing boilers and heat
pumps are increasing rapidly in recent years over time.
In the service sector, space heating and water heating represent 75 and 6% respec-
tively of total consumption. Lighting has a share of 15% and air conditioning is more
significant than in the residential sector, and reached 1% of total consumption with
around 9% of service buildings equipped with air conditioning.
5. References
Arbeitsgruppe Erneuerbare Energien-Statistik, AGEE-Stat, http://www.erneuerbare-
energien.de/erneuerbare_energien/datenservice/agee-stat/doc/5468.php
Bertoli, P. and Atanasiu, B.: Electricity Consumption and Efficiency Trends in the En-
larged European Union – Status Report 2006. European Commission: DG Joint Re-
search Centre 2007.
BMU, Erneuerbare Energien in Zahlen p. 24 http://www.erneuerbare-
energien.de/erneuerbare_energien/datenservice/ee_in_zahlen/doc/2720.php
BPIE, Data Hub for the energy performance of buildings,
http://www.buildingsdata.eu/results
Eurostat, Population and social conditions, distribution of population by tenure status,
type of household and income group (Source SILC) (ilc_lvho02)
http://appsso.eurostat.ec.europa.eu/nui/show.do?dataset=ilc_lvho02&lang=en ,
Energieverbrauch des Sektors Gewerbe, Handel, Dienstleistungen (GHD) in Deutsch-
land für die Jahre 2007 bis 2010 (BMWi)
Endenergieverbrauch in Deutschland 2007, BDEW-Projektgruppe „Nutzenergiebilan-
zen“, unter Mitwirkung des Lehrstuhls für Energiewirtschaft und Anwendungstechnik
der TU München, 2008
The challenges, dynamics and activities in building sector and its energy demand in Germany
17
Energy balances from AG Energiebilanzen 2008 titel : Erstellen der Anwendungs-
bilanz 2008 für den Sektor Gewerbe, Handel, Dienstleistungen (GHD)
German Institute for Economic Research, DIW,
http://www.diw.de/en/diw_01.c.100293.en/about_us/about_us.html
IWU, Deutsh Gebaudetypologie,
http://www.iwu.de/fileadmin/user_upload/dateien/energie/klima_altbau/Gebaeudetypolo
gie_Deutschland.pdf
IWU, Data Base of the Building Stock – Data Survey of the State and the Trends of
Energy Saving Measures in the German Residential Building
Stock, http://www.iwu.de/?id=197,
http://www.iwu.de/fileadmin/user_upload/dateien/energie/klima_altbau/Summery_Data
_Base_of_Building_stock.pdf,
http://www.iwu.de/fileadmin/user_upload/dateien/energie/klima_altbau/Endbericht_Dat
enbasis.pdf
IWU, Basisdata for the projection of the German building typology by IWU,;
http://www.iwu.de/fileadmin/user_upload/dateien/energie/klima_altbau/Flaechen_Geba
eudetypologie_07.pdf,
http://www.iwu.de/fileadmin/user_upload/dateien/energie/klima_altbau/Flaechen_Geba
eudetypologie_Aug_2011.pdf
ODYSSEE, database http://www.odyssee-indicators.org/
PROGNOS, http://www.prognos.com/
TABULA, Typology Approach for Building Stock Energy Assessment,
http://www.building-typology.eu/country.html
The challenges, dynamics and activities in building sector and its energy demand in Germany
18
6. Appendix
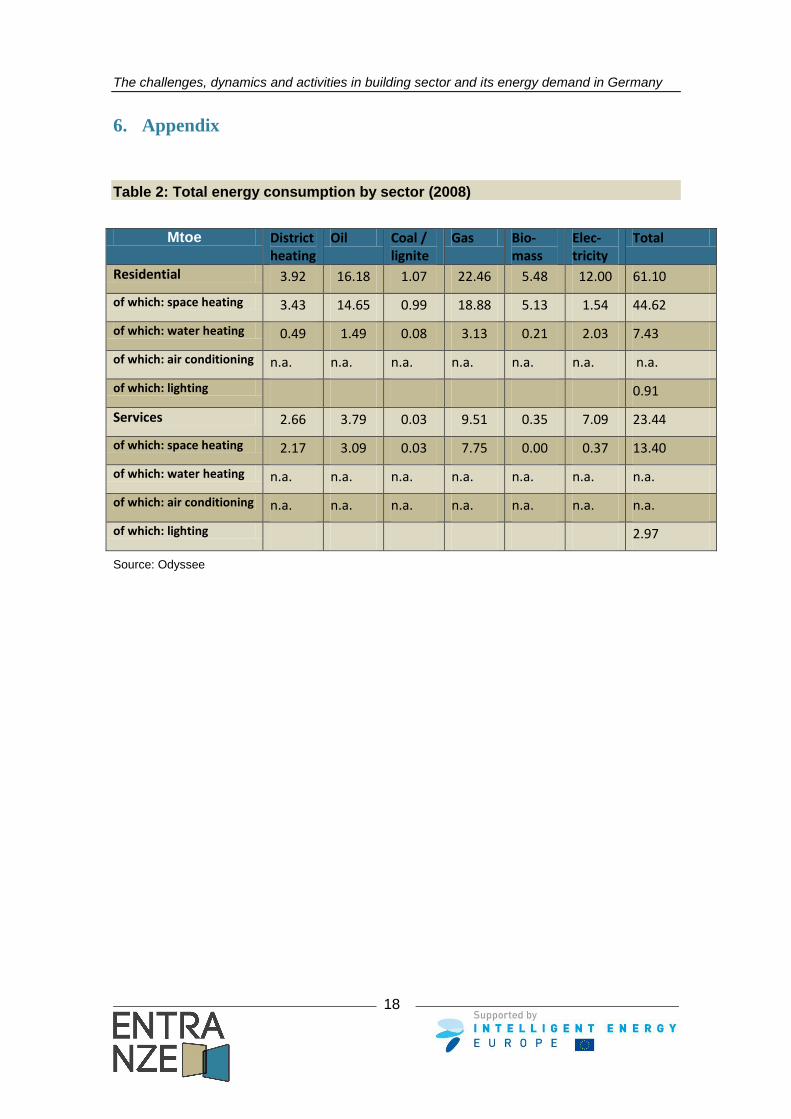
Table 2: Total energy consumption by sector (2008)
Mtoe District heating
Oil Coal / lignite
Gas Bio-mass
Elec-tricity
Total
Residential 3.92 16.18 1.07 22.46 5.48 12.00 61.10
of which: space heating 3.43 14.65 0.99 18.88 5.13 1.54 44.62
of which: water heating 0.49 1.49 0.08 3.13 0.21 2.03 7.43
of which: air conditioning n.a. n.a. n.a. n.a. n.a. n.a. n.a.
of which: lighting 0.91
Services 2.66 3.79 0.03 9.51 0.35 7.09 23.44
of which: space heating 2.17 3.09 0.03 7.75 0.00 0.37 13.40
of which: water heating n.a. n.a. n.a. n.a. n.a. n.a. n.a.
of which: air conditioning n.a. n.a. n.a. n.a. n.a. n.a. n.a.
of which: lighting 2.97
Source: Odyssee