The Challenge of Web-Based Molecular Visualization Robert M. Hanson St. Olaf College NOTE: THIS...
50
The Challenge of Web- Based Molecular Visualization Robert M. Hanson St. Olaf College NOTE: THIS PRESENTATION REQUIRES A WINDOWS PC WITH THE LiveWeb POWERPOINT ADD-IN.
-
date post
20-Dec-2015 -
Category
Documents
-
view
216 -
download
0
Transcript of The Challenge of Web-Based Molecular Visualization Robert M. Hanson St. Olaf College NOTE: THIS...

The Challenge of Web-Based Molecular Visualization
Robert M. HansonSt. Olaf College
NOTE: THIS PRESENTATION REQUIRES A WINDOWS PC WITH THE LiveWeb
POWERPOINT ADD-IN.

The Challenge of Web-Based Molecular Visualization
Robert M. HansonSt. Olaf College
Cologne UniversityAugust 21, 2006

The Challenge of Web-Based Molecular Visualization
Robert M. HansonSt. Olaf College
Radboud University, NijmegenAugust 23, 2006

The Challenge of Web-Based Molecular Visualization
Robert M. HansonSt. Olaf College
Cambridge UniversityAugust 25, 2006

This talk is about visualization – but not just any kind. It is about my favorite kind of visualization – molecular visualization.
But first, let’s think about visualization in general…. Why visualize?

Graphical visualization• 0,1.00• 0.500,1.04• 1.000,1.09• 1.500,1.13• 2.000,1.18• 2.500,1.22• 3.000,1.27• 3.500,1.32• 4.000,1.37• 4.500,1.42• 5.000,1.48• 5.500,1.54• 6.000,1.60• 6.500,1.67• 7.000,1.75• 7.500,1.85• 8.000,1.95• 8.500,2.09• 9.000,2.28• 9.500,2.59• 10.000,7.00• 10.500,11.39• 11.000,11.68• 11.500,11.84
• 12.000,11.96• 12.500,12.05• 13.000,12.12• 13.500,12.17• 14.000,12.22• 14.500,12.26• 15.000,12.30• 15.500,12.33• 16.000,12.36• 16.500,12.39• 17.000,12.41• 17.500,12.44• 18.000,12.46• 18.500,12.47• 19.000,12.49• 19.500,12.51• 20.000,12.52
What are we looking at?

Graphical visualization
A titration curve.

Graphical visualization
time(sec) [NO2]
0 0.0100
50 0.0079
100 0.0065
200 0.0048
300 0.0038
What have we here?

Graphical visualization
Ah, yes, but what kind of reaction kinetics?

Graphical visualization
Not first order…

Graphical visualization
Second order, it is!


Graphical visualization
J. Willard Gibbs:
“To fix our ideas, let the axes of ν, η, and ε have the directions usually given to the axes of X, Y, and Z (ν increasing to the right, η forward, and ε upward). The pressure and temperature of the state represented by any point of the surface are equal to the tangents of the inclinations of the surface to the horizon at that point, as measured in planes perpendicular to the axes of η and of ν, respectively….“
A Method of Geometrical Representation of the Thermodynamic Properties of Substances by Means of Surfaces Transactions of the Connecticut Academy, II, pp 382-404, Dec. 1873.

Graphical visualization
Photo: Thomas G. West
http://krasnow.gmu.edu/twest/maxwell_visual.html
http://old.siggraph.org/publications/newsletter/v33n1/index.html
Maxwell’s plaster model of Gibbs’s surface

Medical visualization

Medical visualization


Körperwelten

The point?
• Visualization takes many forms.
• Sometimes getting the right visualization is critical.
• Many amazing forms of visualization are appearing.
• Visualization doesn’t have to be perfectly “realistic” – and in fact sometimes should not be photorealistic.

Molecular visualization
Friedrich August Kekulé concludes that the structure of benzene is a closed, hexagonal, six-membered ring after a visionary dream.
"...I was sitting writing on my textbook, but the work did not progress; my thoughts were elsewhere. I turned my chair to the fire and dozed. Again the atoms were gamboling before my eyes. This time the smaller groups kept modestly in the background. My mental eye, rendered more acute by the repeated visions of the kind, could now distinguish larger structures of manifold conformation; long rows sometimes more closely fitted together all twining and twisting in snake-like motion. But look! What was that? One of the snakes had seized hold of its own tail, and the form whirled mockingly before my eyes. As if by a flash of lightning I awoke; and this time also I spent the rest of the night in working out the consequences of the hypothesis."
Royston M. Roberts, Serendipidty, Accidental Discoveries in Science , John Wiley and Sons, New York, NY,1989, pp. 75-81.
http://www.chemsoc.org/timeline/pages/1864_benzene.html

Molecular visualization

Molecular visualization
Bob, turn on the sound now.


Molecular visualization
http://www.uscibooks.com/hansonnb.htm

Molecular visualization
quartz helix

Molecular visualization
marcasite

Molecular visualization
zircon

http://www.stolaf.edu/academics/chemapps/jmol/docs/examples-11/zircon.htm

http://www.stolaf.edu/academics/chemapps/jmol/docs/misc/bob.htm

http://www.stolaf.edu/depts/chemistry/mo/struc
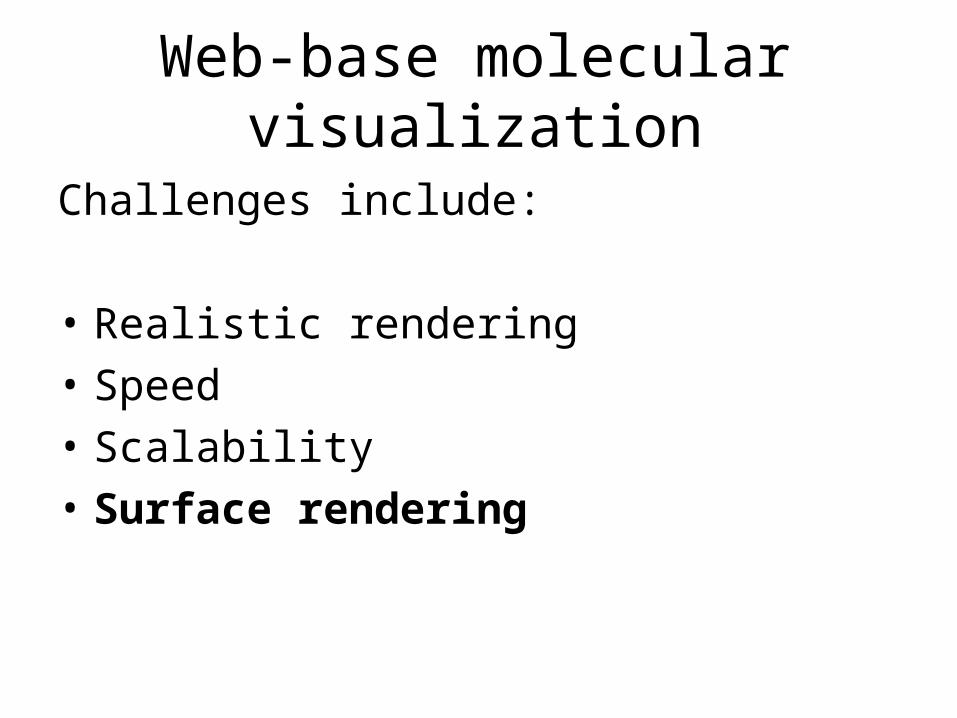
Web-base molecular visualization
Challenges include:
• Realistic rendering
• Speed
• Scalability
• Surface rendering

Web-base molecular visualization
Applications of isosurfaces:
molecular/solvent surfaces
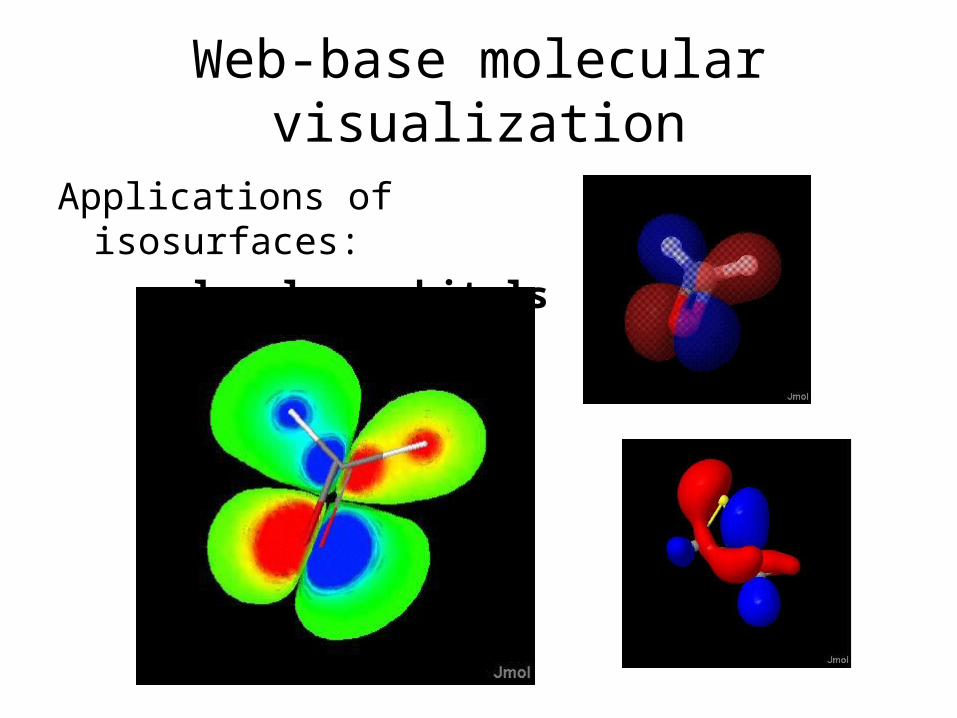
Web-base molecular visualization
Applications of isosurfaces:
molecular orbitals

Web-base molecular visualization
Applications of isosurfaces:
electrostatic potentials

Web-base molecular visualization
Applications of isosurfaces:
atomic orbitals

Web-base molecular visualization
Applications of isosurfaces:
LCAO “cartoons”

Web-base molecular visualization
Applications of isosurfaces:
ellipsoids and
user-defined functions

Web-base molecular visualization
Isosurface Implementation in Jmol:
• Adapted Marching Cubes algorithm

Web-base molecular visualization
Isosurface Implementation in Jmol:
• Adapted Marching Cubes algorithm
• Marching Squares algorithm

Web-base molecular visualization
Isosurface Implementation in Jmol:
• Adapted Marching Cubes algorithm
• Marching Squares algorithm
• Dynamic cube generation

Web-base molecular visualization
Isosurface Implementation in Jmol:
• Adapted Marching Cubes algorithm
• Marching Squares algorithm
• Dynamic cube generation
• Read/Write JVXL file format

Web-base molecular visualization
Typical JVXL compression statistics:
compound type Cube size/Kb JVXL size/Kb Compression ratio
CH3Cl Electron density 1813 3.5 518
CH3Cl Electrostatic Potential
1813 4.8 377
CH3Cl ESP-mapped electron density
3626 6.1 594
ethene MO 1015 5.5 184
1crn Solvent surface ??? 3.4 ???

http://www.stolaf.edu/academics/chemapps/jmol/docs/examples-11/data/ethene.jvxl

CUBE/JVXL Comparisons

CUBE/JVXL Comparisons

CUBE/JVXL Comparisons

CUBE/JVXL Comparisons

Summary
• Visualization is important both in teaching and research.
• Sometimes getting the right visualization is critical.
• Jmol can now render a wide variety of objects using isosurfaces. See http://www.stolaf.edu/academics/chemapps/jmol
• The Jmol Voxel (JVXL) format efficiently and accurately delivers a single surface with roughly 150-600 fold compression over using CUBE files.

Future Plans
• Add to Jmol a space-group translator and support for thermal ellipsoids with the help of the crystallographic community.
• Add electrostatic potential display for files already having charges specified. (No plans to generate charges quantum mechanically.)
• Provide a better implementation of XML and CML.
• Specify the JVXL format better and publish this.• Integrate/demonstrate more AJAX functionality
in relation to Jmol.

Acknowledgments
Miguel Howard wrote the original isosurface code using the Marching Cube algorithm. I adapted it and used that as a basis for the Marching Squares algorithm, which was kindly suggested to me by Olaf Hall-Holt. Fast gaussian molecular orbital calculations are based on algorithms by Daniel Severance and Bill Jorgensen. I thank Won Kyu Park for pointing me to this work.
Many thanks to Chris Steinbeck, Egon Willighagen, Hens Borkent, and Peter Murray-Rust for the kind invitations that allowed me to speak to you today.