THE CARL MOYER PROGRAM GUIDELINES - … · Web view2016/12/09 · Rollers 0.38 Rough Terrain...
37
APPENDIX D TABLES FOR EMISSION REDUCTION AND COST-EFFECTIVENESS CALCULATIONS
Transcript of THE CARL MOYER PROGRAM GUIDELINES - … · Web view2016/12/09 · Rollers 0.38 Rough Terrain...
APPENDIX D
TABLES FOR EMISSION REDUCTION ANDCOST-EFFECTIVENESS CALCULATIONS
Draft for Discussion at Incentives Program Implementation Meeting December 14For internal ARB/CAPCOA discussion only. Do not cite or quote.
APPENDIX D
TABLES FOR EMISSION REDUCTION ANDCOST-EFFECTIVENESS CALCULATIONS
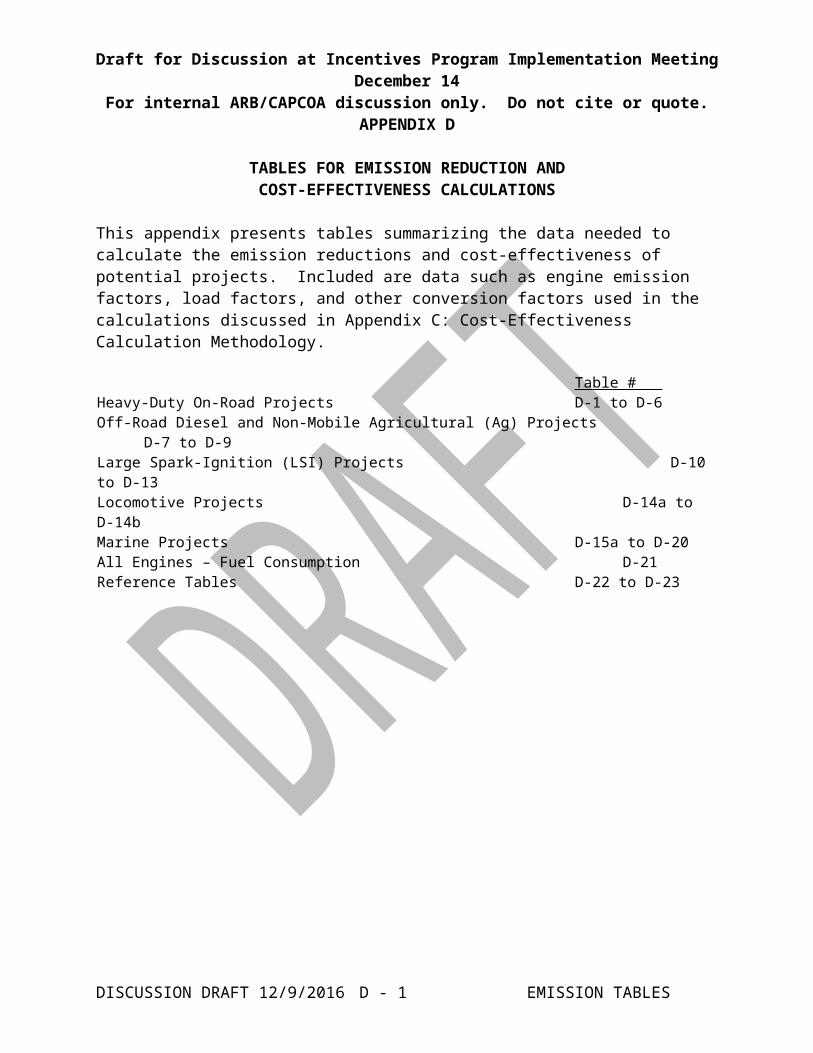
This appendix presents tables summarizing the data needed to calculate the emission reductions and cost-effectiveness of potential projects. Included are data such as engine emission factors, load factors, and other conversion factors used in the calculations discussed in Appendix C: Cost-Effectiveness Calculation Methodology.
Table # Heavy-Duty On-Road Projects D-1 to D-6Off-Road Diesel and Non-Mobile Agricultural (Ag) Projects D-7 to D-9Large Spark-Ignition (LSI) Projects D-10 to D-13Locomotive Projects D-14a to D-14bMarine Projects D-15a to D-20All Engines – Fuel Consumption D-21Reference Tables D-22 to D-23
DISCUSSION DRAFT 12/9/2016 D - 1 EMISSION TABLES
Draft for Discussion at Incentives Program Implementation Meeting December 14For internal ARB/CAPCOA discussion only. Do not cite or quote.
HEAVY DUTY ON-ROAD PROJECTS
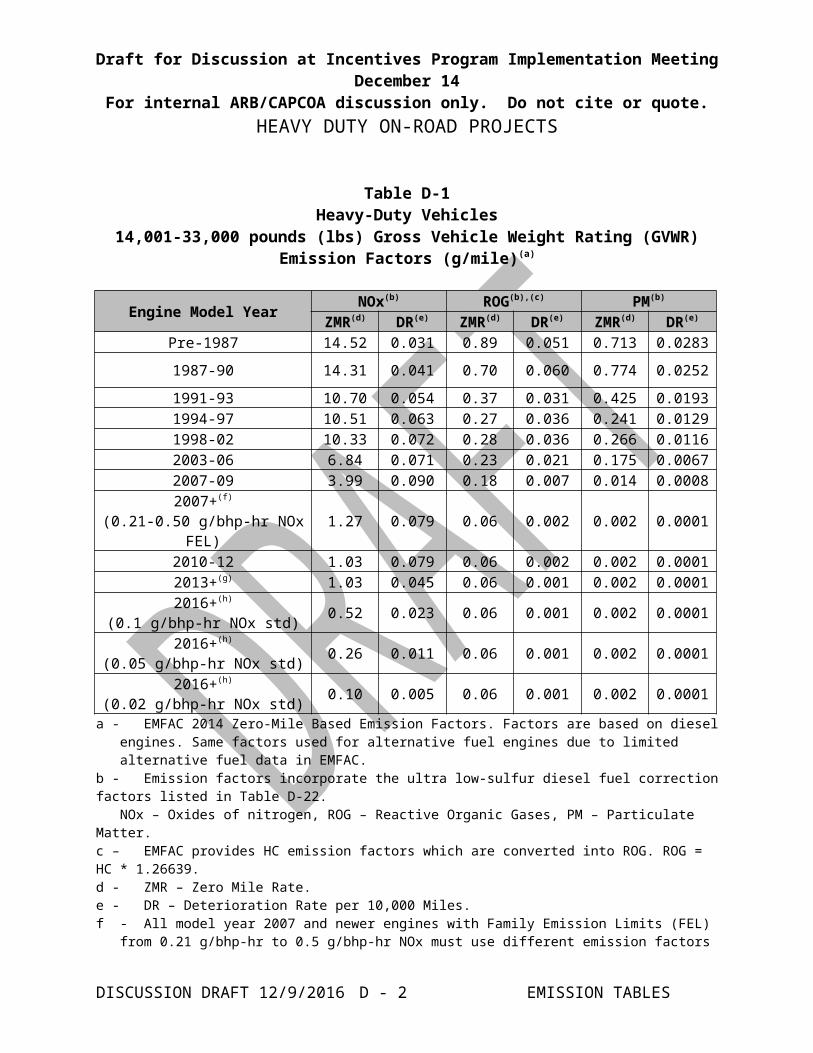
Table D-1Heavy-Duty Vehicles
14,001-33,000 pounds (lbs) Gross Vehicle Weight Rating (GVWR)Emission Factors (g/mile)(a)
Engine Model Year NOx(b) ROG(b),(c) PM(b)
ZMR(d) DR(e) ZMR(d) DR(e) ZMR(d) DR(e)
Pre-1987 14.52 0.031 0.89 0.051 0.713 0.0283
1987-90 14.31 0.041 0.70 0.060 0.774 0.0252
1991-93 10.70 0.054 0.37 0.031 0.425 0.01931994-97 10.51 0.063 0.27 0.036 0.241 0.01291998-02 10.33 0.072 0.28 0.036 0.266 0.01162003-06 6.84 0.071 0.23 0.021 0.175 0.00672007-09 3.99 0.090 0.18 0.007 0.014 0.00082007+(f)
(0.21-0.50 g/bhp-hr NOx FEL) 1.27 0.079 0.06 0.002 0.002 0.0001
2010-12 1.03 0.079 0.06 0.002 0.002 0.00012013+(g) 1.03 0.045 0.06 0.001 0.002 0.00012016+(h)
(0.1 g/bhp-hr NOx std) 0.52 0.023 0.06 0.001 0.002 0.0001
2016+(h)
(0.05 g/bhp-hr NOx std) 0.26 0.011 0.06 0.001 0.002 0.0001
2016+(h)
(0.02 g/bhp-hr NOx std) 0.10 0.005 0.06 0.001 0.002 0.0001
a - EMFAC 2014 Zero-Mile Based Emission Factors. Factors are based on diesel engines. Same factors used for alternative fuel engines due to limited alternative fuel data in EMFAC.
b - Emission factors incorporate the ultra low-sulfur diesel fuel correction factors listed in Table D-22.NOx – Oxides of nitrogen, ROG – Reactive Organic Gases, PM – Particulate Matter.
c – EMFAC provides HC emission factors which are converted into ROG. ROG = HC * 1.26639. d - ZMR – Zero Mile Rate.e - DR – Deterioration Rate per 10,000 Miles.f - All model year 2007 and newer engines with Family Emission Limits (FEL) from 0.21 g/bhp-hr to 0.5
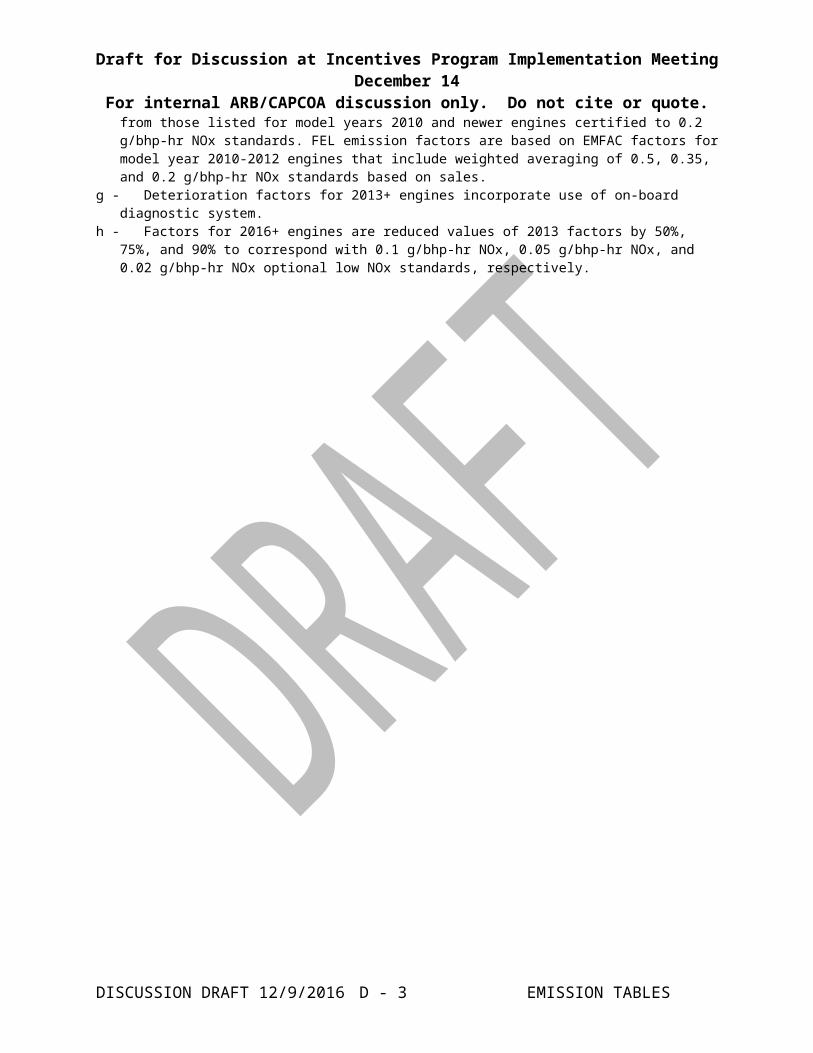
g/bhp-hr NOx must use different emission factors from those listed for model years 2010 and newer engines certified to 0.2 g/bhp-hr NOx standards. FEL emission factors are based on EMFAC factors for model year 2010-2012 engines that include weighted averaging of 0.5, 0.35, and 0.2 g/bhp-hr NOx standards based on sales.
g - Deterioration factors for 2013+ engines incorporate use of on-board diagnostic system. h - Factors for 2016+ engines are reduced values of 2013 factors by 50%, 75%, and 90% to correspond
with 0.1 g/bhp-hr NOx, 0.05 g/bhp-hr NOx, and 0.02 g/bhp-hr NOx optional low NOx standards, respectively.
DISCUSSION DRAFT 12/9/2016 D - 2 EMISSION TABLES
Draft for Discussion at Incentives Program Implementation Meeting December 14For internal ARB/CAPCOA discussion only. Do not cite or quote.
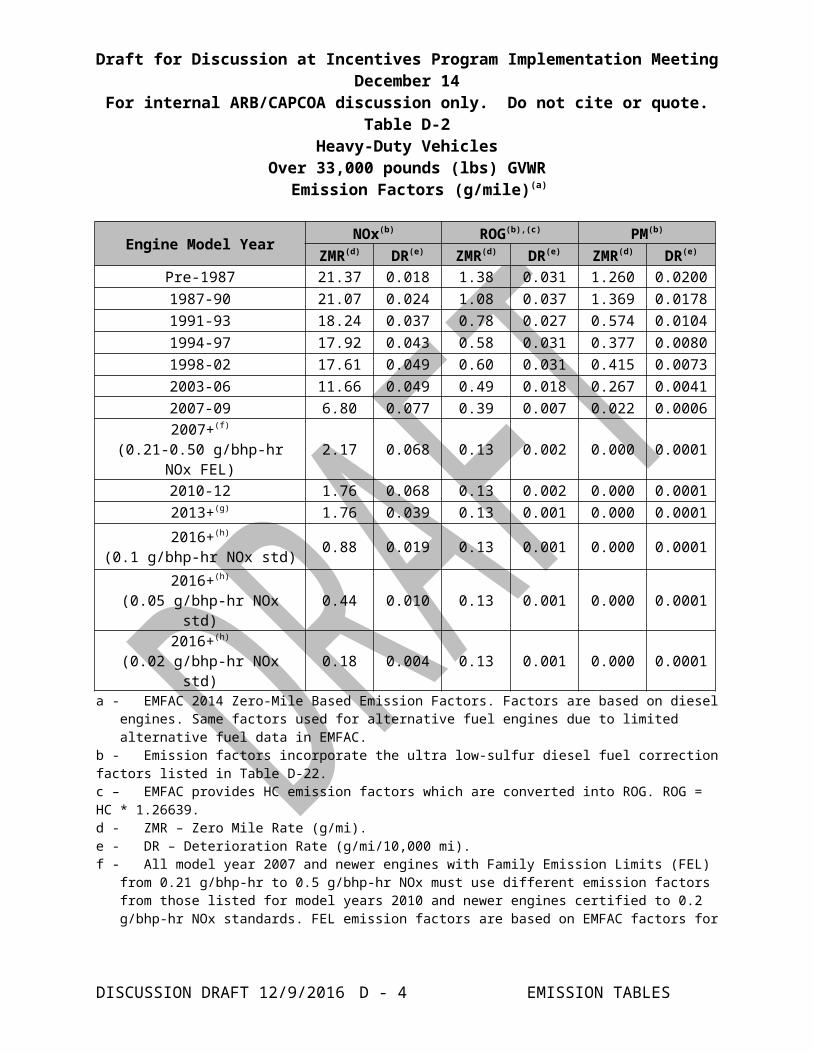
Table D-2Heavy-Duty Vehicles
Over 33,000 pounds (lbs) GVWREmission Factors (g/mile)(a)
Engine Model Year NOx(b) ROG(b),(c) PM(b)
ZMR(d) DR(e) ZMR(d) DR(e) ZMR(d) DR(e)
Pre-1987 21.37 0.018 1.38 0.031 1.260 0.02001987-90 21.07 0.024 1.08 0.037 1.369 0.01781991-93 18.24 0.037 0.78 0.027 0.574 0.01041994-97 17.92 0.043 0.58 0.031 0.377 0.00801998-02 17.61 0.049 0.60 0.031 0.415 0.00732003-06 11.66 0.049 0.49 0.018 0.267 0.00412007-09 6.80 0.077 0.39 0.007 0.022 0.0006
2007+(f)
(0.21-0.50 g/bhp-hr NOx FEL) 2.17 0.068 0.13 0.002 0.000 0.0001
2010-12 1.76 0.068 0.13 0.002 0.000 0.00012013+(g) 1.76 0.039 0.13 0.001 0.000 0.0001
2016+(h)
(0.1 g/bhp-hr NOx std) 0.88 0.019 0.13 0.001 0.000 0.0001
2016+(h)
(0.05 g/bhp-hr NOx std) 0.44 0.010 0.13 0.001 0.000 0.0001
2016+(h)
(0.02 g/bhp-hr NOx std) 0.18 0.004 0.13 0.001 0.000 0.0001
a - EMFAC 2014 Zero-Mile Based Emission Factors. Factors are based on diesel engines. Same factors used for alternative fuel engines due to limited alternative fuel data in EMFAC.
b - Emission factors incorporate the ultra low-sulfur diesel fuel correction factors listed in Table D-22.c – EMFAC provides HC emission factors which are converted into ROG. ROG = HC * 1.26639. d - ZMR – Zero Mile Rate (g/mi).e - DR – Deterioration Rate (g/mi/10,000 mi).f - All model year 2007 and newer engines with Family Emission Limits (FEL) from 0.21 g/bhp-hr to 0.5
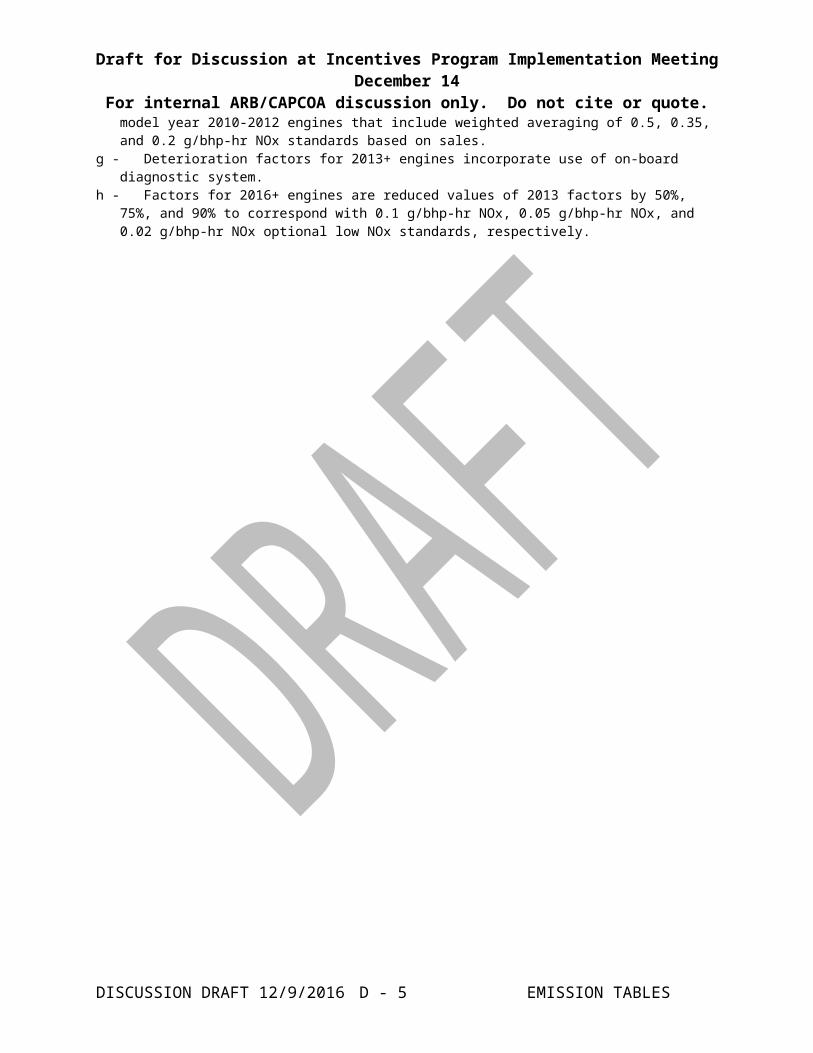
g/bhp-hr NOx must use different emission factors from those listed for model years 2010 and newer engines certified to 0.2 g/bhp-hr NOx standards. FEL emission factors are based on EMFAC factors for model year 2010-2012 engines that include weighted averaging of 0.5, 0.35, and 0.2 g/bhp-hr NOx standards based on sales.
g - Deterioration factors for 2013+ engines incorporate use of on-board diagnostic system.h - Factors for 2016+ engines are reduced values of 2013 factors by 50%, 75%, and 90% to correspond
with 0.1 g/bhp-hr NOx, 0.05 g/bhp-hr NOx, and 0.02 g/bhp-hr NOx optional low NOx standards, respectively.
DISCUSSION DRAFT 12/9/2016 D - 3 EMISSION TABLES
Draft for Discussion at Incentives Program Implementation Meeting December 14For internal ARB/CAPCOA discussion only. Do not cite or quote.
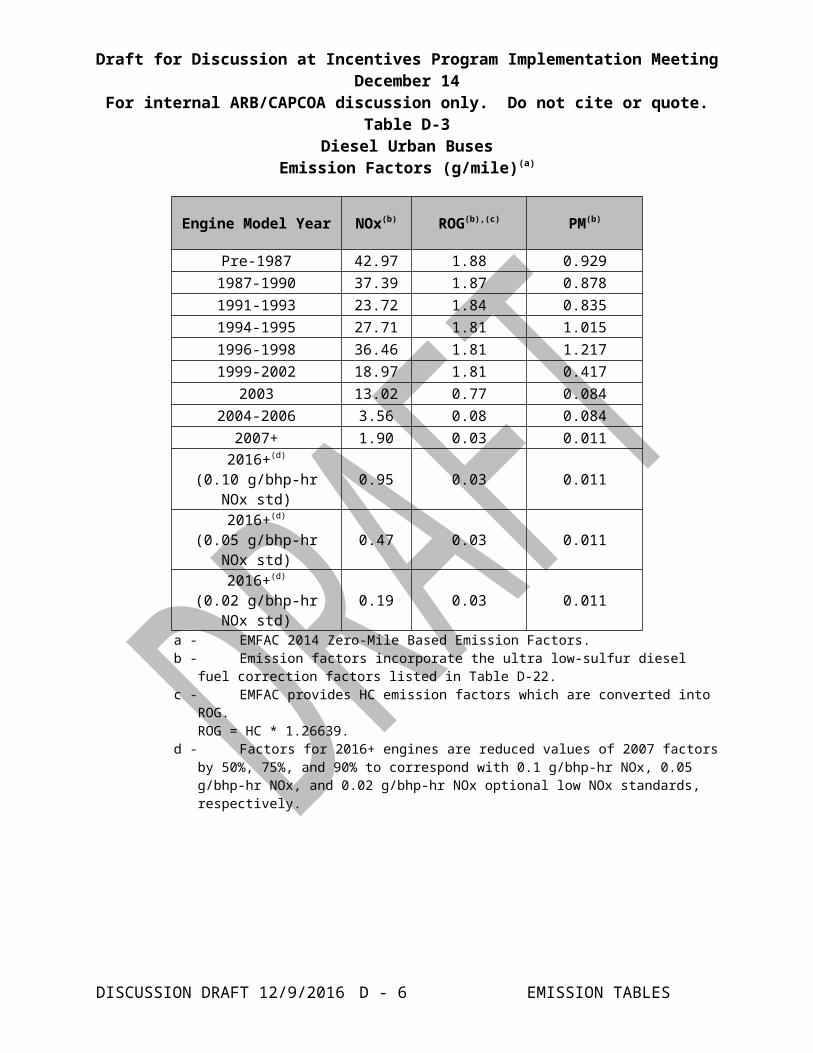
Table D-3Diesel Urban Buses
Emission Factors (g/mile)(a)
Engine Model Year NOx(b) ROG(b),(c) PM(b)
Pre-1987 42.97 1.88 0.9291987-1990 37.39 1.87 0.8781991-1993 23.72 1.84 0.8351994-1995 27.71 1.81 1.0151996-1998 36.46 1.81 1.2171999-2002 18.97 1.81 0.417
2003 13.02 0.77 0.0842004-2006 3.56 0.08 0.084
2007+ 1.90 0.03 0.0112016+(d)
(0.10 g/bhp-hr NOx std) 0.95 0.03 0.011
2016+(d)
(0.05 g/bhp-hr NOx std) 0.47 0.03 0.011
2016+(d)
(0.02 g/bhp-hr NOx std) 0.19 0.03 0.011
a - EMFAC 2014 Zero-Mile Based Emission Factors. b - Emission factors incorporate the ultra low-sulfur diesel fuel correction factors listed in
Table D-22.c - EMFAC provides HC emission factors which are converted into ROG.
ROG = HC * 1.26639.d - Factors for 2016+ engines are reduced values of 2007 factors by 50%, 75%, and 90% to
correspond with 0.1 g/bhp-hr NOx, 0.05 g/bhp-hr NOx, and 0.02 g/bhp-hr NOx optional low NOx standards, respectively.
DISCUSSION DRAFT 12/9/2016 D - 4 EMISSION TABLES
Draft for Discussion at Incentives Program Implementation Meeting December 14For internal ARB/CAPCOA discussion only. Do not cite or quote.
Table D-4Alternative Fuel Urban BusesEmission Factors (g/mile)(a)
Engine Model Year NOx ROG(b) PM
Pre-2003 21.60 2.68 0.0432003-06 15.40 3.87 0.0232007+ 0.65 0.04 0.001
2016+(c)
(0.1 g/bhp-hr NOx std) 0.33 0.04 0.001
2016+(c)
(0.05 g/bhp-hr NOx std) 0.16 0.04 0.001
2016+(c)
(0.02 g/bhp-hr NOx std) 0.07 0.04 0.001
a - EMFAC 2014 Zero-Mile Based Emission Factors.b - EMFAC provides HC emission factors which are converted into ROG.
ROG (Pre-2007 engines) = HC * 0.16137.ROG (2007+ engines) = HC * 0.013972.
c - Factors for 2016+ engines are reduced values of 2007 factors by 50%, 75%, and 90% to correspond with 0.1 g/bhp-hr NOx, 0.05 g/bhp-hr NOx, and 0.02 g/bhp-hr NOx optional low NOx standards, respectively.
DISCUSSION DRAFT 12/9/2016 D - 5 EMISSION TABLES
Draft for Discussion at Incentives Program Implementation Meeting December 14For internal ARB/CAPCOA discussion only. Do not cite or quote.
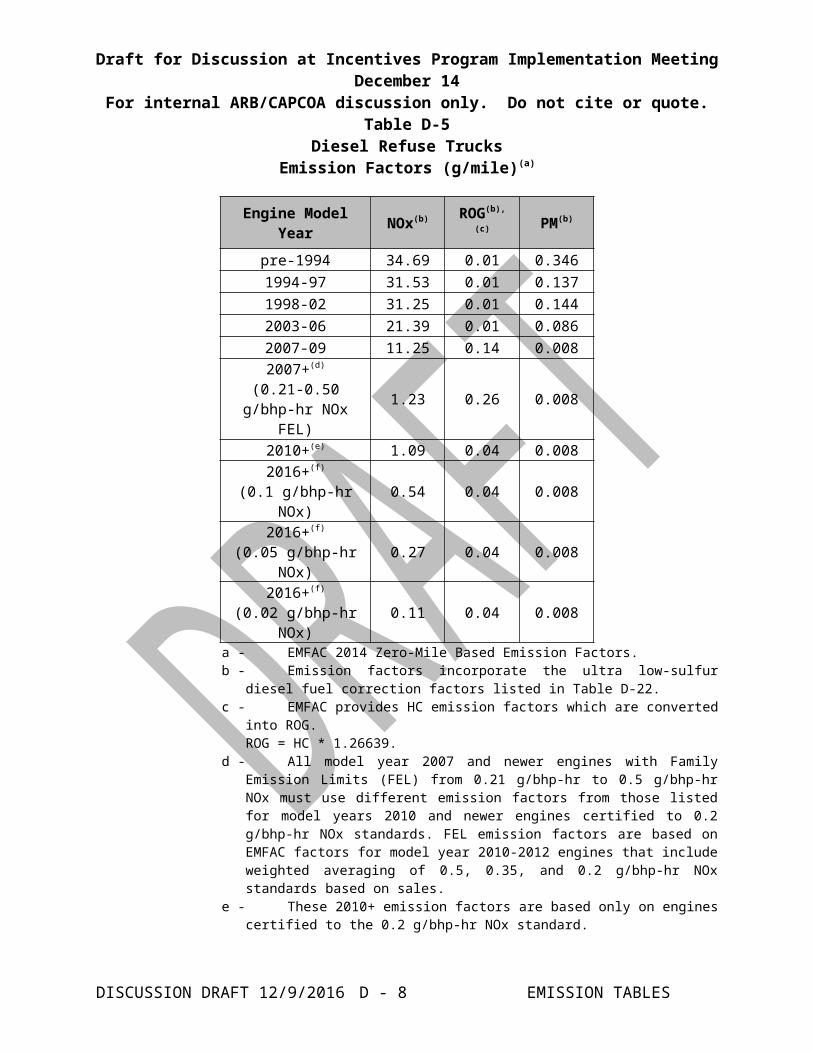
Table D-5Diesel Refuse Trucks
Emission Factors (g/mile)(a)
Engine Model Year NOx(b) ROG(b),(c) PM(b)
pre-1994 34.69 0.01 0.3461994-97 31.53 0.01 0.1371998-02 31.25 0.01 0.1442003-06 21.39 0.01 0.0862007-09 11.25 0.14 0.0082007+(d)
(0.21-0.50 g/bhp-hr NOx FEL)
1.23 0.26 0.008
2010+(e) 1.09 0.04 0.0082016+(f)
(0.1 g/bhp-hr NOx) 0.54 0.04 0.008
2016+(f)
(0.05 g/bhp-hr NOx) 0.27 0.04 0.008
2016+(f)
(0.02 g/bhp-hr NOx) 0.11 0.04 0.008
a - EMFAC 2014 Zero-Mile Based Emission Factors. b - Emission factors incorporate the ultra low-sulfur diesel fuel correction factors
listed in Table D-22.c - EMFAC provides HC emission factors which are converted into ROG.
ROG = HC * 1.26639.d - All model year 2007 and newer engines with Family Emission Limits (FEL) from
0.21 g/bhp-hr to 0.5 g/bhp-hr NOx must use different emission factors from those listed for model years 2010 and newer engines certified to 0.2 g/bhp-hr NOx standards. FEL emission factors are based on EMFAC factors for model year 2010-2012 engines that include weighted averaging of 0.5, 0.35, and 0.2 g/bhp-hr NOx standards based on sales.
e - These 2010+ emission factors are based only on engines certified to the 0.2 g/bhp-hr NOx standard.
f - Factors for 2016+ engines are reduced values of 2013 factors by 50%, 75%, and 90% to correspond with 0.1 g/bhp-hr NOx, 0.05 g/bhp-hr NOx, and 0.02 g/bhp-hr NOx optional low NOx standards, respectively.
DISCUSSION DRAFT 12/9/2016 D - 6 EMISSION TABLES

Draft for Discussion at Incentives Program Implementation Meeting December 14For internal ARB/CAPCOA discussion only. Do not cite or quote.
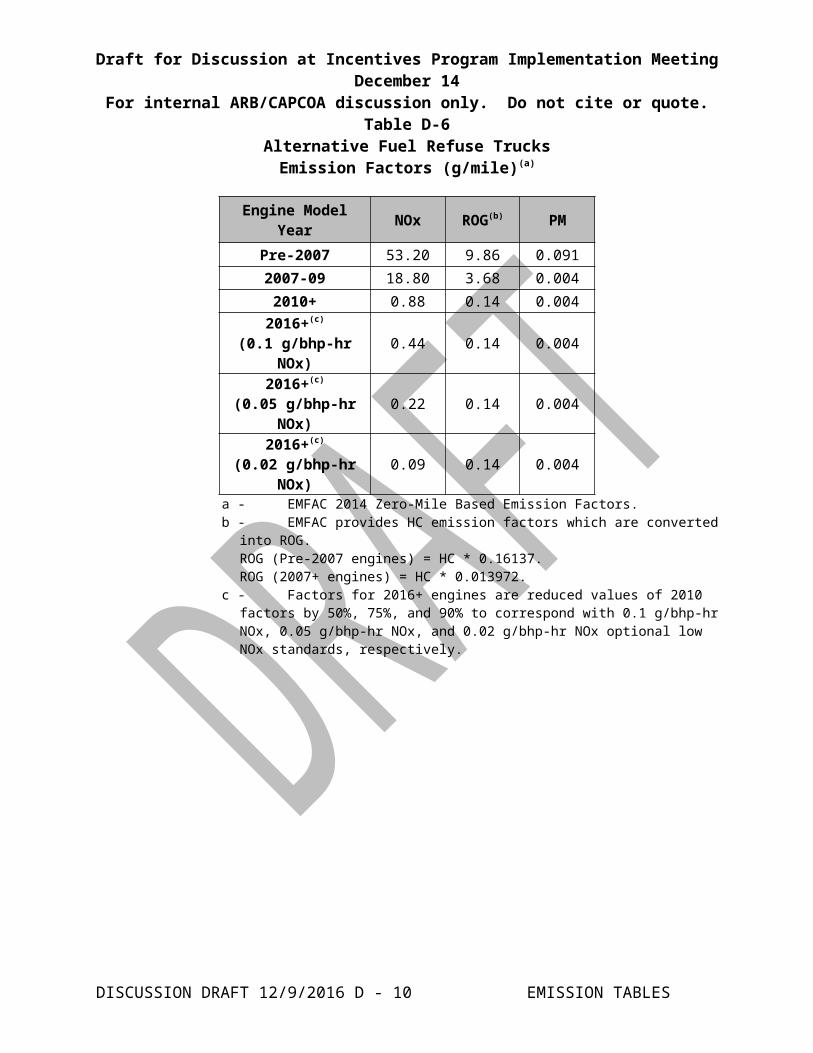
Table D-6Alternative Fuel Refuse Trucks
Emission Factors (g/mile)(a)
Engine Model Year NOx ROG(b) PM
Pre-2007 53.20 9.86 0.0912007-09 18.80 3.68 0.0042010+ 0.88 0.14 0.004
2016+(c)
(0.1 g/bhp-hr NOx) 0.44 0.14 0.004
2016+(c)
(0.05 g/bhp-hr NOx) 0.22 0.14 0.004
2016+(c)
(0.02 g/bhp-hr NOx) 0.09 0.14 0.004
a - EMFAC 2014 Zero-Mile Based Emission Factors.b - EMFAC provides HC emission factors which are converted into ROG.
ROG (Pre-2007 engines) = HC * 0.16137.ROG (2007+ engines) = HC * 0.013972.
c - Factors for 2016+ engines are reduced values of 2010 factors by 50%, 75%, and 90% to correspond with 0.1 g/bhp-hr NOx, 0.05 g/bhp-hr NOx, and 0.02 g/bhp-hr NOx optional low NOx standards, respectively.
DISCUSSION DRAFT 12/9/2016 D - 7 EMISSION TABLES
Draft for Discussion at Incentives Program Implementation Meeting December 14For internal ARB/CAPCOA discussion only. Do not cite or quote.
OFF-ROAD PROJECTS ANDNON-MOBILE AGRICULTURAL PROJECTS
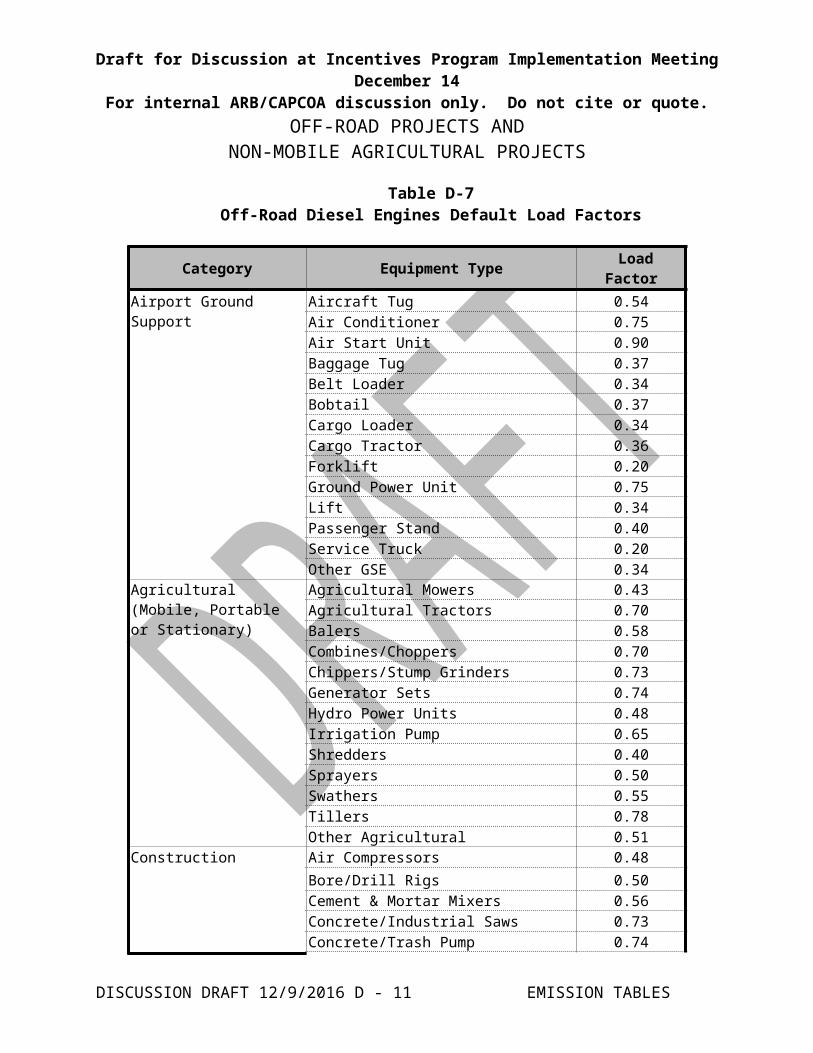
Table D-7Off-Road Diesel Engines Default Load Factors
Category Equipment Type Load Factor
Airport Ground Support Aircraft Tug 0.54Air Conditioner 0.75Air Start Unit 0.90Baggage Tug 0.37Belt Loader 0.34Bobtail 0.37Cargo Loader 0.34Cargo Tractor 0.36Forklift 0.20Ground Power Unit 0.75Lift 0.34Passenger Stand 0.40Service Truck 0.20Other GSE 0.34
Agricultural (Mobile, Portable or Stationary)
Agricultural Mowers 0.43Agricultural Tractors 0.70Balers 0.58Combines/Choppers 0.70Chippers/Stump Grinders 0.73Generator Sets 0.74Hydro Power Units 0.48Irrigation Pump 0.65Shredders 0.40Sprayers 0.50Swathers 0.55Tillers 0.78Other Agricultural 0.51
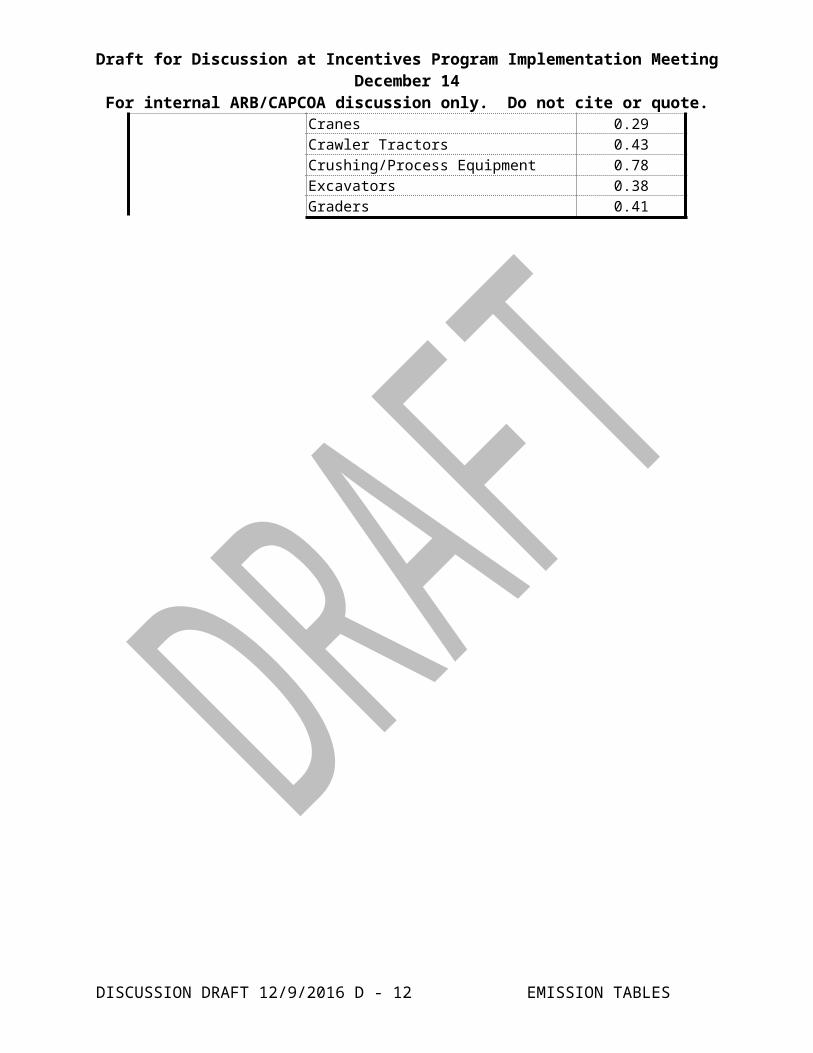
Construction Air Compressors 0.48Bore/Drill Rigs 0.50Cement & Mortar Mixers 0.56Concrete/Industrial Saws 0.73Concrete/Trash Pump 0.74Cranes 0.29Crawler Tractors 0.43Crushing/Process Equipment 0.78Excavators 0.38Graders 0.41
DISCUSSION DRAFT 12/9/2016 D - 8 EMISSION TABLES
Draft for Discussion at Incentives Program Implementation Meeting December 14For internal ARB/CAPCOA discussion only. Do not cite or quote.
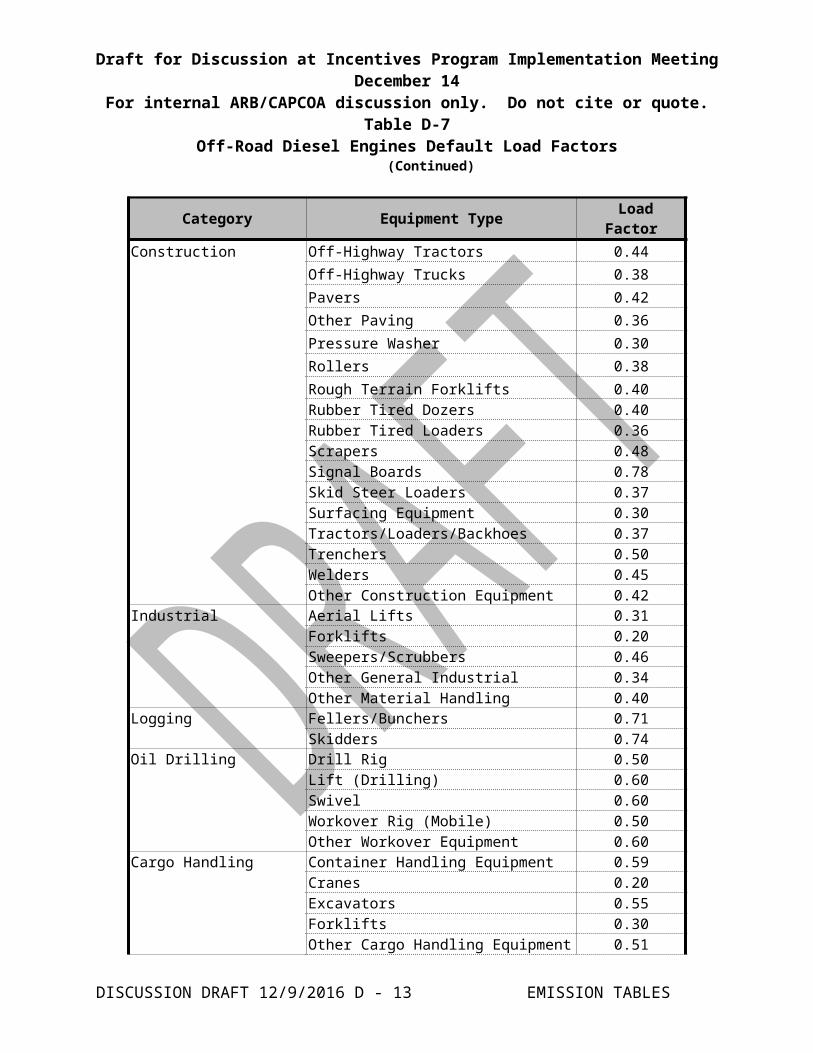
Table D-7Off-Road Diesel Engines Default Load Factors
(Continued)
Category Equipment Type Load Factor
Construction Off-Highway Tractors 0.44Off-Highway Trucks 0.38Pavers 0.42Other Paving 0.36Pressure Washer 0.30Rollers 0.38Rough Terrain Forklifts 0.40Rubber Tired Dozers 0.40Rubber Tired Loaders 0.36Scrapers 0.48Signal Boards 0.78Skid Steer Loaders 0.37Surfacing Equipment 0.30Tractors/Loaders/Backhoes 0.37Trenchers 0.50Welders 0.45Other Construction Equipment 0.42
Industrial Aerial Lifts 0.31Forklifts 0.20Sweepers/Scrubbers 0.46Other General Industrial 0.34Other Material Handling 0.40
Logging Fellers/Bunchers 0.71Skidders 0.74
Oil Drilling Drill Rig 0.50Lift (Drilling) 0.60Swivel 0.60Workover Rig (Mobile) 0.50Other Workover Equipment 0.60
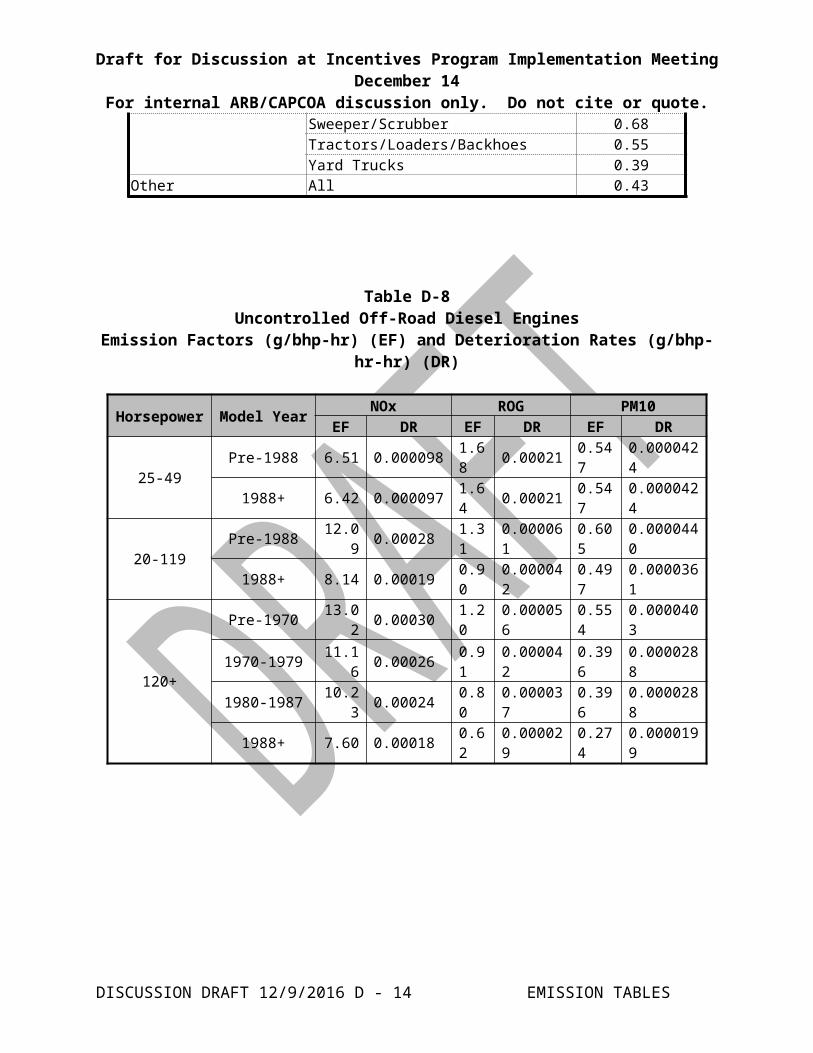
Cargo Handling Container Handling Equipment 0.59Cranes 0.20Excavators 0.55Forklifts 0.30Other Cargo Handling Equipment 0.51Sweeper/Scrubber 0.68Tractors/Loaders/Backhoes 0.55Yard Trucks 0.39
Other All 0.43
DISCUSSION DRAFT 12/9/2016 D - 9 EMISSION TABLES
Draft for Discussion at Incentives Program Implementation Meeting December 14For internal ARB/CAPCOA discussion only. Do not cite or quote.
Table D-8Uncontrolled Off-Road Diesel Engines
Emission Factors (g/bhp-hr) (EF) and Deterioration Rates (g/bhp-hr-hr) (DR)
Horsepower Model YearNOx ROG PM10
EF DR EF DR EF DR
25-49Pre-1988 6.51 0.000098 1.6
8 0.00021 0.547 0.0000424
1988+ 6.42 0.000097 1.64 0.00021 0.547 0.0000424
20-119Pre-1988 12.09 0.00028 1.3
1 0.000061 0.605 0.0000440
1988+ 8.14 0.00019 0.90 0.000042 0.497 0.0000361
120+
Pre-1970 13.02 0.00030 1.20 0.000056 0.554 0.0000403
1970-1979 11.16 0.00026 0.91 0.000042 0.396 0.0000288
1980-1987 10.23 0.00024 0.80 0.000037 0.396 0.0000288
1988+ 7.60 0.00018 0.62 0.000029 0.274 0.0000199
DISCUSSION DRAFT 12/9/2016 D - 10 EMISSION TABLES
Draft for Discussion at Incentives Program Implementation Meeting December 14For internal ARB/CAPCOA discussion only. Do not cite or quote.
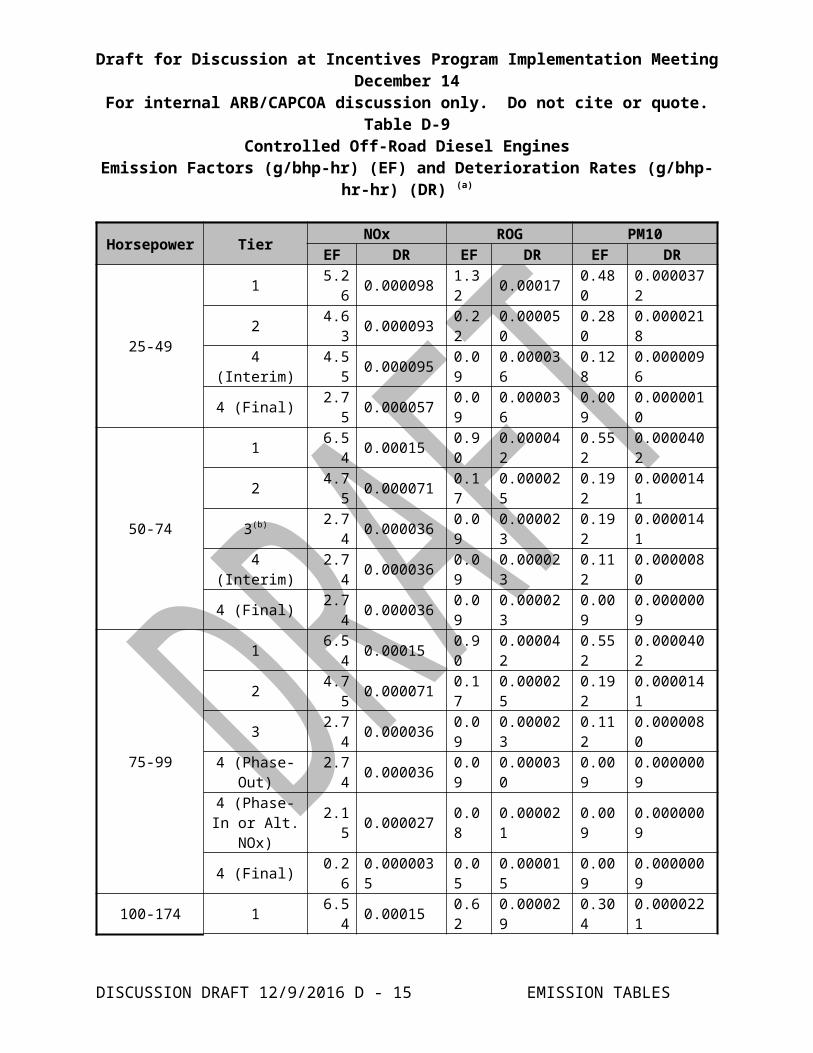
Table D-9Controlled Off-Road Diesel Engines
Emission Factors (g/bhp-hr) (EF) and Deterioration Rates (g/bhp-hr-hr) (DR) (a)
Horsepower TierNOx ROG PM10
EF DR EF DR EF DR
25-49
1 5.26 0.000098 1.32 0.00017 0.480 0.0000372
2 4.63 0.000093 0.22 0.000050 0.280 0.0000218
4 (Interim) 4.55 0.000095 0.09 0.000036 0.128 0.0000096
4 (Final) 2.75 0.000057 0.09 0.000036 0.009 0.0000010
50-74
1 6.54 0.00015 0.90 0.000042 0.552 0.0000402
2 4.75 0.000071 0.17 0.000025 0.192 0.0000141
3(b) 2.74 0.000036 0.09 0.000023 0.192 0.0000141
4 (Interim) 2.74 0.000036 0.09 0.000023 0.112 0.0000080
4 (Final) 2.74 0.000036 0.09 0.000023 0.009 0.0000009
75-99
1 6.54 0.00015 0.90 0.000042 0.552 0.0000402
2 4.75 0.000071 0.17 0.000025 0.192 0.0000141
3 2.74 0.000036 0.09 0.000023 0.112 0.00000804 (Phase-
Out) 2.74 0.000036 0.09 0.000030 0.009 0.0000009
4 (Phase-In or Alt. NOx) 2.15 0.000027 0.08 0.000021 0.009 0.0000009
4 (Final) 0.26 0.0000035 0.05 0.000015 0.009 0.0000009
100-174
1 6.54 0.00015 0.62 0.000029 0.304 0.0000221
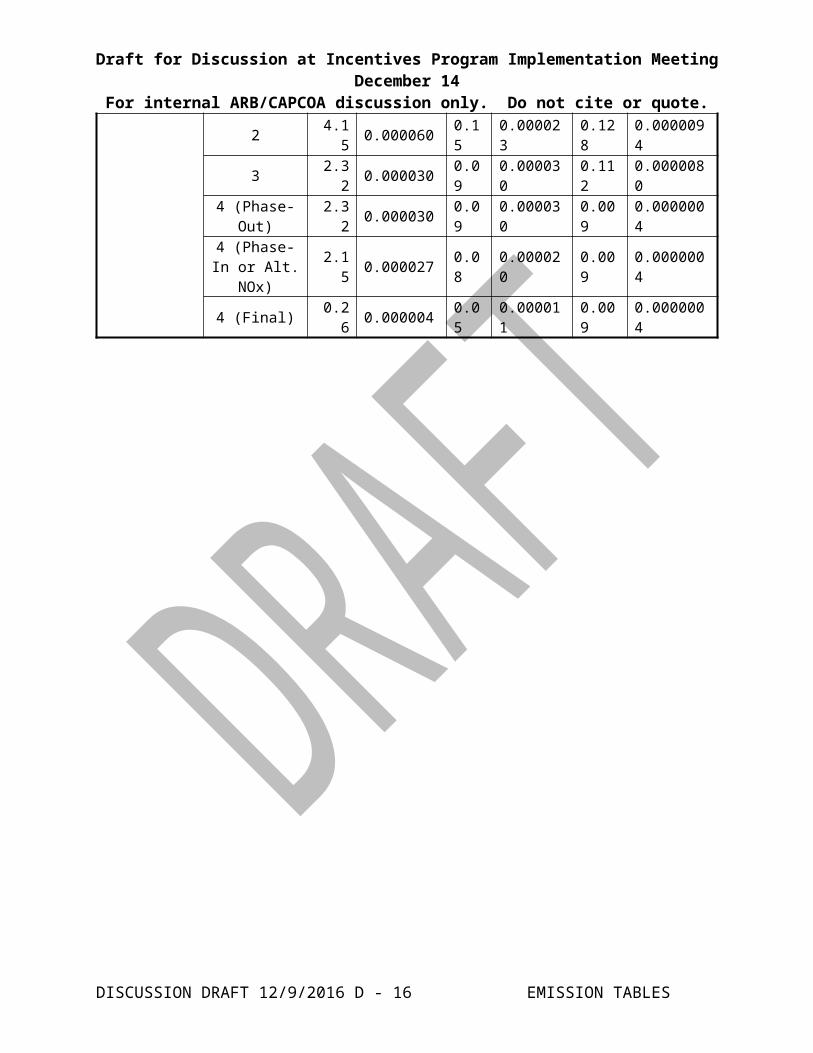
2 4.15 0.000060 0.15 0.000023 0.128 0.00000943 2.32 0.000030 0.09 0.000030 0.112 0.0000080
4 (Phase-Out) 2.32 0.000030 0.09 0.000030 0.009 0.0000004
4 (Phase-In or Alt. NOx) 2.15 0.000027 0.08 0.000020 0.009 0.0000004
4 (Final) 0.26 0.000004 0.05 0.000011 0.009 0.0000004
DISCUSSION DRAFT 12/9/2016 D - 11 EMISSION TABLES
Draft for Discussion at Incentives Program Implementation Meeting December 14For internal ARB/CAPCOA discussion only. Do not cite or quote.
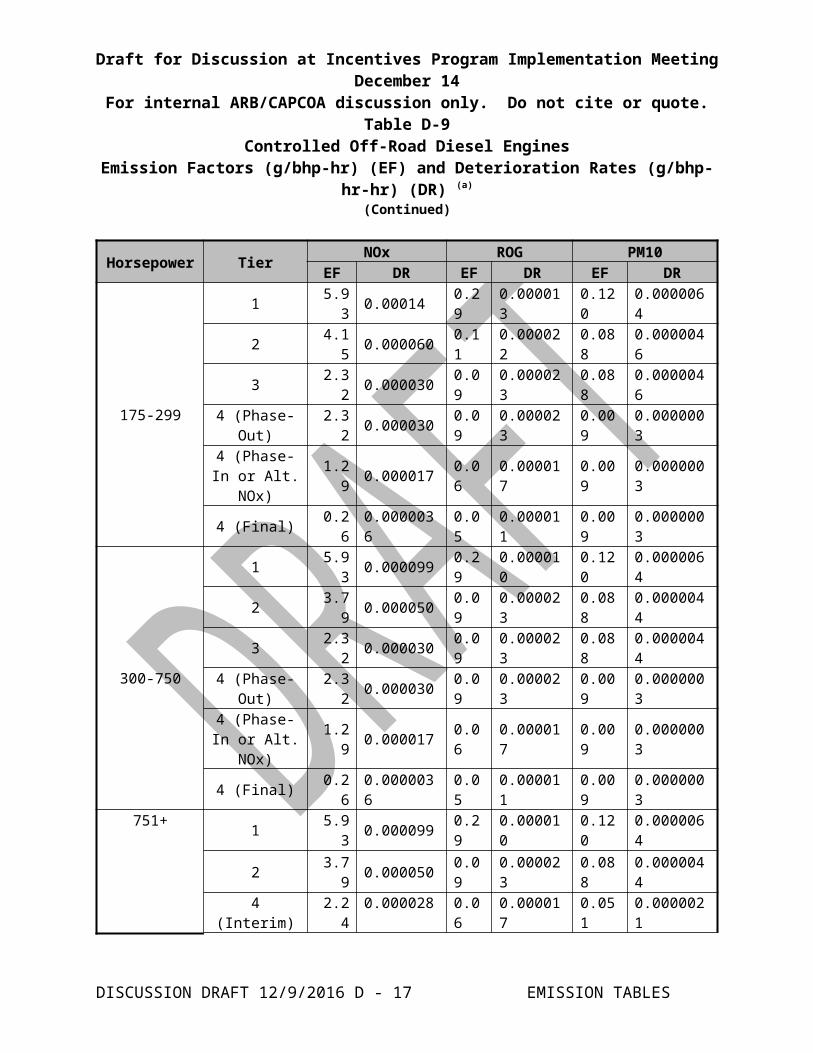
Table D-9Controlled Off-Road Diesel Engines
Emission Factors (g/bhp-hr) (EF) and Deterioration Rates (g/bhp-hr-hr) (DR) (a)
(Continued)
Horsepower TierNOx ROG PM10
EF DR EF DR EF DR
175-299
1 5.93 0.00014 0.29 0.000013 0.120 0.0000064
2 4.15 0.000060 0.11 0.000022 0.088 0.0000046
3 2.32 0.000030 0.09 0.000023 0.088 0.00000464 (Phase-
Out) 2.32 0.000030 0.09 0.000023 0.009 0.0000003
4 (Phase-In or Alt. NOx) 1.29 0.000017 0.06 0.000017 0.009 0.0000003
4 (Final) 0.26 0.0000036 0.05 0.000011 0.009 0.0000003
300-750
1 5.93 0.000099 0.29 0.000010 0.120 0.0000064
2 3.79 0.000050 0.09 0.000023 0.088 0.0000044
3 2.32 0.000030 0.09 0.000023 0.088 0.00000444 (Phase-
Out) 2.32 0.000030 0.09 0.000023 0.009 0.0000003
4 (Phase-In or Alt. NOx) 1.29 0.000017 0.06 0.000017 0.009 0.0000003
4 (Final) 0.26 0.0000036 0.05 0.000011 0.009 0.0000003
751+
1 5.93 0.000099 0.29 0.000010 0.120 0.0000064
2 3.79 0.000050 0.09 0.000023 0.088 0.00000444 (Interim) 2.24 0.000028 0.06 0.000017 0.051 0.0000021
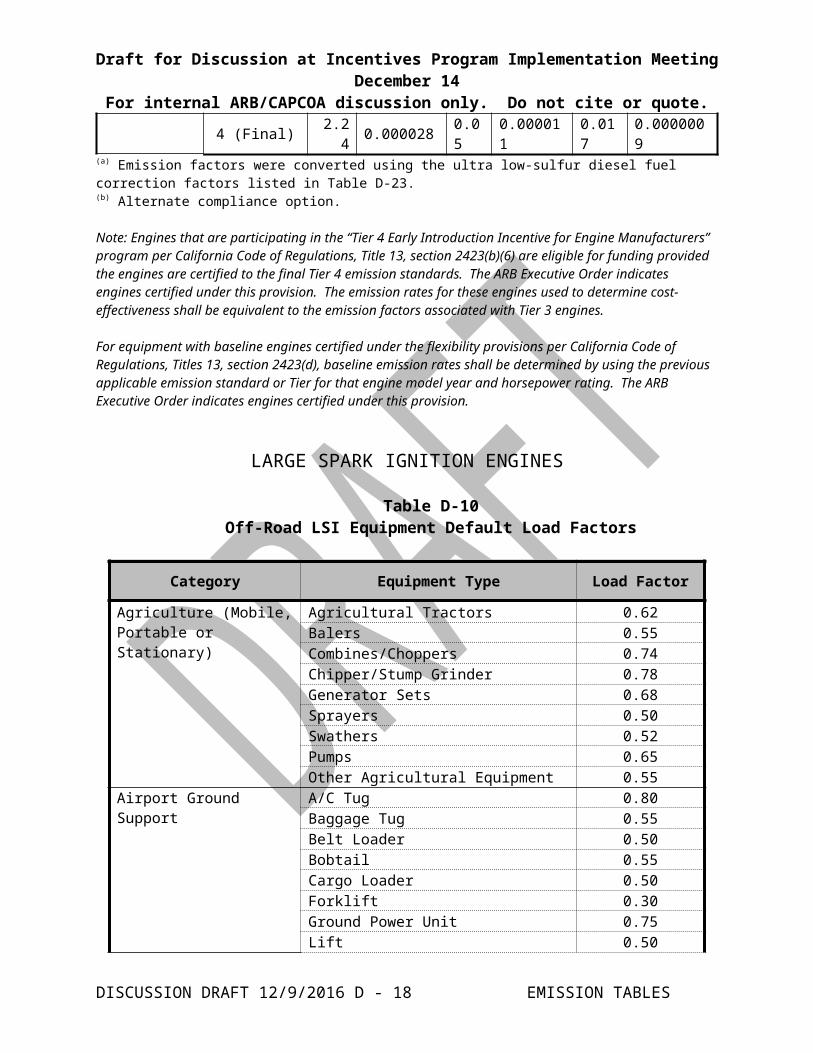
4 (Final) 2.24 0.000028 0.05 0.000011 0.017 0.0000009(a) Emission factors were converted using the ultra low-sulfur diesel fuel correction factors listed in Table D-23.(b) Alternate compliance option.
Note: Engines that are participating in the “Tier 4 Early Introduction Incentive for Engine Manufacturers” program per California Code of Regulations, Title 13, section 2423(b)(6) are eligible for funding provided the engines are certified to the final Tier 4 emission standards. The ARB Executive Order indicates engines certified under this provision. The emission rates for these engines used to determine cost-effectiveness shall be equivalent to the emission factors associated with Tier 3 engines.
For equipment with baseline engines certified under the flexibility provisions per California Code of Regulations, Titles 13, section 2423(d), baseline emission rates shall be determined by using the previous applicable emission standard or Tier for that engine model year and horsepower rating. The ARB Executive Order indicates engines certified under this provision.
LARGE SPARK IGNITION ENGINES
DISCUSSION DRAFT 12/9/2016 D - 12 EMISSION TABLES
Draft for Discussion at Incentives Program Implementation Meeting December 14For internal ARB/CAPCOA discussion only. Do not cite or quote.
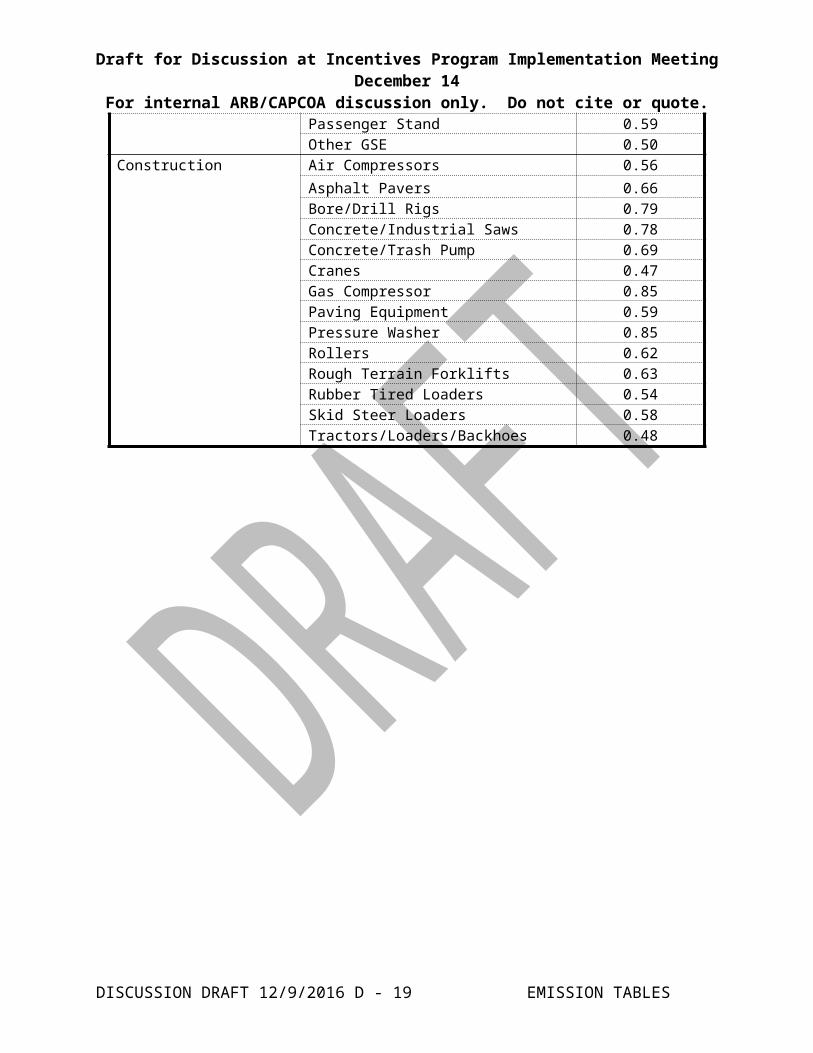
Table D-10Off-Road LSI Equipment Default Load Factors
Category Equipment Type Load Factor
Agriculture (Mobile, Portable or Stationary)
Agricultural Tractors 0.62Balers 0.55Combines/Choppers 0.74Chipper/Stump Grinder 0.78Generator Sets 0.68Sprayers 0.50Swathers 0.52Pumps 0.65Other Agricultural Equipment 0.55
Airport Ground Support A/C Tug 0.80Baggage Tug 0.55Belt Loader 0.50Bobtail 0.55Cargo Loader 0.50Forklift 0.30Ground Power Unit 0.75Lift 0.50Passenger Stand 0.59Other GSE 0.50
Construction Air Compressors 0.56Asphalt Pavers 0.66Bore/Drill Rigs 0.79Concrete/Industrial Saws 0.78Concrete/Trash Pump 0.69Cranes 0.47Gas Compressor 0.85Paving Equipment 0.59Pressure Washer 0.85Rollers 0.62Rough Terrain Forklifts 0.63Rubber Tired Loaders 0.54Skid Steer Loaders 0.58Tractors/Loaders/Backhoes 0.48
DISCUSSION DRAFT 12/9/2016 D - 13 EMISSION TABLES
Draft for Discussion at Incentives Program Implementation Meeting December 14For internal ARB/CAPCOA discussion only. Do not cite or quote.
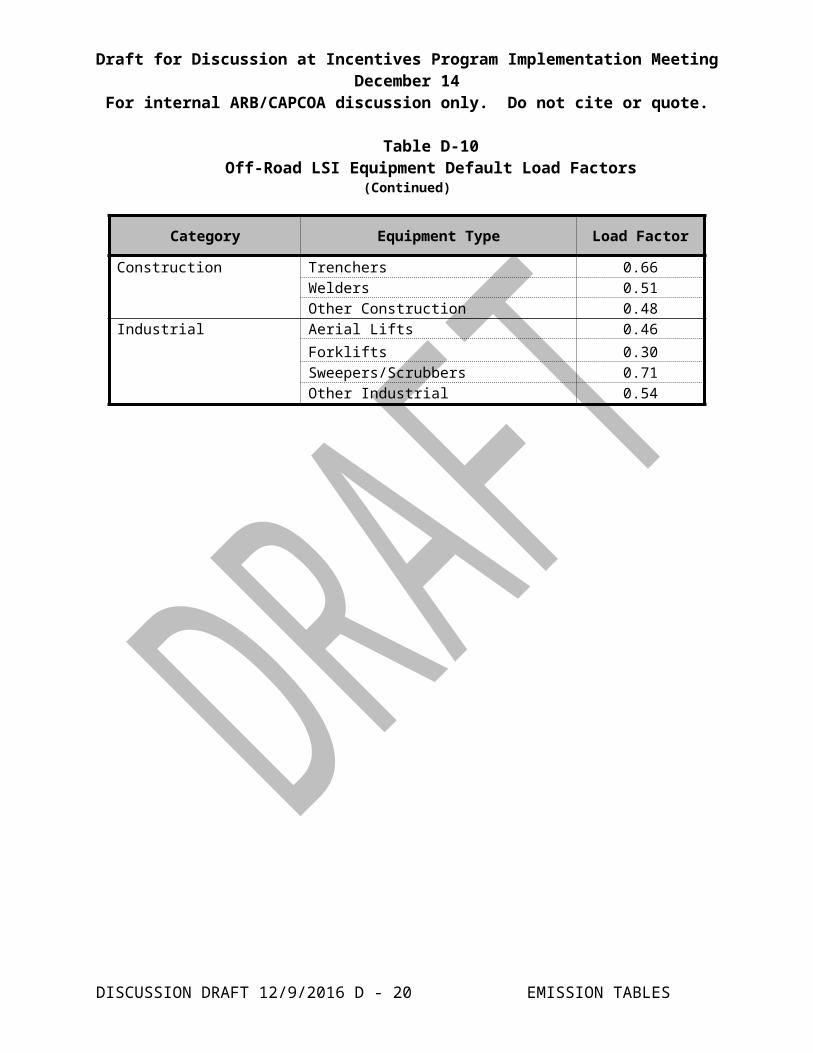
Table D-10Off-Road LSI Equipment Default Load Factors
(Continued)
Category Equipment Type Load Factor
Construction Trenchers 0.66Welders 0.51Other Construction 0.48
Industrial Aerial Lifts 0.46Forklifts 0.30Sweepers/Scrubbers 0.71Other Industrial 0.54
DISCUSSION DRAFT 12/9/2016 D - 14 EMISSION TABLES
Draft for Discussion at Incentives Program Implementation Meeting December 14For internal ARB/CAPCOA discussion only. Do not cite or quote.
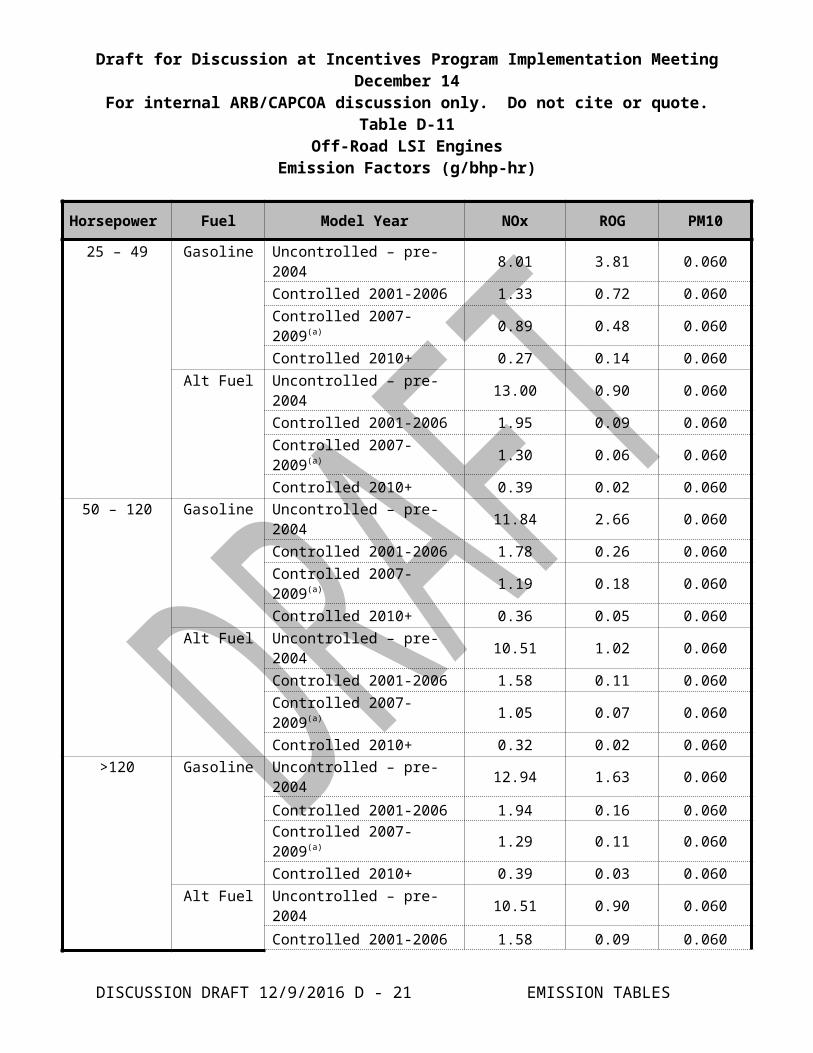
Table D-11Off-Road LSI Engines
Emission Factors (g/bhp-hr)
Horsepower Fuel Model Year NOx ROG PM10
25 – 49 Gasoline Uncontrolled – pre-2004 8.01 3.81 0.060Controlled 2001-2006 1.33 0.72 0.060
Controlled 2007-2009(a) 0.89 0.48 0.060
Controlled 2010+ 0.27 0.14 0.060Alt Fuel Uncontrolled – pre-2004 13.00 0.90 0.060
Controlled 2001-2006 1.95 0.09 0.060
Controlled 2007-2009(a) 1.30 0.06 0.060
Controlled 2010+ 0.39 0.02 0.06050 – 120 Gasoline Uncontrolled – pre-2004 11.84 2.66 0.060
Controlled 2001-2006 1.78 0.26 0.060
Controlled 2007-2009(a) 1.19 0.18 0.060
Controlled 2010+ 0.36 0.05 0.060Alt Fuel Uncontrolled – pre-2004 10.51 1.02 0.060
Controlled 2001-2006 1.58 0.11 0.060
Controlled 2007-2009(a) 1.05 0.07 0.060
Controlled 2010+ 0.32 0.02 0.060>120 Gasoline Uncontrolled – pre-2004 12.94 1.63 0.060
Controlled 2001-2006 1.94 0.16 0.060Controlled 2007-2009(a) 1.29 0.11 0.060
Controlled 2010+ 0.39 0.03 0.060Alt Fuel Uncontrolled – pre-2004 10.51 0.90 0.060
Controlled 2001-2006 1.58 0.09 0.060
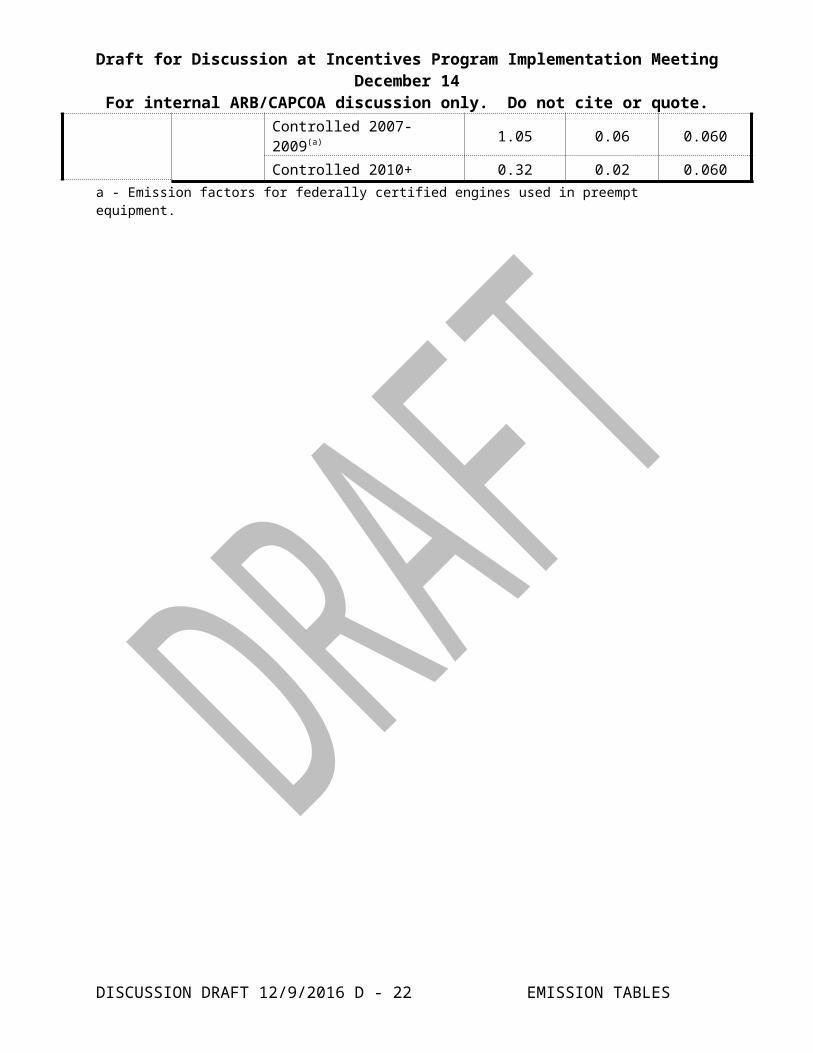
Controlled 2007-2009(a) 1.05 0.06 0.060
Controlled 2010+ 0.32 0.02 0.060a - Emission factors for federally certified engines used in preempt equipment.
DISCUSSION DRAFT 12/9/2016 D - 15 EMISSION TABLES
Draft for Discussion at Incentives Program Implementation Meeting December 14For internal ARB/CAPCOA discussion only. Do not cite or quote.
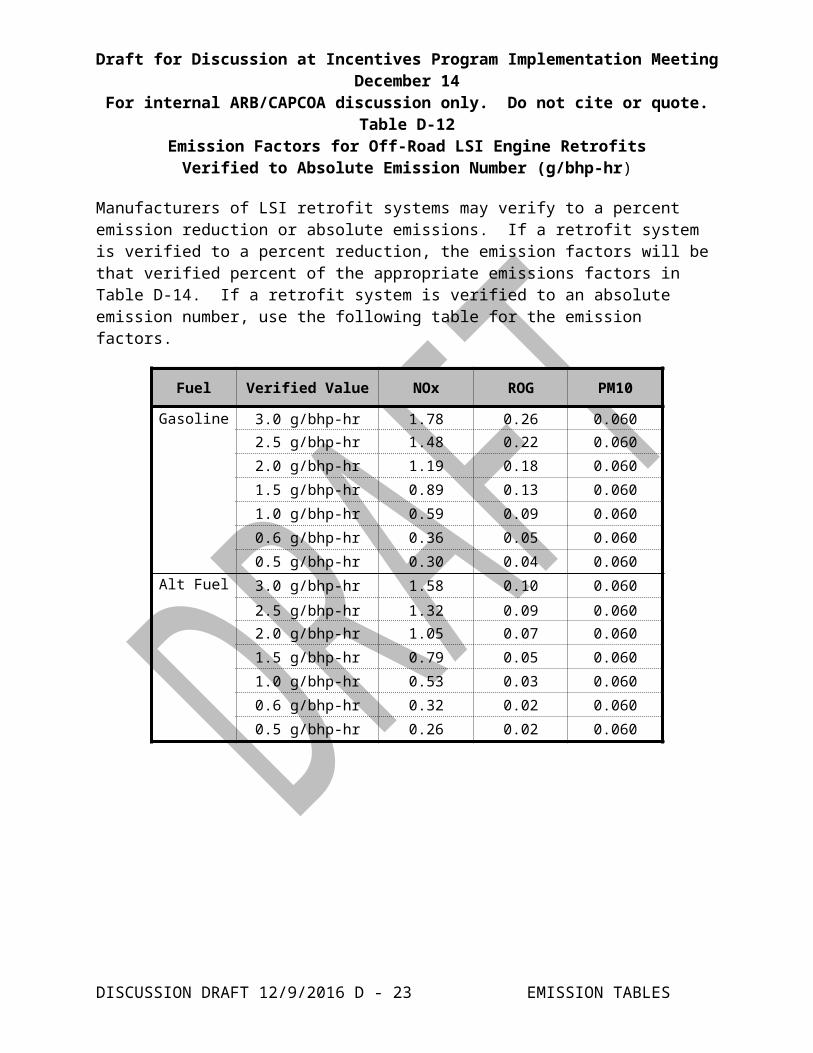
Table D-12Emission Factors for Off-Road LSI Engine Retrofits
Verified to Absolute Emission Number (g/bhp-hr)
Manufacturers of LSI retrofit systems may verify to a percent emission reduction or absolute emissions. If a retrofit system is verified to a percent reduction, the emission factors will be that verified percent of the appropriate emissions factors in Table D-14. If a retrofit system is verified to an absolute emission number, use the following table for the emission factors.
Fuel Verified Value NOx ROG PM10
Gasoline 3.0 g/bhp-hr 1.78 0.26 0.0602.5 g/bhp-hr 1.48 0.22 0.060
2.0 g/bhp-hr 1.19 0.18 0.060
1.5 g/bhp-hr 0.89 0.13 0.060
1.0 g/bhp-hr 0.59 0.09 0.060
0.6 g/bhp-hr 0.36 0.05 0.060
0.5 g/bhp-hr 0.30 0.04 0.060Alt Fuel 3.0 g/bhp-hr 1.58 0.10 0.060
2.5 g/bhp-hr 1.32 0.09 0.0602.0 g/bhp-hr 1.05 0.07 0.060
1.5 g/bhp-hr 0.79 0.05 0.060
1.0 g/bhp-hr 0.53 0.03 0.060
0.6 g/bhp-hr 0.32 0.02 0.060
0.5 g/bhp-hr 0.26 0.02 0.060
DISCUSSION DRAFT 12/9/2016 D - 16 EMISSION TABLES
Draft for Discussion at Incentives Program Implementation Meeting December 14For internal ARB/CAPCOA discussion only. Do not cite or quote.
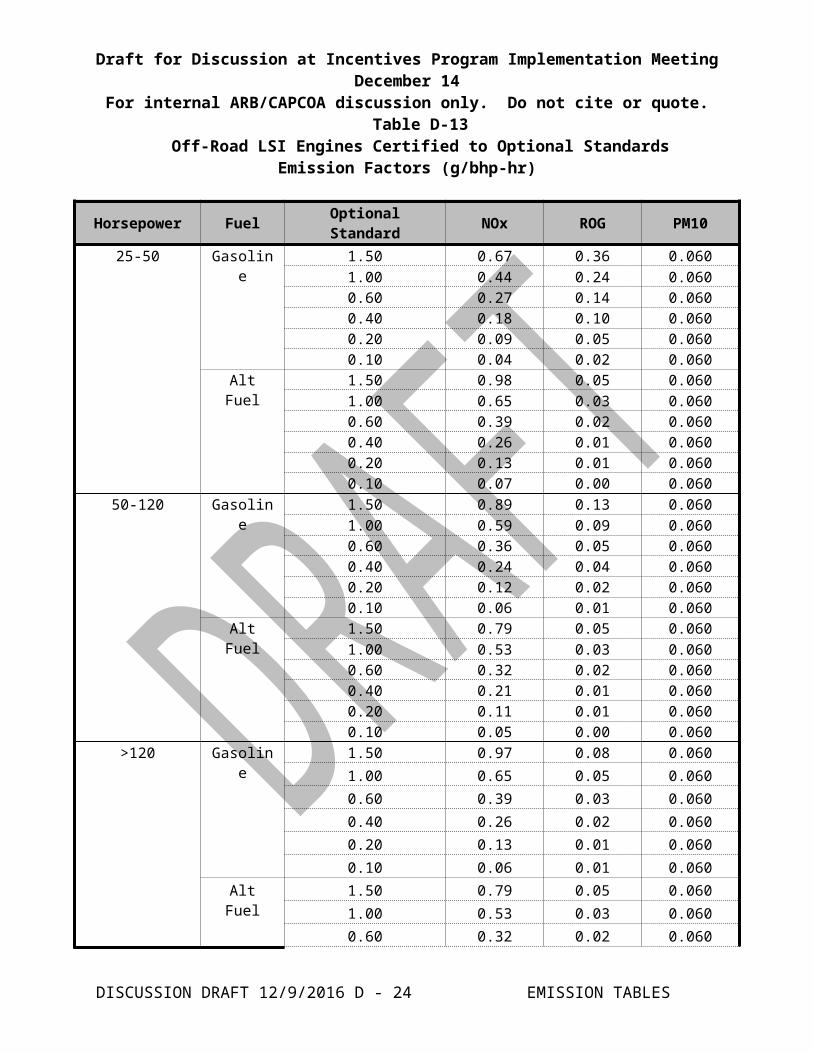
Table D-13Off-Road LSI Engines Certified to Optional Standards
Emission Factors (g/bhp-hr)
Horsepower Fuel Optional Standard NOx ROG PM10
25-50 Gasoline 1.50 0.67 0.36 0.0601.00 0.44 0.24 0.0600.60 0.27 0.14 0.0600.40 0.18 0.10 0.0600.20 0.09 0.05 0.0600.10 0.04 0.02 0.060
Alt Fuel 1.50 0.98 0.05 0.0601.00 0.65 0.03 0.0600.60 0.39 0.02 0.0600.40 0.26 0.01 0.0600.20 0.13 0.01 0.0600.10 0.07 0.00 0.060
50-120 Gasoline 1.50 0.89 0.13 0.0601.00 0.59 0.09 0.0600.60 0.36 0.05 0.0600.40 0.24 0.04 0.0600.20 0.12 0.02 0.0600.10 0.06 0.01 0.060
Alt Fuel 1.50 0.79 0.05 0.0601.00 0.53 0.03 0.0600.60 0.32 0.02 0.0600.40 0.21 0.01 0.0600.20 0.11 0.01 0.0600.10 0.05 0.00 0.060
>120 Gasoline 1.50 0.97 0.08 0.0601.00 0.65 0.05 0.0600.60 0.39 0.03 0.0600.40 0.26 0.02 0.0600.20 0.13 0.01 0.0600.10 0.06 0.01 0.060
Alt Fuel 1.50 0.79 0.05 0.0601.00 0.53 0.03 0.0600.60 0.32 0.02 0.0600.40 0.21 0.01 0.0600.20 0.11 0.01 0.0600.10 0.05 0.00 0.060
DISCUSSION DRAFT 12/9/2016 D - 17 EMISSION TABLES
Draft for Discussion at Incentives Program Implementation Meeting December 14For internal ARB/CAPCOA discussion only. Do not cite or quote.
LOCOMOTIVES
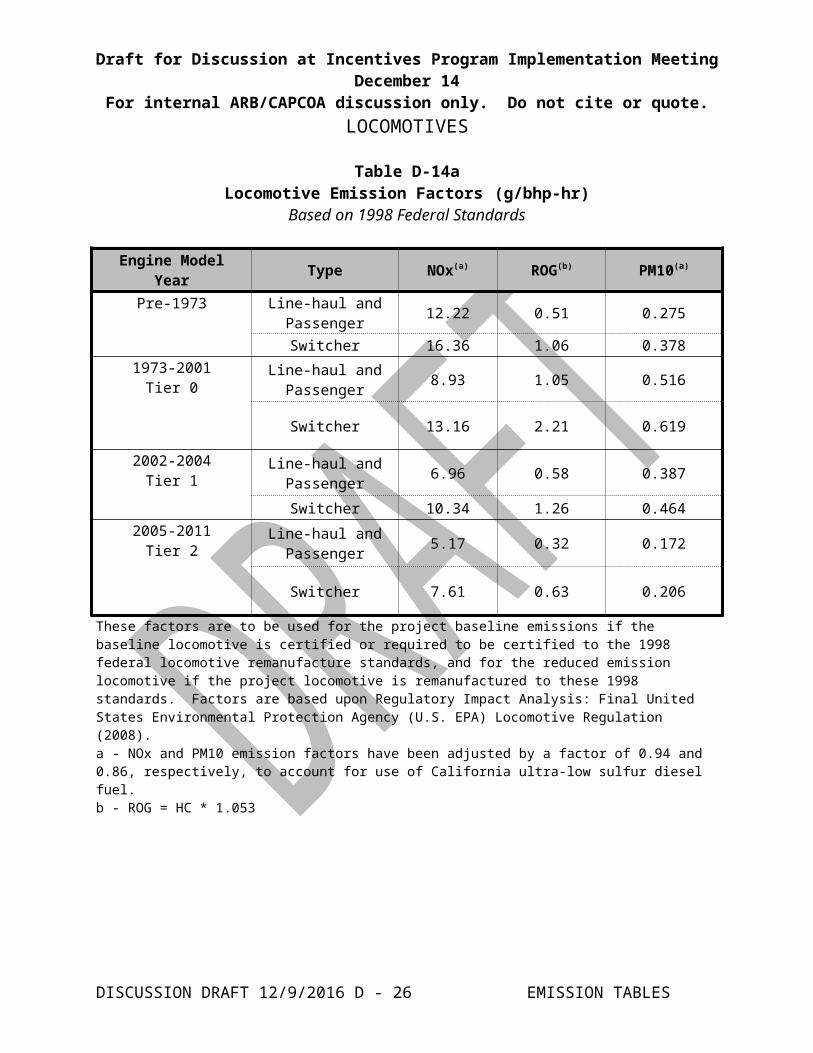
Table D-14aLocomotive Emission Factors (g/bhp-hr)
Based on 1998 Federal Standards
Engine Model Year Type NOx(a) ROG(b) PM10(a)
Pre-1973 Line-haul and Passenger 12.22 0.51 0.275
Switcher 16.36 1.06 0.3781973-2001
Tier 0Line-haul and
Passenger 8.93 1.05 0.516
Switcher 13.16 2.21 0.619
2002-2004Tier 1
Line-haul and Passenger 6.96 0.58 0.387
Switcher 10.34 1.26 0.4642005-2011
Tier 2Line-haul and
Passenger 5.17 0.32 0.172
Switcher 7.61 0.63 0.206
These factors are to be used for the project baseline emissions if the baseline locomotive is certified or required to be certified to the 1998 federal locomotive remanufacture standards, and for the reduced emission locomotive if the project locomotive is remanufactured to these 1998 standards. Factors are based upon Regulatory Impact Analysis: Final United States Environmental Protection Agency (U.S. EPA) Locomotive Regulation (2008).a - NOx and PM10 emission factors have been adjusted by a factor of 0.94 and 0.86, respectively, to account for use of California ultra-low sulfur diesel fuel.b - ROG = HC * 1.053
DISCUSSION DRAFT 12/9/2016 D - 18 EMISSION TABLES
Draft for Discussion at Incentives Program Implementation Meeting December 14For internal ARB/CAPCOA discussion only. Do not cite or quote.
Table D-14bLocomotive Emission Factors (g/bhp-hr)
Based on 2008 Federal Standards
Engine Model Year Type NOx(a) ROG(b) PM10(a)
1973-2001Tier 0+
Line-haul and Passenger 6.96 0.58 0.189
Switcher 11.09 2.21 0.2242002-2004
Tier 1+Line-haul and
Passenger 6.96 0.58 0.189
Switcher 10.34 1.26 0.2242005-2011
Tier 2+Line-haul and
Passenger 5.17 0.32 0.086
Switcher 7.61 0.63 0.1122011-2014
Tier 3Line-haul and
Passenger 5.17 0.32 0.086
Switcher 4.70 0.63 0.086
2015Tier 4
Line-haul and Passenger 1.22 0.15 0.026
Switcher 1.22 0.15 0.026These factors are to be used for the project baseline emissions if the baseline locomotive is certified or required to be certified to the new (2008) federal locomotive remanufacture standards, and for the reduced emission locomotive if the project locomotive is remanufactured to the new standards or meets Tier 3 standards. Factors are based upon Regulatory Impact Analysis: Final U.S. EPA Locomotive Regulation (2008).a - NOx and PM10 emission factors have been adjusted by a factor of 0.94 and 0.86, respectively, to account for use of California ultra-low sulfur diesel fuel.b - ROG = HC * 1.053
DISCUSSION DRAFT 12/9/2016 D - 19 EMISSION TABLES
Draft for Discussion at Incentives Program Implementation Meeting December 14For internal ARB/CAPCOA discussion only. Do not cite or quote.
MARINE VESSELS
Table D-15aUncontrolled Harbor Craft Propulsion Engine
Emission Factors (g/bhp-hr)
Horsepower Model Year NOx ROG PM10
25-50 All 7.57 1.32 0.52051-120 pre-1997 14.27 1.04 0.575
1997+ 9.70 0.71 0.524121-250 pre-1971 15.36 0.95 0.527
1971-1978 14.27 0.79 0.451
1979-1983 13.17 0.72 0.376
1984+ 12.07 0.68 0.376251+ pre-1971 15.36 0.91 0.506
1971-1978 14.27 0.76 0.431
1979-1983 13.17 0.68 0.363
1984-1994 12.07 0.65 0.363251-750 1995+ 8.97 0.49 0.260
751+ 1995+ 12.07 0.60 0.363
DISCUSSION DRAFT 12/9/2016 D - 20 EMISSION TABLES
Draft for Discussion at Incentives Program Implementation Meeting December 14For internal ARB/CAPCOA discussion only. Do not cite or quote.
Table D-15bControlled Harbor Craft Propulsion Engine
Emission Factors (g/bhp-hr)
Horsepower Tier NOx ROG PM10
25-50 1 6.93 1.30 0.5802 5.04 1.30 0.240
3 5.04 1.30 0.17651-120 1 6.93 0.71 0.524
2 5.04 0.71 0.240
3 5.04 0.71 0.176121-175 1 8.97 0.49 0.290
2 4.84 0.49 0.176
3 3.60 0.49 0.077176-750 1 8.97 0.49 0.290
2 4.84 0.49 0.120
3 3.87 0.49 0.068751-1900 1 8.97 0.49 0.290
2 5.24 0.49 0.160
3 3.87 0.49 0.0681901 + 1 8.97 0.49 0.290
2 5.24 0.49 0.1603 4.14 0.49 0.085
Table D-16Tier 4 Harbor Craft Propulsion Engine
Emission Standards (g/bhp-hr)
Model Year Horsepower Tier NOx ROG PM10
2016+ 805-4960 4 1.34 .142 .030(Not applicable for engines using FEL or ABT for compliance)
Table D-17a
DISCUSSION DRAFT 12/9/2016 D - 21 EMISSION TABLES
Draft for Discussion at Incentives Program Implementation Meeting December 14For internal ARB/CAPCOA discussion only. Do not cite or quote.
Uncontrolled Harbor Craft Auxiliary Engine Emission Factors (g/bhp-hr)
Horsepower Model Year NOx ROG PM10
25-50 all 6.42 1.58 0.46051-120 pre-1997 12.09 1.23 0.508
1997+ 8.14 0.85 0.417121-250 pre-1971 13.02 1.13 0.466
1971-1978 12.09 0.94 0.399
1979-1983 11.16 0.86 0.333
1984-1995 10.23 0.82 0.333
1996+ 7.75 0.59 0.255251-750 pre-1971 13.02 1.08 0.448
1971-1978 12.09 0.90 0.381
1979-1983 11.16 0.81 0.321
1984-1994 10.23 0.77 0.321
1995+ 7.60 0.58 0.230751 + pre-1971 13.02 1.08 0.448
1971-1978 12.09 0.90 0.3811979-1986 11.16 0.81 0.321
1987-1998 10.23 0.72 0.321
1999+ 7.75 0.58 0.255
DISCUSSION DRAFT 12/9/2016 D - 22 EMISSION TABLES
Draft for Discussion at Incentives Program Implementation Meeting December 14For internal ARB/CAPCOA discussion only. Do not cite or quote.
Table D-17bControlled Harbor Craft Auxiliary Engine
Emission Factors (g/bhp-hr)
Horsepower Tier NOx ROG PM10
25-50 1 6.54 1.54 0.5112 5.04 1.54 0.240
3 5.04 1.54 0.17651-120 1 6.93 0.85 0.464
2 5.04 0.85 0.240
3 5.04 0.85 0.176121-175 1 6.93 0.58 0.255
2 4.84 0.58 0.176
3 3.60 0.58 0.077176-750 1 6.93 0.58 0.255
2 4.84 0.58 0.120
3 3.78 0.58 0.068751-1900 1 6.93 0.58 0.255
2 5.24 0.58 0.160
3 3.87 0.58 0.0681901 + 1 6.93 0.58 0.255
2 5.24 0.58 0.1603 4.14 0.58 0.085
DISCUSSION DRAFT 12/9/2016 D - 23 EMISSION TABLES
Draft for Discussion at Incentives Program Implementation Meeting December 14For internal ARB/CAPCOA discussion only. Do not cite or quote.
Table D-18Harbor Craft Load Factors
Vessel Type Propulsion Engine Auxiliary Engine
Charter Fishing 0.52
0.43
Commercial Fishing 0.27Ferry/Excursion 0.42
Pilot 0.51Tow 0.68Work 0.45Other 0.52
Barge/Dredge 0.45 0.65Crew & Supply 0.38 0.32
Tug 0.50 0.31
DISCUSSION DRAFT 12/9/2016 D - 24 EMISSION TABLES
Draft for Discussion at Incentives Program Implementation Meeting December 14For internal ARB/CAPCOA discussion only. Do not cite or quote.
Table D-19Shore Power
Default Emission Rates (Grams per kilowatt-hour (g/kW-hr))Pollutant Emission Rate
NOx 13.9ROG 0.49
PM10 (marine gas oil fuel with 0.11- 0.5 % sulfur content)
0.38
PM10 (marine gas oil fuel with <= 0.10 % sulfur content)
0.25
Table D-20Shore Power
Default Power Requirements
Ship CategoryShip Size / Type Default
(Twenty-foot Equivalent Unit (TEU))
Power Requirement (kW)
Container Vessel <1,000 1,0001,000 – 1,999 1,3002,000 – 2,999 1,6003,000 – 3,999 1,9004,000 – 4,999 2,2005,000 – 5,999 2,3006,000 – 6,999 2,5007,000 – 7,999 2,9008,000 – 9,999 3,300
10,000 – 12,000 3,700Passenger Vessel No Default Value – Use Actual Power Requirement(a)
Reefer Break Bulk 1,300Fully containerized 3,300
a - The average power requirement for passenger vessels is 7,400 kW (ARB Oceangoing Vessel Survey, 2005).
DISCUSSION DRAFT 12/9/2016 D - 25 EMISSION TABLES
Draft for Discussion at Incentives Program Implementation Meeting December 14For internal ARB/CAPCOA discussion only. Do not cite or quote.
ALL ENGINES
Table D-21Fuel Consumption Rate Factors (bhp-hr/gal)
Category Horsepower/Application Fuel Consumption Rate
Non-Mobile Agricultural Engines
ALL 17.5
Locomotive Line Haul and Passenger (Class I/II)
20.8
Line Haul and Passenger (Class III)
18.2
Switcher 15.2
Other < 750 hp 18.5
> 750 hp 20.8
REFERENCESThe information in these tables has already been incorporated into the preceding emission factor tables. These tables are included for informational purposes.
Table D-22Fuel Correction FactorsOn-Road Diesel Engines
Model Year NOx PM10 HC
Pre- 2007 0.93 0.72 0.722007+ 0.93 0.80 0.72
Table D-23Fuel Correction FactorsOff-Road Diesel Engines Model Year NOx PM10
Pre-Tier 1 0.930 0.720Tier 1+ 0.948 0.800
DISCUSSION DRAFT 12/9/2016 D - 26 EMISSION TABLES