THE CAPITALISATION OF INTANGIBLES DEBATE: SOFTWARE ...
72
THE CAPITALISATION OF INTANGIBLES DEBATE: SOFTWARE DEVELOPMENT COSTS ACCA AND ADAM SMITH BUSINESS SCHOOL RESEARCH REPORT
Transcript of THE CAPITALISATION OF INTANGIBLES DEBATE: SOFTWARE ...
THE CAPITALISATION OF INTANGIBLES DEBATE: SOFTWARE DEVELOPMENT COSTS
ACCA AND ADAM SMITH BUSINESS SCHOOL RESEARCH REPORT
© 2021 Association of Chartered Certified Accountants and the University of Glasgow June 2021
About ACCA ACCA is the Association of Chartered Certified Accountants. We’re a thriving global community of 227,000 members and 544,000 future members based in 176 countries that upholds the highest professional and ethical values.
We believe that accountancy is a cornerstone profession of society that supports both public and private sectors. That’s why we’re committed to the development of a strong global accountancy profession and the many benefits that this brings to society and individuals.
Since 1904 being a force for public good has been embedded in our purpose. And because we’re a not-for-profit organisation, we build a sustainable global profession by re-investing our surplus to deliver member value and develop the profession for the next generation.
Through our world leading ACCA Qualification, we offer everyone everywhere the opportunity to experience a rewarding career in accountancy, finance and management. And using our respected research, we lead the profession by answering today’s questions and preparing us for tomorrow.
Find out more about us at www.accaglobal.com
About the Adam Smith Business School The University of Glasgow includes among its alumni, the father of economics, Adam Smith. The Adam Smith Business School is named in his honour. We aim to follow his legacy by developing enlightened, engaged and enterprising graduates, who are internationally recognised and make a positive impact on culture and society. Our business is about creating inspiring leaders, researchers and professionals whose research and relations with industry have real impact, influencing organisations as they develop and grow globally.
The Adam Smith Business School has the triple crown of accreditation as it is accredited by the Association to Advance Collegiate Schools of Business (AACSB International), the European Quality Improvement System (EQUIS) and the Association of MBAs (AMBA) for its MBA programme.
The School is home to research, of international and national excellence, that contributes to theoretical advancement and is relevant to practice. Two more recent examples reflecting this are the School’s contribution to the Productivity Institute and the Adam Smith Observatory of Corporate Reporting Practices. The Productivity Institute will directly inform government policy to improve UK productivity. The Observatory is comprised of an international network of researchers in accounting with practice-based experience. It aims at providing accounting standard setters and regulators across the world with evidence-based inputs, such as this report, when the evidence is timely and directly relevant to the issues they tackle.
Find out more about us at www.gla.ac.uk/schools/business/aboutus/

For further information, please contact:Richard Martin, Head of Corporate Reporting, ACCA [email protected]
Ioannis Tsalavoutas, Professor of Accounting, Adam Smith Business School, [email protected]
THE CAPITALISATION OF INTANGIBLES DEBATE:SOFTWARE DEVELOPMENT COSTS
ACCA AND ADAM SMITH BUSINESS SCHOOL RESEARCH REPORT
Dionysia Dionysiou (University of Stirling)
Richard Slack (Durham University)
Ioannis Tsalavoutas (University of Glasgow)
Fanis Tsoligkas (University of Bath)
Contents
1. Introduction 5 1.1 Background and objectives 5 1.2 Method 5 1.3 Main findings 5 1.4 Policy implications and recommendations 6 1.5 Report outline 7
2. Accounting for Software Development Costs – overview of relevant accounting standards and literature 9
2.1 Overview of relevant accounting standards 9 2.2 Related literature 10
3. Research approach 12 3.1 Sample selection 12 3.2 Econometric analysis 15 3.2.1 Determinants of the decision to capitalise SDCs, and amounts of SDC capitalised 15 3.2.2 Expected vs unexpected treatment of SDCs 16
4. Findings and discussion 18 4.1 Capitalisers of software development costs 18 4.2 SDC capitalisation intensity 22 4.3 Univariate analysis 24 4.4 Multivariate analysis 26 4.4.1. Full sample 26 4.4.2 Expected and unexpected accounting treatment of SDCs’ capitalisation 28 4.4.3 SDC capitalisation and material business combinations 30 4.4.4 Additional analysis: implementation of IFRS 3 (Revised) and capitalisation of SDCs 32
5. Conclusion 37 5.1 Conclusions and recommendations 37 5.2 Limitations and directions for future research 38
About the authors 39
References 40
Appendix A: Information for the firm-year observations excluded from our analysis 41
Appendix B: Variable definition 44
Appendix C: Examples of companies’ disclosures 46
Acknowledgements: The authors would like to thank ACCA and the Adam Smith Observatory of Corporate Reporting Practices for providing the funding for this project. We are grateful to Richard Martin (ACCA) for his valuable suggestions, support and advice during the project. We thank Evangelos Seretis for his excellent research assistance with some of the data collected.
4
1.1 Background and objectivesThere have been concerns that financial statements do not reflect adequately the underpinning drivers of value in modern business (Bernanke 2011; Haskel and Westlake 2017; Lev and Gu 2016). Additionally, International Accounting Standard (IAS) 38 Intangible Assets, which governs the treatment of intangible assets, has been criticised for reflecting prudence and conservatism that encourages the expensing of internally generated intangible assets (Mazzi et al. 2019b). This implies that the accounting treatment of internally generated intangible assets, as prescribed by the standard, exacerbates the perceived lack of intangible assets in companies’ balance sheets.
To shed more light on these conjectures, a study by Mazzi et al. (2019b) has among other things examined the relevant amounts and firm characteristics of a very large sample of firms across the world that capitalise and/or expense research and development (R&D) expenditure, specifically under International Financial Reporting Standards (IFRS). However, in today’s economies, companies increasingly invest in software, develop websites as well as other software (eg applications for mobile phones) for use as part of their operations, but that are not necessarily heavily involved in R&D activities. Thus, firms could find themselves spending significant software-related amounts. Such expenditure should be capitalised, subject to meeting the criteria, and shown as a separate category of intangible assets. As such, prior literature that has examined the capitalisation of development costs more broadly has not separately analysed the relevant costs recognised on companies’ financial statements.
The present study complements and extends the study by Mazzi et al. (2019b) by focusing particularly on software development costs (SDCs), which are governed by the same accounting standard (ie IAS 38). To the best of the authors’ knowledge, research on the frequency and likelihood of SDC capitalisation and relevant amounts capitalised on companies’ balance sheets under IFRS is not available. Furthermore, there is an absence of evidence on the characteristics of firms that are more likely to capitalise such expenditure and on the determinants of the amounts of SDC capitalised. The overall objective of the present research is to shed light on these areas.
1. Introduction
1.2 MethodBy drawing on listed companies from 39 countries (40,241 firm-year observations) that have either converged their national standards to IFRS or adopted IFRS, for the five-year period 2015 to 2019, we have collected and summarised evidence on how many companies capitalise SDCs during the year (capitalisers) and how many report R&D costs in the income statement but do not capitalise SDCs during the year (non-capitalisers). This evidence is provided in aggregate and on a country and industry level. We also provide descriptive statistics of the amounts of SDCs capitalised in a given year relative to market values and the net amounts of SDCs that feature on companies’ balance sheets, relative to total assets, at the end of the year. We then provide results from multivariate regression analysis to identify the country- and firm-level determinants influencing the decision of companies to capitalise SDCs and identifying the factors affecting the magnitude of SDCs capitalised in a given year.
In additional analysis with a separate sample, we explored any differences in the determinants influencing the decision of companies to capitalise SDCs and the factors affecting the magnitude of SDCs capitalised for a sample period that covers the same number of years before and after the implementation of IFRS 3 Business Combinations (Revised) in 2009. Finally, for a relatively small number of firms, we collected companies’ most recent annual reports and, from those, we manually extracted examples of voluntary disclosure and accounting policy notes about capitalisation or expensing of SDCs.
1.3 Main findings n The data shows that 62.2% of the firm-year observations in
the sample capitalise SDCs. This suggests that companies very frequently recognise and report SDCs separately. Moreover, from the multivariate analysis we conducted, we identified a significant number of non-capitalisers that, given their firm- and country-level characteristics, one would have expected to capitalise SDCs. This would increase the percentage of capitalisers of SDCs even further.
n In Argentina, Brazil, Chile, Colombia, India, Ireland, Japan, Mexico, New Zealand, Peru, Philippines, Portugal, South Africa and Spain, more than 80% of the firm-year observations are of firms that are capitalisers. In fact, all firm-year observations from Colombia and Philippines are capitalisers.
THE CAPITALISATION OF INTANGIBLES DEBATE: SOFTWARE DEVELOPMENT COSTS | 1. INTRODUCTION
5
THE CAPITALISATION OF INTANGIBLES DEBATE: SOFTWARE DEVELOPMENT COSTS | 1. INTRODUCTION
n The constituents of Consumer Discretionary, Financials, Real Estate and Utilities Sectors exhibit the largest proportion of capitalisers (the proportion of capitalisers is greater than 70%).
n The high frequency of SDCs capitalisation identified holds, even though the amounts involved can be considered immaterial relative to companies’ total assets and/or market values. Specifically, we note that the mean (median) SDC asset intensity on the balance sheet is 0.6% (0.2%) of capitalisers’ total assets. Further, the mean (median) SDC asset capitalised in the year is 0.04% (0.1%) of capitalisers’ market values. However, the large proportion of firms from Asia, which exhibit the lowest net SDCs intensity (mean (median) 0.32% (0.11%) of total assets), distorts the picture in relation to the SDC asset intensity of the overall sample.
n Firms from Oceania (represented by firms from New Zealand and Australia) exhibit the highest intensity (mean (median) 2.22% (1.32%) of total assets). European firms and South African firms tend to present the second highest values of SDC assets as a proportion of total assets (mean (median) for Europe: 1.51% (0.73%); mean (median) for South Africa: 1.28% (0.66%)).
n Firms in the Telecommunications industry exhibit the highest net SDC asset intensity (mean (median) 1.26% (0.37%) of total assets), followed by firms in Technology and Consumer Discretionary (mean (median) is 1.06% (0.28%) and 0.80% (0.26%) of total assets, respectively). Although firms in the Financials Sector have the highest proportion of capitalisers, net SDC asset intensity is of intermediate level when compared with other industries.
n In particular, of the firm-year observations that complete material business combinations in a given year (4,076), a large proportion (3,115 firm-year observations – 76.4%) capitalise SDCs during the year (this represents 12.06% of the firms that capitalise SDCs in the entire sample). Additionally, we identify 1,028 firm-year observations that capitalise research and development (R&D) in the year (this represents 13.80% of the firm-year observations that capitalise R&D in the year in the entire sample). Moreover, for the firms that capitalise SDCs during the year, the mean (median) SDC intensity is 1.1% (0.3%) of total assets, while the mean (median) SDC capitalised in the year is 0.5% (0.1%) of market values.
n Compared with those that do not capitalise SDCs, companies that take the decision to capitalise SDCs tend to be larger, riskier, with higher leverage, to have more international sales, to have incentives to capitalise SDCs to meet their earnings targets, to capitalise other development costs and to have concluded material
business combinations during the year. They are also more likely to employ one of the Big Four auditors. The same characteristics associate positively with the magnitude of the amounts capitalised.
n Nonetheless, firm size, employing a Big Four auditor, and international sales are not significant factors affecting the decision to capitalise SDCs for the sub-sample of firms that have material business combinations. Further, book to market, firm size, having a Big Four auditor, international sales, and frequency of R&D capitalisation and being headquartered in a civic-law country or a country with highly skilled labour and better health infrastructure are not significant determinants of the amounts of SDCs capitalised in the sub-sample with material business combinations. Hence, these factors are significant determinants of SDC capitalisation only for the sub-sample of firms that do not have material business combinations.
n The results from the separate sample focusing on the years before and after the implementation of IFRS 3 (R) in 2009 suggest that the implementation of the revised standard does not influence a firm’s decision about capitalising SDCs or the magnitude of SDC capitalisation, even if it has conducted material business combinations.
1.4 Policy implications and recommendationsThe issue of intangible assets has been on the agenda of standard setters and regulators for some time and it is increasingly gaining momentum. For example, in 2015, as a response to the request for views on the Agenda Consultation of the International Accounting Standards Board (IASB), the European Securities and Markets Authority (ESMA) agreed that there is a need for a review of the guidance for intangible assets and R&D.1 Moreover, in the UK in 2019, the Financial Reporting Council (FRC), following a project it had carried out and a request for feedback from stakeholders, published proposals for business reporting of intangibles (FRC 2019). Additionally, in late 2019, the intangibles research unit within the European Financial Reporting Advisory Group (EFRAG) held discussions on intangibles in relation to the IASB’s forthcoming Agenda Consultation and, ‘at the meeting, IFRS IC [Interpretations Committee] members noted that a fundamental overhaul of the Standard was necessary’ (EFRAG 2019: 2). In response to these voices, the IASB, in its request for information on what its priorities should be over the following five years, included revisiting IAS 38 as one of its potential projects (IASB 2021: Table 5). Further, even though in 2017 the Financial
1 <https://www.esma.europa.eu/sites/default/files/library/2015-1740_-_esma_cl_to_the_iasb_agenda_consultation.pdf>
6
THE CAPITALISATION OF INTANGIBLES DEBATE: SOFTWARE DEVELOPMENT COSTS | 1. INTRODUCTION
Accounting Standards Board (FASB) reported that it was undertaking a project aiming to review, among other things, the mandatory disclosures for intangibles (FASB 2018), it has now initiated a project on accounting for and disclosure of intangibles, including internally developed intangibles and R&D (FASB 2021). Against this backdrop, the findings of the present research are very timely and speak directly to these projects. The findings should also be relevant to regulators more broadly, and to companies and auditors. With regard to SDCs in particular, the key recommendations arising from our findings are summarised as follows.
i. Our findings of high frequency of capitalisation of SDCs, even though the amounts involved can be considered relatively small, are in direct contrast to the prior evidence of relative lack of capitalisation of development costs of new products and processes (ie R&D-related costs) under IAS 38. We conjecture that such costs can be more reliably estimated at the time when the related projects are undertaken. Further, the SDCs’ duration of development can also be estimated with relative reliability over a shorter time period. These two features allow companies to establish their internal use, rather than applying an external market condition for product development, with greater relative reliability and this enables capitalisation of such costs. Along these lines, a relevant method of amortisation or monitoring for impairment can be established. Nonetheless, the stringent criteria for the recognition of development costs deter companies from capitalising other development costs equally frequently. Thus, if the IASB proceeds by revising/replacing IAS 38, reconsideration of the conditions of capitalising developments costs is pertinent. This would improve the accounting treatment and comparability of other intangible assets.
ii. Our findings on the frequency of SDCs' capitalisation and magnitude of related amounts capitalised for the periods before and after IFRS 3 (R) reveal that the IASB’s expectation for ‘an increase in the intangible assets recognised as a result of business combinations’ (IASB, 2014: 13) following the implementation of IFRS 3 (R) did not materialise. This holds for all firms conducting business combinations and for those for which the combinations were material. Further, our findings for the companies that have conducted material business combinations in the most recent sample period suggest that the majority of these firms do recognise SDCs (and even other development assets) separately. In fact, the corresponding amounts appear to be higher than those from all SDC capitalisers in the sample. This suggests that companies do follow IFRS 3 and recognise separately such assets upon material business combinations.
The finding also reinforces views regarding the differential treatment and resultant influence in the frequency of recognition of intangible assets on companies’ balance sheets (see in IASB 2021). In combination, this suggests that the generally perceived lack of recognition of intangible assets more broadly lies with IAS 38.
iii. Our findings indicate significant differences between the percentage of SDC-capitalising firms and SDC asset intensity on companies’ balance sheets across countries/regions. While firms from Asia demonstrate a clear tendency to recognise SDCs separately on the balance sheet, the SDC asset intensity is far smaller than for firms in those regions, such as Oceania and Europe, where capitalisation is less frequent. Given this, users of financial statements, preparers, auditors and/or enforcers of financial information should be alerted of the differential reporting incentives and contextual, or cultural, influential factors across different countries, which result in significant variations in reporting practices. The concept of materiality for triggering separate disclosure of SDC assets and the perceived importance of SDCs evidently have different weight across different jurisdictions. On the other hand, SDC intensity across different sectors appears less variable and percentage of capitalisers is more explicable/less unexpected.
iv. Finally, in contrast to the evidence about lack of disclosures in relation to R&D, our findings from reviewing the disclosures in companies’ annual reports indicate some good disclosure practice for SDCs. Given the lack of mandatory disclosures for either topic in IAS 38, the good practice we have observed rests on companies’ voluntary disclosure behaviour. Arguably, the higher frequency of recognition of SDCs ‘forces’ companies to ‘talk’ about the amounts recognised, despite the relative lack of materiality. Even so, in the cases where business combinations are not present, we have observed that companies do not explicitly explain how much of the cost capitalised relates to in-house development or externally acquired software. Arguably, IAS 38, enforcing bodies and auditors could be encouraged to support more transparent disclosures by assisting firms to distinguish how much of the capitalised amounts relates to externally acquired or internally developed software.
1.5 Report outlineThe next chapter describes the accounting for SDCs and an overview of the relevant accounting standards and literature. The research design is outlined in Chapter 3. We then present and discuss our results in Chapter 4. Conclusions are set out in Chapter 5.
7

THE CAPITALISATION OF INTANGIBLES DEBATE: SOFTWARE DEVELOPMENT COSTS | 1. INTRODUCTION
8
THE CAPITALISATION OF INTANGIBLES DEBATE: SOFTWARE DEVELOPMENT COSTS | 2. ACCOUNTING FOR SOFTWARE DEVELOPMENT COSTS
2.1 Overview of relevant accounting standardsUnder an IFRS reporting regime, accounting for SDCs and associated capitalisation of relevant expenditure is governed primarily by IAS 38 Intangible Assets and less so by IFRS 3 Business Combinations.
IAS 38 prescribes (paragraph 21) that an intangible asset shall be recognised if, and only if:
a. it is probable that the expected future economic benefits that are attributable to the asset will flow to the entity; and
b. the cost of the asset can be measured reliably.
Second, paragraphs 25 and 26 explain, ‘the probability recognition criterion in paragraph 21(a) is always considered to be satisfied for separately acquired intangible assets’ and ‘the cost of a separately acquired intangible asset can usually be measured reliably’.
IAS 38 further covers the accounting for internally generated intangible assets, including R&D costs, of which SDCs form a constituent element. All research costs are expensed. Development costs must be capitalised on meeting the six conditions specified in paragraph 57 of the standard; all other costs are expensed. The six conditions can be applied to cover those costs incurred in relation to the internal development and use of software or its development for sale, as set out below.
“An intangible asset arising from development (or from the development phase of an internal project) shall be recognised if, and only if, an entity can demonstrate all of the following:
a. the technical feasibility of completing the intangible asset so that it will be available for use or sale;
b. its intention to complete the intangible asset and use or sell it;
c. its ability to use or sell the intangible asset;
d. how the intangible asset will generate probable future economic benefits. Among other things, the entity can demonstrate the existence of a market for the output of the intangible asset or the intangible asset itself or, if it is to be used internally, the usefulness of the intangible asset;
e. the availability of adequate technical, financial and other resources to complete the development and to use or sell the intangible asset;
f. its ability to measure reliably the expenditure attributable to the intangible asset during its development”.
Within IAS 38, specific guidance is also provided in relation to software (including that developed internally) that is integral to the use of property, plant and equipment. Specifically, ‘computer software for a computer-controlled machine tool that cannot operate without that specific software is an integral part of the related hardware and it is treated as property, plant and equipment. The same applies to the operating system of a computer. When the software is not an integral part of the related hardware, computer software is treated as an intangible asset’ (IAS 38, para 4).
Recognising the growing importance of website development for internal use and as a sales platform, SIC-32 Intangible Assets – Web Site Costs was issued in March 2002. This confirms that a website developed by an entity using internal expenditure, whether for internal or external access, is an internally generated intangible asset that is subject to the requirements of IAS 38, and specifically those conditions specified in para 57 for capitalisation. SIC-32 identifies four stages of
2. Accounting for Software Development Costs –
overview of relevant accounting standards and literature
9
THE CAPITALISATION OF INTANGIBLES DEBATE: SOFTWARE DEVELOPMENT COSTS | 2. ACCOUNTING FOR SOFTWARE DEVELOPMENT COSTS
website development. Firstly, ‘planning application and infrastructure development’, which is akin to the research phase, so all costs are expensed. Secondly, ‘graphical design development’ is akin to the development stage and costs are to be capitalised if they meet the conditions specified in IAS 38. Owing to websites’ susceptibility to technological obsolescence, SIC 32 specifies that where costs are capitalised, the expected amortisation period should be short, consistent with that set out in IAS 38 para 92. Finally, for ‘content development’ that is developed to advertise and promote an enterprise's own products and services and costs in the ‘operating phase’ are expensed.
In addition to these considerations, as part of a business combination, as of the acquisition date, the acquirer must, among other things, recognise, separately from goodwill, the identifiable assets acquired (IFRS 3, para 10). Specifically, the acquirer’s application of this recognition principle and conditions may result in recognising some assets (including software) that the acquiree had not previously recognised as assets in its financial statements because it developed them internally and charged the related costs to expense (IFRS 3, para 13). As a result, while consolidating subsidiaries, SDCs’ value on a company’s balance sheet would increase, not only because of recognising SDCs already on the balance sheet of the acquiree but also because of the newly recognised SDCs on consolidation.
In this study, we shed light to all relevant costs recognised on companies’ balance sheets.
2.2 Related literatureDespite the plethora of literature about general R&D costs and associated capitalisation (see in Mazzi et al. (2019a; 2019b) and Dargenidou et al. (2021) for relevant references), there is a sparsity of literature on accounting for SDCs under IAS 38. This is despite the growth in importance of automated systems and production planning, the development of apps, cybersecurity challenges and risks, artificial intelligence and big data analytics (Morgan Stanley 2017). Indeed, the body of literature relevant to SDCs has been confined to US-based studies (Aboody and Lev 1998; Ciftci 2010; Dinh et al. 2019; Givoly and Shi, 2008; Krishnan and Wang 2014; Mohd 2005).
This is motivated by the different accounting treatments, under US Generally Accepted Accounting Principles (GAAP), for R&D and SDCs. Statement of Financial Accounting Standard (SFAS) No. 2 requires immediate expensing of R&D costs. Significantly, in contrast to this, capitalisation (and subsequent amortisation) of development costs of software intended for sale is mandated by SFAS No. 86 (effective from 31 December
1985), once technological feasibility has been established for a computer software product. Further to this, SOP 98-1 (effective from 15 December 1998) similarly requires capitalisation of SDCs related to software for internal use during the application development stage (Para 21), where it is ‘probable that the project will be completed and the software will be used to perform the function intended’ (Para 27b). All other costs are expensed. The different accounting treatments of SDCs and R&D have been attributed to the strength of lobbying from the software industry to recognise assets rather than expensing all costs (Kaplan and Sandino, 2001). As noted earlier, under IAS 38 the accounting for SDCs is the same whether the software is developed for internal use or for sale.
Within the extant literature, the focus of the majority of the US-based studies, in the post SFAS 86 era, has been to examine the value relevance of SDC capitalisation. Aboody and Lev (1998: 162–3) find that ‘annually capitalized development costs are positively associated with stock returns and the cumulative software asset reported on the balance sheet is associated with stock prices’. Further, they find no support for the view that the judgement involved in software capitalisation decreases the quality of reported earnings. Mohd (2005) finds that within the software industry information asymmetry is significantly lower for capitalisers than for those that expense SDCs and capitalisers have a resultant lower cost of capital. Indeed, he argues that expensing leads to ambiguity about the value of R&D and hence greater information asymmetry for investors. Consistent with this reasoning, Givoly and Shi (2008) similarly report that capitalising SDCs reduces information asymmetry and the under-pricing of IPOs and consequently lowers cost of capital. These findings are in stark contrast to Ciftci, who reports that ‘capitalization of software costs does not improve earnings quality’ and that the findings ‘suggest that investors’ perception of earnings quality is higher for firms that make a conservative reporting choice’ (Ciftci 2010: 429). He concludes that the earnings quality of the firms that expense all R&D is greater than that of those that capitalise, recognising the possibility of earnings management.
In another study, revealing more positive evidence of SDC capitalisation, Krishnan and Wang (2014) find that SDC capitalisation sends a positive signal of a reduction of business risk to auditors, with a consequent decrease in audit fee. Nonetheless, this is where such capitalisation is inconsequential for beating analysts’ forecasts and also for firms with a low level of following by analysts. Finally, Dinh et al. (2019) contrasting the accounting for SDCs versus R&D in other industries found that capitalisation mitigated the likelihood of under-investment and similarly mitigated the likelihood of a cut in discretionary spend.
10
THE CAPITALISATION OF INTANGIBLES DEBATE: SOFTWARE DEVELOPMENT COSTS | 2. ACCOUNTING FOR SOFTWARE DEVELOPMENT COSTS
Overall, these studies highlight the generally positive evidence of the value relevance and signalling of SDC capitalisation. While there is some contrary evidence, and the possibility that capitalisation will be used as an earnings management tool, nonetheless the literature generally supports the asset recognition of appropriate SDCs.
In a non-US context, to our knowledge the only study of accounting for SDCs in other jurisdictions is that of Walker and Oliver (2005). Their research examined the differences and inconsistencies in capitalisation and asset recognition between US, UK, Australian and IAS accounting treatments of development costs of software intended for internal use, before the adoption of IAS 38. IAS 38 and the US accounting treatment have already been covered in this review: both mandate capitalisation on meeting specified, although different, conditions. In contrast, the UK accounting standard SSAP 13 Accounting for Research and Development (1989) allowed, but did not require, this treatment on meeting conditions for asset recognition. Similarly, Australian Accounting Standard AAS 13 Accounting for Research and Development Costs (1983), and the identically titled AASB 1011 (1987) permitted capitalisation of expenditure on the development of a ‘new product’, to the extent that such costs ‘are expected beyond reasonable doubt to be recoverable’, given future (uncertain) projections. To remove these inconsistencies in
accounting treatments, Walker and Oliver (2005: 67) argue for ‘clarity in accounting rules governing the treatment of software expenditure’.
Further to this divergence of treatments, they argue more widely that the application of capitalisation through the relevant accounting standards is reliant on a series of subjective judgements, such as those about technological feasibility, commercial viability and economic life. This in turn may be susceptible to earnings management owing to pressures on earnings performance or internal bonus incentive structures. In conclusion, Walker and Oliver (2005: 88) advocate ‘(a) the immediate expensing of internally developed software; (b) reporting of this expense as a line item where software expenditure is material; and (c) disclosing, in notes to the financial statements, information about major software development projects’. Such a conclusion is counter to IAS 38, the focus of this research, and widely adopted after 2005 outside the US, where capitalisation of SDCs remains mandated where the specified conditions are met.
As a summary, no research exists on the capitalisation of SDCs under IFRS or outside the US. Therefore, this is the first study to examine the frequency and magnitude of SDC capitalisation of IFRS reporting firms, the factors associated with such practices and the amounts involved.
11
THE CAPITALISATION OF INTANGIBLES DEBATE: SOFTWARE DEVELOPMENT COSTS | 3. RESEARCH APPROACH
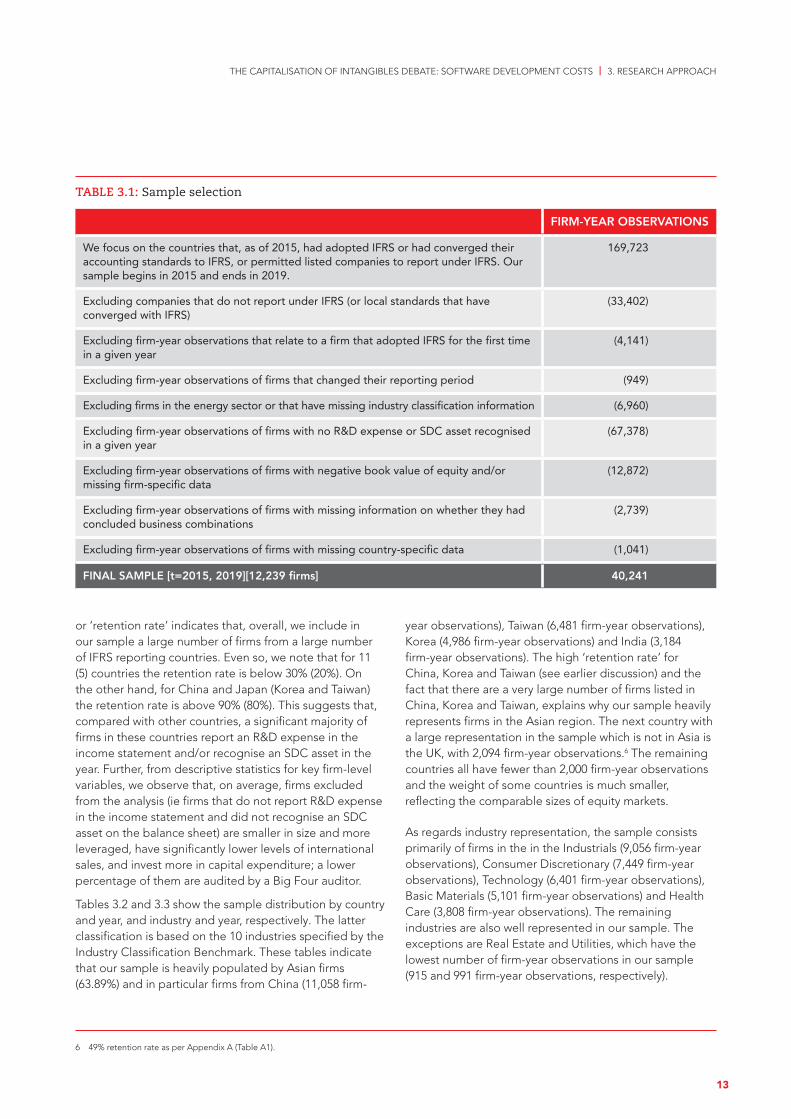
3.1 Sample selectionGiven that we are interested in exploring companies’ relatively recent practices in relation to the objectives of the study and that we wanted to involve as many countries as possible that have adopted IFRS or converged their accounting standards to IFRS or permit listed companies to report under IFRS, the sample selection started by identifying all countries that met these conditions as of 2015, and we then included all periods between 2015 and 2019 in our analysis. To identify these countries, we relied on the relevant guide published by the IFRS Foundation on the use of IFRS by jurisdiction.2 For each of those countries, we obtained the research lists constructed by Worldscope containing all active and dead firms for the years 2015 to 2019. From these lists, we eliminated instruments not classified as equity.3 As far as cross-listed firms were concerned, we retained only those firms based on the country of primary listing. Subsequently, we eliminated 33,402 firm-year observations of firms not reporting under IFRS (or local GAAP, for those countries that had converged their accounting standards with IFRS).4 To avoid the influence of potential transition effects on our findings (Mazzi et al. 2019b), we eliminated any observations of firms that appeared to have adopted IFRS for the first time in a given year (mostly 2015 (31%) and 2016 (28%): 4,141 firm-year observations). Further, we eliminated 949 firm-year observations because the reporting period of the firms concerned was more than 380 or less than 350 days (García Lara, García Osma and Mora 2005; Dargenidou et al. 2021). Then, we eliminated 6,960 firm-year observations because either the firms’ industry classification information was missing or they were in the Energy industry.5
Subsequently, given the objectives of the study (ie to focus on firms that have recognised SDCs on the balance sheet in a given year), we considered the following
aspects. According to IAS 38, and assuming that the firm considers the relevant amounts to be sufficiently material, such expenditure that is capitalised should be shown as a separate category of intangible assets. Further, SDCs could be part of what a company could define as R&D and thus the SDC-related amount expensed in the income statement might be ‘badged’ as R&D expenses. Hence, in a given year, we required our sample firms to have either an SDC asset recognised on the balance sheet and/or an R&D expense in the income statement. Because of this requirement, we eliminated 67,378 firm-year observations that did not report R&D expense or recognise an SDC asset in a given year. Additionally, we eliminated 12,872 firm-year observations with missing firm-specific data and/or negative book value of equity, and 2,739 for which we could not identify whether the company had concluded business combinations in a given year. Finally, we deleted 1,041 firm-year observations because of missing country-specific data. The final sample consists of 40,241 firm-year observations, corresponding to 12,239 firms across 39 countries. The sample selection process is summarised in Table 3.1.
Before discussing the sample distribution by country and year, we note the following. Appendix A presents tabulated information and discussion about the firm-year observations with no R&D expense or SDC asset recognised in a given year that we have excluded, after we have eliminated firm-year observations with missing firm or country-specific data (ie 37,438 firm-year observations). This information indicates that among all the firm-year observations with available data (ie 77,679 – calculated as the sum of total excluded (ie 37,438 firm-year observations) and total included (ie 40,241 firm-year observations) in the analysis) and thus we could have analysed, approximately 52% report an R&D expense in the income statement and/or recognise an SDC asset in a given year and hence are included in the study. This 52%
2 See <https://www.ifrs.org/use-around-the-world/use-of-ifrs-standards-by-jurisdiction/>, accessed 16 April 2021
3 We require the Datastream item TYPE to be equal EQ, indicating an equity instrument.
4 As in Schleicher et al. (2010) and Daske et al. (2013) and Mazzi et al. (2019a), we rely on the Worldscope item ‘accounting standards followed (WC07536) to identify the accounting standards that a company reports.
5 As explained by Mazzi et al. (2019a), exploration and evaluation expenses could be recorded as research and development expenses in the database for companies in this industry. It is noted that in previous ICB Industry namings (and hence earlier literature which used those) this industry was titled ‘Oil and Gas’.
3. Research approach
12
THE CAPITALISATION OF INTANGIBLES DEBATE: SOFTWARE DEVELOPMENT COSTS | 3. RESEARCH APPROACH
or ‘retention rate’ indicates that, overall, we include in our sample a large number of firms from a large number of IFRS reporting countries. Even so, we note that for 11 (5) countries the retention rate is below 30% (20%). On the other hand, for China and Japan (Korea and Taiwan) the retention rate is above 90% (80%). This suggests that, compared with other countries, a significant majority of firms in these countries report an R&D expense in the income statement and/or recognise an SDC asset in the year. Further, from descriptive statistics for key firm-level variables, we observe that, on average, firms excluded from the analysis (ie firms that do not report R&D expense in the income statement and did not recognise an SDC asset on the balance sheet) are smaller in size and more leveraged, have significantly lower levels of international sales, and invest more in capital expenditure; a lower percentage of them are audited by a Big Four auditor.
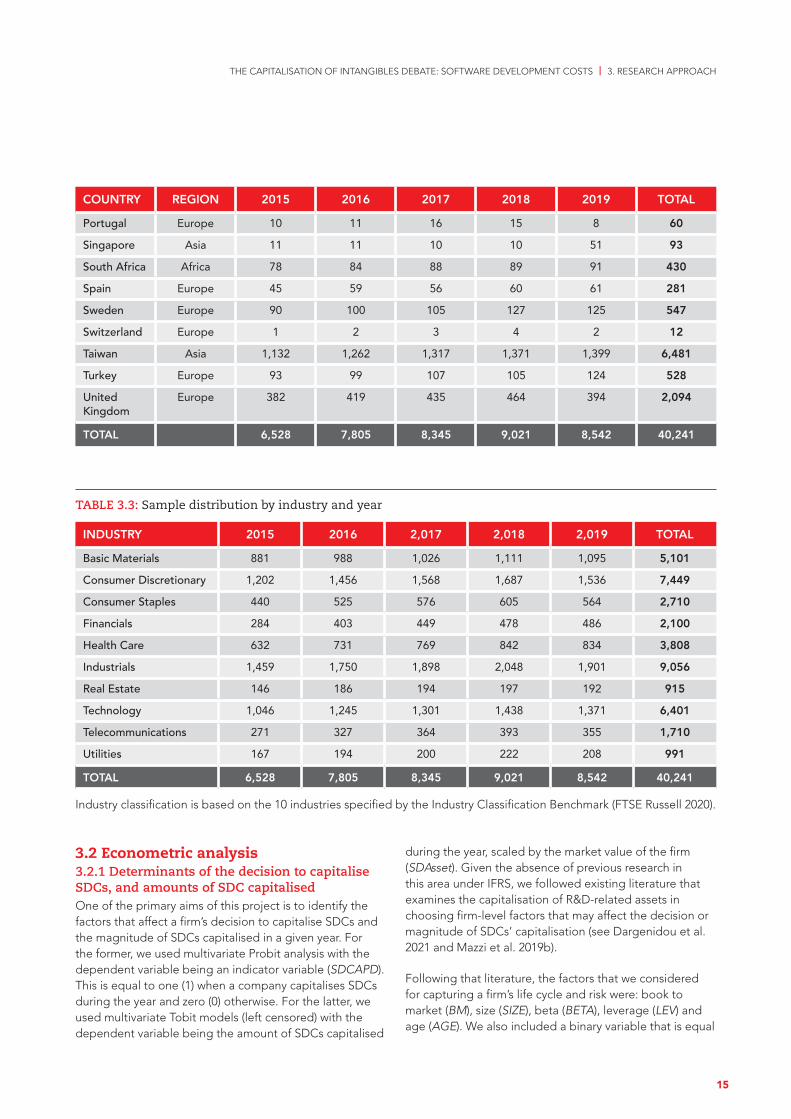
Tables 3.2 and 3.3 show the sample distribution by country and year, and industry and year, respectively. The latter classification is based on the 10 industries specified by the Industry Classification Benchmark. These tables indicate that our sample is heavily populated by Asian firms (63.89%) and in particular firms from China (11,058 firm-
6 49% retention rate as per Appendix A (Table A1).
year observations), Taiwan (6,481 firm-year observations), Korea (4,986 firm-year observations) and India (3,184 firm-year observations). The high ‘retention rate’ for China, Korea and Taiwan (see earlier discussion) and the fact that there are a very large number of firms listed in China, Korea and Taiwan, explains why our sample heavily represents firms in the Asian region. The next country with a large representation in the sample which is not in Asia is the UK, with 2,094 firm-year observations.6 The remaining countries all have fewer than 2,000 firm-year observations and the weight of some countries is much smaller, reflecting the comparable sizes of equity markets.
As regards industry representation, the sample consists primarily of firms in the in the Industrials (9,056 firm-year observations), Consumer Discretionary (7,449 firm-year observations), Technology (6,401 firm-year observations), Basic Materials (5,101 firm-year observations) and Health Care (3,808 firm-year observations). The remaining industries are also well represented in our sample. The exceptions are Real Estate and Utilities, which have the lowest number of firm-year observations in our sample (915 and 991 firm-year observations, respectively).
TABLE 3.1: Sample selection
FIRM-YEAR OBSERVATIONS
We focus on the countries that, as of 2015, had adopted IFRS or had converged their accounting standards to IFRS, or permitted listed companies to report under IFRS. Our sample begins in 2015 and ends in 2019.
169,723
Excluding companies that do not report under IFRS (or local standards that have converged with IFRS)
(33,402)
Excluding firm-year observations that relate to a firm that adopted IFRS for the first time in a given year
(4,141)
Excluding firm-year observations of firms that changed their reporting period (949)
Excluding firms in the energy sector or that have missing industry classification information (6,960)
Excluding firm-year observations of firms with no R&D expense or SDC asset recognised in a given year
(67,378)
Excluding firm-year observations of firms with negative book value of equity and/or missing firm-specific data
(12,872)
Excluding firm-year observations of firms with missing information on whether they had concluded business combinations
(2,739)
Excluding firm-year observations of firms with missing country-specific data (1,041)
FINAL SAMPLE [t=2015, 2019][12,239 firms] 40,241
13

THE CAPITALISATION OF INTANGIBLES DEBATE: SOFTWARE DEVELOPMENT COSTS | 3. RESEARCH APPROACH
We note that, in Appendix A (Table A2), our sample includes the majority of potential firms (ie high retention rate) in the Health Care (76%), Technology (74%) and Telecommunications (69%) industries from the countries we analyse. Hence, it is not surprising these are the most represented in our overall sample.
The firm-year observations across years range from the lowest of 6,528 in 2015 to the highest of 9,021 in 2018. The lower numbers for 2015 and 2016 can be explained by the fact that we have excluded many firms for which this was the first year of IFRS adoption (see earlier discussion and in Table 3.1).
TABLE 3.2: Sample distribution by country and year
COUNTRY REGION 2015 2016 2017 2018 2019 TOTAL
Argentina America 15 15 18 20 16 84
Australia Oceania 216 253 264 285 308 1,326
Austria Europe 24 25 22 21 21 113
Belgium Europe 39 44 40 40 41 204
Brazil America 93 93 90 98 107 481
Canada America 223 201 201 190 215 1,030
Chile America 46 57 60 71 73 307
China Asia 1,868 2,117 2,392 2,601 2,080 11,058
Colombia America 0 5 4 5 4 18
Denmark Europe 25 31 39 38 35 168
Finland Europe 47 51 48 59 52 257
France Europe 167 182 184 203 166 902
Germany Europe 171 182 193 209 205 960
Greece Europe 51 57 57 56 26 247
Hong Kong Asia 247 260 311 367 306 1,491
India Asia 398 569 631 697 889 3,184
Indonesia Asia 64 68 80 93 78 383
Ireland Europe 17 19 11 16 16 79
Israel Asia 96 100 96 103 100 495
Italy Europe 47 60 58 70 65 300
Japan Asia 23 55 79 117 140 414
Jordan Asia 20 22 14 11 7 74
Korea Asia 561 1,046 1,073 1,156 1,150 4,986
Malaysia Asia 72 69 66 69 49 325
Mexico America 21 27 18 20 3 89
Netherlands Europe 39 49 51 49 48 236
New Zealand
Oceania 41 46 50 49 42 228
Norway Europe 36 41 40 46 41 204
Peru America 17 12 16 14 1 60
Philippines Asia 2 2 2 3 3 12
14
THE CAPITALISATION OF INTANGIBLES DEBATE: SOFTWARE DEVELOPMENT COSTS | 3. RESEARCH APPROACH
COUNTRY REGION 2015 2016 2017 2018 2019 TOTAL
Portugal Europe 10 11 16 15 8 60
Singapore Asia 11 11 10 10 51 93
South Africa Africa 78 84 88 89 91 430
Spain Europe 45 59 56 60 61 281
Sweden Europe 90 100 105 127 125 547
Switzerland Europe 1 2 3 4 2 12
Taiwan Asia 1,132 1,262 1,317 1,371 1,399 6,481
Turkey Europe 93 99 107 105 124 528
United Kingdom
Europe 382 419 435 464 394 2,094
TOTAL 6,528 7,805 8,345 9,021 8,542 40,241
TABLE 3.3: Sample distribution by industry and year
INDUSTRY 2015 2016 2,017 2,018 2,019 TOTAL
Basic Materials 881 988 1,026 1,111 1,095 5,101
Consumer Discretionary 1,202 1,456 1,568 1,687 1,536 7,449
Consumer Staples 440 525 576 605 564 2,710
Financials 284 403 449 478 486 2,100
Health Care 632 731 769 842 834 3,808
Industrials 1,459 1,750 1,898 2,048 1,901 9,056
Real Estate 146 186 194 197 192 915
Technology 1,046 1,245 1,301 1,438 1,371 6,401
Telecommunications 271 327 364 393 355 1,710
Utilities 167 194 200 222 208 991
TOTAL 6,528 7,805 8,345 9,021 8,542 40,241
Industry classification is based on the 10 industries specified by the Industry Classification Benchmark (FTSE Russell 2020).
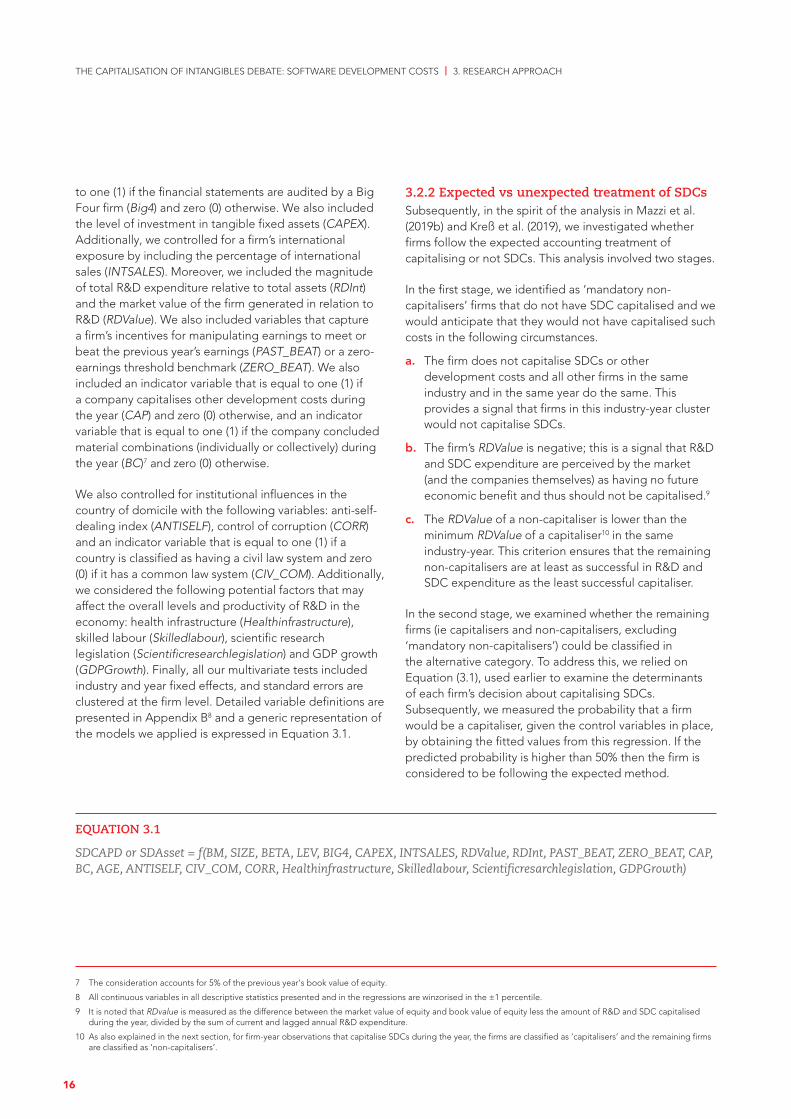
3.2 Econometric analysis3.2.1 Determinants of the decision to capitalise SDCs, and amounts of SDC capitalisedOne of the primary aims of this project is to identify the factors that affect a firm’s decision to capitalise SDCs and the magnitude of SDCs capitalised in a given year. For the former, we used multivariate Probit analysis with the dependent variable being an indicator variable (SDCAPD). This is equal to one (1) when a company capitalises SDCs during the year and zero (0) otherwise. For the latter, we used multivariate Tobit models (left censored) with the dependent variable being the amount of SDCs capitalised
during the year, scaled by the market value of the firm (SDAsset). Given the absence of previous research in this area under IFRS, we followed existing literature that examines the capitalisation of R&D-related assets in choosing firm-level factors that may affect the decision or magnitude of SDCs’ capitalisation (see Dargenidou et al. 2021 and Mazzi et al. 2019b).
Following that literature, the factors that we considered for capturing a firm’s life cycle and risk were: book to market (BM), size (SIZE), beta (BETA), leverage (LEV) and age (AGE). We also included a binary variable that is equal
15
THE CAPITALISATION OF INTANGIBLES DEBATE: SOFTWARE DEVELOPMENT COSTS | 3. RESEARCH APPROACH
to one (1) if the financial statements are audited by a Big Four firm (Big4) and zero (0) otherwise. We also included the level of investment in tangible fixed assets (CAPEX). Additionally, we controlled for a firm’s international exposure by including the percentage of international sales (INTSALES). Moreover, we included the magnitude of total R&D expenditure relative to total assets (RDInt) and the market value of the firm generated in relation to R&D (RDValue). We also included variables that capture a firm’s incentives for manipulating earnings to meet or beat the previous year’s earnings (PAST_BEAT) or a zero-earnings threshold benchmark (ZERO_BEAT). We also included an indicator variable that is equal to one (1) if a company capitalises other development costs during the year (CAP) and zero (0) otherwise, and an indicator variable that is equal to one (1) if the company concluded material combinations (individually or collectively) during the year (BC)7 and zero (0) otherwise.
We also controlled for institutional influences in the country of domicile with the following variables: anti-self-dealing index (ANTISELF), control of corruption (CORR) and an indicator variable that is equal to one (1) if a country is classified as having a civil law system and zero (0) if it has a common law system (CIV_COM). Additionally, we considered the following potential factors that may affect the overall levels and productivity of R&D in the economy: health infrastructure (Healthinfrastructure), skilled labour (Skilledlabour), scientific research legislation (Scientificresearchlegislation) and GDP growth (GDPGrowth). Finally, all our multivariate tests included industry and year fixed effects, and standard errors are clustered at the firm level. Detailed variable definitions are presented in Appendix B8 and a generic representation of the models we applied is expressed in Equation 3.1.
3.2.2 Expected vs unexpected treatment of SDCsSubsequently, in the spirit of the analysis in Mazzi et al. (2019b) and Kreß et al. (2019), we investigated whether firms follow the expected accounting treatment of capitalising or not SDCs. This analysis involved two stages.
In the first stage, we identified as ‘mandatory non-capitalisers’ firms that do not have SDC capitalised and we would anticipate that they would not have capitalised such costs in the following circumstances.
a. The firm does not capitalise SDCs or other development costs and all other firms in the same industry and in the same year do the same. This provides a signal that firms in this industry-year cluster would not capitalise SDCs.
b. The firm’s RDValue is negative; this is a signal that R&D and SDC expenditure are perceived by the market (and the companies themselves) as having no future economic benefit and thus should not be capitalised.9
c. The RDValue of a non-capitaliser is lower than the minimum RDValue of a capitaliser10 in the same industry-year. This criterion ensures that the remaining non-capitalisers are at least as successful in R&D and SDC expenditure as the least successful capitaliser.
In the second stage, we examined whether the remaining firms (ie capitalisers and non-capitalisers, excluding ‘mandatory non-capitalisers’) could be classified in the alternative category. To address this, we relied on Equation (3.1), used earlier to examine the determinants of each firm’s decision about capitalising SDCs. Subsequently, we measured the probability that a firm would be a capitaliser, given the control variables in place, by obtaining the fitted values from this regression. If the predicted probability is higher than 50% then the firm is considered to be following the expected method.
7 The consideration accounts for 5% of the previous year's book value of equity.
8 All continuous variables in all descriptive statistics presented and in the regressions are winzorised in the ±1 percentile.
9 It is noted that RDvalue is measured as the difference between the market value of equity and book value of equity less the amount of R&D and SDC capitalised during the year, divided by the sum of current and lagged annual R&D expenditure.
10 As also explained in the next section, for firm-year observations that capitalise SDCs during the year, the firms are classified as ‘capitalisers’ and the remaining firms are classified as ‘non-capitalisers’.
EQUATION 3.1
SDCAPD or SDAsset = f(BM, SIZE, BETA, LEV, BIG4, CAPEX, INTSALES, RDValue, RDInt, PAST_BEAT, ZERO_BEAT, CAP, BC, AGE, ANTISELF, CIV_COM, CORR, Healthinfrastructure, Skilledlabour, Scientificresarchlegislation, GDPGrowth)
16

THE CAPITALISATION OF INTANGIBLES DEBATE: SOFTWARE DEVELOPMENT COSTS | 3. RESEARCH APPROACH
17
THE CAPITALISATION OF INTANGIBLES DEBATE: SOFTWARE DEVELOPMENT COSTS | 4. FINDINGS AND DISCUSSION
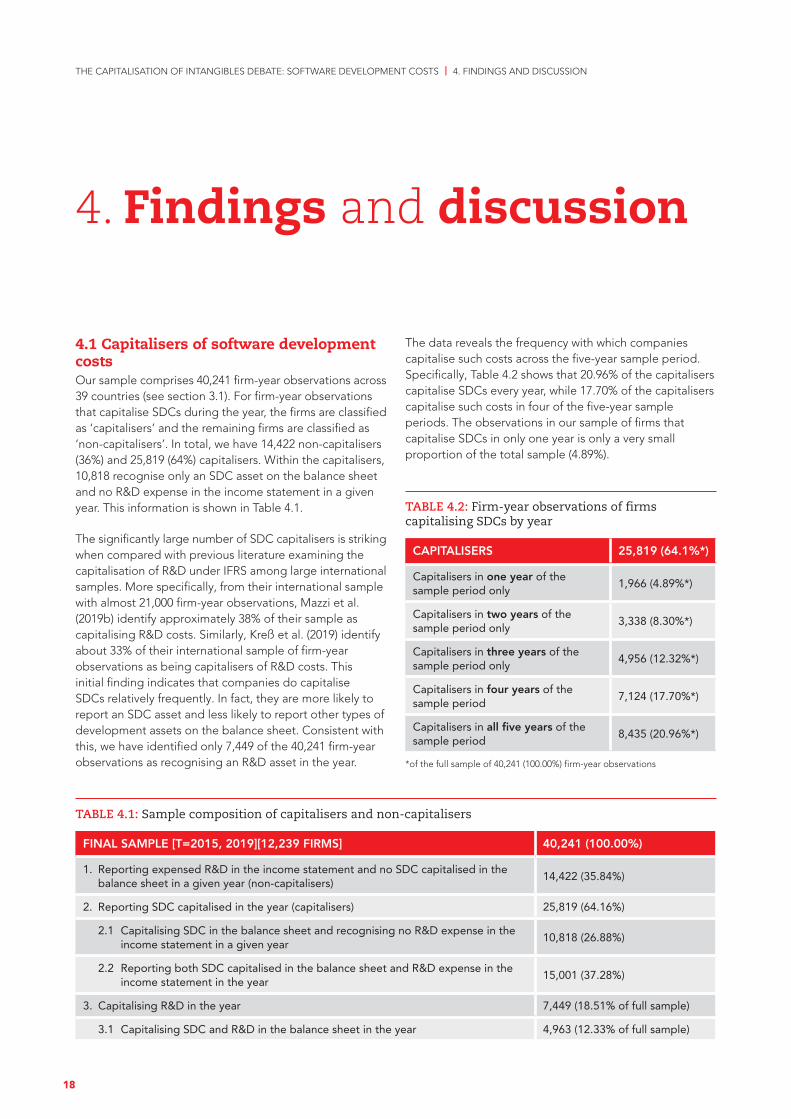
4.1 Capitalisers of software development costsOur sample comprises 40,241 firm-year observations across 39 countries (see section 3.1). For firm-year observations that capitalise SDCs during the year, the firms are classified as ‘capitalisers’ and the remaining firms are classified as ‘non-capitalisers’. In total, we have 14,422 non-capitalisers (36%) and 25,819 (64%) capitalisers. Within the capitalisers, 10,818 recognise only an SDC asset on the balance sheet and no R&D expense in the income statement in a given year. This information is shown in Table 4.1.
The significantly large number of SDC capitalisers is striking when compared with previous literature examining the capitalisation of R&D under IFRS among large international samples. More specifically, from their international sample with almost 21,000 firm-year observations, Mazzi et al. (2019b) identify approximately 38% of their sample as capitalising R&D costs. Similarly, Kreß et al. (2019) identify about 33% of their international sample of firm-year observations as being capitalisers of R&D costs. This initial finding indicates that companies do capitalise SDCs relatively frequently. In fact, they are more likely to report an SDC asset and less likely to report other types of development assets on the balance sheet. Consistent with this, we have identified only 7,449 of the 40,241 firm-year observations as recognising an R&D asset in the year.
The data reveals the frequency with which companies capitalise such costs across the five-year sample period. Specifically, Table 4.2 shows that 20.96% of the capitalisers capitalise SDCs every year, while 17.70% of the capitalisers capitalise such costs in four of the five-year sample periods. The observations in our sample of firms that capitalise SDCs in only one year is only a very small proportion of the total sample (4.89%).
TABLE 4.2: Firm-year observations of firms capitalising SDCs by year
CAPITALISERS 25,819 (64.1%*)
Capitalisers in one year of the sample period only
1,966 (4.89%*)
Capitalisers in two years of the sample period only
3,338 (8.30%*)
Capitalisers in three years of the sample period only
4,956 (12.32%*)
Capitalisers in four years of the sample period
7,124 (17.70%*)
Capitalisers in all five years of the sample period
8,435 (20.96%*)
*of the full sample of 40,241 (100.00%) firm-year observations
4. Findings and discussion
TABLE 4.1: Sample composition of capitalisers and non-capitalisers
FINAL SAMPLE [T=2015, 2019][12,239 FIRMS] 40,241 (100.00%)
1. Reporting expensed R&D in the income statement and no SDC capitalised in the balance sheet in a given year (non-capitalisers)
14,422 (35.84%)
2. Reporting SDC capitalised in the year (capitalisers) 25,819 (64.16%)
2.1 Capitalising SDC in the balance sheet and recognising no R&D expense in the income statement in a given year
10,818 (26.88%)
2.2 Reporting both SDC capitalised in the balance sheet and R&D expense in the income statement in the year
15,001 (37.28%)
3. Capitalising R&D in the year 7,449 (18.51% of full sample)
3.1 Capitalising SDC and R&D in the balance sheet in the year 4,963 (12.33% of full sample)
18
THE CAPITALISATION OF INTANGIBLES DEBATE: SOFTWARE DEVELOPMENT COSTS | 4. FINDINGS AND DISCUSSION
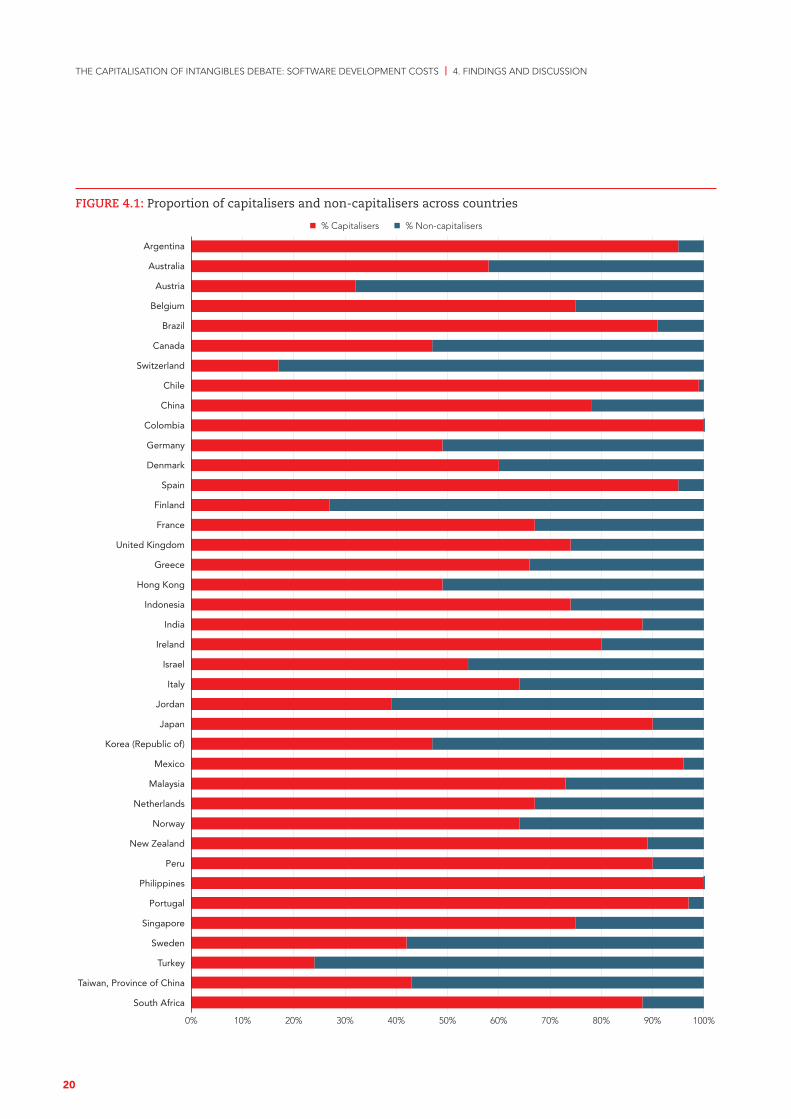
Figure 4.1 plots the percentage of firm-year observations capitalising SDCs by country. We note that in Argentina, Brazil, Chile, Colombia, India, Ireland, Japan, Mexico, New Zealand, Peru, Philippines, Portugal, South Africa and Spain more than 80% of the firm-year observations are capitalisers. In fact, all firms from Colombia and Philippines are capitalisers. This indicates a significantly large proportion of SDC capitalisers for IFRS reporters in these countries in a given year. At the other end of the spectrum, in Austria, Finland, Jordan, Switzerland and Turkey, fewer than 40% of the firm-year observations in our sample capitalise SDCs. Switzerland has the lowest percentage of capitalisers (17%). Canada, Germany, Hong Kong, Jordan, Korea, Sweden, Taiwan and China exhibit intermediate proportions of capitalisers but they generally have higher proportions of non-capitalisers (ranging between 40% and 50%). On reviewing the ‘retention rates’ shown in Appendix A (Table A1), we note that the sample ‘retention rate’ for China and (Korea and Taiwan) is above 90% (80%). This and the data shown in Figure 4.1 allow us to say with confidence that about half of the listed companies in China recognise an SDC asset across the sample period, while this percentage is much lower for Korea and Taiwan.
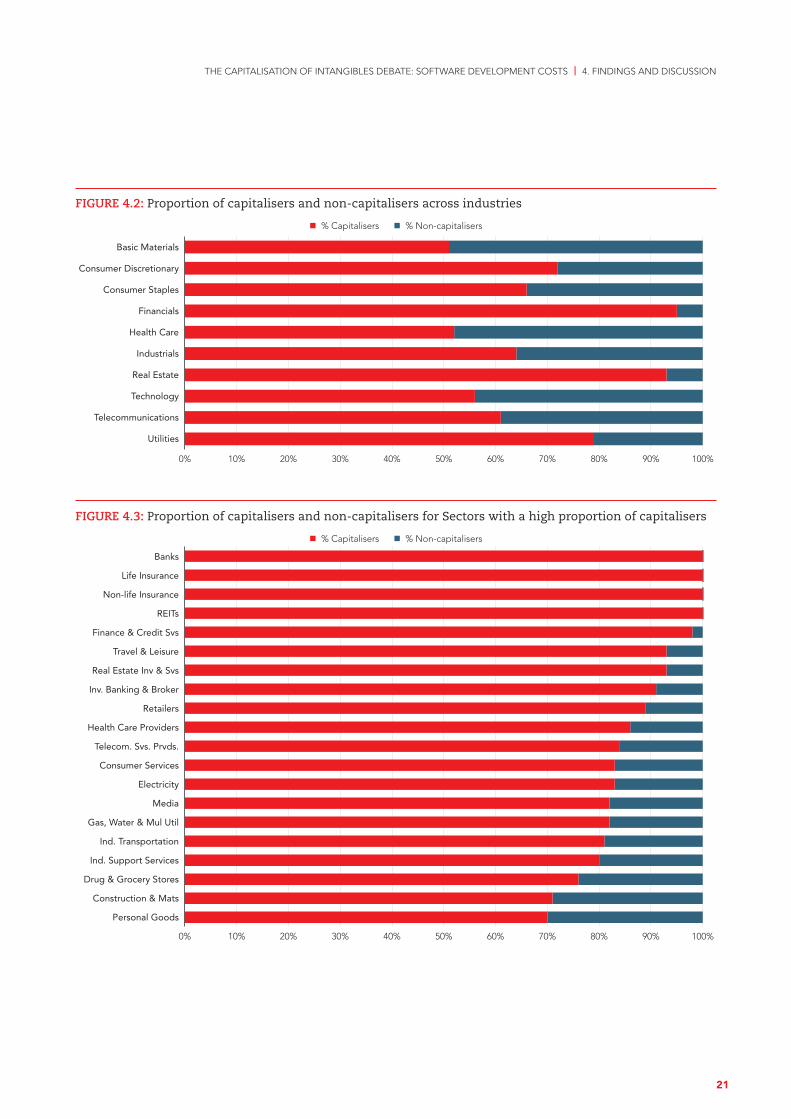
Figure 4.2 plots the percentage of firm-year observations capitalising SDCs by industry. We note that all industries exhibit more capitalisers than non-capitalisers. The constituents of Consumer Discretionary, Financials, Real Estate and Utilities exhibit the largest proportion of capitalisers (the proportion of capitalisers in these is greater than 70%). Firms in the Technology, Health Care and Basic Materials industries have the lowest proportion of capitalisers (56%, 52% and 51%, respectively). Nevertheless, these percentages can be considered relatively high if one considers the data in Appendix A (Table A2), where we show that our sample includes the majority of potential firms in the Health Care (76%) and Technology (74%) industries.
In order to delve further into the proportion of capitalisers across industries, we have also relied on the Industry Classification Benchmark (ICB) Sectors (ie more refined sub-categories of industries) in which the companies
operate. Figure 4.3 shows that in those Sectors the proportion of capitalisers exceeds 70%. Notably, all firms in Banks, Insurance (Life & Non-life) and Real Estate Investment Trusts (REITS) capitalise SDCs. The Sectors with the next highest proportions of capitalisers are Finance & Credit Services (98%), Travel & Leisure (93%), Real Estate, Investment & Services (93%) and Investment Banking & Broker (91%). In untabulated descriptive statistics, we see that Sectors with the lowest proportion of capitalisers include: Medical Equipment Services (47%), Pharmaceutical & Biotech (50%) and Leisure Goods (50%). The remaining Sectors have a higher proportion of non-capitalisers relative to capitalisers. Overall, these results confirm the earlier findings shown in Figure 4.2 that firms in Financials exhibit the highest proportion of capitalisers.
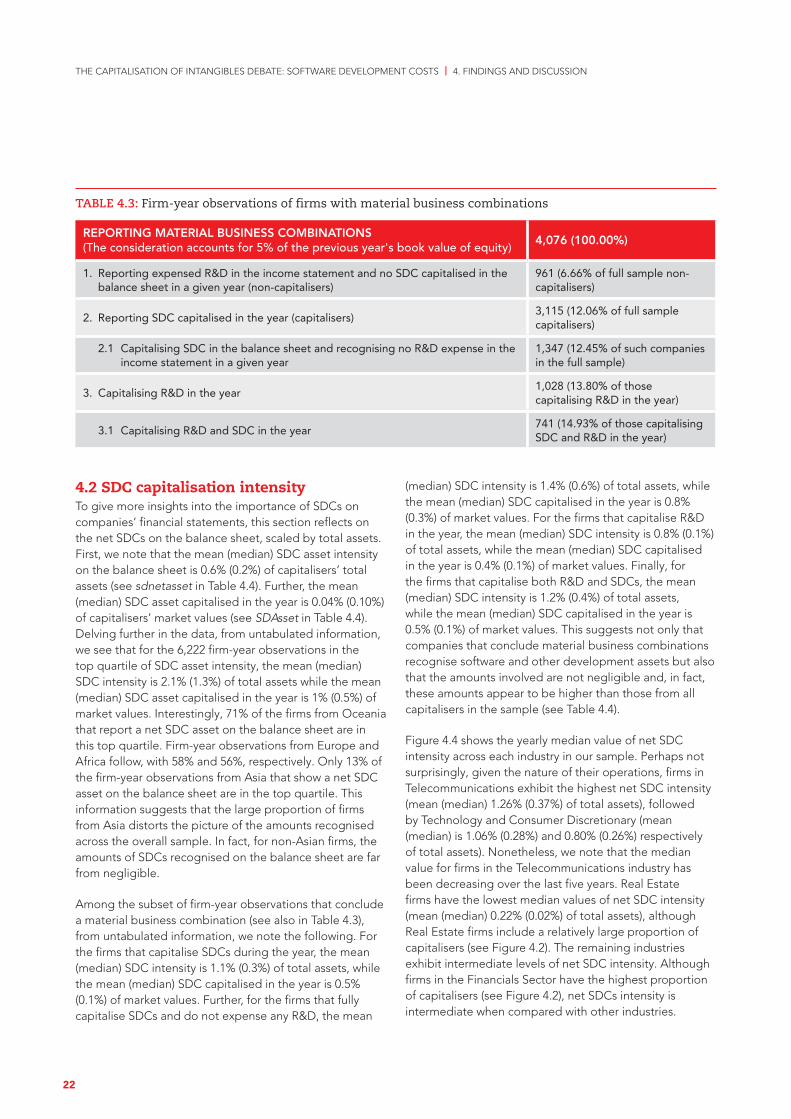
As part of IFRS 3 requirements, when companies complete a business combination they should recognise other intangible assets acquired (including SDCs) separately from goodwill. To explore the influence of business combinations on companies’ SDC intensity levels and frequency of annual capitalisation, we explore the 4,076 firm-year observations that conclude material business combinations during the year and present relevant information in Table 4.3.
Of these firm-year observations, a large proportion (3,115 firm-year observations – 76.4%) capitalise SDCs during the year (this represents 12.06% of the firms that capitalise SDCs during the year in the entire sample). Of these, 1,347 fully capitalise SDCs and do not expense any R&D (this represents 12.45% of such companies in the entire sample). Additionally, we note that 1,028 firm-year observations exhibit material business combinations and capitalise R&D in the year (this represents 13.80% of the firm-year observations that capitalise R&D in the year in the entire sample). Of these, 741 firm-year observations capitalise both R&D and SDCs (this represents 14.93% of the firms in the entire sample that recognise both types of intangibles during the year). Overall, these results indicate that the majority of companies that conclude material business combinations do recognise software and other development assets.
19
THE CAPITALISATION OF INTANGIBLES DEBATE: SOFTWARE DEVELOPMENT COSTS | 4. FINDINGS AND DISCUSSION
Argentina
Australia
Austria
Belgium
Brazil
Canada
Switzerland
Chile
China
Colombia
Germany
Denmark
Spain
Finland
France
United Kingdom
Greece
Hong Kong
Indonesia
India
Ireland
Israel
Italy
Jordan
Japan
Korea (Republic of)
Mexico
Malaysia
Netherlands
Norway
New Zealand
Peru
Philippines
Portugal
Singapore
Sweden
Turkey
Taiwan, Province of China
South Africa
0% 10% 20% 30% 40% 50% 60% 70% 80% 90% 100%
n % Capitalisers n % Non-capitalisers
FIGURE 4.1: Proportion of capitalisers and non-capitalisers across countries
20
THE CAPITALISATION OF INTANGIBLES DEBATE: SOFTWARE DEVELOPMENT COSTS | 4. FINDINGS AND DISCUSSION
Banks
Life Insurance
Non-life Insurance
REITs
Finance & Credit Svs
Travel & Leisure
Real Estate Inv & Svs
Inv. Banking & Broker
Retailers
Health Care Providers
Telecom. Svs. Prvds.
Consumer Services
Electricity
Media
Gas, Water & Mul Util
Ind. Transportation
Ind. Support Services
Drug & Grocery Stores
Construction & Mats
Personal Goods
0% 10% 20% 30% 40% 50% 60% 70% 80% 90% 100%
n % Capitalisers n % Non-capitalisers
FIGURE 4.3: Proportion of capitalisers and non-capitalisers for Sectors with a high proportion of capitalisers
FIGURE 4.2: Proportion of capitalisers and non-capitalisers across industries
Basic Materials
Consumer Discretionary
Consumer Staples
Financials
Health Care
Industrials
Real Estate
Technology
Telecommunications
Utilities
0% 10% 20% 30% 40% 50% 60% 70% 80% 90% 100%
n % Capitalisers n % Non-capitalisers
21
THE CAPITALISATION OF INTANGIBLES DEBATE: SOFTWARE DEVELOPMENT COSTS | 4. FINDINGS AND DISCUSSION
4.2 SDC capitalisation intensityTo give more insights into the importance of SDCs on companies’ financial statements, this section reflects on the net SDCs on the balance sheet, scaled by total assets. First, we note that the mean (median) SDC asset intensity on the balance sheet is 0.6% (0.2%) of capitalisers’ total assets (see sdnetasset in Table 4.4). Further, the mean (median) SDC asset capitalised in the year is 0.04% (0.10%) of capitalisers’ market values (see SDAsset in Table 4.4). Delving further in the data, from untabulated information, we see that for the 6,222 firm-year observations in the top quartile of SDC asset intensity, the mean (median) SDC intensity is 2.1% (1.3%) of total assets while the mean (median) SDC asset capitalised in the year is 1% (0.5%) of market values. Interestingly, 71% of the firms from Oceania that report a net SDC asset on the balance sheet are in this top quartile. Firm-year observations from Europe and Africa follow, with 58% and 56%, respectively. Only 13% of the firm-year observations from Asia that show a net SDC asset on the balance sheet are in the top quartile. This information suggests that the large proportion of firms from Asia distorts the picture of the amounts recognised across the overall sample. In fact, for non-Asian firms, the amounts of SDCs recognised on the balance sheet are far from negligible.
Among the subset of firm-year observations that conclude a material business combination (see also in Table 4.3), from untabulated information, we note the following. For the firms that capitalise SDCs during the year, the mean (median) SDC intensity is 1.1% (0.3%) of total assets, while the mean (median) SDC capitalised in the year is 0.5% (0.1%) of market values. Further, for the firms that fully capitalise SDCs and do not expense any R&D, the mean
(median) SDC intensity is 1.4% (0.6%) of total assets, while the mean (median) SDC capitalised in the year is 0.8% (0.3%) of market values. For the firms that capitalise R&D in the year, the mean (median) SDC intensity is 0.8% (0.1%) of total assets, while the mean (median) SDC capitalised in the year is 0.4% (0.1%) of market values. Finally, for the firms that capitalise both R&D and SDCs, the mean (median) SDC intensity is 1.2% (0.4%) of total assets, while the mean (median) SDC capitalised in the year is 0.5% (0.1%) of market values. This suggests not only that companies that conclude material business combinations recognise software and other development assets but also that the amounts involved are not negligible and, in fact, these amounts appear to be higher than those from all capitalisers in the sample (see Table 4.4).
Figure 4.4 shows the yearly median value of net SDC intensity across each industry in our sample. Perhaps not surprisingly, given the nature of their operations, firms in Telecommunications exhibit the highest net SDC intensity (mean (median) 1.26% (0.37%) of total assets), followed by Technology and Consumer Discretionary (mean (median) is 1.06% (0.28%) and 0.80% (0.26%) respectively of total assets). Nonetheless, we note that the median value for firms in the Telecommunications industry has been decreasing over the last five years. Real Estate firms have the lowest median values of net SDC intensity (mean (median) 0.22% (0.02%) of total assets), although Real Estate firms include a relatively large proportion of capitalisers (see Figure 4.2). The remaining industries exhibit intermediate levels of net SDC intensity. Although firms in the Financials Sector have the highest proportion of capitalisers (see Figure 4.2), net SDCs intensity is intermediate when compared with other industries.
TABLE 4.3: Firm-year observations of firms with material business combinations
REPORTING MATERIAL BUSINESS COMBINATIONS (The consideration accounts for 5% of the previous year's book value of equity)
4,076 (100.00%)
1. Reporting expensed R&D in the income statement and no SDC capitalised in the balance sheet in a given year (non-capitalisers)
961 (6.66% of full sample non-capitalisers)
2. Reporting SDC capitalised in the year (capitalisers)3,115 (12.06% of full sample capitalisers)
2.1 Capitalising SDC in the balance sheet and recognising no R&D expense in the income statement in a given year
1,347 (12.45% of such companies in the full sample)
3. Capitalising R&D in the year1,028 (13.80% of those capitalising R&D in the year)
3.1 Capitalising R&D and SDC in the year741 (14.93% of those capitalising SDC and R&D in the year)
22

THE CAPITALISATION OF INTANGIBLES DEBATE: SOFTWARE DEVELOPMENT COSTS | 4. FINDINGS AND DISCUSSION
Figure 4.5 plots the yearly median values of net SDC intensity for each of the geographic areas/regions to which the countries included in our sample belong.11 Firms from Oceania (ie firms from New Zealand and Australia) exhibit the highest intensity (mean (median) 2.22% (1.32%) of total assets). European and South African firms tend to present the second- and third-highest values of SDC assets in proportion to total assets (mean (median) for Europe: 1.51% (0.73%); mean (median) for Africa: 1.28% (0.66%) of total assets). Firms from Asia, exhibit the lowest net SDC intensity (mean (median) 0.32% (0.11%) of total assets). This, and the fact that firms from this region represent the largest proportion of our sample (63.89%, see Table 3.2), explains the relatively low SDC intensity levels across the full sample and brings to light an interesting feature of the firms in Asia. Although many of them report separately an SDC asset capitalised or an R&D expense, the amounts capitalised on the balance sheet are far smaller than corresponding amounts in other regions.
At a broader level, the information in these graphs demonstrates that, on average, companies appear to have a relatively stable investment in software as reflected on their balance sheets, with no increasing trend relative to total assets over the last five years.
Further, to demonstrate the variation in the way companies describe the reasons behind their investment in SDCs, along with the relevant disclosures provided within their financial statements, we drew on the annual reports of 100 random firms from our sample that have high SDC asset intensity and come from different sectors and different countries and regions. Appendix C presents extracts from the financial statements of 15 such firms that we have selected from this analysis and that could be considered examples of good disclosure practice, including mentions of SDC capitalisation as a key audit matter in auditors’ reports.
11 Drawing on Table 3.2, Africa includes firms from South Africa while America includes firms from Argentina, Brazil, Canada, Chile, Colombia, Mexico and Peru. Asia includes firms from China, Hong Kong, India, Indonesia, Israel, Japan, Jordan, Korea, Malaysia, Philippines, Singapore, and Taiwan. Finally, Europe includes firms from Austria, Belgium, Denmark, Finland, France, Germany, Greece, Ireland, Italy, Netherlands, Norway, Portugal, Spain, Sweden, Switzerland, Turkey and the United Kingdom.
0.0%
0.1%
0.2%
0.3%
0.4%
0.5%
0.6% Basic materials
Consumer Discretionary
Consumer Staples
Financials
Health Care
Industrials
Real Estate
Technology
Telecommunications
Utilities2015 2016 2017 2018 2019
FIGURE 4.4: Net software asset intensity across industries
FIGURE 4.5: Net software asset intensity across regions
Yearly median net SDC asset on the balance sheet, scaled by total assets.
0.0%
0.5%
1.0%
1.5%
2.0% Africa
America
Asia
Europe
Oceania
2015 2016 2017 2018 2019
Yearly median net SDC asset on the balance sheet, scaled by total assets.
23
THE CAPITALISATION OF INTANGIBLES DEBATE: SOFTWARE DEVELOPMENT COSTS | 4. FINDINGS AND DISCUSSION
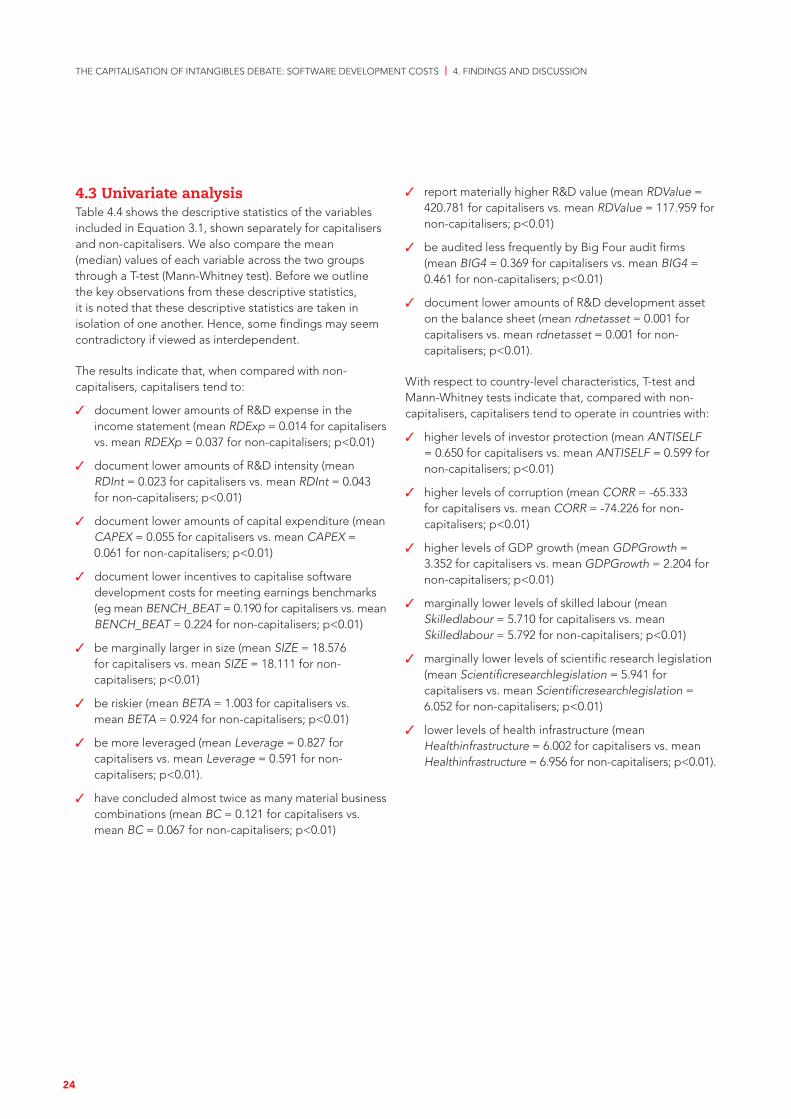
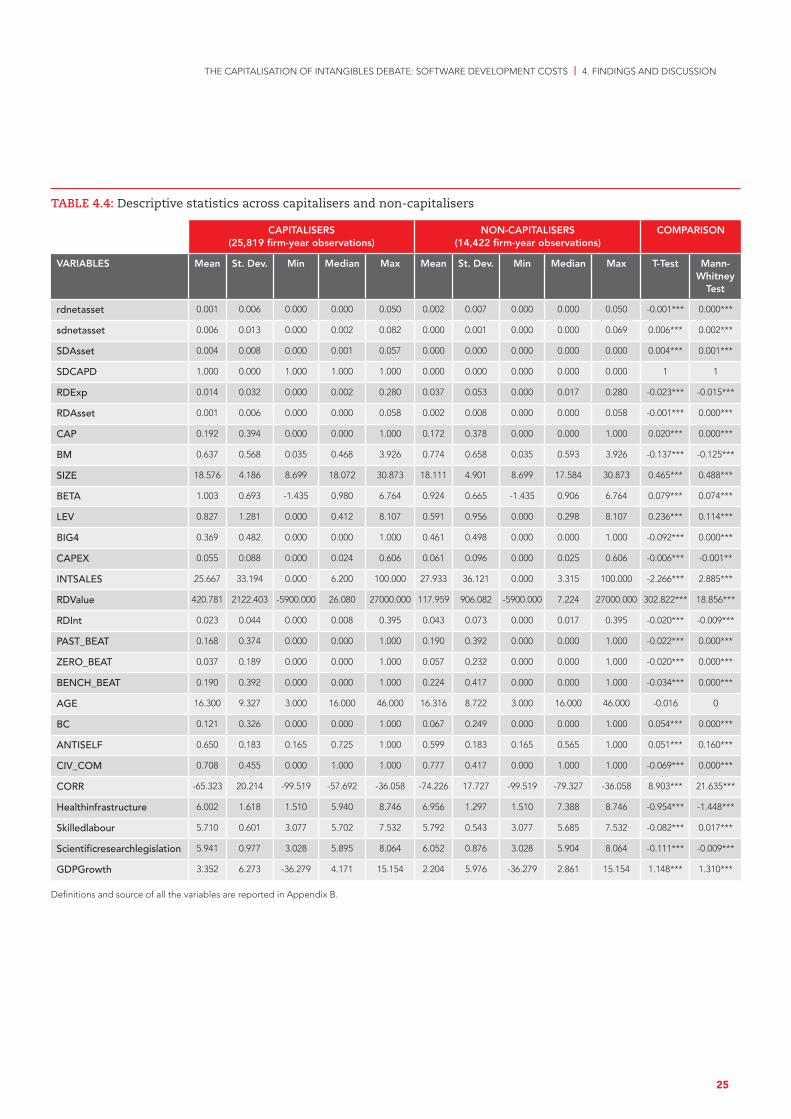
4.3 Univariate analysisTable 4.4 shows the descriptive statistics of the variables included in Equation 3.1, shown separately for capitalisers and non-capitalisers. We also compare the mean (median) values of each variable across the two groups through a T-test (Mann-Whitney test). Before we outline the key observations from these descriptive statistics, it is noted that these descriptive statistics are taken in isolation of one another. Hence, some findings may seem contradictory if viewed as interdependent.
The results indicate that, when compared with non-capitalisers, capitalisers tend to:
✓ document lower amounts of R&D expense in the income statement (mean RDExp = 0.014 for capitalisers vs. mean RDEXp = 0.037 for non-capitalisers; p<0.01)
✓ document lower amounts of R&D intensity (mean RDInt = 0.023 for capitalisers vs. mean RDInt = 0.043 for non-capitalisers; p<0.01)
✓ document lower amounts of capital expenditure (mean CAPEX = 0.055 for capitalisers vs. mean CAPEX = 0.061 for non-capitalisers; p<0.01)
✓ document lower incentives to capitalise software development costs for meeting earnings benchmarks (eg mean BENCH_BEAT = 0.190 for capitalisers vs. mean BENCH_BEAT = 0.224 for non-capitalisers; p<0.01)
✓ be marginally larger in size (mean SIZE = 18.576 for capitalisers vs. mean SIZE = 18.111 for non-capitalisers; p<0.01)
✓ be riskier (mean BETA = 1.003 for capitalisers vs. mean BETA = 0.924 for non-capitalisers; p<0.01)
✓ be more leveraged (mean Leverage = 0.827 for capitalisers vs. mean Leverage = 0.591 for non-capitalisers; p<0.01).
✓ have concluded almost twice as many material business combinations (mean BC = 0.121 for capitalisers vs. mean BC = 0.067 for non-capitalisers; p<0.01)
✓ report materially higher R&D value (mean RDValue = 420.781 for capitalisers vs. mean RDValue = 117.959 for non-capitalisers; p<0.01)
✓ be audited less frequently by Big Four audit firms (mean BIG4 = 0.369 for capitalisers vs. mean BIG4 = 0.461 for non-capitalisers; p<0.01)
✓ document lower amounts of R&D development asset on the balance sheet (mean rdnetasset = 0.001 for capitalisers vs. mean rdnetasset = 0.001 for non-capitalisers; p<0.01).
With respect to country-level characteristics, T-test and Mann-Whitney tests indicate that, compared with non-capitalisers, capitalisers tend to operate in countries with:
✓ higher levels of investor protection (mean ANTISELF = 0.650 for capitalisers vs. mean ANTISELF = 0.599 for non-capitalisers; p<0.01)
✓ higher levels of corruption (mean CORR = -65.333 for capitalisers vs. mean CORR = -74.226 for non-capitalisers; p<0.01)
✓ higher levels of GDP growth (mean GDPGrowth = 3.352 for capitalisers vs. mean GDPGrowth = 2.204 for non-capitalisers; p<0.01)
✓ marginally lower levels of skilled labour (mean Skilledlabour = 5.710 for capitalisers vs. mean Skilledlabour = 5.792 for non-capitalisers; p<0.01)
✓ marginally lower levels of scientific research legislation (mean Scientificresearchlegislation = 5.941 for capitalisers vs. mean Scientificresearchlegislation = 6.052 for non-capitalisers; p<0.01)
✓ lower levels of health infrastructure (mean Healthinfrastructure = 6.002 for capitalisers vs. mean Healthinfrastructure = 6.956 for non-capitalisers; p<0.01).
24
THE CAPITALISATION OF INTANGIBLES DEBATE: SOFTWARE DEVELOPMENT COSTS | 4. FINDINGS AND DISCUSSION
TABLE 4.4: Descriptive statistics across capitalisers and non-capitalisers
CAPITALISERS (25,819 firm-year observations)
NON-CAPITALISERS (14,422 firm-year observations)
COMPARISON
VARIABLES Mean St. Dev. Min Median Max Mean St. Dev. Min Median Max T-Test Mann-Whitney
Test
rdnetasset 0.001 0.006 0.000 0.000 0.050 0.002 0.007 0.000 0.000 0.050 -0.001*** 0.000***
sdnetasset 0.006 0.013 0.000 0.002 0.082 0.000 0.001 0.000 0.000 0.069 0.006*** 0.002***
SDAsset 0.004 0.008 0.000 0.001 0.057 0.000 0.000 0.000 0.000 0.000 0.004*** 0.001***
SDCAPD 1.000 0.000 1.000 1.000 1.000 0.000 0.000 0.000 0.000 0.000 1 1
RDExp 0.014 0.032 0.000 0.002 0.280 0.037 0.053 0.000 0.017 0.280 -0.023*** -0.015***
RDAsset 0.001 0.006 0.000 0.000 0.058 0.002 0.008 0.000 0.000 0.058 -0.001*** 0.000***
CAP 0.192 0.394 0.000 0.000 1.000 0.172 0.378 0.000 0.000 1.000 0.020*** 0.000***
BM 0.637 0.568 0.035 0.468 3.926 0.774 0.658 0.035 0.593 3.926 -0.137*** -0.125***
SIZE 18.576 4.186 8.699 18.072 30.873 18.111 4.901 8.699 17.584 30.873 0.465*** 0.488***
BETA 1.003 0.693 -1.435 0.980 6.764 0.924 0.665 -1.435 0.906 6.764 0.079*** 0.074***
LEV 0.827 1.281 0.000 0.412 8.107 0.591 0.956 0.000 0.298 8.107 0.236*** 0.114***
BIG4 0.369 0.482 0.000 0.000 1.000 0.461 0.498 0.000 0.000 1.000 -0.092*** 0.000***
CAPEX 0.055 0.088 0.000 0.024 0.606 0.061 0.096 0.000 0.025 0.606 -0.006*** -0.001**
INTSALES 25.667 33.194 0.000 6.200 100.000 27.933 36.121 0.000 3.315 100.000 -2.266*** 2.885***
RDValue 420.781 2122.403 -5900.000 26.080 27000.000 117.959 906.082 -5900.000 7.224 27000.000 302.822*** 18.856***
RDInt 0.023 0.044 0.000 0.008 0.395 0.043 0.073 0.000 0.017 0.395 -0.020*** -0.009***
PAST_BEAT 0.168 0.374 0.000 0.000 1.000 0.190 0.392 0.000 0.000 1.000 -0.022*** 0.000***
ZERO_BEAT 0.037 0.189 0.000 0.000 1.000 0.057 0.232 0.000 0.000 1.000 -0.020*** 0.000***
BENCH_BEAT 0.190 0.392 0.000 0.000 1.000 0.224 0.417 0.000 0.000 1.000 -0.034*** 0.000***
AGE 16.300 9.327 3.000 16.000 46.000 16.316 8.722 3.000 16.000 46.000 -0.016 0
BC 0.121 0.326 0.000 0.000 1.000 0.067 0.249 0.000 0.000 1.000 0.054*** 0.000***
ANTISELF 0.650 0.183 0.165 0.725 1.000 0.599 0.183 0.165 0.565 1.000 0.051*** 0.160***
CIV_COM 0.708 0.455 0.000 1.000 1.000 0.777 0.417 0.000 1.000 1.000 -0.069*** 0.000***
CORR -65.323 20.214 -99.519 -57.692 -36.058 -74.226 17.727 -99.519 -79.327 -36.058 8.903*** 21.635***
Healthinfrastructure 6.002 1.618 1.510 5.940 8.746 6.956 1.297 1.510 7.388 8.746 -0.954*** -1.448***
Skilledlabour 5.710 0.601 3.077 5.702 7.532 5.792 0.543 3.077 5.685 7.532 -0.082*** 0.017***
Scientificresearchlegislation 5.941 0.977 3.028 5.895 8.064 6.052 0.876 3.028 5.904 8.064 -0.111*** -0.009***
GDPGrowth 3.352 6.273 -36.279 4.171 15.154 2.204 5.976 -36.279 2.861 15.154 1.148*** 1.310***
Definitions and source of all the variables are reported in Appendix B.
25
THE CAPITALISATION OF INTANGIBLES DEBATE: SOFTWARE DEVELOPMENT COSTS | 4. FINDINGS AND DISCUSSION
4.4 Multivariate analysis4.4.1. Full sampleAs the univariate analysis provided earlier does not necessarily identify influential factors associated with the decision to capitalise SDCs or the amounts of SDCs capitalised, Table 4.5 provides four models of multivariate analysis, presenting the empirical implementation of Equation 3.1 for the entire sample. The dependent variables are the decision to capitalise (Models 1 and 2) and the amount of SDCs capitalised in a given year (Models 3 and 4). The models differ only in the use of alternative measures to proxy for incentives to manipulate earnings by SDCs. Specifically, Models 1 and 3 employ PAST_BEAT and ZERO_BEAT while Models 2 and 4 use BENCH_BEAT. The latter effectively combines PAST_BEAT and ZERO_BEAT as it is also a binary variable and indicates if PAST_BEAT or ZERO_BEAT is one (1).
For firm-level determinants of the decision to capitalise SDCs, SIZE, BETA, LEV, BIG4, INTSALES, PAST_BEAT, ZERO_BEAT, CAP and BC report a positive and statistically significant coefficient. This suggests that companies more likely to decide to capitalise SDCs are larger, riskier, have higher leverage, employ one of the Big Four auditors, have more international sales, have incentives
to capitalise SDCs to meet their earnings targets and capitalise other development costs, and have concluded material business combinations during the year. Conversely, firms with greater growth opportunities (high book-to-market ratio) and higher R&D intensity are less likely to capitalise SDCs (coefficients of BM and RDInt are negative and statistically significant).
Looking at the coefficients of the country-level variables, we infer that firms likely to decide to capitalise SDCs are headquartered in countries with more skilled labour and better scientific research legislation (Skilledlabour and Scientificresearchlegislation have positive and statistically significant coefficients). Instead, non-capitalisers are more likely to operate in countries with better health infrastructure (Healthinfrastructure has a negative and statistically significant coefficient).
The coefficients reported in Models 3 and 4 indicate that almost all factors associated with the decision to capitalise SDCs are also associated with the amounts of SDCs capitalised and in the same direction. The only exception/additional factor is being headquartered in countries with higher investor protection. This is positively associated with higher amounts of SDCs capitalised.
26
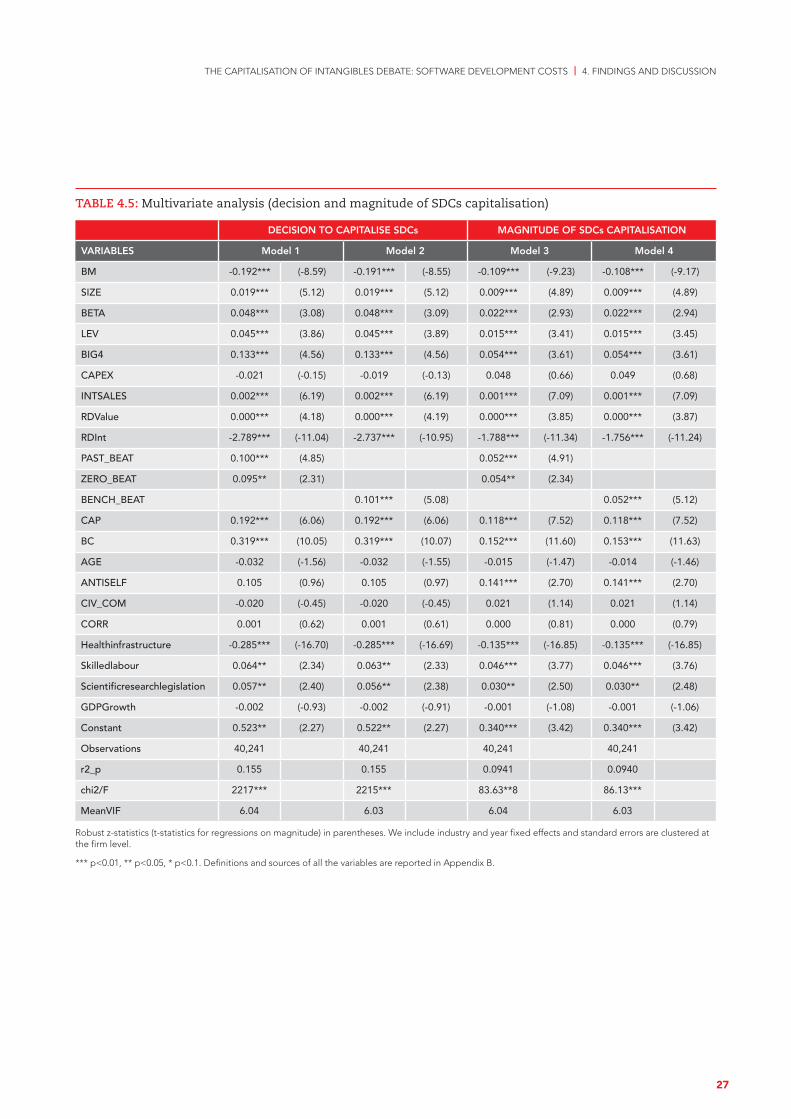
THE CAPITALISATION OF INTANGIBLES DEBATE: SOFTWARE DEVELOPMENT COSTS | 4. FINDINGS AND DISCUSSION
TABLE 4.5: Multivariate analysis (decision and magnitude of SDCs capitalisation)
DECISION TO CAPITALISE SDCs MAGNITUDE OF SDCs CAPITALISATION
VARIABLES Model 1 Model 2 Model 3 Model 4
BM -0.192*** (-8.59) -0.191*** (-8.55) -0.109*** (-9.23) -0.108*** (-9.17)
SIZE 0.019*** (5.12) 0.019*** (5.12) 0.009*** (4.89) 0.009*** (4.89)
BETA 0.048*** (3.08) 0.048*** (3.09) 0.022*** (2.93) 0.022*** (2.94)
LEV 0.045*** (3.86) 0.045*** (3.89) 0.015*** (3.41) 0.015*** (3.45)
BIG4 0.133*** (4.56) 0.133*** (4.56) 0.054*** (3.61) 0.054*** (3.61)
CAPEX -0.021 (-0.15) -0.019 (-0.13) 0.048 (0.66) 0.049 (0.68)
INTSALES 0.002*** (6.19) 0.002*** (6.19) 0.001*** (7.09) 0.001*** (7.09)
RDValue 0.000*** (4.18) 0.000*** (4.19) 0.000*** (3.85) 0.000*** (3.87)
RDInt -2.789*** (-11.04) -2.737*** (-10.95) -1.788*** (-11.34) -1.756*** (-11.24)
PAST_BEAT 0.100*** (4.85) 0.052*** (4.91)
ZERO_BEAT 0.095** (2.31) 0.054** (2.34)
BENCH_BEAT 0.101*** (5.08) 0.052*** (5.12)
CAP 0.192*** (6.06) 0.192*** (6.06) 0.118*** (7.52) 0.118*** (7.52)
BC 0.319*** (10.05) 0.319*** (10.07) 0.152*** (11.60) 0.153*** (11.63)
AGE -0.032 (-1.56) -0.032 (-1.55) -0.015 (-1.47) -0.014 (-1.46)
ANTISELF 0.105 (0.96) 0.105 (0.97) 0.141*** (2.70) 0.141*** (2.70)
CIV_COM -0.020 (-0.45) -0.020 (-0.45) 0.021 (1.14) 0.021 (1.14)
CORR 0.001 (0.62) 0.001 (0.61) 0.000 (0.81) 0.000 (0.79)
Healthinfrastructure -0.285*** (-16.70) -0.285*** (-16.69) -0.135*** (-16.85) -0.135*** (-16.85)
Skilledlabour 0.064** (2.34) 0.063** (2.33) 0.046*** (3.77) 0.046*** (3.76)
Scientificresearchlegislation 0.057** (2.40) 0.056** (2.38) 0.030** (2.50) 0.030** (2.48)
GDPGrowth -0.002 (-0.93) -0.002 (-0.91) -0.001 (-1.08) -0.001 (-1.06)
Constant 0.523** (2.27) 0.522** (2.27) 0.340*** (3.42) 0.340*** (3.42)
Observations 40,241 40,241 40,241 40,241
r2_p 0.155 0.155 0.0941 0.0940
chi2/F 2217*** 2215*** 83.63**8 86.13***
MeanVIF 6.04 6.03 6.04 6.03
Robust z-statistics (t-statistics for regressions on magnitude) in parentheses. We include industry and year fixed effects and standard errors are clustered at the firm level.
*** p<0.01, ** p<0.05, * p<0.1. Definitions and sources of all the variables are reported in Appendix B.
27
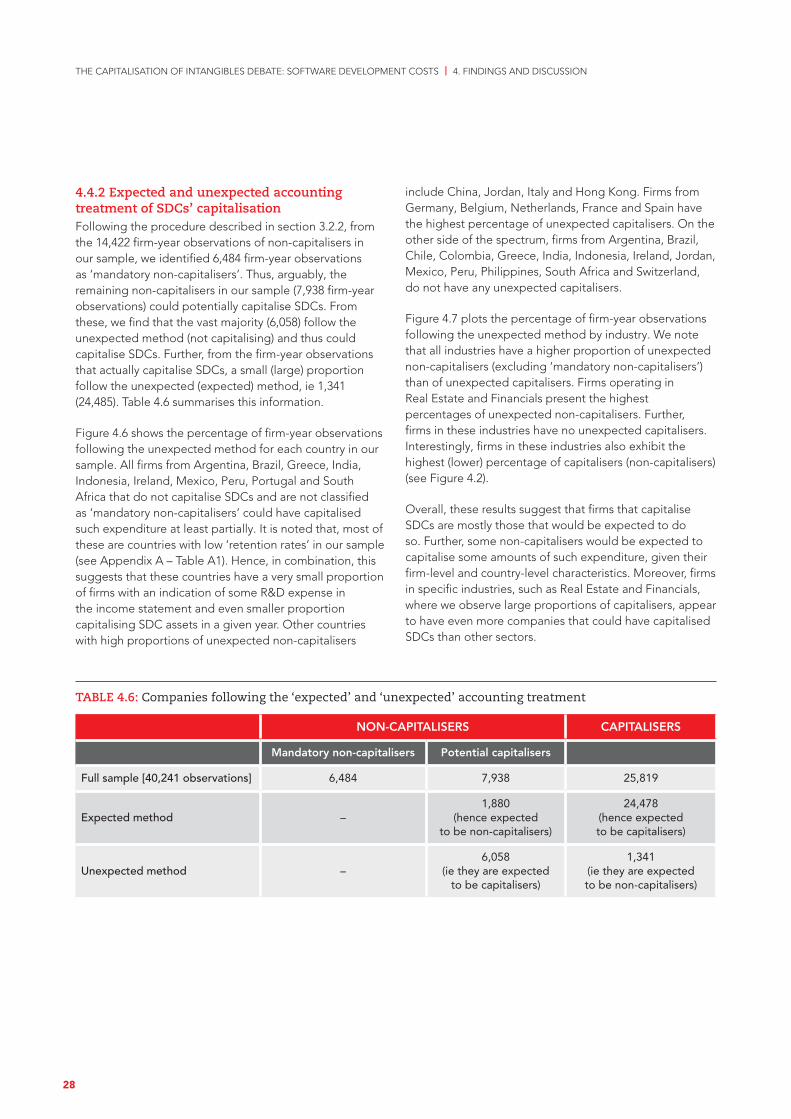
THE CAPITALISATION OF INTANGIBLES DEBATE: SOFTWARE DEVELOPMENT COSTS | 4. FINDINGS AND DISCUSSION
4.4.2 Expected and unexpected accounting treatment of SDCs’ capitalisationFollowing the procedure described in section 3.2.2, from the 14,422 firm-year observations of non-capitalisers in our sample, we identified 6,484 firm-year observations as ‘mandatory non-capitalisers’. Thus, arguably, the remaining non-capitalisers in our sample (7,938 firm-year observations) could potentially capitalise SDCs. From these, we find that the vast majority (6,058) follow the unexpected method (not capitalising) and thus could capitalise SDCs. Further, from the firm-year observations that actually capitalise SDCs, a small (large) proportion follow the unexpected (expected) method, ie 1,341 (24,485). Table 4.6 summarises this information.
Figure 4.6 shows the percentage of firm-year observations following the unexpected method for each country in our sample. All firms from Argentina, Brazil, Greece, India, Indonesia, Ireland, Mexico, Peru, Portugal and South Africa that do not capitalise SDCs and are not classified as ‘mandatory non-capitalisers’ could have capitalised such expenditure at least partially. It is noted that, most of these are countries with low ‘retention rates’ in our sample (see Appendix A – Table A1). Hence, in combination, this suggests that these countries have a very small proportion of firms with an indication of some R&D expense in the income statement and even smaller proportion capitalising SDC assets in a given year. Other countries with high proportions of unexpected non-capitalisers
include China, Jordan, Italy and Hong Kong. Firms from Germany, Belgium, Netherlands, France and Spain have the highest percentage of unexpected capitalisers. On the other side of the spectrum, firms from Argentina, Brazil, Chile, Colombia, Greece, India, Indonesia, Ireland, Jordan, Mexico, Peru, Philippines, South Africa and Switzerland, do not have any unexpected capitalisers.
Figure 4.7 plots the percentage of firm-year observations following the unexpected method by industry. We note that all industries have a higher proportion of unexpected non-capitalisers (excluding ‘mandatory non-capitalisers’) than of unexpected capitalisers. Firms operating in Real Estate and Financials present the highest percentages of unexpected non-capitalisers. Further, firms in these industries have no unexpected capitalisers. Interestingly, firms in these industries also exhibit the highest (lower) percentage of capitalisers (non-capitalisers) (see Figure 4.2).
Overall, these results suggest that firms that capitalise SDCs are mostly those that would be expected to do so. Further, some non-capitalisers would be expected to capitalise some amounts of such expenditure, given their firm-level and country-level characteristics. Moreover, firms in specific industries, such as Real Estate and Financials, where we observe large proportions of capitalisers, appear to have even more companies that could have capitalised SDCs than other sectors.
TABLE 4.6: Companies following the ‘expected’ and ‘unexpected’ accounting treatment
NON-CAPITALISERS CAPITALISERS
Mandatory non-capitalisers Potential capitalisers
Full sample [40,241 observations] 6,484 7,938 25,819
Expected method –1,880
(hence expected to be non-capitalisers)
24,478 (hence expected to be capitalisers)
Unexpected method –6,058
(ie they are expected to be capitalisers)
1,341 (ie they are expected to be non-capitalisers)
28
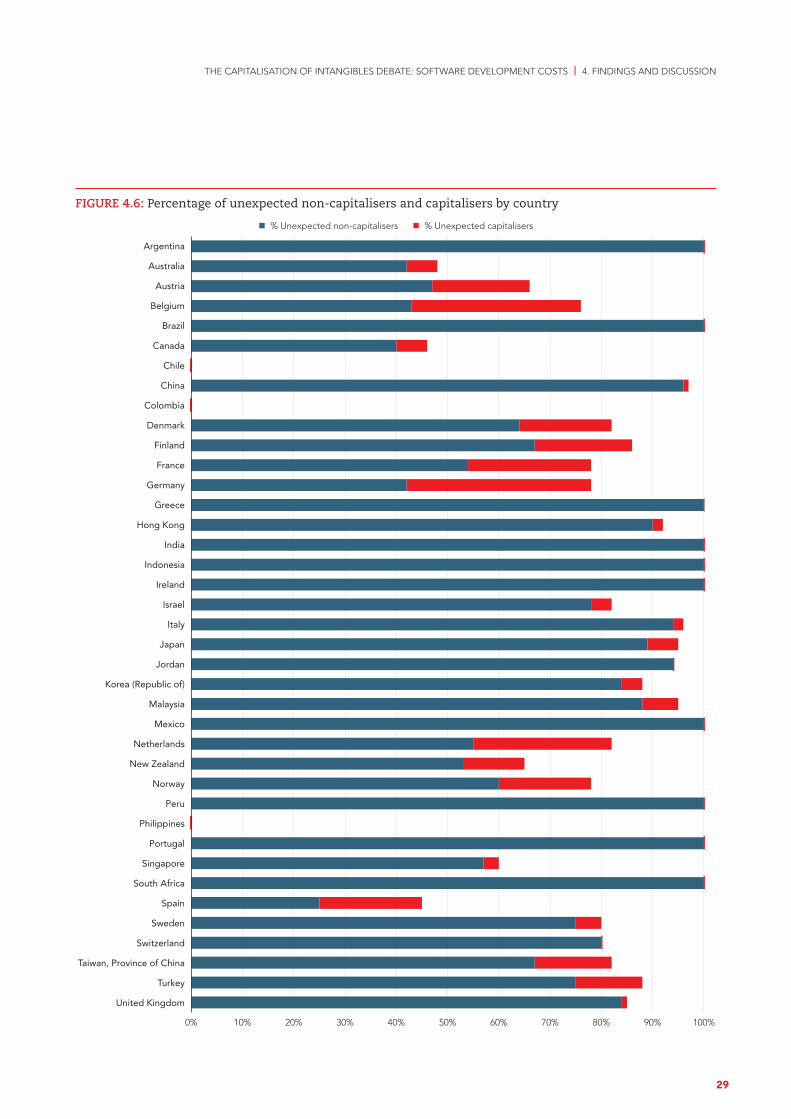
THE CAPITALISATION OF INTANGIBLES DEBATE: SOFTWARE DEVELOPMENT COSTS | 4. FINDINGS AND DISCUSSION
FIGURE 4.6: Percentage of unexpected non-capitalisers and capitalisers by country
Argentina
Australia
Austria
Belgium
Brazil
Canada
Chile
China
Colombia
Denmark
Finland
France
Germany
Greece
Hong Kong
India
Indonesia
Ireland
Israel
Italy
Japan
Jordan
Korea (Republic of)
Malaysia
Mexico
Netherlands
New Zealand
Norway
Peru
Philippines
Portugal
Singapore
South Africa
Spain
Sweden
Switzerland
Taiwan, Province of China
Turkey
United Kingdom
0% 10% 20% 30% 40% 50% 60% 70% 80% 90% 100%
n % Unexpected non-capitalisers n % Unexpected capitalisers
29
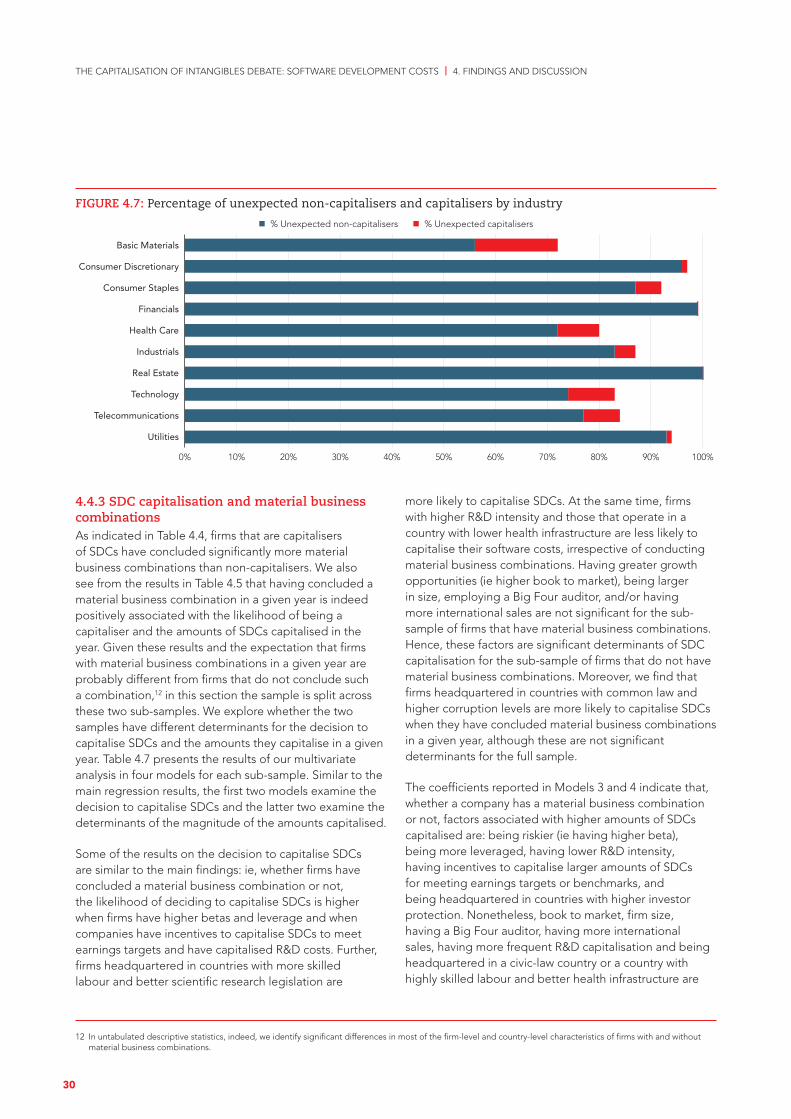
THE CAPITALISATION OF INTANGIBLES DEBATE: SOFTWARE DEVELOPMENT COSTS | 4. FINDINGS AND DISCUSSION
4.4.3 SDC capitalisation and material business combinationsAs indicated in Table 4.4, firms that are capitalisers of SDCs have concluded significantly more material business combinations than non-capitalisers. We also see from the results in Table 4.5 that having concluded a material business combination in a given year is indeed positively associated with the likelihood of being a capitaliser and the amounts of SDCs capitalised in the year. Given these results and the expectation that firms with material business combinations in a given year are probably different from firms that do not conclude such a combination,12 in this section the sample is split across these two sub-samples. We explore whether the two samples have different determinants for the decision to capitalise SDCs and the amounts they capitalise in a given year. Table 4.7 presents the results of our multivariate analysis in four models for each sub-sample. Similar to the main regression results, the first two models examine the decision to capitalise SDCs and the latter two examine the determinants of the magnitude of the amounts capitalised.
Some of the results on the decision to capitalise SDCs are similar to the main findings: ie, whether firms have concluded a material business combination or not, the likelihood of deciding to capitalise SDCs is higher when firms have higher betas and leverage and when companies have incentives to capitalise SDCs to meet earnings targets and have capitalised R&D costs. Further, firms headquartered in countries with more skilled labour and better scientific research legislation are
more likely to capitalise SDCs. At the same time, firms with higher R&D intensity and those that operate in a country with lower health infrastructure are less likely to capitalise their software costs, irrespective of conducting material business combinations. Having greater growth opportunities (ie higher book to market), being larger in size, employing a Big Four auditor, and/or having more international sales are not significant for the sub-sample of firms that have material business combinations. Hence, these factors are significant determinants of SDC capitalisation for the sub-sample of firms that do not have material business combinations. Moreover, we find that firms headquartered in countries with common law and higher corruption levels are more likely to capitalise SDCs when they have concluded material business combinations in a given year, although these are not significant determinants for the full sample.
The coefficients reported in Models 3 and 4 indicate that, whether a company has a material business combination or not, factors associated with higher amounts of SDCs capitalised are: being riskier (ie having higher beta), being more leveraged, having lower R&D intensity, having incentives to capitalise larger amounts of SDCs for meeting earnings targets or benchmarks, and being headquartered in countries with higher investor protection. Nonetheless, book to market, firm size, having a Big Four auditor, having more international sales, having more frequent R&D capitalisation and being headquartered in a civic-law country or a country with highly skilled labour and better health infrastructure are
FIGURE 4.7: Percentage of unexpected non-capitalisers and capitalisers by industry
Basic Materials
Consumer Discretionary
Consumer Staples
Financials
Health Care
Industrials
Real Estate
Technology
Telecommunications
Utilities
0% 10% 20% 30% 40% 50% 60% 70% 80% 90% 100%
n % Unexpected non-capitalisers n % Unexpected capitalisers
12 In untabulated descriptive statistics, indeed, we identify significant differences in most of the firm-level and country-level characteristics of firms with and without material business combinations.
30
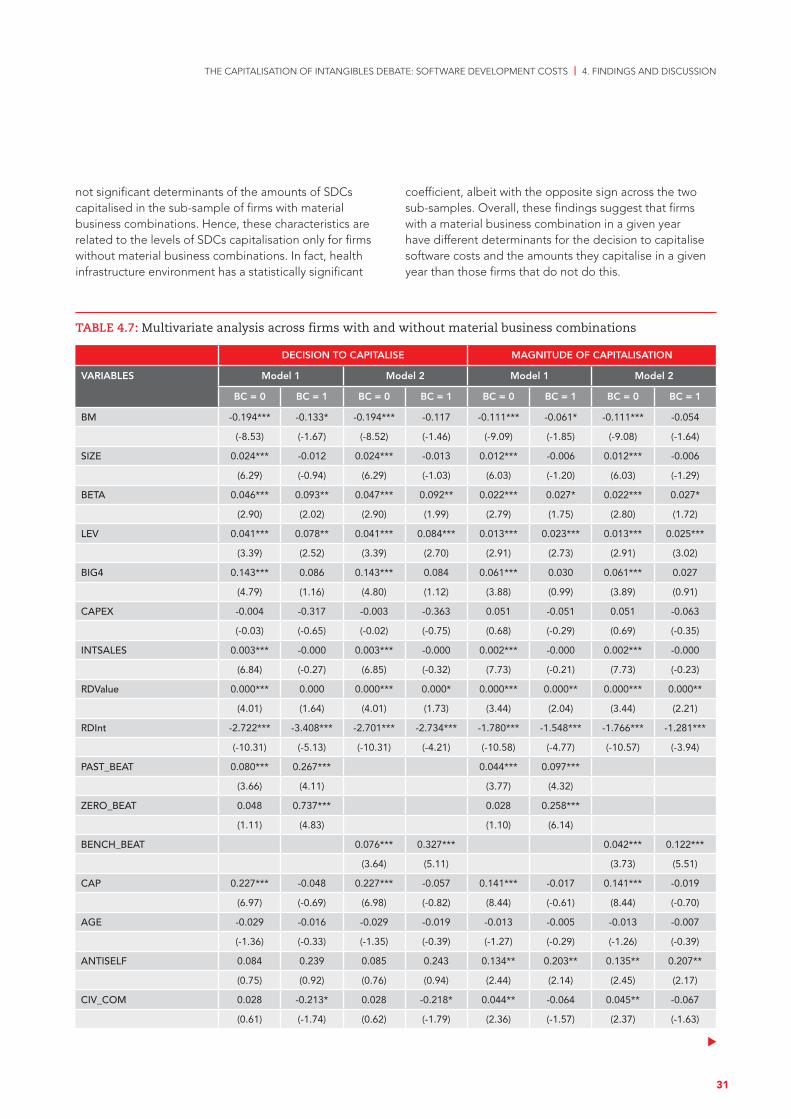
THE CAPITALISATION OF INTANGIBLES DEBATE: SOFTWARE DEVELOPMENT COSTS | 4. FINDINGS AND DISCUSSION
not significant determinants of the amounts of SDCs capitalised in the sub-sample of firms with material business combinations. Hence, these characteristics are related to the levels of SDCs capitalisation only for firms without material business combinations. In fact, health infrastructure environment has a statistically significant
coefficient, albeit with the opposite sign across the two sub-samples. Overall, these findings suggest that firms with a material business combination in a given year have different determinants for the decision to capitalise software costs and the amounts they capitalise in a given year than those firms that do not do this.
DECISION TO CAPITALISE MAGNITUDE OF CAPITALISATION
VARIABLES Model 1 Model 2 Model 1 Model 2
BC = 0 BC = 1 BC = 0 BC = 1 BC = 0 BC = 1 BC = 0 BC = 1
BM -0.194*** -0.133* -0.194*** -0.117 -0.111*** -0.061* -0.111*** -0.054
(-8.53) (-1.67) (-8.52) (-1.46) (-9.09) (-1.85) (-9.08) (-1.64)
SIZE 0.024*** -0.012 0.024*** -0.013 0.012*** -0.006 0.012*** -0.006
(6.29) (-0.94) (6.29) (-1.03) (6.03) (-1.20) (6.03) (-1.29)
BETA 0.046*** 0.093** 0.047*** 0.092** 0.022*** 0.027* 0.022*** 0.027*
(2.90) (2.02) (2.90) (1.99) (2.79) (1.75) (2.80) (1.72)
LEV 0.041*** 0.078** 0.041*** 0.084*** 0.013*** 0.023*** 0.013*** 0.025***
(3.39) (2.52) (3.39) (2.70) (2.91) (2.73) (2.91) (3.02)
BIG4 0.143*** 0.086 0.143*** 0.084 0.061*** 0.030 0.061*** 0.027
(4.79) (1.16) (4.80) (1.12) (3.88) (0.99) (3.89) (0.91)
CAPEX -0.004 -0.317 -0.003 -0.363 0.051 -0.051 0.051 -0.063
(-0.03) (-0.65) (-0.02) (-0.75) (0.68) (-0.29) (0.69) (-0.35)
INTSALES 0.003*** -0.000 0.003*** -0.000 0.002*** -0.000 0.002*** -0.000
(6.84) (-0.27) (6.85) (-0.32) (7.73) (-0.21) (7.73) (-0.23)
RDValue 0.000*** 0.000 0.000*** 0.000* 0.000*** 0.000** 0.000*** 0.000**
(4.01) (1.64) (4.01) (1.73) (3.44) (2.04) (3.44) (2.21)
RDInt -2.722*** -3.408*** -2.701*** -2.734*** -1.780*** -1.548*** -1.766*** -1.281***
(-10.31) (-5.13) (-10.31) (-4.21) (-10.58) (-4.77) (-10.57) (-3.94)
PAST_BEAT 0.080*** 0.267*** 0.044*** 0.097***
(3.66) (4.11) (3.77) (4.32)
ZERO_BEAT 0.048 0.737*** 0.028 0.258***
(1.11) (4.83) (1.10) (6.14)
BENCH_BEAT 0.076*** 0.327*** 0.042*** 0.122***
(3.64) (5.11) (3.73) (5.51)
CAP 0.227*** -0.048 0.227*** -0.057 0.141*** -0.017 0.141*** -0.019
(6.97) (-0.69) (6.98) (-0.82) (8.44) (-0.61) (8.44) (-0.70)
AGE -0.029 -0.016 -0.029 -0.019 -0.013 -0.005 -0.013 -0.007
(-1.36) (-0.33) (-1.35) (-0.39) (-1.27) (-0.29) (-1.26) (-0.39)
ANTISELF 0.084 0.239 0.085 0.243 0.134** 0.203** 0.135** 0.207**
(0.75) (0.92) (0.76) (0.94) (2.44) (2.14) (2.45) (2.17)
CIV_COM 0.028 -0.213* 0.028 -0.218* 0.044** -0.064 0.045** -0.067
(0.61) (-1.74) (0.62) (-1.79) (2.36) (-1.57) (2.37) (-1.63)
TABLE 4.7: Multivariate analysis across firms with and without material business combinations
31
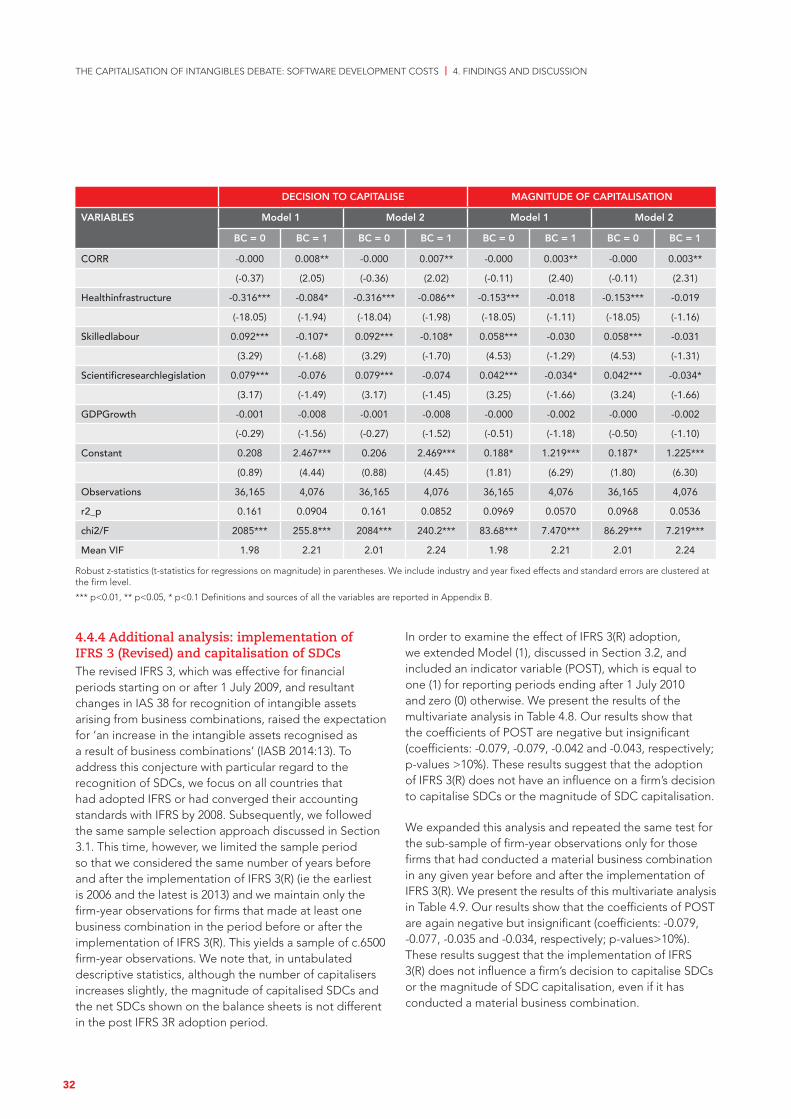
4.4.4 Additional analysis: implementation of IFRS 3 (Revised) and capitalisation of SDCsThe revised IFRS 3, which was effective for financial periods starting on or after 1 July 2009, and resultant changes in IAS 38 for recognition of intangible assets arising from business combinations, raised the expectation for ‘an increase in the intangible assets recognised as a result of business combinations’ (IASB 2014:13). To address this conjecture with particular regard to the recognition of SDCs, we focus on all countries that had adopted IFRS or had converged their accounting standards with IFRS by 2008. Subsequently, we followed the same sample selection approach discussed in Section 3.1. This time, however, we limited the sample period so that we considered the same number of years before and after the implementation of IFRS 3(R) (ie the earliest is 2006 and the latest is 2013) and we maintain only the firm-year observations for firms that made at least one business combination in the period before or after the implementation of IFRS 3(R). This yields a sample of c.6500 firm-year observations. We note that, in untabulated descriptive statistics, although the number of capitalisers increases slightly, the magnitude of capitalised SDCs and the net SDCs shown on the balance sheets is not different in the post IFRS 3R adoption period.
In order to examine the effect of IFRS 3(R) adoption, we extended Model (1), discussed in Section 3.2, and included an indicator variable (POST), which is equal to one (1) for reporting periods ending after 1 July 2010 and zero (0) otherwise. We present the results of the multivariate analysis in Table 4.8. Our results show that the coefficients of POST are negative but insignificant (coefficients: -0.079, -0.079, -0.042 and -0.043, respectively; p-values >10%). These results suggest that the adoption of IFRS 3(R) does not have an influence on a firm’s decision to capitalise SDCs or the magnitude of SDC capitalisation.
We expanded this analysis and repeated the same test for the sub-sample of firm-year observations only for those firms that had conducted a material business combination in any given year before and after the implementation of IFRS 3(R). We present the results of this multivariate analysis in Table 4.9. Our results show that the coefficients of POST are again negative but insignificant (coefficients: -0.079, -0.077, -0.035 and -0.034, respectively; p-values>10%). These results suggest that the implementation of IFRS 3(R) does not influence a firm’s decision to capitalise SDCs or the magnitude of SDC capitalisation, even if it has conducted a material business combination.
DECISION TO CAPITALISE MAGNITUDE OF CAPITALISATION
VARIABLES Model 1 Model 2 Model 1 Model 2
BC = 0 BC = 1 BC = 0 BC = 1 BC = 0 BC = 1 BC = 0 BC = 1
CORR -0.000 0.008** -0.000 0.007** -0.000 0.003** -0.000 0.003**
(-0.37) (2.05) (-0.36) (2.02) (-0.11) (2.40) (-0.11) (2.31)
Healthinfrastructure -0.316*** -0.084* -0.316*** -0.086** -0.153*** -0.018 -0.153*** -0.019
(-18.05) (-1.94) (-18.04) (-1.98) (-18.05) (-1.11) (-18.05) (-1.16)
Skilledlabour 0.092*** -0.107* 0.092*** -0.108* 0.058*** -0.030 0.058*** -0.031
(3.29) (-1.68) (3.29) (-1.70) (4.53) (-1.29) (4.53) (-1.31)
Scientificresearchlegislation 0.079*** -0.076 0.079*** -0.074 0.042*** -0.034* 0.042*** -0.034*
(3.17) (-1.49) (3.17) (-1.45) (3.25) (-1.66) (3.24) (-1.66)
GDPGrowth -0.001 -0.008 -0.001 -0.008 -0.000 -0.002 -0.000 -0.002
(-0.29) (-1.56) (-0.27) (-1.52) (-0.51) (-1.18) (-0.50) (-1.10)
Constant 0.208 2.467*** 0.206 2.469*** 0.188* 1.219*** 0.187* 1.225***
(0.89) (4.44) (0.88) (4.45) (1.81) (6.29) (1.80) (6.30)
Observations 36,165 4,076 36,165 4,076 36,165 4,076 36,165 4,076
r2_p 0.161 0.0904 0.161 0.0852 0.0969 0.0570 0.0968 0.0536
chi2/F 2085*** 255.8*** 2084*** 240.2*** 83.68*** 7.470*** 86.29*** 7.219***
Mean VIF 1.98 2.21 2.01 2.24 1.98 2.21 2.01 2.24
Robust z-statistics (t-statistics for regressions on magnitude) in parentheses. We include industry and year fixed effects and standard errors are clustered at the firm level.
*** p<0.01, ** p<0.05, * p<0.1 Definitions and sources of all the variables are reported in Appendix B.
THE CAPITALISATION OF INTANGIBLES DEBATE: SOFTWARE DEVELOPMENT COSTS | 4. FINDINGS AND DISCUSSION
32
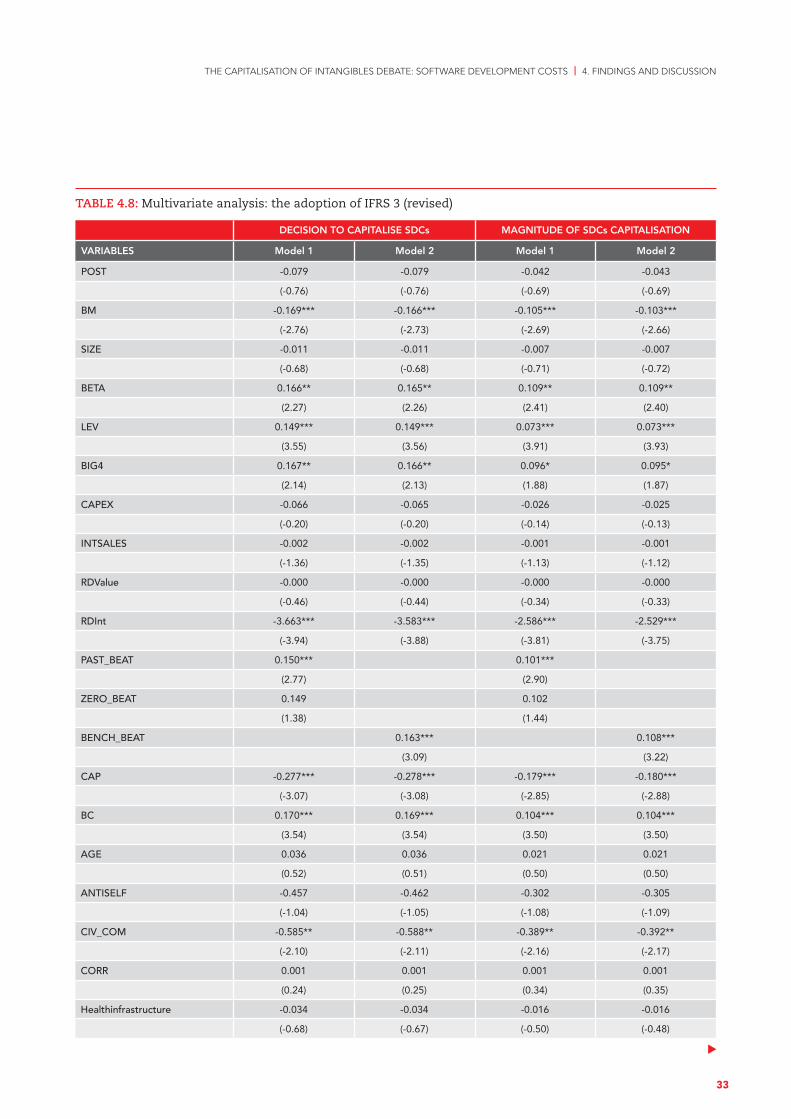
TABLE 4.8: Multivariate analysis: the adoption of IFRS 3 (revised)
DECISION TO CAPITALISE SDCs MAGNITUDE OF SDCs CAPITALISATION
VARIABLES Model 1 Model 2 Model 1 Model 2
POST -0.079 -0.079 -0.042 -0.043
(-0.76) (-0.76) (-0.69) (-0.69)
BM -0.169*** -0.166*** -0.105*** -0.103***
(-2.76) (-2.73) (-2.69) (-2.66)
SIZE -0.011 -0.011 -0.007 -0.007
(-0.68) (-0.68) (-0.71) (-0.72)
BETA 0.166** 0.165** 0.109** 0.109**
(2.27) (2.26) (2.41) (2.40)
LEV 0.149*** 0.149*** 0.073*** 0.073***
(3.55) (3.56) (3.91) (3.93)
BIG4 0.167** 0.166** 0.096* 0.095*
(2.14) (2.13) (1.88) (1.87)
CAPEX -0.066 -0.065 -0.026 -0.025
(-0.20) (-0.20) (-0.14) (-0.13)
INTSALES -0.002 -0.002 -0.001 -0.001
(-1.36) (-1.35) (-1.13) (-1.12)
RDValue -0.000 -0.000 -0.000 -0.000
(-0.46) (-0.44) (-0.34) (-0.33)
RDInt -3.663*** -3.583*** -2.586*** -2.529***
(-3.94) (-3.88) (-3.81) (-3.75)
PAST_BEAT 0.150*** 0.101***
(2.77) (2.90)
ZERO_BEAT 0.149 0.102
(1.38) (1.44)
BENCH_BEAT 0.163*** 0.108***
(3.09) (3.22)
CAP -0.277*** -0.278*** -0.179*** -0.180***
(-3.07) (-3.08) (-2.85) (-2.88)
BC 0.170*** 0.169*** 0.104*** 0.104***
(3.54) (3.54) (3.50) (3.50)
AGE 0.036 0.036 0.021 0.021
(0.52) (0.51) (0.50) (0.50)
ANTISELF -0.457 -0.462 -0.302 -0.305
(-1.04) (-1.05) (-1.08) (-1.09)
CIV_COM -0.585** -0.588** -0.389** -0.392**
(-2.10) (-2.11) (-2.16) (-2.17)
CORR 0.001 0.001 0.001 0.001
(0.24) (0.25) (0.34) (0.35)
Healthinfrastructure -0.034 -0.034 -0.016 -0.016
(-0.68) (-0.67) (-0.50) (-0.48)
THE CAPITALISATION OF INTANGIBLES DEBATE: SOFTWARE DEVELOPMENT COSTS | 4. FINDINGS AND DISCUSSION
33
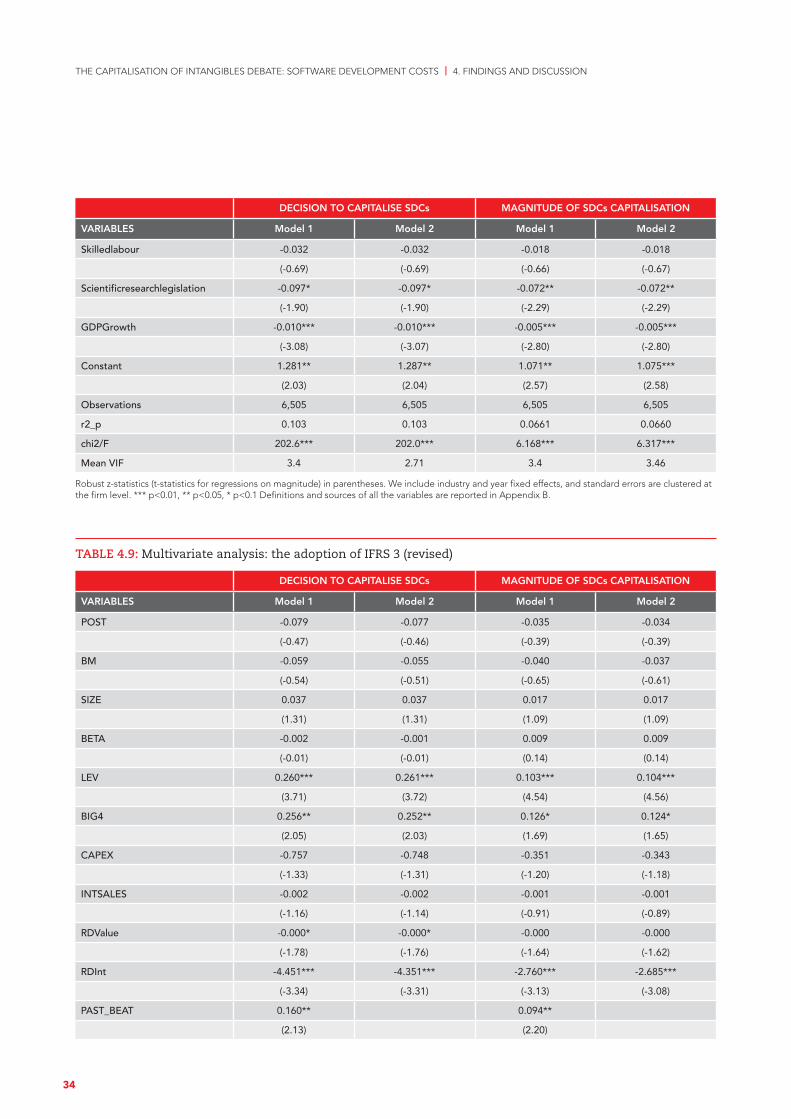
DECISION TO CAPITALISE SDCs MAGNITUDE OF SDCs CAPITALISATION
VARIABLES Model 1 Model 2 Model 1 Model 2
Skilledlabour -0.032 -0.032 -0.018 -0.018
(-0.69) (-0.69) (-0.66) (-0.67)
Scientificresearchlegislation -0.097* -0.097* -0.072** -0.072**
(-1.90) (-1.90) (-2.29) (-2.29)
GDPGrowth -0.010*** -0.010*** -0.005*** -0.005***
(-3.08) (-3.07) (-2.80) (-2.80)
Constant 1.281** 1.287** 1.071** 1.075***
(2.03) (2.04) (2.57) (2.58)
Observations 6,505 6,505 6,505 6,505
r2_p 0.103 0.103 0.0661 0.0660
chi2/F 202.6*** 202.0*** 6.168*** 6.317***
Mean VIF 3.4 2.71 3.4 3.46
Robust z-statistics (t-statistics for regressions on magnitude) in parentheses. We include industry and year fixed effects, and standard errors are clustered at the firm level. *** p<0.01, ** p<0.05, * p<0.1 Definitions and sources of all the variables are reported in Appendix B.
TABLE 4.9: Multivariate analysis: the adoption of IFRS 3 (revised)
DECISION TO CAPITALISE SDCs MAGNITUDE OF SDCs CAPITALISATION
VARIABLES Model 1 Model 2 Model 1 Model 2
POST -0.079 -0.077 -0.035 -0.034
(-0.47) (-0.46) (-0.39) (-0.39)
BM -0.059 -0.055 -0.040 -0.037
(-0.54) (-0.51) (-0.65) (-0.61)
SIZE 0.037 0.037 0.017 0.017
(1.31) (1.31) (1.09) (1.09)
BETA -0.002 -0.001 0.009 0.009
(-0.01) (-0.01) (0.14) (0.14)
LEV 0.260*** 0.261*** 0.103*** 0.104***
(3.71) (3.72) (4.54) (4.56)
BIG4 0.256** 0.252** 0.126* 0.124*
(2.05) (2.03) (1.69) (1.65)
CAPEX -0.757 -0.748 -0.351 -0.343
(-1.33) (-1.31) (-1.20) (-1.18)
INTSALES -0.002 -0.002 -0.001 -0.001
(-1.16) (-1.14) (-0.91) (-0.89)
RDValue -0.000* -0.000* -0.000 -0.000
(-1.78) (-1.76) (-1.64) (-1.62)
RDInt -4.451*** -4.351*** -2.760*** -2.685***
(-3.34) (-3.31) (-3.13) (-3.08)
PAST_BEAT 0.160** 0.094**
(2.13) (2.20)
THE CAPITALISATION OF INTANGIBLES DEBATE: SOFTWARE DEVELOPMENT COSTS | 4. FINDINGS AND DISCUSSION
34
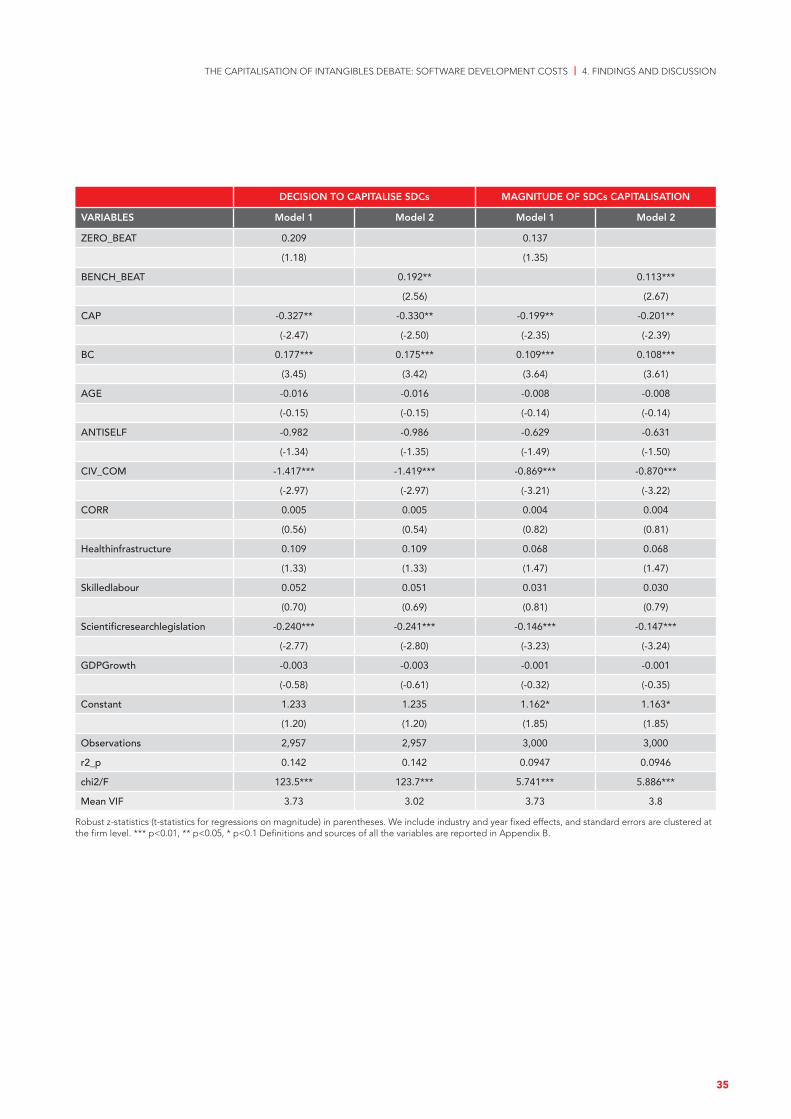
DECISION TO CAPITALISE SDCs MAGNITUDE OF SDCs CAPITALISATION
VARIABLES Model 1 Model 2 Model 1 Model 2
ZERO_BEAT 0.209 0.137
(1.18) (1.35)
BENCH_BEAT 0.192** 0.113***
(2.56) (2.67)
CAP -0.327** -0.330** -0.199** -0.201**
(-2.47) (-2.50) (-2.35) (-2.39)
BC 0.177*** 0.175*** 0.109*** 0.108***
(3.45) (3.42) (3.64) (3.61)
AGE -0.016 -0.016 -0.008 -0.008
(-0.15) (-0.15) (-0.14) (-0.14)
ANTISELF -0.982 -0.986 -0.629 -0.631
(-1.34) (-1.35) (-1.49) (-1.50)
CIV_COM -1.417*** -1.419*** -0.869*** -0.870***
(-2.97) (-2.97) (-3.21) (-3.22)
CORR 0.005 0.005 0.004 0.004
(0.56) (0.54) (0.82) (0.81)
Healthinfrastructure 0.109 0.109 0.068 0.068
(1.33) (1.33) (1.47) (1.47)
Skilledlabour 0.052 0.051 0.031 0.030
(0.70) (0.69) (0.81) (0.79)
Scientificresearchlegislation -0.240*** -0.241*** -0.146*** -0.147***
(-2.77) (-2.80) (-3.23) (-3.24)
GDPGrowth -0.003 -0.003 -0.001 -0.001
(-0.58) (-0.61) (-0.32) (-0.35)
Constant 1.233 1.235 1.162* 1.163*
(1.20) (1.20) (1.85) (1.85)
Observations 2,957 2,957 3,000 3,000
r2_p 0.142 0.142 0.0947 0.0946
chi2/F 123.5*** 123.7*** 5.741*** 5.886***
Mean VIF 3.73 3.02 3.73 3.8
Robust z-statistics (t-statistics for regressions on magnitude) in parentheses. We include industry and year fixed effects, and standard errors are clustered at the firm level. *** p<0.01, ** p<0.05, * p<0.1 Definitions and sources of all the variables are reported in Appendix B.
THE CAPITALISATION OF INTANGIBLES DEBATE: SOFTWARE DEVELOPMENT COSTS | 4. FINDINGS AND DISCUSSION
35

THE CAPITALISATION OF INTANGIBLES DEBATE: SOFTWARE DEVELOPMENT COSTS | 4. FINDINGS AND DISCUSSION
36
5.1 Conclusions and recommendationsWhile the wider topic of intangible assets and their accounting treatment has been on the agenda of standard setters and regulators for some time, there is no evidence on the frequency with which SDCs are capitalised or of the amounts concerned on the balance sheets of IFRS-reporting firms. Further to the recent request in the IASB Agenda Consultation and various initiatives of other international, and standard-setting, bodies (FRC 2019; EFRAG 2019 and FASB 2021), in this study we address this lacuna. Specifically, by drawing on listed companies from 39 countries (40,241 firm-year observations) that have converged their national standards to IFRS or adopted IFRS, for the five-year period 2015 to 2019, we collected and summarised evidence on how many companies capitalise SDC during the year (capitalisers) and how many report R&D costs in the income statement but do not capitalise SDC during the year (non-capitalisers). This evidence is provided in aggregate and also at a country and industry level.
Key findings include the following. The data shows that almost two-thirds of the firm-year observations in the sample capitalise SDCs. This suggests that companies very frequently recognise and report SDCs separately. This contrasts with Mazzi et al.’s report (2019b) on general R&D costs, in which 62% of the sample are shown to expense such costs. The high frequency of SDC capitalisation we identify holds even though the amounts involved can be considered immaterial relative to the companies’ total assets and/or market values. At a country/regional level, however, we find significant differences in the percentage of capitalising firms and the SDC asset intensity on companies’ balance sheets. While firms from Asia show a greater tendency to recognise SDCs separately on the balance sheet than do firms in Oceania and Europe, the SDC asset intensity is far smaller than for firms in these other regions. At a sector level, firms in the Consumer Discretionary, Financials, Real Estate and Utilities Sectors exhibit the largest proportion of capitalisers (it is greater than 70%). Firms in the Telecommunications industry exhibit the highest net SDC asset intensity, followed by firms in Technology and Consumer Discretionary.
5. Conclusion
THE CAPITALISATION OF INTANGIBLES DEBATE: SOFTWARE DEVELOPMENT COSTS | 5. CONCLUSION
Of the firms that complete material business combinations in a given year, a large proportion capitalise both SDCs and R&D in the year. When compared with firms that do not capitalise SDCs, firms that do so are more likely to be larger, riskier, have higher leverage, employ one of the Big Four auditors, have more international sales, have incentives to capitalise SDCs to meet their earnings targets, capitalise other development costs and have concluded material business combinations during the year. These same characteristics associate positively with the magnitude of amounts capitalised. Even so, firm size, employing a Big Four auditor, and making international sales are not significant factors affecting the decision to capitalise SDCs for the sub-sample of firms that have material business combinations. Further, book to market, firm size, having a Big Four auditor, international sales, frequency of R&D capitalisation and being headquartered in a civic-law country or a country with highly skilled labour and better health infrastructure are not significant determinants of the amounts of SDCs capitalised in the sub-sample with material business combinations. Hence, these characteristics are related to the levels of SDC capitalisation only for firms without material business combinations. The results from the separate sample focusing on the years before and after the implementation of IFRS 3 (R) in 2009 suggest that the implementation of the revised standard does not influence a firm’s decision to capitalise SDCs or the magnitude of SDC capitalisation, even if it has conducted material business combinations.
The key recommendations from these findings are as follows. The high frequency of capitalisation of SDCs, in direct contrast to the prior evidence of relative lack of capitalisation of development costs of new products and processes (ie R&D-related costs) under IAS 38, reinforces the call for revision to the criteria of capitalisation of other development costs in IAS 38. The fact that having material business combinations is associated with a larger number of capitalisers and higher amounts of capitalised SDCs suggests that IFRS 3 does achieve its objectives for the separate recognition of SDCs. Nonetheless, the implementation of IFRS 3(R) does not seem to have had an effect (and hence has not improved financial reporting quality) in this respect, relative to the previous standard.
37
No further revision of IFRS 3 appears pertinent, at least as far as the recognition of SDCs is concerned. The significant differences in the percentage of capitalising firms and SDC asset intensity on companies’ balance sheets across countries/regions should alert users of financial statements, preparers, auditors and/or enforcers of financial information to the differential reporting incentives and contextual influential factors across different countries, which result in significant variations in reporting practices. Finally, although we observe relatively good disclosure practices on the issue of SDCs, IAS 38 and auditors and enforcing bodies could encourage more refined disclosures in assisting firms to distinguish how much of the capitalised amounts of SDC relate to externally acquired or internally developed software.
5.2 Limitations and directions for future researchAs in every research study, the results reported above are subject to a number of common limitations and caveats. First, the firm-level data we used is provided by commercial databases. These may contain errors and misclassifications. Second, certain firms may engage in R&D but may not separately report any R&D expense in the income statement or any SDC asset on the balance sheet. These companies are not included in the sample. In practice, their inclusion is unlikely to affect our results because these firms have low R&D intensity, and presumably low materiality. Third, certain firms may capitalise SDC costs but may not report these as a separate category of intangible assets; some companies may have (mis)classified such amounts
as part of general development costs capitalised. Hence, we cannot classify them as capitalisers in our sample. Similarly, it is likely that some companies may develop software internally and part of this expenditure is treated as an expense in the income statement. The databases that we rely on for the data collection do not capture such amounts separately. It is likely that companies merge these expensed costs with other R&D-related expenses. The implications from these potential (mis)classifications would be negligible for the tests on and conclusions about the amounts capitalised, because it is presumed that the non-separate reporting of such amounts is due to their small, non-material, magnitude. Fourth, we rely on econometric techniques to identify the expected practice of SDC capitalisation. While we have made every effort to develop a model that accurately predicts the expected accounting treatment of SDCs, we recognise that this may misclassify some companies.
Future research could examine any consequences of the decision to capitalise SDCs and of the amounts capitalised on various equity and debt market outcomes. Further, insights about the decision to capitalise SDCs and about the amounts capitalised, while comparing IFRS and US GAAP reporters would be pertinent. Additionally, future research could consider the views of preparers on their respective accounting treatments of R&D costs compared with those costs associated with SDCs. This could shed useful light on the differences, in practice, between internally generated and externally purchased intangibles and their treatment under IAS 38.
THE CAPITALISATION OF INTANGIBLES DEBATE: SOFTWARE DEVELOPMENT COSTS | 5. CONCLUSION
38
About the authors
Dr Dionysia Dionysiou, University of StirlingDionysia is a senior lecturer in Accounting and Finance at the University of Stirling. Before that, she was a researcher within the INTACCT network, where she was working on the implications of the mandatory implementation of IFRS in European countries. Dionysia’s main areas of research interest are in corporate finance and corporate distress, as well as financial reporting and market-based accounting. She has published in internationally acclaimed journals in these areas and, for her practice-relevant research, she has received research grants from the Institute of Chartered Accountants of Scotland (ICAS) and ACCA.
Dr Richard Slack, Durham UniversityRichard is a professor in accounting at Durham University Business School. He joined Durham University in 2012, having previously been professor in accounting at Newcastle Business School, Northumbria University. Before his academic career, Richard, a graduate of St Andrews University, worked at Price Waterhouse and is a qualified chartered accountant. Richard’s research encompasses areas of accounting information, and its use by, and usefulness to, capital market users. Further, Richard is interested in the way information is presented by companies and whether narrative disclosure is decision-useful to stakeholder groups.
Dr Ioannis Tsalavoutas, University of GlasgowIoannis is a professor of accounting at the University of Glasgow. His main area of expertise is financial accounting and reporting, in particular, investigating companies’ reporting practices under IFRS across different jurisdictions, along with any economic consequences that may arise from divergence in practice. Ioannis' work experience includes positions as an accounting assistant (in Greece) and as a financial accounting and reporting analyst at Company Reporting Ltd in Edinburgh. Before joining the University of Glasgow in January 2015, Ioannis was a lecturer in accounting at the University of Stirling.
Dr Fanis Tsoligkas, University of BathFanis is a lecturer in accounting at the University of Bath. His main research interests lie in the fields of financial reporting discretion and the adoption of International Financial Reporting Standards. They also include the capital market effects of accounting information and the effect of trading behaviour of corporate executives and directors. Before joining academia, Fanis practised accountancy in Greece.
THE CAPITALISATION OF INTANGIBLES DEBATE: SOFTWARE DEVELOPMENT COSTS | ABOUT THE AUTHORS
39
Aboody, D. and Lev, B. (1998), ‘The Value Relevance of Intangibles: The Case of Software Capitalization’, Journal of Accounting Research, 36: 161–91.
Bernanke, B.S. (2011), ‘Promoting Research and Development: The Government’s Role’. Speech given at the conference on ‘New Building Blocks for Jobs and Economic Growth’, Washington, D.C., 16 May. Available at: <https://www.federalreserve.gov/newsevents/speech/bernanke20110516a.htm>, accessed 9 April 2021.
Ciftci, M. (2010), ‘Accounting Choice and Earnings Quality: The Case of Software Development’, European Accounting Review, 19 (3): 429–59.
Dargenidou, C., Jackson, R. H., Tsalavoutas, I. and Tsoligkas, F. (2021), ‘Capitalisation of R&D and the Informativeness of Stock Prices: Pre-and Post-IFRS Evidence’, The British Accounting Review, 100998.
Daske, H., Hail, L., Leuz, C. and Verdi, R. (2013), ‘Adopting a Label: Heterogeneity in the Economic Consequences around IAS/IFRS Adoptions’, Journal of Accounting Research, 51(3): 495–547.
Dinh, T., Kang, H. and Schultze, W. (2016), ‘Capitalizing Research & Development: Signaling or Earnings Management?’, European Accounting Review, 25 (2), 373–401.
Dinh, T., Sidhu, B. K. and Yu, C. (2019), ‘Accounting for Intangibles: Can Capitalization of R&D Improve Investment Efficiency?’, Abacus, 55 (1): 92–127.
EFRAG (European Financial Reporting Advisory Group) (2019), Discussions on Intangibles in Relation to the IASB 2020 Agenda Consultation Update Paper for Background.
FASB (Financial Accounting Standards Board) (2021), Accounting for and Disclosure of Intangibles, Available at: <https://www.fasb. org/csContentServer?c=FASBContent_C&cid=1176169433424& d=&pagename=FASB%2FFASBContent_C%2FProjectUpdate Page#DR_Intangibles>, accessed 9 April 2021.
FRC (Financial Reporting Council) (2019), Business Reporting of Intangibles: Realistic Proposals, presented at the IASB Accounting Standards Advisory Forum, Agenda Paper 6. Available at: <https://www.ifrs.org/news-and-events/calendar/2019/july/accounting-standards-advisory-forum/>.
FTSE Russell (2020), Industry Classification Benchmark (Equity) v.3.6 <https://research.ftserussell.com/products/downloads/ICB_Rules_new.pdf?_ga=2.121497288.1764508183.1618314858-340009385.1618314858>, accessed 16 April 2021.
García Lara, J. M., Garcia Osma, B. and Mora, A. (2005), 'The Effect of Earnings Management on the Asymmetric Timeliness of Earnings’, Journal of Business Finance & Accounting, 32 (3/4): 691–726.
Givoly, D. and Shi, C. (2008), ‘Accounting for Software Development Costs and the Cost of Capital: Evidence from IPO Underpricing in the Software Industry’, Journal of Accounting, Auditing & Finance, 23 (2): 271–304.
Haskel, J. and Westlake, S. (2017), Capitalism without Capital: The Rise of the Intangible Economy (Princeton: Princeton University Press).
IASB (2021), Request for Information: Third Agenda Consultation, <https://www.ifrs.org/projects/work-plan/2020-agenda-consultation/#published-documents>, accessed 14 April 2021.
IASB (International Accounting Standards Board) (2014), Report and Feedback Statement: Post-implementation Review of IFRS 3 Business Combinations, Available at: <https://www.ifrs.org/content/dam/ifrs/project/pir-ifrs-3/published-documents/rfi/rfi-pir-ifrs-3-business-combinations-jan-2014.pdf>, accessed 14 April 2021.
IMD (Institute for Management Development), (2021), World Competitiveness Yearbook 2021, Available at <https://www.imd.org/wcc/products/eshop-world-competitiveness-yearbook/>, accessed 9 April 2021.
Kaplan, R. S. and Sandino, T. (2001), Accounting for Computer Software Development Costs, Harvard Business School Case Collection, 9–102. Available from <https://store.hbr.org/product/accounting-for-computer-software-development-costs/102034> accessed 16 April 2021.
Kreß, A., Eierle, B. and Tsalavoutas, I. (2019), ‘Development Costs Capitalization and Debt Financing’, Journal of Business Finance & Accounting, 46 (5/6): 636–85.
Krishnan, G. V. and Wang, C. (2013), ‘Are Capitalized Software Development Costs Informative About Audit Risk?’, Accounting Horizons, 28 (1): 39–57.
La Porta, R., Lopez-de-Silanes, F., & Shleifer, A. (2008). The economic consequences of legal origins. Journal of Economic Literature, 46 (2): 285-332.
La Porta, R., Lopez-de-Silanes, F., Shleifer, A., & Vishny, R. W. (1998). Law and finance. Journal of Political Economy, 106 (6): 1113-1155.
Lev, B. and Gu, F. (2016), The End of Accounting and the Path Forward for Investors and Managers (New Jersey: John Wiley & Sons).
Mazzi, F., Slack, R., Tsalavoutas, I. and Tsoligkas, F. (2019a), ‘Country-level Corruption and Accounting Choice: Research & Development Capitalization under IFRS’, The British Accounting Review, 51 (5): 100821.
Mazzi, F., Slack, R., Tsalavoutas, I. and Tsoligkas, F. (2019b), The Capitalisation Debate: R&D Expenditure, Disclosure Content and Quantity, and Stakeholder Views. Downloadable from <https://www.accaglobal.com/gb/en/professional-insights/global-profession/the-capitalisation-debate.html>, accessed 16 April 2021.
Mohd, E. (2005), Accounting for Software Development Costs and Information Asymmetry, The Accounting Review, 80 (4): 1211–31.
Morgan Stanley (2017), ‘Software Eats the World’, [website article] <https://www.morganstanley.com/ideas/software-sector-growth>, accessed 10 March 2021.
Schleicher, T., Tahoun, A. and Walker, M. (2010). ‘IFRS Adoption in Europe and Investment-Cash Flow Sensitivity: Outsider versus Insider Economies’, The International Journal of Accounting, 45(2), 143–68.
Walker, R. G. and Oliver, G. R. (2005), ‘Accounting for Expenditure on Software Development for Internal Use’, Abacus, 41(1): 66–91.
World Bank (2010), The Worldwide Governance Indicators (WGI) Project, World Bank, Washington, DC.
References
THE CAPITALISATION OF INTANGIBLES DEBATE: SOFTWARE DEVELOPMENT COSTS | REFERENCES
40
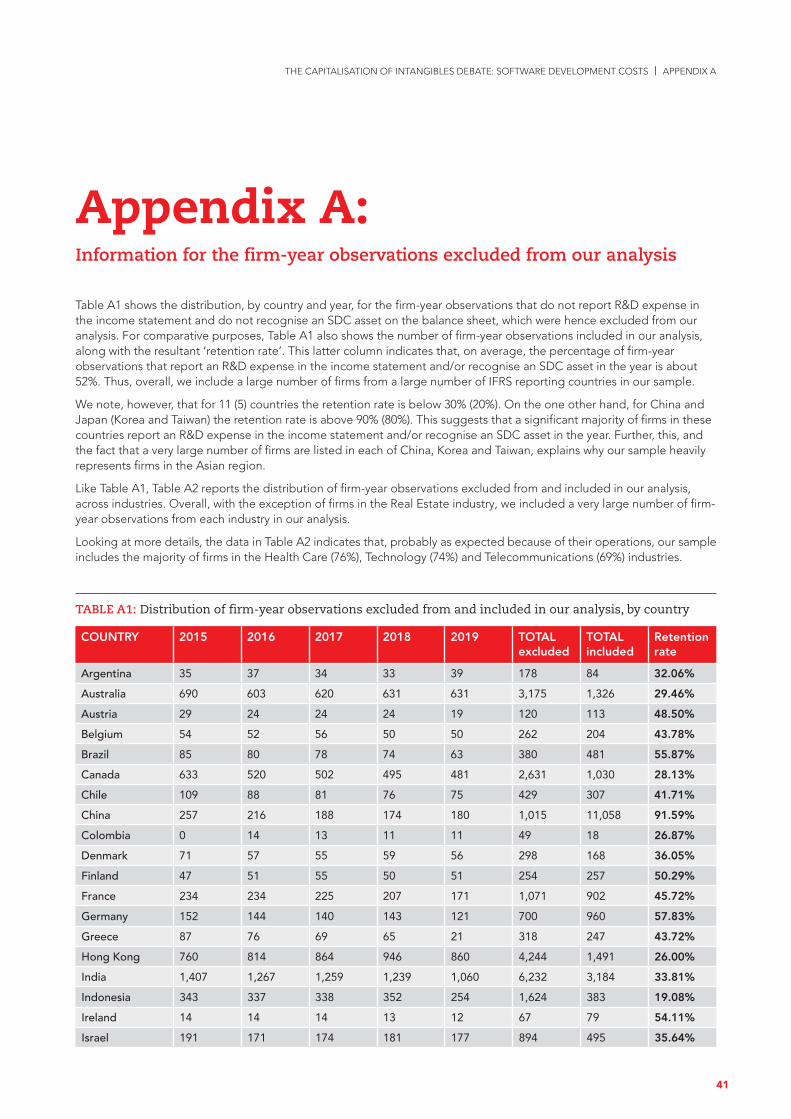
Table A1 shows the distribution, by country and year, for the firm-year observations that do not report R&D expense in the income statement and do not recognise an SDC asset on the balance sheet, which were hence excluded from our analysis. For comparative purposes, Table A1 also shows the number of firm-year observations included in our analysis, along with the resultant ‘retention rate’. This latter column indicates that, on average, the percentage of firm-year observations that report an R&D expense in the income statement and/or recognise an SDC asset in the year is about 52%. Thus, overall, we include a large number of firms from a large number of IFRS reporting countries in our sample.
We note, however, that for 11 (5) countries the retention rate is below 30% (20%). On the one other hand, for China and Japan (Korea and Taiwan) the retention rate is above 90% (80%). This suggests that a significant majority of firms in these countries report an R&D expense in the income statement and/or recognise an SDC asset in the year. Further, this, and the fact that a very large number of firms are listed in each of China, Korea and Taiwan, explains why our sample heavily represents firms in the Asian region.
Like Table A1, Table A2 reports the distribution of firm-year observations excluded from and included in our analysis, across industries. Overall, with the exception of firms in the Real Estate industry, we included a very large number of firm-year observations from each industry in our analysis.
Looking at more details, the data in Table A2 indicates that, probably as expected because of their operations, our sample includes the majority of firms in the Health Care (76%), Technology (74%) and Telecommunications (69%) industries.
TABLE A1: Distribution of firm-year observations excluded from and included in our analysis, by country
COUNTRY 2015 2016 2017 2018 2019 TOTAL excluded
TOTAL included
Retention rate
Argentina 35 37 34 33 39 178 84 32.06%
Australia 690 603 620 631 631 3,175 1,326 29.46%
Austria 29 24 24 24 19 120 113 48.50%
Belgium 54 52 56 50 50 262 204 43.78%
Brazil 85 80 78 74 63 380 481 55.87%
Canada 633 520 502 495 481 2,631 1,030 28.13%
Chile 109 88 81 76 75 429 307 41.71%
China 257 216 188 174 180 1,015 11,058 91.59%
Colombia 0 14 13 11 11 49 18 26.87%
Denmark 71 57 55 59 56 298 168 36.05%
Finland 47 51 55 50 51 254 257 50.29%
France 234 234 225 207 171 1,071 902 45.72%
Germany 152 144 140 143 121 700 960 57.83%
Greece 87 76 69 65 21 318 247 43.72%
Hong Kong 760 814 864 946 860 4,244 1,491 26.00%
India 1,407 1,267 1,259 1,239 1,060 6,232 3,184 33.81%
Indonesia 343 337 338 352 254 1,624 383 19.08%
Ireland 14 14 14 13 12 67 79 54.11%
Israel 191 171 174 181 177 894 495 35.64%
Appendix A:Information for the firm-year observations excluded from our analysis
THE CAPITALISATION OF INTANGIBLES DEBATE: SOFTWARE DEVELOPMENT COSTS | APPENDIX A
41
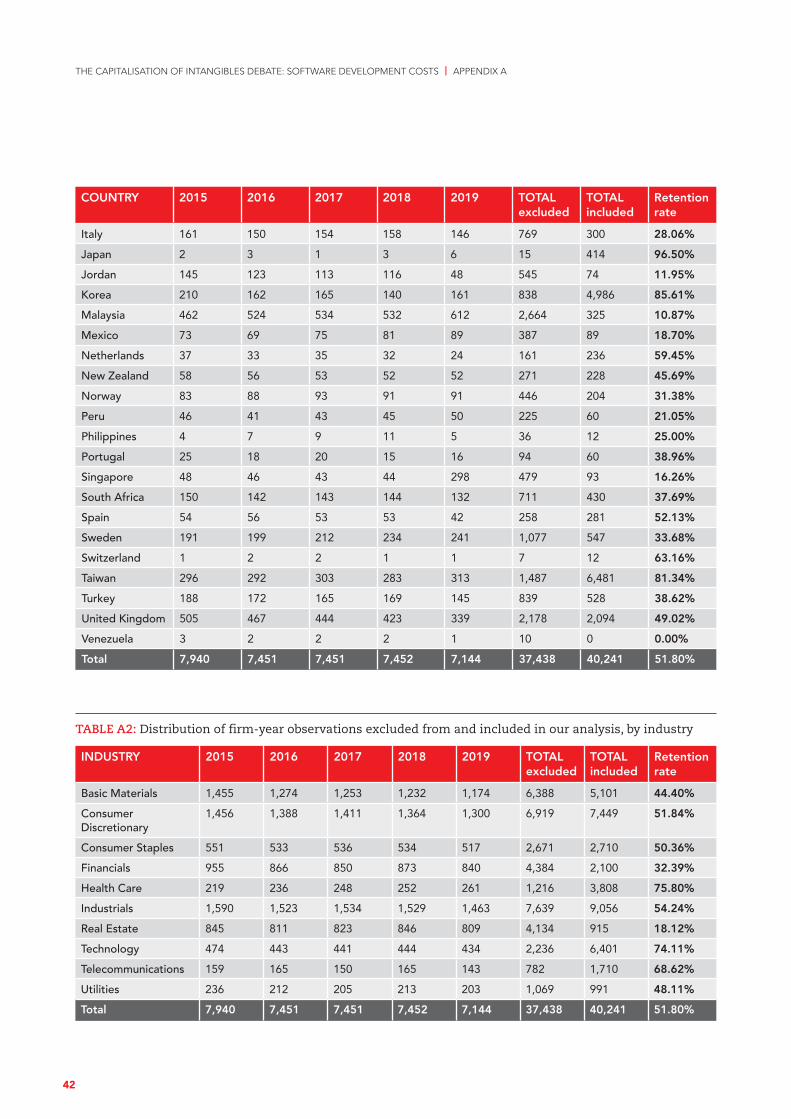
THE CAPITALISATION OF INTANGIBLES DEBATE: SOFTWARE DEVELOPMENT COSTS | APPENDIX A
COUNTRY 2015 2016 2017 2018 2019 TOTAL excluded
TOTAL included
Retention rate
Italy 161 150 154 158 146 769 300 28.06%
Japan 2 3 1 3 6 15 414 96.50%
Jordan 145 123 113 116 48 545 74 11.95%
Korea 210 162 165 140 161 838 4,986 85.61%
Malaysia 462 524 534 532 612 2,664 325 10.87%
Mexico 73 69 75 81 89 387 89 18.70%
Netherlands 37 33 35 32 24 161 236 59.45%
New Zealand 58 56 53 52 52 271 228 45.69%
Norway 83 88 93 91 91 446 204 31.38%
Peru 46 41 43 45 50 225 60 21.05%
Philippines 4 7 9 11 5 36 12 25.00%
Portugal 25 18 20 15 16 94 60 38.96%
Singapore 48 46 43 44 298 479 93 16.26%
South Africa 150 142 143 144 132 711 430 37.69%
Spain 54 56 53 53 42 258 281 52.13%
Sweden 191 199 212 234 241 1,077 547 33.68%
Switzerland 1 2 2 1 1 7 12 63.16%
Taiwan 296 292 303 283 313 1,487 6,481 81.34%
Turkey 188 172 165 169 145 839 528 38.62%
United Kingdom 505 467 444 423 339 2,178 2,094 49.02%
Venezuela 3 2 2 2 1 10 0 0.00%
Total 7,940 7,451 7,451 7,452 7,144 37,438 40,241 51.80%
TABLE A2: Distribution of firm-year observations excluded from and included in our analysis, by industry
INDUSTRY 2015 2016 2017 2018 2019 TOTAL excluded
TOTAL included
Retention rate
Basic Materials 1,455 1,274 1,253 1,232 1,174 6,388 5,101 44.40%
Consumer Discretionary
1,456 1,388 1,411 1,364 1,300 6,919 7,449 51.84%
Consumer Staples 551 533 536 534 517 2,671 2,710 50.36%
Financials 955 866 850 873 840 4,384 2,100 32.39%
Health Care 219 236 248 252 261 1,216 3,808 75.80%
Industrials 1,590 1,523 1,534 1,529 1,463 7,639 9,056 54.24%
Real Estate 845 811 823 846 809 4,134 915 18.12%
Technology 474 443 441 444 434 2,236 6,401 74.11%
Telecommunications 159 165 150 165 143 782 1,710 68.62%
Utilities 236 212 205 213 203 1,069 991 48.11%
Total 7,940 7,451 7,451 7,452 7,144 37,438 40,241 51.80%
42
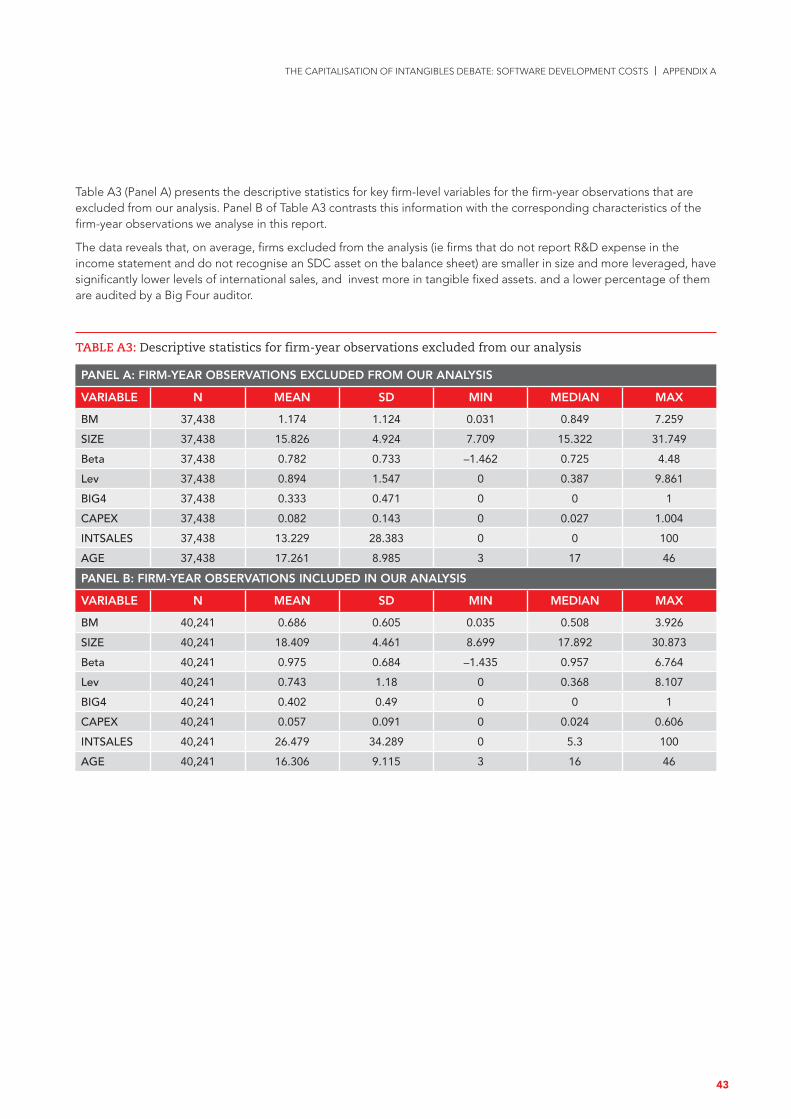
THE CAPITALISATION OF INTANGIBLES DEBATE: SOFTWARE DEVELOPMENT COSTS | APPENDIX A
Table A3 (Panel A) presents the descriptive statistics for key firm-level variables for the firm-year observations that are excluded from our analysis. Panel B of Table A3 contrasts this information with the corresponding characteristics of the firm-year observations we analyse in this report.
The data reveals that, on average, firms excluded from the analysis (ie firms that do not report R&D expense in the income statement and do not recognise an SDC asset on the balance sheet) are smaller in size and more leveraged, have significantly lower levels of international sales, and invest more in tangible fixed assets. and a lower percentage of them are audited by a Big Four auditor.
TABLE A3: Descriptive statistics for firm-year observations excluded from our analysis
PANEL A: FIRM-YEAR OBSERVATIONS EXCLUDED FROM OUR ANALYSIS
VARIABLE N MEAN SD MIN MEDIAN MAX
BM 37,438 1.174 1.124 0.031 0.849 7.259
SIZE 37,438 15.826 4.924 7.709 15.322 31.749
Beta 37,438 0.782 0.733 –1.462 0.725 4.48
Lev 37,438 0.894 1.547 0 0.387 9.861
BIG4 37,438 0.333 0.471 0 0 1
CAPEX 37,438 0.082 0.143 0 0.027 1.004
INTSALES 37,438 13.229 28.383 0 0 100
AGE 37,438 17.261 8.985 3 17 46
PANEL B: FIRM-YEAR OBSERVATIONS INCLUDED IN OUR ANALYSIS
VARIABLE N MEAN SD MIN MEDIAN MAX
BM 40,241 0.686 0.605 0.035 0.508 3.926
SIZE 40,241 18.409 4.461 8.699 17.892 30.873
Beta 40,241 0.975 0.684 –1.435 0.957 6.764
Lev 40,241 0.743 1.18 0 0.368 8.107
BIG4 40,241 0.402 0.49 0 0 1
CAPEX 40,241 0.057 0.091 0 0.024 0.606
INTSALES 40,241 26.479 34.289 0 5.3 100
AGE 40,241 16.306 9.115 3 16 46
43
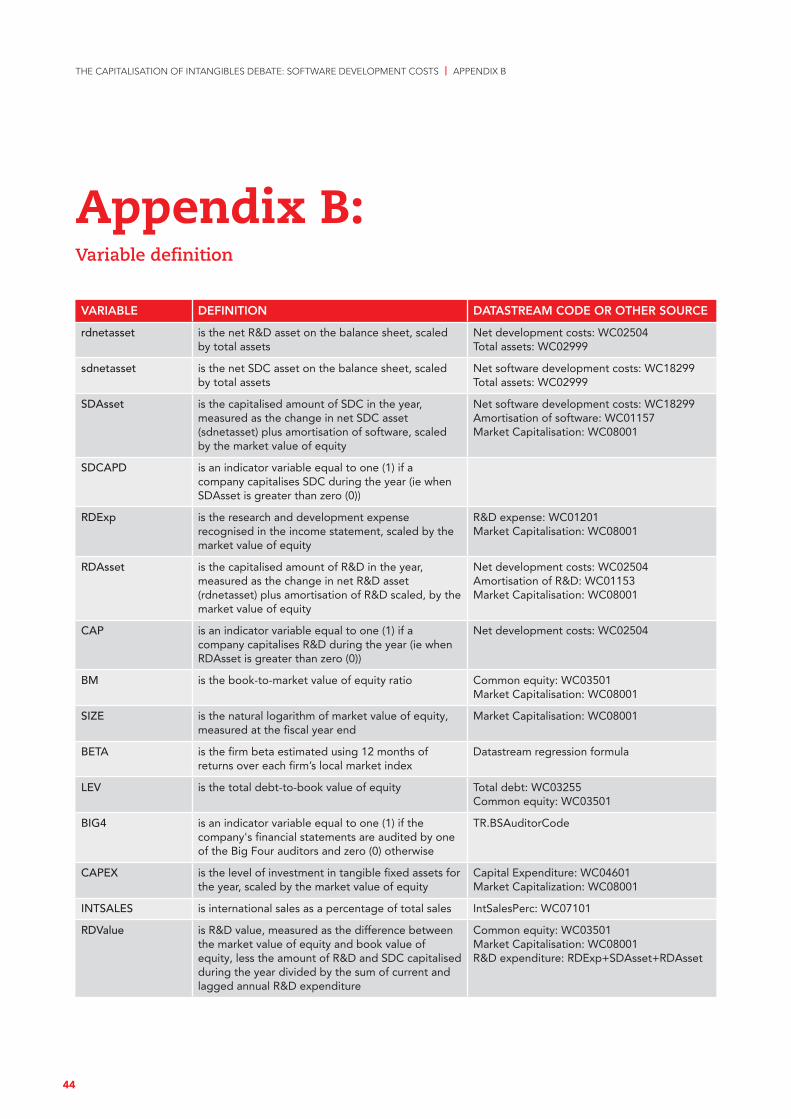
THE CAPITALISATION OF INTANGIBLES DEBATE: SOFTWARE DEVELOPMENT COSTS | APPENDIX B
VARIABLE DEFINITION DATASTREAM CODE OR OTHER SOURCE
rdnetasset is the net R&D asset on the balance sheet, scaled by total assets
Net development costs: WC02504Total assets: WC02999
sdnetasset is the net SDC asset on the balance sheet, scaled by total assets
Net software development costs: WC18299Total assets: WC02999
SDAsset is the capitalised amount of SDC in the year, measured as the change in net SDC asset (sdnetasset) plus amortisation of software, scaled by the market value of equity
Net software development costs: WC18299Amortisation of software: WC01157Market Capitalisation: WC08001
SDCAPD is an indicator variable equal to one (1) if a company capitalises SDC during the year (ie when SDAsset is greater than zero (0))
RDExp is the research and development expense recognised in the income statement, scaled by the market value of equity
R&D expense: WC01201Market Capitalisation: WC08001
RDAsset is the capitalised amount of R&D in the year, measured as the change in net R&D asset (rdnetasset) plus amortisation of R&D scaled, by the market value of equity
Net development costs: WC02504Amortisation of R&D: WC01153Market Capitalisation: WC08001
CAP is an indicator variable equal to one (1) if a company capitalises R&D during the year (ie when RDAsset is greater than zero (0))
Net development costs: WC02504
BM is the book-to-market value of equity ratio Common equity: WC03501Market Capitalisation: WC08001
SIZE is the natural logarithm of market value of equity, measured at the fiscal year end
Market Capitalisation: WC08001
BETA is the firm beta estimated using 12 months of returns over each firm’s local market index
Datastream regression formula
LEV is the total debt-to-book value of equity Total debt: WC03255Common equity: WC03501
BIG4 is an indicator variable equal to one (1) if the company's financial statements are audited by one of the Big Four auditors and zero (0) otherwise
TR.BSAuditorCode
CAPEX is the level of investment in tangible fixed assets for the year, scaled by the market value of equity
Capital Expenditure: WC04601Market Capitalization: WC08001
INTSALES is international sales as a percentage of total sales IntSalesPerc: WC07101
RDValue is R&D value, measured as the difference between the market value of equity and book value of equity, less the amount of R&D and SDC capitalised during the year divided by the sum of current and lagged annual R&D expenditure
Common equity: WC03501Market Capitalisation: WC08001R&D expenditure: RDExp+SDAsset+RDAsset
Appendix B: Variable definition
44
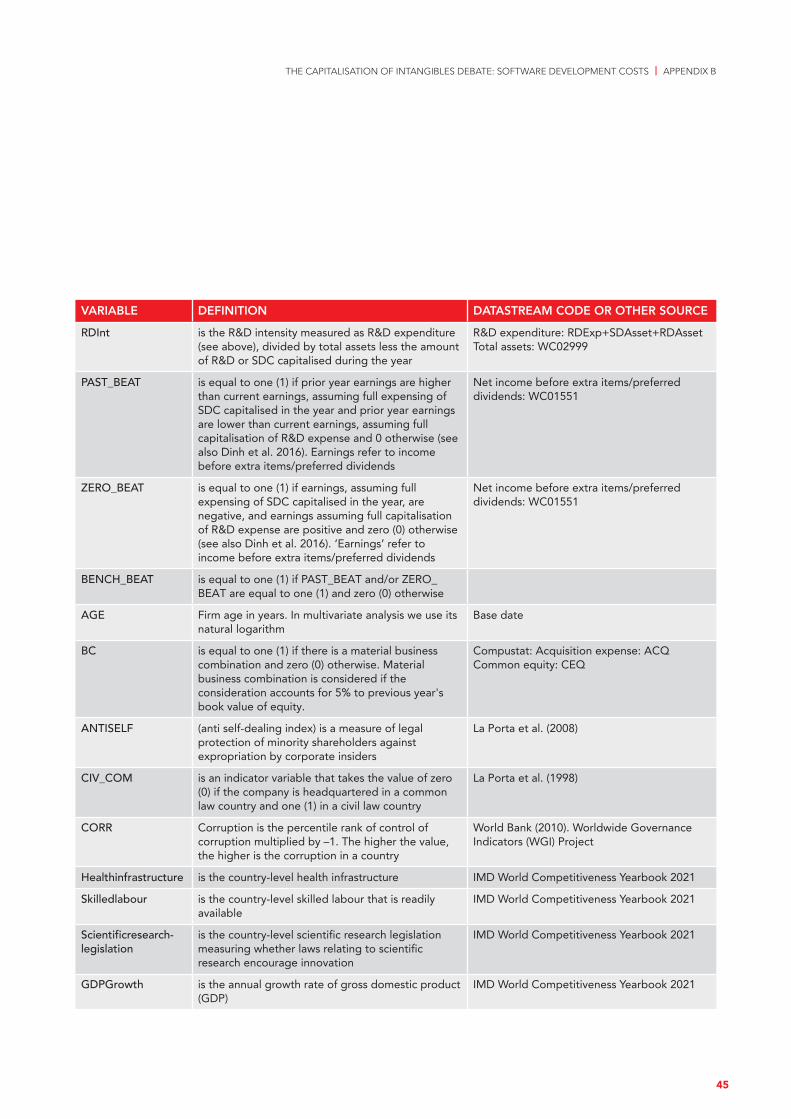
THE CAPITALISATION OF INTANGIBLES DEBATE: SOFTWARE DEVELOPMENT COSTS | APPENDIX B
VARIABLE DEFINITION DATASTREAM CODE OR OTHER SOURCE
RDInt is the R&D intensity measured as R&D expenditure (see above), divided by total assets less the amount of R&D or SDC capitalised during the year
R&D expenditure: RDExp+SDAsset+RDAssetTotal assets: WC02999
PAST_BEAT is equal to one (1) if prior year earnings are higher than current earnings, assuming full expensing of SDC capitalised in the year and prior year earnings are lower than current earnings, assuming full capitalisation of R&D expense and 0 otherwise (see also Dinh et al. 2016). Earnings refer to income before extra items/preferred dividends
Net income before extra items/preferred dividends: WC01551
ZERO_BEAT is equal to one (1) if earnings, assuming full expensing of SDC capitalised in the year, are negative, and earnings assuming full capitalisation of R&D expense are positive and zero (0) otherwise (see also Dinh et al. 2016). ‘Earnings’ refer to income before extra items/preferred dividends
Net income before extra items/preferred dividends: WC01551
BENCH_BEAT is equal to one (1) if PAST_BEAT and/or ZERO_BEAT are equal to one (1) and zero (0) otherwise
AGE Firm age in years. In multivariate analysis we use its natural logarithm
Base date
BC is equal to one (1) if there is a material business combination and zero (0) otherwise. Material business combination is considered if the consideration accounts for 5% to previous year's book value of equity.
Compustat: Acquisition expense: ACQ Common equity: CEQ
ANTISELF (anti self-dealing index) is a measure of legal protection of minority shareholders against expropriation by corporate insiders
La Porta et al. (2008)
CIV_COM is an indicator variable that takes the value of zero (0) if the company is headquartered in a common law country and one (1) in a civil law country
La Porta et al. (1998)
CORR Corruption is the percentile rank of control of corruption multiplied by –1. The higher the value, the higher is the corruption in a country
World Bank (2010). Worldwide Governance Indicators (WGI) Project
Healthinfrastructure is the country-level health infrastructure IMD World Competitiveness Yearbook 2021
Skilledlabour is the country-level skilled labour that is readily available
IMD World Competitiveness Yearbook 2021
Scientificresearch-legislation
is the country-level scientific research legislation measuring whether laws relating to scientific research encourage innovation
IMD World Competitiveness Yearbook 2021
GDPGrowth is the annual growth rate of gross domestic product (GDP)
IMD World Competitiveness Yearbook 2021
45
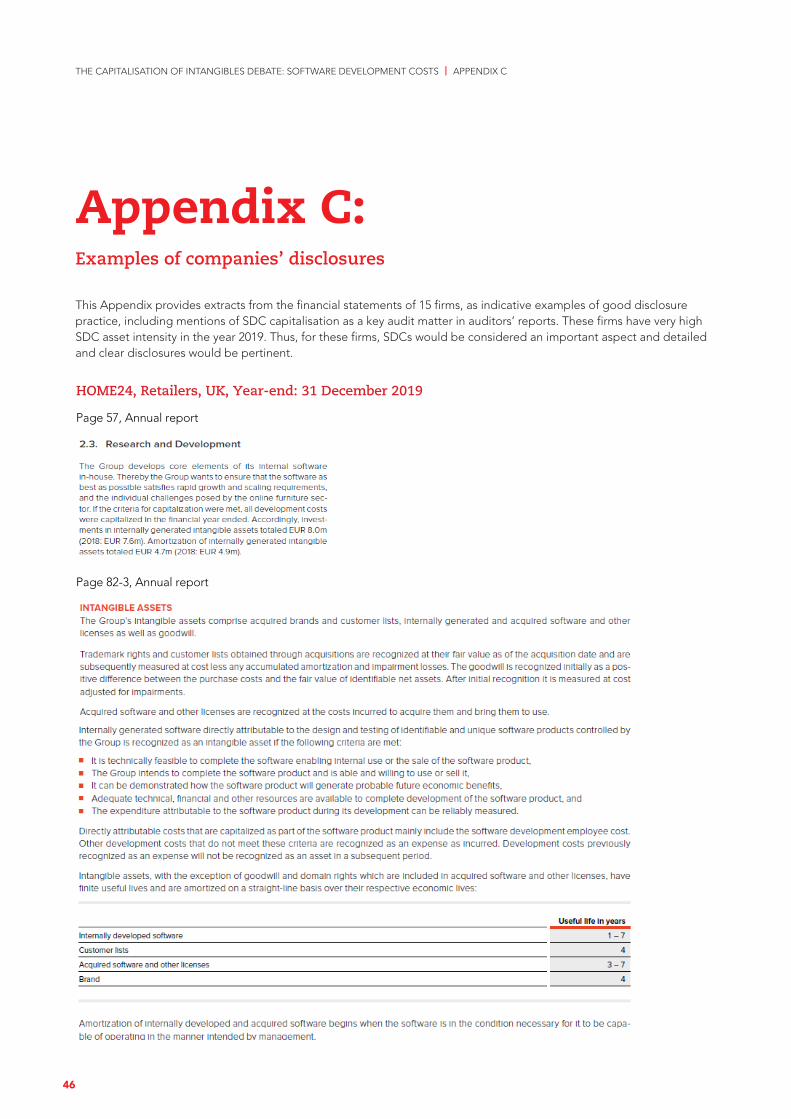
THE CAPITALISATION OF INTANGIBLES DEBATE: SOFTWARE DEVELOPMENT COSTS | APPENDIX C
This Appendix provides extracts from the financial statements of 15 firms, as indicative examples of good disclosure practice, including mentions of SDC capitalisation as a key audit matter in auditors’ reports. These firms have very high SDC asset intensity in the year 2019. Thus, for these firms, SDCs would be considered an important aspect and detailed and clear disclosures would be pertinent.
Appendix C:Examples of companies’ disclosures
HOME24, Retailers, UK, Year-end: 31 December 2019
Page 57, Annual report
Page 82-3, Annual report
HOME24, Retailers, UK, Year-end: 31 December 2019
Page 57, Annual report
Page 82-3, Annual report
HOME24, Retailers, UK, Year-end: 31 December 2019
Page 57, Annual report
Page 82-3, Annual report
HOME24, Retailers, UK, Year-end: 31 December 2019
Page 57, Annual report
Page 82-3, Annual report
HOME24, Retailers, UK, Year-end: 31 December 2019
Page 57, Annual report
Page 82-3, Annual report
HOME24, Retailers, UK, Year-end: 31 December 2019
Page 57, Annual report
Page 82-3, Annual report
HOME24, Retailers, UK, Year-end: 31 December 2019
Page 57, Annual report
Page 82-3, Annual report
HOME24, Retailers, UK, Year-end: 31 December 2019
Page 57, Annual report
Page 82-3, Annual report
HOME24, Retailers, UK, Year-end: 31 December 2019
Page 57, Annual report
Page 82-3, Annual report
46
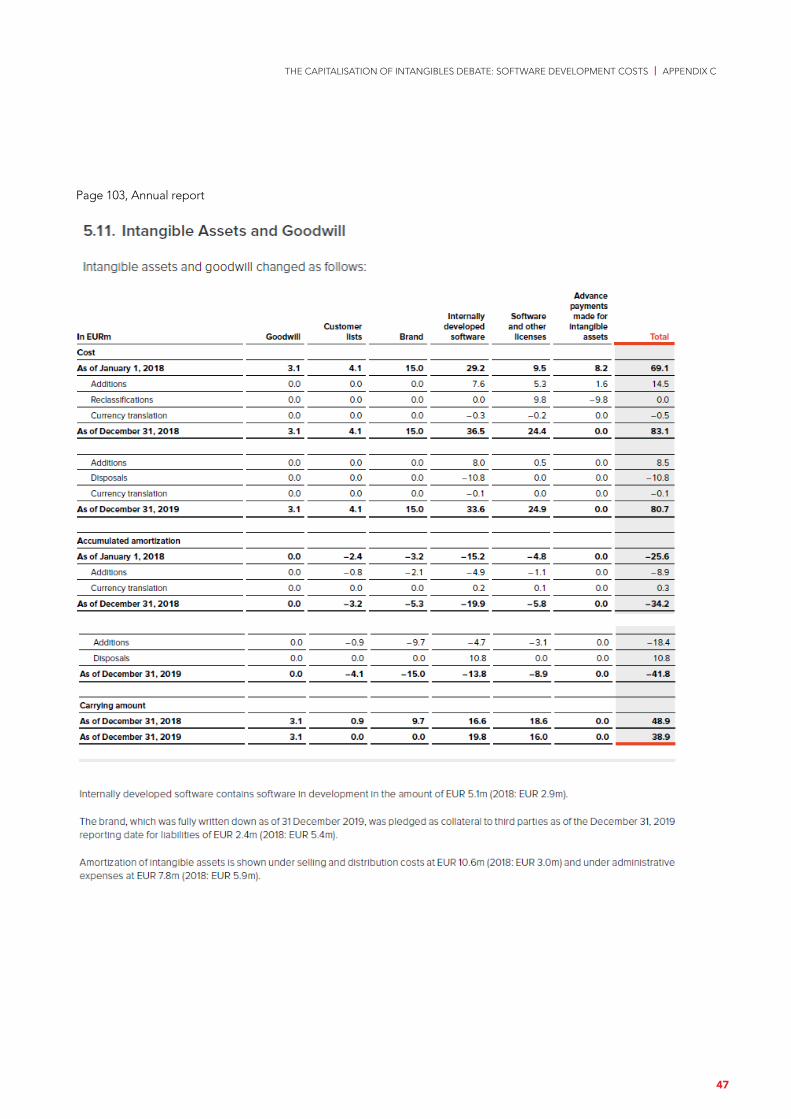
THE CAPITALISATION OF INTANGIBLES DEBATE: SOFTWARE DEVELOPMENT COSTS | APPENDIX C
Page 103, Annual report
47
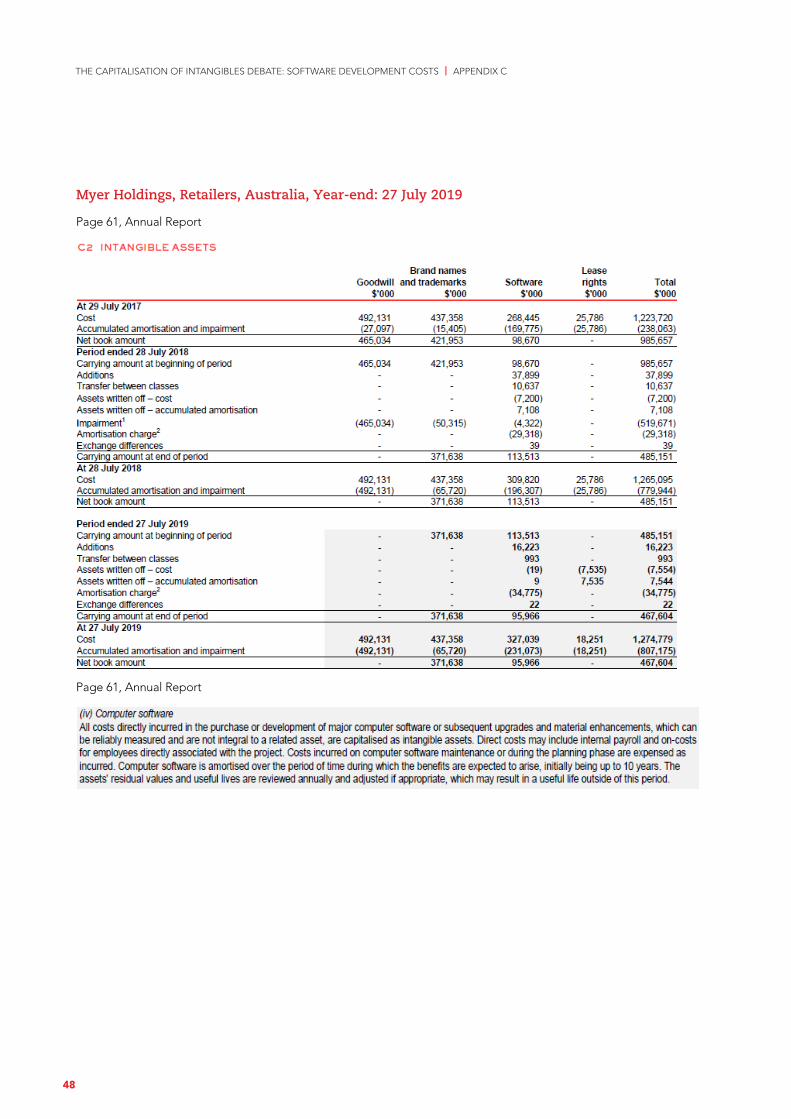
THE CAPITALISATION OF INTANGIBLES DEBATE: SOFTWARE DEVELOPMENT COSTS | APPENDIX C
Myer Holdings, Retailers, Australia, Year-end: 27 July 2019
Page 61, Annual Report
Page 61, Annual Report
48
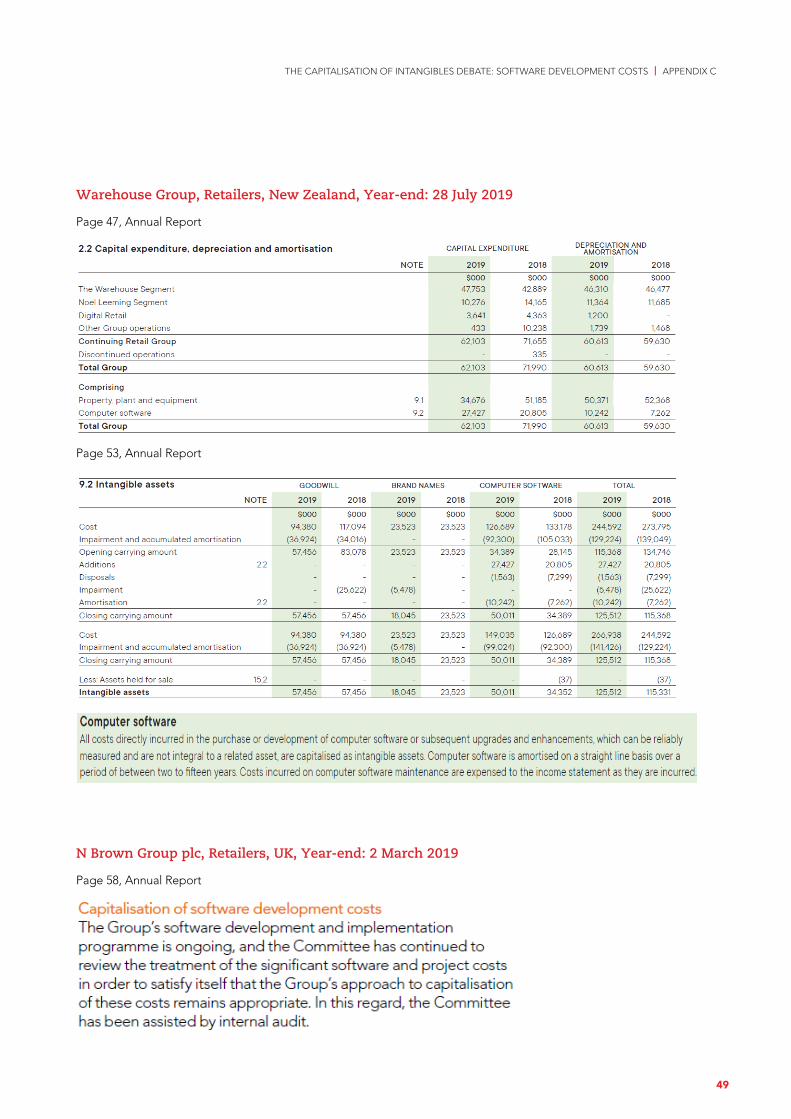
THE CAPITALISATION OF INTANGIBLES DEBATE: SOFTWARE DEVELOPMENT COSTS | APPENDIX C
Warehouse Group, Retailers, New Zealand, Year-end: 28 July 2019
Page 47, Annual Report
Page 53, Annual Report
N Brown Group plc, Retailers, UK, Year-end: 2 March 2019
Page 58, Annual Report
49
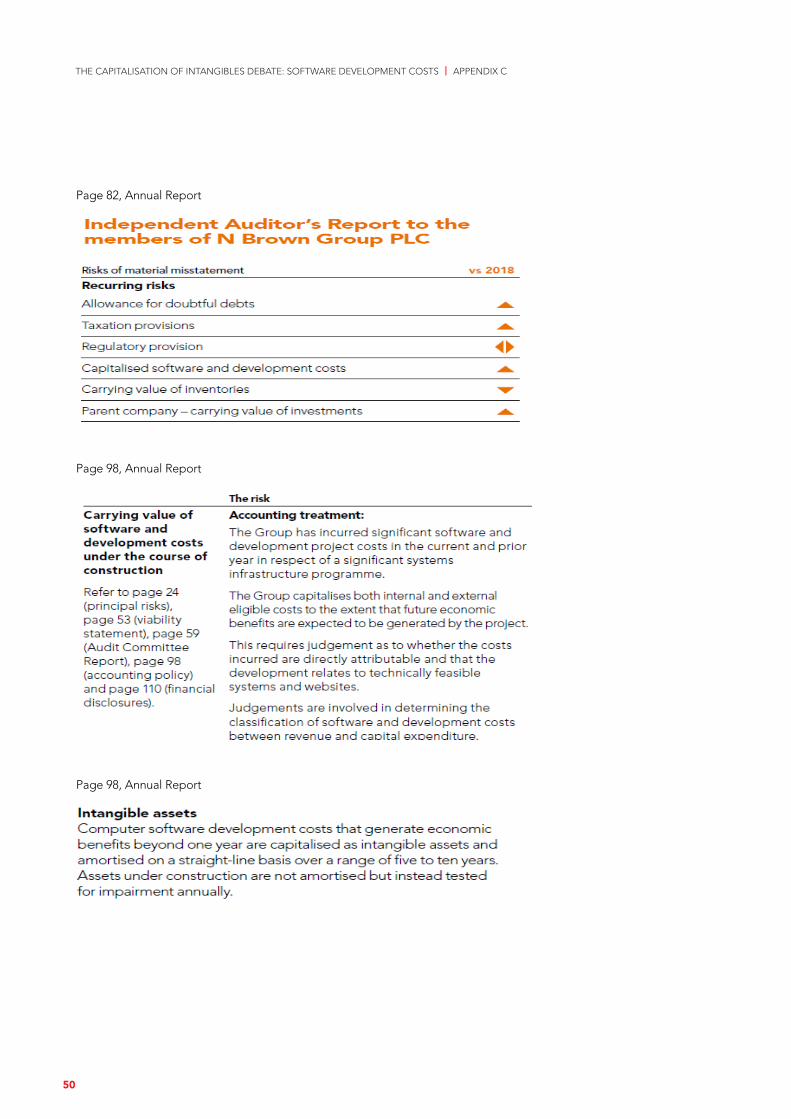
THE CAPITALISATION OF INTANGIBLES DEBATE: SOFTWARE DEVELOPMENT COSTS | APPENDIX C
Page 82, Annual Report
Page 98, Annual Report
Page 98, Annual Report
50
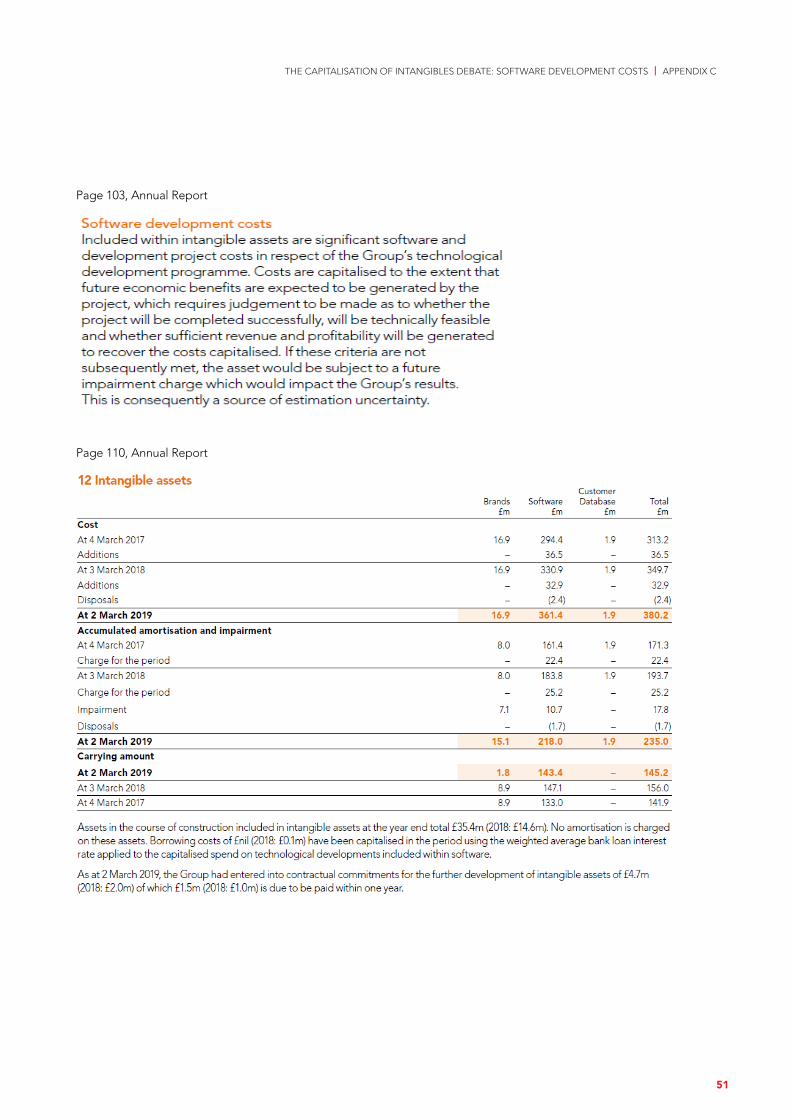
THE CAPITALISATION OF INTANGIBLES DEBATE: SOFTWARE DEVELOPMENT COSTS | APPENDIX C
Page 103, Annual Report
Page 110, Annual Report
51
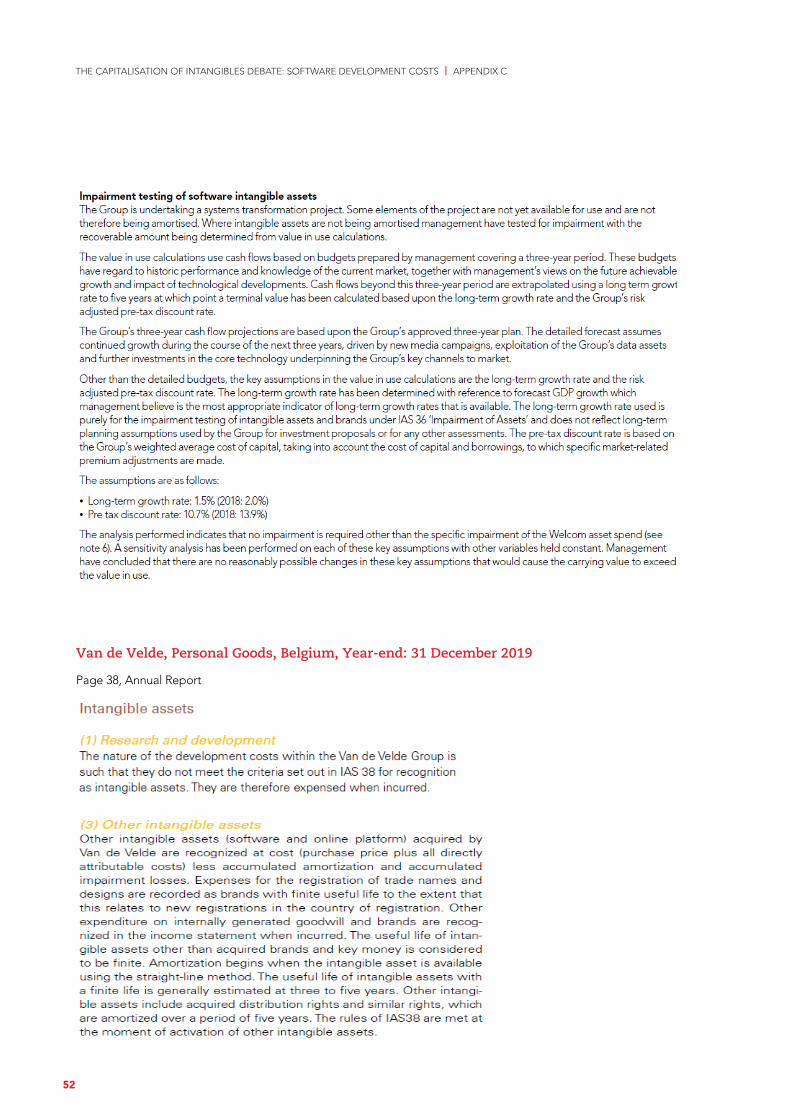
THE CAPITALISATION OF INTANGIBLES DEBATE: SOFTWARE DEVELOPMENT COSTS | APPENDIX C
Van de Velde, Personal Goods, Belgium, Year-end: 31 December 2019
Page 38, Annual Report
52

THE CAPITALISATION OF INTANGIBLES DEBATE: SOFTWARE DEVELOPMENT COSTS | APPENDIX C
Page 47, Annual Report
Page 48, Annual Report
53
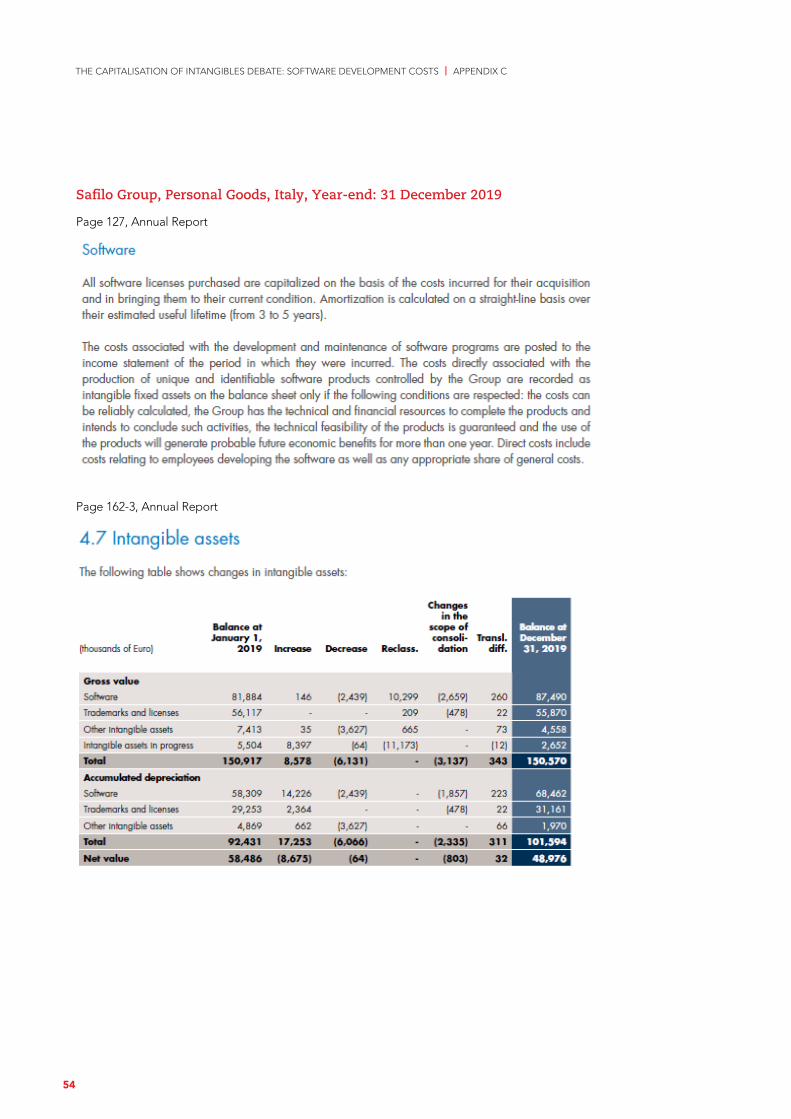
THE CAPITALISATION OF INTANGIBLES DEBATE: SOFTWARE DEVELOPMENT COSTS | APPENDIX C
Safilo Group, Personal Goods, Italy, Year-end: 31 December 2019
Page 127, Annual Report
Page 162-3, Annual Report
Safilo Group, Personal Goods, Italy, Year-end: 31 December 2019
Page 127, Annual Report
Page 162-3, Annual Report
Safilo Group, Personal Goods, Italy, Year-end: 31 December 2019
Page 127, Annual Report
Page 162-3, Annual Report
Safilo Group, Personal Goods, Italy, Year-end: 31 December 2019
Page 127, Annual Report
Page 162-3, Annual Report
54
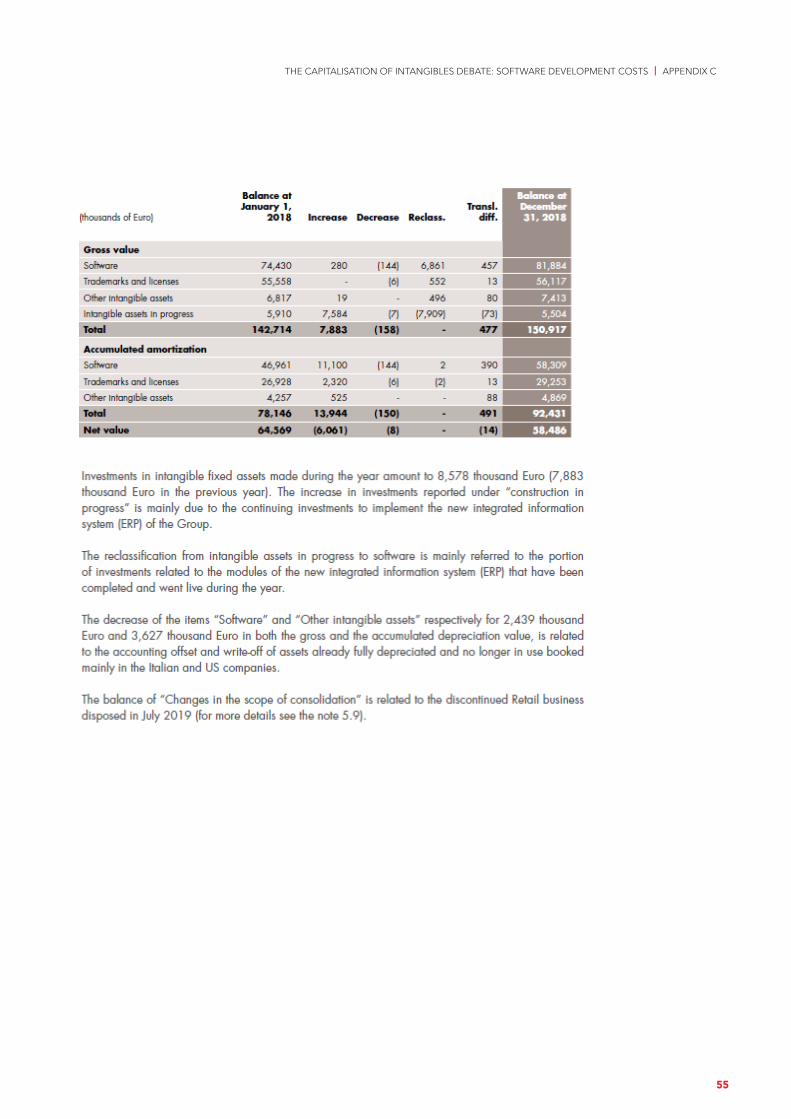
THE CAPITALISATION OF INTANGIBLES DEBATE: SOFTWARE DEVELOPMENT COSTS | APPENDIX C
Safilo Group, Personal Goods, Italy, Year-end: 31 December 2019
Page 127, Annual Report
Page 162-3, Annual Report
55
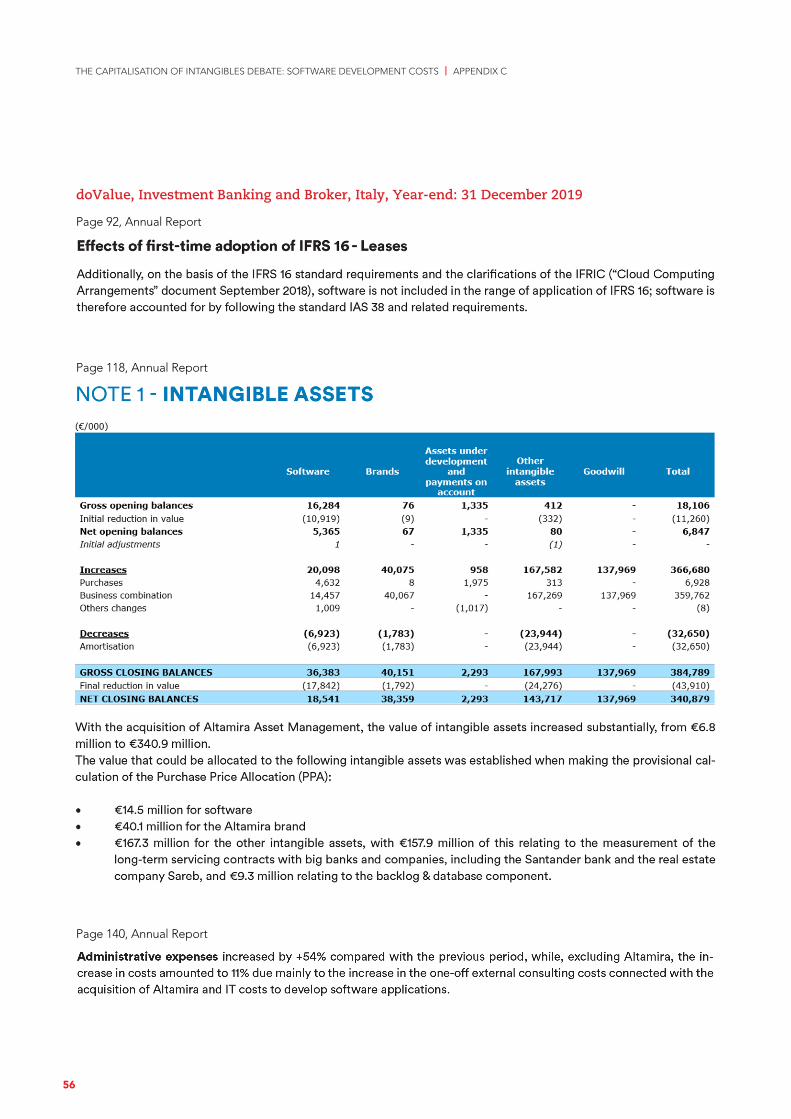
THE CAPITALISATION OF INTANGIBLES DEBATE: SOFTWARE DEVELOPMENT COSTS | APPENDIX C
doValue, Investment Banking and Broker, Italy, Year-end: 31 December 2019
Page 92, Annual Report
Page 118, Annual Report
Page 140, Annual Report
56
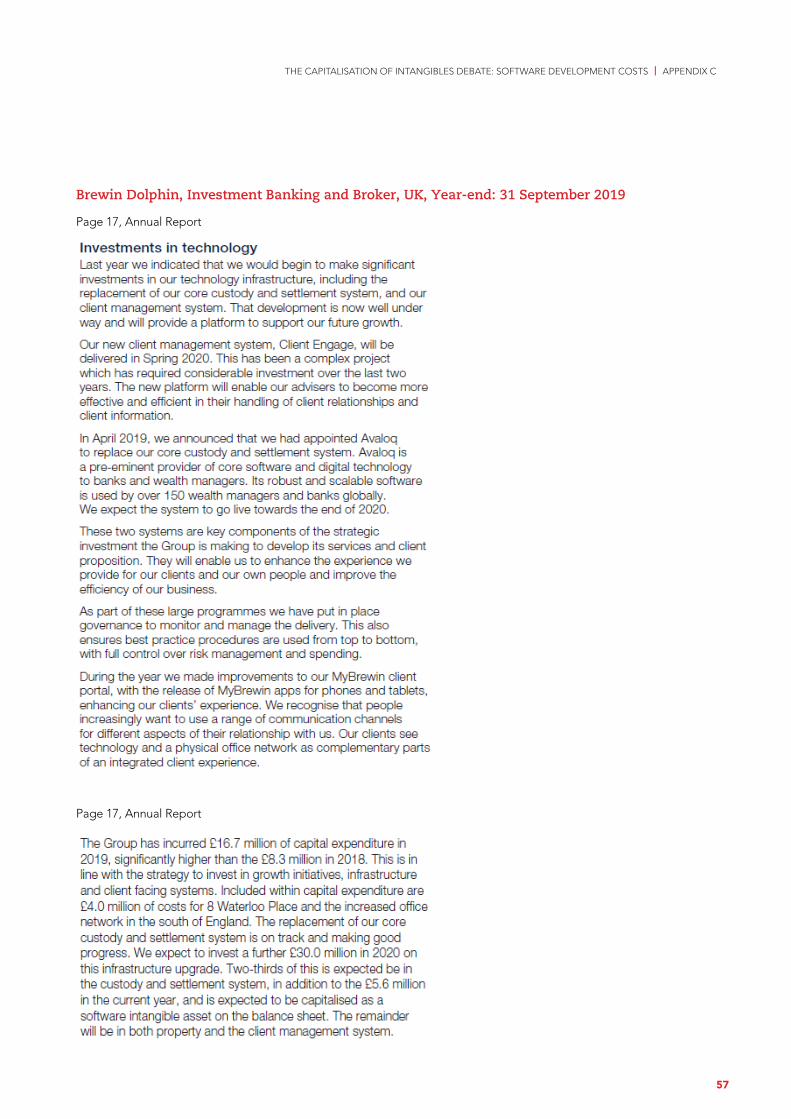
THE CAPITALISATION OF INTANGIBLES DEBATE: SOFTWARE DEVELOPMENT COSTS | APPENDIX C
Brewin Dolphin, Investment Banking and Broker, UK, Year-end: 31 September 2019
Page 17, Annual Report
Page 17, Annual Report
57
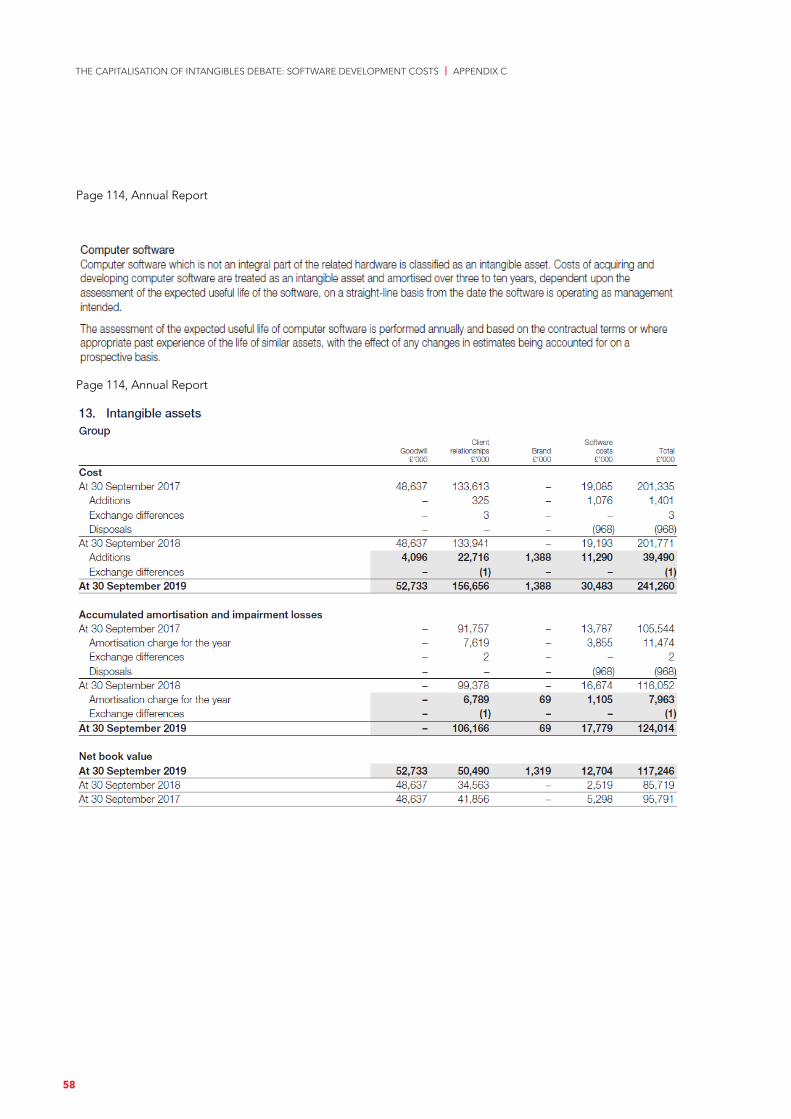
THE CAPITALISATION OF INTANGIBLES DEBATE: SOFTWARE DEVELOPMENT COSTS | APPENDIX C
Page 114, Annual Report
Page 114, Annual Report
58
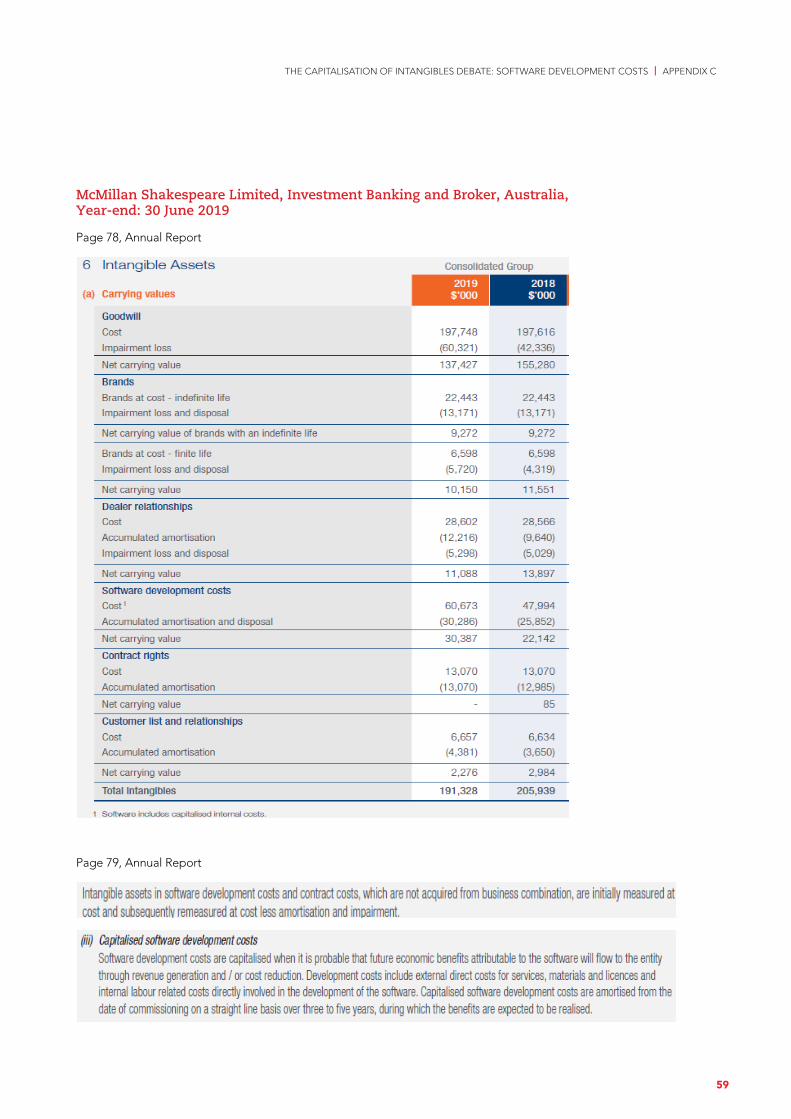
THE CAPITALISATION OF INTANGIBLES DEBATE: SOFTWARE DEVELOPMENT COSTS | APPENDIX C
McMillan Shakespeare Limited, Investment Banking and Broker, Australia, Year-end: 30 June 2019
Page 78, Annual Report
Page 79, Annual Report
59
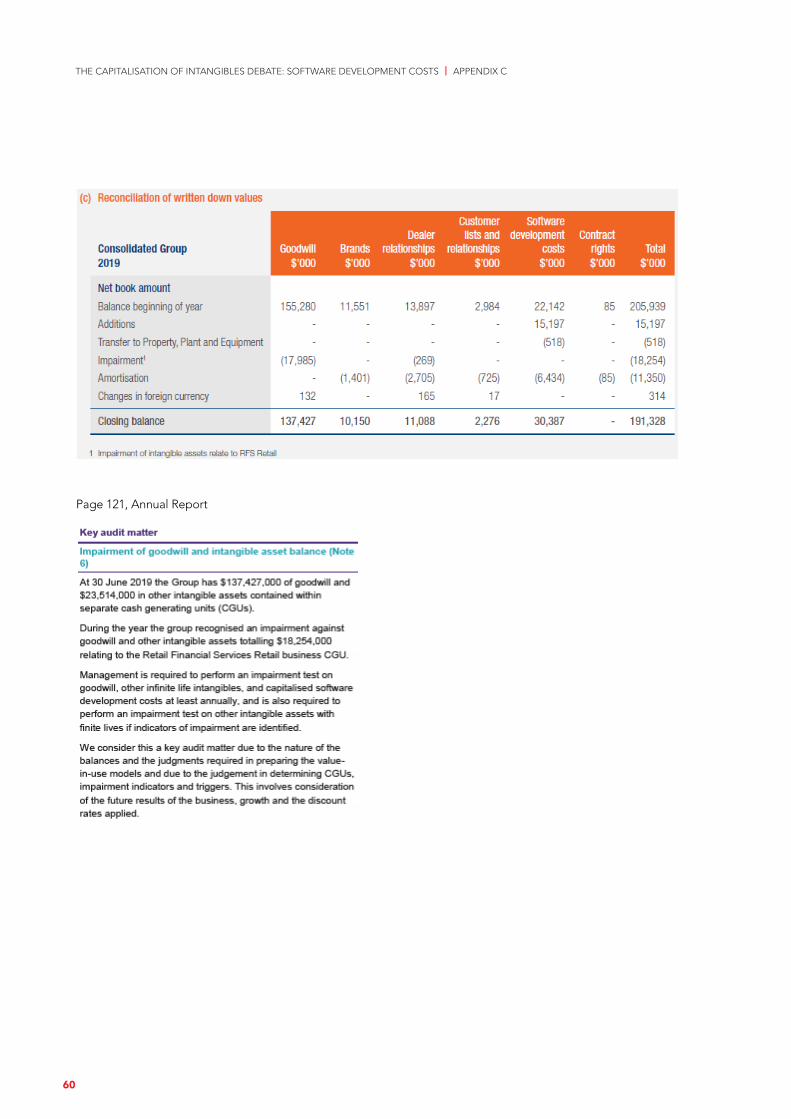
THE CAPITALISATION OF INTANGIBLES DEBATE: SOFTWARE DEVELOPMENT COSTS | APPENDIX C
Page 121, Annual Report
60
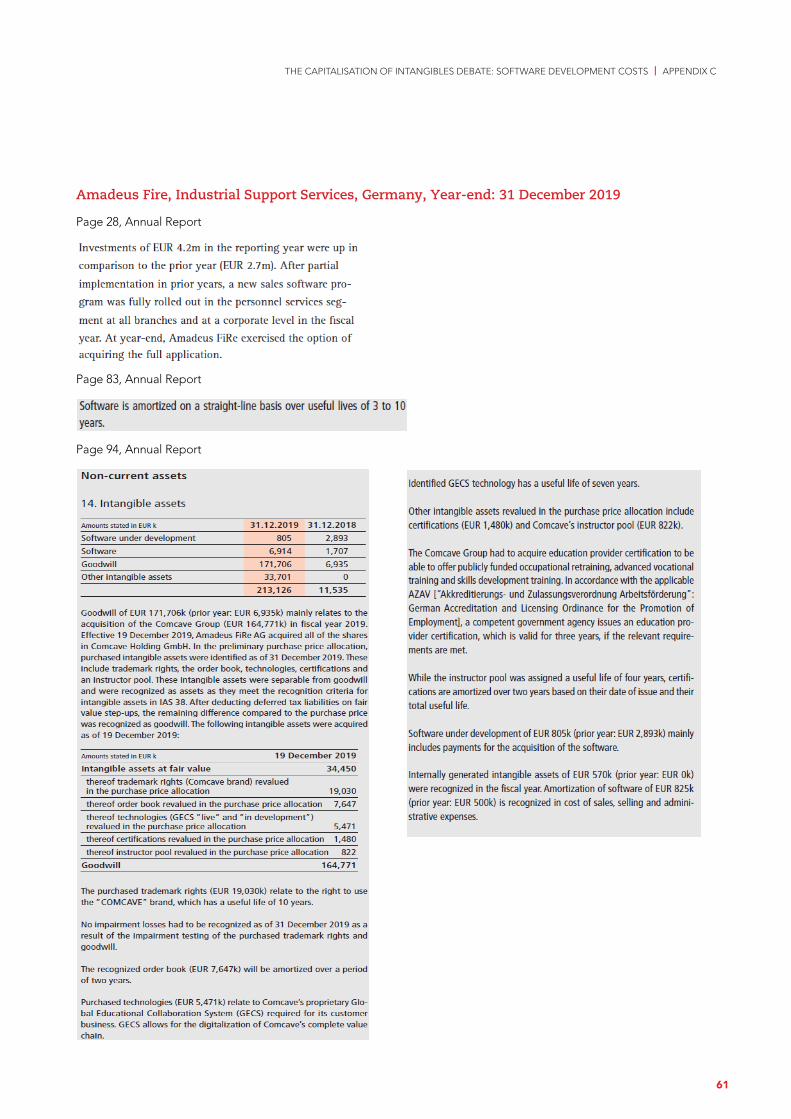
THE CAPITALISATION OF INTANGIBLES DEBATE: SOFTWARE DEVELOPMENT COSTS | APPENDIX C
Amadeus Fire, Industrial Support Services, Germany, Year-end: 31 December 2019
Page 28, Annual Report
Page 83, Annual Report
Page 94, Annual Report
61
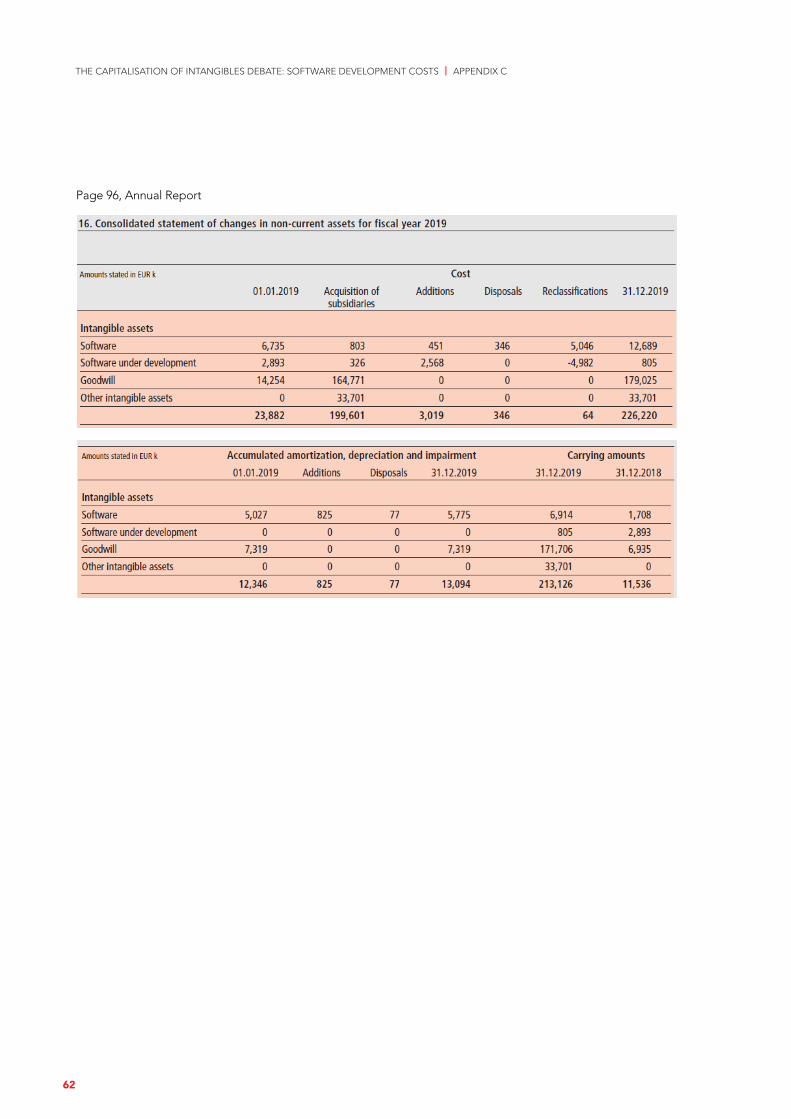
THE CAPITALISATION OF INTANGIBLES DEBATE: SOFTWARE DEVELOPMENT COSTS | APPENDIX C
Page 96, Annual Report
62
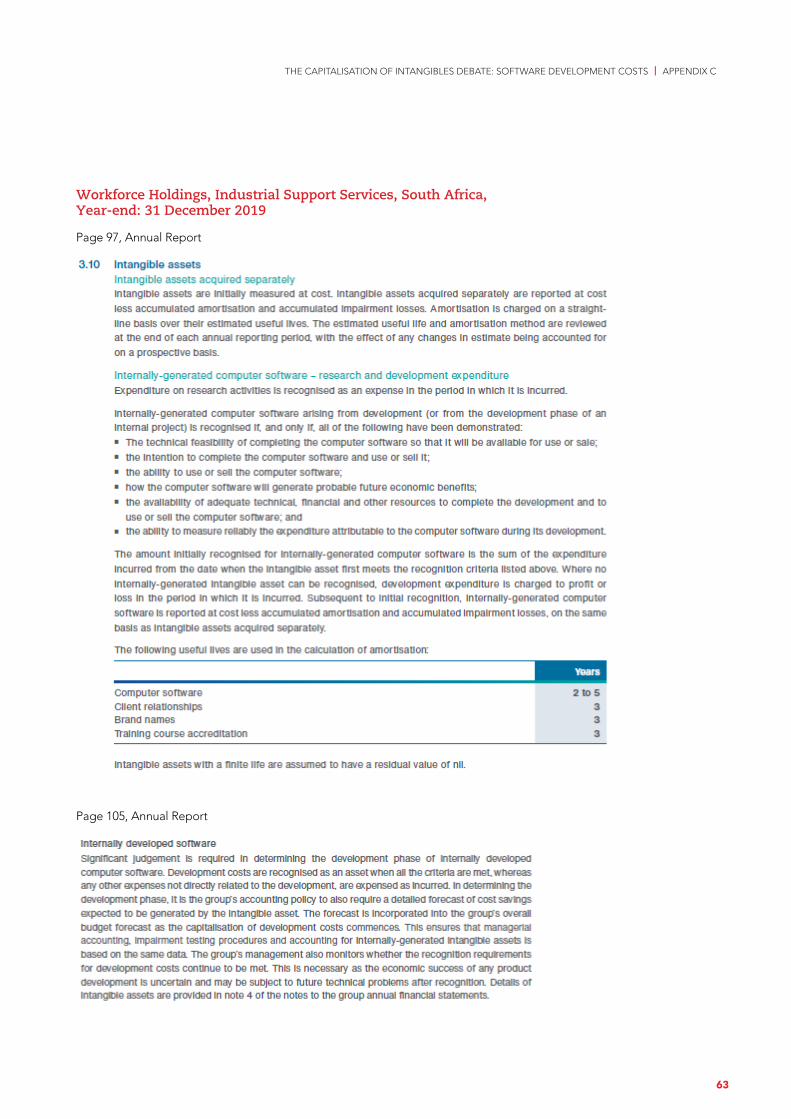
THE CAPITALISATION OF INTANGIBLES DEBATE: SOFTWARE DEVELOPMENT COSTS | APPENDIX C
Workforce Holdings, Industrial Support Services, South Africa, Year-end: 31 December 2019
Page 97, Annual Report
Page 105, Annual Report
63
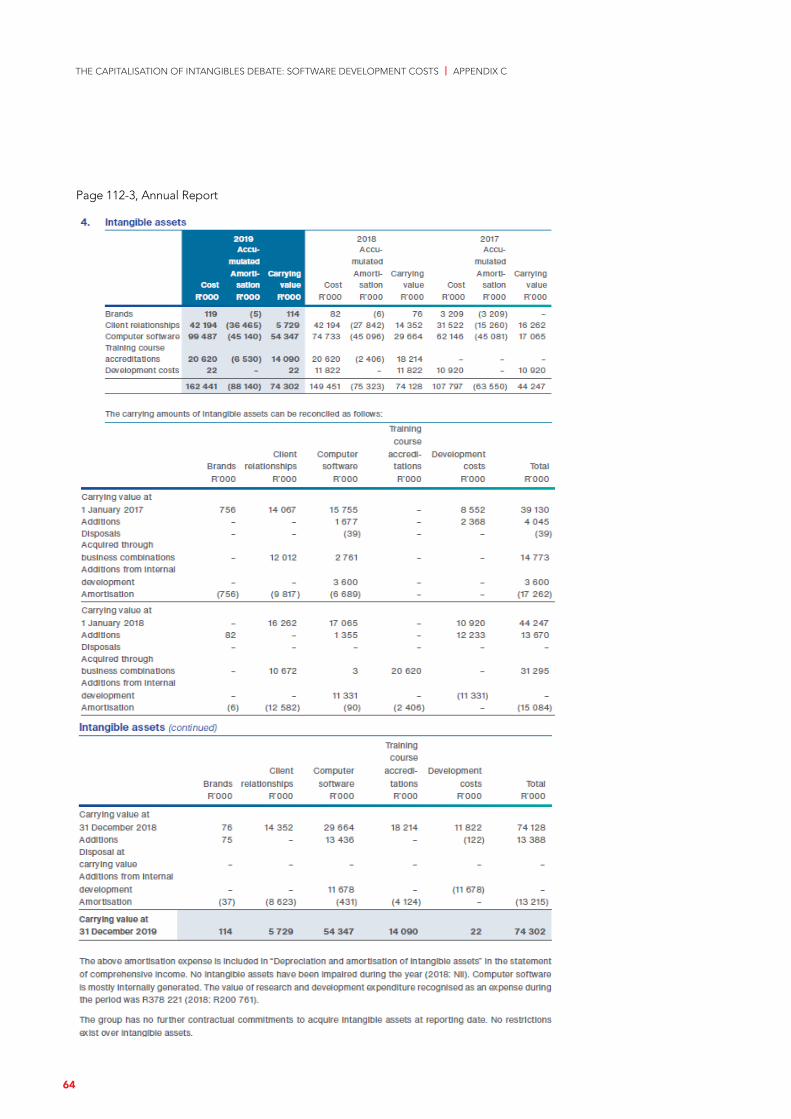
THE CAPITALISATION OF INTANGIBLES DEBATE: SOFTWARE DEVELOPMENT COSTS | APPENDIX C
Page 112-3, Annual Report
64
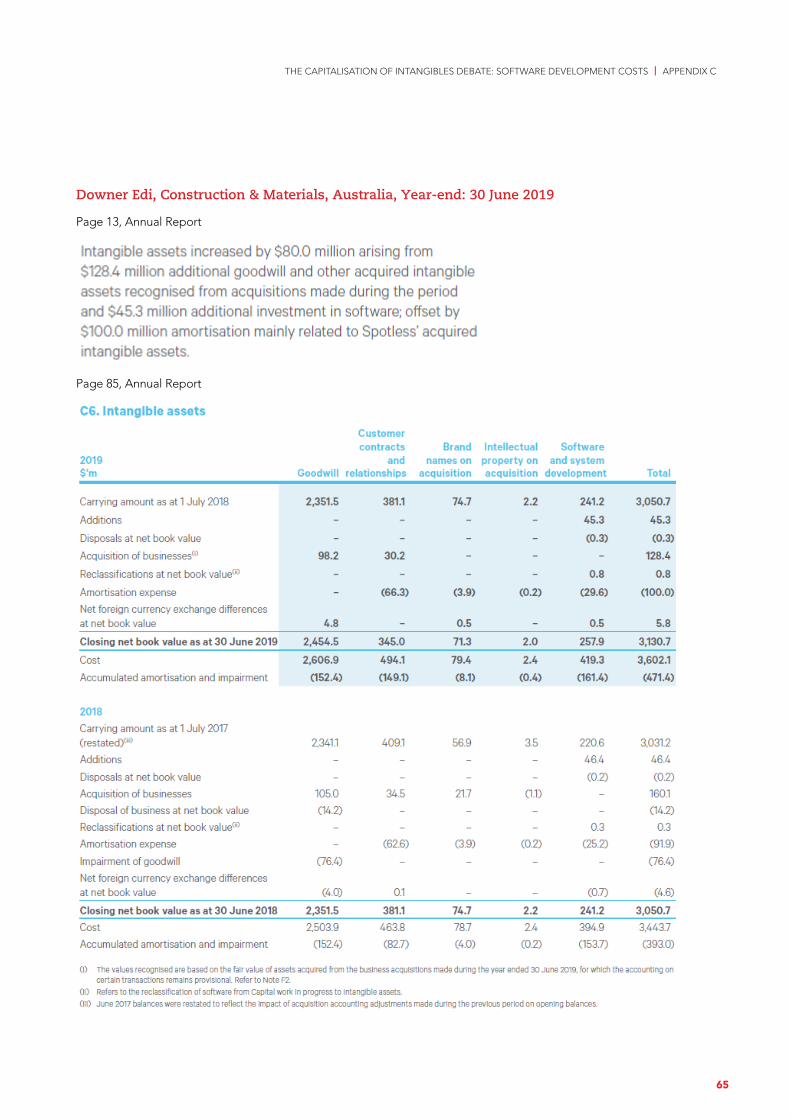
THE CAPITALISATION OF INTANGIBLES DEBATE: SOFTWARE DEVELOPMENT COSTS | APPENDIX C
Downer Edi, Construction & Materials, Australia, Year-end: 30 June 2019
Page 13, Annual Report
Page 85, Annual Report
65

THE CAPITALISATION OF INTANGIBLES DEBATE: SOFTWARE DEVELOPMENT COSTS | APPENDIX C
Page 86, Annual Report
66
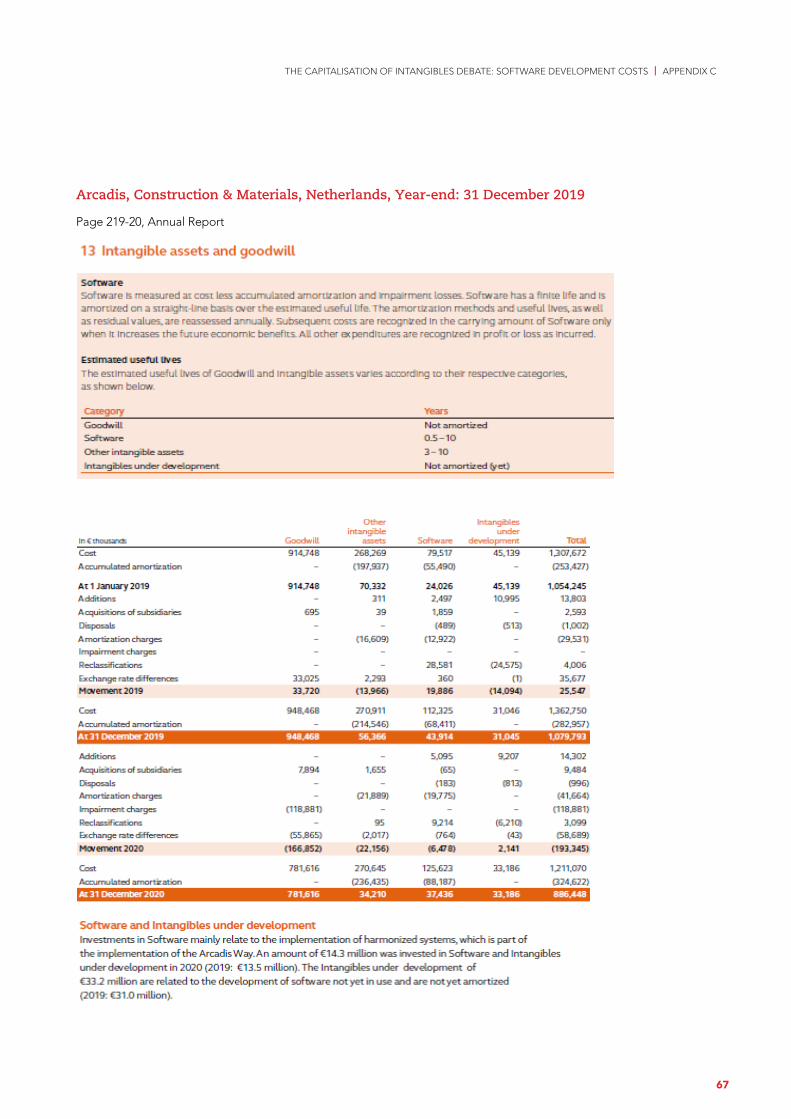
THE CAPITALISATION OF INTANGIBLES DEBATE: SOFTWARE DEVELOPMENT COSTS | APPENDIX C
Arcadis, Construction & Materials, Netherlands, Year-end: 31 December 2019
Page 219-20, Annual Report
67
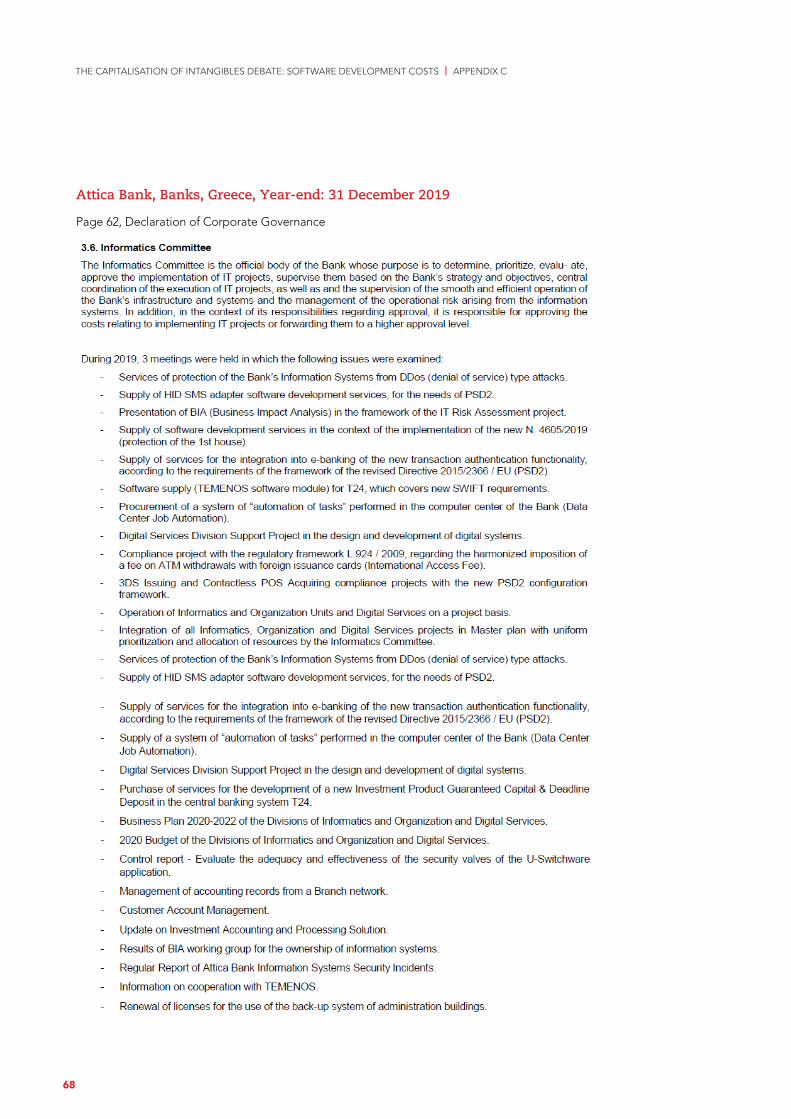
THE CAPITALISATION OF INTANGIBLES DEBATE: SOFTWARE DEVELOPMENT COSTS | APPENDIX C
Attica Bank, Banks, Greece, Year-end: 31 December 2019
Page 62, Declaration of Corporate Governance
68
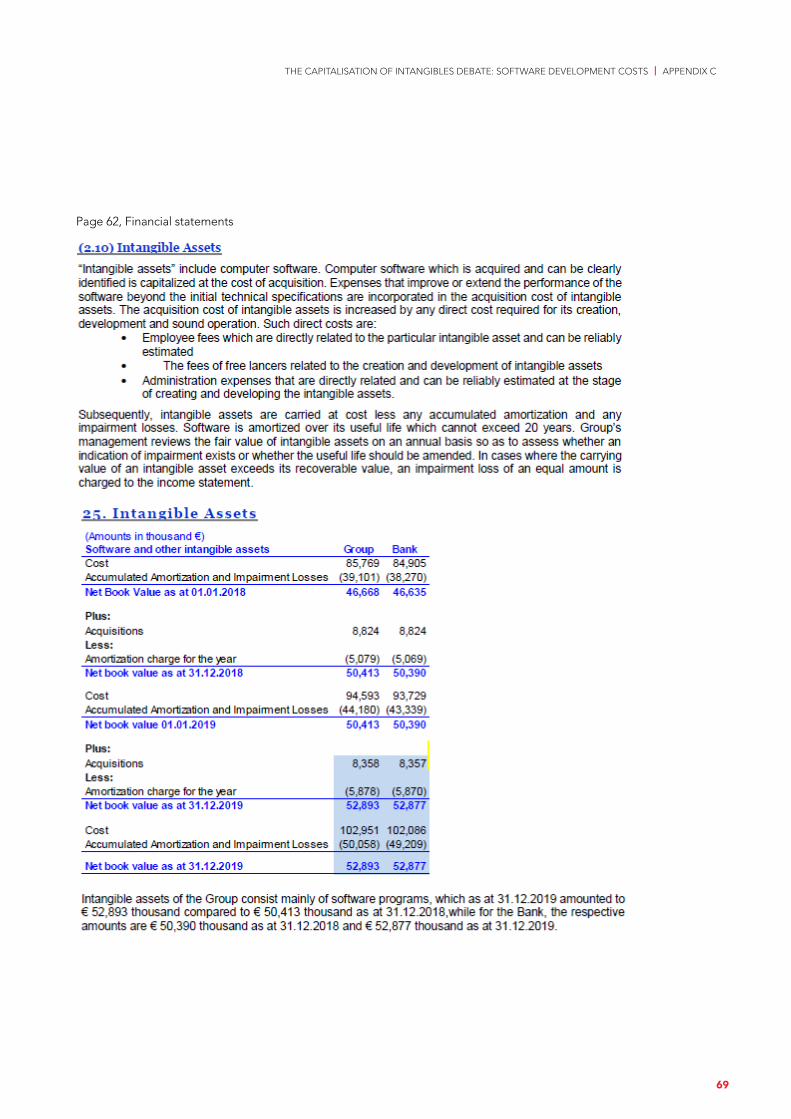
THE CAPITALISATION OF INTANGIBLES DEBATE: SOFTWARE DEVELOPMENT COSTS | APPENDIX C
Page 62, Financial statements
69
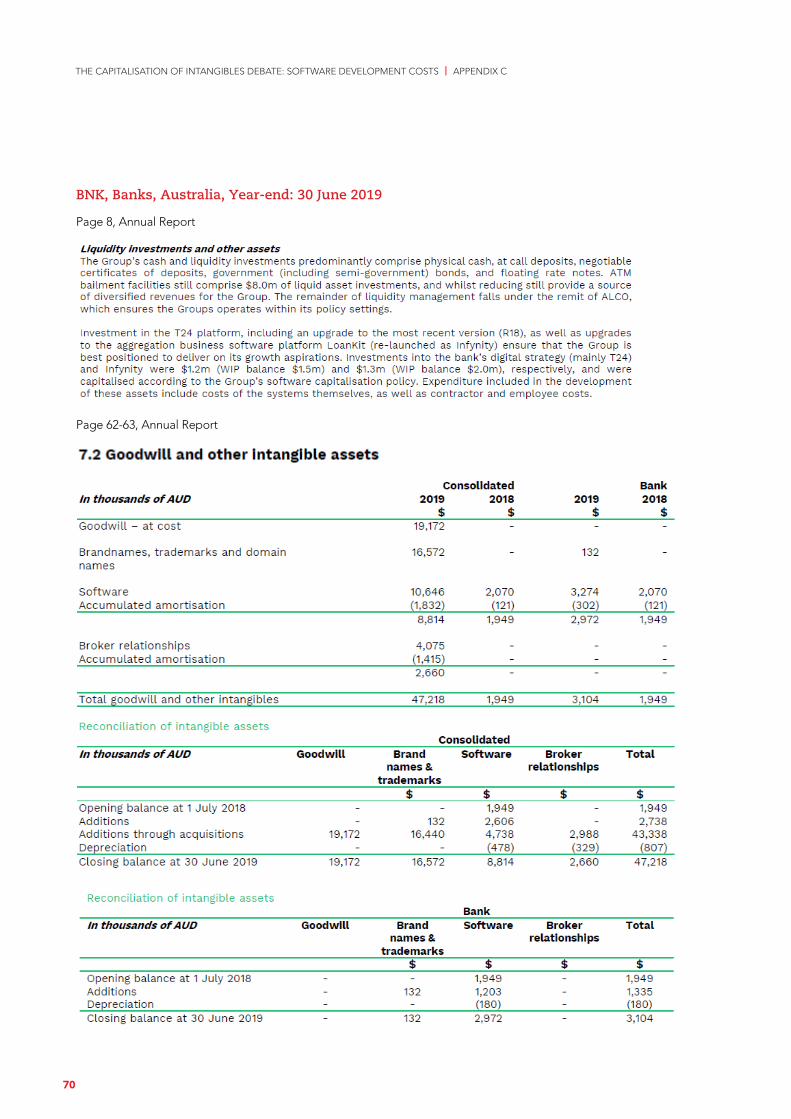
THE CAPITALISATION OF INTANGIBLES DEBATE: SOFTWARE DEVELOPMENT COSTS | APPENDIX C
BNK, Banks, Australia, Year-end: 30 June 2019
Page 8, Annual Report
Page 62-63, Annual Report
70
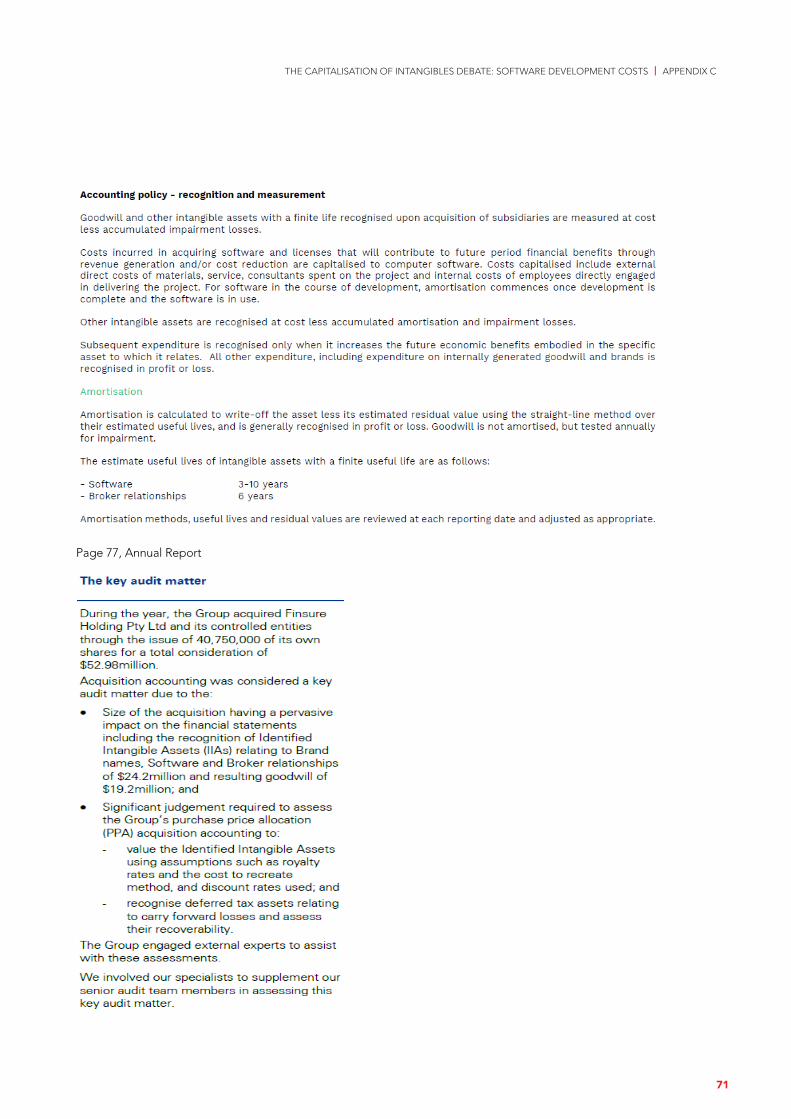
THE CAPITALISATION OF INTANGIBLES DEBATE: SOFTWARE DEVELOPMENT COSTS | APPENDIX C
Page 77, Annual Report
71

PI-INTANGIBLES-SOFTWARE
ACCA The Adelphi 1/11 John Adam Street London WC2N 6AU United Kingdom / +44 (0)20 7059 5000 / www.accaglobal.com