R&D expenditure, disclosure content and quantity, and ... · The capitalisation debate: R&D...
60
The capitalisation debate: R&D expenditure, disclosure content and quantity, and stakeholder views
Transcript of R&D expenditure, disclosure content and quantity, and ... · The capitalisation debate: R&D...

The capitalisation debate:R&D expenditure, disclosure content and quantity, and stakeholder views
© The Association of Chartered Certified Accountants February 2019
About ACCA ACCA (the Association of Chartered Certified Accountants) is the global body for professional accountants, offering business-relevant, first-choice qualifications to people of application, ability and ambition around the world who seek a rewarding career in accountancy, finance and management.
ACCA supports its 208,000 members and 503,000 students in 179 countries, helping them to develop successful careers in accounting and business, with the skills required by employers. ACCA works through a network of 104 offices and centres and more than 7,300 Approved Employers worldwide, who provide high standards of employee learning and development. Through its public interest remit, ACCA promotes appropriate regulation of accounting and conducts relevant research to ensure accountancy continues to grow in reputation and influence.
ACCA is currently introducing major innovations to its flagship qualification to ensure its members and future members continue to be the most valued, up to date and sought-after accountancy professionals globally.
Founded in 1904, ACCA has consistently held unique core values: opportunity, diversity, innovation, integrity and accountability.
More information is here: www.accaglobal.com
About Deloitte
“Deloitte” is the brand under which tens of thousands of dedicated professionals in independent firms throughout the world collaborate to provide audit, consulting, financial advisory, risk management, tax, and related services to select clients. These firms are members of Deloitte Touche Tohmatsu Limited, a UK private company limited by guarantee (“DTTL”).
Each DTTL member firm provides services in particular geographic areas and is subject to the laws and professional regulations of the particular country or countries in which it operates.
Each DTTL member firm is structured in accordance with national laws, regulations, customary practice, and other factors, and may secure the provision of professional services in its territory through subsidiaries, affiliates, and other related entities. Not every DTTL member firm provides all services, and certain services may not be available to attest clients under the rules and regulations of public accounting.
DTTL and each DTTL member firm are legally separate and independent entities, which cannot obligate each other. DTTL and each DTTL member firm are liable only for their own acts and omissions, and not those of each other. DTTL (also referred to as “Deloitte Global”) does not provide services to clients.
The capitalisation debate:R&D expenditure, disclosure
content and quantity, and stakeholder views
Francesco Mazzi, University of Florence
Richard Slack, Durham University
Ioannis Tsalavoutas, University of Glasgow
Fanis Tsoligkas, University of Bath
About this reportAs part of the wider debate on intangibles, this report looks at the extent to which companies using IFRS recognise development costs as assets in different countries and in different sectors. It investigates the factors that may lie behind that asset recognition and makes some suggestions as to how reporting of R&D might be improved.
Contents
Acknowledgements 5
Executive summary 6 Background and objectives 6
Method 6
Main findings 7
Phase 1: R&D accounting treatment and reporting 7
Phase 2: Quantity of R&D-related keywords 7
Phase 3: Stakeholders’ views 8
Conclusions and policy recommendations 8
1. Introduction 11 1.1 Aims 11
1.2 Objectives 12
1.3 Report outline 12
2. Literature review 13 2.1 Determinants of decision to capitalise development costs as well as levels
of development costs capitalised 13
2.2 R&D capitalisation and signalling 14
2.3 Accounting conservatism and prudence: Views of preparers and auditors 15
2.4 R&D-related disclosures 16
3. Research approach 17 3.1 Phase 1 – Sample selection 17
3.2 Phase 1 – Methods applied 20
3.3 Phase 2 – Sample selection 22
3.4 Phase 2 – Methods applied 22
3.5 Phase 3 – Method applied 22
4. Findings and discussion 25 4.1 Phase 1 – Decision to capitalise development costs and amount capitalised 25
Expected and unexpected accounting treatment of R&D 30
4.2 Phase 2 – R&D-related disclosures in annual reports 35
4.3 Phase 3 – R&D accounting and reporting: stakeholders’ views 41
5. Conclusion 47 5.1 Conclusions and recommendations 47
5.2 Limitations and directions for future research 48
4
About the authors 49
References 50
Appendix I: Definitions of variables used in all quantitative analyses 52
Appendix II: List of R&D key terms used in Phase 2 of the project 53
Appendix III: Project overview and issues for the interviewees to consider 54
Appendix IV: Descriptive statistics of full capitalisers and non full capitalisers 55
Appendix V: Detailed frequency analysis of R&D terms across industries, expensers and capitalisers 56
Appendix VI: Examples of companies with varying disclosure and R&D intensity levels 57
ACKNOWLEDGEMENTS
The authors would like to thank ACCA for providing the funding for this project. We are grateful to Richard Martin (ACCA) and Alan Teixeira (Deloitte) for their valuable suggestions, support and advice during the project. We thank the participants who attended the roundtable discussion held at ACCA on 16 April 2018 and provided constructive feedback on preliminary findings of this research. The participants reflected views from relevant constituencies, including auditors, investors, international accounting bodies and corporate preparers. We thank Sotirios Kokkinos and Vicki Sheard for excellent research assistance with the collection of the annual reports and interview transcription, respectively. Finally, we would like to record our appreciation to all those stakeholders who took the time to participate in our interviews and provided valuable insights into the issues we explore in this report.
5

BACKGROUND AND OBJECTIVESThere are concerns that financial statements no longer reflect the underpinning drivers of value in modern business (Bernanke 2011; Haskel and Westlake 2017; Lev and Gu 2016). Such concerns are particularly relevant to accounting for intangibles, including research and development costs (hereafter R&D). Under IAS 38 Intangible Assets, while research costs are expensed, development costs should be capitalised, if they meet the six conditions specified in the standard. Thus, at least technically, the capitalisation of development costs is not considered a managerial choice. Nevertheless, from the financial statements’ preparers’ point of view, significant managerial judgement and detailed evaluations are required so as to conclude whether the six conditions have been met or not. Similarly, auditors need to exercise judgement with associated detailed evaluations to enable them to conclude that they are satisfied with the adopted accounting treatment of their clients. Interestingly, mandatory disclosure requirements in IAS 38 are only that the relevant amounts involved (ie capitalised and/or expensed and if these are material) be disclosed separately.
Executive summary
6
Thus, financial statement users, when using an annual report, primarily rely on firms’ voluntary/narrative R&D disclosure decisions for understanding the value and future benefits arising from such capitalised expenditure. In practice, given the requirements in IAS 1 Presentation of Financial Statements, one would also expect companies to disclose information on significant risk factors and managerial judgement relative to material levels of capitalisation.
While there is literature relevant to R&D in non-IFRS (International Financial Reporting Standards) reporting regimes, to the best of the authors’ knowledge, research on the characteristics of firms that capitalise and/or expense R&D expenditure specifically under IFRS is minimal. Similarly, research that captures the quantity of companies’ disclosures in relation to R&D under an IFRS reporting regime is also minimal. Finally, users’ and/or preparers’ views on the matter are largely absent from extant literature following the adoption of IFRS. The overall objective of this research is to shed light on these three areas.
METHOD
This research project was conducted in three PhasesIn Phase 1, by drawing on listed companies from more than 20 countries (20,475 firm-year observations) that adopted IFRS in 2005 or later, for the 10-year period 2006 to 2015, we collect and summarise evidence on: how many firms expense all their R&D costs (expensers) and how many companies capitalise some of or all their R&D costs (capitalisers) and how many expense all their R&D costs. This evidence is provided in aggregate and also on a country and industry level. We also provide descriptive statistics of the amounts capitalised and expensed relative to market values. We then provide analyses that indicate the country- and firm-level determinants that drive the decision to capitalise development costs, as well as the amounts capitalised.
In Phase 2, we capture and analyse the quantity of R&D-related disclosures in company annual reports for a sub-sample of around 3,400 observations from those firms identified in Phase 1. We construct a research instrument that contains 116 R&D-related keywords. Using software,
The capitalisation debate: R&D expenditure, disclosure content and quantity, and stakeholder views | Executive summary
7
anti-self-dealing index, the higher the incidence and level of R&D capitalisation. Capitalisation is also greater and more likely to occur in countries with a common law legal system.
Further analysis, examining expected levels of capitalisation, indicates that a large proportion of firm-year observations expensing R&D (84%) follow the expected method for the accounting treatment, given their firm- and country-specific characteristics. Nonetheless, we find that a large proportion of firm-year observations capitalising R&D (45%) would be expected to have expensed R&D costs, on the basis of their firm and country characteristics. This indicates that expensing should incur more frequently, given firm- and country-specific characteristics.
Thus, concerns that financial reporting is becoming less decision-useful – with balance sheets not fully (or at all) reflecting the rise in intangible assets (compared with a historic tangible asset base) that now underpin business models and firm economic growth – appear apposite.
Phase 2: Quantity of R&D-related keywords Overall, we find that companies do not provide a high quantity of R&D-related disclosure, despite the importance of intangible assets such as R&D. Although some evidence was found of extensive disclosure with a high of 287 keywords referred to across the annual report, the median frequency in annual reports is only 17 keywords. This mirrors the relative lack of capitalisation although it raises questions about the general disclosure in R&D investment, even where this is largely expensed. Further, companies tend to refer more to R&D in the first half of the annual report (ie voluntary disclosure narratives) than in the second half (ie the financial statements). Moreover, not surprisingly, we find some evidence that firms that capitalise R&D tend to refer marginally more frequently to R&D in the financial statements section of the annual report than firms that expense R&D. In the narrative section of the annual report, we find no differences in the quantity of R&D disclosures between those companies that expense R&D and those that capitalise R&D.
we count the number of times these R&D-related keywords feature in the annual reports as a whole and within the narrative and financial statements sections separately. We analyse these results in relation to capitalisers and expensers, and according to R&D intensity. Further analyses draw on the industry- and country-level determinants of ‘higher’ versus ‘lower’ disclosers.
Preliminary evidence from Phases 1 and 2 was presented to an ACCA roundtable discussion. Using these findings, prior literature and feedback from the roundtable, in Phase 3, we conducted interviews with key stakeholders (preparers, auditors and investors), to gain insights into the capitalisation treatment, related disclosure and its decision usefulness. The last of these considers the relevance of the accounting treatment of R&D to users of financial statements and whether there is a need for the decision usefulness of R&D reporting to be improved.
MAIN FINDINGS
Phase 1: R&D accounting treatment and reportingThe data shows that 62.2% of observations in the sample fully expense R&D costs, while the remainder are split between those that partially capitalise (27.5%) and those that fully capitalise (10.3%). Arguably, these findings suggest that in conforming to the requirements and conditions set out in IAS 38, the majority of companies either fully or partly expense R&D and hence the recognition of R&D as an intangible asset category may be viewed as low.
Within the results, there are country- and industry-level differences in capitalisation.
At a firm level, the decision and magnitude of capitalisation is positively affected by a firm’s R&D intensity, leverage, internationalisation (measured by its percentage of international sales), and earnings-management incentives. Larger firms exhibit a lower incidence of capitalisation and capitalise proportionally lesser amounts than smaller firms. The stronger the audit and enforcement mechanisms in a country and the greater investor protection and the higher its
The stronger the audit and enforcement mechanisms in a country and the greater investor protection and the higher its anti-self-dealing index, the higher the incidence and level of R&D capitalisation.

The capitalisation debate: R&D expenditure, disclosure content and quantity, and stakeholder views | Executive summary
8
Further, while it is acknowledged that capitalisation of some development costs could act as a signal of the managerial view of the future generation of income from certain assets, investors seem to focus more on the overall spend on R&D and are less interested in its accounting treatment, consistent with the no-effects hypothesis. This is in part further justified by a concern that capitalisation may serve as an earnings-management tool. As a result, some investors either capitalise all R&D and then amortise it or make no adjustments to the split featuring in the accounts, when they prepare their valuation estimates.
As regards disclosure, there was general agreement that mandatory disclosure in IAS 38 is minimal and often boiler-plated disclosure on R&D expense and capitalisation. There is a desire for greater disclosure, which would underpin any capitalisation decision based on the six criteria. Further, such disclosure should directly link to those disclosures provided under IAS1 on material judgements relating to the capitalisation decision. Nevertheless, the perception is that such disclosure is currently limited, on the grounds that this would force companies to provide proprietary information.
CONCLUSIONS AND POLICY RECOMMENDATIONSThe issue of intangible assets and R&D in particular has been on the agenda of standard setters and regulators for some time. For example, in 2015, as a response to the request for views on the Agenda Consultation of the International Accounting Standard Board (IASB), the European Securities and Markets Authorities (ESMA) agreed that there is need for a review of the guidance for intangible assets and R&D. Indeed, ESMA suggested that the topic be added to the IASB’s research agenda as a separate item (Maijoor 2015). More recently, in November 2017, the Financial Accounting Standards Board (FASB) reported that it was undertaking a project aiming to review, inter alia, the mandatory disclosures for intangibles (FASB 2018). In the UK, in 2018, the Financial Reporting Council (FRC) initiated a project to review
As with the results in Phase 1, there are country- and industry-level differences in capitalisation.
The quantity of R&D disclosure is positively affected by a firm’s R&D intensity, size, risk (as proxied by beta), international exposure and incentives to manipulate earnings. Further, older firms tend to disclose less about R&D. Finally, companies in countries with high levels of corruption and those companies in a country with common law legal systems tend to disclose more about their R&D.
Phase 3: Stakeholders’ viewsThe views of the 16 stakeholders who participated in our interviews are summarised as follows. There is a general support for a principles-based accounting standard that requires capitalisation against a set of criteria. This is against the uniform expensing accounting treatment in the US. It is argued that principles-based capitalisation enhances comparability between companies in specific sectors and over time. Even so, it is accepted that current reporting practice appears to be dominated by prudence rather than faithful representation. Thus, expensing R&D costs is more readily justified than capitalising them. This is driven by three main factors: difficulty in meeting the six criteria outlined in IAS 38, concerns over future impairments of development costs capitalised, and constraints in the assurance of any capitalised costs.
Concerns were also raised as to the apparent inconsistency between the accounting treatment of internally generated R&D compared to externally purchased R&D. Capitalisation of internally generated development costs is largely constrained by the requirement to meet the six conditions specified in IAS 38. However, as part of an acquisition, under IFRS 3 Business Combinations, many of these assets that are not recognised in the acquiree’s pre-combination financial statements would then be measured at fair value and recognised. Thus, for two otherwise identical firms, differing accounting treatment of R&D costs could result in internally generated costs being primarily expensed whereas externally acquired could be capitalised.
There is a general support for a principles-based accounting standard that requires capitalisation against a set of criteria.

The capitalisation debate: R&D expenditure, disclosure content and quantity, and stakeholder views | Executive summary
9
any capitalised amounts. Perhaps professional accountancy bodies can assist in the improvement of companies’ practices indirectly. Providing more in-depth training on the area of R&D and the issues around it could assist in a change of culture from an emphasis on ‘prudence’ to ‘more faithful representation’. Additionally, preparers and auditors could be encouraged to support more disclosures to assist transparency and the associated decision-usefulness of financial statements.
We find that references to R&D-related terms are, in general, minimal in company annual reports. Moreover, where disclosure is provided, it varies significantly in length and location in the annual report. The interviews with stakeholders confirm a demand for more disclosure, especially when development costs are capitalised. Thus, as a first step forward, companies are encouraged to provide clearer and greater levels of disclosure than that currently provided in relation to the amounts of R&D expenditure in their financial statements.
As far as the standard setters are concerned, if disclosures continue not to be mandated in IAS 38, a better link between R&D-related information and those disclosures required in IAS 1 about estimation of risks and future prospects would be useful to users of financial information. Moreover, given the signalling importance of overall R&D spend rather than necessarily how it is accounted for, our respondents deem that enhanced disclosure about the overall amount of R&D spend is appropriate to aid the decision-usefulness of financial statements (either in notes to the financial statements or the narratives section of the annual report).
current requirements and practice for the business reporting of intangibles and subsequently develop practical proposals for their improvement in the future. Following along these lines, in the feedback statement of its research agenda consultation, the European Financial Reporting Advisory Group (EFRAG) is also proposing to work on this area in the near future. More specifically, it proposes research regarding better information on intangible assets (EFRAG, 2018). On that basis, it is anticipated that the conclusions and recommendations arising from our research findings would inform these projects.
The findings show that more than 60% of the companies in the sample do not capitalise any R&D. Additionally, a large proportion of the companies that capitalise some development costs would be expected not to do so, given their firm- and country-specific characteristics. Overall, however, while maintaining the principles-based approach that supports capitalisation, current criteria in IAS 38 would seem largely to militate against capitalisation. This is in contrast to IFRS 3 where externally purchased R&D can be capitalised on acquisition. Hence, the findings reflect an apparent tension or inconsistency between accounting standards and the treatment of R&D costs. In relation to IAS 38, relaxing the criteria for capitalisation by reducing their number could be the way forward. This may help improve the value-relevance of financial information by more fully matching revenues with costs in the income statement through capitalising and amortising expense on value-creating assets such as R&D. Further, a reduction or simplification of the capitalisation criteria could also result in giving companies less room for exercising earnings management and increasing auditors’ ability to assure
Providing more in-depth training on the area of R&D and the issues around it could assist in a change of culture from an emphasis on ‘prudence’ to ‘more faithful representation’.

The capitalisation debate: R&D expenditure, disclosure content and quantity, and stakeholder views | Executive summary
10
iii. There should be a requirement to set out the key judgements or assumptions made in deciding on capitalising or expensing development costs. The focus could be on technical feasibility with the addition of a requirement to report the thresholds companies use to assess the technical feasibility of completing the potential asset. For example, in pharmaceutical firms, is this when they complete human trials, or reach human trials, or earlier? For other types of firm, is this at a particular testing stage? Such information would help to understand differences between entities and gives an insight into trigger points. This should be required for each class of development costs capitalised (see required disclosure (i) above).
iv. Moreover, we find that the amount of R&D-related disclosure from companies in countries such as Italy, which explicitly requires companies to discuss R&D in the Management Discussion and Analysis section of annual reports, significantly exceeds the levels among companies in countries lacking such a requirement. Hence, the revised Management Commentary or revised corporate governance policies at the country level could require a specific section on R&D, where relevant.
v. Finally, we find significant differences in the decisions about capitalising development costs, amounts capitalised and the quantity of R&D-related terms, between countries. Thus, any changes in related regulations/standards that will be applicable to a variety of countries will be unlikely to resolve differences in reporting practices between countries. The role of local institutional characteristics thus needs to be taken into consideration when interpreting a company’s financial reporting practices.
If the IASB decides to introduce specific mandatory disclosures on R&D within IAS 38, we would propose, given our findings, that requirements be made that could address the following.
i. Capitalised development costs that are reported within the reconciliation of movements of intangible assets could be reported between different categories (eg recognition of development costs related to new projects or additions/improvements to existing projects that result in additional amounts of capitalised development costs).
ii. The total R&D expense that is currently required to be reported separately should be disaggregated between pure research and costs in relation to projects that fail to meet one of the six criteria. In fact, it would be valuable for companies to disclose cumulative costs expensed for projects that reach the point at which the entity starts to capitalise costs. Such information would allow users of the financial statements to understand what the total expense to date has been on such projects. In other words, did companies spend a lot to get to that point? This would be particularly relevant for firms that tend to expense all or most of their R&D costs (eg Pharmaceuticals). Similarly, if a company abandons a project, it would be helpful for users to know the sunk costs recognised as research to that point.
There should be a requirement to set out the key judgements or assumptions made in deciding on capitalising or expensing development costs.

11
1. Introduction
Despite the continuous adoption of IFRS, or convergence of national accounting standards with IFRS across the world, there remain concerns and debates about the levels of accounting comparability between companies.
Significant aspects of these concerns relate to the level of assets recognised in financial statements, and the accompanying disclosures as mandated by the standards. It is argued that this is in part because of the principles-based nature of IFRS which, through their application, allows for managerial discretion.
Of particular relevance to this project, ‘…intangible investments have become the main value creators for many companies and economic sectors. However, these investments are rarely recognized as assets by current accounting standards [owing to expensing]’ (Zéghal and Maaloul 2011: 262). Hence, the level of recognition and the accounting treatment of R&D as a potential component of a company’s intangible asset base (Lev 2018a; 2018b) has become increasingly important. Indeed, Lev (2018a) considers the accounting to be insufficient and inconsistent with knowledge-based business models and the failure to recognise intangibles.
financial statement users have to rely on firms’ voluntary/narrative R&D disclosure decisions for understanding the value and future benefits arising from such capitalised expenditure. But this, itself, is also subject to managerial bias in reporting (Lev 2018b).
Given this background, this project focuses on the areas of accounting for, and the reporting of, R&D, and has the following aims and objectives.
1.1 AIMSThe aims of this research project are to examine:
• companies’ reporting practices for capitalisation (ie capitalisation versus expensing) and the levels of capitalisation of development costs
• companies’ levels of disclosures on the area of R&D, and
• the views of key stakeholders on companies’ reporting practices for R&D accounting and reporting.
Under US accounting standards, all R&D expenditure is expensed as incurred and no capitalisation is permitted.1 Under IAS 38 Intangible Assets, although research costs are expensed, development costs should be capitalised. Such capitalisation of development costs is dependent on their meeting six conditions specified in the standard. Thus, the capitalisation of development costs is not considered a managerial choice. Nevertheless, from the financial statements’ preparers’ point of view, significant managerial judgement and detailed evaluations are required to determine whether these conditions have been met or not. Similarly, auditors need to exercise judgement and carry out sufficiently detailed evaluations to determine whether they are satisfied with the adopted accounting treatment of their clients. Interestingly, mandatory disclosure requirements in IAS 38 are minimal in this respect, although IAS 1 does specify disclosure if such judgements are a source of estimation uncertainty in relation to a material item in the financial statements. In general, however, for R&D,
1 The only exception to this, under US GAAP, relates to software development (SD) costs which can be capitalised once technological feasibility is established (SFAS 86 Accounting for the Costs of Computer Software to Be. Sold, Leased, or Otherwise Marketed).

The capitalisation debate: R&D expenditure, disclosure content and quantity, and stakeholder views | 1. Introduction
12
More specifically, focusing on a sub-sample of firms identified in Phase 1, we count the number of R&D-related keywords/phrases in companies’ annual reports as a whole and across the narratives and financial statements sections, separately. Subsequently, this information is presented across countries and industries as well as between capitalisers and expensers. Further analyses draw on the firm- and country-level determinants affecting a firm’s disclosure quantity.
Using the evidence gathered on the first two objectives, the third objective is to gain insights into the capitalisation treatment and related disclosure and their decision-usefulness, and this was done by conducting interviews with key stakeholders (preparers, auditors and investors). We also gauge stakeholders’ views on how R&D reporting could be improved. Ultimately, information from these interviews enables comment on stakeholder perceptions of the adequacy of the current reporting framework and recommendations for potential changes.
1.3 REPORT OUTLINEThe next chapter provides a brief overview of the prior academic literature. The research approach is then outlined in Chapter 3, followed by the presentation and discussion of the results of each Phase separately in Chapter 4. Conclusions are set out in Chapter 5.
1.2 OBJECTIVESThe above aims are broken down into three related objectives, which have been pursued in three distinct research Phases.
The first objective is to analyse both the proportion of firms capitalising R&D (either fully or partially) compared to those expensing all R&D-related costs, and their levels of capitalisation. This analysis is based on a large sample of listed companies from more than 20 countries, which adopted IFRS (or had their national accounting standards converged to IFRS) in 2005 or later, for the 10-year period 2006 to 2015.
This evidence is provided at an aggregate level and at country and industry levels. This analysis is supplemented by descriptive statistics on the amounts capitalised and expensed relative to market values. Further analysis provides evidence on the country- as well as firm-level determinants that drive the decision to capitalise development costs as well as the amounts capitalised. Beyond this, econometric models are also run to identify over- and under-capitalisation against expected levels at a firm level. This analysis is based on industry and year clusters, while controlling for country influences.
The second objective is to capture and analyse the quantity of R&D-related disclosures in companies’ annual reports.
The aims of this research are broken down into three related objectives, which have been pursued in three distinct research Phases.

13
2. Literature review
The accounting for R&D, the relevant level of disclosure and its informational content to users remains a highly debated and researched area (see, for instance, the reviews in Jeny and Moldovan 2018; Wyatt 2008; Zéghal and Maaloul 2011).
Given the increase in importance of intangible compared with tangible assets in driving company value, this is an important area to a multitude of stakeholders ranging from preparers to users and, more widely, to standard-setting bodies globally. Indeed, Lev (2018a: 465) argues that the deterioration of the usefulness of financial information that has been reported in the US market (Lev and Gu 2016) is in part attributable to ‘standard-setters’ failure to adjust asset recognition rules to the fundamental shift in corporate value-creating resources from tangible to intangible assets’. While recognising that Lev and Gu’s findings are based on a US study, the general argument that intangible assets, including R&D, are not reflected on financial statements, holds even under IFRS where capitalisation is permitted (Zéghal and Maaloul 2011). Hence, Lev’s assertion that there is ‘a widespread dissatisfaction with the relevance and usefulness of corporate financial report information to investors’ (Lev 2018a: 465) that reflects a ‘largely uninformative balance sheet’ (Lev 2018a: 466) potentially extends beyond US accounting standards.
This prior, primarily non-IFRS, literature identifies the capitalisation of R&D as a function of a firm’s life cycle and whether the firm meets the conditions for capitalisation. On this basis, the following characteristics have been found to affect a company’s decision about capitalising development costs as well as levels of development costs capitalised: book to market ratio, as a proxy of risk and growth; R&D value, which is a proxy for the success of a firm’s R&D expenditure; R&D intensity, on the rationale that the more R&D-intense a company is, the higher the probability that it will capitalise some development costs and the higher the amounts to be capitalised; the market value of the company, as a proxy for size; the company’s beta, as a proxy for risk because riskier firms are more likely to engage in basic research that is expensed than are less risky firms (Aboody and Lev 1998); and finally leverage, as a proxy for financial health.
In addition to these characteristics, the literature has concentrated on managerial incentives, which may be associated with the company’s reported performance, as the latter is affected by the accounting
Against this backdrop, and in line with the project’s aims, this chapter summarises three key areas of the literature, which relate to: the determinants of the decision to capitalise development costs and levels of development costs capitalised; the signalling role of R&D capitalisation; and the views of preparers and auditors on the role of accounting conservatism and prudence. We discuss these three key areas in turn, while recognising that much of this prior literature is non-IFRS based.
2.1 DETERMINANTS OF DECISION TO CAPITALISE DEVELOPMENT COSTS AS WELL AS LEVELS OF DEVELOPMENT COSTS CAPITALISEDFor reporting regimes other than US GAAP that permit (or permitted in the past) capitalisation of development costs, prior literature has examined the company characteristics that are associated with a firm’s decision to capitalise some of the R&D expenditure (eg France: Cazavan-Jeny et al. 2011; Germany: Dinh et al. 2015; Italy: Markarian et al. 2008; UK: Oswald 2008; Oswald and Zarowin 2007).

treatment of R&D. More specifically, companies may manage their earnings, via the amounts of R&D costs expensed/capitalised, in an attempt to achieve certain earnings targets. Focusing upon French companies in the pre-IFRS period, when companies were permitted to capitalise research and development costs under certain conditions, Cazavan-Jeny et al. (2011) contend that managers may capitalise research and development costs to meet or beat earnings thresholds/targets or to avoid reporting losses. In their Italian study, also based in the pre-IFRS period, Markarian et al. (2008) conclude that capitalisation may be motivated by earnings smoothing purposes. Finally, in their study on Germany, which covers companies reporting under IFRS, Dinh et al. (2015: 3) found that ‘pressure to beat past year’s earnings and analysts’ forecast of earnings increases the probability of a firm capitalising R&D in the current period. This evidence is in line with the notion of firms opportunistically managing earnings via R&D capitalisation’. They contend that both the decision to capitalise and how much to capitalise are strongly and positively associated with benchmark beating.
2.2 R&D CAPITALISATION AND SIGNALLINGIn line with the notion that an asset, in this case development costs capitalised in a given year, is expected to yield future economic benefits, a company’s decision to capitalise development costs can be perceived as a signalling mechanism of the future economic benefits associated with the asset. In contrast, the ‘no-effects hypothesis’ (see Watts and Zimmerman 1986: 72–6) contends that the market can see through the earnings number and thus stock price changes are not associated with voluntary changes in accounting procedures unless they have any cash flow impacts. Thus, it can be argued that capitalisation of development costs could be considered as a signal only in the absence of incentives to manipulate earnings by employing this mechanism. On that basis, prior literature has indeed examined the relevance of such information to market participants and the evidence is mixed.
For example, Ahmed and Falk (2006) conclude that capitalised R&D signals good news about future earnings flow, in contrast to the very conservative view of expensing all R&D. In their Australian study of 381 firms over the period 1992–99, they find that ‘R&D capitalized expenditure is positively and significantly associated with the firm’s future earnings’ (Ahmed and Falk 2006: 231). Further, Shah et al. (2013: 159), who examine listed companies in the UK, find ‘that capitalised R&D expenditure is positively and significantly related to the market value of the sample firms in the period 2001–2011’ and infer ‘that investors perceive the capitalisation of R&D to be related to successful R&D projects’ (Shah et al. 2013: 168). Similarly, in their post-IFRS UK study, Tsoligkas and Tsalavoutas (2011) show the value relevance of capitalised development costs. Consistent with these findings for the UK, Oswald et al. (2017: 20) conclude that, ‘R&D capitalization has information value’. In sum, although these findings support the signalling approach, these studies lack analyses of the underlying company incentives for earnings management.
In contrast, in support of the ‘no-effects hypothesis’, Goodacre and McGrath (1997) in an experimental study on R&D capitalisation found no significant difference of imputed market value between expenser and capitaliser and both were greater than for a fixed-asset purchaser. Hence, they assert that analysts are not concerned about the accounting treatment but are concerned that R&D is occurring.2 In fact, they also find that ‘analysts did not seem to be misled by the higher earnings reported for the company capitalising R&D expenditure...and that company management’s pre-occupation with short term earnings might be unnecessary’ (Goodacre and McGrath 1997: 155). Consistent with this, Green et al. (1996) find that accounting treatment did not hinder the market in valuing R&D in the UK when capitalisation of development costs was a matter of choice. More recently, Dinh et al. (2015) find that capitalised development costs are value-relevant only for the sub-sample of firms not associated with earnings management incentives. Thus, they contend that the presence of earnings management counteracts the signalling value of capitalisation. Similar findings are reported by Kreß et al. (2019) who, inter alia, examine the value relevance of capitalised development costs in debt markets.
14
The capitalisation debate: R&D expenditure, disclosure content and quantity, and stakeholder views | 2. Literature review
Companies may manage their earnings, via the amounts of R&D costs expensed/capitalised, in an attempt to achieve certain earnings targets.
2 In their recent survey of the literature, Jeny and Moldovan (2018) support these findings by arguing that it is the total R&D investment effort that has a real positive impact on firms’ growth opportunities.

2.3 ACCOUNTING CONSERVATISM AND PRUDENCE: VIEWS OF PREPARERS AND AUDITORSIn an IFRS setting, it is commonly recognised that most costs are expensed owing to the requirement to meet (and assure) the six conditions set out in IAS 38 (Siegel and Borgia 2007; Stark 2008; Zéghal and Maaloul 2011). This expensing treatment is especially prevalent in some sectors, such as pharmaceuticals, where any capitalisation will historically be only after regulatory approval, which is towards the very end of the overall R&D process. This may in part reflect the prudence principle that was enshrined within the Conceptual Framework until 20103 and hence was an inherent feature of the standard when this was developed.
The prevalence of expensing may also reflect the long history of accounting conservatism across jurisdictions prior to the implementation of IAS 38 (Billiot and Glandon 2005; Entwistle 1999; Lev et al. 2005; Nixon 1997). For instance, with reference to the UK, Stark (2008: 277) states that ‘overall, the history of the development of UK standards for the recognition and disclosure of R&D expenditure suggests that there was no enormous demand for any treatment other than immediate expensing. Certainly, there was no demand for any widespread capitalisation of research expenditures’. Consistent with Stark (2008), a prudent or conservative approach in favour of expensing is noted by Ball et al. (1991), who found a general over-expensing due to prudence and fear of future uncertainty pertaining to write downs. Similarly, in his survey of senior UK accountants, Nixon (1997) found that most respondents preferred to expense all R&D costs for the ‘theoretically sound reason that the ex ante benefits are too uncertain’ (Nixon 1997: 265). Of the survey respondents, 81% confirmed a full expensing approach to R&D. This is salient because, under UK GAAP, companies had the choice over capitalisation if the conditions in the standard were met. Nixon (1997) found that preparers opposed capitalisation as they argued that it required subjective judgements and that it increased the scope for earnings manipulation.
Moreover, they raised concerns about future impairments when faced with changing technologies.4 Consistent with the findings of Goodacre and McGrath (1997) and the no-effects hypothesis, Nixon (1997: 273) concludes that the ‘lack of a perceived relationship between the accounting treatment of R&D, in particular the immediate write-off policy of most UK companies, and economic consequences is consistent with the findings that analysts are not misled by the accounting treatment of R&D expenditures’.
Entwistle (1999) carried out interviews with two groups: analysts and firm executives based in Canada, at a period when the R&D treatment there was similar to that in the UK. He found that most of the executives opposed capitalisation. Common reasons for this were to avoid having to manage future write-downs and that expensing as part of the overall R&D spend is viewed positively by the investment community, with the overall investment in R&D being of prime importance. Similarly, he found that the majority of analysts also opposed capitalisation. Reasons advanced included a preference for conservative accounting matched with an inability of firms to predict the future adequately and the possibility of large future impairments. Further, they expressed concerns over earnings manipulation and that expensing helps remind management that a cash outlay has been made.
From another perspective, Lev (2018b: 45) argues that ‘auditors are concerned with enhanced litigation risk’ arising from issues or errors in over-capitalisation. In contrast to the views of preparers, however, there are very few papers examining R&D cost capitalisation from an auditor perspective (Jeny and Moldovan, 2018). Tutticci et al. (2007), in their Australian study, found that that external monitoring by a Big Five auditor and the Australian Security Commission decreases managers’ tendency to capitalise R&D costs. Thus, there is less scope for earnings management type behaviour and more towards expensing, consistent with the general views of preparers in earlier studies. Further, they find that appointing a Big Five equivalent auditor also leads to a stronger relationship between capitalised R&D and stock returns.
The capitalisation debate: R&D expenditure, disclosure content and quantity, and stakeholder views | 2. Literature review
In an IFRS setting, it is commonly recognised that most costs are expensed owing to the requirement to meet (and assure) the six conditions set out in IAS 38.
3 Prudence was removed from the Conceptual Framework in 2010 and re-instated to the Framework in 2018 (ACCA 2014; IFRS 2018a) for annual periods beginning on or after 2020.
4 The worry about impairment is consistent with that observed by Ciftci (2010: 434), who commented that ‘the errors in capitalization due to high uncertainty associated with future benefits might lead to subsequent write-offs in capitalized SDC [software development costs] and reduce future earnings’, albeit in a US context.
15
Owing to the need to assure capitalised assets and the appropriateness of the accounting treatment against the standard and the conditions, Cheng et al. (2016) find that the level of capitalisation is associated with an increase in the audit fee for IFRS reporters. This is also confirmed in the study by Kreß et al. (2019) and is attributed to increased levels of audit risk and the extra work required to verify how conditions have been met, which may require external experts, and to satisfy the auditor over managerial judgements behind the capitalisation.
2.4 R&D-RELATED DISCLOSURESReflecting the general lack of capitalisation and asset recognition, Wyatt (2008: 218) asserts that intangibles are ‘at the center of an information gap that arises from the forward-looking and uncertain nature of economic activity’. Beyond meeting the six conditions and the then-mandatory capitalisation, IAS 38 has no further disclosure requirement and thus does not counter this ‘information gap’. Hence, the disclosures provided by companies beyond the statutory accounting financial information are voluntary. Stark (2008: 277) comments, ‘although the situation evolved to incorporate the mandatory disclosure of R&D expenditures, some concerns were expressed as to whether a single number was likely to be informative without further details of the particular projects being pursued and the likelihood of their success’. More bluntly, albeit in a US context, Lev (2018a; 481) asserts that ‘there should be a considerable enhancement of the disclosure of investments in long-term, value-creating assets. Currently, there is an inexplicable “conspiracy of silence” concerning these investments’ (see also Srivastava, 2014). This leads to a great reliance on voluntary disclosure (Lev 2018b).
Following this line of reasoning, there is within the literature a tension between those who are satisfied as to the adequacy of the present situation, which relies primarily on voluntary disclosures,
and others asking for more recognition and far greater mandatory disclosure on intangible assets. Indeed, Merkley (2014: 728) recognises R&D as an area of ‘significant information problems between managers and investors’. Nonetheless, he argues that ‘narrative [voluntary] disclosure provides a channel for managers to convey contextual information about their firms to market participants. This type of disclosure can bridge the gap between a firm’s financial statement numbers and its underlying business fundamentals’ (and see Penman 2009; Skinner 2008). Further, such disclosure should ultimately benefit firms through higher equity valuations and lower costs of capital (and see Healy and Palepu 2001). This positive view is shared by Zéghal and Maaloul (2011: 262), who comment that their ‘[literature] survey concludes that disclosure is considered as a solution to the negative consequences of non-recognition of intangibles in financial statements’. Empirical literature, such as the study by Liang and Yao (2005), reports that, for intangibles, non-financial information has incremental explanatory power far beyond financial information in explaining a company’s value.
A further major aspect of the disclosure debate is the extent of proprietary information. As capitalisation inherently links to forward-looking earnings streams, much of the relevant information is confidential and commercially sensitive to the business. Hence, Stark (2008: 277) notes ‘issues of confidentiality and associated likelihood of proprietary costs were raised with respect to disclosure’. In his study of executives, Entwistle (1999) finds mixed evidence, with slightly more than half his subjects expressing concern about proprietary information whereas the rest did not have concerns that confidential and sensitive information needed to be disclosed to give insights into intangibles. This reflects the theoretical literature (Verrecchia 1983) suggesting that, when making disclosure decisions, firms trade off the costs of revealing proprietary information with the resulting benefits, such as lower costs of capital, analyst following or more accurate equity valuations.
16
The capitalisation debate: R&D expenditure, disclosure content and quantity, and stakeholder views | 2. Literature review
Beyond meeting the six conditions and the then-mandatory capitalisation, IAS 38 has no further disclosure requirement. This arguably leads to an 'information gap'.

17
3. Research approach
3.1 PHASE 1 – SAMPLE SELECTIONThe data selection starts by focusing on the countries that converged their national standards to IFRS or adopted IFRS on a mandatory or voluntary basis.5 We obtained data from Worldscope/Datastream and include all companies in the research lists of dead and active firms constructed by Datastream for each country we identify as suitable for our sample in the first step. To avoid double counting, firms that are cross-listed in more than one market are included in our sample once, depending only on the country of primary listing. In addition, we eliminate securities that are not classified as equity.6 Further, we eliminate all companies that do not report under IFRS or local GAAP for countries that converged their national standards to IFRS.7 We then retain in our sample all R&D active companies, ie we include only companies that report either an R&D asset or an R&D expense in the period between 2006 and 2015. Subsequently, we eliminate 1,510 firm-year observations belonging to the Oil and Gas industry because the database may classify the relevant extraction costs as development costs. We also exclude 433 firm-year observations with accounting periods of more than 380
5 To assess whether a certain country has adopted (mandatorily or voluntary) or converged to IFRS, we rely on the guide published by the IFRS Foundation on the use of IFRS by jurisdiction (IFRS 2018b).
6 To assess whether a stock is classified as equity, we rely on datatype TYPE and retain those stocks which are recorded as equity (ie EQ)
7 We rely on Worldscope item ‘accounting standards followed’ (WC07536) to identify the reporting standards that companies follow.
8 We acknowledge that we eliminate a relatively large proportion of firm-year observations because of missing data. Whilst this is common in this type of research, in additional analysis we find that of the 156,741 firm-year observations we exclude, 43,180 firm-year observations have available data other than R&D. The majority of these observations are from Hong Kong (5,714), the UK (5,009), Australia (4,749), China (4,326), India (2,576) and France (2,206). Further, it is observations from these industries that are mainly excluded because of unavailable R&D related data: Financials (10,436), Industrials (9,150) and Consumer Services (7,068). Subsequently, we examined whether these firms capitalize software development costs. We find that only 14,249 firm-year observations report a software development cost on the balance sheet. Although these firms do not report an R&D expense (or asset), they capitalize software development costs and these are rather small relative to the market value or total assets of the firm (median values of 0.004 and 0.002 respectively). Overall, firm-year observations excluded represent firms with incomplete data in the database, no R&D expenditure or arguably immaterial R&D expenditure (since it is not recorded as a separate line item in the income statement).
TABLE 3.1: PHASE 1 – SAMPLE SELECTION
177,588 We focus on the countries that adopted or converged with IFRS between 2005 and 2015. Our sample begins in 2006 and ends in 2015 and excludes companies that do not report under IFRS (or local standards that have converged with IFRS)
(156,741)(138,286)
(1,510)(433)
(16,205)(307)
total firm-year observations excludedexcluding non-R&D active companiesfirms from Oil & Gas industryfinancial year-end changedmissing firm-specific datamissing country-specific data
20,847 Sample
(372) Firm-year observations with negative book value of equity
20,475 Final sample [t = 2006, 2015] [6,125 firms]
12,7467,729
2,1035,626
reporting expensed R&D only (Expensers) reporting a capitalised amount of R&D (Capitalisers)reporting capitalised R&D only (Full capitalisers)reporting both capitalised and expensed R&D (Non-full capitalisers)
countries. We classify firm-year observations as a ‘capitaliser’ if a company capitalises, in full or partly, development costs during the year, otherwise we consider the company as an ‘expenser’. In total, we have 12,746 expensers and 7,729 capitalisers, of which 2,103 capitalise all of their R&D expenditure. Table 3.1 summarises the data selection process and shows the breakdown between capitalisers and expensers.
or less than 350 days (similar to García Lara et al. (2005)). Further, we exclude 16,205 firm-year observations with insufficient firm-level data.8 Finally, we exclude 307 firm-year observations with missing country-specific data and 372 firm-year observations with negative book values.
This process results in our sample of 20,475 firm-year observations corresponding to 6,125 firms, across 37

18
The capitalisation debate: R&D expenditure, disclosure content and quantity, and stakeholder views | 3. Research approach
TABLE 3.2: Phase 1 – Sample composition by country
COUNTRY 2006 2007 2008 2009 2010 2011 2012 2013 2014 2015 TOTAL
Argentina 0 0 0 0 0 0 0 0 0 1 1
Australia 81 92 106 118 139 129 126 112 122 89 1,114
Austria 21 24 23 25 24 25 26 23 20 20 231
Belgium 18 22 25 31 28 28 23 20 21 23 239
Brazil 0 0 0 0 23 19 36 25 30 40 173
Canada 0 0 0 0 0 29 67 80 82 77 335
Chile 0 0 0 0 0 3 4 7 7 12 33
China 0 18 18 51 67 106 340 426 1,272 1,406 3,704
Denmark 29 31 31 32 35 40 34 30 28 22 312
Finland 51 66 65 60 63 64 65 46 51 51 582
France 111 127 126 116 132 126 105 92 108 120 1,163
Germany 139 165 162 167 169 165 155 148 154 158 1,582
Greece 11 10 15 19 20 18 29 12 15 10 159
Hong Kong 83 93 105 101 106 127 156 154 172 179 1,276
India 0 0 0 0 0 0 0 319 214 188 721
Indonesia 0 0 0 0 0 0 14 16 14 14 58
Ireland 6 6 11 11 10 6 9 9 9 11 88
Israel 0 0 12 12 13 18 18 18 17 12 120
Italy 44 45 61 54 59 56 50 40 41 55 505
Japan 0 0 0 0 1 1 3 8 16 39 68
Jordan 1 2 1 1 2 3 3 3 2 6 24
Korea 0 0 0 0 0 202 358 564 550 507 2,181
Malaysia 0 0 0 0 0 0 3 4 48 45 100
Mexico 0 0 0 0 0 0 1 3 6 7 17
Netherlands 22 21 22 26 25 25 23 21 21 18 224
New Zealand 0 10 10 9 9 10 8 13 16 19 104
Norway 14 18 18 23 19 26 25 19 23 20 205
Peru 0 0 0 0 0 0 4 6 5 9 24
Philippines 1 1 6 7 6 8 5 0 0 0 34
Portugal 5 5 6 7 5 6 3 1 1 1 40
Singapore 5 5 10 10 6 6 9 10 9 2 72
South Africa 24 23 23 25 22 21 27 30 26 21 242
Spain 18 18 24 19 19 23 24 20 16 18 199
Sweden 64 74 76 74 73 82 90 79 79 89 780
Switzerland 62 71 72 71 72 70 66 62 60 60 666
Turkey 4 4 4 4 4 8 55 68 69 50 270
United Kingdom 203 264 326 323 339 330 288 261 257 238 2,829
TOTAL 1,017 1,215 1,358 1,396 1,490 1,780 2,252 2,749 3,581 3,637 20,475
Tables 3.2 and 3.3 provide information on the sample composition by country and industry respectively. The latter classification is based on the 10 industries specified by the Industry Classification Benchmark. These tables indicate that our sample consists of large proportion of Chinese firms (3,704 firm-year observations), UK firms (2,829 firm-year observations) and Korean firms (2,181 firm-year observations). The weight of the remaining countries is much smaller on an individual basis, although collectively they are still represented by a relatively large number of observations.

19
The capitalisation debate: R&D expenditure, disclosure content and quantity, and stakeholder views | 3. Research approach
TABLE 3.3: Phase 1 – Sample composition by industry
INDUSTRY 2006 2007 2008 2009 2010 2011 2012 2013 2014 2015 TOTAL
Basic materials 102 122 146 157 172 204 275 384 525 514 2,601
Consumer goods 187 229 235 242 251 335 422 553 746 756 3,956
Consumer services 40 50 54 55 69 81 88 103 104 122 766
Financials 22 25 27 34 35 38 50 35 35 41 342
Health care (inc. Pharmaceuticals)
126 153 177 182 207 211 276 358 451 485 2,626
Industrials 302 346 399 419 431 537 689 824 1,149 1,145 6,241
Technology 203 252 280 263 277 318 385 433 498 488 3,397
Telecommunications 17 21 18 21 19 21 21 15 27 29 209
Utilities 18 17 22 23 29 35 46 44 46 57 337
TOTAL 1,017 1,215 1,358 1,396 1,490 1,780 2,252 2,749 3,581 3,637 20,475
Our sample also consists mainly of companies in the following industries: Industrials (6,241 firm-year observations), Consumer Goods (3,956 firm-year observations), Technology (3,397 firm-year observations), Basic Materials (2,601 firm-year observations) and Health Care (2,626 firm-year observations). The weight of the remaining industries is much smaller.

20
3.2 PHASE 1 – METHODS APPLIEDThe first aim of this Phase is to identify the factors that affect a firm’s decision to capitalise development costs, and the amounts capitalised. Multivariate analysis is used with the dependent variable being an indicator variable (CAP). This equals to 1, when a company capitalises (all or part of) R&D in a certain year and 0 otherwise. This model examines relevant factors which may affect the decision to capitalise R&D. Further, the amount of R&D capitalised scaled by market value is the dependent variable (RDCAP). This approach allows us to examine factors that affect the magnitude of capitalisation of R&D.
We follow prior literature, such as Cazavan-Jeny et al. (2011), Dinh et al. (2015) and Oswald (2008), in the choice of firm-level factors that may affect the decision or magnitude of R&D capitalisation. These include factors that capture a firm’s life cycle and risk such as its size (Size), book to market (BM), age (Age), leverage (Leverage) and beta (Beta). We also include the magnitude of R&D expenditure relative to total assets (RDInt), as this may affect the decision about capitalising R&D and factors that capture whether a firm meets capitalisation criteria such as the market value of the firm generated in relation to R&D (RDValue). We also include variables that capture a firm’s incentives to manipulate earnings to meet or beat earnings benchmarks, such as last year’s earnings (PastBeat) or zero (ZeroBeat). International sales (IntSalesPerc) are
The capitalisation debate: R&D expenditure, disclosure content and quantity, and stakeholder views | 3. Research approach
included as a proxy for a firm’s international exposure. Further, we include a number of country-level determinants, because they may also affect a firm’s decision and magnitude of R&D capitalisation: corruption (Corruption), audit and enforcement (AudEnf), investor protection (InvProtection), anti-self-dealing index (AntiselfDeal), and an indicator variable indicating whether a country is classified as civil or common law (CivCom). Country-level controls also include the country-level balance of trade (Baloftrade), skilled labour (SkilledLabour), distribution (DitriInfra), energy (EnerInfra) and health (HeatlhInfra) infrastructure, given that these may influence the overall levels of R&D activity in a given country.9 Finally, our multivariate analysis includes industry and year fixed effects while we cluster standard errors at the firm level. The relationship between R&D capitalisation and the corresponding associated determinants can be expressed as follows:
CAP or RDCAP = f(Size, BM, Age, Leverage, Beta, RDInt, RDValue, PastBeat, ZeroBeat IntSalesPerc, Corruption, AudEnf, InvProtection, AntiselfDeal, CivCom, Baloftrade, SkilledLabour, DitriInfra, EnerInfra, HeatlhInfra)
(1)
The second aim of this Phase is to investigate whether, given firm-specific characteristics, firms follow the expected accounting treatment of R&D (ie capitalisation vs expensing). This involves the following two steps.
The first aim of this Phase is to identify the factors that affect a firm’s decision to capitalise development costs, and the amounts capitalised.
9 Appendix I presents the definitions and source of all variables used in all models in this report.
21
Finally, we define the variable CAPexpected as a dummy variable that takes the value of 1 if a firm is expected (not expected) to capitalise R&D based on CAPpred and effectively does (does not) capitalise R&D based on CAP, and 0 otherwise.
With regard to the level of capitalisation, as a subsequent test, we concentrate on those firm-year observations that we would expect to be capitalisers on the basis of Step Two above and actually did (did not) do so, and identify the expected amount of development costs that one would expect them to have capitalised (expensed). To do so, we run another model for each industry-year cluster with standard errors clustered at the firm level as follows:11
RDCAP = f(Size, BM, Age, Leverage, Beta, RDInt, RDValue, PastBeat, ZeroBeat IntSalesPerc, Corruption, AudEnf, InvProtection, AntiselfDeal, CivCom, Baloftrade, SkilledLabour, DitriInfra, EnerInfra, HeatlhInfra)
(2)
where RDCAP is the amount of R&D capitalised in each year; firm controls are: book to market (BM), R&D value (RDValue), R&D intensity (RDInt), size (Size), beta (Beta), leverage (Leverage), percentage of international sales (IntSalesPerc), age (Age) and two proxies capturing incentives to manage earnings in an attempt to meet earnings benchmarks (PastBeat and ZeroBeat). We define the variable RDCAPpred as the amount of R&D that is expected to be capitalised on the basis of the fitted values of this Tobit model. Conversely, the residuals identify the unexpected R&D that firms capitalise (RDCAPunexp). It is noted that RDCAPunexp can be either positive or negative, identifying firms that overcapitalise or undercapitalise respectively.
Step OneFirst, following Oswald (2008) and Oswald and Zarowin (2007), we identify the firms that expense all their R&D costs and we would anticipate them doing so as ‘mandatory expensers’, where:10
a) the firm expenses all its R&D costs and all other firms in the same industry and in the same year do the same; we interpret the absence of R&D capitalisation in an industry-year cluster as a signal that firms belonging to that cluster should expense R&D
b) the firm’s RDValue is negative; the numerator of RDValue is defined as the difference between market value and book value of equity; thus, a negative RDValue implies that book value is higher than the market value of equity and we interpret this gap/difference as a signal that R&D is perceived by the market (and the companies’ themselves) as having no future economic benefit and thus should not be capitalised
c) the RDValue of an expenser is lower than the minimum RDValue of a capitaliser in the same industry/year; this ensures that the remaining expensers are at least as successful in R&D as the least successful capitaliser.
Step TwoSecond, we examine whether any of the remaining expensers or those that have capitalised (all or part of their R&D costs) could be classified in the alternative category. To do so, we rely on the econometric model (1) that we have used earlier to assess a firm’s decision to capitalise R&D. When running this model, one can obtain the fitted values that will suggest the probability that a firm will be a capitaliser, given its specific characteristics (ie control variables). Having done so, we define the variable CAPpred as 1 if the predicted probability of being a capitaliser is higher than 50%, and 0 otherwise.
The capitalisation debate: R&D expenditure, disclosure content and quantity, and stakeholder views | 3. Research approach
Second, we examine whether any of the remaining expensers or those that have capitalised (all or part of their R&D costs) could be classified in the alternative category.
10 Because the inclusion of these firms in the empirical implementation of Model 1 may bias the results of the estimation, we re-run our estimations excluding them. The results are qualitatively similar and, for brevity, not presented.
11 We run a cross-sectional (ie for each industry and year) Tobit model instead of a pooled model, for consistency with the earnings management literature (eg Kothari et al. 2005).
3.3 PHASE 2 – SAMPLE SELECTIONIn order to examine the quantity of narrative R&D disclosures in annual reports, we select a sub-sample of the 20,847 observations identified in Phase 1. More specifically, we follow a strategic sampling approach and rank all firms in each country-year-industry cluster by their R&D intensity12 and retain the first firm in every industry as a starting point, then the fifth, the ninth, and so on. We rank firms on the basis of R&D intensity in order to ensure that our sample includes companies with varying levels of R&D and therefore reflects not only the importance of R&D investment on the operations of a firm but also the potential correlation between the disclosure levels that are identified in this stage. Following this procedure yields 6,163 firm-year observations. Requiring the financial statements and/or narratives in the annual report to be available, in the English language, and be editable (ie not in picture format) to allow character recognition reduces the sub-sample to 3,402 financial statements and 3,171 narratives sections.13 Of these, we were able to obtain both sections for 3,039 observations in total (ie having a full annual report).
3.4 PHASE 2 – METHODS APPLIEDThe first aim of this Phase is to investigate the quantity of narrative R&D disclosures and obtain evidence from the separate sections of the annual reports in which R&D is discussed. We measure the quantity of narrative R&D disclosures by using a computerised content analysis. Specifically, we develop a list of common R&D keywords. Our starting point of keywords is the list used in Merkley (2014), which we supplement with keywords related to the capitalisation criteria. To assure the latter, we consult other prior studies (ie Chen et al. 2017; Guo et al. 2004; Jones 2007; La Rosa and Liberatore 2014; Nekhili et al. 2016;) and we read IAS 38 thoroughly.14 Appendix II presents the full list of the 116 keywords we use in this study.
Subsequently, we use MaxQDA software, and in particular the MaxDictio application of MaxQDA, to search each annual report and identify the number of times each firm makes reference to each of the words in our list. We then measure the total R&D-related disclosures as the sum of the number of times each firm makes reference to each of the words in our list. We perform this task separately for the front-end of an annual report up to and excluding the financial statements and the back-end of the annual report, which consists of the auditors’ report and the financial statements as well as the notes to the accounts. In the analysis part of this report, we refer to the former as the ‘narratives’ section of the annual report and the latter as the ‘financial statements’ section. Then, we examine determinant factors for the volume of R&D-related disclosures. Multivariate regression analysis is therefore carried out, with the dependent variable being the R&D-related disclosures. Independent variables include those used in the multivariate analysis carried out for Phase 1. The relationship between R&D-related disclosures and the determinants can be expressed as follows:
RDDISCLOSURE = f(Size, BM, Age, Leverage, Beta, RDInt, RDValue, PastBeat, ZeroBeat IntSalesPerc, Corruption, AudEnf, InvProtection, AntiselfDeal, CivCom, Baloftrade, SkilledLabour, DitriInfra, EnerInfra, HeatlhInfra)
(3)
3.5 PHASE 3 – METHOD APPLIEDPhase 3 of the research centres upon capturing the key stakeholders’ views on R&D accounting and reporting: these are the two main groups of stakeholders from a supply perspective (ie account preparers and auditors) and one from the demand or user perspective (ie equity investors). This approach captures the supply chain of information between company and shareholders (Campbell and Slack 2011) and by its engagement with senior participants across these groups it results in a unique project.
22
The capitalisation debate: R&D expenditure, disclosure content and quantity, and stakeholder views | 3. Research approach
The first aim of this Phase is to investigate the quantity of narrative R&D disclosures and obtain evidence from the separate sections of the annual reports in which R&D is discussed.
12 Following prior literature (eg Cazavan-Jeny et al. 2011; Franzen et al. 2007; Oswald 2008), R&D intensity is defined as the ratio of R&D expenditure to total assets.
13 When an annual report was not available at the company’s website, we searched for the corresponding annual report using a Google search and the database Perfect Information. Merkley (2014) develops the list of keywords for US companies reporting under the US GAAP, which disallows the capitalisation of R&D. In contrast, we use a sample of firms that report under IFRS, which permit the capitalisation of R&D and thus we supplement with relevant keywords.
14 Richard Martin and Alan Teixeira also helpfully commented on the constituents of this list.

23
et al. 2006). In order to gain access to individuals in these groups, as suggested by Buchanan et al. (1988), we followed methods employed by Armitage and Marston (2008) and Beasley et al. (2009). In the first instance, we approached potential interviewees identified through personal contacts and networks, a process that was instrumental in helping to secure access to interviewees across the three stakeholder groups. This was supplemented with a member Web survey by ACCA, part of which asked for participation by preparers in the research, and with suggestions from the roundtable discussion.
Each potential interviewee was contacted by email by a member of the research team to outline the scope of the research and to agree interview timing and logistics. An overview of the project and the issues to consider was provided in the email (see Appendix III). All the interviewees were assured anonymity of person and institution. This was re-affirmed at the commencement of the respective interview and each participant agreed to speak freely on IAS 38 and the capitalisation of development costs. Each interview addressed three key areas outlined in the project briefing note, which were consistent with those shown above. This provided consistency within, and where appropriate between, the interviews across the three respective groups.
All the interviews were conducted between April and June 2018. The interviews were conducted by one of the research team who was highly familiar with this as a technique for elucidating insight and reflective comments from interviewees. For logistical reasons, for the UK-based interviewees, where possible, interviews were arranged in the London office of the interviewee. For overseas interviews, skype was predominantly used. This enabled face-to-face contact so as to replicate as far as possible the interview conditions of those conducted in person. Two interviews were by phone owing to a lack of skype connection.
To help provide a meaningful understanding of the stakeholders’ views, the research was designed and conducted through semi-structured, in-depth interviews. This approach not only allowed the interviewees to express their opinions on a number of pre-determined topics but also allowed us to probe further those issues that needed clarification and for the interviewees to elaborate on aspects of IAS 38 which they said were important (Slack and Tsalavoutas 2018; Stubbs and Higgins 2015; Stubbs et al. 2016;). Indeed, reflecting on the use of interviews, Stoner and Holland (2004) affirm that such qualitative research methods allow rich insight into research fields.
An initial series of interview questions were informed by the preliminary findings from Phases 1 and 2 and the relevant literature. Additionally, the preliminary findings were presented at a roundtable discussion event hosted by ACCA in April 2018. The event included auditors, preparers and investors. On the basis of these discussions, the interview questions were further developed and finalised.15 These covered three key areas.
i. Why R&D is important; the relevance of R&D accounting treatment to R&D spend; and whether capitalisation sends a signal to stakeholders.
ii. The accounting treatment of R&D; prudence versus faithful representation and the recognition of R&D assets; preparer and auditor views on expensing and the assurance of capitalisation; comparison to US GAAP.
iii. Disclosure; views on minimal mandatory disclosure requirements; R&D voluntary disclosure usefulness; trade-off between disclosure and proprietary information.
Our study required in-depth discussions with senior participants across two primary groups and one supplementary group, all of which are traditionally difficult–to-reach individuals (Campbell and Slack 2011; Pettigrew 1992; Roberts
The capitalisation debate: R&D expenditure, disclosure content and quantity, and stakeholder views | 3. Research approach
To help provide a meaningful understanding of the stakeholders’ views, the research was designed and conducted through semi-structured, in-depth interviews.
15 Comments from this event are also reflected in the presentation of the findings in section 4.

24
All the interviews were carried out in jurisdictions with IAS 38 reporting, primarily within the EU, with the majority (owing to ease of access) in the UK.
In total, 14 interviews were conducted with 16 participants. Two of the interviews were attended by two participants. The interviewees comprised six auditors, six equity investors/analysts and four preparers. On average, the interview length was nearly 40 minutes, with a maximum length of 55 minutes and a minimum of 26 minutes. Of those interviewees who were equity investors, all were either lead portfolio/fund managers or holders of a senior position in equity analysis. For auditors, the interviewees were predominantly audit and technical partners in international accounting and audit firms with direct involvement with IAS application and audit. Finally, for preparers, all held senior positions ranging from finance director to chief accountant and all had direct financial reporting responsibilities. All the interviews were carried out in jurisdictions with IAS 38 reporting, primarily within the EU, with the majority (owing to ease of access) in the UK. Details of the respective participant cohorts are shown in Table 3.4.
With the permission of each interviewee, all the interviews were recorded and subsequently transcribed for analysis. All the transcribed interviews were then coded by the interviewee to enable key verbatim quotations to be identified,
highlighting common, or divergent, views. All the interviewees were coded Ix (for investors) and Px (for preparers) and Ax (for auditors), in chronological order.
The transcripts were read by the lead interview researcher to gain familiarity with the general findings across all the interviews and, where necessary, to re-listen to key parts of the interview for emphasis. This was discussed in detail across the research team, who met prior to the subsequent analysis of the transcripts. A general coding template was produced highlighting the key recurring themes from the interviews. A detailed manual thematic analysis of the interview data was then undertaken identifying relevant quotes pertaining to the coding themes and isolating any other emerging themes from the detailed review of the data (Boyatzis 1998; Miles and Huberman 1994). The analysis of the transcripts is founded on the identification of ‘interpretative repertoires’ (Potter and Wetherell 1987) and in the findings we provide verbatim illustrative quotes identified through this process. This analysis is consistent with the staged approach suggested by Easterby-Smith et al. (1991) and used in other interview-based research (Armitage and Marston 2008; Campbell and Slack 2011; Slack and Tsalavoutas 2018; Solomon et al. 2011).
The capitalisation debate: R&D expenditure, disclosure content and quantity, and stakeholder views | 3. Research approach
TABLE 3.4: Summary of interviewees
INTERVIEWEE GROUP/CODING POSITION HELD LOCATION
AuditorA1 Technical partner UK
A2 Associate partner UK
A3 Partner UK
A4 Financial accounting Advisory UK
A5 Partner Italy
A6 Partner Germany
Equity Investment*I1 Vice president UK
I2 Managing director, Global research UK
I3 Director, Global research UK
I4 Portfolio director UK
I5 Equity research analyst UK
I6 Portfolio investor UK
PreparersP1 Finance director Hong Kong
P2 Finance director Sweden
P3 Finance director UK
P4 Senior accountant Italy
*UK based but all covering global equity investment.
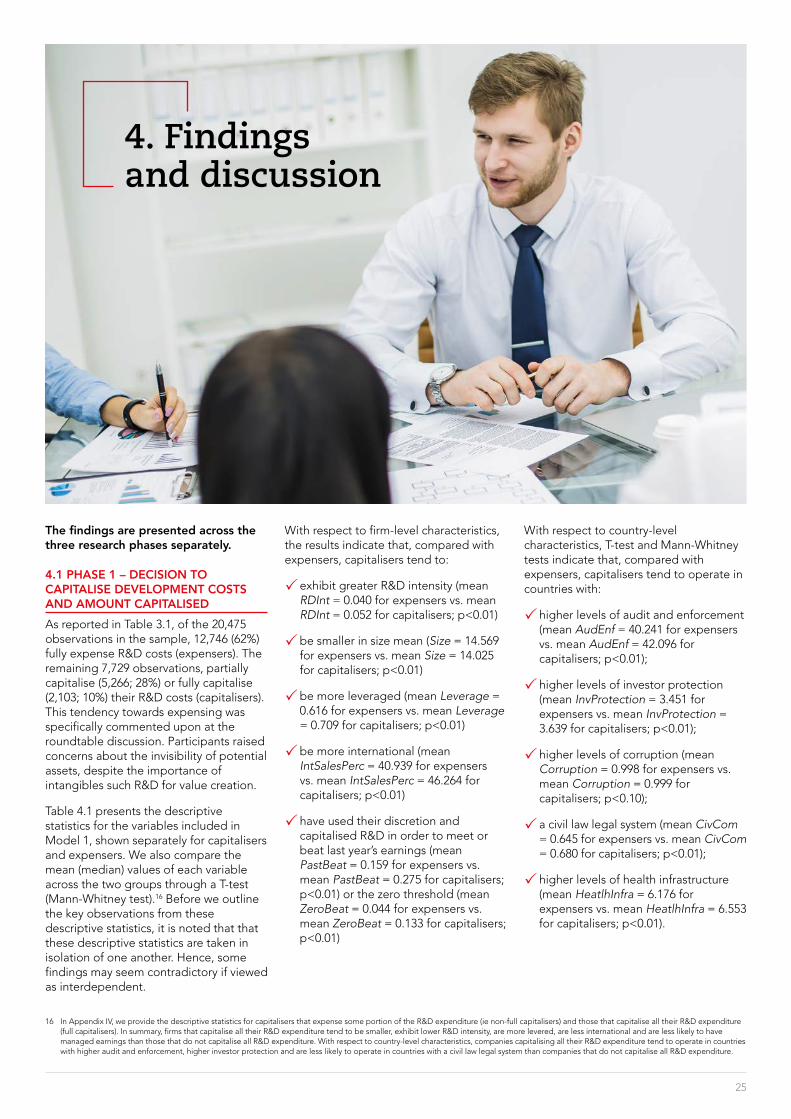
The findings are presented across the three research phases separately.
4.1 PHASE 1 – DECISION TO CAPITALISE DEVELOPMENT COSTS AND AMOUNT CAPITALISEDAs reported in Table 3.1, of the 20,475 observations in the sample, 12,746 (62%) fully expense R&D costs (expensers). The remaining 7,729 observations, partially capitalise (5,266; 28%) or fully capitalise (2,103; 10%) their R&D costs (capitalisers). This tendency towards expensing was specifically commented upon at the roundtable discussion. Participants raised concerns about the invisibility of potential assets, despite the importance of intangibles such R&D for value creation.
Table 4.1 presents the descriptive statistics for the variables included in Model 1, shown separately for capitalisers and expensers. We also compare the mean (median) values of each variable across the two groups through a T-test (Mann-Whitney test).16 Before we outline the key observations from these descriptive statistics, it is noted that that these descriptive statistics are taken in isolation of one another. Hence, some findings may seem contradictory if viewed as interdependent.
4. Findings and discussion
25
With respect to firm-level characteristics, the results indicate that, compared with expensers, capitalisers tend to:
P exhibit greater R&D intensity (mean RDInt = 0.040 for expensers vs. mean RDInt = 0.052 for capitalisers; p<0.01)
P be smaller in size mean (Size = 14.569 for expensers vs. mean Size = 14.025 for capitalisers; p<0.01)
P be more leveraged (mean Leverage = 0.616 for expensers vs. mean Leverage = 0.709 for capitalisers; p<0.01)
P be more international (mean IntSalesPerc = 40.939 for expensers vs. mean IntSalesPerc = 46.264 for capitalisers; p<0.01)
P have used their discretion and capitalised R&D in order to meet or beat last year’s earnings (mean PastBeat = 0.159 for expensers vs. mean PastBeat = 0.275 for capitalisers; p<0.01) or the zero threshold (mean ZeroBeat = 0.044 for expensers vs. mean ZeroBeat = 0.133 for capitalisers; p<0.01)
With respect to country-level characteristics, T-test and Mann-Whitney tests indicate that, compared with expensers, capitalisers tend to operate in countries with:
P higher levels of audit and enforcement (mean AudEnf = 40.241 for expensers vs. mean AudEnf = 42.096 for capitalisers; p<0.01);
P higher levels of investor protection (mean InvProtection = 3.451 for expensers vs. mean InvProtection = 3.639 for capitalisers; p<0.01);
P higher levels of corruption (mean Corruption = 0.998 for expensers vs. mean Corruption = 0.999 for capitalisers; p<0.10);
P a civil law legal system (mean CivCom = 0.645 for expensers vs. mean CivCom = 0.680 for capitalisers; p<0.01);
P higher levels of health infrastructure (mean HeatlhInfra = 6.176 for expensers vs. mean HeatlhInfra = 6.553 for capitalisers; p<0.01).
16 In Appendix IV, we provide the descriptive statistics for capitalisers that expense some portion of the R&D expenditure (ie non-full capitalisers) and those that capitalise all their R&D expenditure (full capitalisers). In summary, firms that capitalise all their R&D expenditure tend to be smaller, exhibit lower R&D intensity, are more levered, are less international and are less likely to have managed earnings than those that do not capitalise all R&D expenditure. With respect to country-level characteristics, companies capitalising all their R&D expenditure tend to operate in countries with higher audit and enforcement, higher investor protection and are less likely to operate in countries with a civil law legal system than companies that do not capitalise all R&D expenditure.

26
The capitalisation debate: R&D expenditure, disclosure content and quantity, and stakeholder views | 4. Findings and discussion
TABLE 4.1: Descriptive statistics of capitalisers and expensers
EXPENSERS (12,746) CAPITALISERS (7,729) COMPARISON
Mean St. Dev. Min Median Max Mean St. Dev. Min Median Max T-testMann-
Whitney test
RDExp 0.035 0.062 0.000 0.012 0.393 0.037 0.068 0.000 0.010 0.393 0.002** –0.002***
RDCap 0.000 0.000 0.000 0.000 0.000 0.023 0.040 0.000 0.007 0.188 0.023*** 0.007***
BM 0.747 0.744 0.049 0.500 4.302 0.767 0.732 0.049 0.543 4.302 0.020** 0.043***
RDValue 112.251 446.763 –706.516 12.088 3170.823 65.189 349.485 –706.516 6.554 3170.823 –47.062*** –5.534***
RDInt 0.040 0.079 0.000 0.013 0.471 0.052 0.077 0.000 0.024 0.471 0.012*** 0.011***
RDInt(sales) 0.219 1.044 0.000 0.017 8.289 0.150 0.753 0.000 0.030 8.289 –0.069*** 0.013***
Size 14.569 2.933 6.494 14.756 25.289 14.025 3.261 5.628 13.742 26.159 –0.544*** –1.014***
Beta 0.905 0.918 –1.710 0.892 3.770 0.895 0.917 –1.710 0.869 3.770 –0.010 –0.023
Leverage 0.616 0.936 0.000 0.324 6.207 0.709 1.021 0.000 0.397 6.207 0.093*** 0.073***
IntSalesPerc 40.939 36.201 0.000 35.745 100.000 46.264 34.871 0.000 46.460 100.000 5.325*** 10.715***
PastBeat 0.159 0.366 0.000 0.000 1.000 0.275 0.447 0.000 0.000 1.000 0.116*** 0.000***
ZeroBeat 0.044 0.204 0.000 0.000 1.000 0.133 0.339 0.000 0.000 1.000 0.089*** 0.000***
BenchBeat 0.186 0.389 0.000 0.000 1.000 0.340 0.474 0.000 0.000 1.000 0.154*** 0.000***
Age 15.043 10.652 1.000 13.000 51.000 15.014 10.516 1.000 13.000 52.000 –0.029 0.000
AudEnf 40.241 10.503 9.000 37.000 54.000 42.096 9.908 9.000 44.000 54.000 1.855*** 7***
InvProtection 3.451 1.482 1.000 3.500 5.000 3.639 1.298 1.000 3.500 5.000 0.188*** 0.000***
AntiselfDeal 0.624 0.243 0.165 0.653 1.000 0.591 0.255 0.172 0.469 1.000 –0.033*** –0.184***
CivCom 0.645 0.479 0.000 1.000 1.000 0.680 0.467 0.000 1.000 1.000 0.035*** 0.000***
Corruption 0.998 0.042 0.000 1.000 1.000 0.999 0.030 0.000 1.000 1.000 –0.001* 0.000
Baloftrade –0.805 7.918 –46.497 1.865 25.400 –0.421 6.413 –31.277 0.730 25.400 0.384*** –1.135***
DitriInfra 7.727 1.165 2.840 7.714 9.565 7.777 1.130 2.840 7.820 9.565 0.050*** 0.106***
EnerInfra 6.810 1.479 0.679 6.895 9.434 6.882 1.292 0.679 6.835 9.434 0.072*** –0.060
HeatlhInfra 6.176 1.802 1.510 6.750 9.529 6.553 1.593 1.510 6.946 9.529 0.377*** 0.196***
SkilledLabour 5.737 0.881 1.877 5.750 8.275 5.766 0.825 1.877 5.780 8.275 0.029*** 0.030***
Definitions and source of all the variables are reported in Appendix I.

Figure 4.1 plots the percentage of firm-year observations of those expensing and capitalising R&D, by country, for those countries in our sample represented by 100 or more observations (see Table 3.2). We note a more or less equal split of firms between the two categories of capitalisers and expensers in Brazil, Denmark, France, Malaysia and the UK. In countries such as Belgium, Italy, Netherlands, Spain, and Sweden, the majority of the firms tend to capitalise (some or all) R&D rather than expense it, while firms from the remaining countries in our sample exhibit a tendency towards expensing their R&D expenditure.
Figure 4.2 plots the percentage of firm-year observations expensing and capitalising R&D, by industry. The constituents of the Consumer Services, Financial, and Technology industries exhibit a more or less equal split between firms capitalising and expensing R&D expenditure. The constituents in the remaining industries, namely Basic Materials, Consumer Goods, Health Care, Industrials, Telecommunications and Utilities, appear to have a tendency towards expensing R&D rather than capitalising.
27
The capitalisation debate: R&D expenditure, disclosure content and quantity, and stakeholder views | 4. Findings and discussion
We note a more or less equal split of firms between the two categories of capitalisers and expensers in Brazil, Denmark, France, Malaysia and the UK.
FIGURE 4.1: Percentage of expensers and capitalisers by country
0 10% 20% 30% 40% 50% 60%
Australia Austria
Belgium Brazil
Canada
DenmarkFinlandFrance
Germany
70% 80% 90% 100%
GreeceHong Kong
IndiaIsrael
Korea (Rep. of)Malaysia
NetherlandsNew Zealand
NorwaySouth Africa
SpainSweden
Italy
SwitzerlandTurkey
United Kingdom
China
Capitalisers Expensers
FIGURE 4.2: Percentage of expensers and capitalisers by industry
Basic materialsConsumer goods
Consumer servicesFinancials
Health care
TechnologyTelecommunications
Utilities
Industrials
0 10% 20% 30% 40% 50% 60% 70% 80% 90% 100%
Capitalisers Expensers

28
We find a positive and significant coefficient for leverage (Leverage) in all models, consistent with the univariate results presented earlier. Given that leverage is a proxy for the restrictiveness of debt covenants as motivators of capitalisation (eg Aboody and Lev 1998), the positive coefficient suggests that managers have incentives to capitalise R&D in order to meet debt covenants. Further, in line with the univariate results presented earlier, IntSalesPerc has positive and significant coefficients in all models, suggesting that firms that are more international exhibit a greater incidence of capitalisation and capitalise greater amounts of R&D. Finally, we also find that firms with greater R&D intensity exhibit a lower incidence of capitalisation but capitalise greater amounts.
With regard to country-level influential factors, the decision and magnitude of capitalisation of R&D is positively associated with the country-level of audit and enforcement (AudEnf), investor protection (InvProtection), corruption (Corruption), health infrastructure (HeatlhInfra) and civil law legal system (CivCom) consistent with the univariate results presented earlier. Further, we find that the decision and magnitude of capitalisation of R&D is positively associated with the anti-self-dealing index (AntiselfDeal). In contrast, distribution and energy infrastructure (DitriInfr and EnerInfra respectively) affect the decision negatively and reduce the amount of R&D capitalised.
As final point, we note that we have repeated this analysis by excluding the countries that are represented by fewer than 100 observations in the sample, and results remain almost identical.
As the univariate analysis provided earlier does not necessarily identify influential factors associated with the decision to capitalise R&D, Table 4.2 provides four models of multivariate analysis presenting the empirical implementation of Equation 1. The dependent variables are the decision to capitalise (Models 1 and 2) and the amount of development costs capitalised (Models 3 and 4). The models are presented twice, using alternative measures to proxy for incentives to manipulate earnings by capitalising R&D. Specifically, Models 2 and 4 employ PastBeat and ZeroBeat while Models 1 and 3 use BenchBeat, which combines PastBeat and ZeroBeat.
According to Table 4.2, size (Size) has a negative coefficient, statistically significant across all models. This result is consistent with the univariate results presented earlier and suggests that larger firms exhibit a lower incidence of capitalisation and capitalise proportionately less than smaller firms. This finding confirms the findings in the previous literature (eg Cazavan-Jenny et al. 2011; Oswald, 2008) and is indicative that larger firms tend to perform more basic research or maintenance and upgrades to their products. Further, for smaller firms, it is likely that a capitalisation decision would have a more material bearing on the overall financial statements and hence would have a more pronounced effect.
In line with the univariate results presented earlier, the coefficients of BenchBeat, PastBeat, ZeroBeat, which proxy for earnings-management incentives, are positive and significant in all four models. These results are consistent with the use of discretion inherent in the capitalisation criteria for recognising R&D on the balance sheet and thus, increasing reported earnings and subsequently beating or meeting current-period earnings targets.
The capitalisation debate: R&D expenditure, disclosure content and quantity, and stakeholder views | 4. Findings and discussion
For smaller firms, it is likely that a capitalisation decision would have a more material bearing on the overall financial statements and hence would have a more pronounced effect.

29
The capitalisation debate: R&D expenditure, disclosure content and quantity, and stakeholder views | 4. Findings and discussion
TABLE 4.2: Multivariate analysis (decision and magnitude of development costs capitalisation)
DECISION TO CAPITALISE R&D MAGNITUDE OF CAPITALISATION
Model 1 Model 2 Model 3 Model 4
BM –0.021(–0.81)
–0.036(–1.43)
0.011***(8.08)
0.010***(7.76)
RDValue –0.000*(–1.88)
–0.000**(–2.16)
0.000(1.30)
0.000(0.71)
RDInt –0.857***(–3.31)
–1.203***(–4.55)
0.097***(7.15)
0.075***(5.70)
Size –0.026***(–2.84)
–0.024***(–2.60)
–0.002***(–4.96)
–0.002***(–4.56)
Beta 0.015(1.26)
0.015(1.31)
0.000(0.81)
0.000(0.83)
Leverage 0.090***(5.35)
0.085***(5.06)
0.006***(8.51)
0.005***(8.03)
IntSalesPerc 0.002***(3.16)
0.002***(3.16)
0.000***(3.42)
0.000***(3.40)
BenchBeat 0.442***(16.78)
0.022***(17.59)
PastBeat 0.335***(12.34)
0.014***(12.63)
ZeroBeat 0.601***(12.72)
0.036***(15.69)
Age 0.007(0.32)
0.004(0.18)
0.000(0.20)
–0.000(–0.11)
AudEnf 0.021***(5.86)
0.022***(5.95)
0.001***(4.75)
0.001***(4.96)
InvProtection 0.155***(5.59)
0.153***(5.53)
0.005***(4.71)
0.005***(4.54)
AntiselfDeal 0.616***(3.43)
0.597***(3.32)
0.025***(3.89)
0.023***(3.62)
CivCom 0.985***(8.76)
0.970***(8.62)
0.031***(6.99)
0.028***(6.66)
Corruption 0.743**(2.07)
0.741**(2.08)
0.010(0.52)
0.010(0.53)
Baloftrade 0.004(1.35)
0.005(1.43)
0.000**(2.02)
0.000**(2.16)
DitriInfra –0.203***(–5.71)
–0.201***(–5.63)
–0.006***(–4.93)
–0.006***(–4.81)
EnerInfra –0.081***(–2.91)
–0.083***(–2.98)
–0.003***(–2.89)
–0.003***(–3.05)
HeatlhInfra 0.116***(4.04)
0.116***(4.04)
0.004***(3.77)
0.004***(3.78)
SkilledLabour –0.023(–0.82)
–0.025(–0.87)
–0.002(–1.52)
–0.002(–1.63)
Constant –2.489***(–5.01)
–2.477***(–5.01)
0.043***(42.32)
0.042***(42.89)
Observationschi2/Fr2_p
20,475869.7100.091
20,475921.160
0.096
20,47521.900–0.382
20,47524.036–0.429
t statistics in parentheses. Industry and year fixed effects included but not shown. Standard errors are clustered at the firm level. Definitions and source of all the variables are reported in Appendix I.
* p < 0.10, ** p < 0.05, *** p < 0.01.
30
Similarly, we split the sample between firms with low and high international exposure. Overall, we do not observe any major differences in the influential factors between firms with different levels of international exposure. The exception is that R&D intensity appears to negatively affect a firm’s decision to capitalise R&D only for the sub-sample of firms with low international exposure (this suggests that the corresponding finding for the overall sample is driven by this sub-sample).
Expected and unexpected accounting treatment of R&D Following the procedure described in section 3.2, from the 12,746 expensers in our sample, we identify 2,963 firm-year observations as ‘mandatory expensers’. Thus, the remaining 17,512 firm-year observations in our sample could potentially capitalise some development costs. Further, we identify 4,053 (7,737) firm-year observations that are expected to capitalise (expense) R&D and actually capitalise (expense). Finally, we identify 1,945 (3,513) firm-year observations that are expected to capitalise (expense) R&D and expense (capitalise) R&D instead. Effectively, the tendency is for firms that follow an unexpected treatment of R&D costs to capitalise development costs instead of expensing (arguably, from this, such companies are over-capitalising). We summarise this information in Table 4.3.
Further, we examine the cross-sectional variation of the determinants of the decision and amount of R&D capitalised and focus on sub-samples based on firm-level earnings, management incentives and internationalisation. This allows us to examine whether the influential factors explaining the decision or magnitude of R&D capitalisation differ when firms have incentives to manage earnings and are more international (and vice versa).
In untabulated tests, we split the sample into those firms with greater incentives to manage earnings and those with lesser incentives to engage in earnings management to meet or beat earnings targets, and on this basis we re-estimate model (1). This allows us to examine whether the influential factors identified above have a differential impact in firms that have higher incentives to manage earnings compared with those that have lower incentives to do this. Overall, we find no such differential effect. The only exception is size, which remains negative and significant for firms with less incentive to manipulate earnings but insignificant for those firms with incentives to manage earnings.
The capitalisation debate: R&D expenditure, disclosure content and quantity, and stakeholder views | 4. Findings and discussion
Effectively, the tendency is for firms that follow an unexpected treatment of R&D costs to capitalise development costs instead of expensing (arguably, from this, such companies are over-capitalising).
TABLE 4.3: Companies following the ‘expected’ accounting treatment
EXPENSERS CAPITALISERS
Mandatory expensers Potential capitalisers
Full sample (20,475) 2,963 9,783 7,729
Expected method (11,953)
– 7,737 4,053
Unexpected method (5,559)
– 1,945(ie they were expected to
capitalise)
3,513(ie they were expected to
expense)
Unable to estimate 101 163
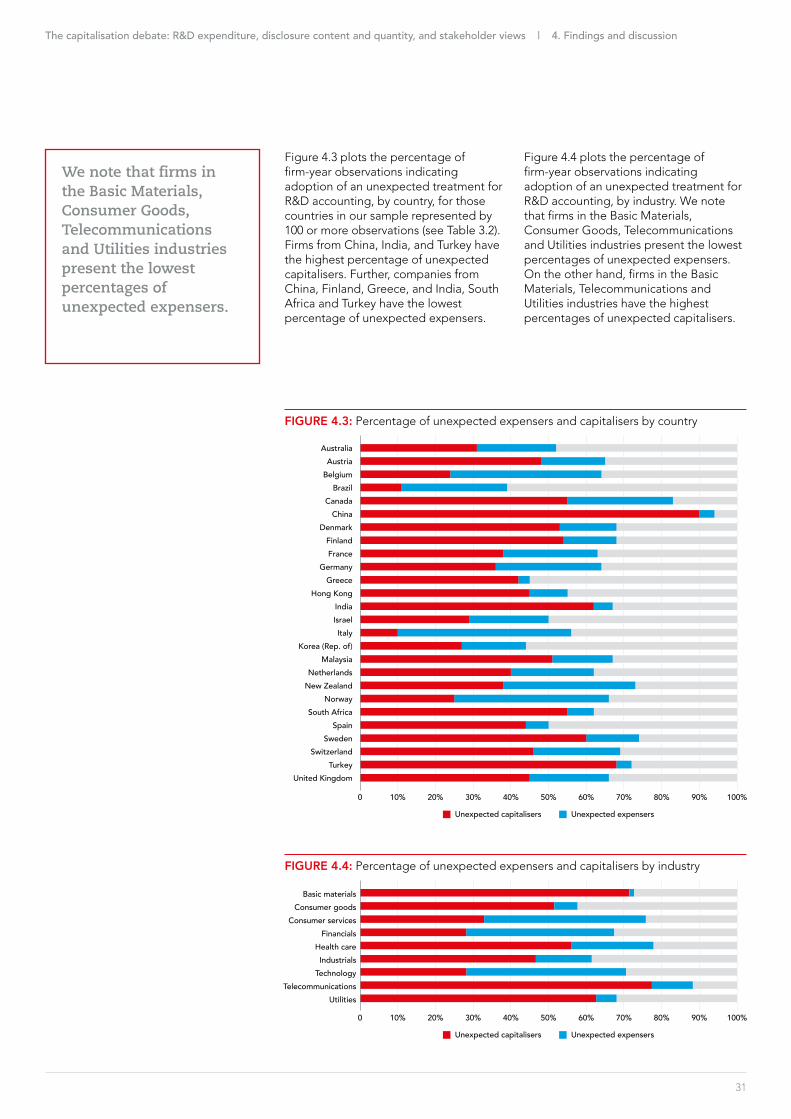
Figure 4.3 plots the percentage of firm-year observations indicating adoption of an unexpected treatment for R&D accounting, by country, for those countries in our sample represented by 100 or more observations (see Table 3.2). Firms from China, India, and Turkey have the highest percentage of unexpected capitalisers. Further, companies from China, Finland, Greece, and India, South Africa and Turkey have the lowest percentage of unexpected expensers.
Figure 4.4 plots the percentage of firm-year observations indicating adoption of an unexpected treatment for R&D accounting, by industry. We note that firms in the Basic Materials, Consumer Goods, Telecommunications and Utilities industries present the lowest percentages of unexpected expensers. On the other hand, firms in the Basic Materials, Telecommunications and Utilities industries have the highest percentages of unexpected capitalisers.
31
The capitalisation debate: R&D expenditure, disclosure content and quantity, and stakeholder views | 4. Findings and discussion
We note that firms in the Basic Materials, Consumer Goods, Telecommunications and Utilities industries present the lowest percentages of unexpected expensers.
FIGURE 4.3: Percentage of unexpected expensers and capitalisers by country
0 10% 20% 30% 40% 50% 60%
Australia Austria
Belgium Brazil
Canada
DenmarkFinlandFrance
Germany
70% 80% 90% 100%
GreeceHong Kong
IndiaIsrael
Korea (Rep. of)Malaysia
NetherlandsNew Zealand
NorwaySouth Africa
SpainSweden
Italy
SwitzerlandTurkey
United Kingdom
China
Unexpected capitalisers Unexpected expensers
FIGURE 4.4: Percentage of unexpected expensers and capitalisers by industry
Basic materialsConsumer goods
Consumer servicesFinancials
Health care
TechnologyTelecommunications
Utilities
Industrials
0 10% 20% 30% 40% 50% 60% 70% 80% 90% 100%
Unexpected capitalisers Unexpected expensers

32
p<0.01), exhibit greater R&D intensity (mean RDInt = 0.057 vs. mean RDInt = 0.047; p<0.01), are more leveraged (mean Leverage = 0.776 vs. mean Leverage = 0.604; p<0.01), older (mean Age = 2.462 vs. mean Age = 2.364; p<0.01), have more international exposure (mean IntSalesPerc = 43.339 vs. mean IntSalesPerc = 49.038; p<0.01) and are smaller in size (mean Size = 13.413 vs. mean Size = 14.706; p<0.01).
Panel C of Table 4.4 presents the descriptive statistics of key variables for the expensers that are expected to capitalise and Panel D for expensers that are expected to expense. We observe that expensers that are expected to capitalise, relative to those that are expected to expense, tend to have greater growth opportunities (mean BM = 0.649 vs. mean BM = 0.372; p<0.01), greater R&D intensity (mean RDInt = 0.064 vs. mean RDInt = 0.043; p<0.01), are smaller in size (mean Size = 13.675 vs. mean Size = 14.983 p<0.01), are more internationally exposed (mean IntSalesPerc = 50.871 vs. mean IntSalesPerc = 38.802; p<0.01) and are older (mean Age = 2.403 vs. mean Age = 2.337; p<0.01 – note these are the logarithmic transformations of age).
In Table 4.4, we report descriptive statistics for key firm-level variables employed in Equation 1 for firms that capitalise/expense and are expected/not expected to do so. Specifically, Panel A of Table 4.4 presents the descriptive statistics of the relevant variables for the capitalisers that are expected to capitalise. On average, these firms appear to capitalise 0.034 of the R&D expenditure relative to their market values while, given their characteristics, one would expect them to capitalise on average 0.043 of their expenditure relative to their market values. Thus, it appears that these firms tend to capitalise lower amounts than expected.
In contrast, as shown in Panel B of Table 4.4, capitalisers that are expected to expense tend to capitalise smaller amounts on average (0.010). T-test and Mann-Whitney tests indicate that the amount of R&D capitalised by firms that are expected to expense are statistically and significantly smaller than those capitalised by firms that are expected to capitalise. Further, capitalisers that are expected to capitalise, relative to capitalisers that are expected to expense, tend to have higher growth opportunities (mean BM = 1.091 vs. mean BM = 0.365;
The capitalisation debate: R&D expenditure, disclosure content and quantity, and stakeholder views | 4. Findings and discussion
In Table 4.4, we report descriptive statistics for key firm-level variables employed in Equation 1 for firms that capitalise/expense and are expected/not expected to do so.
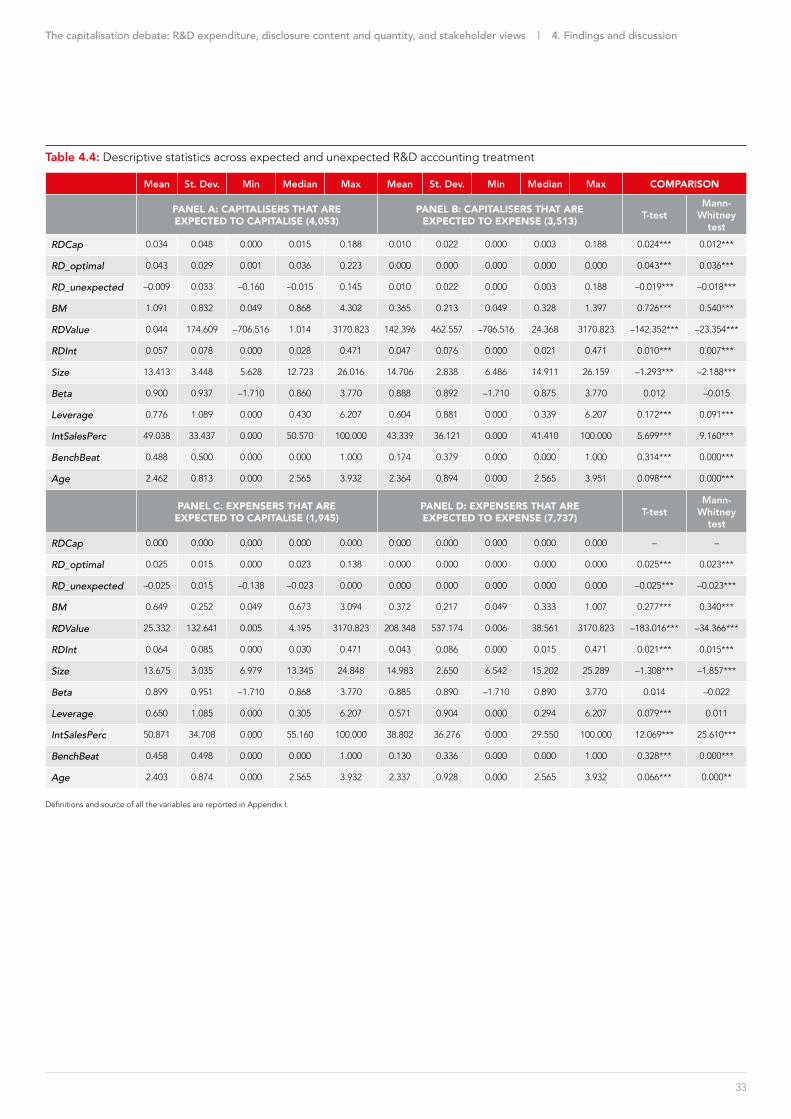
33
The capitalisation debate: R&D expenditure, disclosure content and quantity, and stakeholder views | 4. Findings and discussion
Table 4.4: Descriptive statistics across expected and unexpected R&D accounting treatment
Mean St. Dev. Min Median Max Mean St. Dev. Min Median Max COMPARISON
PANEL A: CAPITALISERS THAT ARE EXPECTED TO CAPITALISE (4,053)
PANEL B: CAPITALISERS THAT ARE EXPECTED TO EXPENSE (3,513) T-test
Mann-Whitney
testRDCap 0.034 0.048 0.000 0.015 0.188 0.010 0.022 0.000 0.003 0.188 0.024*** 0.012***
RD_optimal 0.043 0.029 0.001 0.036 0.223 0.000 0.000 0.000 0.000 0.000 0.043*** 0.036***
RD_unexpected –0.009 0.033 –0.160 –0.015 0.145 0.010 0.022 0.000 0.003 0.188 –0.019*** –0.018***
BM 1.091 0.832 0.049 0.868 4.302 0.365 0.213 0.049 0.328 1.397 0.726*** 0.540***
RDValue 0.044 174.609 –706.516 1.014 3170.823 142.396 462.557 –706.516 24.368 3170.823 –142.352*** –23.354***
RDInt 0.057 0.078 0.000 0.028 0.471 0.047 0.076 0.000 0.021 0.471 0.010*** 0.007***
Size 13.413 3.448 5.628 12.723 26.016 14.706 2.838 6.486 14.911 26.159 –1.293*** –2.188***
Beta 0.900 0.937 –1.710 0.860 3.770 0.888 0.892 –1.710 0.875 3.770 0.012 –0.015
Leverage 0.776 1.089 0.000 0.430 6.207 0.604 0.881 0.000 0.339 6.207 0.172*** 0.091***
IntSalesPerc 49.038 33.437 0.000 50.570 100.000 43.339 36.121 0.000 41.410 100.000 5.699*** 9.160***
BenchBeat 0.488 0.500 0.000 0.000 1.000 0.174 0.379 0.000 0.000 1.000 0.314*** 0.000***
Age 2.462 0.813 0.000 2.565 3.932 2.364 0.894 0.000 2.565 3.951 0.098*** 0.000***
PANEL C: EXPENSERS THAT ARE EXPECTED TO CAPITALISE (1,945)
PANEL D: EXPENSERS THAT ARE EXPECTED TO EXPENSE (7,737) T-test
Mann-Whitney
test
RDCap 0.000 0.000 0.000 0.000 0.000 0.000 0.000 0.000 0.000 0.000 – –
RD_optimal 0.025 0.015 0.000 0.023 0.138 0.000 0.000 0.000 0.000 0.000 0.025*** 0.023***
RD_unexpected –0.025 0.015 –0.138 –0.023 0.000 0.000 0.000 0.000 0.000 0.000 –0.025*** –0.023***
BM 0.649 0.252 0.049 0.673 3.094 0.372 0.217 0.049 0.333 1.007 0.277*** 0.340***
RDValue 25.332 132.641 0.005 4.195 3170.823 208.348 537.174 0.006 38.561 3170.823 –183.016*** –34.366***
RDInt 0.064 0.085 0.000 0.030 0.471 0.043 0.086 0.000 0.015 0.471 0.021*** 0.015***
Size 13.675 3.035 6.979 13.345 24.848 14.983 2.650 6.542 15.202 25.289 –1.308*** –1.857***
Beta 0.899 0.951 –1.710 0.868 3.770 0.885 0.890 –1.710 0.890 3.770 0.014 –0.022
Leverage 0.650 1.085 0.000 0.305 6.207 0.571 0.904 0.000 0.294 6.207 0.079*** 0.011
IntSalesPerc 50.871 34.708 0.000 55.160 100.000 38.802 36.276 0.000 29.550 100.000 12.069*** 25.610***
BenchBeat 0.458 0.498 0.000 0.000 1.000 0.130 0.336 0.000 0.000 1.000 0.328*** 0.000***
Age 2.403 0.874 0.000 2.565 3.932 2.337 0.928 0.000 2.565 3.932 0.066*** 0.000**
Definitions and source of all the variables are reported in Appendix I.

34
The capitalisation debate: R&D expenditure, disclosure content and quantity, and stakeholder views | 4. Findings and discussion
Table 4.5: Descriptive statistics comparing over-capitalisers and under-capitalisers
Mean St. Dev. Min Median Max Mean St. Dev. Min Median Max COMPARISON
PANEL A: COMPANIES THAT OVER-CAPITALISE (4,473)
PANEL B: COMPANIES THAT UNDER-CAPITALISE (5,028) T-test
Mann-Whitney
test
RDCap 0.028 0.048 0.000 0.005 0.188 0.009 0.018 0.000 0.002 0.188 0.019*** 0.003***
RD_expected 0.012 0.029 0.000 0.000 0.188 0.033 0.022 0.000 0.029 0.223 –0.021*** –0.029***
RD_unexpected 0.016 0.028 0.000 0.004 0.188 –0.024 0.016 –0.160 –0.022 0.000 0.040*** 0.026***
BM 0.544 0.574 0.049 0.385 4.302 0.897 0.674 0.049 0.750 4.302 –0.353*** –0.365***
RDValue 111.809 414.207 –706.516 14.634 3170.823 9.856 177.277 –706.516 2.666 3170.823 101.953*** 11.968***
RDInt 0.059 0.086 0.000 0.027 0.471 0.050 0.072 0.000 0.023 0.471 0.009*** 0.004***
Size 14.212 3.102 6.073 14.387 26.159 13.709 3.277 5.628 13.132 26.016 0.503*** 1.255***
Beta 0.889 0.921 –1.710 0.870 3.770 0.900 0.924 –1.710 0.865 3.770 –0.011 0.005
Leverage 0.638 0.926 0.000 0.350 6.207 0.728 1.092 0.000 0.381 6.207 –0.09*** –0.031**
IntSalesPerc 45.089 35.539 0.000 44.800 100.000 49.270 34.091 0.000 51.030 100.000 –4.181*** –6.23***
BenchBeat 0.275 0.446 0.000 0.000 1.000 0.446 0.497 0.000 0.000 1.000 –0.171*** 0.000***
Age 2.381 0.869 0.000 2.565 3.951 2.442 0.847 0.000 2.565 3.932 –0.061*** 0.000***
Definitions and source of all the variables are reported in Appendix I.
greater R&D intensity (mean RDInt = 0.059 vs. mean RDInt = 0.050; p<0.01), are bigger in size (mean Size = 14.212 vs. mean Size = 13.709 p<0.01), are less leveraged (mean Leverage = 0.638 vs. mean Leverage = 0.728; p<0.01), have less international exposure (mean IntSalesPerc = 45.089 vs. mean IntSalesPerc = 34.091; p<0.01) and are younger (mean Age = 2.381 vs. mean Age = 2.442; p<0.01). Interestingly we find that companies that over-capitalise also have lower growth opportunities (mean BM = 0.544 vs. mean BM = 0.897; p<0.01). Given that capitalisation should signal successful R&D projects and thus future growth, this suggests that over-capitalisation is likely to be a result of aggressive reporting.
In Table 4.5, we report descriptive statistics splitting the sample between firms that over- or under-capitalise R&D. These are presented in Panels A and B respectively. We derive the expected amount of R&D that a company should capitalise by estimating model (2) as discussed in section 3.2. A company would over- (under-) capitalise R&D if the amount capitalised is higher (lower) than the amount expected to be capitalised. The results suggest that companies that over-capitalise recognise larger amounts (mean RDCap = 0.028 vs. mean RDCap = 0.009; p<0.01) while the expected amount is much smaller (mean RD_expected = 0.012 vs. mean RD_expected = 0.033; p<0.01). Further, relative to the firms that under-capitalise R&D, these firms have
Given that capitalisation should signal successful R&D projects and thus future growth, this suggests that over-capitalisation is likely to be a result of aggressive reporting.

4.2 PHASE 2 – R&D-RELATED DISCLOSURES IN ANNUAL REPORTSTable 4.6 presents the mean values of the frequency with which each firm makes reference to each of the terms in our list of keywords across the two sections of the annual report (narratives and financial statements) and in aggregate. This is presented for all the companies in our sample as well as separately for expensers and capitalisers.
Overall, although there are some notable exceptions, it is apparent that the level of R&D disclosure is low. For example, the mean (median) frequency of R&D terms in an annual report is only 25 (17). Despite this low level of disclosure, nonetheless the results show that companies tend to report more about R&D in the narratives sections of the annual report (mean (median) frequency of R&D terms being 15 (9) compared with 9(7) in the financial statements). This is not surprising, given that IAS 38 does not mandate that any narrative disclosures on R&D be provided in the financial statements section and related footnotes to the accounts. Hence, such narrative reporting is more likely to be found as part of voluntary disclosure in the front end of the report.
Further, we find that capitalisers tend to refer more frequently to R&D in their annual reports (mean (median) frequency of R&D terms being 26 (19) compared
with 25 (6) in the financial statements; the difference in medians is statistically significant at the 1% level). It is in the financial statements section of the annual report that capitalisers appear to report significantly more about R&D (mean (median) frequency of R&D terms being 10 (7) compared with 9 (6) in the financial statements; the difference in means is statistically significant at the 5% level). This is equally not surprising. The only specific requirement in IAS 38 that expensers must disclose the aggregate amount of R&D expenditure recognised as an expense during the period (IAS 38.126). In contrast, a capitaliser is required to provide information about each class of intangible asset, including capitalised development costs, a reconciliation showing movements, such as additions, amortisation and so on, and the period of amortisation (IAS 38.118).
The overall level of disclosure was debated as part the roundtable discussion. It was argued that although these levels may appear to be low given that the sample comprises R&D active firms, such information may be communicated via different channels. For example, presentations about R&D spend are often given to analysts and investors during capital market days. Hence, where intangibles themselves or related disclosures are not visible in annual reports, it does not mean that they are invisible in general.
35
The capitalisation debate: R&D expenditure, disclosure content and quantity, and stakeholder views | 4. Findings and discussion
Overall, although there are some notable exceptions, it is apparent that the level of R&D disclosure is low.
Table 4.6: Descriptive statistics of the frequency of R&D terms
PANEL A: FULL SAMPLE
N Mean Median Min Max
FS (only) 3,402 9 7 1 112
Narratives (only) 3,171 15 9 1 230
Annual report 3,039 25 17 2 287
PANEL B CAPITALISERS EXPENSERS
N Mean Median Min Max N Mean Median Min Max
FS (only) 1,295 10 7 1 105 2,107 9 6 1 112
Narratives (only) 1,193 15 9 1 150 1,978 15 8 1 230
Annual report 1,131 26 19 2 211 1,908 25 16 2 287
Definitions and source of all the variables are reported in Appendix I.
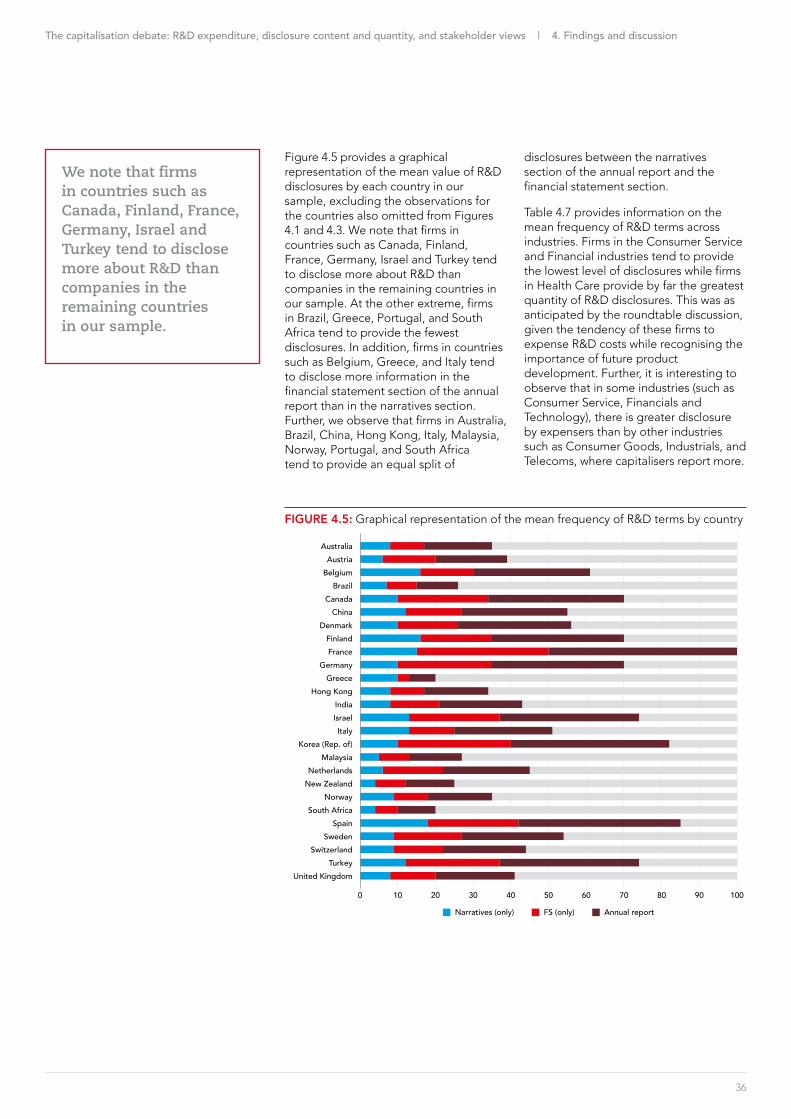
36
disclosures between the narratives section of the annual report and the financial statement section.
Table 4.7 provides information on the mean frequency of R&D terms across industries. Firms in the Consumer Service and Financial industries tend to provide the lowest level of disclosures while firms in Health Care provide by far the greatest quantity of R&D disclosures. This was as anticipated by the roundtable discussion, given the tendency of these firms to expense R&D costs while recognising the importance of future product development. Further, it is interesting to observe that in some industries (such as Consumer Service, Financials and Technology), there is greater disclosure by expensers than by other industries such as Consumer Goods, Industrials, and Telecoms, where capitalisers report more.
Figure 4.5 provides a graphical representation of the mean value of R&D disclosures by each country in our sample, excluding the observations for the countries also omitted from Figures 4.1 and 4.3. We note that firms in countries such as Canada, Finland, France, Germany, Israel and Turkey tend to disclose more about R&D than companies in the remaining countries in our sample. At the other extreme, firms in Brazil, Greece, Portugal, and South Africa tend to provide the fewest disclosures. In addition, firms in countries such as Belgium, Greece, and Italy tend to disclose more information in the financial statement section of the annual report than in the narratives section. Further, we observe that firms in Australia, Brazil, China, Hong Kong, Italy, Malaysia, Norway, Portugal, and South Africa tend to provide an equal split of
The capitalisation debate: R&D expenditure, disclosure content and quantity, and stakeholder views | 4. Findings and discussion
We note that firms in countries such as Canada, Finland, France, Germany, Israel and Turkey tend to disclose more about R&D than companies in the remaining countries in our sample.
FIGURE 4.5: Graphical representation of the mean frequency of R&D terms by country
0 10 20 30 40 50 60
Australia Austria
Belgium Brazil
Canada
DenmarkFinlandFrance
Germany
70 80 90 100
GreeceHong Kong
IndiaIsrael
Korea (Rep. of)Malaysia
NetherlandsNew Zealand
NorwaySouth Africa
SpainSweden
Italy
SwitzerlandTurkey
United Kingdom
China
Narratives (only) FS (only) Annual report

We can interpret these observations as follows, when we compare them with those in Figure 4.2. It appears that companies that follow a treatment which is somewhat against the norm for their industry, tend to report more R&D-related information. For example, for companies in the Telecoms and Consumer Goods industries the norm is to expense (Figure 4.2). In practice, the capitalisers in these industries tend to disclose more than the expensers (mean R&D terms 24 and 27 compared with 21 and 18, respectively; Table 4.7). The reverse holds, albeit more marginally, in industries where the norm is to capitalise (ie Consumer Service and Technology).17
Figure 4.6 provides a graphical representation of the mean frequency of R&D terms by industry for our full sample.
The great variation of disclosure between industries and the higher levels from the Health Care firms were also noted in the ACCA roundtable discussion. This clearly highlights the prevalence of industry effects in relation to both capitalisation of R&D and the levels of disclosure provided to stakeholders. The materiality of research for future product (drug development) pipelines is significant across that sector as is the importance of associated research activity disclosures. In fact, the level of disclosures provided by expensers, as can be seen from the Table 4.7, typifies the pharmaceutical sector within Health Care. In contrast to this, the disclosures provided by firms from the Financials and Consumer Service industries are relatively low in quantity. The level of disclosure and its usefulness is more fully considered in Phase 3 of the research.
37
The capitalisation debate: R&D expenditure, disclosure content and quantity, and stakeholder views | 4. Findings and discussion
It appears that companies that follow a treatment which is somewhat against the norm for their industry, tend to report more R&D-related information.
TABLE 4.7: Mean frequency of R&D terms by industry
FULL SAMPLE EXPENSERS CAPITALISERS
Narratives(only)
FS(only)
Annual report
Narratives(only)
FS(only)
Annual report
Narratives(only)
FS(only)
Annual report
Basic Materials 14 7 21 14 6 21 12 8 22
Consumer Goods 13 7 21 11 6 18 19 9 27
Consumer Service 6 7 13 8 6 15 4 8 11
Financials 8 6 14 11 6 16 5 6 10
Health Care 28 17 46 32 19 51 22 14 37
Industrials 13 8 22 11 7 18 17 9 26
Technology 14 10 25 15 11 26 13 10 23
Telecommunication 12 11 22 12 10 21 11 14 24
Utilities 16 8 25 17 7 25 13 9 25
FIGURE 4.6: Graphical representation of the mean value of R&D disclosures by industry
Basic materialsConsumer goods
Consumer servicesFinancials
Health care
TechnologyTelecommunications
Utilities
Industrials
0 10 20 30 40 50 60 70 80 90 100
Narratives (only) FS (only) Annual report
17 Appendix V provides detailed information (min, max, mean, median) between expensers and capitalisers across industries.

38
Appendix VI identifies a selection of companies from across the world for which the R&D intensity levels and the level of R&D disclosure in their annual reports vary significantly. The relevant information about frequency of disclosures is disaggregated across sections of their annual reports.
In relation to key disclosure items, Table 4.9 provides a summary of the most and least popular terms from the R&D keywords we used in our analysis (see section 3.4). As expected, companies tend to refer commonly to terms such as ‘research and development’ (and ‘R&D’) and five of the most common keywords featuring in IAS 38. Firms also tend to make reference to ‘product’, ‘software’, ‘research’, ‘clinical’ and ‘technology development’. Interestingly, the list of least common terms includes six of the 19 terms we include in the dictionary and that relate to patents.
Table 4.8 presents the mean and median of disclosure quantity and R&D intensity for each quartile of R&D disclosure in the annual report as a whole. Consistent with the information discussed above, we observe significant differences in the disclosure quantity in the annual report between the quartiles. For instance, the median disclosure quantity in the annual report for the bottom quartile is 7 for both expensers and capitalisers, while the median disclosure quantity on the top portfolio is 50 and 46 for expensers and capitalisers respectively. Further, we observe that R&D intensity increases monotonically from the bottom to the top quartile of R&D disclosure. It is only for the top quartile that there are notable differences between expensers and capitalisers, arguably driven by the Health Care constituents, which are the most prevalent reporters and, in fact, are those that tend to expense R&D costs. Taken together, these results reflect the significance of R&D investment in determining the level of R&D-related disclosures.
The capitalisation debate: R&D expenditure, disclosure content and quantity, and stakeholder views | 4. Findings and discussion
Consistent with the information discussed above, we observe significant differences in the disclosure quantity in the annual report between the quartiles.
TABLE 4.8: Frequency of R&D-related terms across expensers and capitalisers and R&D intensity levels, based on quartiles of disclosure levels in the annual report
FS (ONLY) NARRATIVES (ONLY) ANNUAL REPORT R&D INTENSITY
Mean Median Mean Median Mean Median Mean MedianPANEL A: TOP QUARTILE
Capitalisers 19 16 35 31 54 46 0.076 0.043
Expensers 20 16 42 31 62 50 0.106 0.044
PANEL B: 2nd QUARTILE
Capitalisers 10 10 14 13 24 23 0.068 0.031
Expensers 10 9 14 14 23 23 0.061 0.020
PANEL C: 3rd QUARTILE
Capitalisers 7 6 7 7 14 14 0.056 0.022
Expensers 6 6 7 6 14 13 0.035 0.008
PANEL D: 4th QUARTILE
Capitalisers 3 3 3 2 7 7 0.036 0.008
Expensers 3 3 3 3 7 7 0.021 0.003
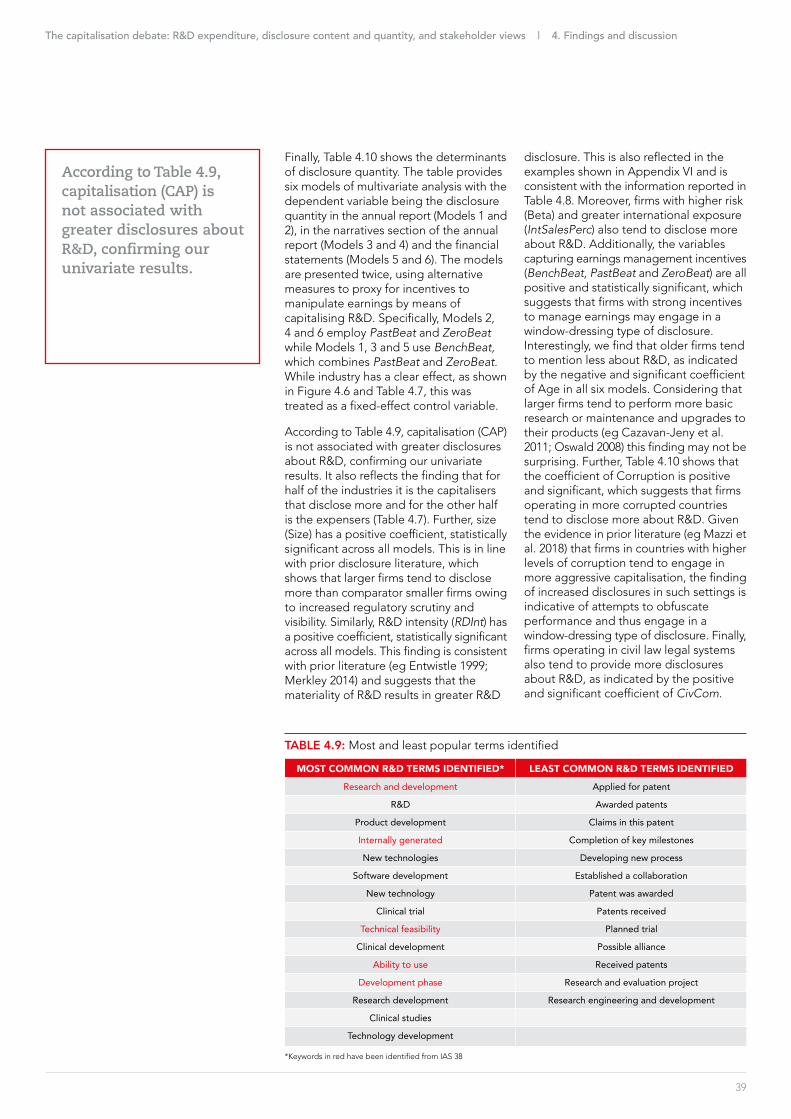
Finally, Table 4.10 shows the determinants of disclosure quantity. The table provides six models of multivariate analysis with the dependent variable being the disclosure quantity in the annual report (Models 1 and 2), in the narratives section of the annual report (Models 3 and 4) and the financial statements (Models 5 and 6). The models are presented twice, using alternative measures to proxy for incentives to manipulate earnings by means of capitalising R&D. Specifically, Models 2, 4 and 6 employ PastBeat and ZeroBeat while Models 1, 3 and 5 use BenchBeat, which combines PastBeat and ZeroBeat. While industry has a clear effect, as shown in Figure 4.6 and Table 4.7, this was treated as a fixed-effect control variable.
According to Table 4.9, capitalisation (CAP) is not associated with greater disclosures about R&D, confirming our univariate results. It also reflects the finding that for half of the industries it is the capitalisers that disclose more and for the other half is the expensers (Table 4.7). Further, size (Size) has a positive coefficient, statistically significant across all models. This is in line with prior disclosure literature, which shows that larger firms tend to disclose more than comparator smaller firms owing to increased regulatory scrutiny and visibility. Similarly, R&D intensity (RDInt) has a positive coefficient, statistically significant across all models. This finding is consistent with prior literature (eg Entwistle 1999; Merkley 2014) and suggests that the materiality of R&D results in greater R&D
disclosure. This is also reflected in the examples shown in Appendix VI and is consistent with the information reported in Table 4.8. Moreover, firms with higher risk (Beta) and greater international exposure (IntSalesPerc) also tend to disclose more about R&D. Additionally, the variables capturing earnings management incentives (BenchBeat, PastBeat and ZeroBeat) are all positive and statistically significant, which suggests that firms with strong incentives to manage earnings may engage in a window-dressing type of disclosure. Interestingly, we find that older firms tend to mention less about R&D, as indicated by the negative and significant coefficient of Age in all six models. Considering that larger firms tend to perform more basic research or maintenance and upgrades to their products (eg Cazavan-Jeny et al. 2011; Oswald 2008) this finding may not be surprising. Further, Table 4.10 shows that the coefficient of Corruption is positive and significant, which suggests that firms operating in more corrupted countries tend to disclose more about R&D. Given the evidence in prior literature (eg Mazzi et al. 2018) that firms in countries with higher levels of corruption tend to engage in more aggressive capitalisation, the finding of increased disclosures in such settings is indicative of attempts to obfuscate performance and thus engage in a window-dressing type of disclosure. Finally, firms operating in civil law legal systems also tend to provide more disclosures about R&D, as indicated by the positive and significant coefficient of CivCom.
39
The capitalisation debate: R&D expenditure, disclosure content and quantity, and stakeholder views | 4. Findings and discussion
According to Table 4.9, capitalisation (CAP) is not associated with greater disclosures about R&D, confirming our univariate results.
TABLE 4.9: Most and least popular terms identified
MOST COMMON R&D TERMS IDENTIFIED* LEAST COMMON R&D TERMS IDENTIFIED
Research and development Applied for patent
R&D Awarded patents
Product development Claims in this patent
Internally generated Completion of key milestones
New technologies Developing new process
Software development Established a collaboration
New technology Patent was awarded
Clinical trial Patents received
Technical feasibility Planned trial
Clinical development Possible alliance
Ability to use Received patents
Development phase Research and evaluation project
Research development Research engineering and development
Clinical studies
Technology development
*Keywords in red have been identified from IAS 38

40
The capitalisation debate: R&D expenditure, disclosure content and quantity, and stakeholder views | 4. Findings and discussion
TABLE 4.10: Determinants of disclosure frequency of R&D terms
ANNUAL REPORT NARRATIVES (ONLY) FS (ONLY)
Model 1 Model 2 Model 3 Model 4 Model 5 Model 6
CAP 0.024(0.61)
0.021(0.55)
–0.007(–0.16)
–0.012(–0.26)
0.015(0.40)
0.014(0.38)
BM –0.054**(–2.36)
–0.058**(–2.55)
–0.053**(–2.06)
–0.058**(–2.29)
–0.032(–1.60)
–0.035*(–1.76)
RDValue –0.000***(–7.17)
–0.000***(–7.26)
–0.000***(–6.06)
–0.000***(–6.15)
–0.000***(–4.37)
–0.000***(–4.47)
RDInt 1.882***(9.27)
1.848***(8.98)
2.005***(9.06)
1.941***(8.65)
1.740***(9.02)
1.724***(8.90)
Size 0.072***(8.34)
0.073***(8.29)
0.093***(9.38)
0.093***(9.35)
0.030***(3.45)
0.030***(3.48)
Beta 0.058***(4.18)
0.058***(4.24)
0.054***(3.42)
0.056***(3.51)
0.046***(3.61)
0.047***(3.65)
Leverage –0.011(–0.68)
–0.011(–0.66)
–0.010(–0.54)
–0.010(–0.56)
0.004(0.24)
0.004(0.25)
IntSalesPerc 0.002***(3.12)
0.001***(3.10)
0.002***(3.19)
0.002***(3.17)
0.001**(2.28)
0.001**(2.28)
BenchBeat 0.262***(8.07)
0.304***(7.67)
0.209***(6.81)
ZeroBeat 0.177***(3.47)
0.225***(3.87)
0.154***(3.21)
PastBeat 0.221***(6.37)
0.263***(6.24)
0.153***(4.61)
Age –0.063***(–2.84)
–0.063***(–2.86)
–0.055**(–2.20)
–0.056**(–2.24)
–0.062***(–2.94)
–0.062***(–2.95)
AudEnf –0.002(–0.68)
–0.002(–0.65)
–0.001(–0.28)
–0.001(–0.23)
–0.003(–0.94)
–0.003(–0.90)
InvProtection 0.052(1.51)
0.053(1.52)
0.114***(2.88)
0.115***(2.90)
0.006(0.17)
0.006(0.16)
AntiselfDeal 0.010(0.06)
0.007(0.04)
–0.333(–1.63)
–0.336(–1.64)
0.436**(2.52)
0.435**(2.49)
CivCom 0.465***(4.07)
0.465***(4.06)
0.462***(3.57)
0.464***(3.59)
0.442***(4.12)
0.442***(4.10)
Corruption 0.832***(4.68)
0.813***(4.47)
0.922***(4.55)
0.903***(4.43)
0.504***(2.81)
0.496***(2.73)
Baloftrade –0.005*(–1.85)
–0.005*(–1.85)
–0.005*(–1.88)
–0.005*(–1.86)
–0.005*(–1.76)
–0.005*(–1.76)
DitriInfra 0.029(0.88)
0.030(0.90)
0.083**(2.23)
0.083**(2.22)
–0.047(–1.46)
–0.046(–1.44)
EnerInfra –0.042(–1.56)
–0.042(–1.56)
–0.082***(–2.61)
–0.082***(–2.60)
0.003(0.12)
0.002(0.10)
HeatlhInfra 0.033(1.19)
0.032(1.16)
0.046(1.55)
0.045(1.51)
0.030(1.06)
0.030(1.06)
SkilledLabour –0.015(–0.58)
–0.014(–0.55)
–0.021(–0.70)
–0.020(–0.66)
0.004(0.17)
0.004(0.19)
Constant 0.347(0.97)
0.366(1.02)
–0.904**(–2.23)
–0.888**(–2.18)
0.510(1.43)
0.515(1.43)
ObservationsFr2_a
3,03926.6020.332
3,03925.6530.330
317127.9840.307
317126.9740.307
340214.6880.234
340213.7540.231
t statistics in parentheses. Industry and year fixed effects included but not shown. Standard errors are clustered at the firm level. Definitions and source of all the variables are reported in Appendix I.
* p < 0.10, ** p < 0.05, *** p < 0.01.

In the results for Phase 3, as reported below, the interviews consider the decision-usefulness of R&D disclosure to stakeholders. They also capture the tension between decision-usefulness and proprietary information.
4.3 PHASE 3 – R&D ACCOUNTING AND REPORTING: STAKEHOLDERS’ VIEWSConsistent with the project’s research aims and the participant overview provided in advance of all interviews, the key qualitative findings are now reported in three sub-sections. These reflect the three central themes on which prior literature has concentrated, as discussed in Chapter 2.
Accounting treatment of R&D expenditureBefore reflecting on the signalling effect or irrelevance (the no-effects hypothesis) of accounting for R&D expenditure, and specifically on capitalisation, there was general agreement across all three stakeholder groups as to the need for IAS 38 to address R&D accounting by following a principles-based framework. This is in contrast to the US approach of expensing all R&D expenditure. There was general appreciation that intangible assets should be adequately captured on the balance sheet (statement of financial position) if the conditions in the standard were met. The following direct quotes reflect this general view.
‘Does it [expensing all] get me closer to the nirvana where I’d like accounting to get us to? No, I don’t think it does…. if you continue to expense R&D, that gap between market capitalisation and net asset value is just going to continue to grow and grow’. (A1)
‘Accounting principles has [sic] a framework that expenses will be matched with their earnings such that the principle under capitalisation matches expense to future defined economic benefits: to not do so would substantially decrease the comparative usefulness [of accounting information]’. (P2)
‘It’s important to have the standard to give a basis for capitalisation instead of just expensing. How the actual accounting is then used by stakeholders is a different matter’. (I4)
While there was support for a principles-based standard with capitalisation, R&D accounting was nonetheless, in general, dismissed as irrelevant by all the investors. They focused much more on the overall cash spend on R&D than on its accounting. This is consistent to the ‘no-effects hypothesis’ (Watts and Zimmerman, 1986) and the findings of Goodacre and McGrath (1997) in their experimental study. For instance, interviewee I5 reflected that, ‘while the story of the overall R&D process is important to us, we need to tie that into overall R&D spend’. More specifically, I2 remarked, ‘we look at each company, what it spends on R&D….we look at all these companies on a cash flow basis’ and I6 bluntly noted that, ‘from an investor perspective, cash spend and free cash flows are way more important than R&D accounting’.
Interestingly, the general investor view of accounting irrelevance was also recognised by some of the preparers and auditors:
‘Investors are not really interested in the accounting treatment – in fact some retail investors may be misled by capitalisation. They look at cash spend’. (P2)
‘I think they [capital markets] care about what the R&D number is and what programme it’s being spent on….but , I think [on] the accounting side of it, I don’t think the markets care less to be honest’. (A5)
Nonetheless, there was some support for signalling (Ahmed and Falk 2006; Shah et al. 2013) from one of the investors, who asserted that capitalisation is: ‘showing the management’s confidence in the asset, if they are willing to capitalise it. So, I think there’s some informational quality in that sense... and there are
41
The capitalisation debate: R&D expenditure, disclosure content and quantity, and stakeholder views | 4. Findings and discussion
While there was support for a principles-based standard with capitalisation, R&D accounting was nonetheless, in general, dismissed as irrelevant by all the investors.
42
R&D, for you to have done that it has to have yield… you’re expecting future benefits....it’s still shareholders’ monies that are being spent’. More bluntly, I6 commented that ‘all R&D spend may ultimately lead to an increase in future earnings, but which projects will come through is guesswork: otherwise, if it was known to fail, the spend would not be done!’. Further, one of the auditors (A2) reflected, ‘historically, the correlation between R&D spend and R&D success is rather weak’.
Concern was also raised about the difficulty of meeting the conditions for recognising an intangible asset and having the information audited, which creates a potential preference towards expensing. This is certainly the case in industries such as pharmaceuticals, where capitalisation is largely restricted to that period after regulatory approval. As two of the participants noted ‘92% of every drug in development fails’ (I3) and ‘once we’ve passed that we start capitalising except for the fact there’s hardly anything left to capitalise’ (A2). Thus capitalisation, certainly in some sectors – and especially pharmaceuticals within Health Care – is largely redundant.
Such concerns over meeting the conditions necessary for the capitalisation of internally funded R&D projects were also highlighted by both auditors and preparers who contrasted this accounting treatment with that in relation to externally purchased development costs under IFRS 3. From a preparer perspective, P2 commented specifically on the 'inconsistency between standards, I think, there is something to improve….you’ve got IFRS 3, so if I’ve got in-process research and development then I have to recognise it as an intangible because I bought it. But I certainly wouldn’t be encouraging IAS 38 to move to put some of those intangibles you recognise under IFRS 3, like customer lists or customer relationships, onto your own balance sheet.' Thus, there is a clear tension between the accounting for intangibles with respect to externally purchased versus internally generated development costs.
hidden signals in terms of financial reporting’ (I3). Further, there was some, albeit mild, support of a signalling effect from the preparers and auditors as regards their perspective of investor market use. But in such cases it was largely muted by the dominance of cash spend. For instance, A2 commented that ‘capitalisation may send a positive signal to the market but largely in line with market expectations.’ But he/she continues that ‘the market is probably more interested in overall spend than necessarily [in] accounting’. Further, while one of the preparers recognised signalling, he/she nonetheless argued that it was outweighed by the emphasis on cash spend, ‘I think the market is interested; from our perspective the market’s interested in the fact that we do capitalise in the sense of that you’ve identified something that you think’s going to generate future cash flows…but what’s more important from a cash perspective [is that] I’m still spending the cash, so it’s your view on what the P&L should reflect’ (P4). Interestingly, the importance of cash spend had also been expressed by a representative of the investment community during the roundtable discussion.
Most of the investors accepted the expenses/capitalisation accounting in the audited financial statements and had confidence in those. Ultimately, as discussed, they focus more on cash spend and its integration into the underpinning strategy and business model. Indeed, from a user perspective, A6 commented that: ‘What is important: it’s the story to stakeholders. So, it would include the business model and how well the development capitalisation fitted with the business model and how well the development actually fitted within the overall story of the strategic report.’
All the investors held that the relationship between accounting and future earnings is extremely difficult to match and to some extent not worth pursuing, which contributes to the irrelevance of accounting. Thus, for instance, I1 comments that ‘every dollar spent on
The capitalisation debate: R&D expenditure, disclosure content and quantity, and stakeholder views | 4. Findings and discussion
Concern was also raised about the difficulty of meeting the conditions for recognising an intangible asset and having the information audited, which creates a natural preference towards expensing.

The capitalisation debate: R&D expenditure, disclosure content and quantity, and stakeholder views | 4. Findings and discussion
43
resources of the acquired business are regarded as externally purchased' (p. 1). A similar outcome of the diverse accounting treatment is also noted by PricewaterhouseCoopers (2008, p. 22) who asserted in the case of an acquisition that 'assets and liabilities will be measured at fair value, including intangible assets and contingent liabilities. The revised standard continues the requirement for identification of intangible assets, with very few intangibles being excluded from identification and valuation'.
Expensing and prudenceAll the interview participants emphasised the prevalence of expensing over capitalisation. This related to three main and interrelated aspects: accounting conservatism and prudence; the difficulty of meeting or assuring the six conditions to be met prior to mandatory capitalisation; and concerns about future impairment.
Firstly, regarding prudence, an interesting tension emerged between prudence and a bias to expensing, in contrast to faithful representation through the recognition of intangible assets on the balance sheet. This was encapsulated by interviewee A5 as follows: ‘expensing is more commonplace, but faithful representation might say ‘but there could be an asset here and to faithfully represent that there’s an argument for capitalisation’. So, there a tension between the two, yes… and you’re going to start from a more conservative platform’. Indeed, for many of the auditors and preparers, expensing simply ‘makes life so much easier in the old-fashioned way of prudence’ (A3). Thus, while prudence was not part of the Conceptual Framework between 2010 and 2018, the vestiges of a prudent approach apparently remain in practice. Indeed, the underpinning literature points to a long history of prudence in the treatment of R&D accounting, beginning before IFRS adoption (Billiot and Glandon 2005; Entwistle 1999; Lev et al. 2005; Nixon 1997; Stark 2008). Such a potential ‘nervousness’ towards capitalisation by auditors was also remarked upon during the earlier roundtable discussion.
Such a tension between the standards was also highlighted by the auditor group. For instance, A4 noted, 'in the case of an acquisition you would have to actually value that development work and that would be done more on a market valuation as to what you could realise that development cost capitalisation for which is misaligned with IAS 38'. They continued: 'there is an issue with different forms of capitalisation and different justifications where you have acquired capitalised based on an ascribed value and you have internal costs capitalised on a cost model. I think that is an issue'. Similarly, A1 bluntly remarked: 'does that make a lot of sense actually?'. The interviewee highlighted that 'I think is an odd outcome of accounting if you think about business combination, so the IFRS3 will [recognise that] you’ve got a Phase 1 asset [and thus] I am going to place a value on that on my books, no matter how early stage it is'. Clearly this brings into sharp contrast the differential accounting treatment.
The contrast between the two standards was also discussed in the round table meeting. In general, as with the interviews, there was concern as to the apparent inconsistency of accounting between the standards. This was summarised by one of the participants, 'inconsistency is a real problem, two companies generating identical stream of cash flows but different earnings profiles based on whether they acquire R&D or do it internally'. The round table also raised concerns as to whether this would have any impact or distortion on capital markets and ascribing business value due to the differences in accounting for externally purchased versus internally generated assets. This concern is also echoed in practice. For instance, Grant Thornton (2013, p1) report: 'in fact, the acquired entity may have been subject to specific restrictions in International Accounting Standard 38 ‘Intangible Assets’ (IAS 38) that prohibit the recognition of many internally generated intangible assets (IAS 38.51-53). These restrictions do not apply to business combination accounting – in effect, all
The contrast between IFRS 3 and IAS 38 was also discussed in the round table meeting. In general, as with the interviews, there was concern as to the apparent inconsistency of accounting between the standards.

The capitalisation debate: R&D expenditure, disclosure content and quantity, and stakeholder views | 4. Findings and discussion
44
One common element of robustness was any history of impairment (Ciftci 2010; Entwistle 1999). In contrast to the capitalisation decision, impairment is considered to send stronger negative signals to the market about reduced earnings and confidence in management and material judgement. Externalities were accepted by investors but a trend of impairment would erode this. Recognising the adverse impact of impairment, P3 commented: ‘we would be concerned with any future impairment and the negative signal that sends about the company and about our judgments; hence we would adopt a conservative approach to accounting’. These concerns about future earnings and managerial confidence were reflected in an auditor’s opinion: ‘I think that awareness of a double hit tends to make CFOs [chief financial officers] wary of capitalisation’ (A5). Finally, from an investor perspective, ‘a big impairment is a strong negative, unless there’s a good external reason but even then, perhaps expensing should have been applied in the first place. Future earnings are hit and….what [does] that tell me about managerial judgement?’ (I5).
In the discussions on capitalisation, there was some, albeit limited, recognition of the potential for earnings management (Markarian et al. 2008) and this elicited some sympathy for the US approach to expensing. A2 cynically commented, however, that such an approach – in contrast to any principles-based standard on capitalisation – was ‘the easy way out’. As discussed, most of the investors accepted the audited financial statements as presented and from that ran their own models. In contrast, a minority adopted an extreme position of 100% recapitalisation. Indeed, in discussing the possible managerial subjectivity of IAS 38 with respect to the capitalisation conditions, one interviewee from the investors’ group explained that their treatment was to capitalise all R&D costs. Thus, I1 explained, ‘We have our own equity valuation model, we capitalise all R&D... any written-off research we’re going to recapitalise that…We want to take the subjectivity out of IAS 38 so it removes that and then it removes, obviously, the accounting distortions’.
Secondly, while recognising the principle and importance of conditionality behind capitalisation, there were strongly held views on the difficulties of meeting (by preparers) and assuring (by auditors) the six conditions specified in IAS 38 prior to capitalisation. Such a finding is consistent to that reported in the literature (for instance Zéghal and Maaloul, 2011). For example, interviewee P4 stated that ‘the six conditions effectively lead to expensing especially mainly due to technical feasibility and future market, which are often inherently unknown and thus [there is] no certainty to support capitalisation or for auditor assurance’. Indeed, recognising the inherent difficulties of assurance, one of the auditors commented, ‘I imagine that many auditors sigh a huge sigh of relief when they see that a client has decided to expense all of the development costs because it takes away a lot of that judgement, takes away a lot of the need to try and audit something which is inherently very difficult to audit’ (A1). In some industries, notably pharmaceuticals, this made capitalisation virtually non-existent, ‘I know it is completely common practice in the pharmaceutical industry that pretty much nothing gets capitalised until you have regulatory approval’ (A3).
The concern over the six conditions and auditor assurance, especially with regard to future markets, was a commonly raised issue, although all the preparers had experience of capitalisation and confirmed that they had internal management and governance systems to help identify appropriate capitalisation. These systems served as a helpful basis for assurance as well as acting as a track record of successful projects, in contrast to a history of impairment, which would call managerial judgement into question. The dynamic of the preparer/auditor relationship can be illustrated by the comment: ‘I think it’s understanding how management has made its judgement…and then from an audit perspective it is challenging it...it’s more about management having a robust process to have challenged themselves and to have considered the alternative outcomes and the potential impact of the alternative outcomes’ (A3).
In contrast to the capitalisation decision, impairment is considered to send stronger negative signals to the market about reduced earnings and confidence in management and material judgement.
The capitalisation debate: R&D expenditure, disclosure content and quantity, and stakeholder views | 4. Findings and discussion
45
Unsurprisingly, the tension that surfaced reflected concerns about making increased disclosures to support decision usefulness versus the need to safeguard proprietary information and commercial sensitivity. This principally focused on how the capitalisation conditions were met and associated managerial judgements, along with the granularity of the R&D split by material product groups. For instance, interviewee A3 reflected: ‘I think there is management always trying to balance what it believes to be market-sensitive, proprietary, whatever, against the need to provide useful information from a usefulness perspective’. Indeed, P1 admitted ‘basically, the disclosure is quite limited…I think it would be a good idea to have some specific disclosures on capitalisation’. This tension in part reflects the debate in the literature between those who argue that disclosure (mandatory and voluntary) does satisfy the needs of users (Merkley 2014; Penman 2009) and those who advocate greater levels of reporting (Lev 2018a).
From a user perspective, there was demand for greater, more focused, disclosure balanced against the voluminous nature of corporate reporting. Investors lamented that, ‘the level of disclosure, the transparency, is so opaque’ (I3) and ‘we never get that level of disclosure beyond the aggregate cost of R&D’ (I2). Thus, the disclosure is often at an aggregate level although investors did recognise the usefulness of quality narrative disclosure and the strategic review in relation to R&D.
‘Quality narrative disclosure may provide an appropriate way forward and avoid the more proprietary detailed financial disclosures’. (A5)
‘I think it’s the tone from that that may or may not come across… they actually have control over what goes into those first few pages, so it’s very interesting from my perspective…what the overall tone is and what they are not talking about….it’s tone and exclusion that’s useful’. (I6)
The general issue of earnings management was recognised by preparers and auditors. This again led auditors to be more conservative (or prudent) in their approach to and assurance of capitalisation, especially in a regulated environment with high levels of audit-file review. From a preparer perspective, the opportunity for earnings management was more fully recognised in relation to a less visible regulatory perspective and to private businesses, ‘The criteria are judgemental as the principles are laid out. They’re not rules, they are principles. So, yes, if you were minded to want to try and achieve a particular outcome then I think IAS 38 does give you some leeway to do so. So, in that context you could take the view of debits to the balance sheet’ (P4). This would accord with managerial manipulation, as noted by Cazavan-Jeny et al. (2011) and Dinh et al. (2015). In a reverse situation, interviewee A5 noted: ‘in smaller companies, maybe coming to an IPO, then you would need to be mindful of over-expensing so as to have future abnormal earnings effectively in hand’. Thus, earnings management was appreciated in the contexts of both increasing and decreasing earnings.
DisclosureThe final aspect of all the interviews related to disclosure. While IAS 38 sets out the six conditions to be met for capitalisation of development costs, the mandatory disclosure requirements in relation to those criteria are minimal, beyond the accounting for R&D and the split between expensed and capitalised costs usually dealt with through a boiler-plated accounting policy note. Although there is a requirement to present a reconciliation for each class of intangible asset there is (beyond IAS 1 on material managerial judgements) very little by way of mandatory requirements for R&D capitalisation, with disclosure being largely voluntary in the front-end of the annual report.
Unsurprisingly, the tension that surfaced reflected concerns about making increased disclosures to support decision usefulness versus the need to safeguard proprietary information and commercial sensitivity.

The capitalisation debate: R&D expenditure, disclosure content and quantity, and stakeholder views | 4. Findings and discussion
46
Indeed, this issue was widely appreciated across the auditor group and the recognition that there may well follow greater regulatory pressure on the quality of disclosures required under IAS 1 in relation to significant managerial judgements, such as would be the case in a significant and material capitalisation. This was summed up by A3: ‘I think properly applied, the guidance in IAS 1 would address any concerns’.
Overall, there is recognition of the need for a standard and its principles-based application. The level of expensing relative to capitalisation is a product of the standard and the demonstration and assurance of the six conditions, coupled with accounting conservatism or prudence. This latter issue is further exacerbated by concerns over impairment. Disclosure remains a contested area between the need for decision-usefulness and the desire to protect proprietary information, although issues were evident over the interface between IAS 38 and IAS 1 and the level and quality of disclosure about significant managerial judgements such as that associated with a material capitalisation.
The question of managerial judgements and related disclosures was referred to by preparers and auditors, as well as the link to IAS 1. IAS 1, paragraph 125 stipulates, ‘An entity shall disclose information about the assumptions it makes about the future, and other major sources of estimation uncertainty at the end of the reporting period, that have a significant risk of resulting in a material adjustment to the carrying amounts of assets and liabilities within the next financial year’ (emphasis added). Despite this, A1 reflected:
‘This actually ties in with an area of the accounts that I think is historically been done very, very poorly to date, which is IAS 1 disclosures around judgements and estimates. Because if it is a key judgement or a key source of estimation uncertainty [as to whether] … I [should] have capitalised more of it, and actually that’s a key judgement, then there should be sufficient disclosures as a result of IAS 1 for a user to understand the judgements that management have taken’. (A1)
The level of expensing relative to capitalisation is a product of the standard and the demonstration and assurance of the six conditions, coupled with accounting conservatism or prudence.
47
5.1 CONCLUSIONS AND RECOMMENDATIONSThe issue of intangible assets and R&D in particular has been high on the agenda of standard setters and regulators (eg ESMA (Maijoor 2015), FASB (2017), FRC (2018) and EFRAG, 2018). There is also concern as to whether intangible assets are reflected in companies’ financial statements, given the current accounting standards and that the gap between book and market values is widening over time owing to the increasing importance of intangibles. Further, concern was expressed as to the apparent inconsistency of accounting treatment between externally purchased (under IAS 3) and internally generated R&D and the capitalisation conditions specified in IAS 38. On that basis, it is expected that the following conclusions and recommendations arising from our research findings would inform these projects, along with the related academic literature.
Our findings suggest that more than 60% of the companies in our sample do not capitalise R&D. Additionally, we find that a large proportion of the companies that capitalise some development costs would be expected not to do so, given their firm- and country-specific characteristics. Overall, while maintaining the principles-based approach that supports
5. Conclusion
capitalisation, it would appear that current criteria in IAS 38 actually militate against capitalisation. Relaxing the criteria for capitalisation by reducing their number could be the way forward. Lev (2018a) argues that such recommendations would help restore the value-relevance of financial information by improving revenue-cost matching in the income statement by capitalising and amortising expense on value-creating assets such as R&D (and see Ohlson 2006). This could also result in giving companies less room for exercising earnings management and would improve auditors’ ability to assure any capitalised amounts. Perhaps professional accountancy bodies can assist indirectly in the improvement of companies’ practices. Providing more in-depth training on the area of R&D and the issues around it could assist in a change of culture towards recognising the balance or tension between prudence and the faithful representation of assets. Additionally, preparers and auditors could be encouraged to support more disclosure to promote transparency.
We find that discussion of R&D is minimal in companies’ annual reports. Moreover, disclosures vary significantly in both length and location in the annual report.
The interviews with stakeholders also confirm a clear demand for more disclosure, especially when development costs are capitalised. Thus, as a first step forward, companies are encouraged to provide clearer and more disclosures about the amounts of R&D expenditure recognised in their financial statements.
As far as the standard setters are concerned, if disclosures continue not to be mandated in IAS 38, a better link between R&D-related information and the disclosures required in IAS 1 about estimation risks and future prospects could be introduced. Moreover, given that the market recognises the importance of the overall R&D spend rather than how it is accounted for, enhanced disclosure of that overall amount of R&D spend is deemed appropriate to aid the decision-usefulness of financial statements (in either the notes to the financial statements or the narratives section of the annual report). Further to these issues of direct relevance to IAS 38, is the tension between standards reflecting an apparent inconsistency of accounting treatment. Under IAS 38, there are stringent conditions for the capitalisation of development costs and their recognition as intangible assets on the

The capitalisation debate: R&D expenditure, disclosure content and quantity, and stakeholder views | 5. Conclusion
48
5.2 LIMITATIONS AND DIRECTIONS FOR FUTURE RESEARCHThe results reported above are subject to a number of common limitations and caveats. First, for Phases 1 and 2 our samples are based on firm-level data revealed by commercial databases. These may contain errors and misclassifications. Second, certain firms may engage in R&D but may not report any R&D expense in the income statement or any R&D asset on the balance sheet. These companies are not included in the sample. In practice, their inclusion is unlikely to affect our results because these firms have low R&D intensity. Third, we rely on econometric techniques to identify the expected amounts of R&D a company should capitalise. While we have made every effort to develop a model that accurately predicts the expected accounting treatment of R&D, we recognise that this may misclassify some companies.
For Phase 3, we acknowledge that the views expressed in this research relate only to the sample of our interviewees. Nonetheless, given the common issues that were identified in the discussion, we tentatively consider them to be broadly representative of the respective groups (see Bence et al. 1995; Campbell and Slack 2011).
Future research could examine R&D-related disclosures made in conference calls and/or non-regulated methods of communications (voluntary disclosures). Moreover, future research could examine whether disclosures and recognition are considered to be complements or substitutes. Future research could also examine the recognition of and disclosures about other intangibles that could be capitalised under IAS 38. This point is further reinforced by the general lack of research on intangibles other than goodwill and R&D.
balance sheet. In contrast, under IFRS 3, for purchased R&D costs, such costs can be capitalised and hence result in more intangible assets being recognised on the balance sheet for an acquiring firm compared to an identical firm that has internally generated R&D projects. Thus, consideration should be given to this inconsistency or to further extend disclosure requirements to more explicitly discuss the reasons justifying the capitalisation of the acquired development costs on acquisition.
We find that the quantity of R&D-related disclosure from companies in countries such as Italy, which explicitly requires companies to discuss R&D-related matters in the Management Discussion and Analysis section of annual reports, exceeds significantly that made by companies in countries that lack such a requirement. Hence, the revised Management Commentary or revised corporate governance policies at the country level could require a specific section on R&D, where relevant.
Finally, it is noted that we find significant differences in decisions about capitalising development costs, the amounts capitalised, and the quantity of R&D-related terms, between countries. Thus, any changes in related regulations/standards that will be applicable to a variety of countries will be unlikely to resolve differences in reporting practices between countries. The role of local institutional characteristics needs to be taken into consideration when interpreting a company’s financial reporting practices.
Any changes in related regulations/standards that will be applicable to a variety of countries will be unlikely to resolve differences in reporting practices between countries.

49
DR FRANCESCO MAZZI, UNIVERSITY OF FLORENCEFrancesco is an assistant professor in accounting at the University of Florence. His research interests are in the area of financial accounting, disclosure, corporate social responsibility, and banking. A central theme of his research is investigating the economic consequences of accounting choices, implementation of policies, and both financial and non-financial disclosures. His efforts have focused on identifying and testing societal factors that affect the economic consequences of these topics. Among these are country-level factors such as culture, corruption, religion, and trust, which explain differential economic consequences for similar corporate behaviours/decisions. Prior to his academic post, Francesco worked as a chartered accountant in Italy.
PROFESSOR RICHARD SLACK, DURHAM UNIVERSITYDr Richard Slack is head of Accounting and professor in accounting at Durham University Business School. Richard joined Durham University in 2012, having previously been professor in accounting at Newcastle Business School, Northumbria University. Prior to his academic career, Richard, a graduate of St Andrews University, worked at Price Waterhouse and is a qualified chartered accountant. Richard’s research encompasses areas of accounting information. Specifically, Richard is interested in the way information is portrayed by companies and whether narrative disclosure is decision-useful to stakeholder groups.
DR IOANNIS TSALAVOUTAS, UNIVERSITY OF GLASGOWIoannis is a senior lecturer in accounting at the University of Glasgow. His main area of expertise is financial accounting and reporting, in particular, investigating companies’ reporting practices under International Financial Reporting Standards across different jurisdictions, along with any economic consequences that may arise from divergence in practice. Ioannis' work experience includes positions as an accounting assistant (in Greece) and as a financial accounting and reporting analyst at Company Reporting Ltd in Edinburgh. Prior to joining the University of Glasgow in January 2015, Ioannis was a lecturer in accounting at the University of Stirling.
DR FANIS TSOLIGKAS, UNIVERSITY OF BATHFanis is a lecturer in accounting at the University of Bath. His main research interests lie in the fields of financial reporting discretion and the adoption of International Financial Reporting Standards. They also include the capital market effects of accounting information and the effect of trading behaviour of corporate executives and directors. Prior to joining academia, Fanis practised accountancy in Greece.
About the authors

References
Aboody, D. and Lev, B. (1998), ‘The Value Relevance of Intangibles: The Case of Software Capitalization’, Journal of Accounting Research, 36: 161–91.
ACCA (2014), Prudence and IFRS. Downloadable from: <https://www.accaglobal.com/content/dam/acca/global/PDF-technical/financial-reporting/tech-tp-prudence.pdf>, accessed 7 November 2018.
Ahmed, K. and Falk, H. (2006), ‘The Value Relevance of Management’s Research and Development Reporting Choice: Evidence from Australia’, Journal of Accounting and Public Policy, 25 (3): 231–64.
Armitage, S. and Marston, C. (2008), ‘Corporate Disclosure, Cost of Capital and Reputation: Evidence from Finance Directors’, British Accounting Review, 40 (4), 314–36.
Ball, R., Thomas, R.E. and McGrath, J. (1991), ‘Influence of R&D Accounting Conventions on Internal Decision-making of Companies’, R&D Management, 21 (4): 261–69.
Beasley, M. S., Carcello, J. V., Hermanson, D. R. and Neal, T. L. (2009), ‘The Audit Committee Oversight Process’, Contemporary Accounting Research, 26(1): 65–122.
Bence, D., Hapeshi, K. and Hussey, R. (1995), Examining Investment Information Sources for Sophisticated Investors Using Cluster Analysis’, Accounting and Business Research, 26 (1), 19–26.
Bernanke, B.S. (2011), ‘Promoting Research and Development: The Government’s Role’. Speech given at the conference on ‘New Building Blocks for Jobs and Economic Growth’, Washington, D.C., 16 May. Downloadable from: <https://www.federalreserve.gov/newsevents/speech/bernanke20110516a.htm>, accessed 7 November 2018.
Billiot, M. J. and Glandon, S. (2005), ‘The Impact of Undisclosed Intangible Assets on Firm Value’, Journal of Accounting and Finance Research, 13 (2): 67–78.
Boyatzis, R.E. (1998), Transforming Qualitative Information: Thematic Analysis and Code Development (Thousand Oaks, London, & New Delhi, SAGE Publications).
Buchanan, D., Boddy, D. and McCalman, J. (1988), ‘Getting In, Getting On, Getting Out, and Getting Back’, in Bryman, A. (ed.), Doing Research in Organizations (London, U.K.: Routledge).
Campbell, D.J. and Slack, R.E. (2011), ‘Environmental Disclosure and Environmental Risk: Sceptical Attitudes of UK Sell-side Bank Analysts’, British Accounting Review, 43 (1): 53–64.
Cazavan-Jeny, A., Jeanjean, T. and Joos, P. (2011), ‘Accounting Choice and Future Performance: The Case of R&D Accounting in France’, Journal of Accounting and Public Policy, 30 (2): 145–65.
Chen, E., Gavious, I. and Lev, B. (2017), ‘The Positive Externalities of IFRS R&D Capitalization: Enhanced Voluntary Disclosure’, Review of Accounting Studies, 22 (2): 677–714.
Cheng, J. C., Lu, C. C. and Kuo, N. T. (2016), ‘R&D Capitalization and Audit Fees: Evidence from China’, Advances in Accounting, 35: 39–48.
Ciftci, M. (2010), ‘Accounting Choice and Earnings Quality: The Case of Software Development’, European Accounting Review, 19 (3): 429–59.
Dinh, T., Eierle, B., Schultze, W. and Steeger, L. (2015), ‘Research and Development, Uncertainty, and Analysts’ Forecasts: The Case of IAS 38’, Journal of International Financial Management & Accounting, 26 (3): 257–93.
Easterby-Smith, M., Thorpe, R. and Lowe, A. (1991), Introduction to Management Research, (London, U.K.: Sage).
50
Entwistle, G. M. (1999), ‘Exploring the R&D Disclosure Environment’, Accounting Horizons, 13 (4), 353–85.
EFRAG, 2018, ‘Feedback Statement – Research Agenda Consultation’, Downloadable from: <https://www.efrag.org/News/Project-324/Feedback-Statement---2018-EFRAG-Research-Agenda-Consultation>, accessed 21 November 2018.
FASB (2018), ‘Disclosure Review – Intangibles, Share-based Payment, and Foreign Currency (last updated on November 14, 2017)’, Downloadable from: <https://www.fasb.org/cs/ContentServer?c=FASBContent_C&cid=117616943 3424&d=&pagename=FASB%2FFASBContent_C%2FProjectUpdatePage#DR _Intangibles>, accessed 7 November 2018.
Franzen, L. A., Rodgers, K. J. and Simin, T. T. (2007), ‘Measuring Distress Risk: The Effect of R&D Intensity’, The Journal of Finance, 62 (6), 2931–67.
FRC (2018), ‘Intangibles: How Can Business Reporting Do Better?’, Downloadable from: <https://www.frc.org.uk/accountants/accounting-and-reporting-policy/research/intangibles-how-can-business-reporting-do-better>, accessed 21 November 2018.
García Lara, J.M., Garcia Osma, B. and Mora, A. (2005). The Effect of Earnings Management on the Asymmetric Timeliness of Earnings. Journal of Business Finance and Accounting, 32(3‐4), 691–726.
Goodacre, A. and McGrath, J. (1997), ‘An Experimental Study of Analysts’ Reactions to Corporate R&D Expenditure’, The British Accounting Review, 29 (2), 155–79.
Grant Thornton (2013). Intangible assets in a business combination. Identifying and valuing intangibles under IFRS 3. Downloadable from: <https://www.grantthornton.global/en/insights/articles/Valuing-intangibles-under-IFRS3/>.
Green, J.P., Stark, A.W. and Thomas, H.M. (1996), ‘UK Evidence on the Market Valuation of Research and Development Expenditures’, Journal of Business Finance and Accounting, 23 (2), March: 191–216.
Guo, R., Lev, B. and Zhou, N. (2004), ‘Competitive Costs of Disclosure by Biotech IPOs’, Journal of Accounting Research, 42 (2): 319–55.
Haskel, J., and Westlake, S. (2017), Capitalism without Capital: The Rise of the Intangible Economy (Princeton: Princeton University Press)
Healy, P. M. and Palepu, K. G. (2001), ‘Information Asymmetry, Corporate Disclosure, and the Capital Markets: A Review of the Empirical Disclosure Literature’, Journal of Accounting and Economics, 31 (1–3): 405–40.
IFRS (2018a), Conceptual Framework for Financial Reporting (London: IFRS Foundation).
IFRS (2018b), Use of IFRS Standards Around the World, Downloadable from: <http://www.ifrs.org/use-around-the-world/use-of-ifrs-standards-by-jurisdiction/>, accessed 22 November 2018
Jeny, A. and Moldovan, R. (2018), Recognition and Disclosure of Intangible Assets – A Meta Analysis Review, Working paper. Downloadable from: <http://dx.doi.org/10.2139/ssrn.3120397>, accessed 7 November 2018.
Jones, D. A. (2007), ‘Voluntary Disclosure in R&D-intensive Industries’, Contemporary Accounting Research, 24 (2): 489–522.
Kothari, S. P., Leone, A. J. and Wasley, C. E. (2005), ‘Performance Matched Discretionary Accrual Measures’, Journal of Accounting and Economics, 39 (1): 163–97.
Kreß, A., Eierle, B. and Tsalavoutas, I. (2019) Development costs capitalization and debt financing. Forthcoming in Journal of Business Finance and Accounting, <https://doi.org/10.1111/jbfa.12370>.

La Rosa, F. and Liberatore, G. (2014), ‘Biopharmaceutical and Chemical Firms’ R&D Disclosure, and Cost of Equity: The Impact of the Regulatory Regime’, European Management Journal, 32 (5): 806–20.
Lev, B. (2018a), ‘The Deteriorating Usefulness of Financial Report Information and How to Reverse It’, Accounting and Business Research, 48 (5): 465–93.
Lev, B. (2018b), Intangibles, Working paper, New York University. Downloadable from: <https://ssrn.com/abstract=3218586>, accessed 7 November 2018.
Lev, B. and Gu, F. (2016), The End of Accounting and the Path Forward for Investors and Managers (New Jersey: John Wiley & Sons).
Lev, B., Sarath, B. and Sougiannis, T. (2005), ‘R&D Reporting Biases and their Consequences’, Contemporary Accounting Research, 22 (4): 977–1026.
Liang, C. J. and Yao, M. L. (2005), ‘The Value-relevance of Financial and Nonfinancial Information—Evidence from Taiwan’s Information Electronics Industry’, Review of Quantitative Finance and Accounting, 24 (2): 135–75.
Maijoor, S. (2015), ‘Ref: the IASB’s Request for Views: 2015 Agenda Consultation’. Letter to H. Hoogervorst, IASB, 1 December, Downloadable from: <https://www.esma.europa.eu/sites/default/files/library/2015-1740_-_esma_cl_to_the_iasb_agenda_consultation.pdf>, accessed 7 November 2018.
Markarian, G., Pozza, L. and Prencipe, A. (2008), ‘Capitalization of R&D Costs and Earnings Management: Evidence from Italian Listed Companies’, The International Journal of Accounting, 43 (3): 246–67.
Mazzi, F. Slack, R. and Tsalavoutas, I. (2018). The Effect of Corruption and Culture on Mandatory Disclosure Compliance Levels: Goodwill Reporting in Europe, Journal of International Accounting, Auditing and Taxation, 31, 52–73.
Merkley, K. (2014), ‘Narrative Disclosure and Earnings Performance: Evidence from R&D Disclosures’, The Accounting Review, 89 (2): 725–57.
Miles, M.B. and Huberman, A.M. (1994), Qualitative Data Analysis (California, Sage Publications).
Nekhili, M., Hussainey, K., Cheffi, W., Chtioui, T. and Tchakoute-Tchuigoua, H. (2016), ‘R&D Narrative Disclosure, Corporate Governance and Market Value: Evidence from France’, Journal of Applied Business Research, 32 (1): 111.
Nixon, B. (1997), ‘The Accounting Treatment of Research and Development Expenditure: Views of UK Company Accountants’, European Accounting Review, 6 (2): 265–77.
Ohlson, J. (2006), ‘A Practical Model of Earnings Measurement’, The Accounting Review, 81: 271–9.
Oswald, D. R. (2008), ‘The Determinants and Value Relevance of the Choice of Accounting for Research and Development Expenditures in the United Kingdom’, Journal of Business Finance & Accounting, 35 (1 & 2): 1–24.
Oswald, D., Simpson, A.V. and Zarowin, P. (2017), ‘The Information Benefits of R&D Capitalization’, Working paper, New York University. Downloadable from SSRN: <https://ssrn.com/abstract=2952388>, accessed 7 November 2018.
Oswald, D. R. and Zarowin P. (2007), ‘Capitalization of R&D and the Informativeness of Stock Prices’, European Accounting Review, 16 (4), 703–26.
Penman, S. H. (2009), ‘Accounting for Intangible Assets: There is also an Income Statement’, Abacus, 45 (3): 358–71.
Pettigrew, A.M. (1992), ‘On Studying Managerial Elites’, Strategic Management Journal, 13 (S2), 163–82.
Potter, J. and Wetherell, M. (1987), Discourse and Social Psychology: Beyond Attitudes and Behaviour (Sage).
PricewaterhouseCoopers, (2008). IFRS 3 (Revised): Impact on earnings. The crucial Q&A for decision-makers. Downloadable from: <https://www.pwc.com/gx/en/ifrs-reporting/pdf/ifrs3r.pdf>.
Roberts, J., Sanderson, P., Barker, R. and Hendry, J. (2006), ‘In the Mirror of the Market: The Disciplinary Effects of Company/Fund Manager Meetings’, Accounting, Organizations and Society, 31 (3): 277–94.
Shah, S. A. Z., Liang, S. and Akbar, S. (2013), ‘International Financial Reporting Standards and the Value Relevance of R&D Expenditures: Pre and post IFRS Analysis’, International Review of Financial Analysis, 30: 158–69.
Skinner, D. J. (2008), ‘Accounting for Intangibles – A Critical Review of Policy Recommendations’, Accounting & Business Research, 38 (3), 191–204
Slack, R., and Tsalavoutas, I. (2018), ‘Integrated Reporting Decision Usefulness: Mainstream Equity Market Views’, Accounting Forum, 42 (2), 184–98.
Solomon, J.F., Solomon, A., Norton, S.D. and Joseph, N.L. (2011), ‘Private Climate Change Reporting: An Emerging Discourse of Risk and Opportunity?’ Accounting, Auditing & Accountability Journal, 24 (8), 1119–48.
Stark, A.W. (2008), ‘Intangibles and Research – an Overview with a Specific Focus on the UK’, Accounting and Business Research, Special Issue: International Accounting Policy Forum, 38 (3), 275-285
Stoner, G. and Holland, J. (2004) ‘Using case studies in finance research’. In: Humphrey, C. and Lee, B. (eds.) The Real Life Guide to Accounting Research: A Behind-the-Scenes View of Using Qualitative Research Methods. Elsevier: Amsterdam, The Netherlands, pp. 37-56. ISBN 9780080439723
Stubbs, W. and Higgins, C. (2015), ‘Stakeholders’ Perspectives on the Role of Regulatory Reform in Integrated Reporting’, Journal of Business Ethics, 147 (3), 489–508.
Stubbs, W., Higgins, C. and Milne, M. (2016), An Exploration of the Information Needs of Selected Stakeholders of Integrated Reporting. Report prepared for CPA Australia <https://www.cpaaustralia.com.au/~/media/corporate/allfiles/document/professional-resources/sustainability/report-exploration-stakeholder-needs-integrated-reporting.pdf>, accessed 8 November 2018.
Srivastava, A. (2014), ‘Why Have Measures of Earnings Quality Changed Over Time?’ Journal of Accounting and Economics, 57, 196–217.
Tsoligkas, F. and Tsalavoutas, I. (2011), ‘Value Relevance of R&D in the UK after IFRS Mandatory Implementation’, Applied Financial Economics, 21 (13): 957–67.
Tutticci, I., Krishnan, G. and Percy, M. (2007), ‘The role of external monitoring in firm valuation: The case of R&D capitalization’, Journal of International Accounting Research, 6 (2): 83–107.
Verrecchia, R. E. (1983), ‘Discretionary Disclosure’, Journal of Accounting and Economics, 5: 179–94.
Watts, R. L. and Zimmerman, J. L. (1986), Positive Accounting Theory (Englewood Cliffs, NJ: Prentice-Hall).
Wyatt, A. (2008), ‘What Financial and Non-Financial Information on Intangibles is Value-Relevant? A Review of the Evidence’, Accounting and Business Research, 38 (3): 217–56.
Zéghal, D. and Maaloul, A. (2011), ‘The Accounting Treatment of Intangibles – A Critical Review of the Literature’, Accounting Forum, 35 (4): 262–74.
The capitalisation debate: R&D expenditure, disclosure content and quantity, and stakeholder views | References
51
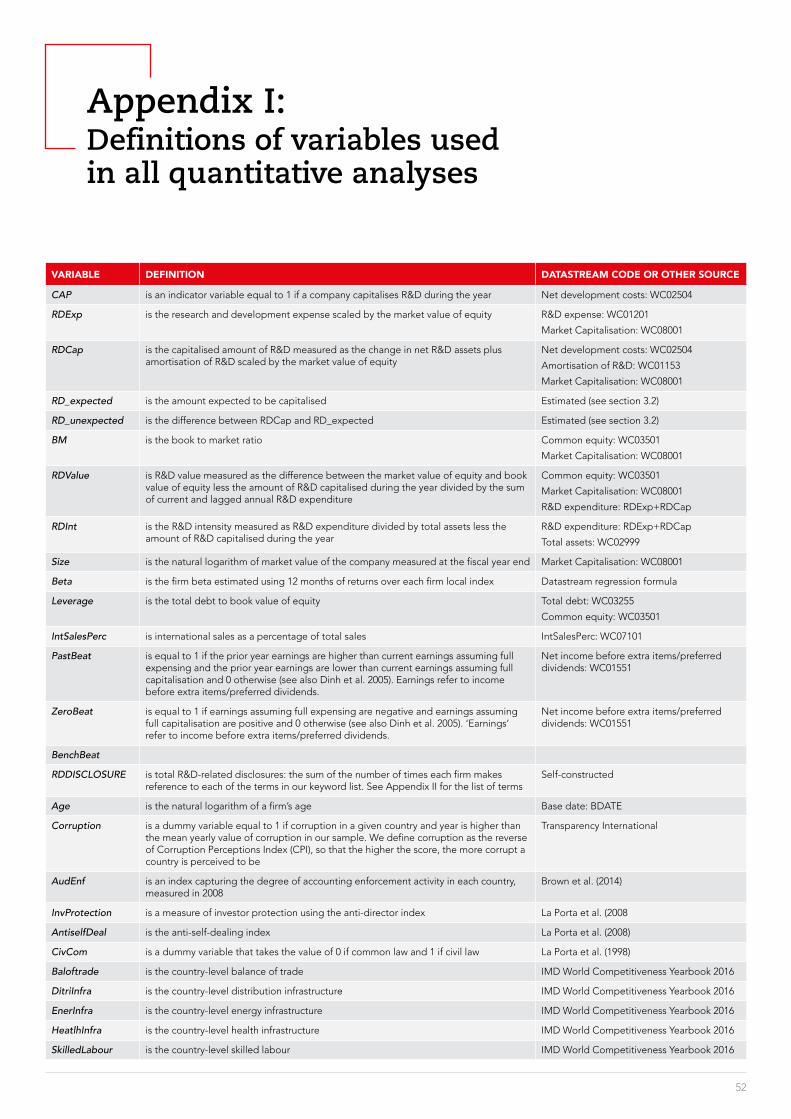
VARIABLE DEFINITION DATASTREAM CODE OR OTHER SOURCE
CAP is an indicator variable equal to 1 if a company capitalises R&D during the year Net development costs: WC02504
RDExp is the research and development expense scaled by the market value of equity R&D expense: WC01201
Market Capitalisation: WC08001
RDCap is the capitalised amount of R&D measured as the change in net R&D assets plus amortisation of R&D scaled by the market value of equity
Net development costs: WC02504
Amortisation of R&D: WC01153
Market Capitalisation: WC08001
RD_expected is the amount expected to be capitalised Estimated (see section 3.2)
RD_unexpected is the difference between RDCap and RD_expected Estimated (see section 3.2)
BM is the book to market ratio Common equity: WC03501
Market Capitalisation: WC08001
RDValue is R&D value measured as the difference between the market value of equity and book value of equity less the amount of R&D capitalised during the year divided by the sum of current and lagged annual R&D expenditure
Common equity: WC03501
Market Capitalisation: WC08001
R&D expenditure: RDExp+RDCap
RDInt is the R&D intensity measured as R&D expenditure divided by total assets less the amount of R&D capitalised during the year
R&D expenditure: RDExp+RDCap
Total assets: WC02999
Size is the natural logarithm of market value of the company measured at the fiscal year end Market Capitalisation: WC08001
Beta is the firm beta estimated using 12 months of returns over each firm local index Datastream regression formula
Leverage is the total debt to book value of equity Total debt: WC03255
Common equity: WC03501
IntSalesPerc is international sales as a percentage of total sales IntSalesPerc: WC07101
PastBeat is equal to 1 if the prior year earnings are higher than current earnings assuming full expensing and the prior year earnings are lower than current earnings assuming full capitalisation and 0 otherwise (see also Dinh et al. 2005). Earnings refer to income before extra items/preferred dividends.
Net income before extra items/preferred dividends: WC01551
ZeroBeat is equal to 1 if earnings assuming full expensing are negative and earnings assuming full capitalisation are positive and 0 otherwise (see also Dinh et al. 2005). ‘Earnings’ refer to income before extra items/preferred dividends.
Net income before extra items/preferred dividends: WC01551
BenchBeat
RDDISCLOSURE is total R&D-related disclosures: the sum of the number of times each firm makes reference to each of the terms in our keyword list. See Appendix II for the list of terms
Self-constructed
Age is the natural logarithm of a firm’s age Base date: BDATE
Corruption is a dummy variable equal to 1 if corruption in a given country and year is higher than the mean yearly value of corruption in our sample. We define corruption as the reverse of Corruption Perceptions Index (CPI), so that the higher the score, the more corrupt a country is perceived to be
Transparency International
AudEnf is an index capturing the degree of accounting enforcement activity in each country, measured in 2008
Brown et al. (2014)
InvProtection is a measure of investor protection using the anti-director index La Porta et al. (2008
AntiselfDeal is the anti-self-dealing index La Porta et al. (2008)
CivCom is a dummy variable that takes the value of 0 if common law and 1 if civil law La Porta et al. (1998)
Baloftrade is the country-level balance of trade IMD World Competitiveness Yearbook 2016
DitriInfra is the country-level distribution infrastructure IMD World Competitiveness Yearbook 2016
EnerInfra is the country-level energy infrastructure IMD World Competitiveness Yearbook 2016
HeatlhInfra is the country-level health infrastructure IMD World Competitiveness Yearbook 2016
SkilledLabour is the country-level skilled labour IMD World Competitiveness Yearbook 2016
52
Appendix I:Definitions of variables used in all quantitative analyses

ability to sell development of new process patent registration research facilities
ability to use development of new products patent was awarded research facility
announced a collaboration development of proprietary technology
patents awarded research initiative
application pending development phase patents granted research operations
applications pending device development patents pending research phase
applied for patent drug candidate patents received research pipeline
applied research entering development pilot studies research programme
availability of financial resources established a collaboration pilot study research project
awarded patents evaluating the potential of planned investigation research unit
basic research existence of a market planned trial research venture
breakthrough in existing alliance platform development research, development
breakthrough innovation filed patent possible alliance research, engineering, and development
claims in this patent granted a patent preclinical data safety studies
clinical candidate important patent preclinical development safety study
clinical data in-process development process development service development
clinical development in-process research product candidate software development
clinical programme intellectual capital product development technical development
clinical studies intention to complete product engineering technical feasibility
clinical study internally generated projects in development technological breakthrough
clinical trial issued a patent prototype technology acquisition
collaborative initiative issued patents R&D technology breakthrough
collaborative research joint research received a patent technology development
completion of key milestones joint venture to develop received patents technology milestone
conduct research key patent research and development test data
continuing development of new knowledge research and evaluation project testing phase
develop technology new patent research and product development trial results
developing new process new project research centre
developing new products new technologies research collaboration
developing new technologies new technology research collaborative
developing new technology patent pending research development
* Keywords in red fonts are the keywords we added to the list used by Merkley (2014).
53
Appendix II:List of R&D key terms used in Phase 2 of the project

There has been a growing disparity between book values and market values, part of this can be attributed to accounting for development costs. But is accounting for R&D relevant to investors and what signals do expensed or capitalised costs send to the capital market?
Under IAS 38 while research costs are expensed, development costs must be capitalised. Such capitalisation of development costs is, however, dependent on the costs meeting six conditions specified in the standard. Thus, the capitalisation of development costs is not a managerial choice. Nevertheless, from the financial statements’ preparers’ point of view, significant managerial judgement and detailed evaluations are required by preparers and auditors for their assurance so as to conclude whether these conditions have been met or not. In contrast, in the US all costs are expensed which provides no room for potential earnings management or benchmark-beating behaviour.
Three main themes will be discussed within the interview.
1. Why is R&D important; the relevance of R&D accounting compared with R&D spend; and does capitalisation send a signal to stakeholders?
2. The accounting treatment of R&D; prudence versus faithful representation and the recognition of R&D assets; preparer and auditor views on expensing and the assurance of capitalisation; comparison to US GAAP.
3. Disclosure; views on minimal mandatory disclosure requirements; R&D voluntary disclosure usefulness; trade-off between disclosure and proprietary information.
54
Appendix III:Project overview and issues for the interviewees to consider

NON FULL CAPITALISERS (5,626) FULL CAPITALISERS (2,103) COMPARISON
Mean St. Dev. Min Median Max Mean St. Dev. Min Median Max T-testMann-
Whitney test
RDExp 0.051 0.075 0.000 0.022 0.393 0.000 0.000 0.000 0.000 0.000 0.051*** 0.022***
RDCap 0.023 0.040 0.000 0.007 0.188 0.023 0.040 0.000 0.007 0.188 0.000*** 0.000***
BM 0.721 0.682 0.049 0.517 4.302 0.889 0.840 0.049 0.622 4.302 –0.168*** –0.106***
RDValue 28.829 135.491 –706.516 5.651 3170.823 162.459 622.026 –706.516 13.667 3170.823 –133.630*** –8.016***
RDInt 0.063 0.080 0.000 0.033 0.471 0.022 0.056 0.000 0.005 0.471 0.041*** 0.029***
RDInt(sales) 0.158 0.721 0.000 0.044 8.289 0.128 0.832 0.000 0.006 8.289 0.030*** 0.039***
Size 14.363 3.260 6.073 14.296 26.159 13.120 3.085 5.628 12.715 24.806 1.242*** 1.581***
Beta 0.919 0.897 –1.710 0.895 3.770 0.833 0.965 –1.710 0.770 3.770 0.086*** 0.125***
Leverage 0.659 0.929 0.000 0.368 6.207 0.841 1.226 0.000 0.473 6.207 –0.182*** –0.105***
IntSalesPerc 48.478 34.969 0.000 50.195 100.000 40.340 33.914 0.000 37.150 100.000 8.138*** 13.045***
PastBeat 0.333 0.471 0.000 0.000 1.000 0.119 0.324 0.000 0.000 1.000 0.215*** 0.000***
ZeroBeat 0.153 0.360 0.000 0.000 1.000 0.080 0.271 0.000 0.000 1.000 0.073*** 0.000***
BenchBeat 0.403 0.490 0.000 0.000 1.000 0.171 0.376 0.000 0.000 1.000 0.232*** 0.000***
Age 15.355 10.983 1.000 13.000 52.000 14.102 9.093 1.000 12.000 51.000 1.254*** 1.000**
AudEnf 41.801 9.716 9.000 44.000 54.000 42.884 10.367 9.000 45.000 54.000 –1.084*** –1.000***
InvProtection 3.576 1.345 1.000 3.500 5.000 3.808 1.147 1.000 4.000 5.000 –0.232*** –0.500***
AntiselfDeal 0.595 0.258 0.172 0.469 1.000 0.580 0.248 0.172 0.469 1.000 0.015*** 0.000***
CivCom 0.696 0.460 0.000 1.000 1.000 0.636 0.481 0.000 1.000 1.000 0.061*** 0.000***
Corruption 0.999 0.027 0.000 1.000 1.000 0.636 0.481 0.000 1.000 1.000 0.364 0.000
Baloftrade –0.228 6.578 –31.277 1.865 25.400 –0.938 5.918 –31.277 –0.535 25.400 0.709*** 2.399***
DitriInfra 7.888 0.991 2.911 7.944 9.565 7.481 1.394 2.840 7.774 9.565 0.407*** 0.170***
EnerInfra 6.973 1.210 0.679 6.895 9.434 6.640 1.461 0.679 6.400 9.434 0.333*** 0.495***
HeatlhInfra 6.567 1.584 1.510 7.029 9.529 6.516 1.615 1.510 6.778 9.529 0.051 0.251**
SkilledLabour 5.790 0.781 1.877 5.780 8.275 5.704 0.929 1.877 5.781 7.925 0.085*** –0.001
55
Appendix IV:Descriptive statistics of full capitalisers and non full capitalisers

EXPENSERS CAPITALISERS
N Mean Median Min Max N Mean Median Min Max
PANEL A: FINANCIAL STATEMENTS (ONLY)
Basic Materials 315 6 5 1 25 53 8 5 1 57
Consumer Goods 418 6 5 1 94 162 9 7 1 32
Consumer Service 82 6 6 1 17 88 8 5 1 42
Financials 55 6 6 2 15 48 6 4.5 1 19
Health Care 297 19 15 1 112 182 14 9.5 1 92
Industrials 481 7 5 1 74 391 9 6 1 73
Technology 294 11 9 1 73 320 10 9 1 61
Telecommunication 99 10 6 1 45 26 14 9.5 2 47
Utilities 66 7 6.5 1 22 25 9 4 1 105
PANEL B: NARRATIVES (ONLY)
Basic Materials 298 14 8 1 120 56 12 6 1 67
Consumer Goods 379 11 6 1 99 146 19 12.5 1 95
Consumer Service 73 8 7 1 31 73 4 3 1 16
Financials 46 11 8 1 34 35 5 3 1 34
Health Care 294 32 22 1 230 176 22 18 1 150
Industrials 455 11 7 1 72 362 17 10 1 86
Technology 284 15 10 1 103 306 13 9 1 95
Telecommunication 90 12 7 1 85 20 11 6.5 1 39
Utilities 59 17 7 1 144 19 13 8 1 91
PANEL C: ANNUAL REPORT
Basic Materials 277 21 15 2 133 47 22 15 2 97
Consumer Goods 371 18 12 2 137 139 27 22 2 106
Consumer Service 71 15 13 2 48 62 11 9 2 32
Financials 42 16 13 4 47 28 10 7 3 50
Health Care 288 51 40 3 287 172 37 27 4 211
Industrials 437 18 13 2 81 351 26 19 2 151
Technology 278 26 20 2 131 294 23 18 2 120
Telecommunication 88 21 16 2 89 20 24 15 4 59
Utilities 56 25 15 2 153 18 25 13 2 144
Figures in bold highlight notable differences.
56
Appendix V:Detailed frequency analysis of R&D terms across industries, expensers and capitalisers

NAME** YEAR COUNTRY INDUSTRY Frequency of R&D terms in annual report
Frequency of R&D terms in
narratives
Frequency of R&D terms in financial
statements
R&D INTENSITY
TOP QUARTILE BASED ON TOTAL FREQUENCY OF R&D TERMS IN COMPANIES’ ANNUAL REPORTS
Capitalisers Evotex 2007 Germany Health care 109 91 18 0.419
BIOCON 2013 India Health care 151 74 77 0.042
NOKIA 2015 Finland Technology 111 95 16 0.112
Expensers AETERNA ZENTARIS
2014 Canada Health care 158 128 30 0.432
INFINEON TECHNOLOGIES
2014 Germany Technology 117 103 14 0.091
ADIDAS 2012 Germany Consumer Goods
100 93 7 0.012
2ND QUARTILE BASED ON TOTAL FREQUENCY OF R&D TERMS IN COMPANIES’ ANNUAL REPORTS
Capitalisers FIRST SENSOR 2015 Germany Industrials 30 20 10 0.054
AXIS 2015 Sweden Technology 31 16 15 0.346
TELIT COMMS 2013 United Kingdom Technology 28 15 13 0.275
Expensers BEIERSDORF 2015 Germany Consumer 32 26 6 0.027
IMAGINATION TECHNOLOGIES
2014 United Kingdom Technology 28 18 10 0.398
BATM ADVANCED COMMS.
2015 Israel Technology 29 12 17 0.058
3RD QUARTILE BASED ON TOTAL FREQUENCY OF R&D TERMS IN COMPANIES’ ANNUAL REPORTS
Capitalisers OXFORD METRICS 2015 United Kingdom Technology 18 10 8 0.111
ELICA 2015 Italy Consumer Goods
18 4 14 0.026
KRONES 2015 Germany Industrials 18 16 2 0.073
Expensers ESPIAL GROUP 2015 Canada Technology 18 10 8 0.127
CAPLIN POINT LABS.
2015 India Health care 17 9 8 0.026
COMPUTIME GROUP
2015 Hong Kong Industrials 18 9 9 0.004
4TH QUARTILE BASED ON TOTAL FREQUENCY OF R&D TERMS IN COMPANIES’ ANNUAL REPORTS
Capitalisers A2 MILK 2015 New Zealand Health Care 9 5 4 0.025
RICHEMONT 2015 Switzerland Consumer Goods
8 3 5 0.004
ZODIAC AEROSPACE
2009 France Industrials 8 7 1 0.008
Expensers SFS GROUP 2015 Switzerland Industrials 9 5 4 0.014
YOC 2015 Germany Consumer Services
9 7 2 0.103
HORNBY 2015 United Kingdom Consumer Goods
8 6 2 0.038
**Clicking on a company’s name will direct readers to the relevant annual report.
57
Appendix VI:Examples of companies with varying disclosure and R&D intensity levels


PI-INTANGIBLES-R&D
Disclaimer: Though funded by ACCA, this research project was conducted by independent university academics. The findings from this project reflect the views of the participants and are not necessarily those of ACCA or its staff and members.
ACCA The Adelphi 1/11 John Adam Street London WC2N 6AU United Kingdom / +44 (0)20 7059 5000 / www.accaglobal.com