Environmental Disclosure Economic Performance, and ... · “According to the Carbon Disclosure...
70
1 Environmental Performance, Economic Performance, and Environmental Disclosure Peter Clarkson UQ Business School, The University of Queensland Don Trow Visiting Fellow 2012 Prepared for the School of Accounting & Commercial Law Victoria University of Wellington 17 October 2012
Transcript of Environmental Disclosure Economic Performance, and ... · “According to the Carbon Disclosure...

1
Environmental Performance, Economic Performance, and Environmental Disclosure
Peter Clarkson
UQ Business School, The University of QueenslandDon Trow Visiting Fellow 2012
Prepared for the School of Accounting & Commercial Law
Victoria University of Wellington
17 October 2012

Focus – insights provided by the academic literature
regarding the relations among:
- environmental performance
- financial performance
- environmental disclosure
Interested parties (include):
- analysts/fund managers (e.g., „trading rule‟, fundamental value)
- accountants (e.g., GAPP, disclosure)
- management (e.g., strategic plan)
Caution – seemingly “self-serving”
illustrated using my own work „disproportionately‟
2
The investor (e.g., „trading rule) –
To provide the foundation a trading rule, environmental
performance data must:
1. be informative regarding a firm‟s future financial
performance and/or its risk profile
AND
2. not be fully within the public domain
3
Foundation (step #1) –
From a „fundamental‟ perspective, for environmental
factors to have share price implications, the capital markets
must believe that the extent of a firm‟s commitment to the
environment will affect either, or both, its future financial
performance and its risk profile.
Equally, under the assumed objective of „shareholder wealth
maximisation‟, for management to incorporate
environmental factors into their strategic plans, they must
believe that the share market prices these factors.
4
5
The accountant –
Absent a formalised regulatory framework or structure,
answers to the questions such as „what to account for‟, and
„how to account for it‟ (i.e., assets, liabilities, revenues,
expenses) are relatively elusive notions
General „environmental performance‟ studies
→ disclosure issues predominantly
Carbon (GHG) emissions studies
→ disclosure and accounting issues

„Takeaways‟ (in brief) –
Environmental Performance → Valuation
Environmental Performance ↔ Economic Performance
Environmental Performance → Cost of Equity Capital (risk)
Signalling role for Environmental Disclosure
6
7
“While these results do not directly speak to the question of whether
investors can use environmental performance information as the basis
for a trading strategy, they do suggest that analysts would be
negligent if they fail to consider a firm‟s environmental strategy
in the conduct of a fundamental analysis.
Certainly the documented market decrements ascribed to poor
environmental performance firms in highly polluting industries of
approximately 20% reveal the impact of environmental
performance as economically meaningful.
Further, the strong and consistent evidence of a relation between
environmental and financial performance, and between
environmental performance and risk as manifest in cost of equity
capital, indicates that a firm‟s environmental strategy has the
potential to significantly impact firm performance and risk, and
thereby represents an important consideration for a valuation
exercise.”

Baseline („null hypothesis‟) –
Traditional economic theory suggests that firms should meet only the
minimal environmental standards prescribed by law, with „over-
compliance‟ argued to divert financial resources from productive
investments and thereby results in reduced profitability
For example, Milton Friedman has suggested that pollution is a cost
borne by the public and that reducing the public cost amounts to
philanthropy, not profit maximization (1970, New York Times Magazine)
Notwithstanding, studies consistently document considerable
variation in corporate environmental performance, even in
industries where stringent environmental regulations have existed
for decades
8

e.g., Clarkson et al. (2004)
29 „pure play‟ pulp & paper firms
EP = lbs. TRI / $1000 sales
Min 0.019
Median 1.447
Max 14.210
Mean 2.039 (≈ 6.865 million lbs)
Std Dev 1.936
If one believes that, on average, managers act in a rational economic
manner, and that in equilibrium, price = value, then why / how do,
or can, these disparities persist?
9

Practical Foundations – Why should
environmental performance “matter”?
“Positives” value „enhancing‟ production efficiencies / cost reduction
“green goodwill”
increasing rivals costs (best available technology)
“Negatives” „detrimental‟ X exposure to future environmental legislation
X exposure to future remediation expenditures
X “firms‟ reputations and long-term sales can suffer
Symmetrical argument
„Good‟ EP „Poor‟ EP

The Economist - “Why firms go green” (12 Nov 2011)
“Many companies have found that, even with little carbon regulation, some
sorts of green investment make commercial sense. Improved energy
efficiency and waste management are obvious examples. With oil prices
so high, small changes can save a lot of money, which is why companies
that adopted ambitious emissions-reduction targets around the time of
Copenhagen have tended to stiffen, not slacken, them.”
“According to the Carbon Disclosure Project (CDP), …. 59% of emissions-
reducing investments made so far--mostly in energy efficiency or
renewable energy--will pay for themselves within three years.”
“BHP Billiton and Rio Tinto are both investing in renewables. So is Alcoa,
an aluminium producer, which is also attempting to measure its
environmental impacts. This could provide a defense against future
emissions regulations or perhaps help it grab green subsidies.”
11

Herald Sun, 14 Sept. 2011
“Superannuation funds are offloading share in companies
that have high greenhouse gas outputs to help reduce the
impact of the carbon tax on investment returns.”
“Company profits can be dented by the carbon tax,” Trucost
chief executive Richard Mattison said.
“Profitability will be adversely affected by the impact of a
carbon tax for a select number of companies and having
knowledge of that will enable super funds to better manage
their portfolios and returns.”
12

A. General „Environmental Performance –
E(cash flows)
Valuation = PV
Discount rate (risk)
valuation ? EP
future cash flows ? EP
cost of equity capital ? EP
role for disclosure ?

Empirical Studies – ‘stylized’ facts
market value inversely associated with environmental
performance
valuation primitives future CF, COEC
bi-directional relation between environmental
performance and financial performance
evidence on the relation between environmental
performance and cost of equity capital (COEC) mixed
incremental role for environmental disclosures in
explaining market value
→ retrospective (historical) versus prospective (inferred) 14
15
Valuation Relevance –
Hughes (2000) “The value relevance of nonfinancial measures of air pollution in the electric utility industry” (TAR)
Clarkson, Li, Richardson (2004) “The Market Valuation of Environmental Capital Expenditures by Pulp and Paper Companies” (TAR)

Hughes (TAR, 2000)
EP SO2 emissions
coef on EMIT for 1990 = -395.81 (t = -2.64)
16.3% of market capitalization
16
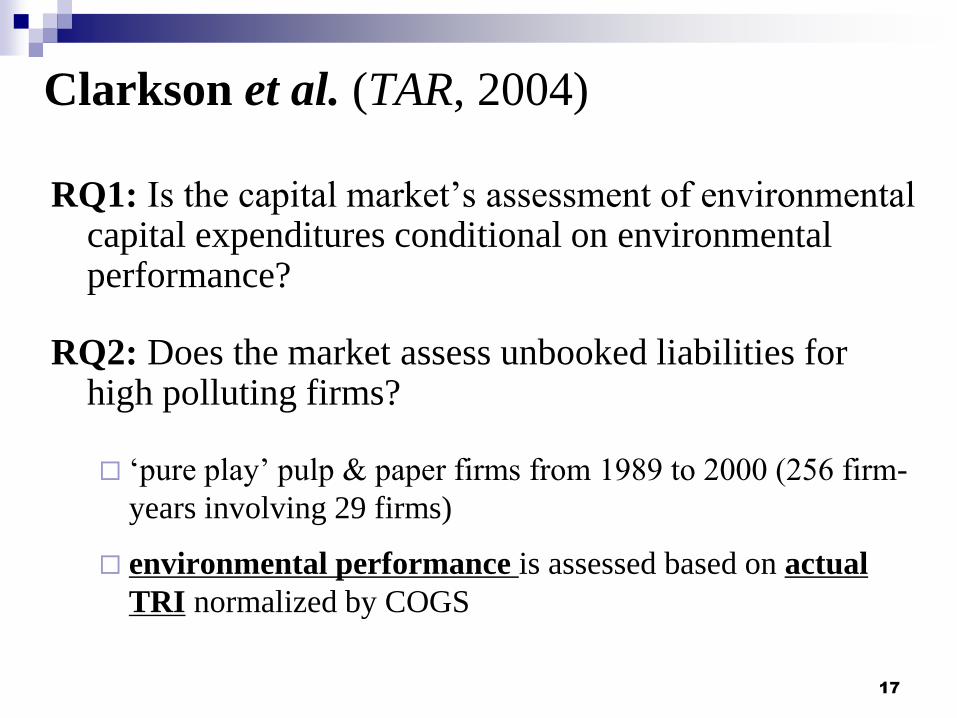
Clarkson et al. (TAR, 2004)
RQ1: Is the capital market‟s assessment of environmental capital expenditures conditional on environmental performance?
RQ2: Does the market assess unbooked liabilities for high polluting firms?
„pure play‟ pulp & paper firms from 1989 to 2000 (256 firm-
years involving 29 firms)
environmental performance is assessed based on actual
TRI normalized by COGS
17

18
Market Valuation Model Estimates
Variable Sign Coef p-value
ECE + 2.706 0.011
ECE*POLLUTE _ -2.227 0.030
NECE + 3.439 < 0.001
NECE*POLLUTE ? -0.543 (0.372)
POLLUTE - -560.441 0.005
Primary Coefficient Tests
3 = 1 p = 0.057 3 + 4 = 0 p = 0.354
(2.706 – 2.227)
POLLUTE = 1 if poor environmental performer, 0 if good
7 = - 560.441 (POLLUTE) → penalty = 16.6% of mkt cap

from a strategic perspective –
For the good EP firms („over-compliers‟)
Reduced latent liability
reduced exposure to litigation?
reduced exposure to remediation costs?
enhanced reputation?
Benefits to environmental capital expenditures
(asset = + NPV vs abatement/compliance expenditure)
green goodwill
cost efficiencies
competitive advantage (raising rivals costs)
appears potentially both performance and risk implications 19

Valuation primitives
numerator
→ expected future cash flows (earnings)
denominator
→ discount rate cost of equity capital
20

Environmental Performance / Financial Performance
Hart and Ahuja (1996)
Environmental Performance → Financial Performance
Change in „emission efficiency‟ from 1988 to 1989 using TRI data
from the IRRC‟s 1993 Corporate Environmental Profile
Focus - subsequent ROS, ROA, ROE
1989 1990 1991 1992
ROS X
ROA X
ROE X
improvements only for the (initially) high polluting firms

22
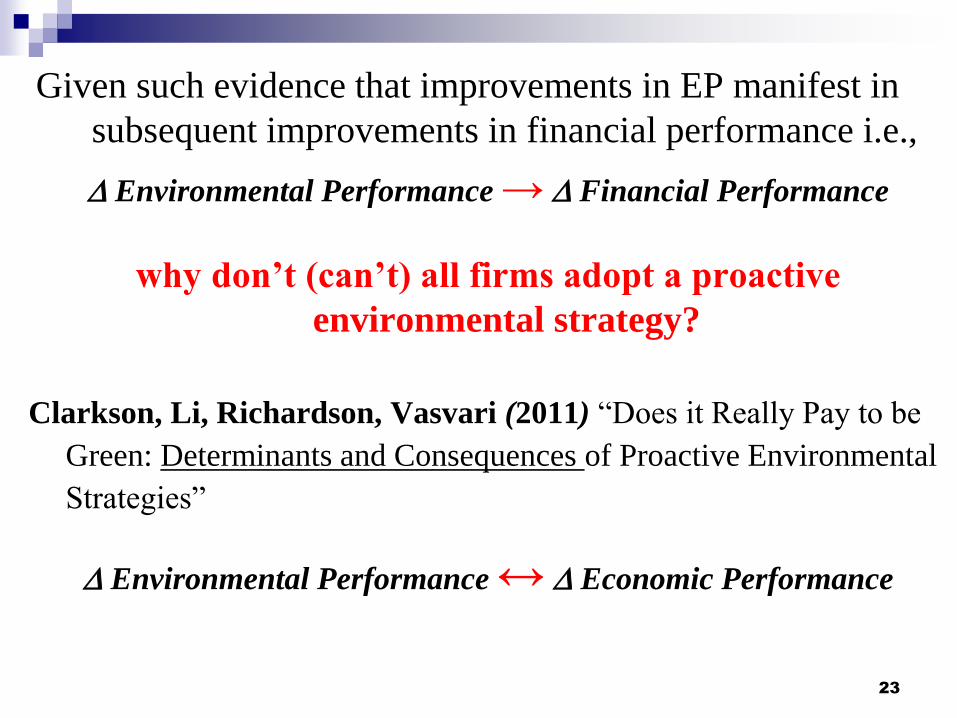
Given such evidence that improvements in EP manifest in
subsequent improvements in financial performance i.e.,
Environmental Performance → Financial Performance
why don‟t (can‟t) all firms adopt a proactive
environmental strategy?
Clarkson, Li, Richardson, Vasvari (2011) “Does it Really Pay to be
Green: Determinants and Consequences of Proactive Environmental
Strategies”
Environmental Performance ↔ Economic Performance
23
24
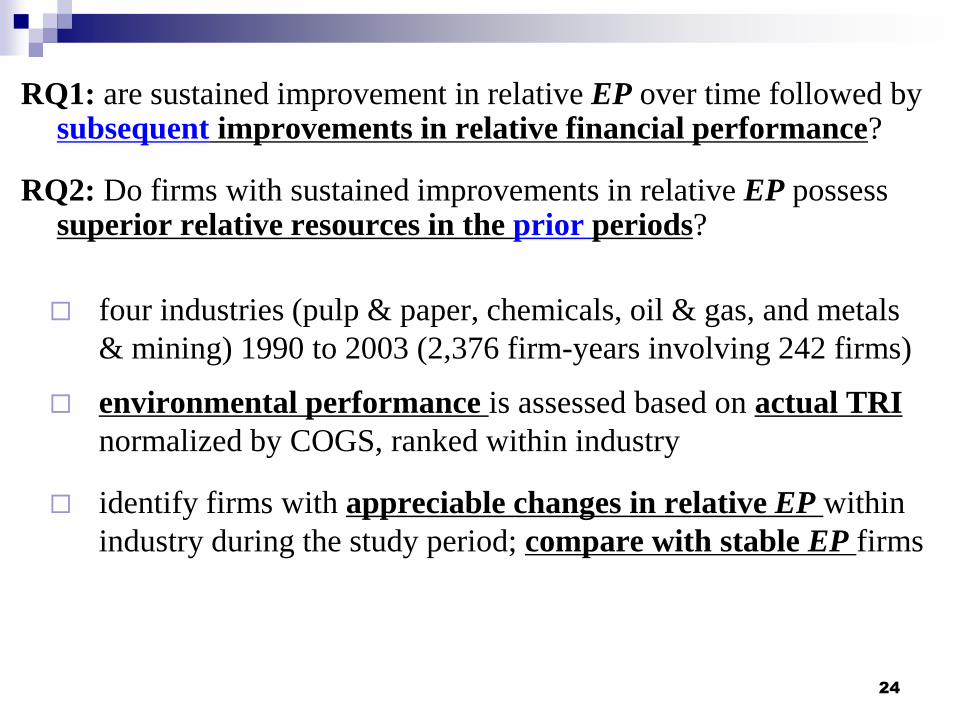
RQ1: are sustained improvement in relative EP over time followed by subsequent improvements in relative financial performance?
RQ2: Do firms with sustained improvements in relative EP possess superior relative resources in the prior periods?
four industries (pulp & paper, chemicals, oil & gas, and metals
& mining) 1990 to 2003 (2,376 firm-years involving 242 firms)
environmental performance is assessed based on actual TRI
normalized by COGS, ranked within industry
identify firms with appreciable changes in relative EP within
industry during the study period; compare with stable EP firms

25
ROA PRO 57.258 62.770 66.116 68.705 70.389 72.408 73.856
SP 51.167 47.314 48.785 49.857 47.260 47.194 46.486
diff (+) 6.091 15.456 17.331 18.848 23.129 25.214 27.370
p-value 0.186 0.018 0.001 0.012 0.008 0.006 0.001
CF diff (+) 12.711 14.410 18.049 22.866 32.685 35.187 37.312
p-value 0.022 0.018 0.003 0.001 < 0.001 < 0.001 < 0.001
Table 3 Panel A: Progressive (PRO) vs Stable Poor (SP) (41 matched pairs)
Measure FY-3 FY-2 FY-1 FY0 FY+1 FY+2
FY+3
Table 3 Panel B: Regressive (RE) versus Stable Good (SG) (23 matched pairs)
ROA RE 41.275 39.824 37.275 36.370 31.783 28.944 28.626
SG 51.267 53.866 52.904 54.234 52.734 52.961 53.491
diff (–) -9.992 -14.042 -15.629 -17.864 -20.951 -24.017 -24.865
p-value 0.060 0.072 0.052 0.040 0.039 0.019 0.004
CF diff (–) -12.025 -14.721 -17.267 -24.940 -28.330 -30.210 -30.759
p-value 0.078 0.053 0.033 0.012 0.007 0.002 < 0.001
26
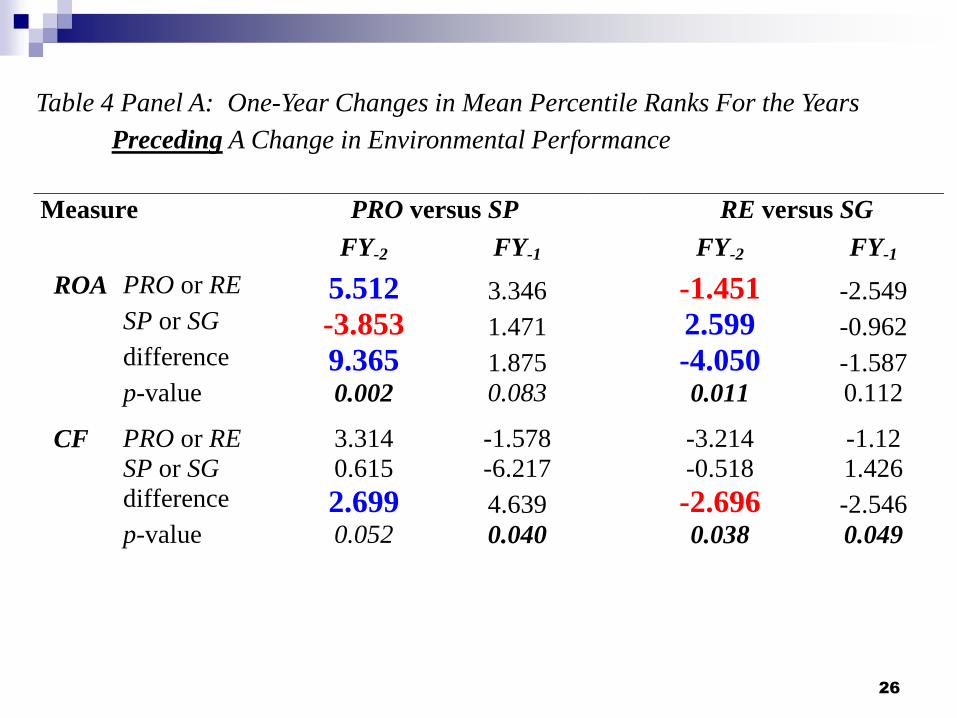
Measure PRO versus SP RE versus SG
FY-2 FY-1 FY-2 FY-1
ROA PRO or RE 5.512 3.346 -1.451 -2.549
SP or SG -3.853 1.471 2.599 -0.962
difference 9.365 1.875 -4.050 -1.587
p-value 0.002 0.083 0.011 0.112
CF PRO or RE 3.314 -1.578 -3.214 -1.12
SP or SG 0.615 -6.217 -0.518 1.426
difference 2.699 4.639 -2.696 -2.546
p-value 0.052 0.040 0.038 0.049
Table 4 Panel A: One-Year Changes in Mean Percentile Ranks For the Years
Preceding A Change in Environmental Performance

Summary –
Although a proactive environmental strategy may be associated with
improved future economic performance (i.e., „„it pays to be
green”), not all firms can mimic such a strategy.
It appears that only firms with sufficient financial resources and
management capabilities can pursue a proactive environmental
strategy.
This finding helps to explain the continued variation in environmental
performance within polluting industries even after three decades of
increasingly stringent US environmental regulations.
27
Implications – policy makers
Acknowledging resource constraints may assist environmental policy
makers in designing more effective pollution abatement policies.
To realize aggregate pollution abatement, effective environmental
policies should provide economic incentives to encourage poor
environmental performers to become „progressive‟ firms, and to
discourage good environmental performers from backsliding into
becoming „regressive‟ firms.
For instance, voluntary environmental programs may be more
effective in industries where resource constraints vary significantly
across firms.
In addition, public recognition of superior environmental performance
may be a strong incentive since it could lead to real economic benefits
in the form of consumer „„green goodwill” in the marketplace. 28
Implications – Accounting Standards
Our research is directly relevant to accounting standards dealing with
valuation and impairment (for example, standards addressing
business combinations and asset impairment).
To the extent that a firm‟s environmental strategy is linked to its
future financial performance, our results suggest that proactive
firms enjoy identifiable intangible assets related to environment
performance and reactive firms face the prospect of negative
future cash flows.
29

Implications – Management Accounting Practice
There is a vast practitioner literature in management accounting
focusing on environmental management systems in which
environmental responsibility generates a major concern because of
the cost magnitude and risk exposure
For instance, Figge et al. (2002) argue that firms must incorporate
environmental and social aspects into the four balanced
scorecard perspectives in order to practice sustainability
management.
A maintained assumption of this literature is that pursing proactive
environmental strategies is worthwhile. However, less than one-
half of surveyed CFOs‟ and top environmental officers believe
environmental performance enhances shareholder value (CICA)
30
Denominator effects → COEC
Relative EP and COEC
Sharman and Fernando (2008)
Connors and Silva-Gao (2009)
significant negative association
(relative EP captures a dimension of firm risk)
clear economic benefits to environmental risk management
“firms that develop a strategy that improves their total risk
management through better environmental risk management are
rewarded by the financial markets for their efforts” (Sharfman & Fernando)
31

Sharman and Fernando (2008)
cost of equity capital – CAPM, Bloomberg
environmental risk management – TRI, KLD
CAPM Bloomberg
32
→ predicted inverse relation between COEC estimates and
environmental risk management measure
curiously, also document a positive relation with cost of debt
(but also carry higher debt and have greater leverage)
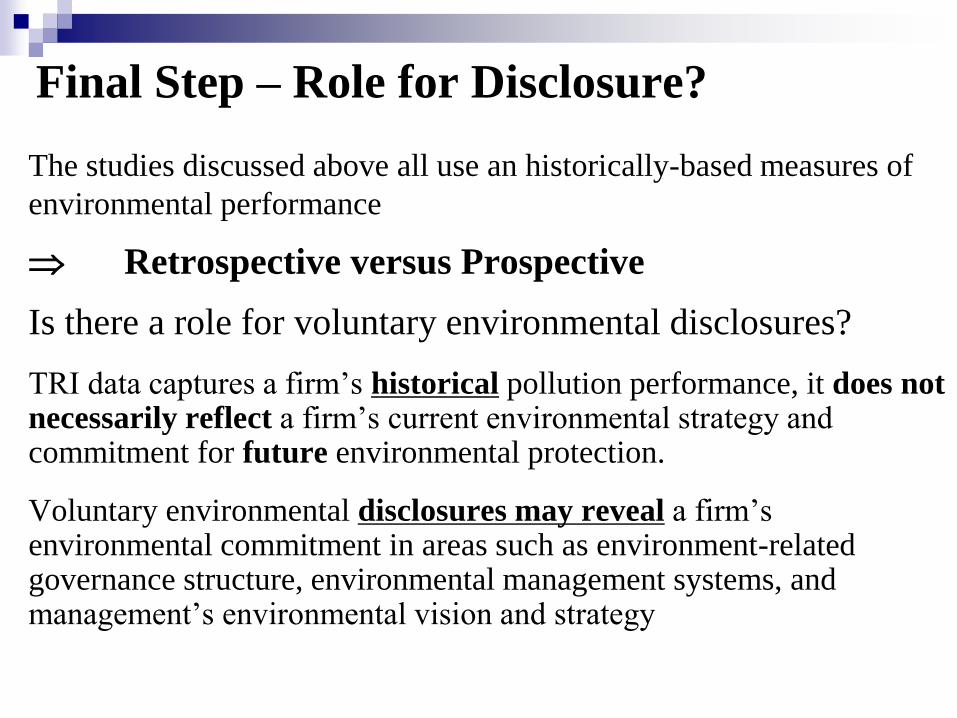
Final Step – Role for Disclosure?
The studies discussed above all use an historically-based measures of
environmental performance
Retrospective versus Prospective
Is there a role for voluntary environmental disclosures?
TRI data captures a firm‟s historical pollution performance, it does not necessarily reflect a firm‟s current environmental strategy and commitment for future environmental protection.
Voluntary environmental disclosures may reveal a firm‟s environmental commitment in areas such as environment-related governance structure, environmental management systems, and management‟s environmental vision and strategy
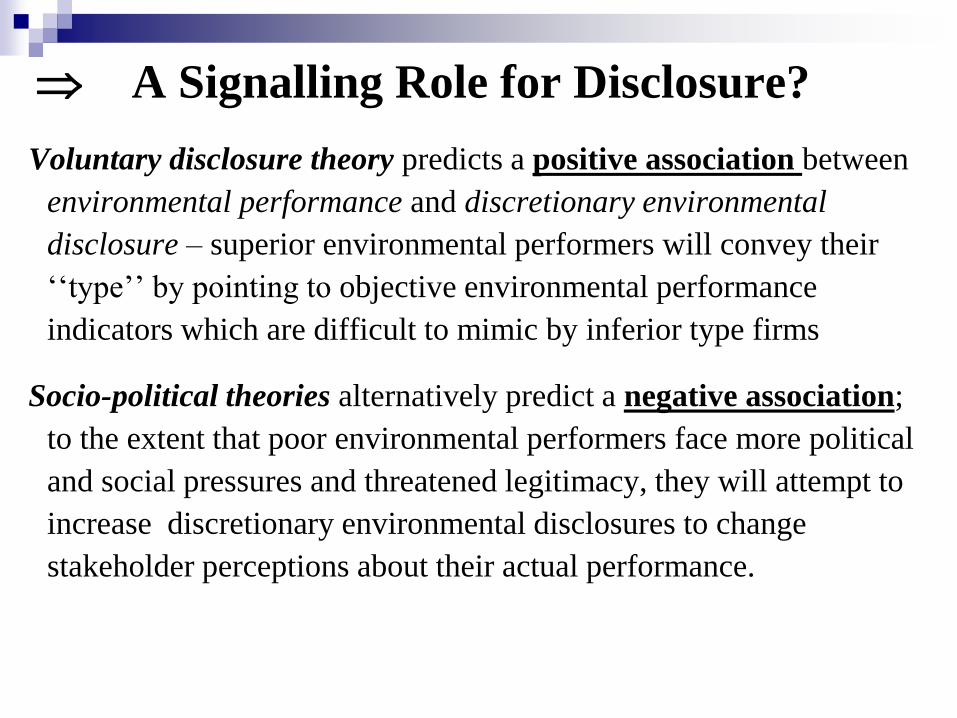
A Signalling Role for Disclosure?
Voluntary disclosure theory predicts a positive association between
environmental performance and discretionary environmental
disclosure – superior environmental performers will convey their
„„type‟‟ by pointing to objective environmental performance
indicators which are difficult to mimic by inferior type firms
Socio-political theories alternatively predict a negative association;
to the extent that poor environmental performers face more political
and social pressures and threatened legitimacy, they will attempt to
increase discretionary environmental disclosures to change
stakeholder perceptions about their actual performance.

35
Clarkson, Li, Richardson, Vasvari (2008) “Revisiting the Relation
between Environmental Performance and Environmental
Disclosure: An Empirical Analysis”
RQ: the relation between environmental performance and environmental disclosure?
191 firms for 2003 with EPA TRI data
the five most polluting industries
environmental disclosure – GRI-based index developed in
conjunction with a GRI steering committee member: 95 items
Hard disclosure items verifiable (79 items)
Soft disclosure items non-verifiable (16 items)
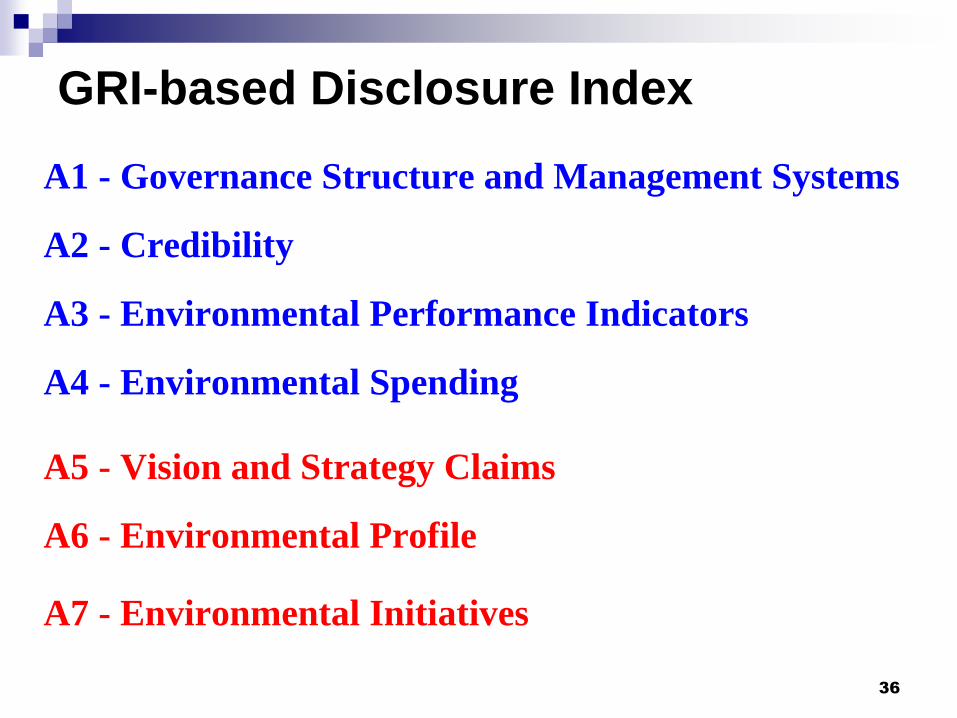
GRI-based Disclosure Index
A1 - Governance Structure and Management Systems
A2 - Credibility
A3 - Environmental Performance Indicators
A4 - Environmental Spending
A5 - Vision and Strategy Claims
A6 - Environmental Profile
A7 - Environmental Initiatives
36

37

38
2006 2003
Disclosure Category
Mapping to GRI
% of firms
attaining item
Mean Score
% of firms
attaining item
Mean Score
A3) Environmental Performance Indicators (EPI) (scale: 0-6) * 68.93**
9.04**
52.17 6.27
1. EPI on energy use and/or energy efficiency EN3,4,17 45.63 1.19 36.95 0.92 1) Performance data is presented 45.63 35.87
2) Performance data is presented relative to peers/rivals or industry 0.97 1.09
3) Performance data is presented relative to previous periods (trend analysis) 34.95 26.09
4) Performance data is presented relative to targets 11.65 7.61
5) Performance data is presented both in absolute and normalized form 10.68 13.04
6) Performance data is presented at disaggregate level (i.e. plant, business
unit, geographic segment).
15.53 8.70
2. EPI on water use and/or water use efficiency EN5,17 24.27 0.65 25.00 0.62 1) Performance data is presented 24.27 25.00
2) Performance data is presented relative to peers/rivals or industry 0.00 1.09
3) Performance data is presented relative to previous periods (trend analysis) 18.45 17.39
4) Performance data is presented relative to targets 6.80 5.43
5) Performance data is presented both in absolute and normalized form 6.80 7.61
6) Performance data is presented at disaggregate level (i.e. plant, business
unit, geographic segment).
8.74 5.43
3. EPI on green-house-gas emissions EN8 52.43***
1.62***
22.83 0.58 1) Performance data is presented 51.46 20.65
2) Performance data is presented relative to peers/rivals or industry 2.91 0.00
3) Performance data is presented relative to previous periods (trend analysis) 46.60 19.57
4) Performance data is presented relative to targets 25.24 9.78
5) Performance data is presented both in absolute and normalized form 14.56 4.35
6) Performance data is presented at disaggregate level (i.e. plant, business
unit, geographic segment).
21.36 3.26

39
40
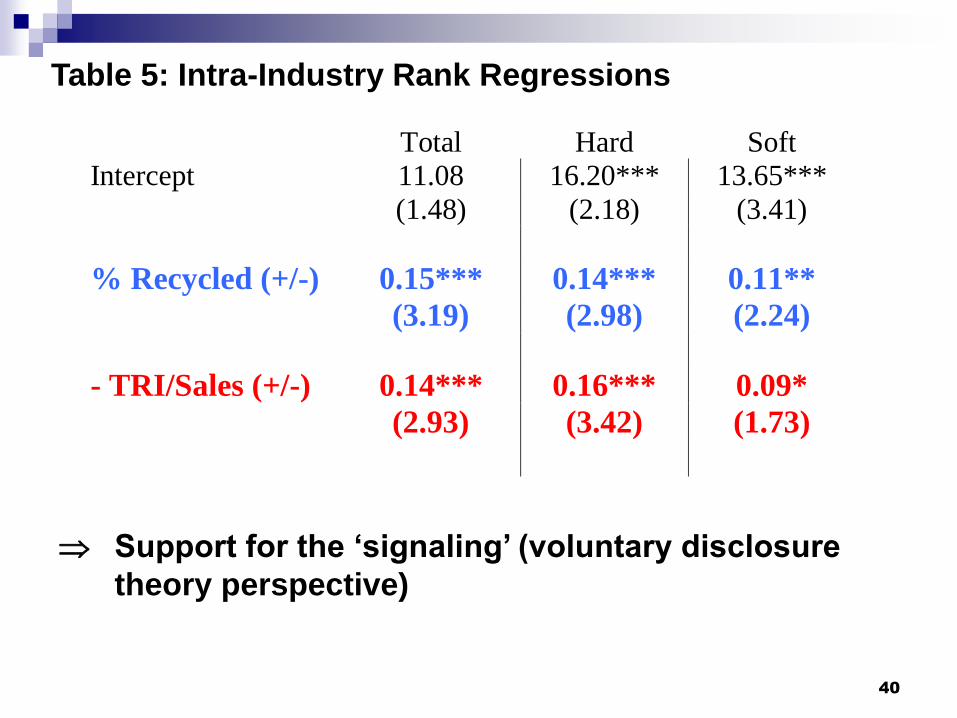
Total Hard Soft
Intercept 11.08 16.20*** 13.65***
(1.48) (2.18) (3.41)
% Recycled (+/-) 0.15*** 0.14*** 0.11**
(3.19) (2.98) (2.24)
- TRI/Sales (+/-) 0.14*** 0.16*** 0.09*
(2.93) (3.42) (1.73)
Table 5: Intra-Industry Rank Regressions
Support for the ‘signaling’ (voluntary disclosure
theory perspective)
41
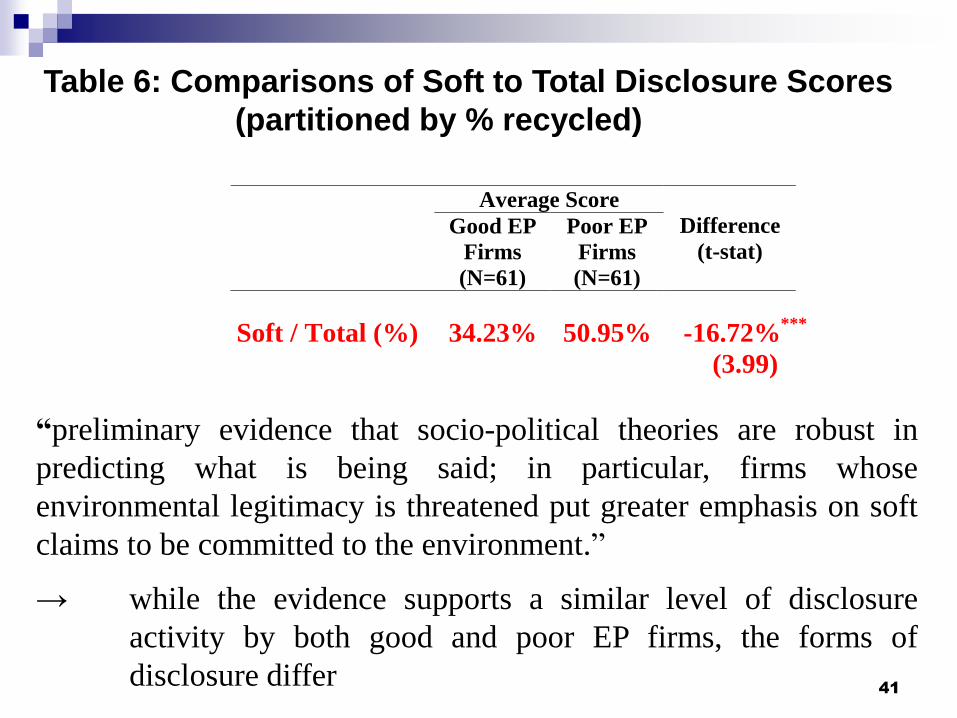
Table 6: Comparisons of Soft to Total Disclosure Scores
(partitioned by % recycled)
Average Score
Good EP
Firms
(N=61)
Poor EP
Firms
(N=61)
Difference
(t-stat)
Soft / Total (%) 34.23% 50.95% -16.72%***
(3.99)
“preliminary evidence that socio-political theories are robust in
predicting what is being said; in particular, firms whose
environmental legitimacy is threatened put greater emphasis on soft
claims to be committed to the environment.”
→ while the evidence supports a similar level of disclosure
activity by both good and poor EP firms, the forms of
disclosure differ

42
Clarkson, Fang, Li, Richardson (2012) “The Relevance of Environmental Disclosures: Are such Disclosures Incrementally Informative?”
RQ: Given knowledge of environmental performance, is voluntary environmental disclosure incrementally „value relevant‟?
“story” – EP data (e.g., TRI) reflect historical environmental performance; they do necessarily communicate a firm‟s environmental strategy going forward
→ potential for firms to use additional disclosures to communicate their future prospects and risks

43
Sample Data
92 firms for 2003 and 103 firms for 2006
5 most polluting industries: Pulp & Paper, Chemical, Oil & Gas, Metals & Mining, and Utilities
environmental disclosure – GRI-based index developed by Clarkson et al. (2008) (AOS)
environmental performance – intra-industry percentile rank actual TRI normalized by COGS

44
Intercept 14.064 < 0.001
BV + 1.283 < 0.001
AE + 4.327 < 0.001
TRI – -5.936 0.070
EnvDis + 13.089 < 0.001
Regular + 1.355 0.279
Adj R2 0.637
Variable Sign Coef p-value
TABLE 4A Valuation Model Results
incremental to TRI, voluntary environmental disclosure provides
valuation relevant information
45
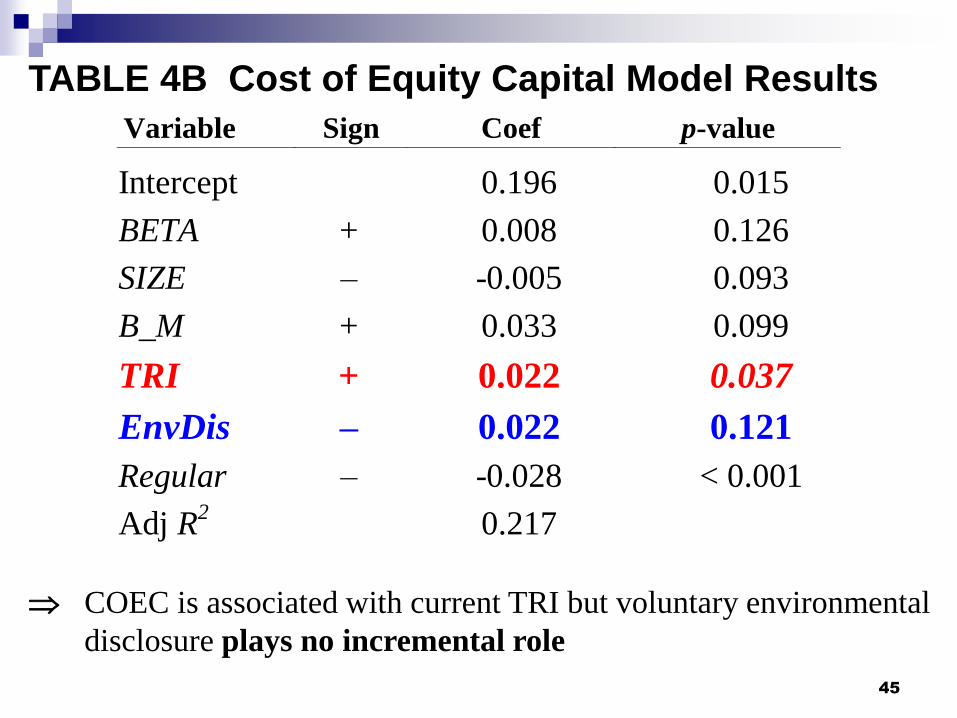
TABLE 4B Cost of Equity Capital Model Results
Intercept 0.196 0.015
BETA + 0.008 0.126
SIZE – -0.005 0.093
B_M + 0.033 0.099
TRI + 0.022 0.037
EnvDis – 0.022 0.121
Regular – -0.028 < 0.001
Adj R2 0.217
Variable Sign Coef p-value
COEC is associated with current TRI but voluntary environmental
disclosure plays no incremental role

46
Variable Sign Coef p-value Coef p-value
Intercept 0.018 0.225 0.088 < 0.001
ROA /CFO + 0.399 < 0.001 0.380 < 0.001
SIZE – -0.002 0.274 -0.002 0.189
EnvDis + 0.036 0.018 0.010 0.277
TRI – -0.011 0.187 -0.013 0.158
Adjusted R2 0.197 0.215
TABLE 4C Long-Term Financial Performance Results
average 3-year ahead
ROA NCF
incremental to TRI, voluntary environmental disclosure provides
relevant information about future financial performance
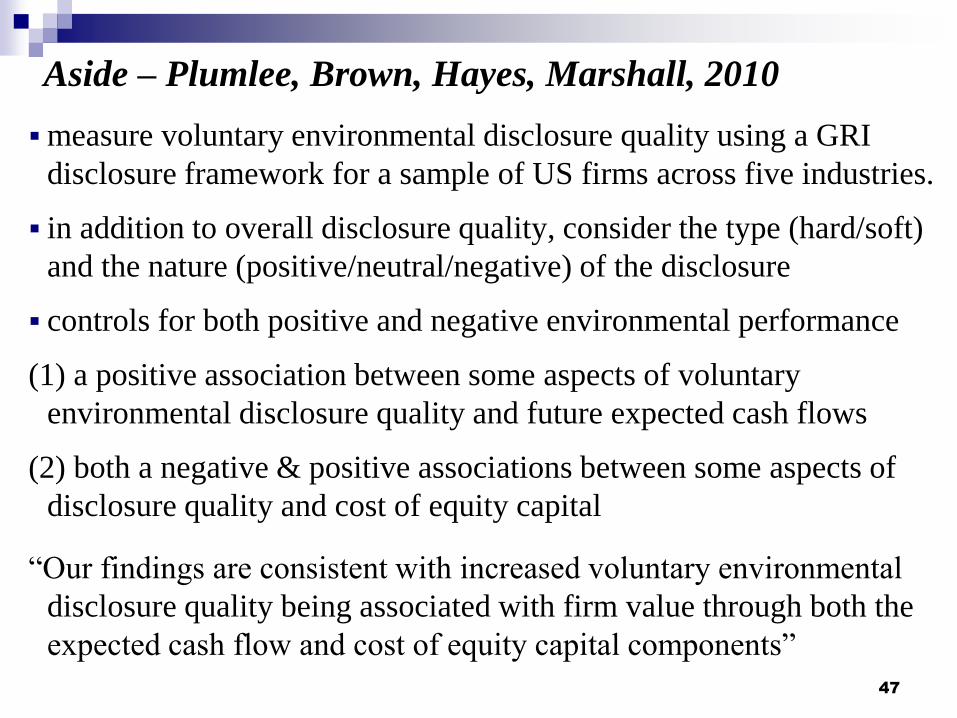
Aside – Plumlee, Brown, Hayes, Marshall, 2010
measure voluntary environmental disclosure quality using a GRI
disclosure framework for a sample of US firms across five industries.
in addition to overall disclosure quality, consider the type (hard/soft)
and the nature (positive/neutral/negative) of the disclosure
controls for both positive and negative environmental performance
(1) a positive association between some aspects of voluntary
environmental disclosure quality and future expected cash flows
(2) both a negative & positive associations between some aspects of
disclosure quality and cost of equity capital
“Our findings are consistent with increased voluntary environmental
disclosure quality being associated with firm value through both the
expected cash flow and cost of equity capital components”
47
48
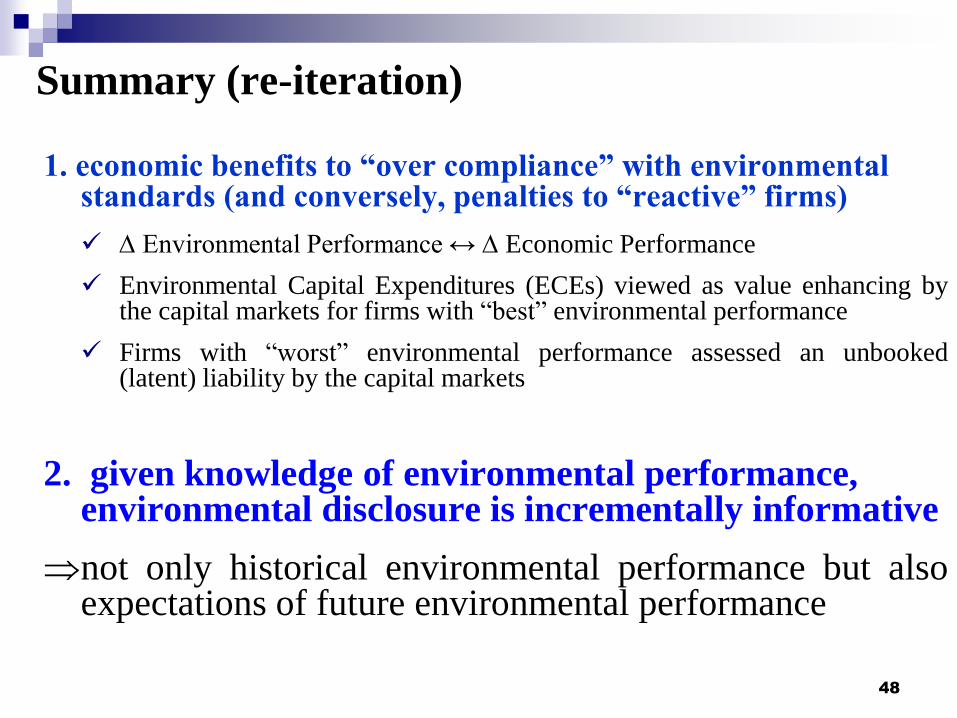
Summary (re-iteration)
1. economic benefits to “over compliance” with environmental standards (and conversely, penalties to “reactive” firms)
Environmental Performance ↔ Economic Performance
Environmental Capital Expenditures (ECEs) viewed as value enhancing by the capital markets for firms with “best” environmental performance
Firms with “worst” environmental performance assessed an unbooked (latent) liability by the capital markets
2. given knowledge of environmental performance, environmental disclosure is incrementally informative
not only historical environmental performance but also expectations of future environmental performance

B. Carbon (GHG) Emissions Studies –
Valuation:
Matsumura, Prakash & Vera-Munoz
- S&P 500 firms; 2006 – 2008
- voluntary CDP disclosures
Griffin, Lont & Sun
- S&P 500 & TSX 200 firms; 2005/6 – 2009
- voluntary CDP disclosures & estimation model
Chapple, Clarkson & Gold
- 58 Australian firms; 2007
- voluntary CDP disclosures & VicSuper proprietary information
- - - - - - - - - - - -
Clarkson, Li, Pinnuck & Richardson - listed EU firms, 2006 – 2009; 843 firm-year observations
- emissions data from EU Community Independent Transactions Log (CITL)

RQ: relationship between voluntarily disclosed carbon emissions levels
and firm value?
S&P 500 firms voluntarily disclosing carbon emissions data to CDP
2006 → 2008; final sample = 584 firm-yr observations (of 1,443)
valuation model methodology; recognise „self selection‟ bias
assessed penalty of $202 US per ton of GHG emissions (argued to
be the present value of both direct and indirect costs (potential
litigation and remediation costs, and loss of reputation)
Matsumura, Prakash, Vera-Munoz, 2011 (working paper)
50

Griffin, Lont, Sun, 2012 (working paper)
RQ: value relevance of climate change disclosures ?
S&P 500 firms, 2006 – 2009; TSE 200 firms, 2005 – 2009
with CDP disclosures – U.S., 824 firm-yrs; Canada, 259 firm-
yrs
estimate carbon emissions for non-disclosers; valuation model
and event study methodologies
“To summarize, Table 3 shows three results:
(1) investors view greenhouse gas emissions as a significant
negative valuation driver;
(2) the valuation effects are incrementally more negative for S&P
500 and GHGE-intensive companies; and,
(3) a negative valuation effect occurs regardless of whether or not
the company discloses to the CDP.”
51

“Thus, in line with our research expectation, this evidence
indicates that investors price stocks as if higher GHG
emissions impose an additional off-balance sheet liability
not already reflected in the market‟s assessments of
reported earnings and shareholders‟ equity.”
“This off-balance sheet amount reflects investors‟
assessment of the additional net expenditures or
uncertainties regarding company responsibilities for
climate change and/or as increased net cash outflows
from future compliance, abatement, regulatory, and tax
costs not captured by the accounting statements.” 52

53
For a hypothetical company with median GHG emissions, assuming
a GHG cost of $20 per ton, and applying the coefficient estimates
from regressions based on pooled observations,
Table 3 estimates (base valuation model) investors factor 20% of
the GHG cost cost into stock price as an unrecognized liability
→ an unrecognized liability of $4.01 per ton of GHGE
Table 5 estimates (self selection model) investors factor 47.25%
of the $20 cost into stock price as an unrecognized liability
→ an off-balance liability of $9.45 per ton of GHGE
Notwithstanding the qualifiers at the outset, these figures
“offer some practical guidance as to the cost per ton of GHG priced
by equity investors as an off-balance sheet liability.”
54
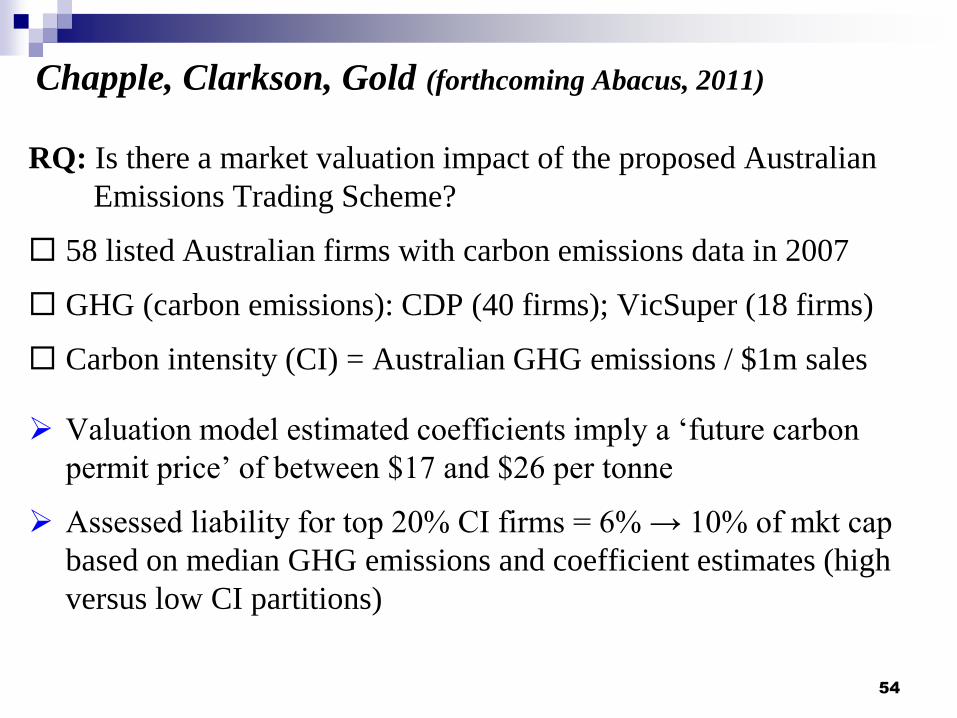
Chapple, Clarkson, Gold (forthcoming Abacus, 2011)
RQ: Is there a market valuation impact of the proposed Australian
Emissions Trading Scheme?
58 listed Australian firms with carbon emissions data in 2007
GHG (carbon emissions): CDP (40 firms); VicSuper (18 firms)
Carbon intensity (CI) = Australian GHG emissions / $1m sales
Valuation model estimated coefficients imply a „future carbon
permit price‟ of between $17 and $26 per tonne
Assessed liability for top 20% CI firms = 6% → 10% of mkt cap
based on median GHG emissions and coefficient estimates (high
versus low CI partitions)

55
e.g., Table 5 Panel A – Primary Valuation Model Results
Assessed penalty 6.57% 10.08% (% market capitalization) (high CI versus low CI partition)
+ 10 → 12%

Industry Reports – Australian context – include:
Citigroup (2008): for eight of Australia‟s highest carbon intensive
firms, a carbon cost of $20 per tonne under the proposed ETS
could create a liability of between 20% and 40% of market
capitalisation assuming zero price pass-though
Port Jackson Partners (2008): analyse fourteen (undisclosed)
TEEI firms, finding that with carbon at $40 per tonne, the
proposed scheme would result in four firms closing, three
facing a high risk of future negative cash flows, and annual
profits being reduced by more than 10% for the remaining seven.
Deutsche Bank (2009): DCF analysis leads to a view that the
impact of an ETS as relatively “benign” – however, the analysis
was conducted near the end of 2009 by which time proposed
changes suggested that the allocation of free allowances would
be relatively more liberal
56
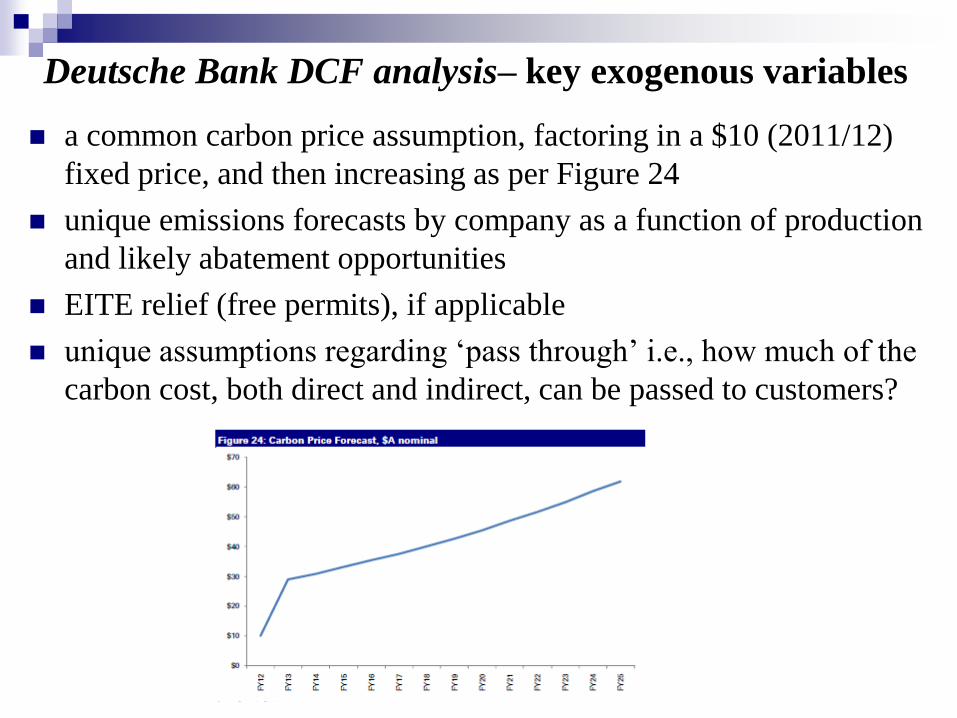
Deutsche Bank DCF analysis– key exogenous variables
a common carbon price assumption, factoring in a $10 (2011/12)
fixed price, and then increasing as per Figure 24
unique emissions forecasts by company as a function of production
and likely abatement opportunities
EITE relief (free permits), if applicable
unique assumptions regarding „pass through‟ i.e., how much of the
carbon cost, both direct and indirect, can be passed to customers?

58

59

60
Key messages –
for 19 of the 25 firms, the valuation impacts are negative; for 5, the
impact is zero due to their ability to pass on the additional carbon costs.
the valuation impacts are relatively benign; for 17 of the 25, < 3%; and
on a weighted average basis, -3% for the Top 25 emitters.
in the hypothetical case of no cost pass through and no EITE relief, the
weighted average impact is -8.8%.
the allocation of free permits, mainly via EITE relief, in combination
with cost pass through, materially reduces the valuation impact in many
cases; in the extreme case, a 51% reduction.
both AGL Energy and Origin Energy have relatively low carbon intensity
in their generation assets; valuations are sensitive to their ability to pass
through their higher generating costs to end customers, consequently, the
CPRS could drive quite probably positive valuation outcomes for both.
Virgin Blue highly exposed to the domestic revenue and limited ability to
pass through incremental carbon costs

Clarkson, Li, Pinnuck, Richardson, 2012 (working paper)
listed EU firms with carbon emissions and permit allocation
data available over the period 2006 – 2009
participating installations; emissions data recorded by the
European Commission in the Community Independent
Transaction Log (CITL)
installation data aggregated up to the listed entity level using the
BVD Amadeus Database
Research Focus –
the valuation relevance of carbon emissions under the EU ETS
→ free permit allocations
cost pass on ability
jurisdictional differences
62

Results – Covered versus Uncovered Emissions
Variable Pooled Pooled
Intercept 1.194 1.212
(< 0.001) (< 0.001)
BV 1.116 0.522
(< 0.001) (< 0.001)
AE 7.048 7.038
(< 0.001) (< 0.001)
EmitTot -0.044 - - -
(<0.001)
AllocShort - - - -0.084
(0.038)
PerAlloc - - - 0.019
(0.475)
Adj R2 0.809 0.809
assessed liability = €44 per ton
assessed liability = €84 per ton
of uncovered emissions
assessed liability / asset (?)
statistically zero for permit
allocations
63

significant assessed liability for firms with limited „cost pass on
ability‟
greatly mitigated (or zero) for those with the greatest ability to
pass on the costs -0.098 + 0.063 and -0.119 + 0.101
HH 2.545 -0.034 Rank
(0.033) baseline liability (0.211)
AllocShort -0.098 -0.119 AllocShort
(0.014) (0.017)
PerAlloc 0.013 0.016 PerAlloc
(0.647) (0.697)
AllocShort*HH 0.063 0.101 AllocShort*Rank
(0.052) mitigation (0.037)
PerAlloc*HH 0.007 0.002 PerAlloc *Rank
(0.443) (0.773)
Results – Cost Pass On Ability

Results – EU versus Non-EU Emissions
Variable Model 3 Model 4
Intercept 1.738 1.657
(0.190) (0.182)
BV 1.411 1.460
(< 0.001) (< 0.001)
AE 5.526 5.808
(< 0.001) (< 0.001)
CDP Global Emissions -0.053 ---
(0.023)
AllocShort --- -0.094
EU (0.008)
PerAlloc --- 0.025
non-EU (0.169)
Non-EU Emissions --- -0.048
(0.041)
65
Disclosure vs Accounting
Disclosure
→ what information do various stakeholders “need”
Accounting
→ how to present the information
- - - - - - - - - - - - - - - - -
Our results indicate that investors need the following information in
order to refine their estimates of latent carbon liabilities:
(1) current carbon emissions at the corporate entity level,
segregated by regions under different regulatory regimes;
(2) the firm‟s carbon efficiency relative to its sector peers for each
sector the company operates in; and
(3) other information indicating the firm‟s ability to pass on
increased carbon costs to consumers.
66

Accounting for carbon –
Basic issues include: net versus gross methods
cost versus revaluation
Proposed/adopted approaches include (but are
certainly not limited to) –
IFRIC 3 – cost model
IFRIC 3 – revaluation model
US GAAP
67

U.S. GAAP (net)
(1) an asset is only recorded for purchased emission certificates, at
cost, and depreciated according to usage
(2) allowances which are allocated for free are not reflected in the
financial accounting,
(3) if an entity does not hold the estimated required amount of
emission certificates, a liability reflecting the number and current
price of missing rights must be recognised
expense of I/S relates to using up of purchased certificates
risk of accounting mismatch asset at cost; liability at current
value (small, relates only difference between purchase and need)
68

IFRIC 3 – cost & revaluation models (gross)
Three separate B/S items:
(1) an intangible asset reflecting purchased and granted certificates,
(2) a liability equal to total emissions = monetary amount of
allowances required to surrender
(3) a deferred income item for rights allocated for free
(4) the emissions rights asset is: (i) retained at historical cost (gains
when disposed of) or (ii) re-valued with gains accruing in a
revaluation reserve
risk of accounting mismatch asset at cost or revalued; deferred
income amortised at cost; liability at current value
69

Preliminary insights –
Veith, Werner, Zimmerman (2009) “Competing accounting
treatments for emissions rights: A capital markets perspective”
Using return and price regressions for a sample of major European
regulated firms, we present evidence that only US GAAP
treatments report income components concerning exposure from
the emission trade that are useful in valuation decisions.
Despite their increased complexity, models within the scope of IFRIC
3 only yield information in line with carbon price changes but not
with regard to a firm-specific exposure toward the scheme
“We find that the cost-based net approach provides additional
information while gross methods, even the full market-based
disclosures, do not. We thus show that an increase in reporting
complexity does not always yield superior information content.”
70