The Burden of the Nondiversifiable Risk of Entrepreneurship · The Burden of the Nondiversifiable...
25
NBER WORKING PAPER SERIES THE BURDEN OF THE NONDIVERSIFIABLE RISK OF ENTREPRENEURSHIP Robert E. Hall Susan E. Woodward Working Paper 14219 http://www.nber.org/papers/w14219 NATIONAL BUREAU OF ECONOMIC RESEARCH 1050 Massachusetts Avenue Cambridge, MA 02138 August 2008 We are grateful to Ravi Jagannathan, Deborah Lucas, Matthew Rhodes-Kropf, and numerous seminar participants for comments and to Katherine Litvak for data on venture-contract terms. Hall's research is part of the Economic Fluctuations and Growth Program of the National Bureau of Economic Research. The views expressed herein are those of the author(s) and do not necessarily reflect the views of the National Bureau of Economic Research. NBER working papers are circulated for discussion and comment purposes. They have not been peer- reviewed or been subject to the review by the NBER Board of Directors that accompanies official NBER publications. © 2008 by Robert E. Hall and Susan E. Woodward. All rights reserved. Short sections of text, not to exceed two paragraphs, may be quoted without explicit permission provided that full credit, including © notice, is given to the source.
Transcript of The Burden of the Nondiversifiable Risk of Entrepreneurship · The Burden of the Nondiversifiable...
NBER WORKING PAPER SERIES
THE BURDEN OF THE NONDIVERSIFIABLE RISK OF ENTREPRENEURSHIP
Robert E. HallSusan E. Woodward
Working Paper 14219http://www.nber.org/papers/w14219
NATIONAL BUREAU OF ECONOMIC RESEARCH1050 Massachusetts Avenue
Cambridge, MA 02138August 2008
We are grateful to Ravi Jagannathan, Deborah Lucas, Matthew Rhodes-Kropf, and numerous seminarparticipants for comments and to Katherine Litvak for data on venture-contract terms. Hall's researchis part of the Economic Fluctuations and Growth Program of the National Bureau of Economic Research.The views expressed herein are those of the author(s) and do not necessarily reflect the views of theNational Bureau of Economic Research.
NBER working papers are circulated for discussion and comment purposes. They have not been peer-reviewed or been subject to the review by the NBER Board of Directors that accompanies officialNBER publications.
© 2008 by Robert E. Hall and Susan E. Woodward. All rights reserved. Short sections of text, notto exceed two paragraphs, may be quoted without explicit permission provided that full credit, including© notice, is given to the source.
The Burden of the Nondiversifiable Risk of EntrepreneurshipRobert E. Hall and Susan E. WoodwardNBER Working Paper No. 14219August 2008JEL No. G12,G24,G32,H1,L14
ABSTRACT
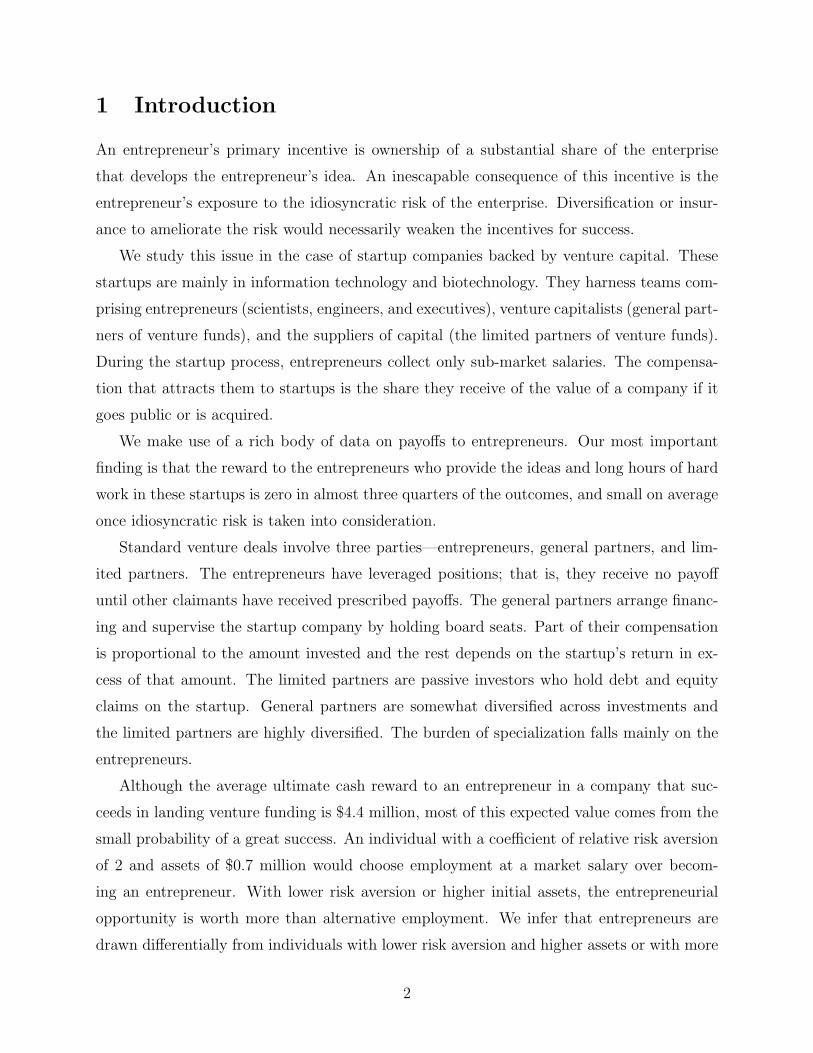
In the standard venture capital contract, entrepreneurs have a large fraction of equity ownership inthe companies they found and are paid a sub-market salary by the investors who provide the moneyto develop the idea. The big rewards come only to those whose companies go public or are acquiredon favorable terms, forcing entrepreneurs to bear a substantial burden of idiosyncratic risk. We studythis burden in the case of high-tech companies funded by venture capital. Over the past 20 years, thetypical venture-backed entrepreneur earned an average of $4.4 million from companies that succeededin attracting venture funding. Entrepreneurs with a coefficient of relative risk aversion of two andwith less than $0.7 million would be better off in a salaried position than in a startup, despite the prospectof an average personal payoff of $4.4 million and the possibility of payoffs over $1 billion. We concludethat startups attract entrepreneurs with lower risk aversion, higher initial assets, preferences for entrepreneurshipover employment, and optimistic beliefs about the payoffs from their products.
Robert E. HallHoover InstitutionStanford UniversityStanford, CA 94305-6010and [email protected]
Susan E. WoodwardSand Hill Econometrics, Inc115 Everett Ave.Palo Alto, CA [email protected]
1 Introduction
An entrepreneur’s primary incentive is ownership of a substantial share of the enterprise
that develops the entrepreneur’s idea. An inescapable consequence of this incentive is the
entrepreneur’s exposure to the idiosyncratic risk of the enterprise. Diversification or insur-
ance to ameliorate the risk would necessarily weaken the incentives for success.
We study this issue in the case of startup companies backed by venture capital. These
startups are mainly in information technology and biotechnology. They harness teams com-
prising entrepreneurs (scientists, engineers, and executives), venture capitalists (general part-
ners of venture funds), and the suppliers of capital (the limited partners of venture funds).
During the startup process, entrepreneurs collect only sub-market salaries. The compensa-
tion that attracts them to startups is the share they receive of the value of a company if it
goes public or is acquired.
We make use of a rich body of data on payoffs to entrepreneurs. Our most important
finding is that the reward to the entrepreneurs who provide the ideas and long hours of hard
work in these startups is zero in almost three quarters of the outcomes, and small on average
once idiosyncratic risk is taken into consideration.
Standard venture deals involve three parties—entrepreneurs, general partners, and lim-
ited partners. The entrepreneurs have leveraged positions; that is, they receive no payoff
until other claimants have received prescribed payoffs. The general partners arrange financ-
ing and supervise the startup company by holding board seats. Part of their compensation
is proportional to the amount invested and the rest depends on the startup’s return in ex-
cess of that amount. The limited partners are passive investors who hold debt and equity
claims on the startup. General partners are somewhat diversified across investments and
the limited partners are highly diversified. The burden of specialization falls mainly on the
entrepreneurs.
Although the average ultimate cash reward to an entrepreneur in a company that suc-
ceeds in landing venture funding is $4.4 million, most of this expected value comes from the
small probability of a great success. An individual with a coefficient of relative risk aversion
of 2 and assets of $0.7 million would choose employment at a market salary over becom-
ing an entrepreneur. With lower risk aversion or higher initial assets, the entrepreneurial
opportunity is worth more than alternative employment. We infer that entrepreneurs are
drawn differentially from individuals with lower risk aversion and higher assets or with more
2
optimism. Other types of people that may be attracted to entrepreneurship are those with
preferences for that role over employment and those who exaggerate the likely payoffs of
their own products.
We focus on the joint distribution of the duration of the entrepreneur’s involvement in
a startup—what we call the venture lifetime—and the value that the entrepreneur receives
when the company exits the venture portfolio. Exits take three forms: (1) an initial public
offering, in which the entrepreneur receives liquid publicly-traded shares or cash (if she
sells her own shares at the IPO) and has the opportunity to diversify; (2) the sale of the
company to an acquirer, in which the entrepreneur receives cash or publicly-traded shares
in the acquiring company and has the opportunity to diversify; and (3) shutdown or other
determination that the entrepreneur’s equity interest has essentially no value. Most IPOs
return substantial value to an entrepreneur. Some acquisitions also return substantial value,
while others may deliver a meager or zero value to the entrepreneur.
The joint distribution shows a distinct negative correlation between exit value and ven-
ture lifetime, especially in information technology. Highly successful products tend to result
in IPOs or acquisitions at high values relatively quickly. These outcomes are favorable for
entrepreneurs in two ways. First, the value arrives quickly and is subject to less discounting.
Second, the entrepreneur spends less time being paid a low startup salary and correspond-
ingly more time with higher post-startup compensation, either in the public version of the
original company, in the acquiring company, or in another job. A fraction of entrepreneurs
launch new startups after exiting from an earlier startup.
We develop a unified analysis of the factors affecting the entrepreneur’s risk-adjusted
payoff, based on a dynamic program. The analysis takes account of the joint distribution
of exit value and venture lifetime and of salary and compensation income. We use it to
calculate the certainty-equivalent value of the entrepreneurial opportunity—the amount that
a prospective entrepreneur would be willing to pay to become a founder of a venture-backed
startup. For a risk-neutral individual, the certainty-equivalent is $4.4 million. With mild
risk aversion, however, the amount is only $1.9 million and with normal risk aversion, the
amount is only slightly positive.
We are not aware of any earlier research that quantifies the rewards on a per-company
basis or per-entrepreneur-year basis, the focus of our work. Earlier research on venture-
backed startups has focused on the returns to venture investors. An extensive theoretical
3

literature considers the implications of idiosyncratic risk for entrepreneurs and managers—
see Heaton and Lucas (2004) for a recent contribution and many references.
2 The Startup Process
At the outset, startups are usually operated and financed by the entrepreneurs themselves.
Friends and family may invest as founding shareholders. Unless the founders are wealthy,
they need outside financing, so a main task early in a startup is to find investors. Some
are individual investors called angels. But venture funds are capable of investing more at
the outset than is available from these other sources, and venture can invest large amounts
later in the development of a startup with a promising product. Our concern is with the
companies that succeed in obtaining venture funding by convincing some venture capitalists
that the new business has a positive net present value, which, given the skewness of the
distribution of value at outcome, implies at least some chance of becoming highly profitable.
Venture funds seldom give a company all of the money it will need to get from startup
to exit in a single investment. Instead, a syndicate of venture funds will provide financing
in rounds, anticipating future rounds of funding, possibly including different investors, if
the startup makes reasonable progress but still lacks the revenue to be self-sustaining, and
denying the startup further funding otherwise. An early round typically gives a startup a
few million dollars, while later rounds, if they occur, often involve much larger investments.
General partners are the organizers of venture funds. They recruit financing commitments
from limited partners—usually pension funds, endowments, and wealthy individuals—and
choose the companies that will receive financing. Compensation to general partners com-
prises an annual fraction of committed capital (typical is two percent) plus carry—a fraction
of the profits (20 to 30 percent) from successful exits. The limited partners receive most
of the cash returned by venture investments when a company undergoes a favorable exit
event—an IPO or acquisition.
Venture funds generally hold convertible preferred shares in their portfolio companies.
The preference requires that the funds receive a specified amount of cash back before the
common shareholders (the entrepreneurs, angels, and employees) receive any return. In a
successful outcome, the convertible preferred shares convert shares to common stock. Instead
of convertible preferences, venture funds may hold debt claims, in which case they receive
the repayment of the debt even in the best outcomes. Both arrangements put the common
4
shareholders, including the entrepreneurs, in a leveraged position, increasing their exposure
to the idiosyncratic risk of the startup.
A huge literature portrays the standard venture financial contract as the constrained
optimum of a challenging mechanism design problem. This research explains key features,
including the assignment of a share of the ultimate value to the entrepreneurs, multiple stages
of financing, and debt instruments (preferences) that convert to equity. Some of the more
prominent contributions include Admati and Pfleiderer (1994), Schmidt (2003), Casamatta
(2003), and Repullo and Suarez (2004). Wilmerding (2003) and Bagley and Dauchy (2003)
explain the terms of venture contracts from the perspective of venture capitalists and their
lawyers.
The dominant factor in this literature is moral hazard. Venture investors and their
agents, the general partners of venture funds, are unable to monitor or specify the efforts
of entrepreneurs to commercialize their ideas. Consequently, the entrepreneurs are paid in
proportion to the actual commercial success of their companies. This alignment of incentives
comes at the cost of a substantial diminution in the value of the enterprise because of the
idiosyncratic risk that entrepreneurs are unable to insure. Alternatives with less risk, such as
paying entrepreneurs salaries in place of equity, apparently provide such weak incentives that
the relationship based on equity incentives weakened by idiosyncratic risk is still optimal for
some products and some entrepreneurs.
Venture capitalists face a daunting problem evaluating proposals for startups. One of
the reasons that entrepreneurs receive sub-market salaries during the startup phase is to
induce self-selection among applicants for venture funding. Only entrepreneurs with beliefs
in the commercial values of their ideas will seek funding if the entrepreneur’s payoff from an
unsuccessful startup is negative.
Most of the expected return to entrepreneurs comes from low- probability large gains.
About three-quarters of venture-backed companies expire without returning any cash to their
entrepreneurs. The largest returns generally come from IPOs, but acquisitions sometimes
provide high returns as well. On the other hand, many acquisitions occur at low prices
and are effectively liquidations. Some venture-backed companies remain for many years as
stand-alone operations, able to pay their employees out of revenue, but generating no returns
for shareholders.
The free-standing startup company is one of the ways that ideas for new products are
5
developed and marketed. It provides powerful incentives for its entrepreneurs, but at the
cost of exposing them to the idiosyncratic risks of their companies. Most scientists and
engineers working on new products work as employees for established—often very large—
companies. Their employment contracts isolate them from the most of the idiosyncratic risks
of the products they develop. Incentives are not as powerful as in startups. We discuss the
sorting of potential entrepreneurs into startups and established companies in a later section.
We note that the market for scientists and engineers has not developed any intermediate
contract, though one could imagine such a contract. It would pay a higher salary than the
standard venture contract does, but provide less exit value, for example, by putting a ceiling
on the payout. We believe that such contracts are rare. The two successful contract forms
in the market technical talent are polar opposites. The intermediate contract appears not
to be viable.
3 Data
3.1 Data on venture transactions
We use a database compiled by Sand Hill Econometrics on venture investments in startups
and on the fates of venture-backed companies. The data are drawn from a variety of sources,
including several commercial data vendors. The vendors concentrate on reporting funding
events and valuations for venture investments and successful outcomes (IPOs and high-
value acquisitions)and are less likely to report shutdowns and acquisitions at low values.
Sand Hill Econometrics has used a wide range of sources to augment coverage of these
adverse termination events. Hall and Woodward (2007) describe the data in more detail and
documents the technique we use to track the evolution of the entrepreneurs’ ownership of
a company through successive rounds of funding, each of which dilutes the entrepreneurs’
claims.
One important source of valuation data is S-1 statements filed by venture-backed com-
panies when they go public. These statements often give a funding history for the company.
Because an IPO is a favorable event, the back-filling of round values from S-1s is a source of
return-based selection in the data. Our earlier paper describes how we adjust for selection
bias.
Our data include 20,961 venture-backed companies, the great majority of all such compa-
nies in the United States starting in 1987. Among the exit values used in the analysis, 2,010
6
are IPOs, 5,329 are acquisitions, and 3,180 are confirmed zero-value exits. Of the remaining
companies, we treat those more than 5 years past their last rounds of venture funding as
having exited at some time with zero value; 3,904 companies fall into this category. We ran-
domly assign these companies exit dates by drawing from the empirical distribution of time
past funding of companies with known zero-value exit dates. The remaining 6,538 companies
have not yet achieved their exit values.
3.2 Number of entrepreneurs per company
Our basic data sources do not contain information about the number of entrepreneurs in
each startup company. We use an estimate from a sample of companies that underwent
IPOs. The sample is a random draw from all IPOs reported in our data. The SEC form S-1
filed prior to an IPO contains a description of the major shareholders, which includes the
founders. Our estimate of the average number of entrepreneurs is 2.02 with a standard error
of 0.15 .
4 The Joint Distribution of Startup Lifetime and Exit
Value
The lifetime of a startup—the time from inception to the entrepreneurs’ receipt of cash from
an exit event—plays a key role in our analysis. Entrepreneurs prefer short lifetimes for two
reasons. First, their salaries at a venture-backed startup are modest; they forego a full return
to their human capital during the lifetime. Second, the time value of money places a higher
value on cash received sooner.
Lifetimes and exit values are not distributed independently. In particular, a substantial
fraction of startups linger for many years and then never deliver much cash to their founders.
And some of the highest exit values occurred for companies like YouTube that exited soon
after inception. We work with the joint distribution, f(τ, v), of startup lifetime, τ , and
value received by the entrepreneurs, v. We take a flexible view of the joint distribution, as
appropriate for our rich body of data. We place lifetimes τ and values v in 9 and 11 bins
respectively and estimate the 99 values of the joint distribution defined over the bins.
Estimation of the joint distribution needs to take account of the fact that many companies
in our data have not completed their lifetimes as startups. To account for the right-censoring
of lifetimes, we let It,τ be an indicator function for whether a company started in month t
7
could have been observed to exit at lifetime τ . We denote the month where we gather our
data as T . Thus
It,τ = 1 if T − t ≥ τ (1)
= 0 otherwise.
We further letNv,τ be the number of companies observed in the sample with entrepreneurial
exit value in bin v and lifetime in bin τ . Non-exited companies are not included in N . We
let Lt be the number of companies launched in month t. Then
Nv,τ =∑t
LtIt,τfv,τ , (2)
where f is the joint distribution defined over the bins. We let
Nτ =∑t
LtIt,τ , (3)
so
fv,τ =Nv,τ
Nτ
. (4)
Our method for estimating the joint distribution is equivalent to estimating a hazard function
showing the probability of exit at a given age conditional on no earlier exit, using all available
data on the hazard at each age.
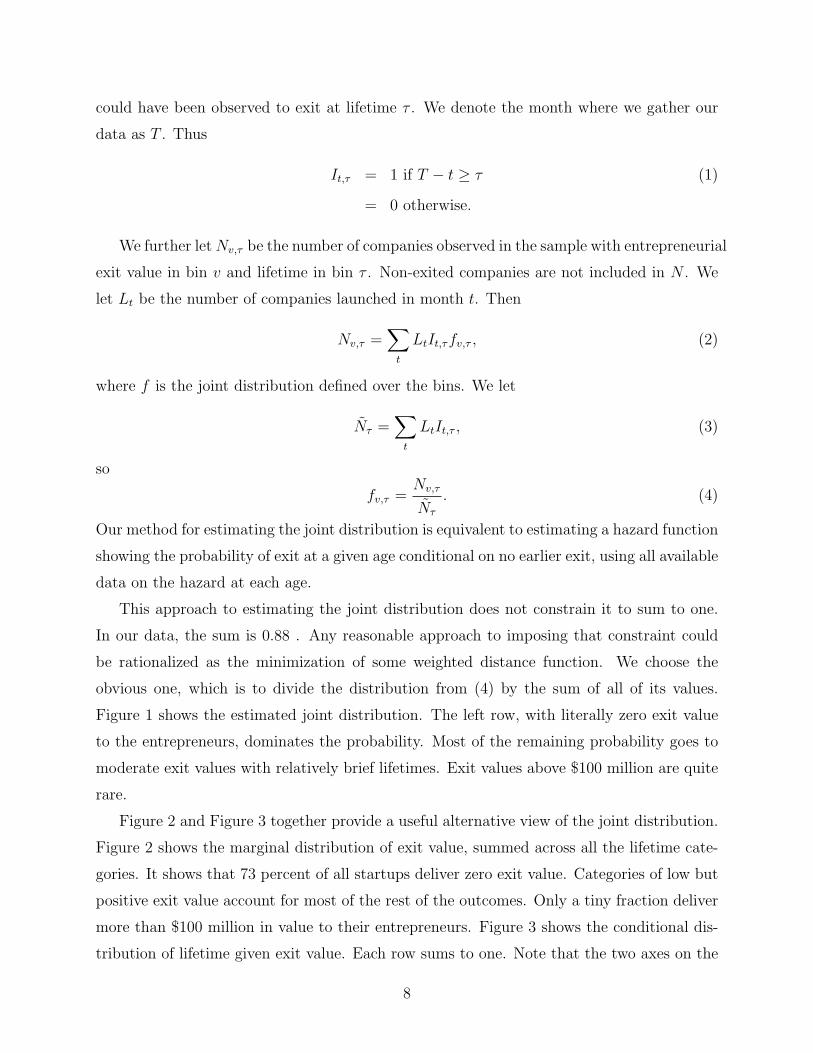
This approach to estimating the joint distribution does not constrain it to sum to one.
In our data, the sum is 0.88 . Any reasonable approach to imposing that constraint could
be rationalized as the minimization of some weighted distance function. We choose the
obvious one, which is to divide the distribution from (4) by the sum of all of its values.
Figure 1 shows the estimated joint distribution. The left row, with literally zero exit value
to the entrepreneurs, dominates the probability. Most of the remaining probability goes to
moderate exit values with relatively brief lifetimes. Exit values above $100 million are quite
rare.
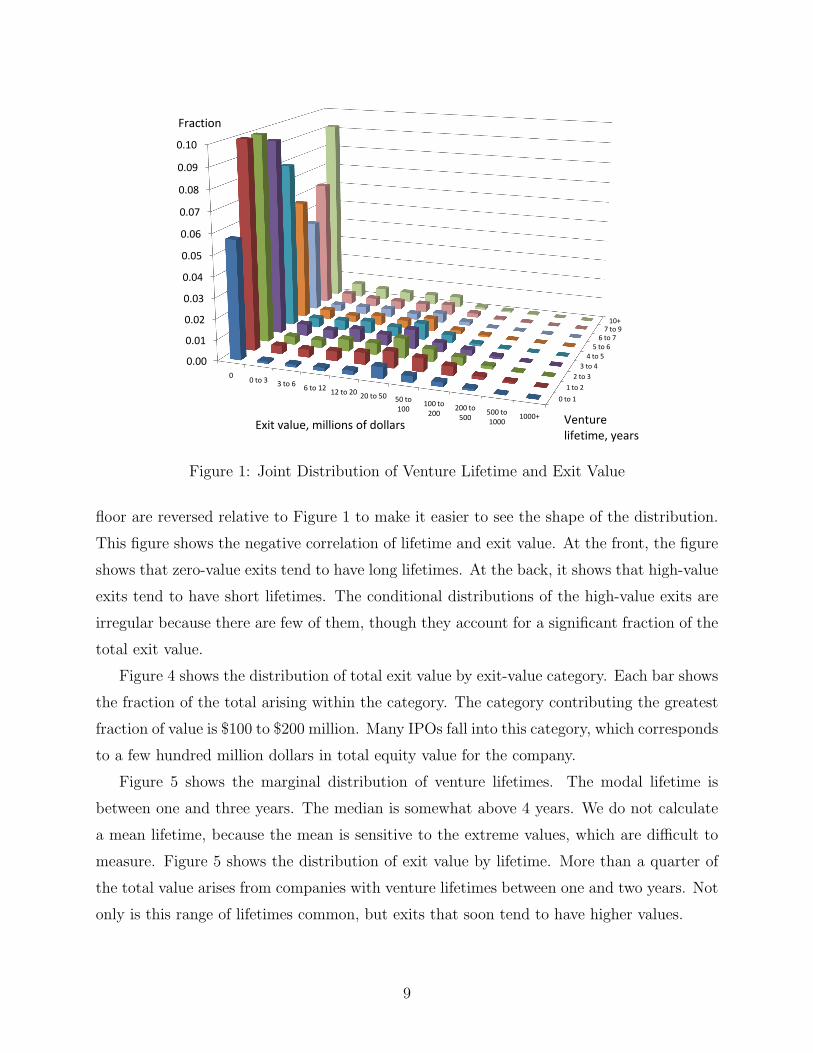
Figure 2 and Figure 3 together provide a useful alternative view of the joint distribution.
Figure 2 shows the marginal distribution of exit value, summed across all the lifetime cate-
gories. It shows that 73 percent of all startups deliver zero exit value. Categories of low but
positive exit value account for most of the rest of the outcomes. Only a tiny fraction deliver
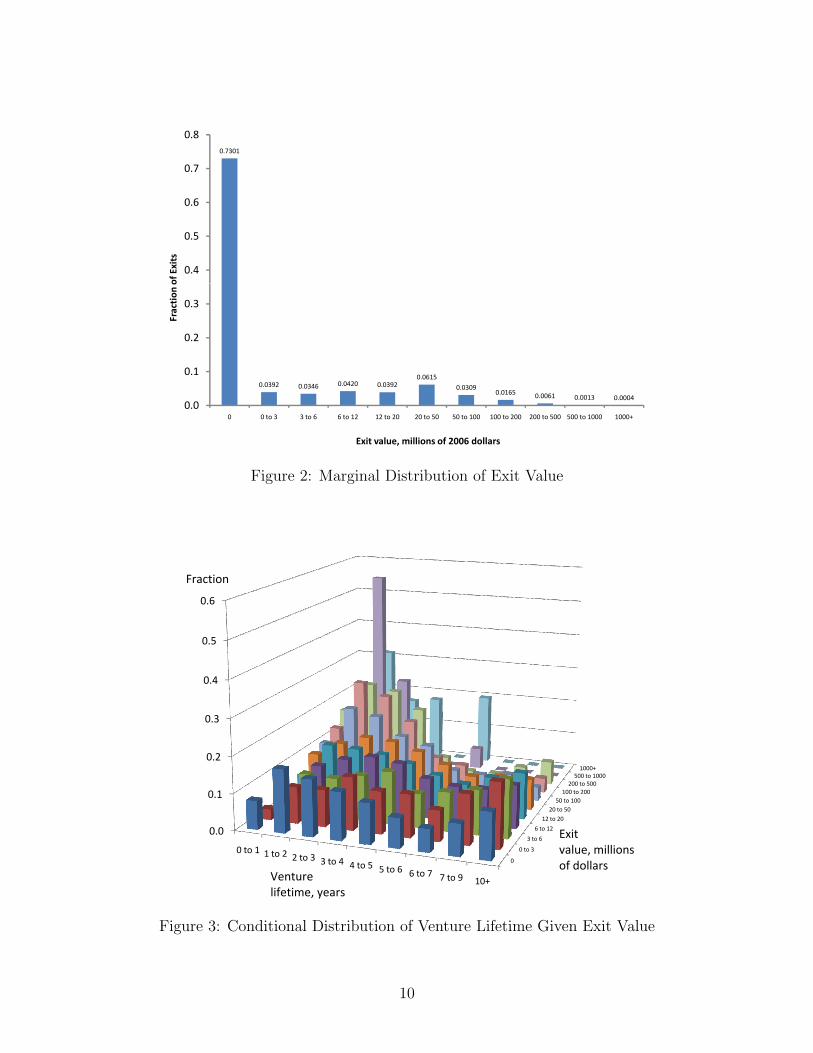
more than $100 million in value to their entrepreneurs. Figure 3 shows the conditional dis-
tribution of lifetime given exit value. Each row sums to one. Note that the two axes on the
8
0 to 1
1 to 2
2 to 3
3 to 4
4 to 55 to 6
6 to 77 to 9
10+
0.00
0.01
0.02
0.03
0.04
0.05
0.06
0.07
0.08
0.09
0.10
00 to 3 3 to 6
6 to 1212 to 20 20 to 50 50 to
100100 to
200200 to
500500 to 1000
1000+
Fraction
Venture lifetime, years
Exit value, millions of dollars
Figure 1: Joint Distribution of Venture Lifetime and Exit Value
floor are reversed relative to Figure 1 to make it easier to see the shape of the distribution.
This figure shows the negative correlation of lifetime and exit value. At the front, the figure
shows that zero-value exits tend to have long lifetimes. At the back, it shows that high-value
exits tend to have short lifetimes. The conditional distributions of the high-value exits are
irregular because there are few of them, though they account for a significant fraction of the
total exit value.
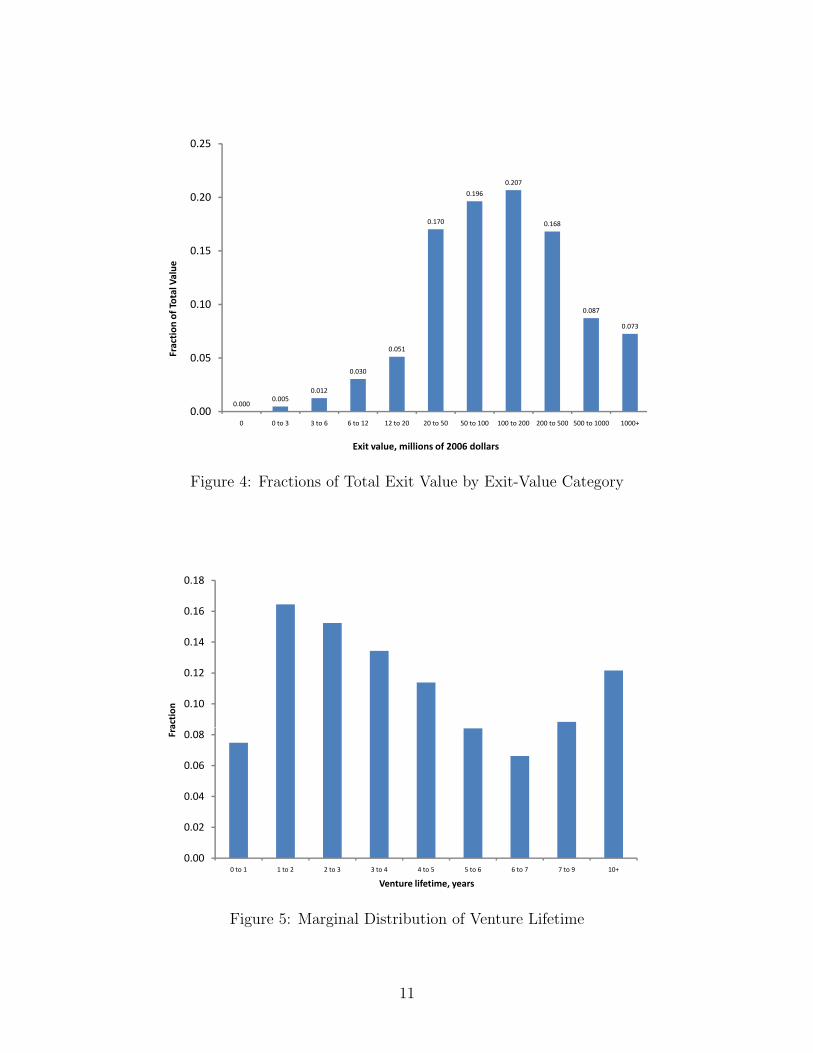
Figure 4 shows the distribution of total exit value by exit-value category. Each bar shows
the fraction of the total arising within the category. The category contributing the greatest
fraction of value is $100 to $200 million. Many IPOs fall into this category, which corresponds
to a few hundred million dollars in total equity value for the company.
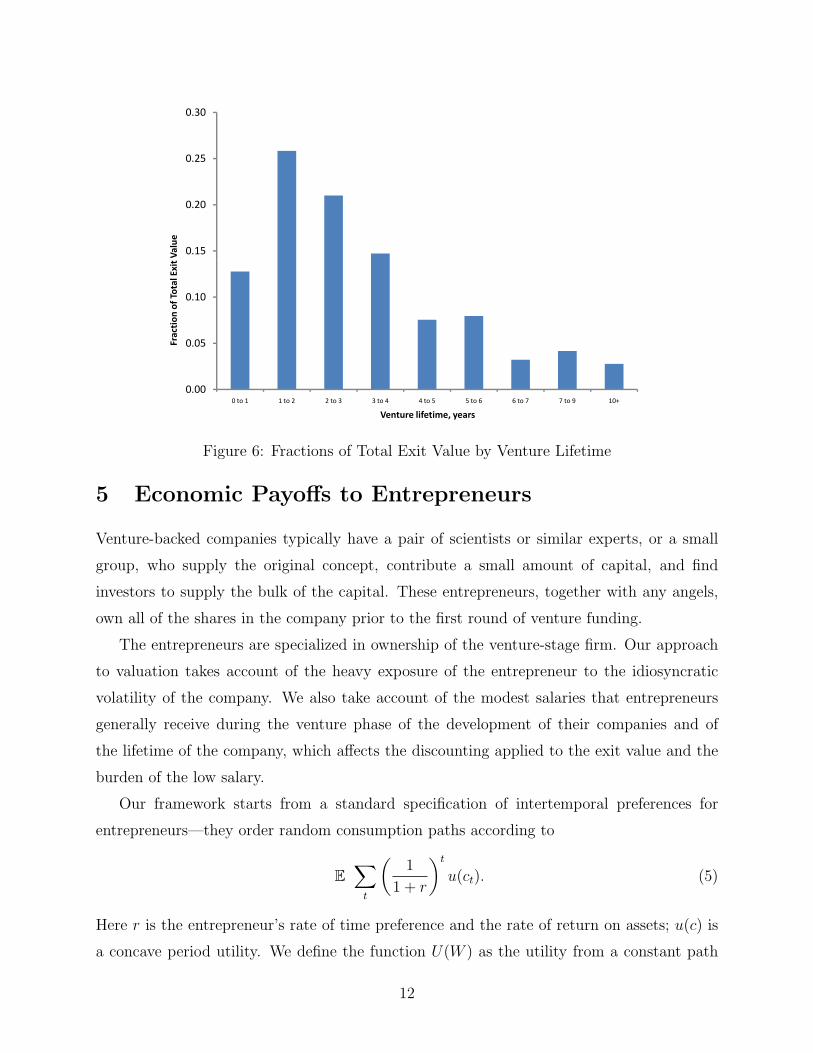
Figure 5 shows the marginal distribution of venture lifetimes. The modal lifetime is
between one and three years. The median is somewhat above 4 years. We do not calculate
a mean lifetime, because the mean is sensitive to the extreme values, which are difficult to
measure. Figure 5 shows the distribution of exit value by lifetime. More than a quarter of
the total value arises from companies with venture lifetimes between one and two years. Not
only is this range of lifetimes common, but exits that soon tend to have higher values.
9
0.7301
0.4
0.5
0.6
0.7
0.8
of Exits
0.0392 0.0346 0.0420 0.03920.0615
0.03090.0165 0.0061 0.0013 0.0004
0.0
0.1
0.2
0.3
0 0 to 3 3 to 6 6 to 12 12 to 20 20 to 50 50 to 100 100 to 200 200 to 500 500 to 1000 1000+
Fraction
o
Exit value, millions of 2006 dollars
Figure 2: Marginal Distribution of Exit Value
0.4
0.5
0.6
Fraction
0
0 to 3
3 to 6
6 to 12
12 to 20
20 to 5050 to 100100 to 200200 to 500500 to 10001000+
0.0
0.1
0.2
0.3
0 to 1 1 to 2 2 to 3 3 to 4 4 to 5 5 to 6 6 to 7 7 to 9 10+Venture lifetime, years
Exit value, millions of dollars
Figure 3: Conditional Distribution of Venture Lifetime Given Exit Value
10
0.170
0.196
0.207
0.168
0.15
0.20
0.25
al Value
0.0000.005
0.012
0.030
0.051
0.087
0.073
0.00
0.05
0.10
0 0 to 3 3 to 6 6 to 12 12 to 20 20 to 50 50 to 100 100 to 200 200 to 500 500 to 1000 1000+
Fraction
of Tota
Exit value, millions of 2006 dollars
Figure 4: Fractions of Total Exit Value by Exit-Value Category
0.10
0.12
0.14
0.16
0.18
action
0.00
0.02
0.04
0.06
0.08
0 to 1 1 to 2 2 to 3 3 to 4 4 to 5 5 to 6 6 to 7 7 to 9 10+
Fra
Venture lifetime, years
Figure 5: Marginal Distribution of Venture Lifetime
11
0.15
0.20
0.25
0.30
Value
0.00
0.05
0.10
0 to 1 1 to 2 2 to 3 3 to 4 4 to 5 5 to 6 6 to 7 7 to 9 10+
Fraction
of Total Exit
Venture lifetime, years
Figure 6: Fractions of Total Exit Value by Venture Lifetime
5 Economic Payoffs to Entrepreneurs
Venture-backed companies typically have a pair of scientists or similar experts, or a small
group, who supply the original concept, contribute a small amount of capital, and find
investors to supply the bulk of the capital. These entrepreneurs, together with any angels,
own all of the shares in the company prior to the first round of venture funding.
The entrepreneurs are specialized in ownership of the venture-stage firm. Our approach
to valuation takes account of the heavy exposure of the entrepreneur to the idiosyncratic
volatility of the company. We also take account of the modest salaries that entrepreneurs
generally receive during the venture phase of the development of their companies and of
the lifetime of the company, which affects the discounting applied to the exit value and the
burden of the low salary.
Our framework starts from a standard specification of intertemporal preferences for
entrepreneurs—they order random consumption paths according to
E∑t
(1
1 + r
)tu(ct). (5)
Here r is the entrepreneur’s rate of time preference and the rate of return on assets; u(c) is
a concave period utility. We define the function U(W ) as the utility from a constant path
12
of consumption funded by wealth W :
U(W ) =1 + r
ru
(r
1 + rW
)(6)
The multiplication by 1+rr
turns flow utility into discounted lifetime utility. The quantity
r1+r
W is the flow of consumption to be financed by the return on the wealth at rate r.
We distinguish between wealth, Wt, which measures the entrepreneur’s total command
over resources, and so incorporates the expected value of future compensation (human
wealth), and assets, At, by which we mean holdings of non-human wealth such as secu-
rities. At does not include the entrepreneur’s holdings of shares in the startup, which we
classify as human capital. For an entrepreneur in year t of a startup that has not yet exited,
we define Wt(At) as the wealth-equivalent of the entrepreneur’s command over resources,
counting what remains of the entrepreneur’s original non-human wealth, At, and the en-
trepreneur’s random future payoff from the startup, conditional on not having exited to this
time. Our definition is implicit: U(Wt(At)) is the expected utility from maximizing equation
(5) over consumption strategies.
Now we let U(Wt(At)) be the value, in utility units, associated with an entrepreneur in a
non-exited company t years past venture funding, as a function of current non-entrepreneurial
assets At. We could have defined a value function Ut(At) without interposing the function
Wt(At). Instead we let Wt(At) be the value function, which means that we need to take the
concave transformation U(Wt(At)) so that the Bellman equation adds up utility, according
to the principle of expected utility. The slightly roundabout approach of stating our findings
in terms of the wealth-equivalent Wt(At)) makes the units meaningful, whereas the units
of utility are not. Further, in our benchmark case, utility is negative, a further source
of confusion. Note that W captures initial assets, venture salary, venture exit value, and
subsequent compensation in a post-venture position, when it is calculated at time zero for
an entrepreneur.
The company has a conditional probability or hazard πt of exiting at age t. At exit, it pays
a random amount Xt to the entrepreneur. Upon exiting, the entrepreneur’s value function
is U(W ∗(A)), where A now includes the cash exit value. The entrepreneur’s consumption
is limited by assets left from the previous year—no borrowing against future earnings may
13
occur. The entrepreneur’s dynamic program is
U(Wt(At)) = maxct<At
[u(ct) +1
1 + r(1− πt+1)U(Wt+1((At − ct)(1 + r) + w))
+1
1 + rπt+1 EX U(W ∗((At − ct)(1 + r) +Xt+1))] (7)
The post-venture value function is
U(W ∗(A)) =1 + r
ru
(rA+ w∗
1 + r
). (8)
Here w∗ is post-venture compensation, including employee stock options, at the non-venture
continuation of this company or another company. From equations (6) and (8), we have
W ∗(A) = A+w∗
r. (9)
Note that this is additive in A. But when future earnings are random, the entrepreneur’s
risk aversion enters the calculation of the wealth-equivalent.
We represent each of the value functions U(Wt(At)) as piecewise linear with 500 knots be-
tween zero and $49 million, spaced exponentially. We calculate them by backward recursion
(value function iteration). We assume power utility with constant relative risk aversion, γ.
We take as our base case γ = 2, a venture salary of w = $150, 000, post-venture compensation
of w = $300, 000, and starting assets of A0 = $1 million.
A useful feature of the wealth-equivalent is that the difference between its value for an
entrepreneur with given initial assets and its value for an individual who holds a non-venture
position paying w∗ and with the same initial assets is the amount that the second would be
willing to pay to become an entrepreneur. We call this the certainty-equivalent value of the
entrepreneurial opportunity and denote it A. This property follows from the additivity of
the non-entrepreneurial wealth-equivalent we noted earlier.
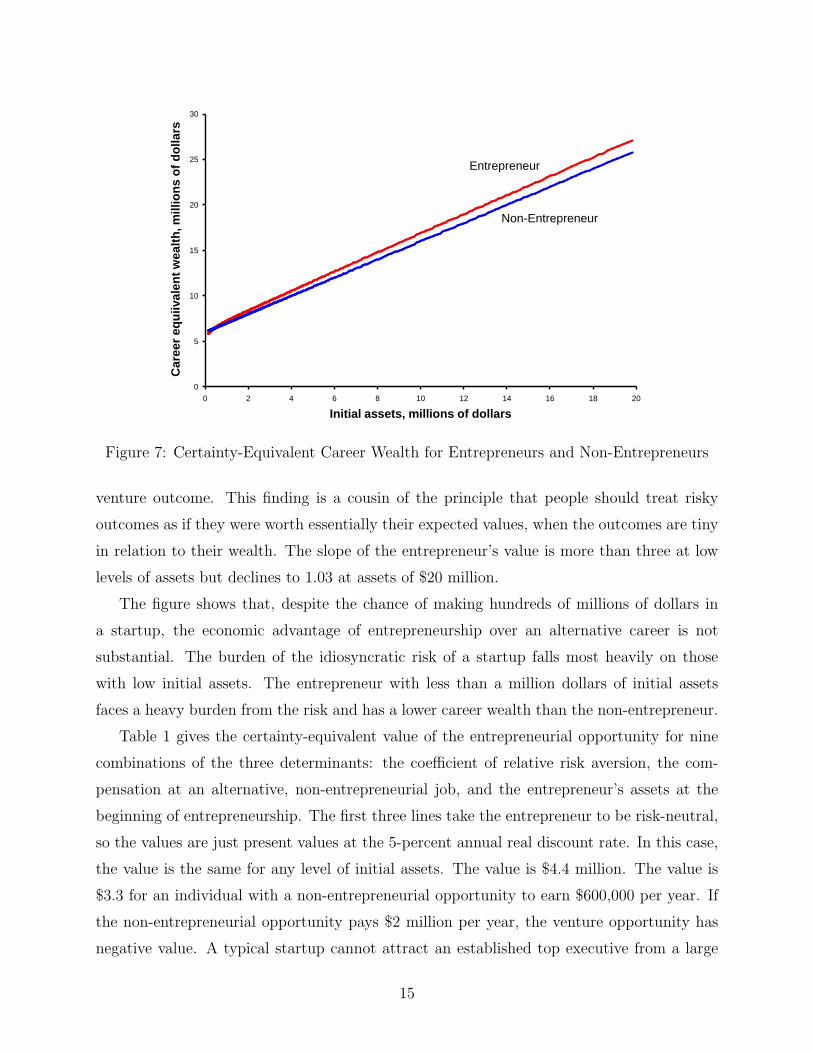
Figure 7 shows W0(A0), the wealth-equivalent for an entrepreneurial experience as of
its beginning and W ∗(A0), the wealth-equivalent for a non-entrepreneur, both as functions
of the common value of their initial assets, shown on the horizontal axis. The certainty-
equivalent value of the venture opportunity is the vertical difference between the two curves.
The non-entrepreneurial value is a straight line with unit slope—a dollar of extra initial
assets becomes a dollar of wealth, because the non-venture individual faces no uncertainty.
On the other hand, a dollar of extra initial assets becomes more than a dollar of equivalent
wealth, because initial wealth has no uncertainty and thus dilutes the uncertainty from the
14
0
5
10
15
20
25
30
0 2 4 6 8 10 12 14 16 18 20
Care
er
eq
uiivale
nt
wealt
h, m
illio
ns o
f d
ollars
Initial assets, millions of dollars
Entrepreneur
Non-Entrepreneur
Figure 7: Certainty-Equivalent Career Wealth for Entrepreneurs and Non-Entrepreneurs
venture outcome. This finding is a cousin of the principle that people should treat risky
outcomes as if they were worth essentially their expected values, when the outcomes are tiny
in relation to their wealth. The slope of the entrepreneur’s value is more than three at low
levels of assets but declines to 1.03 at assets of $20 million.
The figure shows that, despite the chance of making hundreds of millions of dollars in
a startup, the economic advantage of entrepreneurship over an alternative career is not
substantial. The burden of the idiosyncratic risk of a startup falls most heavily on those
with low initial assets. The entrepreneur with less than a million dollars of initial assets
faces a heavy burden from the risk and has a lower career wealth than the non-entrepreneur.
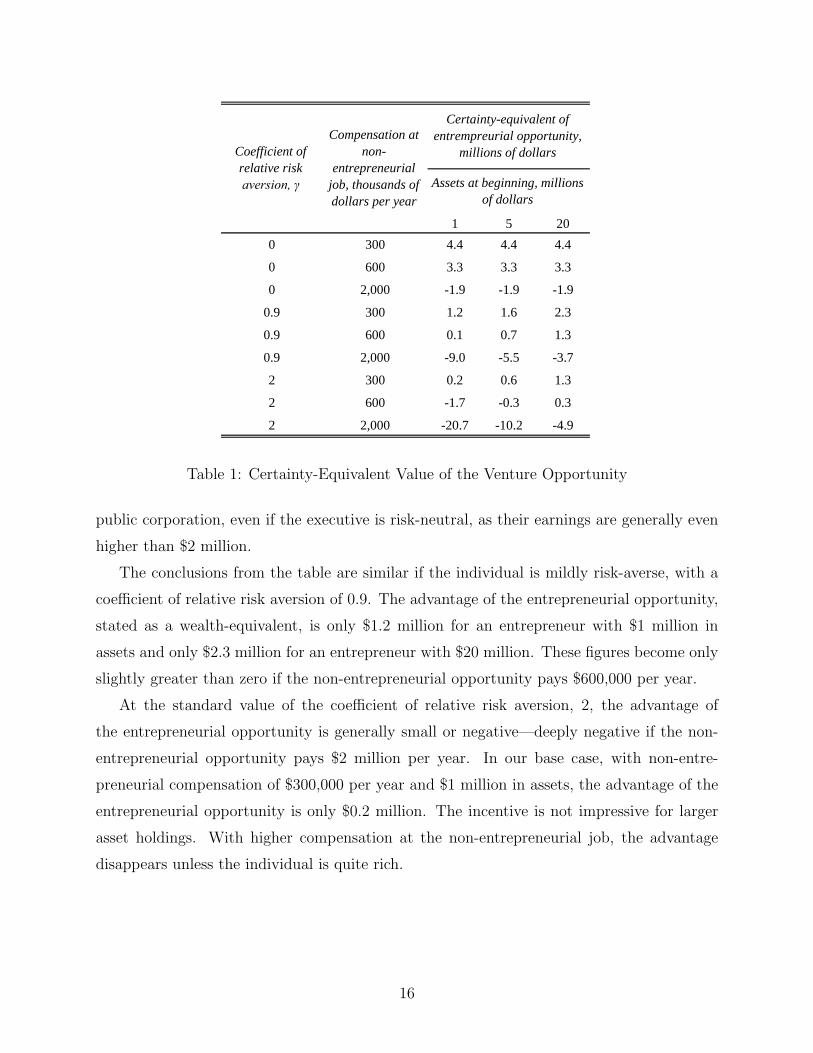
Table 1 gives the certainty-equivalent value of the entrepreneurial opportunity for nine
combinations of the three determinants: the coefficient of relative risk aversion, the com-
pensation at an alternative, non-entrepreneurial job, and the entrepreneur’s assets at the
beginning of entrepreneurship. The first three lines take the entrepreneur to be risk-neutral,
so the values are just present values at the 5-percent annual real discount rate. In this case,
the value is the same for any level of initial assets. The value is $4.4 million. The value is
$3.3 for an individual with a non-entrepreneurial opportunity to earn $600,000 per year. If
the non-entrepreneurial opportunity pays $2 million per year, the venture opportunity has
negative value. A typical startup cannot attract an established top executive from a large
15
Data from Matlab program DPMain, array Output
gamma w* 1 5 20
0 0.3 4.371 4.371 4.371
0 0.6 3.270 3.270 3.270
0 2 -1.868 -1.868 -1.868
0.9 0.3 1.207 1.585 2.258
0.9 0.6 0.061 0.719 1.262
0.9 2 -9.033 -5.477 -3.679
2 0.3 0.249 0.612 1.294
2 0.6 -1.685 -0.325 0.291
2 2 -20.651 -10.232 -4.859
1 5 20
0 300 4.4 4.4 4.4
0 600 3.3 3.3 3.3
0 2,000 -1.9 -1.9 -1.9
0.9 300 1.2 1.6 2.3
0.9 600 0.1 0.7 1.3
0.9 2,000 -9.0 -5.5 -3.7
2 300 0.2 0.6 1.3
2 600 -1.7 -0.3 0.3
2 2,000 -20.7 -10.2 -4.9
Coefficient of
relative risk
aversion, γ
Compensation at
non-
entrepreneurial
job, thousands of
dollars per year
Abar
Assets at beginning, millions
of dollars
Certainty-equivalent of
entrempreurial opportunity,
millions of dollars
Table 1: Certainty-Equivalent Value of the Venture Opportunity
public corporation, even if the executive is risk-neutral, as their earnings are generally even
higher than $2 million.
The conclusions from the table are similar if the individual is mildly risk-averse, with a
coefficient of relative risk aversion of 0.9. The advantage of the entrepreneurial opportunity,
stated as a wealth-equivalent, is only $1.2 million for an entrepreneur with $1 million in
assets and only $2.3 million for an entrepreneur with $20 million. These figures become only
slightly greater than zero if the non-entrepreneurial opportunity pays $600,000 per year.
At the standard value of the coefficient of relative risk aversion, 2, the advantage of
the entrepreneurial opportunity is generally small or negative—deeply negative if the non-
entrepreneurial opportunity pays $2 million per year. In our base case, with non-entre-
preneurial compensation of $300,000 per year and $1 million in assets, the advantage of the
entrepreneurial opportunity is only $0.2 million. The incentive is not impressive for larger
asset holdings. With higher compensation at the non-entrepreneurial job, the advantage
disappears unless the individual is quite rich.
16
6 Entrepreneurs in Aging Companies
Our discussion so far has focused on the risk-adjusted payoff to a potential entrepreneur at
the decision point when venture funding first becomes available. In this section, we consider
the same issue at later decision points, as the startup ages. Our discussion is conditional on
the company not having exited.
The dynamic program of equation (7) assigns a value Wt(At) to the entrepreneur’s posi-
tion in each year t that the company has not exited. Under our assumptions, the path is the
same for all companies. The entrepreneur’s value falls as the company ages for two reasons.
First, the entrepreneur generally consumes out of assets, so assets decline. Second, early
exits are the most valuable exits, so aging another year means that the remaining potential
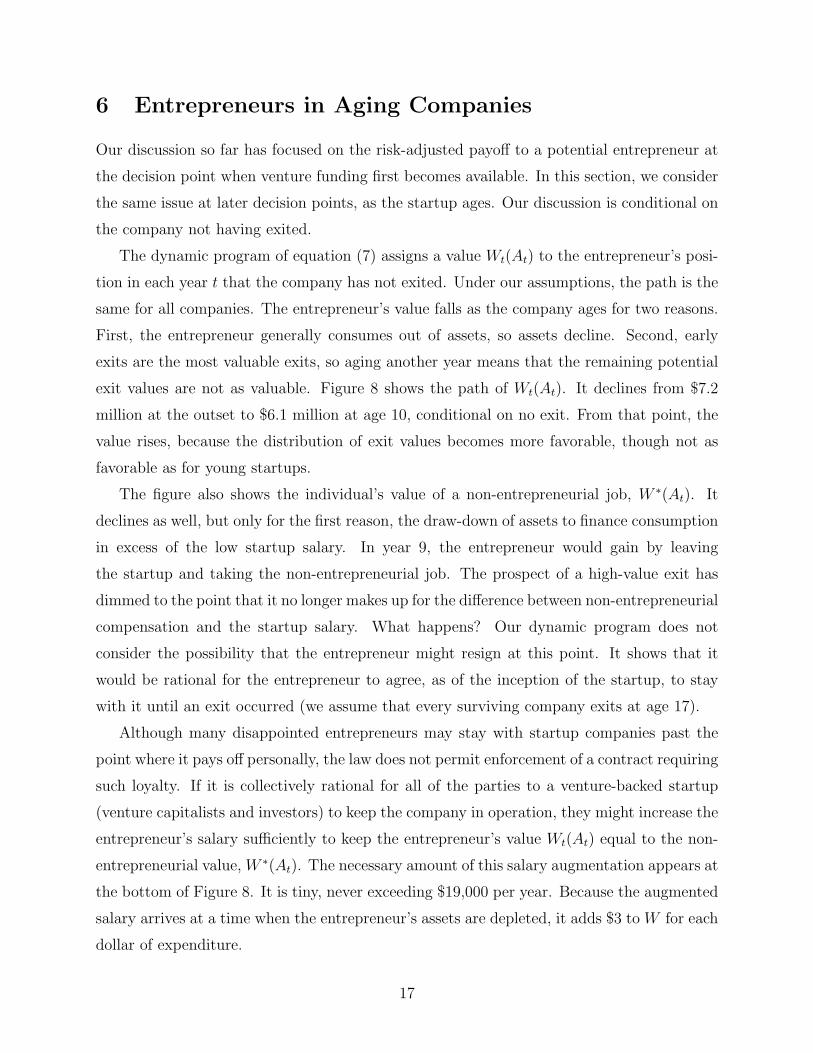
exit values are not as valuable. Figure 8 shows the path of Wt(At). It declines from $7.2
million at the outset to $6.1 million at age 10, conditional on no exit. From that point, the
value rises, because the distribution of exit values becomes more favorable, though not as
favorable as for young startups.
The figure also shows the individual’s value of a non-entrepreneurial job, W ∗(At). It
declines as well, but only for the first reason, the draw-down of assets to finance consumption
in excess of the low startup salary. In year 9, the entrepreneur would gain by leaving
the startup and taking the non-entrepreneurial job. The prospect of a high-value exit has
dimmed to the point that it no longer makes up for the difference between non-entrepreneurial
compensation and the startup salary. What happens? Our dynamic program does not
consider the possibility that the entrepreneur might resign at this point. It shows that it
would be rational for the entrepreneur to agree, as of the inception of the startup, to stay
with it until an exit occurred (we assume that every surviving company exits at age 17).
Although many disappointed entrepreneurs may stay with startup companies past the
point where it pays off personally, the law does not permit enforcement of a contract requiring
such loyalty. If it is collectively rational for all of the parties to a venture-backed startup
(venture capitalists and investors) to keep the company in operation, they might increase the
entrepreneur’s salary sufficiently to keep the entrepreneur’s value Wt(At) equal to the non-
entrepreneurial value, W ∗(At). The necessary amount of this salary augmentation appears at
the bottom of Figure 8. It is tiny, never exceeding $19,000 per year. Because the augmented
salary arrives at a time when the entrepreneur’s assets are depleted, it adds $3 to W for each
dollar of expenditure.
17
150
200
250
300
6.4
6.6
6.8
7.0
7.2
7.4
ds of d
ollars
s of dollars
Wt(At)
W*(At)
0
50
100
5.4
5.6
5.8
6.0
6.2
1 2 3 4 5 6 7 8 9 10 11 12 13 14 15 16 17
Thou
san
Millions
Year
Extra Salary (right scale)
Figure 8: Entrepreneurial Value and Non-Entrepreneurial Value Prior to Exit
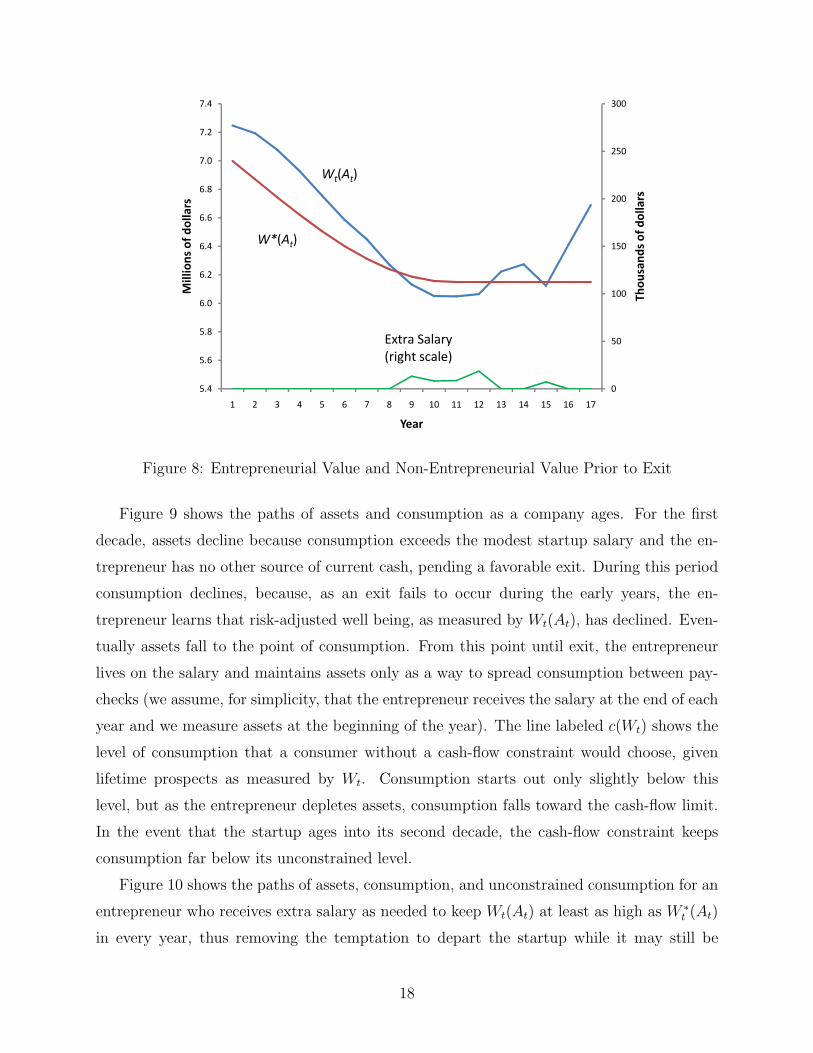
Figure 9 shows the paths of assets and consumption as a company ages. For the first
decade, assets decline because consumption exceeds the modest startup salary and the en-
trepreneur has no other source of current cash, pending a favorable exit. During this period
consumption declines, because, as an exit fails to occur during the early years, the en-
trepreneur learns that risk-adjusted well being, as measured by Wt(At), has declined. Even-
tually assets fall to the point of consumption. From this point until exit, the entrepreneur
lives on the salary and maintains assets only as a way to spread consumption between pay-
checks (we assume, for simplicity, that the entrepreneur receives the salary at the end of each
year and we measure assets at the beginning of the year). The line labeled c(Wt) shows the
level of consumption that a consumer without a cash-flow constraint would choose, given
lifetime prospects as measured by Wt. Consumption starts out only slightly below this
level, but as the entrepreneur depletes assets, consumption falls toward the cash-flow limit.
In the event that the startup ages into its second decade, the cash-flow constraint keeps
consumption far below its unconstrained level.
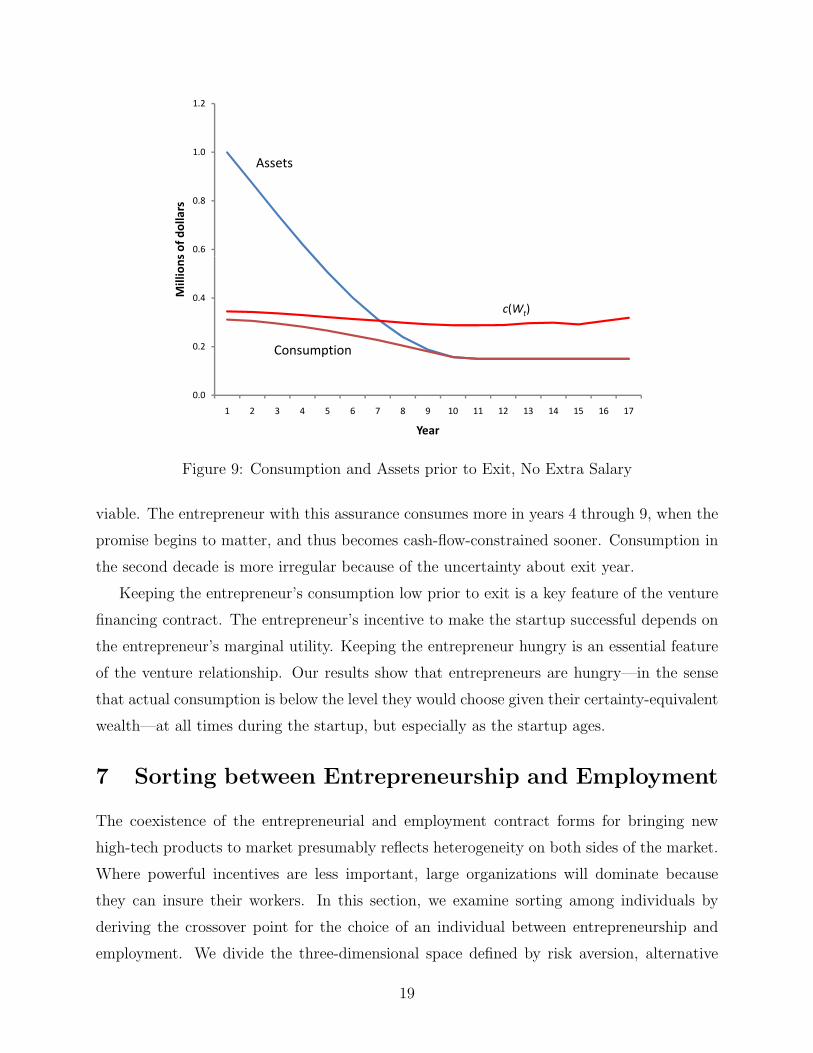
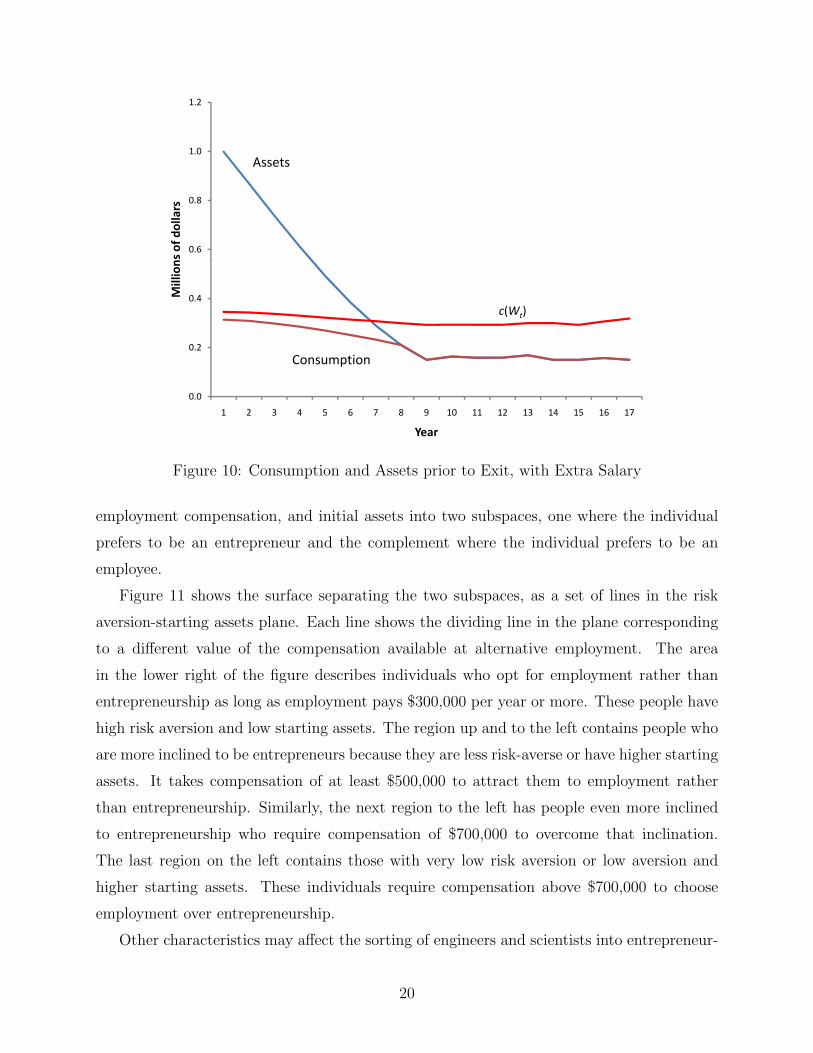
Figure 10 shows the paths of assets, consumption, and unconstrained consumption for an
entrepreneur who receives extra salary as needed to keep Wt(At) at least as high as W ∗t (At)
in every year, thus removing the temptation to depart the startup while it may still be
18
0.6
0.8
1.0
1.2
s of dollars
Assets
0.0
0.2
0.4
1 2 3 4 5 6 7 8 9 10 11 12 13 14 15 16 17
Millions
Year
c(Wt)
Consumption
Figure 9: Consumption and Assets prior to Exit, No Extra Salary
viable. The entrepreneur with this assurance consumes more in years 4 through 9, when the
promise begins to matter, and thus becomes cash-flow-constrained sooner. Consumption in
the second decade is more irregular because of the uncertainty about exit year.
Keeping the entrepreneur’s consumption low prior to exit is a key feature of the venture
financing contract. The entrepreneur’s incentive to make the startup successful depends on
the entrepreneur’s marginal utility. Keeping the entrepreneur hungry is an essential feature
of the venture relationship. Our results show that entrepreneurs are hungry—in the sense
that actual consumption is below the level they would choose given their certainty-equivalent
wealth—at all times during the startup, but especially as the startup ages.
7 Sorting between Entrepreneurship and Employment
The coexistence of the entrepreneurial and employment contract forms for bringing new
high-tech products to market presumably reflects heterogeneity on both sides of the market.
Where powerful incentives are less important, large organizations will dominate because
they can insure their workers. In this section, we examine sorting among individuals by
deriving the crossover point for the choice of an individual between entrepreneurship and
employment. We divide the three-dimensional space defined by risk aversion, alternative
19
0.6
0.8
1.0
1.2
s of dollars
Assets
0.0
0.2
0.4
1 2 3 4 5 6 7 8 9 10 11 12 13 14 15 16 17
Millions
Year
c(Wt)
Consumption
Figure 10: Consumption and Assets prior to Exit, with Extra Salary
employment compensation, and initial assets into two subspaces, one where the individual
prefers to be an entrepreneur and the complement where the individual prefers to be an
employee.
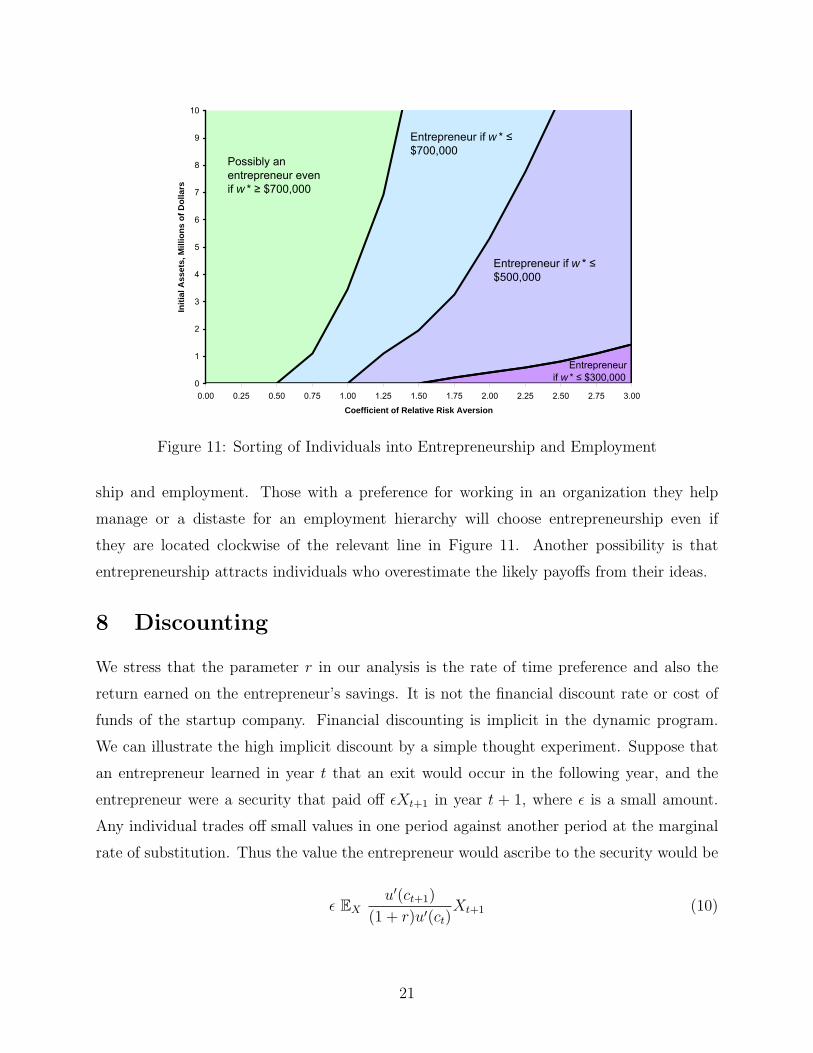
Figure 11 shows the surface separating the two subspaces, as a set of lines in the risk
aversion-starting assets plane. Each line shows the dividing line in the plane corresponding
to a different value of the compensation available at alternative employment. The area
in the lower right of the figure describes individuals who opt for employment rather than
entrepreneurship as long as employment pays $300,000 per year or more. These people have
high risk aversion and low starting assets. The region up and to the left contains people who
are more inclined to be entrepreneurs because they are less risk-averse or have higher starting
assets. It takes compensation of at least $500,000 to attract them to employment rather
than entrepreneurship. Similarly, the next region to the left has people even more inclined
to entrepreneurship who require compensation of $700,000 to overcome that inclination.
The last region on the left contains those with very low risk aversion or low aversion and
higher starting assets. These individuals require compensation above $700,000 to choose
employment over entrepreneurship.
Other characteristics may affect the sorting of engineers and scientists into entrepreneur-
20
0
1
2
3
4
5
6
7
8
9
10
0.00 0.25 0.50 0.75 1.00 1.25 1.50 1.75 2.00 2.25 2.50 2.75 3.00
Coefficient of Relative Risk Aversion
Initi
al A
sset
s, M
illio
ns o
f Dol
lars
Possibly an entrepreneur even if w * ≥ $700,000
Entrepreneur if w * ≤ $500,000
Entrepreneur if w * ≤ $300,000
Entrepreneur if w * ≤ $700,000
Figure 11: Sorting of Individuals into Entrepreneurship and Employment
ship and employment. Those with a preference for working in an organization they help
manage or a distaste for an employment hierarchy will choose entrepreneurship even if
they are located clockwise of the relevant line in Figure 11. Another possibility is that
entrepreneurship attracts individuals who overestimate the likely payoffs from their ideas.
8 Discounting
We stress that the parameter r in our analysis is the rate of time preference and also the
return earned on the entrepreneur’s savings. It is not the financial discount rate or cost of
funds of the startup company. Financial discounting is implicit in the dynamic program.
We can illustrate the high implicit discount by a simple thought experiment. Suppose that
an entrepreneur learned in year t that an exit would occur in the following year, and the
entrepreneur were a security that paid off εXt+1 in year t + 1, where ε is a small amount.
Any individual trades off small values in one period against another period at the marginal
rate of substitution. Thus the value the entrepreneur would ascribe to the security would be
ε EXu′(ct+1)
(1 + r)u′(ct)Xt+1 (10)
21
The discount factor Dt is the ratio of this value to the expected value,
Dt =EX
u′(ct+1)(1+r)u′(ct)
Xt+1
EX Xt+1
(11)
In our base case, with coefficient of relative risk aversion of two, the discount factor Dt
varies from 0.09 to 0.22 over the age of the company. Thus a claim that had an expected
payoff of one dollar next year, in proportion to the distribution of the exit value next year,
would be worth only $0.09 to $0.22 this year. Conceptually, the discount breaks down into
a pure time element and an element relating to the fact that the amount of the exit value
will become known next year. The pure time discount is just the 5 percent in 11+r
. All
the rest of the discount comes from the uncertainty in the exit value. The reason that the
entrepreneur puts such a low value on the payoff εXt+1 is that it delivers almost all its value
in circumstances where the entrepreneur is rich and has low marginal utility. Notice that
D = 11.05
for a risk-neutral entrepreneur with constant marginal utility.
9 Serial Entrepreneurship
Gompers, Kovner, Lerner and Scharfstein (2008) report that about 12 percent of venture-
backed entrepreneurs have served in that role in an earlier venture-backed startup. Our
dynamic program, equation (7), does not consider that possibility. We could alter the pro-
gram to include the 12 percent likelihood of future entrepreneurship, though this alteration
would come at a considerable complication in calculating the value functions, because the
same function would appear after the exit in the future and at time zero. The effect would be
a slight increase in the value of entrepreneurship relative to employment. None of our conclu-
sions would be significantly affected, because the probability of repeating as an entrepreneur
is relatively small.
Our results have an interesting implication for serial entrepreneurship. Figure 11 shows
that the choice between entrepreneurship and employment is sensitive to assets. A successful
exit will give an entrepreneur a substantial level of assets, far up the vertical axis in the figure.
Hence further entrepreneurship becomes far more attractive relative to employment after a
success. Wealth from a successful earlier exit relieves the burden of the idiosyncratic risk of
a second startup.
22
10 Concluding Remarks
The contract between venture capital and entrepreneurs does essentially nothing to alleviate
their financial extreme specialization in their own companies. Given the nature of the gamble
revealed in Figure 2, entrepreneurs would benefit by selling some of the value that they would
receive in the best outcome on the right, when they would be seriously rich, in exchange for
more wealth in the most likely of zero exit value, on the left. It would be hard to find a
more serious violation of the Borch-Arrow optimality condition—equality of marginal utility
in all states of the world—than in the case of entrepreneurs.
A diversified investor would be happy to trade this off at a reasonable price, given that
most of the risk is idiosyncratic and diversifiable. But venture capitalists will not do this—
they don’t buy out startups at the early stages and they don’t let entrepreneurs pay them-
selves generous salaries. They use the exit value as an incentive for the entrepreneurs to
perform their jobs. Moral hazard and adverse selection bar the provision of any type of
insurance to entrepreneurs—they must bear the huge risk shown in Figure 2.
The venture capital institutions of the United States convert ideas into functioning busi-
nesses. We show that the process contains an important bottleneck—for good reasons based
mainly on moral hazard, the venture contract cannot insure entrepreneurs against the huge
idiosyncratic risk of a startup. Risk-adjusted payoffs to the entrepreneurs of startups are
remarkably small. Although our results are based entirely on the venture process, we believe
that no other arrangement is much better at solving the problem of getting smart people to
commercialize their good ideas.
The approach to the measurement of the burden of non-diversifiable risk developed in
this paper applies to many other settings as well. Executives of large companies often have
employment contracts exposing them to their employer’s idiosyncratic risk. Employees in
general are exposed to the idiosyncratic risks of their jobs and of their human capital. The
self-employed, including authors, composers, and inventors, bear large amounts of undiver-
sifiable idiosyncratic risk. Given panel data on the cash receipts of these people, one could
apply the method of this paper directly.
23
References
Admati, Anat R. and Paul Pfleiderer, “Robust Financial Contracting and the Role of
Venture Capitalists,” Journal of Finance, 1994, 49 (2), 371.
Bagley, Constance E. and Craig E. Dauchy, The Entrepreneur’s Guide to Business Law,
West Legal Studies in Business, 2003.
Casamatta, Catherine, “Financing and Advising: Optimal Financial Contracts with Venture
Capitalists,” Journal of Finance, October 2003, 58 (5), 2059.
Gompers, Paul, Anna Kovner, Josh Lerner, and David Scharfstein, “Performance Persistence
in Entrepreneurship,” May 2008. Harvard Business School.
Hall, Robert E. and Susan E. Woodward, “The Incentives to Start New Companies: Ev-
idence from Venture Capital,” April 2007. Hoover Inistitution, Stanford University,
stanford.edu/∼rehall.
Heaton, John and Deborah Lucas, “Capital Structure, Hurdle Rates, and Portfolio Choice—
Interactions in an Entrepreneurial Firm,” May 2004. University of Chicago and North-
western University.
Repullo, Rafael and Javier Suarez, “Venture Capital Finance: A Security Design Approach,”
Review of Finance, 2004, 8, 75–108.
Schmidt, Klaus M., “Convertible Securities and Venture Capital Finance,” Journal of Fi-
nance, June 2003, 58 (3), 1139.
Wilmerding, Alex, Deal Terms: The Finer Points of Venture Capital Deal Structures,
Valuations, Term Sheets, Stock Options, and Getting Deals Done, Aspatore, 2003.
24