The Browning of America: The Growing Hispanic Presence in the U.S. Presidents Conference Council for...
16
The Browning of America: The Growing Hispanic Presence in the U.S. Presidents Conference Council for Christian Colleges & Universities January 28, 2011 Luis Lugo Director, Pew Forum on Religion & Public Life Washington, D.C. www.pewforum.org
-
Upload
alexandra-ada-payne -
Category
Documents
-
view
213 -
download
0
Transcript of The Browning of America: The Growing Hispanic Presence in the U.S. Presidents Conference Council for...

The Browning of America: The Growing Hispanic Presence in the U.S.
Presidents ConferenceCouncil for Christian Colleges & Universities
January 28, 2011
Luis LugoDirector, Pew Forum on Religion & Public Life
Washington, D.C.
www.pewforum.org
2
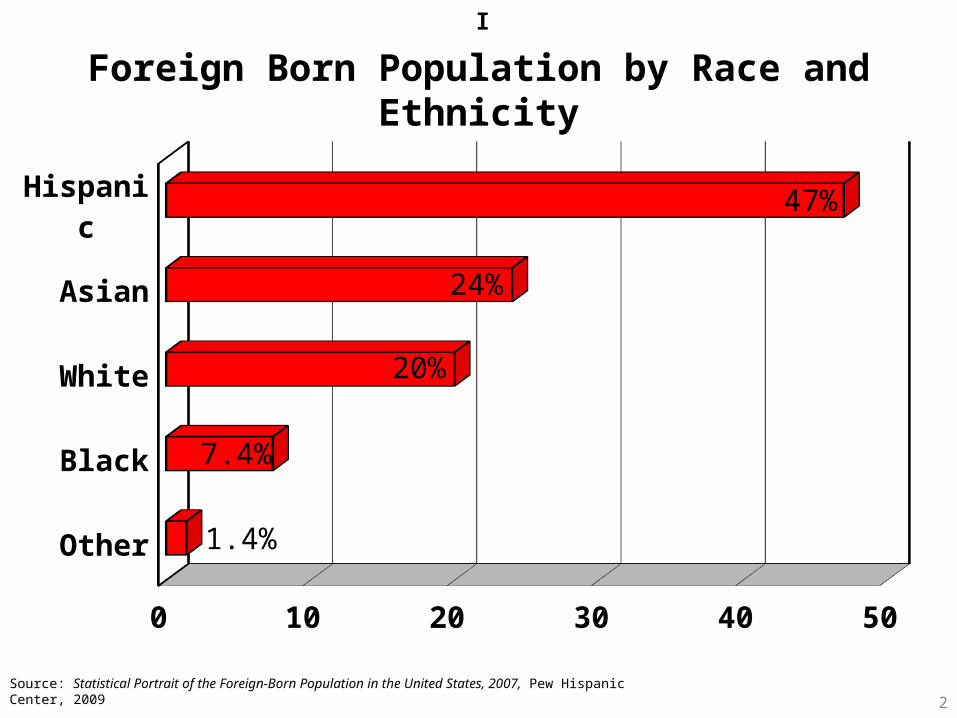
Foreign Born Population by Race and Ethnicity
Source: Statistical Portrait of the Foreign-Born Population in the United States, 2007, Pew Hispanic Center, 2009
Other
Black
White
Asian
His-panic
0 10 20 30 40 50
1.4%
7.4%
20%
24%
47%
I

3
Fertility Rates by Ethnicity
2.1
2.9
2.01.9 1.8
0
0.5
1
1.5
2
2.5
3
All Hispanics Blacks Asians Whites
Source: National Center for Health Statistics, 2007

4
Hispanic Population in the U.S.(Actual and Projected)
14.5
42.3
6.3
83.7
127.8
0
20
40
60
80
100
120
140
1960 1970 1980 1990 2000 2005 2010 2020 2030 2040 2050
Mill
ions
Source: U.S. Population Projections: 2005-2050, Pew Research Center, 2008

5
Population by Race and Ethnicity, Actual and Projected: 1960, 2005 and 2050
(% of total)
White Hispanic Black Asian0
102030405060708090
100
3.5
14
29%
1960 2005 2050
Source: U.S. Population Projections: 2005-2050, Pew Research Center, 2008

6
Religious Affiliation of Foreign and Native Born
Source: U.S. Religious Landscape Survey, Religious Affiliation: Diverse and Dynamic, p. 47; *Includes respondents who were born in U.S. territories (Guam, U.S. Virgin Islands, etc.) and Puerto Rico.
Total Population Native Born Foreign Born*Christian 78% 79% 74%
Protestant 51 55 24 Evangelical churches 26 28 15 Mainline churches 18 20 7 Historically black churches 7 8 2 Catholic 24 21 46 Mormon 1.7 1.8 0.9 Jehovah’s Witness 0.7 0.7 1.0 Orthodox 0.6 0.4 1.8
Other Religions 5 4 9
Jewish 1.7 1.8 1.5 Muslim 0.6 0.3 1.7 Buddhist 0.7 0.6 1.6 Hindu 0.4 <0.3 3.0 Unaffiliated 16 16 16
II

7
Religious Affiliation of Immigrants by Time of Arrival
1910- 1960- 1970- 1980- 1990- 2000-1959 1969 1979 1989 1999 2007
Christian 78% 78% 68% 76% 74% 74%
Protestant 33 30 24 27 21 22 Evangelical churches 13 15 15 17 13 13 Mainline churches 19 14 7 7 5 5 Historically black churches 1 1 1 3 3 3 Catholic 42 44 39 45 49 48 Mormon 1 1 2 1 1 1 Jehovah’s Witness 1 1 1 1 1 1 Orthodox 2 2 2 2 2 2 Other Religions 7 8 12 10 8 8 Jewish 3 3 3 2 1 1 Muslim <0.5 <0.5 2 2 1 2 Buddhist 1 2 2 2 1 1 Hindu <0.5 2 3 3 4 4
Unaffiliated 13 14 19 14 18 16
Source: U.S. Religious Landscape Survey, Religious Affiliation, p. 51.
8
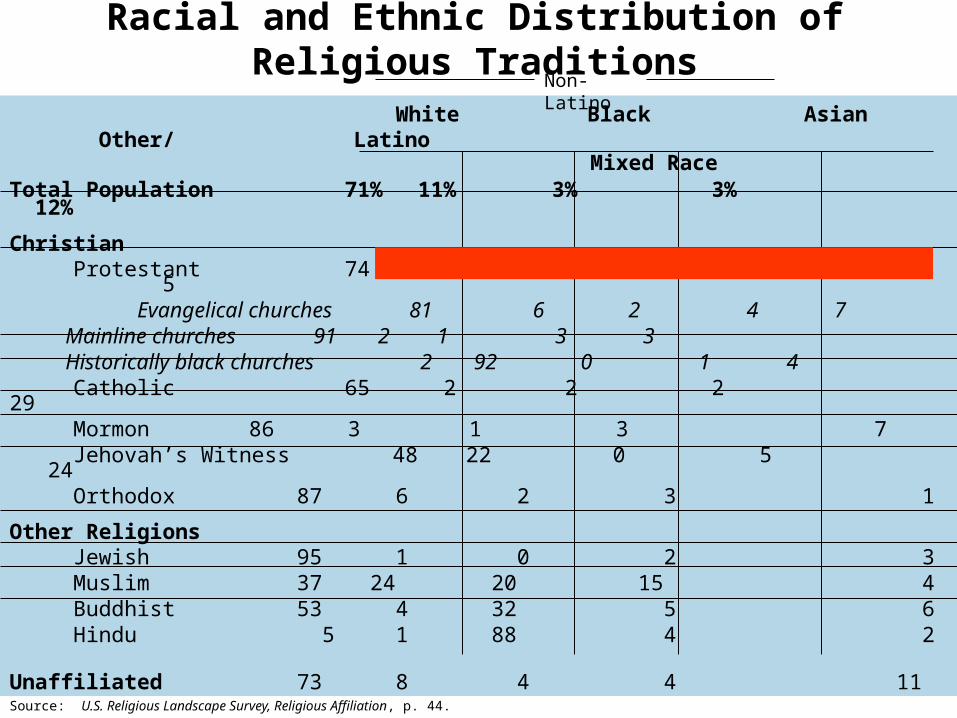
Racial and Ethnic Distribution of Religious Traditions
White Black Asian Other/ Latino Mixed Race
Total Population 71% 11% 3% 3% 12%
Christian Protestant 74 16 1 3 5 Evangelical churches 81 6 2 4 7 Mainline churches 91 2 1 3 3 Historically black churches 2 92 0 1 4 Catholic 65 2 2 2 29 Mormon 86 3 1 3 7 Jehovah’s Witness 48 22 0 5 24 Orthodox 87 6 2 3 1
Other Religions Jewish 95 1 0 2 3 Muslim 37 24 20 15 4 Buddhist 53 4 32 5 6 Hindu 5 1 88 4 2 Unaffiliated 73 8 4 4 11
Source: U.S. Religious Landscape Survey, Religious Affiliation, p. 44.
Non-Latino

9
Denominational Distribution of Latinos
Source: Changing Faiths: Latinos and the Transformation of American Religion, p. 7. Pew Forum on Religion & Public Life and Pew Hispanic Center, 2007.Note: Percentages may not sum to 100 due to rounding.
Catholic 67.6%Protestant 19.6 Baptist 6.9 Independent/Nondenominational 3.0 Congregational/Church of Christ 0.7 Presbyterian 0.3 Methodist 0.3 Lutheran 0.2 Episcopalian 0.2 Reformed 0.0 Something else 2.3 Nothing in particular 1.5 DK/Refused 1.1
Other Christians 2.7 Jehovah’s Witness 1.9 Mormon 0.7 Orthodox 0.1
Other Faiths 0.9
Unaffiliated 7.8
DK/Refused 1.1

10
Religious Tradition Among Latinos by Country of Origin
% who are... All Hispanics Mexico
Puerto Rico Cuba
Dominican Republic
Central America
South America
Catholic 68% 74% 49% 60% 68% 60% 71%
Evangelical 15 12 27 14 9 22 11
Mainline Protestant
5 4 9 7 6 3 3
Other Christian 3 3 4 1 2 2 2
Unaffiliated 8 7 9 14 9 12 8
Source: Changing Faiths, p. 13.

11
Renewalism Among Latino Protestants
Pentecostals Charismatics Neither
All 31% 26% 44%
Country of OriginMexican 28 25 47Puerto Rican 36 31 33Cuban 34 21 45Dominican 40 13 47Central American 38 27 36South American 29 31 40
NativityForeign Born 36 25 39Native Born 25 26 49
Non-Hispanic Protestants 9 9 82†
Source: Changing Faiths, p. 30.
†Source: 2006 Pew Forum Global Survey of Pentecostals.

Conversion Among Latinos by Religious Affiliation
% who are... All Mainline Other Hispanics Catholic Evangelical Protestant Christian Unaffiliated
Converts 18% 2% 51% 32% 52% 65% Formerly Catholic 13 * 43 26 41 39 Formerly Protestant 3 1 4 5 10 15
Not Converts 82 98 49 68 48 35
Source: Changing Faiths, p. 40.
Among Hispanics who are currently…

Estimates of the U.S. Unauthorized Immigrant Population from Latin America, 2000-2008
-13-
2000 2001 2002 2003 2004 2005 2006 2007 2008 20090
2
4
6
8
10
12
6.67.1
7.48
8.48.9
9.610.1
9.6
8.9
Source: Trends in Unauthorized Immigration: Undocumented Inflow Now Trails Legal Inflow & U.S. Unauthorized Immigration Flows Are Down Sharply Since Mid-Decade, Pew Hispanic Center, 2008 & 2010
III

14
English Proficiency Among Foreign Born Adults
Non-Hisp. Other
Non-Hisp. Asian
Non-Hisp. Black
Non-Hisp. White
Hispanic
0 10 20 30 40 50 60 70 80 90 100
Speaks only English Speaks English very well
Speaks English less than very well
Source: 2006 American Community Survey

15
Religious Tradition Among Hispanic Adults by Education and Income
EducationAll
U.S.All
Hispanics Catholic Evangelical Mainline Protestant
Other Christian Unaffiliated
Less than high school degree
14% 39% 42% 34% 30% 37% 33%
High school degree
36 47 44 54 56 52 49
Four-year college degree
16 10 9 10 12 9 17
Income
Less than $30,000
31 43 46 39 29 45 41
$30,000-$49,000
22 19 18 24 21 26 21
$50,000 or more 48 17 14 21 24 11 25
Source for Hispanics: Changing Faiths, p. 12.
Source for Total U.S. Population: U.S. Religious Landscape Survey, Religious Affiliation, p. 56, 60.
Among Hispanics…

www.pewforum.org