Ice cream Truck Service Toronto & Ice Cream Truck Mississauga
Upload
asad-akhundCategory
view
93download
1
The Bear’s Ice CreamAsad Akhund
Heather BartonMark BushnellMelanie Kern
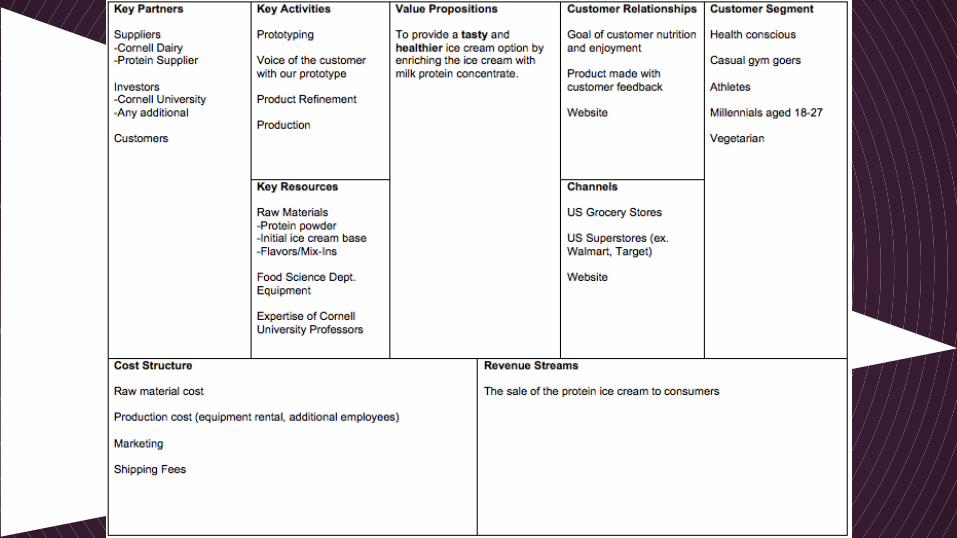
Value PropositionCreate a tasty, healthier ice cream option by enriching ice cream with milk protein concentrate.
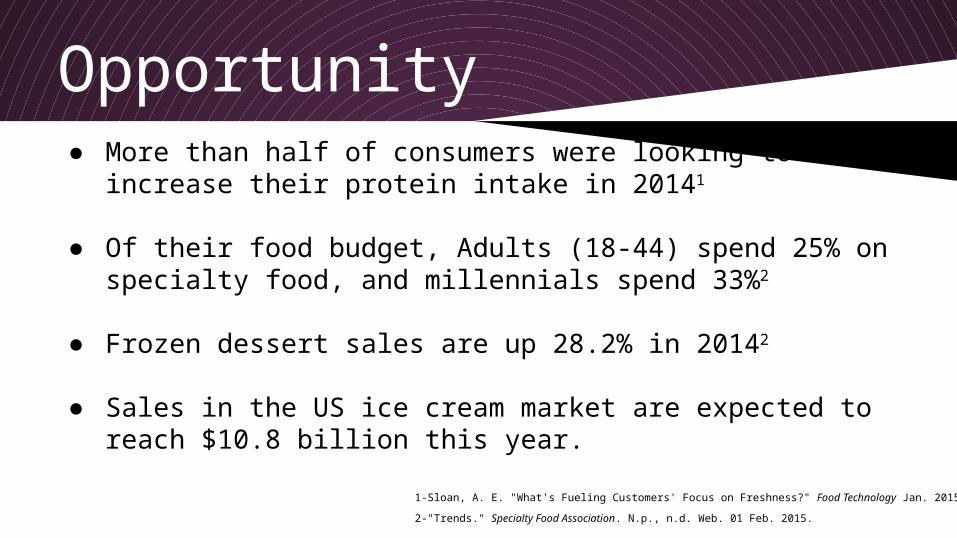
Opportunity● More than half of consumers were looking to increase
their protein intake in 20141
● Of their food budget, Adults (18-44) spend 25% on specialty food, and millennials spend 33%2
● Frozen dessert sales are up 28.2% in 20142
● Sales in the US ice cream market are expected to reach $10.8 billion this year.
1-Sloan, A. E. "What's Fueling Customers' Focus on Freshness?" Food Technology Jan. 2015: n. pag. Web.
2-"Trends." Specialty Food Association. N.p., n.d. Web. 01 Feb. 2015.
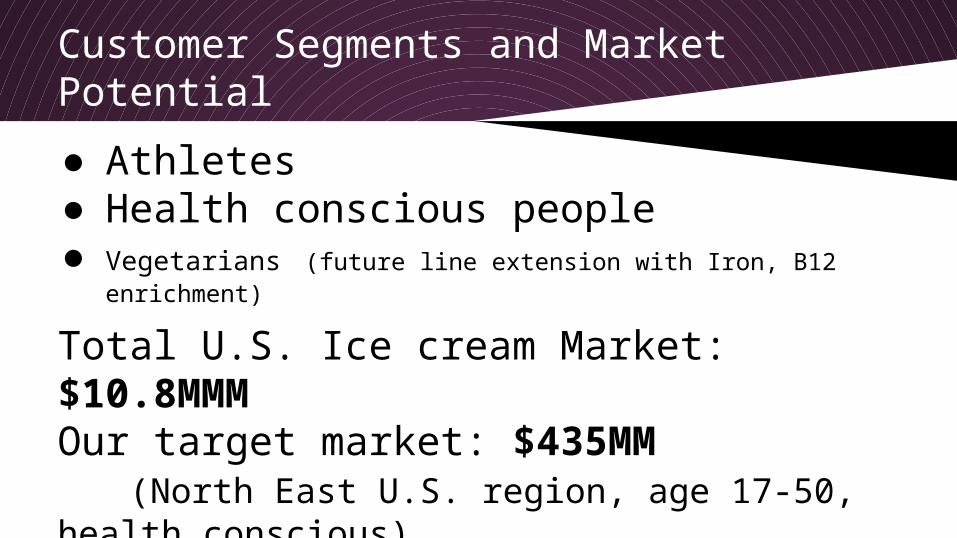
Customer Segments and Market Potential
● Athletes● Health conscious people● Vegetarians (future line extension with Iron, B12 enrichment)
Total U.S. Ice cream Market: $10.8MMMOur target market: $435MM (North East U.S. region, age 17-50, health conscious)
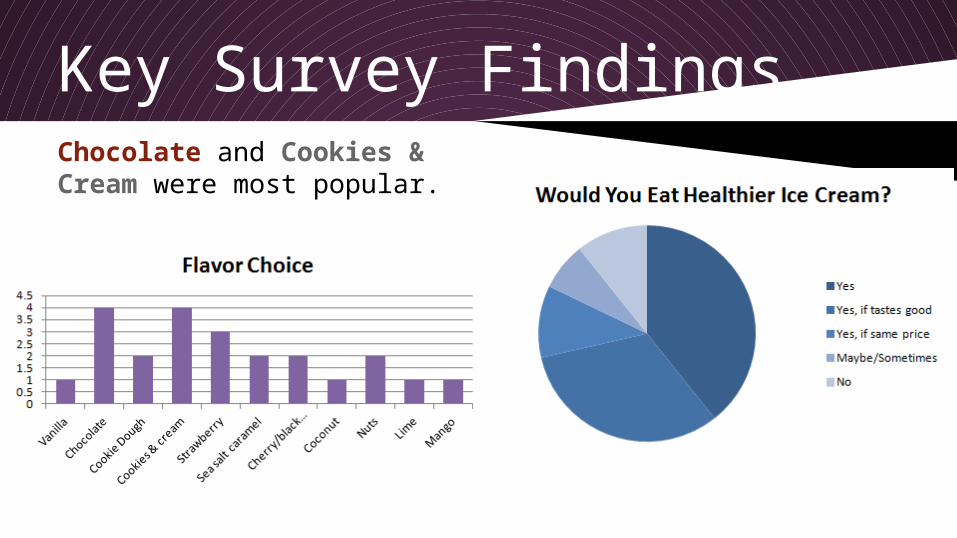
Key Survey FindingsChocolate and Cookies & Cream were most popular.
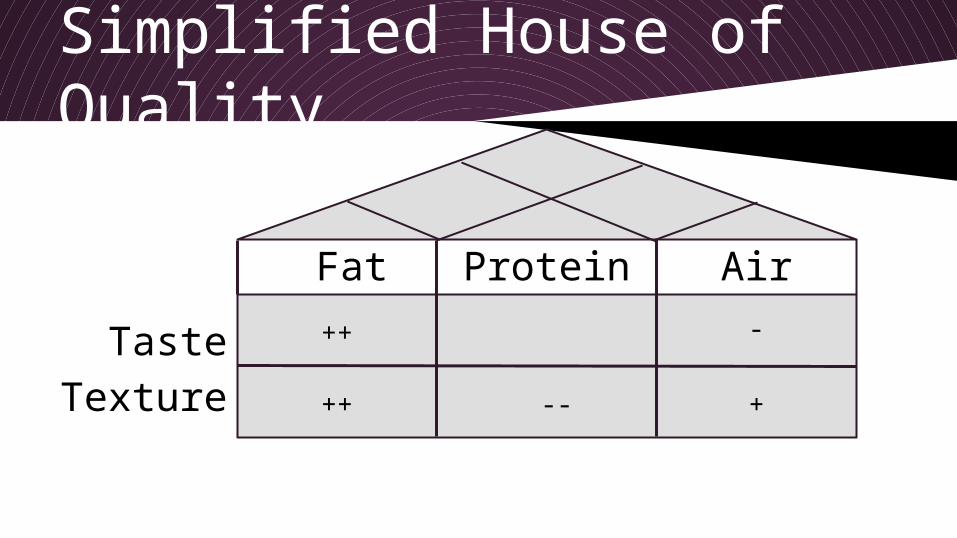
Simplified House of Quality
TasteTexture
Fat Protein Air
++ -
+++ --
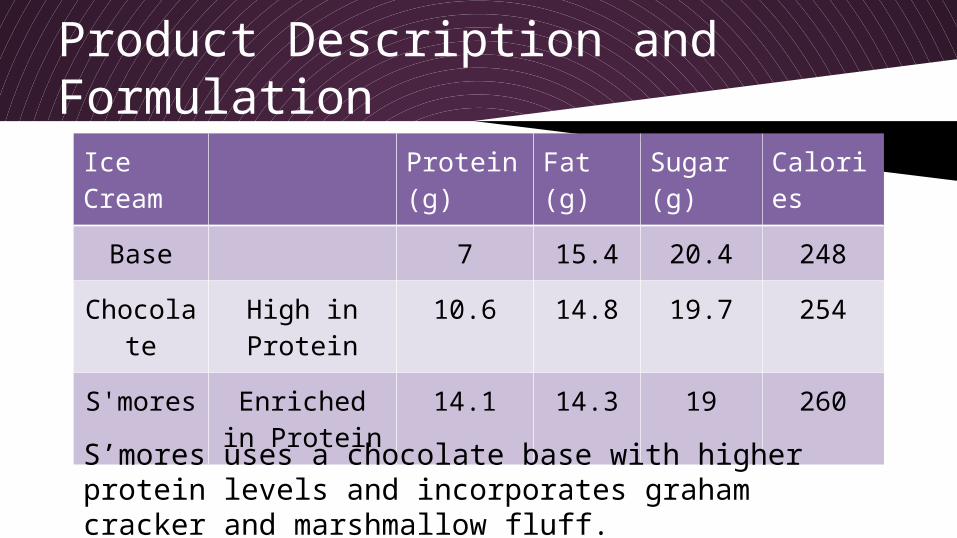
Product Description and Formulation
Ice Cream Protein (g) Fat (g) Sugar (g) Calories
Base 7 15.4 20.4 248
Chocolate High in Protein 10.6 14.8 19.7 254
S'mores Enriched in Protein
14.1 14.3 19 260
S’mores uses a chocolate base with higher protein levels and incorporates graham cracker and marshmallow fluff.
Intellectual Property● No patent anticipated● Production process is no different from
other ice creams● Keep formula as a trade secret
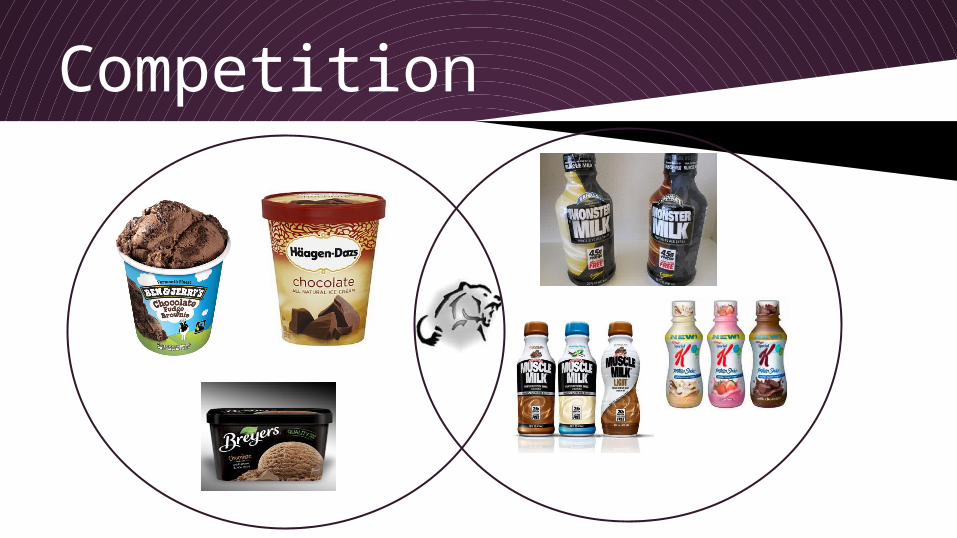
Competition
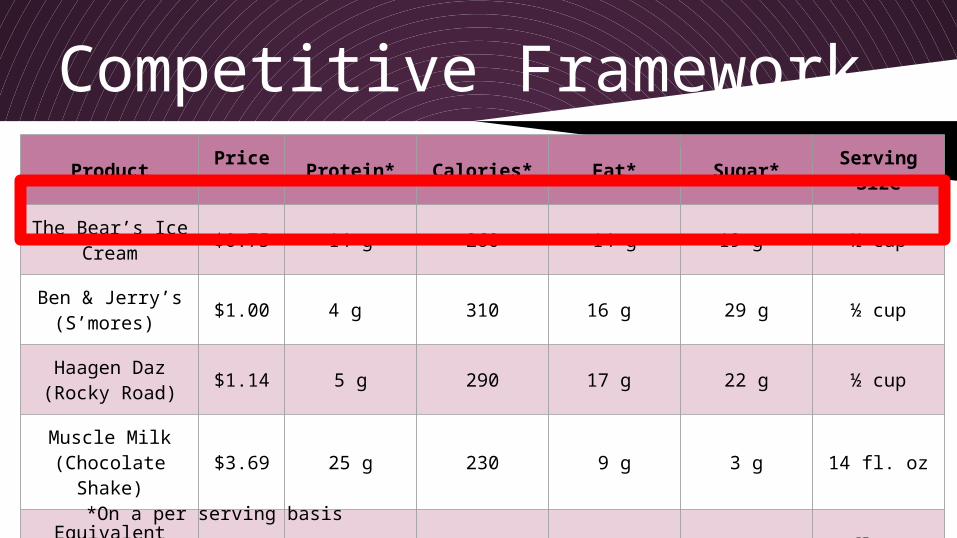
Competitive FrameworkProduct Price* Protein* Calories* Fat* Sugar* Serving Size
The Bear’s Ice Cream $0.75 14 g 260 14 g 19 g ½ cup
Ben & Jerry’s (S’mores) $1.00 4 g 310 16 g 29 g ½ cup
Haagen Daz (Rocky Road) $1.14 5 g 290 17 g 22 g ½ cup
Muscle Milk (Chocolate Shake) $3.69 25 g 230 9 g 3 g 14 fl. oz
Equivalent Muscle Milk portion size $1.05 7 g 70 3 g 1 g 4 fl. oz. (½
cup)
*On a per serving basis
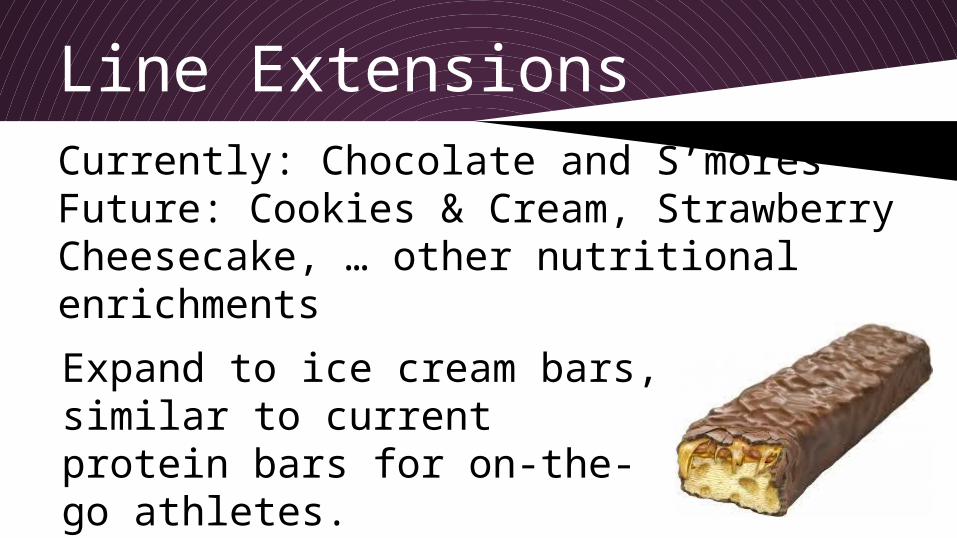
Line ExtensionsCurrently: Chocolate and S’moresFuture: Cookies & Cream, Strawberry Cheesecake, … other nutritional enrichments
Expand to ice cream bars, similar to current protein bars for on-the-go athletes.
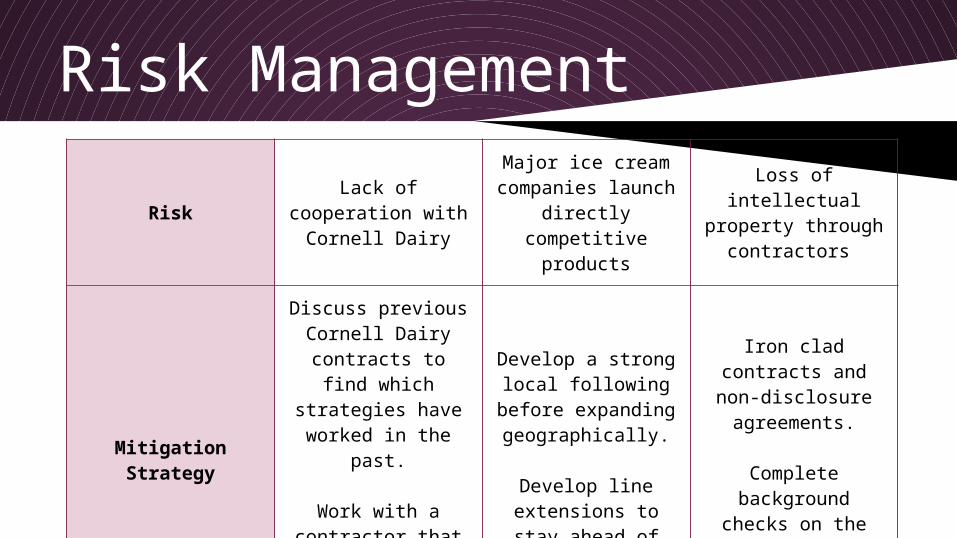
Risk Management
RiskLack of cooperation with Cornell Dairy
Major ice cream companies launch directly competitive
products
Loss of intellectual property through
contractors
Mitigation Strategy
Discuss previous Cornell Dairy
contracts to find which strategies have
worked in the past.
Work with a contractor that does not produce their own ice cream.
Develop a strong local following before
expanding geographically.
Develop line extensions to stay
ahead of our competition.
Iron clad contracts and non-disclosure
agreements.
Complete background checks on the
contracting company.
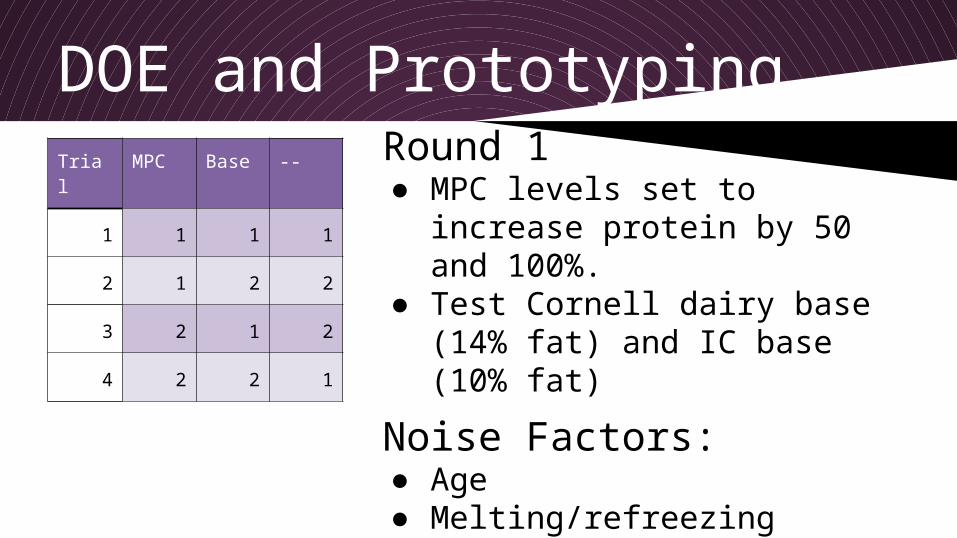
DOE and PrototypingRound 1● MPC levels set to increase
protein by 50 and 100%.● Test Cornell dairy base (14%
fat) and IC base (10% fat)
Noise Factors:● Age● Melting/refreezing
Trial MPC Base --
1 1 1 1
2 1 2 2
3 2 1 2
4 2 2 1
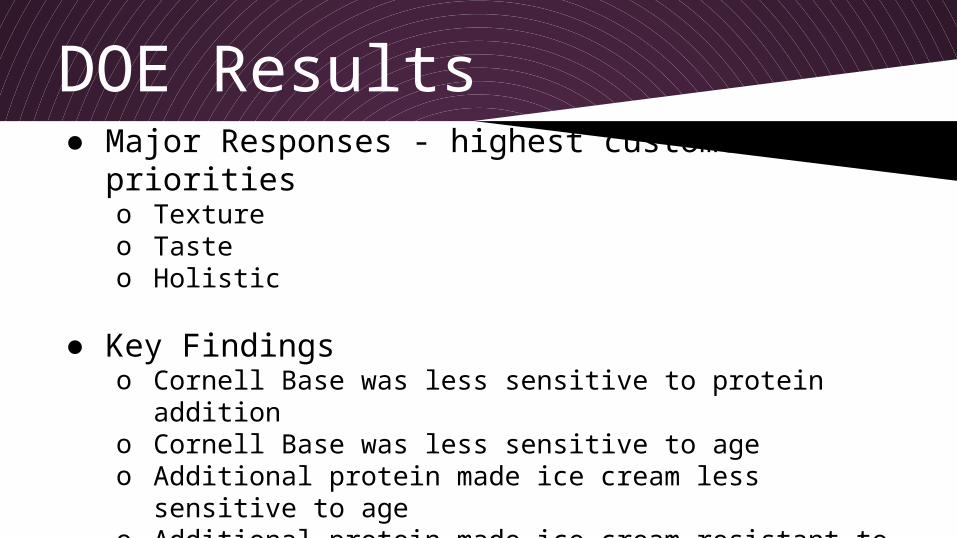
DOE Results● Major Responses - highest customer priorities
o Textureo Tasteo Holistic
● Key Findingso Cornell Base was less sensitive to protein additiono Cornell Base was less sensitive to ageo Additional protein made ice cream less sensitive to
ageo Additional protein made ice cream resistant to melting
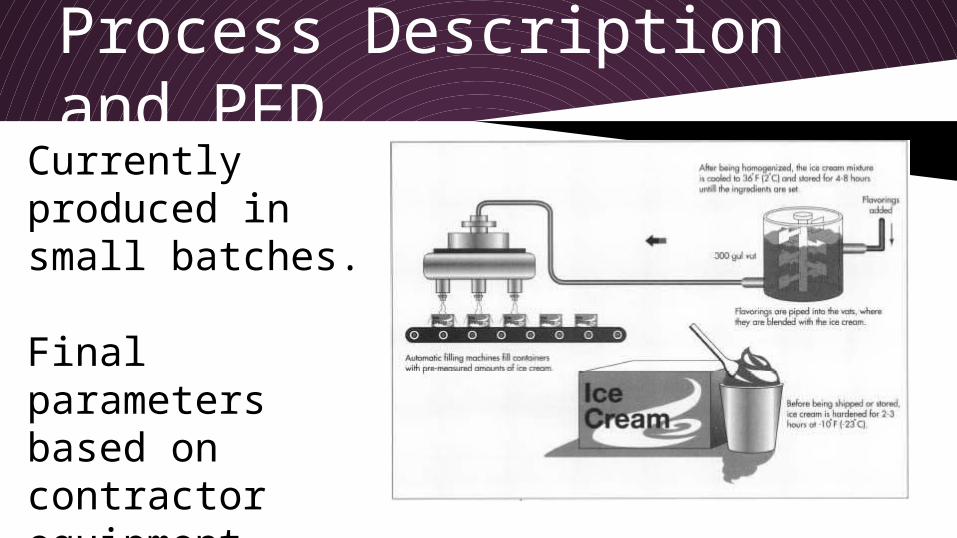
Process Description and PFD
Currently produced in small batches.
Final parameters based on contractor equipment.
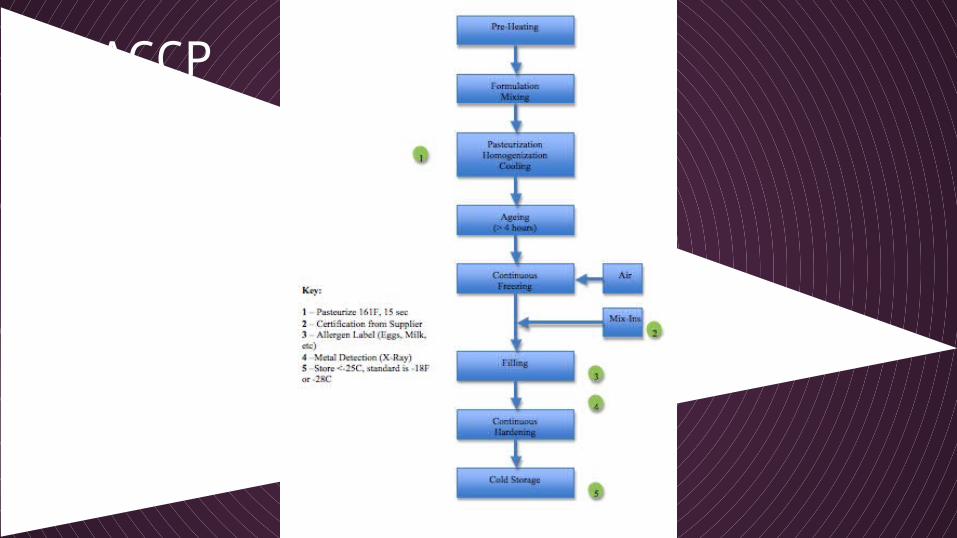
HACCP
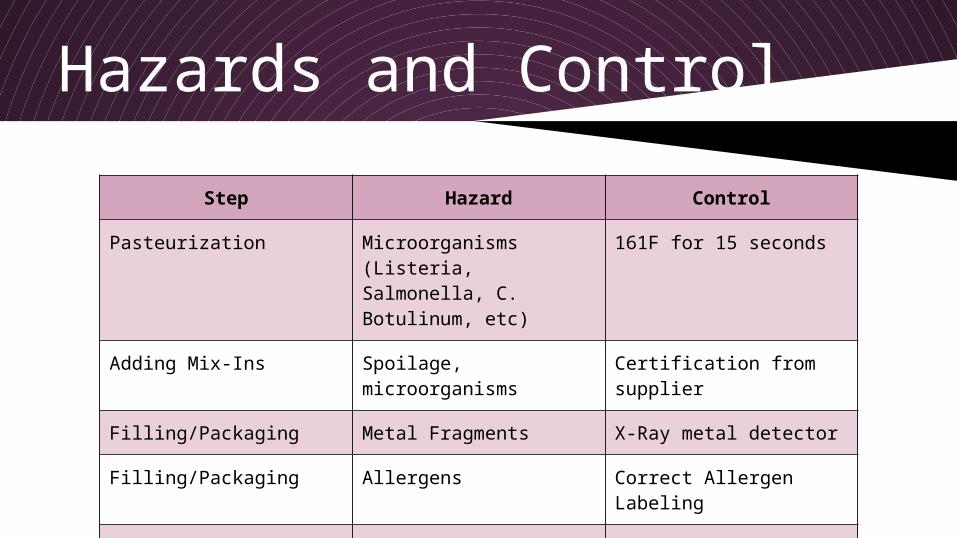
Hazards and Control
Step Hazard Control
Pasteurization Microorganisms (Listeria, Salmonella, C. Botulinum, etc)
161F for 15 seconds
Adding Mix-Ins Spoilage, microorganisms Certification from supplier
Filling/Packaging Metal Fragments X-Ray metal detector
Filling/Packaging Allergens Correct Allergen Labeling
Storage Spoilage, microbial growth Store Below -25C
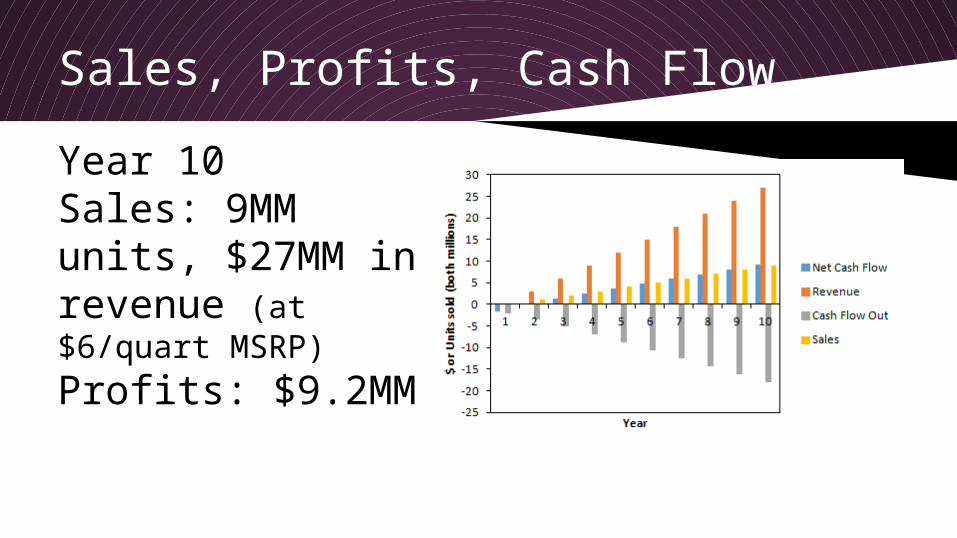
Sales, Profits, Cash Flow
Year 10Sales: 9MM units, $27MM in revenue (at $6/quart MSRP)Profits: $9.2MM
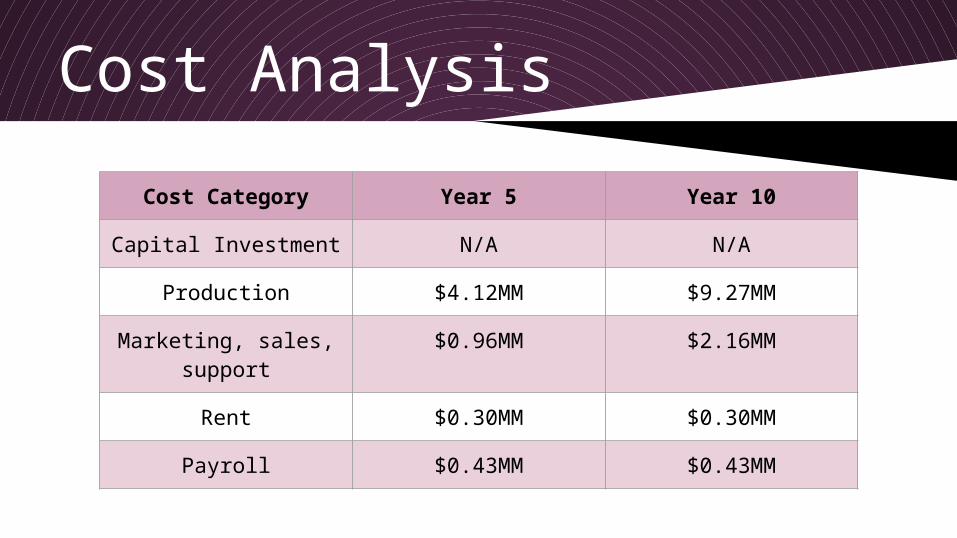
Cost Analysis
Cost Category Year 5 Year 10
Capital Investment N/A N/A
Production $4.12MM $9.27MM
Marketing, sales, support $0.96MM $2.16MM
Rent $0.30MM $0.30MM
Payroll $0.43MM $0.43MM

Sensitivity Analysis
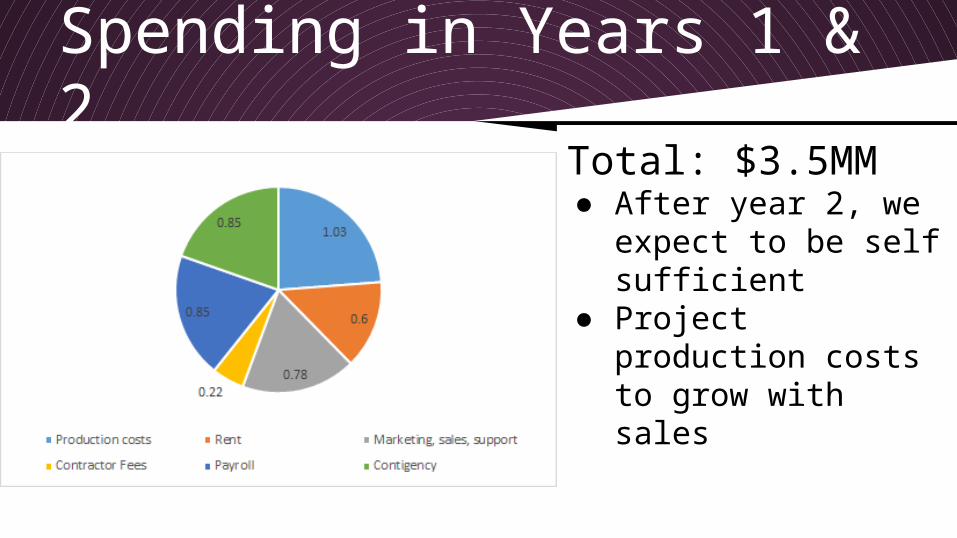
Spending in Years 1 & 2Total: $3.5MM● After year 2, we
expect to be self sufficient
● Project production costs to grow with sales
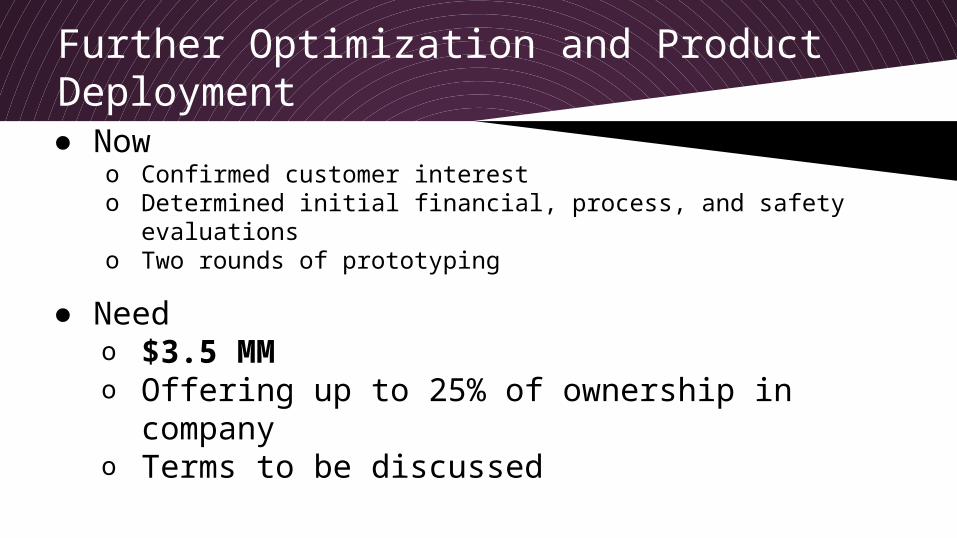
Further Optimization and Product Deployment● Now
o Confirmed customer interesto Determined initial financial, process, and safety evaluationso Two rounds of prototyping
● Needo $3.5 MMo Offering up to 25% of ownership in companyo Terms to be discussed
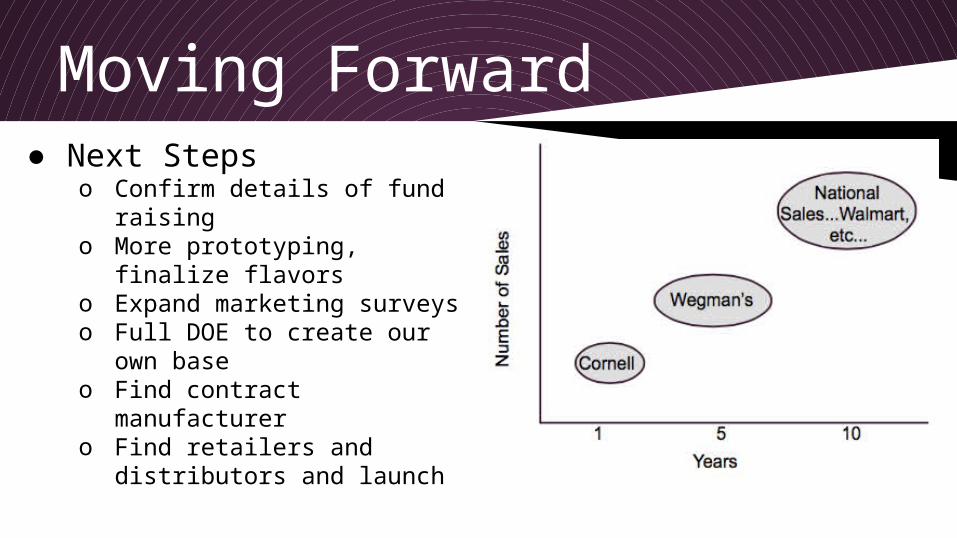
Moving Forward● Next Steps
o Confirm details of fund raising
o More prototyping, finalize flavors
o Expand marketing surveys o Full DOE to create our own
baseo Find contract manufacturero Find retailers and
distributors and launch

Thank you