DREYER’S GRAND ICE CREAM 2001 ANNUAL REPORT · Wherever and whenever Americans shop for ice...
35
DREYER’S GRAND ICE CREAM 2001 ANNUAL REPORT
Transcript of DREYER’S GRAND ICE CREAM 2001 ANNUAL REPORT · Wherever and whenever Americans shop for ice...

D R E Y E R ’ S G R A N D I C E C R E A M 2 0 0 1 A N N U A L R E P O R T

Service.Dreyer’s unique advantage.Placing our brands within easy reachof millions of American households.
Wherever and whenever Americans shop for ice cream, Dreyer’s makes sure their favorite brands will be there, every time, through . . .

1
the only nationwide direct-store-service system in the category.

Turning great brands into leading brands.
2
2 0 0 1 A N N U A L R E P O R T
Direct-store-service (DSS) turns great ice cream brands intoleading ones.
Ice cream is America’s dessert, and Americans, from kids toseniors, enjoy a wide variety of ice cream flavors and styles.Segmentation—developing great ice cream products for everytaste—has been and remains essential for ice cream brandsto grow. While great brands attract consumer interest, whatdrives consumer purchases is product quality, flavor selection,and consistent availability.
Dreyer’s has developed a broad portfolio of great ice creambrands and built them to market leadership through the onlynationwide direct-store-service system in the category. Dreyer’sDSS advantage has made its portfolio of company brands boththe fastest growing in the category and the grocery channelshare leader.

85 86 87 88 89 90 91 92 93 94 95 96 97 98 99 00 01
20%
18%
16%
14%
12%
10%
8%
6%
4%
D R E Y E R ’ S C O M P A N Y B R A N D P O R T F O L I O S H A R E O F P A C K A G E D I C E C R E A M S A L E S T O T H E G R O C E R Y C H A N N E L
D R E Y E R ’ S C O M P A N Y B R A N D P O R T F O L I OS
ourc
e: IR
I; D
olla
r S
hare
3

Year ended December1
($ in thousands, except per share amounts) 2001 2000
R E S U L T S F O R T H E Y E A R :Sales2 $1,399,698 $1,194,356Net income 8,829 25,378Net income available to common stockholders 8,269 24,220Net income per common share — diluted .24 .72
Y E A R E N D S T A T U S :Total assets 498,689 468,451Total stockholders’ equity3 208,365 100,372Working capital4 84,018 58,006
The Company’s fiscal year is a 52-week or 53-week period ending on the last Saturday in December. Fiscal years 2001 and 2000 consisted of 52 and 53 weeks, respectively.As a result of EITF 01-09, “Accounting for Consideration Given by a Vendor to a Customer (Including a Reseller of the Vendor’s Products),” certainexpenses presently classified as selling, general and administrative expenses will be recorded as a reduction of sales beginning in the first quarter of 2002. In accordance with this pronouncement, all prior periods will be reclassified on a retroactive basis. This retroactive reclassification willhave no effect on net income as previously reported.The Company’s redeemable convertible preferred stock was converted to common stock in the second quarter of 2001.Certain reclassifications have been made to prior years’ financial data to conform to the current year presentation.
4
F I N A N C I A L H I G H L I G H T S
1
2
3
4

5
97
Sales
97
0
98
1,0
22
99
1,1
00
00
1,1
94
01
1,4
00
$1,500
$1,250
$1,000
$750
$500
($ in millions)
97
0.1
4
98
(1.7
5)
99
0.3
3
00
0.7
2
01
0.2
4
$1.00
$0.50
$0.00
($1.75)
97
Total assets
50
2
98
46
2
99
44
1
00
46
8
01
49
9
$525
$500
$475
$450
$425
($ in millions)
Net incomepercommonshare

T O O U R S H A R E H O L D E R S
For much of 2001, the ice cream industry was preoccupied with a single factor—the extraordinarily high cost of cream. The spike in dairy costs not only depressed
profits, it also prompted retailers to accelerate increases in the retail price of ice cream.While these price increases are likely to benefit profits in the long run, they served todepress demand in the first half of the year by slowing the growth of the category.
Our company was not immune from this issue. Our dairy costs for the year were$30 million higher than normal and our sales during the first half of the year were wellbelow our expectations due to the effect of price elasticity. Results on the bottomline for 2001 were very disappointing. However, during the last half of the year, wedrove a tremendous rebound in our sales growth; and late in the year, we finally saw along-overdue crash in dairy prices. We are glad that the cost issues are moving
6

behind us, and we believe we have a great deal of momentum in our business as wemove into 2002 and beyond.
From August of 2001 onward, our company portfolio of premium brands, the core of our business, posted a volume increase of 12 percent. What makes this increaseparticularly gratifying is that we simultaneously realized price increases of about1.5 percent—not enough to cover the short-term dairy cost spike, but a good gainnevertheless. This core business resurgence helped drive our best market shareperformance ever in the fourth quarter of 2001 as Dreyer’s portfolio of company brandsheld a 20 percent dollar share of all packaged ice cream sold in U.S. grocerystores—about a point ahead of our nearest competitor. Overall, our sales grew by 17 percent in 2001 and the strong momentum of the second half has continuedinto the first months of 2002.
We’re obviously proud of our pace of growth, which puts us in the top tier of the foodcategory. Even though the dairy price decline came too late to help 2001 results inany meaningful way, we believe that the current trends—both in sales growth andcosts—bode well for 2002.
C H A N G I N G T H E N A M E A N D C H A N G I N G T H E G A M E
Our business model is built on two mutually reinforcing strengths: brand leadershipand direct-store-delivery (DSD). We have been committed to this vision from thebeginning. When we began our march toward national preeminence in 1994, there
were still people who were skeptical about a strategy based on direct-store-delivery.Today, the strengths of DSD are apparent in category-leading brands across the foodindustry. In our category, as in snack foods, beverages, and so many others, companieswith first-class DSD systems build sales and market share in ways that competitorswithout this capability cannot match.
Our approach to direct-store-delivery has evolved significantly over the years. Ourstrategic emphasis is not really on “delivery”—transporting product to stores, it’s on“service.” We build our brands not just by how we get to the store, but by what wedo in the store. Keeping a wider variety of brands and flavors than any other competitor
7

8
in-stock at all times, merchandising and building displays, executing smooth, rapidpromotions, building relationships with store personnel—these things are the key tosatisfying consumers and building sales. They are also the key to building profitsfor our retail customers, whether they are supermarkets, convenience stores, ormass merchandisers.
As a result of our evolution, we no longer refer to our system as “direct-store-delivery”(DSD), we call it “direct-store-service” (DSS). It’s supported by technology, processes,and teams of people far beyond what any of our competitors can offer. A few yearsback, our trucks operated as “rolling warehouses”—they set out each morning with asfull an assortment of products as they could, and called on each store on a specifiedroute. Ideally, they would have the product that store needed, and hopefully we wouldbe able to replenish the shelves before anything was out-of-stock. This is the systemstill used by all of our ice cream competitors in direct distribution.
We have effectively changed the game. Today our sales people call on each storeseveral times each week, without a truck, and enter an order on hand-held computers.That order is picked and loaded, often several states distant, and brought to thestore by delivery trucks that are rerouted every day for optimal efficiency. Our salespeople and merchandisers spend their time servicing the store—and building ourbrands. Increasingly, in conjunction with our major supermarket customers, we are takingover the entire management of our inventory in each store. We are directly linked tothe scanners at each checkout counter, and we know exactly how many packages ofeach brand and flavor have sold—and how many to restock—in every store, every day.
We don’t do all this just because we want to run a world-class distribution system.We do it because of the overwhelming, incontrovertible advantage of direct-store-servicein categories like ice cream and so many others: direct-store-service builds brands.
B R A N D B U I L D I N G
Direct-store-service builds existing brands—by enabling the execution of promotionsand limited-time offerings throughout the year in ways that are impossible for competitorswho use the supermarket warehouse system. It builds brands—especially in an

9
“impulse” category like ours—by making sure that all flavors of all brands are in-stock,all the time. DSS even allows us to tailor specific availability and restocks to whatlocal consumers want—not just by chain or region, but literally by store. It allows us to maintain a far wider variety of individual brands than anyone else—brandswhich are highly targeted to consumers’ needs and desires across a broad range of“ice cream occasions.”
Direct-store-service also builds new brands. Our success at innovation, our unsurpassedtrack record at developing entire new brands and flavors, depends on our ability toalmost immediately gain and maintain incremental nationwide shelf space. We havedone this repeatedly over the past 10 years. From our original base in premiumDreyer’s and Edy’s® Grand Ice Cream, we led the development of the “better-for-you”segment with Grand Light®, Frozen Yogurt, Fat-Free and No Sugar Added—a segmentin which we continue to have a leading market share. In recent years we havesuccessfully introduced brand after brand where our knowledge of the category and theconsumer pointed to opportunity: Whole Fruit Sorbet, Whole Fruit Bars, Homemade,Dreamery®, Starbucks®, Godiva® and M&M/Mars—each achieved nationwide distributionand rapidly gained consumer acceptance.
Innovation and direct-store-service work together to build brands. For a case in point,look at our introduction of Dreamery—a new brand name, with no existing consumerrecognition—which we were able to build to 70 percent national grocery distributionin just 11 weeks. Today our portfolio of superpremium brands, including Dreamery,Whole Fruit Sorbet, Starbucks and Godiva, holds a 24 percent dollar share of thesegment in the grocery channel. Brand leadership and direct-store-service are nottwo separate strategies. They work together—as mutually reinforcing strengths—tobuild our sales.
R E A P I N G T H E R E W A R D S
We have worked long and hard to build our capabilities. We are now concentratingon reaping the rewards—in continued sales increases, of course, but also in highermargins. While the profit pressure from dairy costs in 2001 was disappointing, weknow that dairy supply has always grown rapidly in this country in response to high

prices—producing a rapid return to lower dairy costs. We are keeping our focus onthe core elements of our own strategy—the four strategic initiatives that will driveprofit growth:1. Expanding our share in the premium segment;2. Building our superpremium business;3. Expanding into new channels; and4. Reducing our total delivered cost.
Many of the costs in our DSS system are largely fixed, and incremental volumecombined with tight cost control can produce substantial leverage and margin gains.Our new products, especially in superpremium, generally have higher margins thanour existing portfolio. Development of new channels, such as convenience stores andrestaurants, not only increases sales, but it also leverages our existing cost structure.With this in mind, we chose our four strategic initiatives to drive our sales momentumand at the same time, to build our profit margins.
We took some blows to profitability in 2001, but we kept our focus on the fourcore strategies. Our team of over 4,700 people across the country—a team that isrecognized as unsurpassed in our industry—kept its focus on continuing to changethe game and distance ourselves from the competition. All of this paid off, as wedrove a great sales rebound in the second half of the year. We are better positionedthan ever before—with our brands, with our sales strength and systems, and aboveall with the skill, experience and dedication of our people. Our goal remains thesame—preeminence in the ice cream category—and we believe we are movingtoward this goal more rapidly than ever.
T. Gary RogersChairman of the Board and Chief Executive Officer
10
William F. Cronk, IIIPresident

11
Many unique tastes, one unique service.

12
T H E O R I G I N O F D R E Y E R ’ S D I R E C T - S T O R E - D E L I V E R Y
In 1935, Bill Dreyer expanded his ice cream parlor business onGrand Avenue in Oakland, California to include selling packagedDreyer’s Grand Ice Cream to grocers located in the San FranciscoBay Area. For people to enjoy his ice cream at home as muchas they did in his parlor, Dreyer knew he had to ensure that thequality of Dreyer’s Grand would be maintained from the factoryto the grocer’s freezer cabinet and into consumers’ hands.
He also knew that ice cream was a grocery staple on the weeklyshopping list of virtually every American family and serving hisgrocers would demand frequent deliveries. Dreyer’s approachwas to run a small fleet of trucks, complete with ice boxes,to hand deliver Dreyer’s Grand Ice Cream to his local grocerycustomers. He’d stock his trucks each morning with an inventoryof each of the five flavors in the Dreyer’s Grand line, creatinga virtual warehouse on wheels. Using this classic “pack andpeddle” method, his delivery drivers would visit and restockevery grocery store along their route.
While consistent distribution was essential for his success, BillDreyer also recognized that interaction at the store level wasjust as important for his future. He knew from the beginning thatevery store delivery was an opportunity to present his qualityice creams directly to consumers and gauge their reaction to hisnew flavors, like his signature Rocky Road, just as if he wasserving customers in the parlor.

13
P A T , N A T I O N A L A C C O U N T M A N A G E R
“We learned, long ago, that it’s not enough just to make great ice cream.”

14
T H E E V O L U T I O N T O D I R E C T - S T O R E - S E R V I C E
When Gary Rogers and Rick Cronk bought Dreyer’s in 1977, the “pack and peddle”distribution system had run up against challenges. Grocery stores had grown muchlarger and the breadth of food items in every category had increased significantly asfood companies began to segment their lines to broaden their appeal. With thisproduct proliferation, direct-store-delivery (DSD) vendors now had to carry many moreitems on their trucks to meet consumer demand and avoid out-of-stocks on theirgrocers’ shelves.
Branded product leaders, like Coca-Cola and Frito-Lay, were the first to adapt theirown DSD systems to meet this challenge. In similar fashion, Dreyer’s recognizedthat the best way to increase in-stocks and eventually sales for its own growingproduct line, was to customize service for each of its grocery customers. This meantimplementing computer-assisted ordering technology so that the company’s routesalespeople could track sales and forecast which Dreyer’s Grand ice creams weremost likely to meet demand at any given grocery. These sales trend and flavor prefer-ence forecasts, combined with promotional schedules, became the basis for customdelivery orders tailored to each store. With ever-improving sales and distributioncapabilities, Dreyer’s route salespeople could restock each store with a full assortmentof Dreyer’s Grand Ice Cream on every visit.
The adoption of computer-assisted ordering began Dreyer’s transition from basicdelivery to a new era of information-based distribution service.

15
“This is my office. This is my ice cream—Dreyer’s. This is my philosophy—take care of my grocers so they can take care of their customers.”
J O S H , G R O C E R Y R O U T E S A L E S P E R S O N

16
T H E C U S T O M S E R V I C E C A P A B I L I T Y O F D I R E C T - S T O R E - S E R V I C E
In 1994 Dreyer’s embarked on a plan to expand its distribution nationwide and growits share of ice cream sales to reach preeminence in the ice cream industry. TodayDreyer’s nationwide direct-store-service (DSS) system includes a coordinated networkof five factories, 41 regional sales offices and 57 frozen transport depots, cross-docksand warehouses. Technology links these sites together providing computer-assistedordering, inventory management, production forecasting and dynamic delivery routingcapabilities. Today the company’s DSS system serves thousands of ice cream retailersin all 50 states and reaches more than 90 million U.S. households.
There are more retailers selling packaged ice cream today than ever before, rangingfrom nationwide chain grocers to local corner convenience stores. Each of theseretailers has distinct product arrays and sales patterns, and as a result, uniquedistribution needs. Larger retail stores with broad ice cream assortments requirefrequent, large deliveries. Smaller venues with less freezer display space and limitedassortments require smaller deliveries.
To maximize both sales opportunities with its retailers and the efficiency of its DSSsystem, Dreyer’s customizes service to each location. For smaller volume stores, onesalesperson driving a small route truck can quickly and efficiently serve a full route.For larger volume chain grocers, there may be up to four Dreyer’s employees in theservice team, each moving independently through their own routes. The teamincludes a delivery agent unloading palletized orders from a 40-foot refrigerated truck,two merchandisers restocking the ice cream assortment in the frozen display aisle,and a route salesperson forecasting the order for the next delivery.

17
“It takes a coordinated team to serve high-volume stores—making sure we have the right products at the right time, every time.”
P A U L , D E L I V E R Y A G E N T

T H E S A L E S A D V A N T A G E O F D I R E C T - S T O R E - S E R V I C E
Each retailer Dreyer’s serves is unique, but they all have one thing in common—adesire to maximize their ice cream sales and profits. The company’s direct-store-servicesystem offers a solution to each of them.
Large chain grocery stores account for the majority of packaged ice cream sales in theU.S. and Dreyer’s branded portfolio accounts for a 20 percent share of this channel.Leveraging the DSS system to drive sales of its branded portfolio and grow this shareis Dreyer’s primary goal. Chain grocers have large ice cream assortments, high-volume turnover, limited storage space for frozen food inventory and active promotionalcalendars. Working within these parameters, Dreyer’s offers chain grocers a range ofservice solutions from category management to optimize their ice cream assortment,to scan-based trading to minimize their inventory and logistical requirements.
Retailers selling ice cream outside of the traditional grocery channel address thegamut of consumers’ shopping occasions beyond the weekly grocery run. While theirretailing formats vary widely, they share a common need for strong, recognizable
brands and customized distribution service. Wal-Mart, like many supercenters,demands national brands and timely replenishment to compete in food sales withtraditional groceries. 7-Eleven and other leading convenience stores require smallerpackage sizes, a more indulgent product line and frequent distribution service to meettheir unique combination of rapid inventory turnover and limited freezer space. Andrestaurants demand top brand-name products with distribution service tailored tomeet their specific needs. The flexibility of Dreyer’s DSS system meets these variedretailing requirements and provides the company with an unmatched opportunity toleverage its brands into significant growth.
18

19
“I love visiting a new Dreyer’s customer. They’re always amazed by what I can do for their ice cream sales.”
D E S I R E E , N O N - G R O C E R Y R O U T E S A L E S P E R S O N

T H E B R A N D B U I L D I N G A D V A N T A G E O F D I R E C T - S T O R E - S E R V I C E
Direct-store-service provides control of product presentation and an unparalleledsegmentation capability—two great advantages in Dreyer’s goal to build marketleading brands.
American consumers demand and expect quality products and they reward thosebrands that meet their expectations. For ice cream consumers, quality is having theirfavorite brands and flavors in-stock every time they visit the freezer aisle. Quality isuser-friendly packages with clearly visible flavors merchandised by brand and productline so they can find their favorites—fast. Quality is point-of-purchase displays thatcall attention to new flavors, seasonal products, and Limited Editions. And quality istrusting that the ice cream they purchase will be perfect for their families, theirfriends and themselves. There is no greater way to guarantee that Dreyer’s portfolioof brands meets and exceeds these consumer expectations than by controllingpresentation. Dreyer’s people control Dreyer’s ice cream every step of the way, fromthe production line to the retailer’s display case.
Segmentation—delighting an ever-expanding variety of consumer tastes—is essentialfor growth and direct-store-service is essential for effective segmentation. Effectivesegmentation is seeing consumer trends before competitors and being first to marketwith superior brands. Effective segmentation is being the partner-of-choice for majorconsumer brands, like Starbucks®, Godiva® and M&M/Mars, that seek an advantagedentrance into the ice cream category. Effective segmentation is marketing a variety of ice cream package sizes appropriate for both retailers and their consumers. Effectivesegmentation is great new products combined with the distribution clout to persuadegrocers nationwide to display them at retail. Finally, effective segmentation is executingdistribution service across a rapidly expanding business with constantly improvingin-stock rates.
There is simply no better way to build brands than through direct-store-service.
20
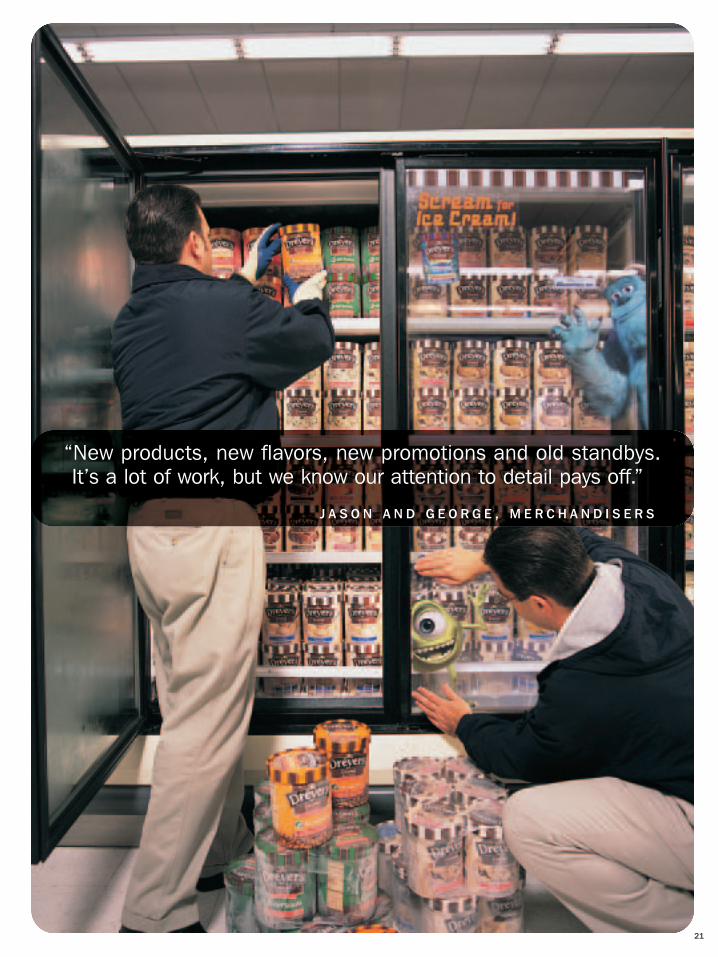
“New products, new flavors, new promotions and old standbys. It’s a lot of work, but we know our attention to detail pays off.”
J A S O N A N D G E O R G E , M E R C H A N D I S E R S
21

22
Ice cream is America’s favorite dessert. In 2001, more Americanschose one of Dreyer’s brands than any other brand. Young andold from all walks of life, some chose premium Dreyer’s GrandIce Cream, Grand Light® or M&M/Mars while others chose oursuperpremium Dreamery® and Whole Fruit Sorbet. Coffee loversfound their favorites with Starbucks Ice Cream while chocolatefans were delighted by Godiva Ice Cream. Each of theseAmericans is passionate about their favorite ice cream, andDreyer’s is passionate about its mission to ensure that theirfavorites are waiting for them whenever and wherever they shop
for ice cream.
Its portfolio of superior brands and its commitment to superiordistribution service has made Dreyer’s the fastest growingice cream company in America and the category leader. Withmore than 4,700 professionals dedicated to exceeding theexpectations of ice cream consumers across America—no onebuilds great brands into leaders better than Dreyer’s.
Service.
Turning great brandsinto leading brands.

23
“And I wonder why my kids always want to go shopping with me.”
M O M , F A M I LY C . E . O .

24
F I V E - Y E A R S U M M A R Y O F S I G N I F I C A N T F I N A N C I A L D A T A
Year ended December1
($ in thousands, except per share amounts) 2001 2000 1999 1998 1997
O P E R A T I O N S :Sales and other income2 $1,402,103 $1,198,114 $1,101,907 $1,025,988 $973,091Income (loss) before
cumulative effect of change in accounting principle 8,829 25,378 11,587 (46,510) 8,774
Net income (loss) 8,829 25,378 10,992 (46,510) 8,028Net income (loss) available
to common stockholders 8,269 24,220 9,872 (47,630) 3,968
P E R C O M M O N S H A R E :Basic:
Income (loss) before cumulative effect of change in accounting principle .26 .86 .38 (1.75) .18
Net income (loss) .26 .86 .36 (1.75) .15
Diluted:Income (loss) before
cumulative effect of change in accounting principle .24 .72 .35 (1.75) .17
Net income (loss) .24 .72 .33 (1.75) .14
Dividends declared3 .24 .12 .12 .12 .12
B A L A N C E S H E E T :Total assets 498,689 468,451 441,065 461,721 502,146Working capital4 84,018 58,006 29,513 61,059 78,576Long-term debt5 148,671 121,214 104,257 169,781 165,913Redeemable convertible
preferred stock6 100,540 100,078 99,654 99,230Stockholders’ equity6 208,365 100,372 73,694 61,174 108,688
The Company’s fiscal year is a 52-week or 53-week period ending on the last Saturday in December. Fiscal years 2001, 1999, 1998 and 1997each consisted of 52 weeks, while fiscal year 2000 consisted of 53 weeks.As a result of EITF 01-09, “Accounting for Consideration Given by a Vendor to a Customer (Including a Reseller of the Vendor’s Products),” certainexpenses presently classified as selling, general and administrative expenses will be recorded as a reduction of sales beginning in the first quarter of 2002. In accordance with this pronouncement, all prior periods will be reclassified on a retroactive basis. This retroactive reclassification willhave no effect on net income (loss) as previously reported.On February 14, 2001, the Board of Directors declared its intention to increase the regular quarterly dividend from $.03 to $.06 per commonshare for each quarter of 2001.Certain reclassifications have been made to prior years’ financial data to conform to the current year presentation.Excludes current portion of long-term debt.The Company’s redeemable convertible preferred stock was converted to common stock in the second quarter of 2001.
1
2
3
4
5
6

T O T H E B O A R D O F D I R E C T O R S A N D S T O C K H O L D E R S O F
D R E Y E R ’ S G R A N D I C E C R E A M , I N C .
We have audited, in accordance with auditing standards generally accepted in the United States of America,the consolidated financial statements of Dreyer’s Grand Ice Cream, Inc. and its subsidiaries as of December29, 2001 and December 30, 2000 and for each of the three years in the period ended December 29, 2001appearing in the Company’s Annual Report on Form 10-K for the period ended December 29, 2001(which statements are not presented herein); and in our report dated February 13, 2002, we expressed anunqualified opinion on those consolidated financial statements. In our opinion, the information set forth inthe accompanying consolidated balance sheet as of December 29, 2001 and December 30, 2000 and therelated consolidated statements of income, of changes in stockholders’ equity and of cash flows for eachof the three years in the period ended December 29, 2001, when read in conjunction with the consolidatedfinancial statements from which it has been derived, is fairly stated in all material respects in relation thereto.
As discussed in Note 2 of the consolidated financial statements, the Company changed its method ofaccounting for start-up costs in the first quarter of 1999.
PricewaterhouseCoopers LLPSan Francisco, CaliforniaFebruary 13, 2002
R E P O R T O F I N D E P E N D E N T A C C O U N T A N T S
25

Year ended1
($ in thousands, except per share amounts) Dec. 29, 2001 Dec. 30, 2000 Dec. 25, 1999
R E V E N U E S :Sales2 $1,399,698 $1,194,356 $1,099,817Other income 2,405 3,758 2,090
1,402,103 1,198,114 1,101,907
C O S T S A N D E X P E N S E S :Cost of goods sold 1,083,674 889,412 837,907Selling, general and administrative2 294,013 255,739 235,146Reversal of restructuring charges (1,315)Interest, net of amounts capitalized 10,833 12,352 11,450
1,388,520 1,157,503 1,083,188
Income before income tax provision and cumulative effect of change in accounting principle 13,583 40,611 18,719
Income tax provision 4,754 15,233 7,132
Income before cumulative effect of change in accounting principle 8,829 25,378 11,587
Cumulative effect of change in accounting principle 595
Net income 8,829 25,378 10,992Accretion of preferred stock to redemption value3 212 462 424Preferred stock dividends3, 4 348 696 696
Net income available to common stockholders $ 8,269 $ 24,220 $ 9,872
P E R C O M M O N S H A R E — B A S I C :Income available to common stockholders before
cumulative effect of change in accounting principle $ .26 $ .86 $ .38Cumulative effect of change in accounting principle .02
Net income available to common stockholders $ .26 $ .86 $ .36
P E R C O M M O N S H A R E — D I L U T E D :Income available to common stockholders before
cumulative effect of change in accounting principle $ .24 $ .72 $ .35Cumulative effect of change in accounting principle .02
Net income available to common stockholders $ .24 $ .72 $ .33
The Company’s fiscal year is a 52-week or 53-week period ending on the last Saturday in December. Fiscal years 2001 and 1999 each consisted of 52 weeks, while fiscal year 2000 consisted of 53 weeks.As a result of EITF 01-09, “Accounting for Consideration Given by a Vendor to a Customer (Including a Reseller of the Vendor’s Products),” certainexpenses presently classified as selling, general and administrative expenses will be recorded as a reduction of sales beginning in the first quarter of 2002. In accordance with this pronouncement, all prior periods will be reclassified on a retroactive basis. This retroactive reclassification willhave no effect on net income as previously reported.The Company’s redeemable convertible preferred stock was converted to common stock in the second quarter of 2001.On February 14, 2001, the Board of Directors declared its intention to increase the regular quarterly dividend from $.03 to $.06 per commonshare for each quarter of 2001.
C O N S O L I D A T E D S T A T E M E N T O F I N C O M E
26
1
2
3
4

C O N S O L I D A T E D B A L A N C E S H E E T
($ in thousands, except per share amounts) Dec. 29, 2001 Dec. 30, 2000
A S S E T S
Current assets:Cash and cash equivalents $ 1,650 $ 2,721Trade accounts receivable, net of allowance for doubtful
accounts of $1,024 in 2001 and $2,611 in 2000 89,721 77,310Other accounts receivable1 16,116 17,702Inventories 81,298 68,801Deferred income taxes 3,547 4,584Prepaid expenses and other 8,849 6,950
Total current assets 201,181 178,068Property, plant and equipment, net 198,565 190,833Goodwill, distribution rights and other intangibles, net 94,468 92,892Other assets1 4,475 6,658
Total assets $ 498,689 $468,451
L I A B I L I T I E S A N D S T O C K H O L D E R S ’ E Q U I T Y
Current liabilities:Accounts payable and accrued liabilities $ 91,794 $ 80,260Accrued payroll and employee benefits 25,369 24,759Current portion of long-term debt 15,043
Total current liabilities 117,163 120,062Long-term debt, less current portion 148,671 121,214Deferred income taxes 24,490 26,263
Total liabilities 290,324 267,539
Commitments and contingenciesRedeemable convertible preferred stock2, $1 par value — no shares and 1,008,000
shares authorized, issued and outstanding in 2001 and 2000, respectively 100,540
Stockholders’ equity:Preferred stock, $1 par value — 10,000,000 shares and 8,992,000 shares
authorized, no shares issued or outstanding in 2001 and 2000, respectivelyCommon stock2, $1 par value — 60,000,000 shares authorized;
34,461,000 shares and 28,268,000 shares issued and outstanding in 2001 and 2000, respectively 34,461 28,268
Capital in excess of par2 160,103 58,396Notes receivable from stockholders (2,546) (2,284)Retained earnings 16,347 15,992
Total stockholders’ equity 208,365 100,372
Total liabilities and stockholders’ equity $ 498,689 $468,451
Certain reclassifications have been made to prior years’ financial data to conform to the current year presentation.The Company’s redeemable convertible preferred stock was converted to common stock in the second quarter of 2001.
27
1
2

C O N S O L I D A T E D S T A T E M E N T O F C H A N G E S I N S T O C K H O L D E R S ’ E Q U I T Y
Notes (AccumulatedCapital receivable deficit)Common stock
in excess from Retained(In thousands) Shares Amount of par stockholders earnings Total
B A L A N C E S A T
D E C E M B E R 2 6 , 1 9 9 8 27,312 $27,312 $ 46,722 $(1,459) $(11,401) $ 61,174Net income for 1999 10,992 10,992Accretion of preferred stock to
redemption value (424) (424)Preferred stock dividends declared (696) (696)Common stock dividends declared (3,319) (3,319)Issuance of common stock under
employee stock plans, net 579 579 6,671 (1,042) 6,208Repurchases and retirements
of common stock (20) (20) (221) (241)
B A L A N C E S A T
D E C E M B E R 2 5 , 1 9 9 9 27,871 27,871 53,172 (2,501) (4,848) 73,694Net income for 2000 25,378 25,378Accretion of preferred stock to
redemption value (462) (462)Preferred stock dividends declared (696) (696)Common stock dividends declared (3,380) (3,380)Issuance of common stock under
employee stock plans, net 457 457 5,785 (171) 6,071Repurchases and retirements
of common stock (60) (60) (1,485) 388 (1,157)Tax benefits from employee stock
option plans 924 924
B A L A N C E S A T
D E C E M B E R 3 0 , 2 0 0 0 28,268 28,268 58,396 (2,284) 15,992 100,372Net income for 2001 8,829 8,829Accretion of preferred stock to
redemption value1 (212) (212)Preferred stock dividends declared1 (348) (348)Common stock dividends declared (7,914) (7,914)Conversion of redeemable
convertible preferred stock1 5,800 5,800 94,952 100,752Issuance of common stock under
employee stock plans, net 550 550 8,207 (1,292) 7,465Repurchases and retirements
of common stock (157) (157) (3,801) 1,030 (2,928)Tax benefits from employee stock
option plans 2,349 2,349
B A L A N C E S A T
D E C E M B E R 2 9 , 2 0 0 1 34,461 $34,461 $160,103 $(2,546) $ 16,347 $208,365
The Company’s redeemable convertible preferred stock was converted to common stock in the second quarter of 2001.
28
1

C O N S O L I D A T E D S T A T E M E N T O F C A S H F L O W S
Year ended1
($ in thousands) Dec. 29, 2001 Dec. 30, 2000 Dec. 25, 1999
C A S H F L O W S F R O M O P E R A T I N G A C T I V I T I E S :Net income $ 8,829 $ 25,378 $ 10,992Adjustments to reconcile net income to cash flows
from operations:Depreciation and amortization 35,974 37,479 35,515Deferred income taxes (183) 6,665 4,305Loss on disposal of property, plant and equipment 1,360 1,803Tax benefits from employee stock option plans 2,349 924Provision for losses on accounts receivable 1,602Reversal of restructuring charges (1,315)Cumulative effect of change in accounting principle 595Changes in assets and liabilities, net of amounts acquired:
Trade accounts receivable (12,411) 6,607 3,802Other accounts receivable2 1,586 (3,963) 15,637Inventories (12,497) (11,044) (5,197)Prepaid expenses and other (1,899) (236) (2,113)Accounts payable and accrued liabilities2 10,314 (14,832) 2,910Accrued payroll and employee benefits 610 (5,179) 10,368
32,672 44,761 77,302
C A S H F L O W S F R O M I N V E S T I N G A C T I V I T I E S :Acquisition of property, plant and equipment (40,598) (24,513) (23,756)Retirement of property, plant and equipment 2,181 515 726Purchase of Specialty Frozen Products, L.P. (18,922)Purchase of common stock of Cherokee Cream Company, Inc. (7,651)Purchase of independent distributors and distribution rights (7,067) (1,564) (1,000)Decrease (increase) in other assets2 1,832 (4,413) 1,803
(43,652) (56,548) (22,227)
C A S H F L O W S F R O M F I N A N C I N G A C T I V I T I E S :Proceeds from long-term debt2 34,600 160,095Repayments of long-term debt2 (22,186) (149,421) (55,058)Issuance of common stock under employee stock plans, net 7,465 6,071 6,208Repurchases and retirements of common stock (2,928) (1,157) (241)Cash dividends paid (7,042) (4,238) (3,997)
9,909 11,350 (53,088)
( D E C R E A S E ) I N C R E A S E I N C A S H A N D
C A S H E Q U I V A L E N T S (1,071) (437) 1,987Cash and cash equivalents, beginning of year 2,721 3,158 1,171
C A S H A N D C A S H E Q U I V A L E N T S , E N D O F Y E A R $ 1,650 $ 2,721 $ 3,158
The Company’s fiscal year is a 52-week or 53-week period ending on the last Saturday in December. Fiscal years 2001 and 1999 each consisted of 52 weeks, while fiscal year 2000 consisted of 53 weeks.Certain reclassifications have been made to prior years’ financial data to conform to the current year presentation.
29
1
2

D I R E C T O R S
T. Gary RogersChairman of the Board and Chief Executive Officer
William F. Cronk, IIIPresident
Edmund R. ManwellSecretary, Partner of Manwell & Schwartz, Attorneys at Law
Jan L. BoothPrivate Investor
Robert A. HelmanPartner of Mayer, Brown, Rowe & Maw, Attorneys at Law
M. Steven LangmanManaging Director, Rhône Group LLC
John W. LarsonPrivate Investor
Timothy P. SmuckerChairman and Co-Chief Executive Officer,The J.M. Smucker Company
C O R P O R A T E O F F I C E R S
T. Gary RogersChairman of the Board andChief Executive Officer
William F. Cronk, IIIPresident
Thomas M. DelaplaneVice President–Sales
J. Tyler JohnstonVice President–Marketing
Timothy F. KahnVice President–Finance and Administration and Chief Financial Officer
William R. OldenburgVice President–Operations
William C. CollettTreasurer
Mark LeHockyGeneral Counsel
Jeffrey P. PorterController
Edmund R. ManwellSecretary
Seated from left: T. Gary Rogers and William F. Cronk. Standingfrom left: Thomas M. Delaplane, J. Tyler Johnston, Timothy F. Kahnand William R. Oldenburg.
C O R P O R A T E O F F I C E
Dreyer’s Grand Ice Cream, Inc.5929 College AvenueOakland, CA 94618(510) 652-8187
D I V I S I O N O F F I C E S
Northwest Division18404 72nd Avenue So.Kent, WA 98032(425) 251-0809
Southwest Division2305 Camino Ramon, Suite 180San Ramon, CA 94583(925) 242-3400
Midwest Division601 Wall StreetGlendale Heights, IL 60139(630) 924-7755
Southeast Division410 Ware Boulevard, Suite 612Tampa, FL 33619(813) 623-5528
Northeast Division301 Roundhill DriveRockaway, NJ 07866(973) 627-8822
I N D E P E N D E N T
A C C O U N T A N T S
PricewaterhouseCoopers LLPSan Francisco, Californiawww.pwcglobal.com
T R A N S F E R A G E N T
Mellon Investor Services LLC235 Montgomery Street23rd FloorSan Francisco, CA 94104www.mellon-investor.com
S T O C K L I S T I N G
NASDAQ National MarketSymbol DRYR
A N N U A L M E E T I N G
The Annual Meeting ofStockholders will be held at 2 p.m., Wednesday, May 8, 2002, at The Claremont Resort & Spa, Ashby and DomingoAvenues, Oakland, CA 94623
W E B S I T E S
www.dreyersinc.comwww.dreyers.comwww.edys.comwww.icecream.comwww.conefactory.com
Des
igne
d an
d pr
oduc
ed b
y Ja
cobs
Ful
ton
Des
ign
Gro
up,
Palo
Alto
, C
A, U
SA
C O R P O R A T E D A T A
30

Dreyer’s Grand Ice Cream 2001 Annual Report

C O R P O R A T E O F F I C E 5 9 2 9 C O L L E G E A V E N U E O A K L A N D C A L I F O R N I A 9 4 6 1 8
Dreyer’s Grand Ice Cream, Inc.