The Australian Photovoltaic Industry Roadmap Reports/2004/PVRoadmap.pdf · AUSTRALIAN BUSINESS...
124
the australian photovoltaic industry roadmap /// AUSTRALIAN BUSINESS COUNCIL FOR SUSTAINABLE ENERGY /// July 2004
Transcript of The Australian Photovoltaic Industry Roadmap Reports/2004/PVRoadmap.pdf · AUSTRALIAN BUSINESS...

the australian photovoltaic industry roadmap ///
AUSTRALIAN BUSINESS COUNCIL FOR SUSTAINABLE ENERGY
/// July 2004

// FOREWORDThis Roadmap has been developed by the Australian Business Council for SustainableEnergy (BCSE), with financial support from the Australian Government throughAusIndustry. The BCSE has developed this Roadmap to identify the potential ofAustralia’s PV industry and the economic, social and environmental benefits it coulddeliver over the next twenty-five years. It also sets out how this potential could beachieved through ‘joined-up’ actions between government and industry.
The BCSE acknowledges the assistance of a number of its members and otherstakeholders in providing input for this Roadmap. It also acknowledges the assistanceand support of the consultants Dr David Crossley and Greg Watt (Energy FuturesAustralia), Paul Cowley (IT Power Australia), Geoff Stapleton (Global Sustainable EnergySolutions) and Richard Collins (Punchline Energy). In addition, this Roadmap would nothave been possible without significant inputs from industry, and it acknowledges theseinputs especially from Muriel Watt, Andrew Blakers, Georgine Duncan, Philip Mackey,Mark Twidell, Tony Stocken, Alison Reeves, Fiona O’Hehir, Sylvia Tulloch and Peter Lawley.
// ABOUT THE AUSTRALIAN BUSINESS COUNCIL FOR SUSTAINABLE ENERGYThe BCSE is the leading advocate for sustainable energy in Australia. It has more than250 organisations as members ranging from installers and designers of renewableenergy systems to large project developers and equipment manufacturers. Membersalso include both retailer and generator companies.
The BCSE undertakes activities and programs which support the development of the PVindustry in Australia. These activities are aimed at building industry capacity andcapability, addressing impediments, and promoting the benefits to potential customers.Industry development activities include:
� Providing the Chair and Secretariat for the Renewable Energy Action AgendaImplementation Group. This is the Implementation Group for the Renewable EnergyIndustry Action Agenda. This is a joint industry-government strategy to grow therenewable energy industry to annual sales of $4 billion by 2010.
� Maintaining an accreditation scheme for industry practitioners who design and install stand-alone and grid-connected PV systems and stand-alone hybridenergy systems.
� Working with state agencies on programs and projects to facilitate development of the renewable and sustainable energy industries.
� Developing guides and other resources, often with financial support fromgovernment, to assist the implementation of sustainable energy projects.
� Working with industry sectors to increase training and skills.
Disclaimer
The views expressed in this publication are those of the authors at the time of writing. The Australian Business Council for Sustainable Energy (BCSE) and AusIndustry do not in any way guarantee the accuracy of anyinformation or data contained in this publication and accept no responsibility for any loss, injury or inconvenience sustained by any users of this publication or in relation to any information or data contained in thispublication. No person should rely on any information or data contained in this publication without independently verifying its accuracy, currency, completeness and relevance for their purposes. All users of thispublication should always obtain independent professional advice before making any investment or business decisions in relation to any information or data contained in this publication.
This report was funded by AusIndustry and the BCSE.
Please note that all dollar figures expressed in this document are in Australian dollars (AUD) unless otherwise specified. Reference to ‘government’ refers to the Australian Government, not to the state governments,which are described as such or delineated by state.
Australian Business Council for Sustainable EnergySuite 304, Level 3, 60 Leicester Street, Carlton Victoria 3053T (03) 9349 3077 F (03) 9349 3049www.bcse.org.au
3 August 2004
© Australian Business Council for Sustainable Energy
ISBN 0-9756076-1-8

THE AUSTRALIAN PHOTOVOLTAIC INDUSTRY ROADMAP 1 //
// EXECUTIVE SUMMARY
The vision for Australia’s PV industry Solar photovoltaic (PV) technology generates electricity from sunlight. There are nogreenhouse gas emissions in its operation and no noise, and it can provide both off-gridand grid-connected benefits. PV is an unobtrusive, decentralised technology that can bedeployed in innovative ways in a myriad of applications. The fuel for PV – the sun – is asource of boundless energy.
This Roadmap sets out the industry development strategy to deliver a cost competitive,vibrant Australian PV industry by 2020. Funded by AusIndustry and the Australian PVindustry, the Roadmap is the culmination of an extensive 10 month consultation processinvolving input from all areas of the industry and taking into account internationaldevelopments impacting upon the PV industry.
The PV industry is growing internationally to be multi-billion dollar industry. Awarenessof the benefits is increasing as innovative international government programs takeeffect. This in turn results in industry development and a significant increase in installedcapacity. Accordingly, the cost of PV technology is continuing to fall.
Australia has vast solar resources, we have leading technologies and world classresearchers, we have a number of promising start-up companies – so why have wefailed to deliver on the potential? And why have other countries overtaken us? What canwe do to redress the problem? These are the issues that this Roadmap seeks to address– it seeks to reposition Australia as a world leader in a field in which we havehistorically excelled.
Australia is currently at a crossroads in terms of its participation in this global scene.
The issue for the Australian PV industry today is that there is enormous marketpotential, built up through a natural competitiveness in Australian research anddevelopment, industry investment and government policy support. However, despite thisgrowth, the industry is not yet self-sustaining and advantages gained to date could belost. The PV industry cannot continue to actively invest in strategic industry developmentunless the Australian government is also committed to the journey.
The industry has identified its strengths and necessary developments in technology andmarkets, but requires policy and program support to assist it in bridging the gap tomainstream commercial competitiveness.
A strategic industry – government development framework is now required for Australiato leverage historical expertise and develop a growing domestic market with associatedbenefits into the future. Global growth in the PV industry and resulting cost reductionswill continue with or without Australian participation. However, the absence of astrategic industry development framework will see Australia develop as a net importerof PV systems and components, thus losing local jobs and investment in manufactureand system development.
During the consultation process for this Roadmap, Australian industry has outlined‘Sunrise’ targets for PV market expansion for 2010 and 2020 that it has the capability todeliver in cooperation with government. The main industry objectives are to meet aninstalled capacity of 6,740 MW by 2020, PV sector jobs of 31,600, revenue of $5,160million annually and nearly 10 million tonnes of CO2 of avoided in 2020.
Sunrise targetsAustralian PV industry 2003 actual 2010 2020
Installed Capacity (MW) 46 350 6,740
Employment 1,100 5,290 31,600
Total sales revenue ($ million) 204 1,180 5,160
CO2 abated in year (‘000 tonnes) 65 490 9,320
The Roadmap identifies two critical components:
� Belief from industry and the financial sector that a significant PV opportunity existsin Australia and for export markets, in which it is worth investing considerablefinancial and infrastructure resources, to build a strong, sustainable industry sector; and
� Recognition by the government that PV has an important place in the Australianenergy fuel mix, through the implementation of a sustainable industry developmentstrategy that will assist in bridging the gap for consumers between now andcommercial viability.
For the ‘Sunrise’ targets to be achieved, the PV industry requires that current electricitymarket impediments constraining the uptake of PV be addressed by government. Untilsuch time as these are rectified, compensatory measures that reward the benefitsprovided by the large-scale deployment of PV need to be implemented.
The Roadmap thus requires that government and industry work together to develop themarket for PV in Australia, and to leverage the resultant expertise to build a vibrantexport industry. Key actions coming from the Roadmap are:
Government to provide an industry development framework that supports newinvestment and includes:
� Market stimulation – this addresses specific market impediments that prevent thebenefits that PV provides being adequately recognised and rewarded. Marketstimulation underpins increased demand by bridging the current cost competitivegap in the key PV markets for off-grid and grid-connect. This includes feed-in tariffs,enhancing the Mandatory Renewable Energy Target, implementing effective buildingcodes and standards, supporting diesel replacement, and providing financial supportfor strategic market development.
� Removal of regulatory barriers – this addresses electricity market impedimentsthat result in increased installation costs, and delays arising from metering,connection and pricing arrangements.
� Building industry capacity and capability – this includes supporting industrydevelopment activities that build local industry capacity, and includes support forexports, innovation, training and education.
For its part Australia’s PV industry will continue to build on and leverage its investmentsto date with specific actions as follows:
� Drive installed system costs downwards.
� Improve quality, reliability and performance.
� Expand and develop markets and applications.
� Support for industry capacity building.
Australia has the makings of a world class PV industry. The industry is poised to makethe required investment, the economic value of which will flow across the Australianeconomy, if it is provided with a stable and transparent long-term policy framework thatenables PV to compete on its merits and be rewarded for its benefits.
A growing global industry
The global PV industry has been growing at over 30 per cent per annum over the last tenyears and this growth is expected to continue well into the future. Expectations are thatit will grow to $15 billion per annum by 2010 and in the order of $1.5 to $2 trillion by2030. This growth has been underpinned by market-based programs that have beensupporting the deployment of PV in order to reduce its cost and make it mainstream.
In addition, higher values are increasingly being placed on ancillary services, such aspower system reliability and voltage stability, so that a simple comparison of energycost is no longer appropriate as a measure of competitiveness.
PV industry support programs in a number of developed countries will sustain a highglobal growth rate. These programs have ambitious targets for installed PV capacity intheir respective countries, for instance: Japan – 4820 MW by 2010; Germany – 2000MW by 2010; and the US – 3000 MW by 2010.
This support for PV is principally driven by the desire to reduce greenhouse gasemissions, to create new sustainable employment and investment, meet future energydemands, and to maintain or achieve energy supply security. In addition, there areadditional region-specific drivers that facilitate growth of the global PV industry.
The market for grid-connected PV has grown at 65 per cent and the market for off-grid PVhas grown at 18 per cent over the last five years. Whilst it is difficult to predict how thePV industry will grow into the future, industry experts believe that annual growth rates inthe range of 15 per cent to 30 per cent are likely to be achieved over the period to 2010.
The PV industry in Australia
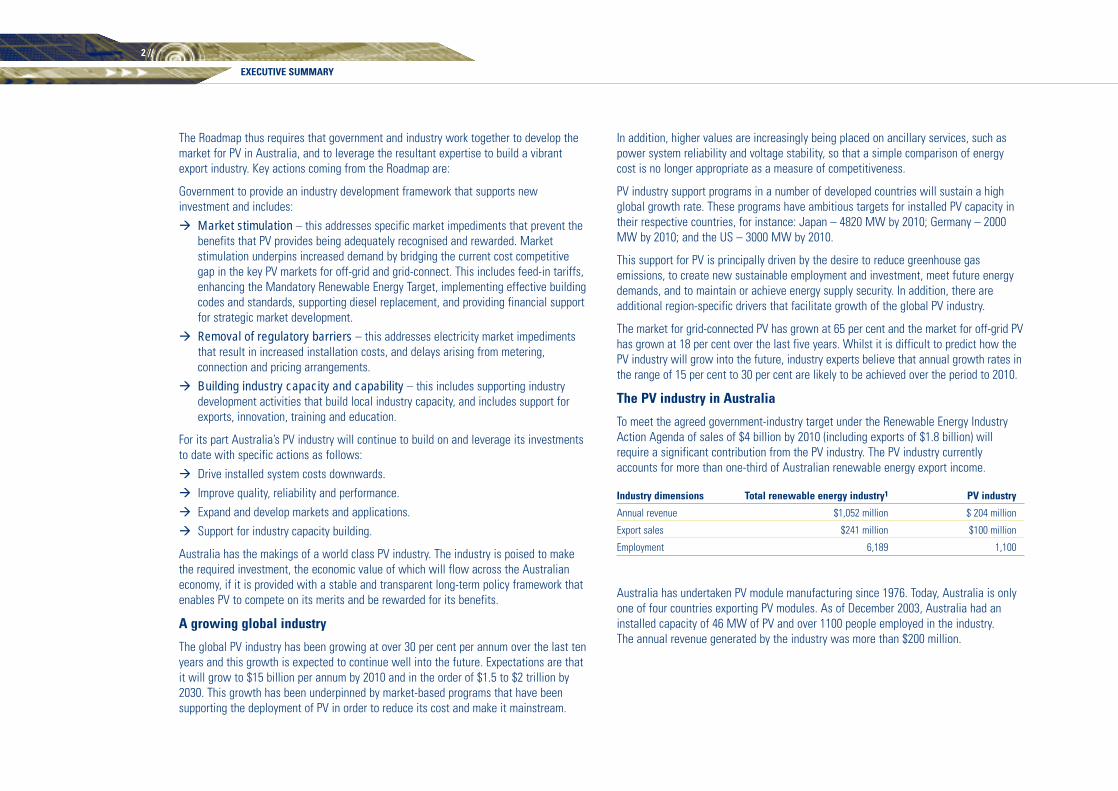
To meet the agreed government-industry target under the Renewable Energy IndustryAction Agenda of sales of $4 billion by 2010 (including exports of $1.8 billion) willrequire a significant contribution from the PV industry. The PV industry currentlyaccounts for more than one-third of Australian renewable energy export income.
Industry dimensions Total renewable energy industry1 PV industry
Annual revenue $1,052 million $ 204 million
Export sales $241 million $100 million
Employment 6,189 1,100
Australia has undertaken PV module manufacturing since 1976. Today, Australia is onlyone of four countries exporting PV modules. As of December 2003, Australia had aninstalled capacity of 46 MW of PV and over 1100 people employed in the industry. The annual revenue generated by the industry was more than $200 million.
2 //
EXECUTIVE SUMMARY

3 //
PV has enormous potential in Australia across a range of applications and activities. The 350 MW installed capacity target under the industry’s ‘Sunrise vision’ comprisesthe following sector projections:
Sunrise 2010 projections by market sector Installed capacity (MW) 2003 SunriseBy application sector actual 2010
Off-grid domestic
Remote households, holiday homes, pastoral stations, isolated communities (indigenous), fringe-grid 13.5 MW 40 MW
Off-grid non-domestic
Telecoms, water pumping, signalling, cathodic protection, electric fences, street lights, tourist facilities 20 MW 94 MW
Off-grid mini-grids
Isolated communities (mines), public generation 6.0 MW 12 MW
Grid-connected distributed
Residential rooftops, commercial BIPV 6.5 MW 163 MW
Grid-connected centralised
Network strengthening, bulk power 1.5 MW 38 MW
Consumer devices
Small portable electronic devices 0.2 MW 1 MW
TOTAL 46 MW 350 MW
The Australian PV Industry has invested significant funds and dedication to buildthe PV market to its present internationally recognised level of achievement. Overthe last six years alone, the Australian industry has invested the following efforts:
� Investment of more than $150 million in R&D, mostly in the past three years.
� Investment in additional manufacturing facilities for modules and systemcomponents.
� Creation of new jobs across the industry to over 1,100.
� Development of export markets in technology and services by meeting the needs of targeted aid budgets and international development activity.
� Continued improvement and development of installer training and accreditation.
� Developing Australian Standards.
� Development and expansion of distribution and marketing channels.
� Development and expansion of education and training facilities.
� Informing markets and governments of the technologies benefits.
� Promotion and demonstration of the benefits of PV through programs and activitiessuch as Solar House Day.
� Participation in international collaborative programs such as the InternationalEnergy Agency PV Power Systems (PVPS) program.
� Dedicating effort to international trade missions.
� Supporting the BCSE as an industry association to build industry capacity andcapability.
� Dedicating considerable time and effort to the development of an industrydevelopment vision and strategy.
International opportunities for AustraliaThe developing world is expected to dominate future growth in demand for energyservices. PV is already cost-competitive in some applications, particularly off-grid, andfrequently offers the lowest cost energy service on a life-cycle basis compared to othersupply options, such as conventional power networks. PV offers developing countries anappropriate means of delivering reliable energy services to rural populations in anenvironmentally sustainable way. For this type of application, energy services can meetrequirements for potable water, health care and lighting. The potential demand for PV inAfrica, Asia and Latin America is estimated at 19 GW2; this is seven times more thanthe current worldwide installed capacity.
MW of PV installed in Australia
0
1
2
3
4
5
6
7
1992 1993 1994 1995 1996 1997 1998 1999 2000 2001 2002 2003
kWp
grid-connectedoff-grid
THE AUSTRALIAN PHOTOVOLTAIC INDUSTRY ROADMAP

International market development activities impacting on renewable energy include thefollowing:3
� Internationally-coordinated greenhouse gas reduction polices and clean airpolicies. The Kyoto Protocol and associated programs, for example the CleanDevelopment Mechanism, provide financial incentives for the implementation ofrenewable energy projects, particularly in developing countries.
� Bilateral arrangements, such as the renewable energy component underAustralia-US Climate Action Partnership, provide opportunities for drivingrenewable energy markets and exports.
� Specific programs for the implementation of renewables in developingcountries. These may be classified as financial incentives, however theirimplementation requires policy initiatives by developing and developed countrygovernments, plus multilateral and bilateral donors. The World Bank recentlycommitted to increase its investment in renewables within its energy portfolioby 20 per cent annually (the current level is four per cent).
� The introduction of competitive energy markets that allow consumers to choosemore environmentally sustainable power supply.
Technology trendsCurrently between 50 and 65 per cent of the PV market value, which includes muchresearch and development and intellectual property value, is ‘locked’ within the PVmodules. The remainder of the market value comes from the enabling technology (or‘balance of system’) components, such as power conditioning equipment, batteries(mainly for off-grid systems), cables and fittings, and from non-component services, suchas design, installation, maintenance and provision of consultancy services.
Over the past decade, global PV module prices have consistently decreased at the rateof approximately 18 per cent with each doubling of cumulative production experience(82 per cent cost to progress ratio). At current market growth rates this equates toannual cost reductions of around 6 per cent. The rate of progress is expected tocontinue for at least the next 10 years. Current international targets for PV foresee a fourfold increase from the current worldwide installed power of almost 3 GW to at least 11 GW by 2010. PV module prices will therefore fall by at least a third over the next seven to eight years, which will be reflected by similar reductions in the cost of PV electricity.
The case for continued support for Australia’s PV industryAs PV is coming from a very low level of installed capacity, its full life cycle cost is stillconsiderably more expensive that conventionally-supplied coal-based electricity.
PV can be competitive in a greater number of markets, but is prevented from being so aspricing structures in Australia’s energy markets do not currently capture the economicand environmental benefits that PV systems provide, thus disadvantaging PV ineconomic decisions made by energy consumers. In addition, the higher up-front installedcost makes it difficult for customers to finance.
Current coal-based grid electricity prices do not reflect a range of environmental,technical and social externalities which are borne by the community and which wouldbe reduced for each kWh substituted by PV generation. There are a number of unpricedbenefits that PV provides, which are not currently recognised and rewarded. The policyframework that has been advanced by the industry in this Roadmap requires that thesebenefits be recognised, or if not, then other measures be introduced to compensate:
� Offsetting escalating peak power demand.
� Low environmental impact.� Use of a building integrated material.� Security of supply.
Importantly, adopting the ‘Sunrise’ policy framework that is outlined in theRoadmap will additionally enable:� The development of a local industry where Australia can build a substantial
global position in the growing global PV industry, well beyond its GDP share ofthe world economy.
� Local manufacturers and suppliers to be able to plan and invest to update andexpand their facilities. The stop-start approach to PV support taken to date hascreated significant uncertainty at a time when Australia could have been furtherleveraging off its competitive advantage.
� PV to become accessible to all Australians, thereby enabling the community todirectly embrace sustainable development and the reduction of greenhouse gas emissions.
� The community to understand that the government is serious about reducinggreenhouse gas emissions as PV is a most highly visible sustainable energytechnology and one in which households, community groups & businesses candirectly participate.
EXECUTIVE SUMMARY
4 //

THE AUSTRALIAN PHOTOVOLTAIC INDUSTRY ROADMAP 5 //
� The continuation of support for capacity building that will enable PV to becomecost effective in the medium to longer term, enabling Australia to achieve thedeep cuts in greenhouse emissions that are required to stabilise the impacts ofclimate change.
� The development of a transition path where the benefits of PV are valued bycustomers and the electricity industry.
This will deliver a vibrant local industry that will make a significant contribution to theAustralian economy and to the task of reducing greenhouse gas emissions. The PV industrycan grow to an installed capacity of 6,740 MW by 2020, provide nearly 32,000 jobs, haveannual sales of $5,160 million and avoid nearly 10 million tonnes of CO2 in 2020.
PV industry activity frameworkTo deliver the ‘Sunrise vision’ for installed capacity of 350 MW by 2010 requires specificactions and activities by both industry and government. The policy framework requiredof government is in relation to specific PV market sectors, and the Roadmap sets out acomprehensive approach that considers market stimulation, addresses impediments andbuilds industry capacity and capability.
For its part Australia’s PV industry will continue to build on and leverage its investmentto date. Specific actions for industry include:
1. Continue to drive installed system costs downwards through:� Investing in the expansion of manufacturing facilities, including modules and
balance of systems components.
� Investing in improved manufacturing, logistics and resourcing processes.
� Improving component and product standardisation to reduce unit costs.
� Continued investment in research and development to improve systemperformance and lower cost per kWh of system output.
� Developing new products and installation methods for both existing and new markets.
� Increasing the efficiency of the supply chain to bring services to customers inmore timely and cost-effective manner.
� Developing innovative financing approaches that reduce the effective cost to customers.
� Developing synergies with other industry sectors such as building andconstruction (particular new buildings), electricity distribution business (withregard to network strengthening and connection) as well as infrastructureowners and operators.
� Developing innovative and flexible supply channels to access new and expandingmarket segments.
� Improved system packaging and integration to deliver lower installed costs.2. Continue to improve quality, reliability and performance of PV systems through:� Continued development of standards, training and accreditation of designers
and installers of PV and hybrid systems.� Continued investment in expanding and extending system and component
testing.� Continued investment in development of process and control equipment to
optimise system performance.� Continued improvement in after sales service availability and cost.
3. Continue to expand and develop markets and applications for PV by:� Continuing to differentiate service provided by PV from alternative fossil
fuel generation.� Continuing work on promotion of the benefits that PV delivers and seeking to
get these recognised and rewarded in the market.� Increasing marketing, consumer awareness and education.� Undertaking extensive promotion and training within the building industry
and trades.� Seeking out higher value markets that provide a premium by recognising,
aesthetics, reliability and security of supply.� Developing product solutions that are valued by different market sectors,
e.g. BIPV, telecoms, and transport market solutions.� Partnering with existing industries and supply chains so as to streamline
marketing and supply and to expand into new markets.� Supporting trade initiatives and the further development of channels and
markets overseas.� Continuing to develop export markets for Australian components, systems
and services.4. Support industry capacity building by:� Continuing support for development of training and education infrastructure.� Supporting international collaboration on research and development, market
development and standards.� Undertaking regular market surveys to ascertain customer requirements for
products and services.

Proposed Government PV policy frameworkTo support industry’s actions, the following policy roadmap provides government with aportfolio of sustainable industry development policy mechanisms that deliver multiplebenefits to both the PV industry and the Australian economy more broadly. This willconsolidate Australia’s international competitiveness, promote innovation andinvestment and increase the range of economic and social benefits which PV can deliver.
The policy framework is set out in two steps. The first step includes the broad-basedindustry development and energy market initiatives that are required to establish anoverall energy market framework that facilitates the development of the PV industry.The second step has a suite of measures that focus on the three specific PV markets:grid-connect, off-grid and export.
Step 1 – Broad-based and industry development initiatives� Building industry capacity and capability, through:
– Targeted funding programs to underpin industry development, includingdeveloping industry standards, developing a skilled and accredited workforce, as well as participation in international taskforces on industry development.
– Support for innovation and commercialisation in the areas of technology,financing, applications and marketing to ensure that Australian industry canmaintain a competitive advantage over time.
� The introduction of a greenhouse price signal into the electricity sector wouldensure that investment, purchasing and operating decisions include the cost ofgreenhouse gas emissions. This also recognises the greenhouse benefits ofinstalling PV rather than being supplied by emission intensive coal-fired powergeneration.
� Changes to make MRET more effective as an industry development initiative for PV.This includes changes to the ‘deeming’ provisions for PV so as to reducetransactions costs and better reflect the performance of PV systems.
Step 2 – Sector-specific programsIn addition to the broader energy market and the general industry capacity buildinginitiatives, specific programs have been developed that focus on the three specific PVmarkets; grid-connect, off-grid and export. These programs provide a suite of measuresthat will stimulate each sector and address the impediments that are preventing the fullpotential of PV being realised.
i. 150,000 Roofs by 2010 program – grid-connect marketThis program consists of five measures that are geared to the development of thegrid-connect market so that by 2010, this market has grown to 200 MW installedcapacity and the total installed PV capacity in Australia has grown to 350 MW. Likeother developed countries the grid-connect market will drive future growth ofAustralia’s PV industry. To achieve large-scale deployment of PV in this sector,systems must be available at $5000 per installed kW to consumers. At this level PVbecomes economically viable for customers.
It is important that growth in the grid-connect market be maintained by extending theexisting PV Rebate Program (PVRP), or an equivalent strategy, until such time as thefollowing proposed industry development measures are implemented. Failure to do so willcreate a hiatus that will cause the industry to stall.
Reward network benefits of grid-connect systems through a ‘feed in tariff’A ‘feed in tariff’ is proposed as the optimum industry development method for the grid-connect market to follow on from the completion of PVRP. Feed-in tariffs work byarranging for all PV customers to be paid a higher price for electricity produced fromtheir PV system. This approach has been demonstrated to be very effective in a numberof countries.
The higher value for the power produced reflects the considerable benefits thatdistributed PV systems provide to the electricity distribution system that are notcurrently recognised, nor rewarded. These include contribution to meeting peak powerrequirements and network integrity and security.
Ensure that PV is incorporated in new building Codes and Standards A number of state governments are implementing mandatory minimum energyperformance standards for new residential buildings. This provides an importantopportunity for PV to be incorporated into new residential buildings and providesbuilding developers with a number of options to meet the greenhouse reductionrequirements.
This model should be developed and rolled out into other states and also roll out intonew non-residential buildings. States such as Victoria and South Australia haveintroduced minimum five star energy efficiency requirements for new residentialbuildings. At present these schemes do not give credit to customers who install PV, butthere is potential for this to occur in the future. All energy performance schemes shouldappropriately recognise and reward the contribution of PV systems to electricity supplyfor the building envelope.
EXECUTIVE SUMMARY
6 //

THE AUSTRALIAN PHOTOVOLTAIC INDUSTRY ROADMAP 7 //
Support for market developmentTargeted funding programs are important to underpin community acceptance andunderstanding and to support industry development. In the case of the grid-connectmarket these activities include:
� Improving the visibility of PV in the built environment through an expansion of thesuccessful schools programs and extending schemes to other government andcommunity facilities.
� New government and public buildings to be required to consider PV integrated withenergy efficiency measures in the design phase.
� Support outreach education programs to highlight the benefits of PV, including thefurther development of curriculum materials for schools.
� Support the development of iconic high profile PV projects. Each state shoulddevelop at least four such facilities by 2010, perhaps through design competitions,which would create even greater awareness.
� Training and promotion to building designers, engineers, planners and consultants toincrease their expertise and awareness about PV technology.
� Marketing and promotion of the benefits and opportunities that PV can deliver.
Creating a level economic playing fieldPV technology will compete more effectively in Australia’s energy markets when currentmarket distortions are addressed to create a level playing field with more efficienteconomic outcomes.
This requires that power prices to consumers be more cost reflective in terms oflocation and time of use. In this way consumers are provided with price signals inproportion to the impact that their electricity use has on the investment required in thenetwork and in new generation.
Processes and requirements for the connection and deployment of PV systems currentlyact as a significant hurdle to investing in a PV system. Cconnection should bestreamlined by standardising connection agreements to best practice and enablingcustomers to choose a metering system with a minimum requirement of digital netmetering. Guidelines need to be established by state-based electricity regulatorsrelating to metering and connection of PV systems so as to minimise costs to customers,as well as reduce delays in connection.
ii Diesel replacement program – Off-grid market developmentPV in off-grid applications is currently disadvantaged through the operation ofsubsidised pricing for customers supplied through remote grids, particularly inQueensland, NT and WA. In addition, changes to the fuel excise arrangementsproposed in the Prime Minister’s 2004 Energy Statement, will mean that all powergeneration outside metropolitan areas will be able to use diesel and otherpetroleum products excise-free. This undermines the competitive position of PV, andincreases Australia’s dependence on imported fossil fuels.
To deliver on the PV targets for off-grid applications the following measures are required:� Diesel used for public generation should continue to accrue excise. This brings it
into line with diesel used in metropolitan areas and recognises the adverseenvironmental, security of supply and balance of payments impacts that come fromreliance on imported petroleum products.
� Customers in remote areas that are not connected to public grids who choose toinstall renewable energy rather than rely on diesel should be able to internalise the value of the excise that would have been paid had the system been inmetropolitan areas.
� Governments should progressively introduce more cost-reflective and transparentpricing practices for remote consumers. Retailers should charge regionallyappropriate prices and offer rebates to consumers who install renewable energysystems equivalent to the difference between the full cost of supplying thatcustomer and the uniform price actually paid by the customer.
iii. Facilitate the export of PV equipment and services, particularly to developing countriesThere are significant opportunities for Australia to export products and services,particularly in line with its off-grid PV expenses:
� Increase access to international aid programs by providing funding assistance tosupport the employment of industry experts to promote Australian industriescapabilities overseas and also to identify and disseminate overseas opportunitieslocally.
� PV to be included in Australian Aid projects to recognise that health care,education, local development and other development objectives are facilitated bythe provision of cost-effective local energy supply options. Renewable energysystems can play a key role in delivering development objectives.
� Assistance to utilise bilateral agreements that Australia has to leverageopportunities for market development and industry collaboration.

� Facilitate greater participation in international collaborative programs – thisincludes more comprehensive participation in the International Energy Agency PVPower Systems (IEA PVPS) program activities, as well as accessing thecollaborative programs of the European Commission.
� Assistance to build Australian industry capacity to export. Existing networks suchas the Australian Renewable Energy Exporter Network (AREEN) need to bestrengthened to allow for a full-time secondee from industry to support capacitybuilding and market development.
Australia has the makings of a world class industry. The industry is poised to make therequired investment if it is provided with a long-term policy framework that enables PVto compete on its merits, with benefits recognised and rewarded.
EXECUTIVE SUMMARY
8 //
THE AUSTRALIAN PHOTOVOLTAIC INDUSTRY ROADMAP 9 //
1// INTRODUCTION 10
2// THE AUSTRALIAN AND INTERNATIONAL CONTEXT 11
Meeting global needs 11The greenhouse imperative:
an important PV driver in Australia 12Energy supply in Australia 13Australian industry at the crossroads 13
3// THE AUSTRALIAN PV INDUSTRY 15PV cells and modules 15Applications 15Solar radiation 16History of the PV industry in Australia 17Value of the Australian PV industry 19Employment 20Australia’s competitive advantages 20
Research and development 20Manufacturing 21Innovations for markets 21System development 22Delivery to customers 22
Education and training 24Standards and accreditation 25Investment by the Australian PV industry 25
4// THE PV MARKET 26Global PV market 26Regional drivers for international growth 27Market development activities for renewables 28Financing support schemes 29The Australian PV market 29Market segments 30
Off-grid systems 31Mini-grid systems 32Grid-connected systems 33Small portable electronic devices 34
PV system pricing 34
Unpriced benefits of PV 35Offsetting the escalating peak power problem 35Low environmental impact 36Use as a building-integrated material 36Security of supply 36
Government support programs 37National programs 37Photovoltaic Rebate Program 37Remote Renewable Power Generation Program 37Mandatory Renewable Energy Target 37Renewable Energy Equity Fund (REEF) 37State Government Programs 38
Energy statement – ‘Securing Australia’s energy future’ 38
Impediments to further uptake of PV 39
5// WHAT IS THE POTENTIAL OF THE AUSTRALIAN PV INDUSTRY? 41Key common assumptions 42Projections of future PV sales 45
Off-grid domestic 45Off-grid non-domestic 46Mini-grid systems 46Grid-connected distributed 46Grid-connected centralised 47
Conclusions of modelling 47
6// EXPORT MARKETS 48Opportunites to export Australian R&D services
and intellectual property 48Market opportunities in developing countries 49Specific market opportunities for Australia 50Market opportunities in industrialised countries 51Leveraging Australia’s aid programs 52Opportunities to access international programs 52
REEEP 52International Energy Agency implementing
agreements 52Other international opportunities 53
How do we increase our PV exports? 53
7// THE WAY FORWARD 55Industry development policy framework 59PV industry activity framework 60Proposed Government PV policy framework 61
Step 1 – Broad-based industry development initiatives 61
Step 2 – Sector-specific programs 621. 150,000 Roofs by 2010 program 622. Diesel replacement program 653. Facilitating exports 65
8// CREATING THE DRIVERS FOR INNOVATION 66Policy support 66Strategic industry status 66PV R,D&D Fund 67 Technical innovation 67Financial innovation 68Innovation requirements by market sector 68
Off-grid residential 68On-grid residential 69Off-grid industrial 69Centralised grid-connected systems 70Small portable devices 70
9// CONCLUSIONS 71
NOTES 73
REFERENCES & WEBSITES 75
GLOSSARY AND ABBREVIATIONS 79
APPENDICES 81
// TABLE OF CONTENTS

1// INTRODUCTIONSolar photovoltaic (PV) technology generates electricity from sunlight. There are nogreenhouse gas emissions in its operation and no noise, and it can provide both off-gridand grid-connected benefits.
This Roadmap sets out the industry development strategy to deliver a cost-competitive,vibrant Australian PV industry by 2020.
Under this strategy, PV will provide 3 per cent of Australia’s power needs by 2020, andwill have become accessible to the wider community at prices competitive to projectedgrid electricity prices. The technology will be applied according to innovative Australianmarket developments. This means integration into Australia’s urban as well as ruralenvironment – into the façades and atriums of commercial buildings, on structuresalongside roads and highways, as individual applications such as street lighting, andmost importantly, on homes connected to the grid.
Over the past twenty years, the Australian PV industry has proven itself to be bothinnovative and commercially practical. Australia has a place among the world leaders in PV technology, particularly in providing reliable power to remote applications, in itsworld-class research, and in development of PV technologies and their applicability to markets.
This document sets out the PV industry in both a global and Australian context, anddetails national and export markets. Scenario modelling for the Australian PV industry’scapabilities is explained and targets are set out for installed domestic capacity for 2010,2020 and 2030. This modelling underpins the way forward for the PV industry with anappropriate industry activity framework delivering industry benefits stimulated by aportfolio of government industry development policies.
Developing the RoadmapThis Roadmap is the culmination of a 10 month extensive consultation process that hasinvolved input from all aspects of Australia’s PV industry and has been informed bydevelopments in the international PV industry.
A brief summary of the consultation process is set out below:
� An initial scoping meeting was held in August 2003 between the consultancyteam, BCSE and the initial consortium of key interested parties, including industryand universities.
� The first workshop was held in Sydney in September 2004. Prior to the workshop,stakeholders were invited to submit three points or ideas in relation to each of thefollowing questions:
i. Where do we want the PV industry to be in the short term (say 2010), themedium term (say 2020) and the long term (say 2030)?
ii. What’s stopping the PV industry from realising these short, medium and longterm goals?
iii. What strategies should the PV industry and its various stakeholders adopt toachieve the short, medium and long term goals?
The responses were collated prior to the workshop and used to guide thediscussion at the workshop. During the workshop, break-out sessions were heldto discuss the three questions.
� To capture input from other interested stakeholders, a series of workshops wereheld during August, September and October 2003 in all mainland capital cities.These meetings comprised:
i. PV industry consultation forums – during which experts involved in the PVindustry were able to express their views and visions for the future of theindustry in the short, medium and long terms. It also involved those currently notactive in the industry, but who could be, such as architects.
ii. Focus groups – small group meetings during which those involved in the PVindustry and other potential stakeholders (such as representatives of the buildingindustry, local councils and government policy makers) were also able to expresstheir views.
These events were attended by a total of 106 people from a range of areas,including PV manufacture, PV supply chain, PV research and development (R&D),PV policy and support, PV users, energy suppliers, government representatives,architects and designers, and the building sector.
� Workshops were also held in Sydney and Melbourne with BCSE industrystakeholders and the project team, to develop and synthesise results of theconsultations, develop and refine the industry modelling and develop industry andgovernment actions under the Roadmap.
� In addition, the project team took advantage of a number of industry conferencesand seminars to discuss the Roadmap process and obtain input from delegates.These included:
– Alternative Technology Retailers Association Annual Conference, Hobart, 8–10 August 2003.
– Urban Development Institute of Australia Conference, Brisbane, 25 September 2003.
– BCSE National Conference, Sydney, 30 March–1 April 2004.
INTRODUCTION
10 //

THE AUSTRALIAN PHOTOVOLTAIC INDUSTRY ROADMAP 11 //
2// THE AUSTRALIAN AND INTERNATIONAL CONTEXTFOR PHOTOVOLTAICSGlobally, the PV industry has been growing at over 30 per cent per annum over the lastten years, and this level of growth is expected to continue well into the future. Recentgrowth rates have been due to substantial uptake of PV in grid-connected markets inEurope, Japan and the US. This growth has been underpinned by market-basedprograms that have been supporting the deployment of PV in order to reduce costs andmake it mainstream.
The global rationale underlying this concerted drive for growth in the PV industry arevaried and often complex. Four fundamental factors, however, underpin theattractiveness of PV and explain the fervent response internationally:
i. The use of PV for electricity is an effective response to the globally recognisedimperative to reduce greenhouse gas emissions in order to stabilise human-inducedclimate change.
ii. PV is seen as an important technology in addressing energy security, in terms of:
� Being a foil to rising international energy prices.
� Requirements to import large amounts of fossil fuels.
� Improved security and reliability of supply.
iii. PV is an effective way in which to meet the growing energy demands of developingcountries and, in particular, to provide power to the 2 billion people in thedeveloping world who do not presently have access to electricity.
iv. PV is a globally emerging industry that will revolutionise the way that energy isgenerated and consumed, and will provide significant growth in employment globally.
In addition to the above, the structure, ownership and operation of electricity systemsaround the world are changing in response to industry restructuring, the availability ofnew technologies and increasing environmental awareness. Large-scale, central powergeneration and distribution, which has characterised the electricity industry for much ofthe 20th century, is being challenged by new technologies, which are cleaner, faster todeploy and better matched to local requirements. These have the advantage of beingdecentralised, which means that they are generating electricity closer to point of use,they are less vulnerable to terrorist attacks, and they increase security of supply.
Higher values are increasingly being placed on ancillary services, such as power systemreliability and voltage stability, so that a simple comparison of energy cost is no longerappropriate as a measure of competitiveness. PV electricity is unique amongst the newenergy sources for the wide range of energy and non-energy benefits which can beprovided, while the use of PV power systems as an integral part of a building provides
the greatest opportunity for exploiting non-energy benefits and for adding value to thePV power system. PV is also unique in its ability to deliver energy from microwatts to megawatts.
PV is proving that it can deliver the above requirements. It is an unobtrusive technologythat can be deployed in innovative ways in decentralised locations. The fuel for PV – the sun – is a source of boundless energy.
The USA,1 the European Union2 and Japan3 all have recently published Roadmaps forthe development of their PV industries, which show the level of internationalcommitment. These all reflect PV as a major industry growth opportunity.
Meeting global energy needsAccording to the International Energy Agency (IEA), global electricity consumption isexpected to increase by over 130 per cent from 2001 levels by 2040 to 36,346 TWh4.This presents the global community with an awesome challenge in being able to supplythis electricity in a manner that not only addresses important energy securityconsiderations but also results in a net reduction in greenhouse gas emissions.
BP’s Statistical Review of World Energy 20045 was published on June 15th, and showsthat, at current rates of production, the world’s proved reserves of oil are sufficient tolast for 40 years, with nearly 77 per cent of those reserves are located in OPECcountries. The proved reserves of natural gas are sufficient to last for 67 years atcurrent rates of production, with the largest reserves in the countries of the formerSoviet Union. Proved reserves of coal are sufficient to last 192 years at currentproduction rates, with most reserves in North America, the Asia Pacific region, andEurope and Eurasia.
World energy use increased three percent in 2003, with the strongest growth (sixpercent) in the Asia Pacific region. Among fossil fuels, coal grew fastest in 2003, withan increase of 7 percent, largely due to a reported increase of more than 15 per cent inChina. Chinese oil demand has also doubled over the past ten years, leading BPs ChiefExecutive, Lord Browne of Madingley, to conclude in his foreword that China ‘will be amajor influence on the world energy scene from now on’.
In contrast to its fossil fuel statistics, BPs statistics on renewable energy sources arerelatively limited. The report does note that PV capacity has increased more than ten-foldover the last decade.
Shell International Petroleum has also recognised the capability and potential ofrenewable energy. In a report released in 2003,6 it predicted that more than half of theworld’s energy supply will come from renewable resources by 2050. Shell is acting onthis view by increasing its investment in renewables, including PV, having provided PV

12 //
systems to 28,000 more rural homes with no access to power from the grid in 2003,bringing the total to 50,000 since off-grid rural operations began in 2000.7 Other majorglobal companies such as General Electric are moving into the renewables sphere throughthe acquisition and development of wind and PV businesses over the last few years.
Renewable energy therefore has a critical role to play in meeting our global demand forenergy as recognised by two of the world’s largest energy companies. The EuropeanRenewable Energy Council (EREC)8 in its report ‘Renewable Energy Scenarios to 2040,’9concluded that renewables could provide 50 per cent of global energy needs by 2040,compared to the 2001 renewables contribution of 14 per cent. The report showed that,in terms of share of power consumption, renewables have the potential to increase itsmarket share from 19 per cent in 2001 to over 80 per cent in 2040. They also concludedthat, to achieve this vision, effective European policy frameworks are required to assistin the deployment of these technologies. The report showed that growing developingcountry markets, where distributed PV can replace the need to build expensive andintrusive electricity supply infrastructure, will ensure that PV will be the energy sourceof choice for many years to come.
The greenhouse imperative: an important PV driver in AustraliaThe way in which we use and produce energy has significant environmental andeconomic impacts. Meeting Australia’s growing energy needs currently results in theemission of millions of tonnes of greenhouse gases, which is having an increasinglyharmful impact on climate. This will continue to be a particularly sensitive issue inAustralia. As shown in Figure 2.1, Australia is now the highest greenhouse emitter percapita in the world at 27 tonnes per person and the USA is second highest at 21 tonnesper capita.10 This arises as a result of the significant amounts of energy used byindustry, in particular the aluminium industry, and our reliance on coal fired generation(the worst greenhouse gas emitter) to meet 80 per cent of our electricity needs.
Figure 2.1 Greenhouse gas emissions per capita for selected Annex I countries, 2001 (t CO2e)Source: The Australia Institute, 2004
Climate change is an immediate problem requiring urgent action. As the world is gettinghotter on average, Australia is also warming and getting drier. Australian scientists,including the Chief Scientist of CSIRO Atmospheric Research Graham Pearman11, agreethat this is due to the enormous amounts of fossil fuels that we burn – coal to generateelectricity and oil to drive cars. The effects of global warming include making extremeweather events more common, droughts worse and bushfires more severe.
Significantly reducing greenhouse emission is an important challenge facing the globalcommunity. The need for deep cuts has been formally acknowledged by the AustralianGovernment. The Foreign Minister, Alexander Downer, has stated:
“If we are going to achieve stability in global temperatures in the years ahead then CO2emissions will have to be reduced by between one half and two thirds.” 12
In 2000, the UK Royal Commission on Environmental Pollution brought down a reportexamining the feasibility of achieving a 60 per cent reduction in Britain’s emissions by2050. The report observed:
Human use of energy has grown enormously, based overwhelmingly on burning fossilfuels. This is causing a significant change in the composition of the atmosphere which,unless halted, is likely to have very serious consequences… In addition to previouslyrecognised risks from obtaining and using energy, the world is now faced with a radicalchallenge of a totally new kind, which requires an urgent response. The longer theresponse is deferred, the more painful the consequences will be.13
0
5
10
15
20
25
30
Australia USA Germany Russia UK Japan
(t CO2e)
THE AUSTRALIAN AND INTERNATIONAL CONTEXT FOR PHOTOVOLTAICS

THE AUSTRALIAN PHOTOVOLTAIC INDUSTRY ROADMAP 13 //
The Blair Government has responded with a detailed study and discussion of how sucha reduction might be achieved.14 Noting that the UK ‘is likely to face increasinglydemanding carbon reduction targets’, the UK Government concludes:
Credible scenarios for 2050 can deliver a 60 per cent cut in CO2 emissions, but largechanges would be needed both in the energy system and in society… Given the strongchance that future, legally binding, international targets will become more stringentbeyond 2012, a precautionary approach suggests that the UK should be setting aboutcreating a range of future options by which low carbon futures could be delivered, as,and when, the time comes.15
The European Union (EU) is in the process of implementing an emissions trading schemethat will place a value on carbon dioxide. The scheme is scheduled to commence on 1 January 2005. Current carbon dioxide prices quoted in the EU are around € 10 pertonne (approximately $18 per tonne).
Energy supply in Australia
Australia’s electricity supply is dominated by coal, whith over 80 per cent of electricityproduced supplied through the use of brown and black coal. Gas currently providesaround 11 per cent of electricity needs and renewables make up less than 9 per cent.
Australia’s overall energy consumption is expected to increase by nearly 60 per cent to2040. Electricity demand is expected to increase by nearly 65 per cent to over 355TWh16. Australia therefore has a critical challenge in reducing the carbon intensity of itspower supply. In the report ‘Securing Australia’s Energy Future’ launched by the PrimeMinister in June 2004, it is estimated that over $37 billion of new energy infrastructurewill be required to meet Australia’s growing energy needs to 2020.17
It is critical that an effective framework is adopted to guide future investment andensure that we are not just compounding our current greenhouse problems and creatinga greater burden for the future. Using energy more efficiently and switching from coal torenewable power generation are effective, long-term and globally accepted ways inwhich to mitigate climate change.
Australia has the renewable energy resource base to be able to significantly reduceemissions. Greenhouse gas emissions from the stationary energy sector (which accountsfor nearly half of Australia’s total greenhouse gas emissions) can be halved by 2040using existing technology and without affecting economic growth, according to the‘Clean Energy Future for Australia’ study.
The ‘Clean Energy Future’ study found that Australia has sufficient natural gas andrenewable energy resources, like solar, wind and bioenergy, to make up the bulk ofelectricity supply in 2040.18
To underpin this vision it is imperative for Government to implement policies thatincorporate the following:
� Support fuel switching away from coal to zero or low emission fuels.
� Provide a greenhouse price signal into the energy market to guide new investmentdecisions in energy infrastructure.
� Remove energy market impediments to distributed energy sources and create a levelplaying field with centralised fossil fuel generators.
The Clean Energy Future study has conservatively estimated that PV could contributefive per cent of Australia’s electricity needs in 2040, equivalent to an installed capacityof 9,000 MW. This did not include sector specific support mechanisms as outlined inthis Roadmap. The Australian PV industry has proposed a targeted vision for itscapabilities under the Sunrise targets, as outlined in Chapter 5. A sector-specificindustry development program is proposed meet these targets and to deliver a thrivingdomestic and competitive PV industry in Australia.
Australian industry at the crossroads
The global PV industry includes new manufacturing capacity that is located in countriesthat actively support PV and have growing local markets. In addition, the emphasis forthe application of PV in recent years has shifted internationally from off-grid to grid-connected markets and applications.
Australia is currently at a crossroads in terms of its participation in the global PVmarket. Whilst building up considerable expertise in PV over several decades andcurrently holding a position of some leadership internationally, particularly in the field ofoff-grid systems, Australian industry is in danger of losing this leadership. Significantgovernment policies are needed to assist the Australian industry to have confidence inexpanding, investing, innovating and becoming a profitable and cost-effective energysector industry.
A strategic industry development framework is now required to be implemented forAustralia to leverage historical expertise and develop sustainable domestic marketgrowth, with associated economic, environmental and social benefits into the future.Global growth in the PV industry and resulting cost reductions will continue with orwithout Australian participation. The absence of a strategic industry developmentframework will see Australia as a net importer of PV systems and components, thuslosing local jobs and investment in R&D, manufacture, and system development andinstallation.

14 //
The Department of Education Science and Training has published a Report entitledCommercialisation of Photovoltaics Research in Australia.19 This highlights the history ofAustralian leadership in PV technology, and the ‘difficulty of gaining investors in PV’ inAustralia to commercialise the IP developed, especially compared to the commitment ofgovernments overseas.
CASE STUDY: PACIFIC SOLAR – AUSTRALIAN INNOVATIONAND MANUFACTURING LOST OFFSHORE
Pacific Solar was an Australian-formed company that commercialisedAustralian research and development at a site in Sydney and looked set toprovide innovative low-cost technology packaged product solutions toAustralian customers.
Founded in February 1995, Pacific Solar was a high-tech spin-off companyfrom the University of New South Wales, which provided the company’sinitial intellectual property.
Pacific Solar’s Crystalline Silicon on Glass (CSG) technology is a uniquethin-film PV technology that was readied for commercialisation and set upa pilot line plant in Sydney. Pacific Solar invested over $90 million indeveloping CSG and related technologies, including intellectual propertyvalued at over $19 million.
Unexpected changes to government funding support programs in early2003 put the new company in jeopardy. Market immaturity and uncertaintymade securing the necessary financial capital impossible and forced PacificSolar to look for investment in manufacturing and markets elsewhere.
In June 2004, the 20 former employees of Pacific Solar announced theformation of a new company, CSG Solar, to be based in Germany, that willconstruct a plant for the manufacture of Australian developed technologyand innovation.
The case of Pacific Solar highlights the imperative for sustainable marketand industry development policies to keep the benefits of Australianinnovation onshore.
�
THE AUSTRALIAN AND INTERNATIONAL CONTEXT FOR PHOTOVOLTAICS
Testing PV solar tiles

THE AUSTRALIAN PHOTOVOLTAIC INDUSTRY ROADMAP 15 //
3// THE AUSTRALIAN PV INDUSTRYThe Australian PV industry has participated in technology development and delivery forover three decades. This chapter explains the current commercial technology, thedevelopment of the PV industry in Australia and the industry’s value, commercialstrengths, activities and commitments to date. At present, Australia manufactures themajority of PV components for the domestic market and undertakes significant researchand development into technology and product development for the market.
The Australian PV industry is composed of the following sectors:
� Research and development.
� PV cell and module manufacturing.
� Balance of System (BOS) manufacturing.
� Distribution, wholesaling and retail sales.
� System integration, including design and installation.
� Electricity supply.
� Education and training.
� Standards and Accreditation.
PV cells and modulesPV cells are semiconductor devices that convert sunlight into direct current (DC)electricity. They do this silently and with no moving parts or emissions. There are a variety of technologies available, at various stages of development andcommercialisation. Today, the dominant, widely used cell technologies are mono-crystalline, multi-crystalline (first generation) and amorphous silicon (second generation)products.
Mono-crystalline and multi-crystalline cells are manufactured as individual elements. As asingle PV cell, they are fragile and deteriorate if exposed to the environment. PV modules,the useful structural electricity generation product, are manufactured by electricallyconnecting PV cells together and encapsulating them in weatherproof packages.
Each technology type has different manufacturing techniques, cost and performance,and are usually compared on a dollar per Watt basis. Each is more suited to variousapplications. For example, where surface area available is limited, mono-crystallinemodules provide maximum power output. Conversely, where low cost per square metreis important, amorphous modules may provide an advantage.
Each PV module provides a building block for a complete PV system consisting of anumber of modules and other electrical components. PV modules are electrically
connected in series (to build up voltage) and in parallel (to build up current) to suit thedemand and voltage requirements of a specific electrical load.
In Australia, there are no silicon wafers produced, but BP Solar produces both mono andmulticrystralline silicon cells from imported wafers, and Origin plans to use importedmonosilcion wafers to produce its Sliver® cells. There is no thin film (secondgeneration) production, of amorphous silicon, cadmium telluride (CdTe) or copper indiumdeselinide (CIS). Pilot production of Dye Solar Cells (DSC), a third generation technologybased on artificial photosynthesis, is undertaken at Sustainable TechnologiesInternational (STI).
Further Australian PV technology types include concentrator ‘dishes’, which work byconcentrating light onto PV cells and tracking the sun’s path.
For more information on all the technologies outlined above, see Appendix 1.
ApplicationsThere are two common applications, being Stand-alone Power Systems (SPS) and grid-connected systems. These are explained below.
Stand-alone Power Systems (SPS): also referred to as ‘off-grid systems’, include asystem controller, batteries for energy storage for night or periods of poor sunshine andan inverter, if the load requires it, to convert the DC of the batteries into conventionalAC power. Figure 3.1 shows the typical composition of a SPS, where the quantity of PVmodules and battery capacity are determined by the application.
Figure 3.1 Stand-alone PV power system
Solar arraySystem
controller
DC equipment
ACequipment
DC to ACinverter
Battery bank

Such off-grid applications include electricity for houses not on the grid, remote lightingand security systems, telecommunications, cathodic protection, battery charging,navigation aids, traffic and railway signalling, and monitoring systems.
The exception to the configuration in Figure 3.1 are PV pumping systems, which typicallyonly have a PV array, a pump and control equipment. They typically do not havebatteries, as the water is usually pumped to storage during daylight hours, for use whenrequired. Irrigation systems typically are used during daylight hours, so they also usuallydo not require battery storage. Water pumps run on DC electricity, and thus do notrequire conversion to AC.
Grid-connected power systems: include a DC to AC inverter, plus safety devices.Figure 3.2 shows the typical composition of a grid connect system.
Figure 3.2 Grid-connected PV power system layout
Figure 3.3 depicts global trends in the improvement of efficiencies of PV cell, moduleand inverter technologies. As can be seen, there have been significant efficiencyimprovements in all of these aspects of a PV system.
Figure 3.3 Improving efficiencies of PV technologiesSource: ESTIR, 2002, Energy technology indicators
Solar radiation
Solar radiation from the sun is the ‘fuel’ for the PV system. Where there is moreavailable solar radiation, the output of the system will be greater
Solar radiation is affected by a number of factors:
� Latitude – position on the globe affects the relative position of the sun in the skyand hence its intensity.
� Proximity to the coast or mountains – generally the closer to the coast ormountains, the greater the frequency of cloud coverage that obscures the sun.
� Time of day – the further away from noon then the lower the sun is in the sky andtherefore the intensity of solar radiation is lower.
� Time of year – seasonal changes bring varying cloud effects, position of the sun inthe sky and day length.
Compared to most other countries, Australia is rich in solar resources. The high averagesolar radiation available in Australia is shown in Figure 3.4, compared to other regions.For the grid-connect market, the majority of Australia’s population enjoys high annualsolar radiation. In addition, the availability of the solar radiation correlates closely withpeak loads (80 per cent of PV system output is during times of summer peak demand).The majority of the off-grid power system market is also located in areas with highradiation and where the cost of delivering diesel is expensive or in some cases, such asin tropical areas, impossible to access in the wet season.
0102030405060708090
100
1995 2000 2005 2010proven efficiency % projected
efficiency %
c-silicon solar cells
modules
inverter
%
Solar array
Grid interactive DCto AC inverter
The grid
Load
THE AUSTRALIAN PV INDUSTRY
16 //

THE AUSTRALIAN PHOTOVOLTAIC INDUSTRY ROADMAP 17 //
Figure 3.4 Average irradiation by regionSource: IEA Greenhouse Gas R&D Program, 2003 1
Additionally, Australia also has the highest potential effective surface area perinhabitant in the world outside the USA for use by decentralised PV electricitygeneration (19.9 m2 roof and 5.0 m2 façade).2 This means that Australia has anenormous potential for roof-mounted and façade-integrated PV systems.
History of the PV industry in Australia
Australia has been at the forefront of PV applications over several decades. Australialed the world in the development and application of PV systems for telecommunicationsand remote area power supply in the 1970s and 1980s.
In 1978, Telecom Australia installed one of the world’s first and largest PV-poweredmicrowave repeater stations in central Australia, and established an important PVresearch, development and testing program at its Telecom Research Laboratories, withclose links to the CSIRO battery research and testing facility in Melbourne. In 1979,Tideland Energy was established as the first PV manufacturing plant in the SouthernHemisphere with financial assistance from the NSW government. In 1980 TelecomResearch Laboratories commenced field tests in Australia on crystalline silicon modules.In 1981, Australian National Railways installed a PV-powered signal relay and
communications system, also one of the world’s largest at the time. Other signalling andtelecommunications installations followed.
These developments sparked interest in PV for a range of SPS applications, andAustralia led the world in the development and use of PV in off-grid household,agricultural and industrial applications. Australia was also at the forefront of Solar CarRacing, which aided public awareness of PV technology and stimulated internationalresearch efforts in both PV technology and balance of system components, such asmotors and batteries. The Solar Car Race from Darwin to Adelaide continues withinternational competitors.
During the 1980s, the Solarex Corporation established manufacturing in Sydney, and BPSolar purchased Tideland Energy (which included their manufacturing plant) in 1985.Both companies serviced the telecommunications, export and other off-grid markets.Hybrid power systems, using a combination of diesel or petrol generators and PV and/orwind, emerged. The development of sine-wave inverters saw rapid development of thismarket, especially for off-grid residential power supplies. The first government PVsupport scheme, the NSW Remote Area Power Assistance Scheme (RAPAS) wasdeveloped to allow remote residents to gain 24 hour power supply where grid powerwas not available. This was followed by schemes in other States and by largerinstallations in diesel grids around Australia.
In 1985, BP Solar licensed the ‘Laser Grooved Buried Grid’ technology from theUniversity of New South Wales (UNSW). 1989 saw the establishment of the Centre forPhotovoltaic Devices and Systems at the UNSW.
In the mid 90s the Australian government Energy Research and DevelopmentCorporation (ERDC) formed a consortium to bring DSC (artificial photosynthesis)technology to Australia. Sustainable Technologies International (STI) lead thatconsortium and has since established the world leading DSC development andcommercialisation operation in Queanbeyan. STI continues to cooperate with the SwissFederal Institute EPFL. Investment to date in the Australian operation has been ~$20million, of which 25 per cent has been government support. That investment includedthe establishment of a pilot manufacturing facility, which produced ‘maoduels’ with 95per cent Australian content.
Grid-connected applications followed the development of sine-wave grid interactiveinverters. Project Aurora, one of Australia’s first grid interactive PV systems, wasinstalled at CERES in Melbourne and connected to the Brunswick Electricity SupplyDepartment. The system included 48 PV modules and a 14 kW 3-phase grid interactiveinverter. Energy Australia installed what is still the largest grid connected system inAustralia – the Singleton PV power station at 400 kW. In 2003, Melbourne City Council
0
200
400
600
800
1000
1200
1400
1600
1800
2000
Austra
lia
Middle
East
India
Africa
Latin
America
Rest o
f Asia USA
China
EU-15
FSU/Ea
stern
Europ
e
Average irradiation(kWh/m2)

commissioned Origin Energy and BP Solar to install Australia’s largest roof-top PV array(199 kW) on the roof of the Queen Victoria Market.
In line with the ecologically sustainable development goals of the Sydney 2000Olympics, Pacific Power, with financial assistance from SEDA, commissioned BP Solar toinstall 640 x 1 kW PV systems on houses in the Newington Solar Village (Mirvac LendLease Village Consortium). Several other landmark PV systems were installed on sitesaround the Olympic facilities, including water pumping systems and the iconic OlympicBoulevard lights.
In 2001, BP Solar opened a new manufacturing plant at Sydney Olympic Park, NSW,which replaced its existing two manufacturing plants in NSW. The new plant reached 25MW in capacity by the end of year and was subsequently expanded to 35 MW in 2003.
The Australian National University (ANU) Combined Heat and Power Solar system(CHAPS) was launched in 2002, and a demonstration system installed on Bruce Hall,Canberra, in 2003.
In 2003, Origin Energy announced plans to establish a new plant in South Australia tomanufacture Sliver® Cell technology, which was developed by ANU. This technologyutilises mono-crystalline type PV cells that are developed with an innovativemanufacturing process. Sliver® technology uses 90 per cent less expensive silicon thancurrent conventional PV modules yet aims to deliver commercially competitive cell andmodule efficiencies.
In March 2004, Australia Post released a set of four renewable energy stamps. ItsPhilatelic Department reported unprecedented interest with demand outstrippingpredictions by 75 per cent.
See Appendix 2 for details of milestones in the development of PV in Australia andinternationally.
CASE STUDY: BP SOLAR SYDNEY OLYMPIC PARK PV MANUFACTURING PLANT
In 1998, BP Solar Australia unveiled an initiative to build a new PVmanufacturing plant in Sydney. The new facility, which opened in 2001 andis located in Sydney Olympic Park, was the result of the merger betweenBP Solar and Amoco Solarex and doubled the combined productioncapacity of the two companies’ former facilities. It is one of the largestfacilities of its type in the world. It cost $57 million to construct, providesalmost 300 jobs for Australians, and will ultimately be capable of supplying40 MW of PV cells each year for domestic and international markets.
The creation of the facility involved the upgrading of plant and equipment,innovative architectural design (including building-integrated PV modules)and the incorporation of energy efficient and waste reduction features inthe production process. The facility caters for the production of both mono-crystalline and multi-crystalline PV technologies, using an advanced screenprinted processing system that yields cells with a performance equal to thebest in the world. The plant expects to export up to $100 million worth ofPV products a year by the end of 2004.
�
THE AUSTRALIAN PV INDUSTRY
18 //
Solar lighting at Olympic Stadium, Sydney

THE AUSTRALIAN PHOTOVOLTAIC INDUSTRY ROADMAP 19 //
Value of the Australian PV industry
In 2003, total production of PV cells in Australia rose to 27 MW, and total conventionalmodule production output increased to 10 MW. Full PV cell production capacity was 34MW, with a further 5 MW capacity in concentrator systems. Of the PV cells produced inAustralia, 17 MW (64 per cent) were exported. See Figure 3.5 for Australia’scontribution to world cell and module production. Of the 10 MW of conventional PVmodules produced in Australia, 5 MW (49 per cent) was exported.
Figure 3.5 World PV cell and module production 2003Source: PV News, March 2004
Exports of both cells and modules are expected to increase considerably from 2004onwards as production at BP Solar’s Sydney Olympic Park facility reaches full capacityand again in 2005 when Origin Energy’s new factory is expected to come on line.Imported cells and modules also feature quite significantly in installations in Australia –around 2 MW, accounting for 30 per cent of installed capacity in 2003.
Of the 7 MW of PV product supplied into the Australian market in 2003, approximately 5 MW went into off-grid applications, valued at an average system cost of $20 perWatt. The balance of around 2 MW went into grid-connected systems, valued at asystem average cost of $10 per Watt. The local market is therefore worth approximately$95 million, not including exceptional installation costs.
The exported 17 MW of cells and 15 MW of modules added an export value ofapproximately $106 million. The export figure should be treated with caution as to
Australia’s export success. Whilst BP Solar and others enjoy export success, asignificant proportion is inter-company/market transfer by BP Solar, which could just aseasily be sourced by alternative or new plants located in countries with more vibrantdomestic markets and or export support.
The overall net value of PV manufacture and sales in Australia in 2003 was thereforeestimated to be around $201 million. However, all silicon wafers (the raw material forsilicon PV cells) were imported, which reduces the net value of the product to Australiaby approximately $14 million. The $187 million net value does not include:
� Extraordinary installation costs in remote areas or for special Building Integrated PV(BIPV) systems.
� On-going operation and maintenance (O&M) costs. Based on the installed PVcapacity in Australia of 46 MW at the end of 2003, these costs could add a further$16 million to industry value, if off-grid system O&M costs are 2 per cent and grid-connected system costs are 1 per cent per annum of PV system value at current costs.
� Exports of enabling technology (‘balance of system’) components, includinginverters, batteries and controllers. Inverter prices range from about $1.00 to$2.20/kVA. Manufacturers of batteries and other enabling technology componentsalso export their products, although on a relatively small scale.
� Exports of intellectual property/license fees.
In addition, costs for R&D undertaken by universities and industry amounted to morethan $33 million in 2002.
Table 3.1 provides a breakdown of non-export PV sales in Australia in 2003, whichtotalled approximately $95 million for over 3,200 installations.
Table 3.1 Non-export Sales of PV in Australia in 2003Source: Watt, Muriel 3
Annual sales Capacity of ($ million) installations (kW)
Off-grid domestic applications 29.0 1,450
Off-grid non-domestic applications 49.8 3,320
Grid-connected distributed applications 12.3 1,230
Grid-connected centralised electricity generation 4.0 500
Total 95.1 6,500
0
50
100
150
200
250
300
350
400
Japan Europe US Australia ROW
MW
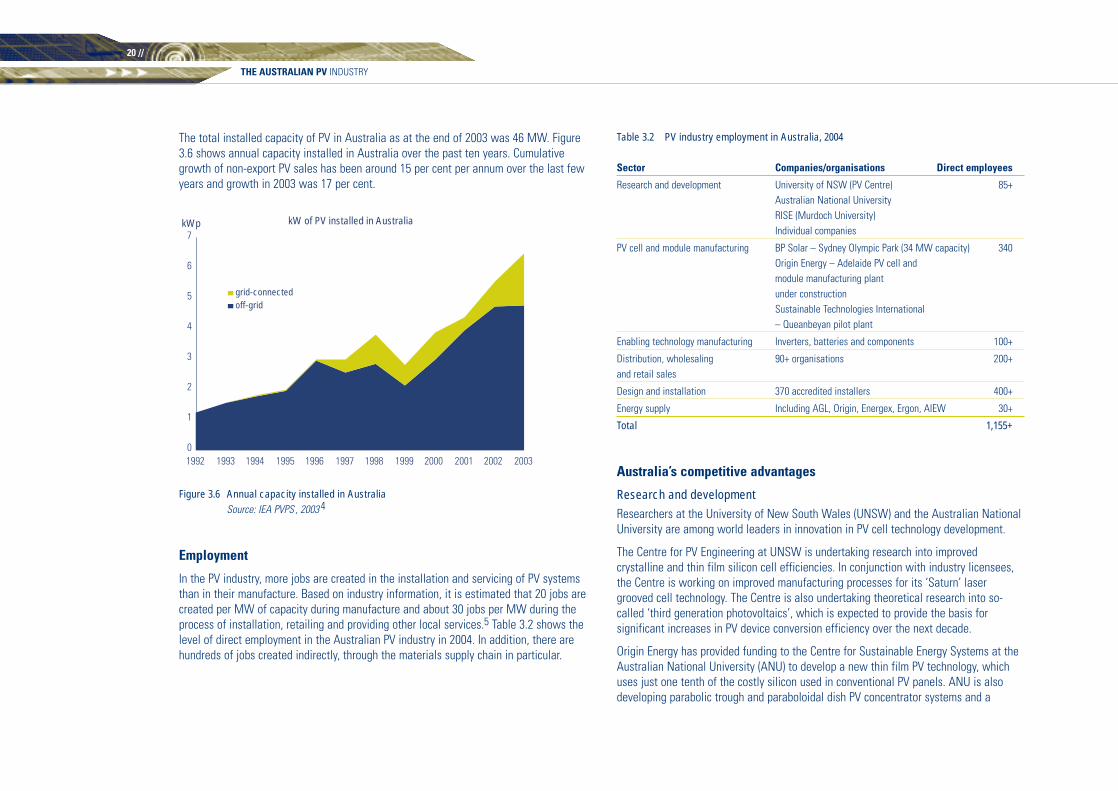
The total installed capacity of PV in Australia as at the end of 2003 was 46 MW. Figure3.6 shows annual capacity installed in Australia over the past ten years. Cumulativegrowth of non-export PV sales has been around 15 per cent per annum over the last fewyears and growth in 2003 was 17 per cent.
Figure 3.6 Annual capacity installed in AustraliaSource: IEA PVPS , 2003 4
Employment
In the PV industry, more jobs are created in the installation and servicing of PV systemsthan in their manufacture. Based on industry information, it is estimated that 20 jobs arecreated per MW of capacity during manufacture and about 30 jobs per MW during theprocess of installation, retailing and providing other local services.5 Table 3.2 shows thelevel of direct employment in the Australian PV industry in 2004. In addition, there arehundreds of jobs created indirectly, through the materials supply chain in particular.
Table 3.2 PV industry employment in Australia, 2004
Sector Companies/organisations Direct employees
Research and development University of NSW (PV Centre) 85+Australian National UniversityRISE (Murdoch University)Individual companies
PV cell and module manufacturing BP Solar – Sydney Olympic Park (34 MW capacity) 340Origin Energy – Adelaide PV cell and module manufacturing plant under constructionSustainable Technologies International – Queanbeyan pilot plant
Enabling technology manufacturing Inverters, batteries and components 100+
Distribution, wholesaling 90+ organisations 200+and retail sales
Design and installation 370 accredited installers 400+
Energy supply Including AGL, Origin, Energex, Ergon, AIEW 30+
Total 1,155+
Australia’s competitive advantages
Research and developmentResearchers at the University of New South Wales (UNSW) and the Australian NationalUniversity are among world leaders in innovation in PV cell technology development.
The Centre for PV Engineering at UNSW is undertaking research into improvedcrystalline and thin film silicon cell efficiencies. In conjunction with industry licensees,the Centre is working on improved manufacturing processes for its ‘Saturn’ lasergrooved cell technology. The Centre is also undertaking theoretical research into so-called ‘third generation photovoltaics’, which is expected to provide the basis forsignificant increases in PV device conversion efficiency over the next decade.
Origin Energy has provided funding to the Centre for Sustainable Energy Systems at theAustralian National University (ANU) to develop a new thin film PV technology, whichuses just one tenth of the costly silicon used in conventional PV panels. ANU is alsodeveloping parabolic trough and paraboloidal dish PV concentrator systems and a
kW of PV installed in Australia
0
1
2
3
4
5
6
7
1992 1993 1994 1995 1996 1997 1998 1999 2000 2001 2002 2003
kWp
grid-connectedoff-grid
THE AUSTRALIAN PV INDUSTRY
20 //

THE AUSTRALIAN PHOTOVOLTAIC INDUSTRY ROADMAP 21 //
combined heat and power solar system (CHAPS) that integrates PV electricity generationand solar hot water production using 25 times concentrating troughs.
STI has over 30 patents for DSC technology and products and also operates a pilot lineand is continuing to develop its titania dye solar cell (DSC) technology.
Murdoch University is developing methods of producing low cost silicon from a numberof new sources for both wafer-based and thin film silicon PV cells. The process willprovide options for the PV industry if the price of conventional silicon wafers increases.
Solar Systems is manufacturing and continuing development of its CS500 PV trackingconcentrator dishes. System efficiencies of 20 per cent have been achieved. Thesystems are currently based on silicon cells, but work is continuing on development ofnon-silicon devices, which are expected to achieve 40 per cent efficiency. Solar Systemsis also investing in research to develop new storage technologies for mini-grid systems.
Manufacturing
Cell and module manufacture
Over the past four years, BP Solar’s PV cell and module manufacturing facilities havegrown over three-fold. In 1999, the facilities were capable of producing about 10 MW ofPV product per annum, whereas in 2003 the combined cell and module productioncapacity was 34 MW per annum. The current BP Solar plant at Sydney Olympic Park,Sydney utilises high volume world class manufacturing methodology including highperformance screen-printed processing to produce both mono- and multi-crystalline cellsand modules. BP Solar is currently evaluating a further expansion of production capacityto 40 MW per annum which will be dependent on local market conditions.
In late 2003, Origin Energy announced the investment of $35 million in a PV cell andmodule manufacturing facility in Adelaide using Sliver® cell technology developed atANU. The plant is expected to being production in early 2005 at the 5 MW/year capacity plant.
STI has been manufacturing and selling DSC cells and modules components in smallquantities since 2002. The company has plans to establish volume manufacturing and toincrease the range of DSC products from BIPV façade panels to include micropowermodules and standard panels, but is having difficulties in raising the necessary venturecapital and state government support.
Balance of System technology manufacturing
(BOS) components support the generation of a PV system. They include inverters,batteries, regulators, control equipment and mounting systems.
Australian companies originally developed inverters for the off-grid market,manufacturing quality products suitable for both the Australian and most internationalmarkets. In 2004, products cover both grid-connected and off-grid markets and range insize from less than 1 KVA to over 100 KVA. Advanced Energy Systems, Selectronics,Power Solutions Australia, Latronics and Solar Energy Australia are all involved in themanufacture and development of inverters in Australia. Advanced Energy Systems andPower Solutions Australia also manufacture very advanced generator interactiveinverters. With the exception of Selectronics (which partly owns Power SystemsAustralia), all manufacture grid-interactive inverters.
Melbourne-based company, Plasmatronics, designs, develops and manufactures innovativeelectronic regulating and metering devices for off-grid PV power systems that are utilisedin Australia and exported globally. Australian Energy Research Laboratories (AERL) inQueensland and Advanced Energy Systems design, develop and manufacture maximumpower point trackers (MPPT) controllers that act to optimise the PV power system.
BP Solar also produces system controllers which range from small power systems tosophisticated PV diesel hybrid controllers with remote control and data-logging andalarm facilities for the high-end telecommunications sector.
Innovations for marketsThe Australian PV industry has historically shown strength in industrial innovation,providing solutions for different market requirements. This includes early innovations tosuit the power requirements for Australia’s vast telecommunications network. This ledon to providing reliable solutions for remote households and communities, transportsystems such as rail, navigation aids for waterways, and remote monitoring systems forwater, air and traffic.
More recently, innovation has been increasing for grid-connected markets, in particularwith the use of PV as a building material. For example, PV has been included in a façadeon a building at Melbourne University, as transparent eaves on a Brisbane high rise, anddye-sensitised PV has formed part of an atrium roof for the CSIRO’s new building in Newcastle.
Further developments have been made on the use of PV integrated into roof-tiles.Products have also been developed to optimise airflows and temperature differentialsunder the tiles, and to use this heat within the building.
Innovation for remote power continues. In particular, Solar Systems provide solutions forreliable and efficient remote community power use with large PV parabolic dishes.Power and Water Corporation, Advanced Energy Systems and Telstra NDC provideoptimised solar and diesel hybrid systems on small grids as power stations for remotecommunities.

System developmentTo service the Australian off-grid market, the PV industry has developed very reliabledistribution and installation networks. In addition to meeting customers’ expectations,reliability is also driven by the high-cost travelling to remote systems for maintenanceand repair.
Investments in manufacturing facilities, including investments via government supportprograms, has lead to the development of more reliable components and products thatcan be monitored remotely and are easy to repair on-site. These products must besuitable for hot deserts, colder regions of southern Australia and extremely humidconditions of the tropical north. The robust nature of both systems and installationmethodologies gives Australian systems competitive advantage when installed indeveloping countries in particular, where climates can be harsh and application sitesdifficult to access.
PV designers and installers have developed into competent suppliers of systems, fromsmall systems or weekenders to larger hybrid systems that are used in householdsystems and for remote communities. Grid-connect system design (including systempackages and system configuration options) are becoming increasingly cost competitiveand high quality, as well as meeting customers’ various requirements. Grid-connectsystem design includes homes as well has community and commercial buildings.
There are over 350 small to medium sized businesses that typically employ 1–15 peoplein the design and/or installation of PV systems. These operate primarily in the off-gridmarket at present, but an increasing number are entering the grid-connect market. Themajority of these are located outside the larger urban areas.
Delivery to customersAustralian has a unique and efficient supply chain that has developed since the 1970s.PV modules and BOS equipment are generally sold by distributors and wholesalers tosmaller retail outlets and individual system designers and installers (this includessystem integrators who are typically project-focussed), though some PV BOSmanufacturers sell directly to retail outlets and installers.
BP Solar has approximately 12 major distributors with at least one located in each state.These tend to be relatively larger companies for the industry (5–20 employees) who thenon-sell modules to smaller retail installer businesses. With the exception of onecompany, RF Industries, all distributors retail direct to end-use customers in addition tosupplying to the smaller retailers and installers on a wholesale basis. Kyocera has
established its own Australian sales operation for PV modules which sells to retailersand installers, while Sharp and Sanyo sell to retailers/installers from their parentcompanies’ Australian operations. Shell, Unisolar, Helios, Kaneka, and some Indianmodule manufacturers have distributors of their equipment within Australia.
Retail sales of PV systems to end-users are undertaken by wholesalers, retail shops(which typically include design and installation staff) and directly by designers andinstallers. It is estimated that there are over 90 wholesale and retail outlets for PVsystems throughout Australia. While there are over 370 accredited PV system designersand installers within Australia, not all have formal retail outlets. Some operate fromtheir own homes, conducting retail sales directly with the end-user in their homes.Designers and installers have developed businesses that can design, supply, install andmaintain systems throughout Australia.
Many PV system wholesalers and retailers commenced operation as suppliers of off-gridsystems and have branched into grid-connected systems since 2000. Those in thecapital and larger cities are more active in grid-connected systems than those in therural areas, some of which continue as wholly off-grid power or water pumpingspecialists.
In the 1990s a number of electricity distributors, for example Integral Energy, EnergyAustralia, Energex and Ergon, were actively involved in retailing and installing PVsystems in the off-grid market. Today Ergon is still actively involved in this market, andWestern Power and Power and Water Corporation are installing and planning theadditional installation of PV systems to supplement diesel mini-grids in remote areas.Origin Energy is also retailing and installing in the grid-connect market; this includesturn-key projects.
Figure 3.7 shows a diagram of the supply chain in Australia.
Figure 3.7 Australian supply chain
Typically supplylarger off-gridcustomers andgrid connectmarket
Cells ModulesLarger systemintegrators
Distributorsand
wholesalers
Smallersystem
integrators
Balance of System(inverters, batteries,regulators, frames,trackers)
Route to marketSystem components
Typically supplysmaller off-gridcustomers and distributed gridconnect.
Customers
THE AUSTRALIAN PV INDUSTRY
22 //

THE AUSTRALIAN PHOTOVOLTAIC INDUSTRY ROADMAP 23 //
CASE STUDY: AUSTRALIAN PV CONTRACTOR, IVAN DENOSOVITCH, EXPLAINS SYSTEM DELIVERY
Australian PV contractor, Ivan Denosovitch, explains system delivery inrural areas.
The average turnaround time to deliver a PV stand-alone power system(SPS) system is 6 months from the initial quotation to the final placing ofan order and installation.
Once a client has decided to go ahead, we the contractors complete all thenecessary paperwork for the various rebate schemes that are available.This can take 1-2 months to progress through the system.
Once the rebates have been approved, the commercial part is taken care ofwith a 35 per cent deposit. 35 per cent progress payment and delivery ofequipment to site, with a final 30 per cent payment on completion.
A hybrid system installation comprising of a 5 kW array, 10 kW inverter,battery bank and a diesel generator would typically require:
� 3 days preparation of equipment and packing of the truck
� 1–2 days driving to site
� on site > 1 week
� return to base 1–2 days
� _ day to clean and restore truck & equipment
Fifty per cent of installations require a second visit in the first 6 months,with 100 per cent requiring a subsequent visit in 2 years, to undertakeroutine maintenance and check system optimisation.
Generally there is a 12 month warranty on the installation, with any callouts within this period being free of charge. A proportion of these call outsare generally done by plane in remote areas, as there is generally noequipment transfer required.
�
Off-grid solar home

Education and training
It is important that adequate and appropriate training, from trade to professional levelsis readily available, to ensure that appropriate skills are available to develop asustainable PV industry. Over the last 10 years, appropriate renewable energy trainingmodules have been developed and implemented to education institutions. Table 3.3provides details on PV education at universities and TAFEs around Australia. Resourcematerials have also been developed by a number of organisations, such as the ACRE-produced suite of Resource Books and Learning Guides to support training and lift thestandard and consistency. This was a very significant project and achieved a world classresource for the renewable energy industry.
Table 3.3 PV Education in Australia, 2004
Sector InstitutesTAFE TAFE (Trade level) qualifications:
� Advanced Diploma of Renewable Energy or� Certificate IV & Diploma in Electrotechnology – Renewable Energy
QLDBrisbane North Institute of TAFECooloola – Sunshine TAFECairns TAFE
VICTORIASwinburne Institute of TAFEChisholm TAFENorthern Metropolitan Institute of TAFEGordon TAFE
NTCentralian TAFESwan TAFE
NSWUltimo TAFEMuswellbrook TAFEGranville College of TAFE
WACentral TAFE
SARegency TAFE Spencer TAFE
University University of NSW, Sydney: Bachelor of Engineering in Photovoltaics and Solar Energy
Murdoch University, Perth: A range of graduate and post graduate energystudies programs, both on campus and via distance education
Charles Darwin University, Darwin: offers a Bachelor of Electrical andElectronic Engineering Degree which contains some renewable energy units
Australian National University, Canberra: Home to the Centre for Sustainable Energy Systems. Offers two degree courses – Bachelor of Engineering (Sustainable Energy) and Bachelor of Sustainable Engineering (Environmental Systems).
University of Melbourne: Masters in Environment which includes modules on renewable energy
RMIT University, Melbourne: Masters in Sustainable Energy(to begin semester 1, 2005)
THE AUSTRALIAN PV INDUSTRY
24 //
Installing a PV tiled roof

THE AUSTRALIAN PHOTOVOLTAIC INDUSTRY ROADMAP 25 //
Standards and accreditationA number of relevant Australian Standards and industry guidelines are in place andmore are under development. Standards are necessary for system performance, qualityand installation, a high level of safety, market acceptance, and confidence.
Renewable energy standards (AS4086 and AS4509) have been developed andimplemented. A PV array standard and an inverter standard for SPS are underdevelopment and are expected to be finalised by 2005. A standard contract formbetween the installer and the system owner for off-grid systems has been developedwith the industry by the BCSE.
Similarly, installer Accreditation provides a means of ensuring that designers/installerpractitioners have a minimum level of competence in the design and installation ofrenewable energy systems. The Accreditation scheme works to improve customerconfidence, safety standards, system performance and also establishes a network ofdesigners/installers of systems across the country.
Since the Accreditation scheme’s commencement in 1993, 439 individuals have obtainedaccreditation in total and over 370 individuals are currently accredited. The Accreditationprogram is administered by the BCSE, and is overseen by an independent committee ofPV experts. All training is currently undertaken in the TAFE courses outlined above.
The Accreditation system also gives support to the various government grant andsubsidy programs for PV available over the last ten years. The majority of theseschemes require PV systems to be designed and installed by a BCSE-accredited person.
The Accreditation scheme continues to be developed by the BCSE. A particular focus is further development of a dispute resolution process between installers andcustomers, and OH&S issues.
A number of PV organisations work with the Australian Standards Organisation (ASO) todevelop Standards for equipment and installation. For instance, the Research Institutefor Sustainable Energy (RISE) works closely with Australian and International bodies inthe development of standards for stand-alone PV systems and components. They alsoare able to test equipment to those Standards, and input into the development of newAustralian.
Investment by the Australian PV industryThe Australian PV Industry has invested significant financial resources and dedication tobuild the PV market to its present internationally-recognised level of achievement. Overthe last six years alone, the Australian industry has invested the following efforts:
� More than $150 million in R&D, much of it in the past three years – the majority ofwhich is for market innovation, followed by technology and social research.
� Investment in additional manufacturing facilities for PV modules and systemcomponents.
� Creation of new jobs across the industry, particularly in regional areas and inmanufacturing.
� Development of export markets in technology and services by meeting the needs ofinternational development activities.
� Continued improvement and development of training and Accreditation.
� Developing Australian Standards.
� Development and expansion of distribution and marketing channels.
� Development and expansion of education facilities.
� Educating customers and governments about the benefits of PV.
� Promotion and demonstration of the benefits of PV through programs and activitiessuch as Solar House Day.
� Participation in international collaborative programs such as the InternationalEnergy Agency PV Power Systems program.
� Participating in international trade missions.
� Supporting the BCSE as the PV industry association to build industry capacity andcapability.
� Dedicating considerable time and effort to the development of an industrydevelopment vision and strategy, through activities such as the development of thisRoadmap, consultations with government officials at federal, state and local levels,and ongoing consultations through various BCSE fora.

4// THE PV MARKET
Global PV market
Globally, PV is a rapidly expanding, high-tech, future-focused industry presently worth inthe order of $4 to $5 billion per annum in terms of final annual sales revenue.Expectations are that it will grow to $15 billion per annum by 2010 and in the order of$1.5 to $2 trillion by 2030.
Currently between 50 and 65 per cent of the PV market value, which includes muchresearch and development and intellectual property value, is ‘locked’ within the PVmodules. The remainder of the market value comes from the BOS components, such aspower conditioning equipment, batteries (mainly for off-grid systems), cables andfittings, and from non-component services, such as design, installation, maintenanceand provision of consultancy services.
PV is one of the fastest growing industries in the world, growing on an annual basis atan average of 33 per cent globally over the last five years (see Figure 4.1). The marketfor grid-connected PV has grown at 65 per cent per annum, and the market for off-gridPV has grown at 18 per cent over the last five years. Whilst it is difficult to predict howthe PV industry will grow into the future, industry experts believe that annual growthrates in the range of 15 per cent to 30 per cent are likely to be achieved over the periodto 2010.1
Annual market growth rates used by the PV industry usually refer to the growth in termsof the cumulative market to date (total systems installed or produced) as this tends tobe a less erratic indicator than variation in sales from one year to the next. This isparticularly the case when markets are analysed by application sector as for anemerging industry one or two large projects can have a significant impact on growthfrom one year to the next.
Figure 4.1 Growth in the global PV marketSource: Renewable Energy World, 2003
PV industry support programs in several developed countries are likely to sustain a highglobal growth rate. These programs have ambitious targets for installed PV capacity intheir respective countries, for instance: Japan – 4820 MW by 2010; Germany – 2000MW by 2010; and the USA – 3000 MW by 2010. This is also reflected in the location ofmanufacturing facilities around the world, the majority of which are in Germany andJapan. Figure 4.2 shows the leading manufacturers as of March 2004, the majority ofwhom are located in either Japan or Germany.
0
50
100
150
200
250
300
350
400
450
525MWp
1994 1995 1996 1997 1998 1999 2000 2001 2002
Off-grid/other
Grid-connect
26 //

THE AUSTRALIAN PHOTOVOLTAIC INDUSTRY ROADMAP 27 //
Figure 4.2 Leading PV cell/module producers in 2003 Source PV News, March 2004
By the end of 2002, a cumulative total of about 1,330 MW of PV electricity capacity hadbeen installed in the 20 IEA PVPS member countries.2 IEA PVPS countries haveaccounted for more than 90 per cent of global PV production. However, it is interestingto note that Japan installed more capacity in 2002 than the remaining countriescombined and that three countries accounted for 85 per cent of the total installedcapacity and more than 92 per cent of new capacity.
The annual rate of growth of PV installed in the IEA PVPS countries has varied between20 per cent in 1994 and 40 per cent in 2000. However, the rate of growth between 2001and 2002 (34 per cent) was similar to the rate of growth between 2000 and 2001 (36 percent). As in previous years, the majority of the growth in 2002 was in Japan andGermany, with these two countries alone accounting for 79 per cent of reported capacityinstalled during the year and driving the doubling of market size that has occurred alittle more than every two years in the IEA PVPS countries in recent years. While theproportion of grid-connected PV capacity now makes up about three-quarters of the total(mainly due to large scale, government or utility supported programs) in Japan, Germanyand the USA off-grid applications still account for more total installed capacity and newcapacity installed in the majority of the 20 reporting countries.
Annual module production in IEA PVPS countries rose by over 50 per cent in 2002, to482 MW. Module production capacity increased by almost 49 per cent in 2002 to acapacity of 792 MW. Currently 47 per cent of cell production and 54 per cent of moduleproduction in the reporting countries occur in Japan. The vast majority of modulesproduced continue to be based on crystalline silicon material. A number of othertechnology types are in production but at a much smaller scale.
Regional drivers for international growthAs outlined in Chapter 2, many countries recognise the benefits of PV and are investingin supporting the technology to ensure that they will play an active role in futuredevelopments. Support internationally for PV is principally driven by the requirement toreduce greenhouse gas emissions, to create new sustainable employment andinvestment and to maintain or achieve energy supply security. In addition, there areadditional region-specific drivers that facilitate growth of the global PV industry.
In several key developed economies – notably Japan and in parts of the United States,including California – electricity from PV is moving towards being competitive with retailelectricity prices after the inclusion of modest subsidies to internalise environmentalbenefits.
Japan’s retail electricity price for residential customers is some three times that of the Australian average (38.5c/kWh), while Germany’s retail price is typically double. In parts of California the electricity tariffs are up to three times higher than our own.With the current level of target industry development work, PV electricity is likely tobecome cost-competitive with grid-supplied electricity in Japan and California withinthe next five years.3
The developing world is expected to dominate future growth in demand for energyservices. PV is already cost-competitive in some applications, particularly off-grid, andfrequently offers the lowest energy service cost on a life-cycle basis than other supplyoptions, such as conventional power networks. PV offers developing countries anappropriate means of delivering reliable energy services to rural populations. For thistype of application, energy services can meet requirements for portable water, healthcare and a range of lighting and house-hold power. The potential demand for PV inAfrica, Asia and Latin America is estimated at 19 GW4; this is some seven times morethan the current worldwide installed capacity.
Over the past decade, global PV module prices, which account for about half of the priceof a PV system, have consistently decreased at the rate of approximately 18 per centwith each doubling of cumulative production experience (82 per cent cost to progressratio). At current market growth rates this equates to annual cost reductions of around 6 per cent. The rate of progress is expected to continue for at least the next 10 years.
0
50
100
150
200
250
Sharp ShellSolar
Kyocera BP Solar RWE(ASE)
Mitsubishi Isofoton Sanyo
MW
26.7%
10.4% 9.7% 9.5%5.7% 4.7%4.7%5.4%
Market share

Current international targets for PV foresee a fourfold increase from the currentworldwide installed power of almost 3 GW to at least 11 GW by 2010. PV module priceswill therefore fall by at least a third over the next seven to eight years, which will bereflected by similar reductions in the cost of PV electricity.
Market development activities for renewables
Current international market development activities impacting on renewable energyinclude the following5:
� Internationally coordinated greenhouse gas reduction polices and clean air policies.The Kyoto Protocol and associated measures, for example, the Clean DevelopmentMechanism give financial incentives for the implementation of renewable energyprojects, particularly in developing countries.
� Bilateral arrangements, such as the renewable agreement under the Australia-USAClimate Action Partnership, provide opportunities for driving renewable markets andexports.
� Specific programs for the implementation of renewables in developing countries,particularly through development aid initiatives. Their implementation requirespolicy initiatives by developing and developed country governments plus multi-lateral and bi-lateral donors. The World Bank recently committed to increase itsinvestment in renewables within its energy portfolio by 20 per cent annually (thecurrent level is four per cent).
� The introduction of competitive energy markets that allow consumers to choose‘green power’.
In line with these drivers for renewables, governments in both developed anddeveloping countries are initiating policies and programs that directly stimulate theinstallation of PV and therefore the growth in the PV industry.
Figure 4.3 spans the period of 1992 to 2008. Data for the period of 2002 and earlier are‘historical’, whereas data for years beyond 2002 are ‘best projections’. The graph showscontinued progress toward meeting the Project goals of decreasing direct manufacturingcosts and increasing production capacity.
CASE STUDY: PV MANUFACTURING R&D PROGRAM IN THE USA
The PV Manufacturing R&D Program in the USA (formerly known as PVMaT) is aR&D partnership between the US Department of Energy (DOE) and the US PVindustry. These partnerships date back to 1990, when the project was started. Theprogram is designed to help US industry improve PV manufacturing processes andequipment; accelerate manufacturing cost reductions for PV modules, balance-of-systems components, and integrated systems; increase commercial productperformance and reliability; and enhance the investment opportunities forsubstantially scaling up US manufacturing capacity and increasing US market share.
Industry participants are selected through competitive procurements. This projecthas helped the USA’s PV industry accomplish several goals since its inception:� Improve module manufacturing processes and equipment. � Accelerate manufacturing cost reductions for PV modules, balance-of-systems
components, and integrated systems.� Increase commercial product performance and reliability. � Enhance the investment opportunities for the substantial scale-up of US-
based PV manufacturing plant capacities.
Figure 4.3 shows the 2002 data of 15 PV Manufacturing R&D module manufacturingpartners who had active manufacturing lines in 2002. (A ‘partner,’ in this context,refers to a subcontractor with a specific technology. The 15 partners represent 11companies.) The graph shows continued progress toward meeting the Project goalsof decreasing direct manufacturing costs and increasing production capacity.
Figure 4.3 PV manufacturing R&D cost/capacity Source: NREL, 2004 6
2002 Data15 PV Manufacturing R&D participants with active manufacturing lines in 2002
Direct module manufacturing cost only (2002 Dollars)
19921993
199419951996
19971998
1999
2000
20012002
20032004
20052006
20072008
0
1
2
3
4
5
6
100 200 300 400 500 600 700 800
Total PV manufacturing capacity (MW/yr)
‘Average’ module manufacturing cost ($/Wp)
�
THE PV MARKET
28 //

THE AUSTRALIAN PHOTOVOLTAIC INDUSTRY ROADMAP 29 //
Financing support schemes
Market growth is currently facilitated globally by financial arrangements that enableaffordable access to PV.
Particularly successful schemes in developed countries to provide financial assistancefor the purchase of PV systems have been as follows:
� Subsidies or rebates that reduce up-front price of the system.
� Guarantees for high purchase price for the energy that recognise network benefits.
� Low interest loans when buying the system.
� Personal and corporate income tax credits.
� Property tax credits.
� Sales tax exemptions.
� Competitive grants, often targeted to specific markets.
Some countries also offer incentives to encourage the establishment of newmanufacturing plants. These are generally been in the form of tax credits.
Appendix 6 summarises the financial incentives currently in operation in the USA, whilstChapter 7 includes case studies on the drivers in the Japanese and German markets.
Appropriate financing mechanisms are being recognised as one of the key drivers for thedeployment of renewable energy systems in developing countries as well. These areutilised by multilateral organisations, for example the World Bank, the United NationsDevelopment Program (UNDP), the United Nations Environment Program (UNEP), bilateralorganisations, national governments and non-government organisations. The financialprograms that encourage the installation of PV systems include:
� Soft loans – often in the form of micro-credit which allow the owner to pay for thesystem over a number of years.
� Revolving funds.
� Direct subsidies to reduce the upfront capital costs.
Multilateral and bilateral agencies are financing and implementing programs in manycountries. These focus on the implementation of solar home systems. Other financialinitiatives are implemented to more broadly encourage the development of PV. Thisincludes initiatives for market transformation, to support the development andexpansion of local renewable businesses.
The Australian PV market
The market for PV in Australia has been increasing at an average rate of 15 per centover the past three years across all sectors. Growth in 2003 was 17 per cent. Incomparison, global growth rates are currently 33 per cent per annum (as discussedpreviously) and long-term OECD trends show an average growth of 28 per cent. Whilethe marked growth in Japanese (45 per cent) and German (59 per cent) markets over the
CASE STUDY: THE EUROPEAN UNION
The EU has a strategy to double renewable energy market share from the present 6 per cent to 12 per cent by 2010. Within its 6th Research Framework Programmethe EU will devote € 810 million to renewable energy sources. During 2004 newtargets to increase market share to 20 per cent by 2020 have been accepted inprincipal7. The effect of this will be to increase PV supply from 0.02 to 0.2 per centof energy supply.
Meeting the new 20 per cent by 2020 targets have equally important benefits, suchas avoided fuel costs of more than € 100 billion, CO2 reductions of over 700Mt/year(some 17 per cent of 1990 emissions), saved external costs of up to € 300 billionand extra employment of 2 million people.
However, the EU is aware that certain issues still need to be tackled in order toachieve a substantial increase in the share of renewables. These include:
� Setting targets for growth.
� Stable policy framework for security of investment.
� Creating a level energy playing field.
� Tackling administrative and grid barriers through the strict enforcement ofregulatory frameworks.
� Creating frameworks for accelerating the growth of market for renewableheating and cooling.
� Expanding the financial support for research and development (R&D).8
The growth in PV module sales in Europe is principally as a result of the 100,000Roofs Program and the Renewable Energy Law, both of which created a largedemand in Germany. Over 80 per cent of the PV module sales in Europe in 2002were into Germany. Figure 4.4 shows the total annual MW of PV installed in the 13 European countries.
�

last three years have an impact on the global data, Australian growth in PV lags behindthat of Austria (35 per cent), Canada (20 per cent), France (24 per cent), Korea (16 percent), the Netherlands (46 per cent), Portugal (26 per cent), UK (55 per cent) and theUSA (22 per cent)9.
With strengths in PV technology innovation, and robust product design and construction,Australia has the potential to capture between 7 per cent and 15 per cent of the globalPV market.
Market segments
Over the past ten years, the total PV capacity installed in Australia has grown over five-fold from 9 MW to 46 MW in 2003 (see Figure 4.6). Currently, there are six main marketsectors for photovoltaic technology in Australia as listed below. Table 4.3 shows thebreakdown of data for the total installed PV capacity in Australia for the first fourmarket sectors.
i. Off-grid domestic applications.
ii. Off-grid non-domestic applications.
iii. Grid-connected distributed applications.
iv. Grid-connected centralised electricity generation.
v. Mini-grid systems.
vi. PV cells in small portable electronic devices.
In addition, there is a market for intellectual property across the range of sectors.
CASE STUDY: THE EUROPEAN UNION CONTINUED
Figure 4.4 Annual PV installed (MW) in 13 European countriesSources: IEA PVPS, 2003 and EurObserv’ER, Photovoltaic Energy. Barometer April, 2003
Figure 4.5 Breakdown of cumulative PV installed in 4 different markets for 13 European countries, 2002Source: IEA PVPS, 2003
0
50
100
150
200
250
300
German
y
Netherl
ands
Italy
Switzerla
ndFra
nce Spain
Austria UK
MW
off-grid
grid connected
0
20
40
60
80
100
120
1994 1995 1996 1997 1998 1999 2000 2001 2002
MWSweden
Portugal
Norway
Finland
Denmark
Austria
UK
Spain
France
Switzerland
Italy
Netherlands
Germany
�
THE PV MARKET
30 //

THE AUSTRALIAN PHOTOVOLTAIC INDUSTRY ROADMAP 31 //
Figure 4.6 Installed capacity 1993 – 2003 in AustraliaSource: Watt, Muriel, 2004
Table 4.3 Total installed PV capacity in Australia, December 2003
Market Sector Capacity (MW)
Off-grid domestic applications 13.6
Off-grid non-domestic applications 26.1
Grid-connected distributed applications 4.6
Grid-connected centralised electricity generation 1.4
Total 45.6
Source: Watt, Muriel, 2004
Off-grid systems
Australia has developed world-leading expertise in PV for off-grid power supply.Australia manufactures some of the most robust and reliable components for off-gridapplications, particularly inverters and batteries for harsh conditions. These productsand services that are highly appropriate to export, particularly to our regional neighbourswho have large populations remote from electricity networks.
Off-grid power requirements still represent an essential market for the PV industry inAustralia and PV can compete economically with conventional off-grid SPV power supplysolutions. However, domestic market volume, which is estimated to be between 15 and20 MW per annum, is not sufficient to sustain local manufacture of PV components and systems.
Table 4.4 shows an analysis of diesel generation by application. The table quantifies thecurrent potential market for off-grid PV. It is estimated that currently in the order of 600to 700 million litres of diesel is used for power generation in remote communities (thisaccounts for an increase from the 1999 figures below).10
Table 4.4 Analysis of diesel generation by application
Sector Generation capacity Diesel consumed(MW) (ML/a)
Indigenous 19 13.6
Pastoral 44 20.0
Households 62 12.0
Tourist 15 13.1
Public generation 195 123.4
Mining 330 384.4
Total 665 566.5
Domestic applications
Approximately 13,000 homes throughout Australia have off-grid PV installations. Theremaining off-grid domestic market for PV in Australia is small, estimated at between20,000 and 30,000 homes and other buildings not connected to the main electricitygrids. The installed capacity for off-grid domestic applications was about 13.6 MW as atDecember 2003.
kW of PV installed in Australia
0
5000
10000
15000
20000
25000
30000
35000
40000
45000
50000
1992 1993 1994 1995 1996 1997 1998 1999 2000 2001 2002 2003
kWp
grid-connected centralizedgrid-connected distributedoff-grid non-domesticoff-grid domestic

A typical new off-grid PV system has a capacity of 1.5 kWp, compared with systemsinstalled in the 1980s and early 1990s which were typically less than 1 kW. Typicalcosts for a 1 kWp system are about $20,000, including the cost of battery storage,inverter, back-up generator and other control equipment. The per kW cost of largersystems is lower, but depends on the mix of PV, generator and battery storage chosen.Such hybrid energy systems may also include a kW-sized wind generator.
Prior to the commencement of the Government’s Photovoltaic Rebate Program in 2000,the majority of sales were off-grid PV systems installed in regional areas and supportedby state-based incentive schemes.
A potentially large market for PV electricity as an alternative or supplement to grid-supplied electricity is for residential dwellings in fringe-of-grid locations. Thisopportunity is dependent upon electricity industry responses to rising network costs. Ifthe electricity industry accepts PV as a cost-effective solution to network augmentationin fringe-of-grid areas, a market of 5 to 10 MW per annum could exist between 2015and 2030. Additionally, a stable demand of 1 to 2 MW per annum for repowering orextending existing off-grid domestic properties (mostly isolated farms) is predicted.
Non-domestic applications
Off-grid non-domestic applications include telecommunications, pipeline cathodicprotection, water pumping, remote PV power stations (sometimes with local mini-grids),road signage, monitoring systems, electric fences, and navigational aids. About 26 MWof off-grid non-domestic PV applications was installed at December 2003. Theseapplications currently comprise 57 per cent of total installed PV capacity in Australia.The long-term stable demand for off-grid non-domestic applications is estimated to bein the order of 5 to 10 MW per annum for water pumping and 2 to 3 MW per annum forother off-grid non-domestic applications.
The off-grid non-domestic sector has been dominated by telecommunicationsapplications. During the 1980s and early 1990s, Telstra (then Telecom Australia) was thebiggest customer for PV modules with massive infrastructure development acrossAustralia using PV. With the introduction of other telecommunication companies inrecent years, further infrastructure development has occurred that has required theapplication of PV modules. In the past Telstra (Telecom) purchased PV equipment onperiod contract, today the purchase of PV generally is related to particular projects oroutsourced as part of maintenance contracts. However, there is still considerablepotential for PV-powered mobile phone relay systems in regional areas.
Cathodic protection for pipelines was another major application in the 1980s and 1990swith a number of companies specialising in this market at the time. This market is notas large as it was 10 years ago and is dependent on new pipeline projects (eg in the oiland gas industry). An associated market is PV-powered protection equipment on oil rigs.
PV water pumping is a market which will continue to grow in the coming years. Localcompanies, Mono Pumps and Solar Energy Systems, specialise in manufacturing PVwater pumping systems, and there are a number of other firms specialising in systeminstallation.
Australia also has a considerable history in the deployment of PV systems to powernavigational aids. These range from small port lighting systems, to channel lighting andlight-houses (e.g. Cape Otway, Victoria). Recreational activities, such as yachting andriver craft, use PV to power on-board equipment, such as security and navigation systems.
Under a different policy, the electricity industry might consider that a decentralisedapproach based on distributed generators with no loss of amenity for customers is moresensible economically than extending or maintaining electricity networks to fringelocations. If 2.5 per cent of customers in the most isolated fringe-of-grid locations wereinstead powered by PV SPS, this would imply an additional market for PV of 20 to 30MW per annum11.
Mini-grid systems
The Renewable Remote Power Generation Program (RRPGP) is stimulating theinstallation of PV power stations to parallel with diesel generators in remotecommunities and towns. In 2003, Power and Water Corporation in the Northern Territoryinstalled a 56 kW system at Bulman and a 225 kW system at King’s Canyon. Dependingon the cost effectiveness of these systems, Power and Water Authority is planning toinstall many megawatts of additional capacity in the coming five years. A 220 kWconcentrator system has been completed for the Pitjantjatjara community in SouthAustralia by Victorian company Solar Systems. The system operates in a mini-grid witha diesel power station to supply six communities, with costs lower than for flat plate PVsystems. Between now and mid-2005 a total of thirty 25 kW PV concentrating dishes(manufactured by Solar Systems) will be installed at three sites in the Northern Territory(Hermannsburg, Yuendumu and Lajamanu) to supply 750 kW.
THE PV MARKET
32 //

THE AUSTRALIAN PHOTOVOLTAIC INDUSTRY ROADMAP 33 //
Grid-connected systems
Distributed applications
Grid-connected distributed applications comprise PV systems installed on residentialdwellings, and community buildings such as schools and kindergartens. About 2,000homes throughout Australia have grid-connected PV installations. The installed capacityfor grid-connected distributed applications was about 4.6 MW as at December 2003.
The projected grid-connected market is relatively large, comprising more than sevenmillion homes and community buildings. Even if only a quarter of this market has anorth-facing roof or other building surfaces suitable for PV, this amounts to a potentialmarket of some 2,600 MW at system sizes of 1.5 kW each, 500 times current totalannual PV installation rates. It is this market that has the most potential to deliver
significant PV industry investment in Australia (as identified in the Sunrise targets inChapter 5), and provide a sufficiently large domestic base for increasing export growthand reducing greenhouse gas emissions.
In January 2000, apart from the Sydney Olympics Athletes Village, there was littledemand for grid-connected PV and virtually no widespread infrastructure to deliver it. By 2001, the Photovoltaic Rebate Program had stimulated rising demand and thedevelopment of infrastructure to support grid-connected PV.
In Australia, the market for Building Integrated PV (BIPV) on commercial and publicbuildings is in its infancy, but the International Energy Agency has calculated12 thatthere are about 14,700,000 m2 of available good solar capture area for BIPV façades oncommercial and industrial building in Australia.
Centralised electricity generation
Although the distinction between distributed and centralised PV systems can sometimesbe vague, for the purposes of the PV Roadmap we have classified systems which havetheir own dedicated electrical substation as centralised systems.
The Energy Australia 400 kW PV array, installed at Singleton in 1997/98, is the largestcentralised grid-connected plant in Australia. The impetus for this installation was theinitiation of the Green Power program in Australia. Under a Green Power program,electricity retailers provide a ‘green’ tariff option to customers which is at a premium toregular tariffs. The retailer commits to ensuring that an equivalent amount of electricityto the amount of Green Power energy purchased by a customer is produced fromrenewable energy sources by approved electricity generators.
The Green Power program also led to Country Energy installing SEDA-supported 50 kWPV arrays in Queanbeyan and Dubbo. Though these are ‘centralised’ plants installed byan electricity distributor and having their own substation, they could also be consideredas ‘distributed’ systems since they are embedded within the electricity distributionnetwork.
It is expected that, in the future, larger PV systems will also be installed in the builtenvironment, either on existing buildings or new buildings. Some of these will requirethe installation of their own substations and will be connected to medium voltage gridsand therefore could be considered as centralised systems. The distinction betweencentralised systems and large distributed systems will be difficult at times.
Research is being undertaken overseas to investigate the installation of largecentralised PV plants in desert and regional locations and transmitting the electricity tourban locations. This work is being led by Japan, and there is activity under Task 8 of
CASE STUDY: ANANGU PITJANTJATJARA SOLAR STATION
The Anangu Pitjantjatjara lands cover an area in excess of 100 000 squarekilometres in north-west South Australia. They are home to approximately 2,500people living in communities and outstations.
A PV power station of 10 concentrating dishes was installed for the communities asa cost-saving measure and to reduce diesel consumption by more than 160,000litres each year. The ‘Sun Farm’, as it is referred to by the locals, will interconnectthe larger Umuwa and Ernabella communities to a mini-grid and complement a 3MW diesel station. The PV plant is expected to produce approximately 5 MWh ofelectricity per annum.
Solar Systems’ high-concentration solar PV dish technology uses mirrored paraboliccollectors to concentrate the sun approximately 500 times onto the highly efficientPV receivers. Each of the 10 dishes tracks on a dual axes and are optimised bydynamic auto-educating software. Built-in telemetry allows remote monitoring andcontrol, guaranteeing maximum power generation during the life of the plant. The220 kW station cost $2.5 million to build, install and commission.
The Pitjantjatjara Council received a $1 million Renewable EnergyCommercialisation Program grant from the Australian Greenhouse Office,complemented by funds for the project from the South Australian Department ofAboriginal Affairs and the Aboriginal and Torres Strait Islander Commission.
�

the IEA PVPS program. However, commercial installation of very large systems is notanticipated in Australia in the next 10 years unless undertaken via a carbon creditprogram with foreign companies/governments.
Solar Systems is developing new concentrating systems suitable for centralisedelectricity generation. Currently they are focusing on applying the technology in smallcommunity and village power systems such as mini-grids that currently use dieselgenerators. It is expected that this technology will be cost competitive with standardfossil fuel generators for centralised grid connected generation in 15 to 20 years. It alsohas significant export potential, particularly to countries with high radiation levels, largeavailable spaces and a high electricity demand, such as the USA.
Small portable electronic devicesThe use of PV in small portable devices is growing. PV cells and small modules arecurrently used in a variety of applications, such as watches, calculators, torches, gardenlights and measuring and recording equipment. It is estimated that approximately 10 MW of PV cells per annum are installed in electronic components used in Australia.These appliances use imported cells, and are not included under the Australian PVpower system market described above. The release of the next generation PV modules,which perform better in low light conditions than silicon cells, coincides with the growthin the development of small electronic devices. These include mobile phones, portableradio equipment, miniature transmitters and sensor equipment.
Next generation PV will have features which will very significantly expand the potentialfor PV in the electronics sector. PV with the ability to deliver good efficiency indoors andin other low light situations can be used for:
� Emergency power for battery switching.
� Storage life extension for batteries through trickle charging and smart electronics.
� Better utilization of batteries through capacitive properties of nano-technology PV.
� Next generation power enhancement for mobile devices.
The ability to perform in low light conditions can give a new feature to existingproducts. Applications where the PV module trickle charges a battery can prolong theautonomy of an existing product. Applications where a battery or grid supply is replacedby PV will be possible where the product is always used in a lighted position eg in retailpremises and hotel corridors. This will provide a cost savings in battery replacement orwiring installation.
By 2010, the international market for PV components could be 10 per cent of the relativebattery market, which is currently over $25 billion, and likely to be double that by 2010.
At present, Australia has virtually none of this market, but if we maintain our position inthe development of 3rd generation PV, then it is not unrealistic to say we could capture5 to 10 per cent of the market, that is around $2.5 billion to $5 billion, although asignificant proportion of this could be manufactured by licensees in countries withcheaper manufacturing costs.
PV system pricing System price data for Australia is difficult to obtain and represent accurately. AsAustralia currently has a relatively small market, large systems can dominate marketprice curves. In addition, module prices make up a significant proportion of systemprices and these are set by global trends that are affected by foreign exchange ratesand economies of scale achieved in other countries.
The current price for a single grid connected 1 kW system installed is approximately$12,200 excluding GST (Origin, 2004). Industry experts put the price for the same systemfive years ago at approximately $18,000 excluding GST. Note that the price per systemcan be reduced by up to 15–20 per cent for bulk installations. Figure 4.7 shows therecent downward trend in average off-grid and grid-connected PV systems prices inAustralia since 2000.
Figure 4.7 Average system prices for PV systems installed in AustraliaSource: Watt, Muriel, 2004
0
5000
10000
15000
20000
25000
2000 2001 2002 2003
$/kW
off grid up to 1 kW
grid- connected up to 10 kW
THE PV MARKET
34 //

THE AUSTRALIAN PHOTOVOLTAIC INDUSTRY ROADMAP 35 //
A similar downward trend for BP Solar’s wholesale selling prices per Watt in Australiasince 1995 is shown in Figure 4.8. BP Solar currently has a 65 to 70 per cent marketshare module sales in Australia.
Figure 4.8 Trend in wholesale selling price of PV modulesSource: BP Solar, 2003
Figure 4.9 shows the breakdown of current upfront grid-connected installed systemscost. Modules make up the majority of system cost (52 per cent), followed by inverter(25 per cent) and installation/other (23 per cent).
Figure 4.9 Grid-connected installed systems price
Unpriced benefits of PV
Pricing structures in Australia’s energy markets do not currently capture the economicand environmental benefits that PV systems provide, thus disadvantaging PV in marketdecisions made by energy customers.
Current coal-based grid electricity prices do not reflect a range of environmental,technical and social externalities which are borne by the community and which wouldbe reduced for each kWh substituted by PV generation. This is relevant to the case ofgrid-connected PV, whereby the value of systems is currently based only on the value ofthe total kWh generated over each operational year at retail electricity prices. Typically,any net export from the PV system to the grid is credited to the electricity customer’sretail bill.
Offsetting the escalating peak power problem
The increasing demand for electricity at peak times during summer is well recognised.According to the National Electricity Market Management Company, all statesparticipating in the national electricity market require additional generation by 2005/06to meet growing summer power demands.13
Electricity demand patterns are becoming increasingly more ‘peaky’ – the ratio ofaverage load to peak load is decreasing. In some new residential subdivisions inAdelaide, for example, 50 per cent of local network capacity is now used for only fiveper cent of the time.14
NEMMCO has projected that peak summer demands will increase significantly; in NSWsummer demand will increase by 1500 MW in 2007/08. This growth is drivingsignificant expenditure on infrastructure. In NSW alone, distribution and transmissioncompanies are to spend $5 billio on network upgrades in the next five years. Some twothirds of this network expenditure is attributed to peak demand.15 The $5 billion in newinvestment equates to a staggering $3,300 per kW of peak power incurred. Therequirement for further investment in peak generation (for example, gas turbines) tomeet this demand, equates to as much as an additional $1 billion in investment.
The daily maximum generation output of PV systems is closely correlated with peakdemand times. PV generation has around 80–90 per cent availability during peak times.PV output offsets importing electricity from the grid at peak times and thereforeprovides a network benefit.
Some two thirds of the additional network investment could be avoided by offsettinggrowth in peak demand – such as by investing in a grid connected PV system. Thisinvestment equates to an avoided $2,200 per kW. This benefit of installing a PV systemis not currently rewarded.
Typical installed system price ($/kW in 2004 – ex GST)
0
2000
4000
6000
8000
10000
12000
14000
installation/otherinvertermodule
0100020003000400050006000700080009000
10000
1995 1999 2002
$/kW

Figure 4.10 shows a NSW-specific example of the value of a 1 kW grid-connected PVsystem in relation to retail electricity prices. This value includes the wholesale NEMspot price equivalent for typical hours of PV operation; retail margin on the wholesaleprice including network losses, ancillary services and pool fees and charges; and theannual value of offsetting peak demand in network investment assuming 10 years ofoperation. The PV system provides a value to the electricity system of $240/MWh.
Figure 4.10 PV Value to the electricity system in relation to retail cost
Low environmental impact
The value of electricity generated by PV systems currently competes with fossil fuelretail energy prices that do not yet internalise all environmental impacts. Environmentalexternalities include local impacts such as air pollution, land use and water use. WhenPV displaces coal fired generation, NOx emissions are typically reduced by 50 per centper MWh and SOx emissions by 90 per cent, making PV photovoltaic electricity avaluable addition to clean air policies.
The major global environmental impact of fossil fuel energy generation is greenhousegas emissions. PV systems generate electricity with zero emissions. Lifetime CO2equivalent emissions (including the impact of PV production) with current PV powersystem technologies are 85 to 94 per cent less than those from coal fired power stationsand will be 95 to 97 per cent less with the new PV technologies now being introducedinto the market.16 Increasingly the cost of carbon is being internalised into internationaleconomies (Europe in particular), which results in PV systems becoming more
economically viable. The European emissions trading scheme will be introduced in 2005and carbon permits are currently trading at an equivalent of $17 per MWh.
Use as a building integrated material
PV integrated into the surfaces of buildings (such as façades, atria and roofs), allow thepossibilities of combining energy production with other functions of the buildingenvelope, such as appearance, weatherproofing, shading and/or solar thermalcollection. Cost savings through these combined functions can be substantial.Additionally, no high-value land is required and electricity is generated at the point ofuse, generally matching peak generation with peak demand, such as summer electricityloads. The electricity generated contributes directly to the building occupant’s electricityrequirements, whilst also avoiding transmission and distribution losses, and reducingcapital and maintenance costs for utilities.
The integration of the PV power system into the architectural design offers more thancost benefits. It allows the designer to create environmentally benign and energyefficient buildings, without sacrificing comfort, aesthetics or economy, and offers a newand versatile building material.17 Commercial buildings often use expensive externalfaçade material that may be comparable in cost to PV modules. However, no price signalcurrently exists to building developers or architects that reflect the benefit of energyproduction to future building owners and tenants once the building is operational.
Security of supply
PV systems are a distributed form of generation. This modularity provides benefits toelectricity utilities by allowing for generation to be expanded, or reduced (by relocation),to match demand more easily than with large central generation plant. Lead-times arealso shorter, exposure to fuel price volatility is reduced and grid augmentation can beavoided.18 Hence financial costs and risks are reduced. The use of PV systems adds toelectricity network integrity by reducing stress on networks (particularly during times ofhigh demand). In additional PV systems are smaller targets and therefore reduce the riskof terrorist attack.
PV can be used in conjunction with a small battery supply to provide an UPS capabilityat the domestic level greatly improving the availability of supply to essential applianceseg lighting, refrigeration, communications et. It can also can be used by emergencyservices to provide backup energy independent of fossil fuels or distributed electricity.
Value of PV in NSW ($/MWh in 2004)
0
50
100
150
200
250
300
PV value Retail cost
networkretail, losses and feesenergy
THE PV MARKET
36 //

THE AUSTRALIAN PHOTOVOLTAIC INDUSTRY ROADMAP 37 //
Government support programs
The development of the Australian PV market has been underpinned by a number ofAustralian and State Government support programs that are described below. SeeAppendix 3 for further details on these programs.
National programs
Photovoltaic Rebate Program (PVRP)
PVRP commenced in 2000 to support market development of PV. The program is fundedby the Australian Government and administered by the states and are available tohouseholders and owners of community-use buildings. The initial funding was $31million over 4 years and due to finish at the end of 2003. In February 2003, the programhad been oversubscribed for the 2002/2003 financial year and was capped to $100,000per month. In the 2003/04 Budget, announced in May 2003, PVRP received an additional$3.6 million for 2003/04 (total funding $5.8 million for the year) and $5.8 million for the2004/05 financial year. The program is now due for completion in June 2005. Of thefunding for 2004/05, $1 million has been assigned PV projects by property developers,which are to be selected via a competitive bidding process.
Grants of $5.50 per Watt (up to 1.5 kW) were initially available. Since there was a rapiduptake of the grants in the first 6 months the rules were changed to $4 per Watt fornew systems and $2.50 per Watt for system upgrades. Some states have developedprograms for ‘solar schools’ under PVRP. Since the start of the program, over 5000 PVsystems have been installed, representing over 5.7 MW of PV installed (see Figure 4.11).
Renewable Remote Power Generation Program (RRPGP)
The objectives of RRPGP are to increase the use of renewable energy for powergeneration in off-grid areas, reduce diesel use, support market development of PV, assist in meeting the infrastructure needs of indigenous communities and to reducegreenhouse gas emissions. RRRPGP funding is available for industry support programsthat relate directly to the use of renewable energy generation in off-grid areas, includingtraining, information provision, equipment testing and development of standards,renewable resource and system applicability studies and demonstration projects.
Funding for RRPGP is provided to the States by the Australian government, collectedfrom diesel fuel excise from 2001/02 to 2003/04 for diesel fuel used by publicgenerators not connected to main electricity grids. Grants of up to 50 per cent of thecapital cost of renewable energy systems are available for diesel replacement. Up to$200 million is expected to be available over the life of the program up to 2010. As atthe end of April 2004, $130m of RRPGP funds has been committed.
The States have developed different approaches for targeting the funding. A specificallocation of $8 million has been made to the Aboriginal and Torres Strait IslanderCommission (ATSIC) to assist with the development of industry capability and localunderstanding of renewable energy systems in indigenous communities. This program isentitled ‘Bushlight’.
Mandatory Renewable Energy Target
The Mandatory Renewable Energy Target (MRET) was introduced by the AustralianGovernment in 2001. MRET requires electricity retailers to meet annually renewableenergy targets that increase 9500 GWh of additional renewable energy by 2010 andcontinue at this level to 2020. Renewable Energy Certificates (RECs; 1 REC = 1 MWh)are created from eligible generation to meet the targets. For PV systems up to 10 kW,five years of RECs can be created upfront, or deemed, on installation. For PV systemsgreater than 10 kW RECs are only eligible to be created from the actual generation.
Renewable Energy Equity Fund (REEF)
The Renewable Energy Equity Fund is a $26.5 million venture capital fund established toincrease investment in renewable energy technologies through the provision of equityfinance. It is funded to $18 million under the Australian Government’s REEF program and$8.5 million (approx) from private sources.
0
50,000
100,000
150,000
200,000
250,000
Jan
Feb
Mar
Apr
May Jun
Jul
Aug
Sep
Oct
Nov De
cJa
nFe
bM
arAp
rM
ayJu
neJu
lyAu
gSe
pt Oct
Nov De
cJa
nFe
bM
ar Apr
May
June
July
Aug
Sept
Oct
Nov De
cJa
nFe
bM
ar Apr
May
June
July
Aug
Sept Oct
Nov De
cJa
nFe
bM
arAp
ril
2000 2001 2002 2003 2004Grid Off-grid
W/pmth
Figure 4.11 Watts installed per month under PVRPSource: Australian Greenhouse Office, 2004

State government programsStates are involved in administering the PVRP, and RRPGP (all states except Victoria),and some states have additional programs and/or contribute funds to existing Australianprograms. State Government programs that apply to PV and are additional to theAustralian Government schemes include the following.
Victoria
The Renewable Energy Support Fund (RESF) is designed to support innovativeapplications of medium-scale, renewable energy technologies – such as energygenerated from PV or mini-hydro projects. RESF is a key initiative of the VictorianGreenhouse Strategy.
New South Wales
The Renewables Investment Program (RIP) provides funding assistance for renewableenergy projects in NSW through regular six monthly funding rounds. Appropriateprojects are funded on a competitive basis based on greenhouse gas savings, the levelof innovation displayed, the degree of market transformation and commercial returns.NSW provides a top-up to PVRP funding available to support applications not eligible forPVRP support. The Department of Utilities Energy and Sustainability (DEUS) alsosupports broad PV industry development through activities such as ‘Who Buys SolarPower’ market surveys and facilitating cooperation between the PV and the ElectricitySupply industries in NSW.
Queensland
The Working Property Rebate Program (WPRS) is a joint Queensland Government andAustralian Government initiative, this scheme applies to family owned workingproperties located in selected remote shires in Western and Northern Queensland notconnected to the main or Mount Isa electricity grids. The WPRS is designed toencourage the use of renewable energy, reduce the use of diesel, and service the powerneeds of working properties in remote Queensland. The scheme is funded under RRPGP($8 million) and by the Queensland Government ($4 million). The scheme is currentlyexpected to continue until the earliest of mid 2006.
Western Australia
The Remote Area Power Supply Program provides rebates for renewable energy powersystems used instead of diesel generation in off-grid areas of WA. Rebates areavailable for systems serving Aboriginal communities, businesses and households. TheProgram is jointly funded by the Australian and WA Governments. The RenewableEnergy Water Pumping Program provides rebates for medium and large sized renewableenergy based pumps, such as PV pumps and windmills, used instead of diesel based
pumps in off-grid areas of WA. Total funding of up to $4.8 million is expected to beavailable under the Renewable Energy Water Pumping Program from February 2002 toJune 2006. The program provides rebates on the capital cost of the renewable energycomponent of eligible pumping systems.
Energy statement – ‘Securing Australia’s energy future’Australia’s Prime Minister delivered the Energy Statement for Australia in June 2004.19
This Statement has delivered the Australian Government’s visions for the future directionof the energy sector and therefore has implications for the role of the PV industry.
The key features of the statement that impact on the PV industry are as follows:
i. Establishment of a Research and Development fund with a total of $500 millionwhich will be available to projects that result in a reduction in greenhouse gasemissions. Funds will be available for qualifying projects and will receive $1 forevery $2 contributed by the project proponents. Eligible projects will includegeosequestration, efficient coal-fired technology, energy efficiency, renewableenergy, gas-fired generation and cogeneration as well as transport and agriculturalemission reductions.
ii. $200 million specifically available for renewable energy and energy efficiency,which includes the following:
a. $20 million to improve energy storage for intermittent generation.
b. $75 million for Solar Cities trials to demonstrate solar energy and energyefficiency. This funding is to develop an operational model of solar energy,energy efficiency and energy market to assist in providing appropriate pricingsignals. The program funding is to be committed over a 5 year period to fundtrials. Trials will include time of day pricing, interval metering, cost reflective buyback arrangements.
c. $100 million for commercialisation of renewable energy technologies withcommercial potential.
iii. MRET – the Australian Government has committed to continue the scheme but notto increase the current target. A scheduled review of the scheme prior to the EnergyStatement by an independent panel recommended an extension of the scheme andan increasing target following 2010. While the Government has not adopted thisrecommendation, it has committed to a number of other recommendations,including:
a. Establish time limits for the creation of RECs.
b. Publish additional data on baselines of generators commissioned prior to 1997and additional data on generation.
THE PV MARKET
38 //

THE AUSTRALIAN PHOTOVOLTAIC INDUSTRY ROADMAP 39 //
c. Extending deeming provisions for PV and increase threshold to 100 kW – thiswould become an important driver for PV as it would allow a customer access toupfront funding more in line with module guarantee periods.
d. Provisional accreditation for renewable energy generators.
iv. Energy efficiency –The key measures announced are:
a. Providing information to consumers and business on the energy performance ofbuildings, requiring landlords and building owners to disclose energy performanceinformation to prospective tenants and purchasers.
b. Large energy users (using more than 0.5 PJ/a, about 250 companies) will berequired to undertake energy audits and report on their emissions and mitigationplans.
c. Continue with existing programs to further develop minimum performancestandards for appliances and buildings (nothing new in this initiative).
v. Changes to diesel excise – Excise is currently levied on the use of fuels in Australiaincluding the use of petrol and diesel. The level of excise on diesel currentlyamounts to around 40 per cent of the total fuel cost (excluding transport). Exciserelief is currently available for a number of users in remote and regional Australia.The fuel excise changes substantially expand the availability of excise reliefeffectively making excise free the use of fuels used for stationary energyapplications such as power generation, heating and industrial applications. This willhave a significant adverse impact on the competitiveness of off-grid renewablepower generation projects. The changes are expected to be effective from 1 July2006. The biggest impact will be felt by the PV distributor, designer/installercomponent of the market and system integrators
Impediments to further uptake of PV
During the consultation undertaken for the PV Roadmap, a number of barriers wereidentified by the various stakeholders. These were then identified by cause and effect,the urgency to resolve the barrier and what possible solutions could be, and who wouldbe involved in assisting with their dissolution. Appendix 7 contains full details on thebarriers and their possible solutions. Table 4.5 summarises the key barriers identified by industry.
CASE STUDY: CONNECTION PROCESS
Complications with system connection and metering led to a Melbourne residentbeing unable to generate electricity from her installed 2.1 kW PV system for fourmonths. The system owner’s distribution network service provider (DNSP) requiredthe existing net meter at the domestic residence be replaced with an interval meter(at a cost of $81 plus $70 annual rental) as well as a separate cable to be takenfrom the switchboard to the meter in order to separately measure the solar systemoutput. The contract sent by the retailer for this work had a clause requiring theresident to sign over RECs worth more than $2000 (over the life of the system) tothe retailer.
The resident then decided to switch to another retailer not requiring her to sign overher RECs and with a better buy-back fee. Unfortunately the new retailer is yet toprovide a contract, so the DNSP has refused to install the meter and the PV systemremains unconnected. Owners of systems are also not eligible for PVRP rebatefunds until the system is connected. The connection process for systems iscommonly protracted and complex such as in this case.
�
Residential PV system, Noble Park, Victoria

Table 4.5 Summary of key barriers to the large-scale deployment of PV in Australia
Barrier Causes Effects
Barriers from PV Industry Perspective
Instability of the market for PV in Australia Immature market compounded by short-term, Consumer uncertainty; difficulty planning and buildingstart-stop support policies viable businesses
Small PV market volume in Australia High up-front costs for PV systems, long ‘payback’ period, Falling share of global PV market; critical pressures to relocatelow awareness, low recognition of added-values of PV, PV cell and PV manufacturing out of Australiadisjointed support measures
Business development finance hard to access for the PV industry Finance sector unfamiliar with PV/over-cautious PV industry businesses cannot easily grow
Weak export orientation by the PV industry Low awareness among aid and trade sectors Failure to capture viable export opportunities; danger of crowding-out by overseas competitors
Ambivalence among consumers towards non-conventional energy sources Very low electricity prices and inadequate price signals; PV viewed as uneconomic, impractical or only of distant consumers unaware of the costs they impose on the electricity future benefitindustry; low awareness of personal impact on greenhouse gas emissions; limited PV awareness by consumers
Barriers from Other Stakeholders Perspectives
High up-front cost/long payback period for PV systems Small market volumes (little mass-production effect); limited Demand and experience remain low; competitors with large(service) industry experience; technologies still being optimised subsidised markets pull ahead;(especially grid-connect)
Complex ‘purchase’ procedures (subsidies, RECs interconnection, buy-back) Subsidy and RECs programs are new and unfamiliar to the consumer; Reluctance by consumers to deal with the complexities involvedelectricity industry is unfamiliar with PV and applies inappropriate in purchasing PV systemsprocedures for interconnection and buyback
Apprehension about PV amongst the electricity industry Risk-averse electricity industry with little experience of PV, PV overlooked or discounted as a viable demand management oruncertainty about added value claims because little quantification distributed generation option (only for distant future)of unpriced benefits has been carried out
Building developers are largely unfamiliar with PV and unaware Little PV exposure and experience in the building industry; Very few BIPV buildings in Australiaof its potential value to them little awareness of their ability to influence the energy sources
used in buildings and therefore reduce operating costs The main opportunity for PV is inaccessible
Lack of strategic R&D support Closure of government funding programs Collapse of research groups.Reduction in educational opportunities
THE PV MARKET
40 //

THE AUSTRALIAN PHOTOVOLTAIC INDUSTRY ROADMAP 41 //
5// WHAT IS THE POTENTIAL OF THE AUSTRALIAN PV INDUSTRY?For Australia to build a strong PV industry, two critical components are required:
� Belief from industry and the financing sector that a significant opportunity exists inAustralia that is worth investing considerable financial and infrastructure resourcesin to build a strong, sustainable industry sector. This investment includes additionalprivate investment in capability and capacity as well as corporate investment instreamlining industry representation, accreditation and standards; and
� Recognition by the government that PV has a place in the Australian energy fuel mix, through the implementation of a sustainable industry development that will assist in bridging the gap for consumers between now and commercial viability.
In order to make a clear case for industry and government, this Roadmap presents avision for the PV industry called ‘Sunrise’ with target installed capacity to 2030.
This Chapter considers two principal scenarios for the purpose of establishing the‘Sunrise vision’. The two scenarios are ‘Business as Usual’ (BAU), and an alternativeenhanced scenario ‘Sunrise 350’. The BAU scenario is representative of a ‘sit and wait’approach, with no further additional government support, while Sunrise 350 presents anambitious vision for the Australian PV sector, but one that is achievable through theindustry development programs presented in Chapter 7. Both scenarios have beeninformed through the industry and stakeholder consultations undertaken during thedevelopment of the PV Roadmap, and has been influenced by broader internationalperspectives and developments.
Figures 5.1 and 5.2 show these two very different outcomes for the PV industry inAustralia. The BAU case shows an industry fragmented by stop/start governmentsupport policies that manages to sustain itself until commerciality. In this case, theindustry will ultimately build itself around imported modules but will not support a solidmanufacturing base.
In contrast, the Sunrise 350 scenario shows an industry with considerable depth inmodule and balance of system manufacturing, distribution and installation. Not onlydoes government support bridge the gap for consumers, but the certainty allowsindustry to invest in its capability and build capacity. Sunrise 350 shows an industrycontributing significantly to the Australian economy in terms of jobs, revenue (nationaland exports), electricity supply and carbon abatement.
Figure 5.1 BAU scenario of revenue and jobs projections to 2030
Figure 5.2 ‘Sunrise 350’ revenue and jobs projections to 2030
20002001
20022003
20042005
20062007
20082009
20102011
20122013
20142015
20162017
20182019
20202021
20222023
20242025
20262027
20282029
2030
0
500
1000
1500
2000
2500
3000
0.00
500.00
1000.00
1500.00
2000.00
2500.00
3000.00
3500.00
Revenue ($million) Jobs
Aus Module industry revenue
Aus BOS industry revenue
Local installation + O&M revenue
Jobs
0.00
500.00
1000.00
1500.00
2000.00
2500.00
3000.00
3500.00
2000
2001
2002
2003
2004
2005
2006
2007
2008
2009
2010
2011
2012
2013
2014
2015
2016
2017
2018
2019
2020
2021
2022
2023
2024
2025
2026
2027
2028
2029
2030
Revenue ($million)
0
10000
20000
30000
40000
50000
60000
70000
80000
90000Jobs
Aus Module industry revenueAus BOS industry revenueLocal installation + O&M revenueJobs

42 //
The results shown in Figures 5.1 and 5.2 are summarised in the following table. Aspreviously stated, the scenarios were built in consultation with industry and use a rangeof assumptions taken from global market growth scenarios. The comprehensive detailsitting behind the modelling is available at Appendix 4. The scenarios themselves aresummarised in Table 5.1.
Table 5.1 Results of the PV Roadmap Scenario Modelling
2010 2020 2030BAU Sunrise 350 BAU Sunrise 350 BAU Sunrise 350
Total PV Installed 120 350 420 6,740 2,090 23,910(cumulative MW)
PV Sector Jobs 310 5,290 370 31,600 2,820 79,570
PV Sector Revenue 80 1,180 100 5,160 530 6,830(annual $ million)
Electricity Generated 160 490 580 9,320 2,890 33,050(annual MWh)
CO2e abated in year 160 490 580 9,320 2,890 33,050(‘000 tonnes)
Exports ($m) 19 445 22 1916 93 2438
Key common assumptionsBoth scenarios share some common assumptions, notably:
� Global market growth rate for the foreseeable future is 25 per cent per annum.
� Price versus production has a Progress Ratio of 82 per cent for modules, BOS andinstallation. This is equivalent to an 18 per cent reduction with every doubling ofinstalled capacity.
� Cost (and price) reductions of internationally-traded components such as modulesand BOS are based on global market volumes, while installation cost (price)reductions are based on local market volumes.
� Starting electricity prices used are Australian averages as determined by the EnergySupply Association of Australia. Electricity prices in states such as SA and WA inparticular are likely to be higher than the national average, while NSW and Victoriamay be lower than the average.
� Average yield figures (typical output of a 1 kW unit of PV, which is mainly a measureof the average annual solar resource at the installed location) are based on MRETZone 3 deeming values for (small) PV generators and is equivalent to 1.4 MWh perannum for a 1 kW system. Zone 3 covers most major Australian centres. Notableexceptions which will experience higher yields are Darwin, Alice Springs andMoree. Melbourne and all of Tasmania will have lower yields.
� RRPGP continues to 2010 with gradual phase-out (i.e. no ‘step’ withdrawal at theend of program term).
What is ‘Business as Usual’?An analysis of the historical development of Australia’s PV market over the last decadefor the four main PV application sectors is summarised as follows:
1. Demand in the off-grid, non-domestic sector was declining until the introduction ofthe RRPGP in 2000. This is believed to indicate that the traditional market fortelecoms and other industrial applications was approaching saturation. RRPGP hasstimulated new demand for PV SPS for diesel replacement and water pumping, andfor new industrial and semi-commercial applications. The two-year average growthrate (16 per cent) is therefore believed to be appropriate for market projections inthe Business as Usual scenario, at least while RRPGP remains in operation, that is,until around 2010.
2. Grid-connected centralised power is dominated by a small, infrequent number ofvery large projects which tend to distort the growth rate. Nevertheless, the threeyear average growth rate (10 per cent) is seen to be generally indicative of BAUdemand trends in this sector.
3. The grid-connected distributed power market in 1998 and 1999 was similarlyinfluenced by large ‘atypical’ demand for modules for the Newington OlympicVillage and other applications for the 2000 Olympics in Sydney.
4. The introduction of GST in 2000 stimulated a further spike in demand, notably forboth grid-connected and off-grid domestic systems. The years 2001 and 2002 arefelt to demonstrate a more typical demand pattern, and the two-year averagegrowth rates (19 per cent and 16 per cent respectively) are believed to be moreappropriate for BAU market projections for the off-grid domestic and grid-connecteddistributed sectors whilst PVRP remains in place.
WHAT IS THE POTENTIAL OF THE AUSTRALIAN PV INDUSTRY?

THE AUSTRALIAN PHOTOVOLTAIC INDUSTRY ROADMAP 43 //
Table 5.2 ‘Business as Usual’ scenario summary
Scenario overview Arguably BAU is more reflective of market forces. However, the slow local growth relative to strong overseas industry development has impacts on local industry development; ultimately this leads to a marginalised role for local component manufacturers. Consequentially, there is weak export potential.
Key assumptions PVRP concludes mid-2005 with no successor.RRPGP continues to 2010 with gradual phase-out (i.e. no ‘step’ withdrawal at the end of program term).MRET deeming period remains as per current regulations (maximum 5 year blocks).No new incentives or other industry development measures.Continuing cross-subsidy to fringe-of-grid customers.
Market shape Near-termPVRP conclusion leads to immediate 50 per cent drop in residential PV sectors (both on and off-grid). Demand subsequently begins to rebuild in line with BAU growth rate, but from this lower level, such that 2010 market volume is no larger than volume at the end of PVRP.Commercial off-grid exhibits ‘traditional’ growth rate.Water pumping and ‘community power’ (isolated rural mini-grids) continue to be driven by RRPGP to 2010.Mid-termOff-grid markets reach sustainable demand levels between 2012 and 2015.Revived interest from DNSPs. Trials for weak-grid support and as network capacity management tool.Distributed residential demand re-emerges towards the end of this term as PV electricity approaches competitiveness with grid-tariffs. SA and WA will see this before QLD, VIC, NSW/ACT and TAS due to higher electricity prices.Long-termIncreasing residential and remote community uptake.Emerging opportunities including PV for Hydrogen production and possibly Multi-MW Desert PV (Centralised generation) systems.
Industry profile Near-termExisting cell/module manufacturers dramatically scale-down production. Consequent job losses. This has some knock-on impact on BOS manufacturers and R&D centres (much reduced grid-connect R&D focus) as well as installers, with a contraction of the installer pool. Potentially this could result in a reduced maintenance focus with consequential implications for broad industry reputation. Possible impact on economic growth in regional areas due to job losses.Medium-termModules largely imported. No module export. Influx of overseas BOS (notably inverters) towards end of term as grid-connect re-emerges.Long-termPossible module manufacture re-entry (Overseas IP). Strong overseas module dominance. BOS retained, but significant imports from more developed competitors.

44 //
Table 5.3 Sunrise 350 Scenario Summary
Scenario overview Strong market intervention and support for local industry development. Requires continuing intervention coupled to industry development, building for the next 5–6 years, and then gradually diminishing over a period of a further 6–7 years. Focused on strong local industry, with local manufacturing meeting 75 per cent of local demand into the long-term future. This provides a strong base for product R&D. Consequentially Australian PV industry is more visible internationally with robust, innovative products and a stronger export focus.
Key assumptions PVRP concludes mid-2005, superseded by an alternative incentive scheme for residential customers, particularly focused at stimulating demand for grid-connect systems.Similar focus on commercial building sector (incentives or mandatory targets).Network strategy refocused towards distributed generation as a capacity and demand management tool.RRPGP continues to 2010 with gradual phase-out (i.e. no ‘step’ withdrawal at the end of program term).Gradual adoption of PV as a viable supply for fringe-of-grid customers
Market shape Near-termIntervention program to succeed PVRP, stimulating high levels of demand for residential grid-connect. Likewise new initiatives to stimulate demand for commercial building sector. Annual growth rates for distributed grid-connect of 100 per cent from 2005 to 2010 for an (annual) market of approximately 80 MW in 2010.Similarly intervention to stimulate utility sector demand for centralised grid-connect PV under DSM/Capacity Management Strategies. Also doubling sector market volume year on year from 2006 to achieve 20 MW per annum in 2010.Commercial off-grid exhibits ‘traditional’ growth rate.Water pumping and ‘community power’ (isolated rural mini-grids) continue to be driven by RRPGP to 2010, but with stronger marketing e.g. for water pumping to address inland salinity issues and additional inclusion of fringe-of-grid applications.Export drive focused on delivering 50 per cent of production (modules and BOS) overseas, particularly to regional neighbours.Medium-termGradual phase-out of intervention as PV electricity price approaches retail electricity prices. Residential/commercial grid-connect demand growth rates gradually slow. Distributed grid-connect sector approaches long-term sustainable annual demand (600 MW pa) by the end of the term. Off-grid non-domestic (including mini-grids) achieves sustainable annual limits early in the term, with demand remaining stable thereafter. Off-grid residential developing more of the fringe-of-grid opportunity continues to expand, though slowing towards the mid-term and achieving the sustainable limit by the end of this term.Long-termAll major markets with the exception of grid-connect centralised are stabilised, commencing ‘replacement’ cycle towards the end of the term. Centralised continues to grow, responding to emerging opportunities including PV for hydrogen production and possibly Multi-MW Desert PV (Centralised generation).
Industry profile Near-termModule manufacturing is retained, including some cell manufacture. Revitalised R&D focus both fundamental and applied, particularly with industry focus on developing/expanding appropriate building integrated (BIPV) solutions.Beginnings of regional export expansion. Deep and broad installer service pool with strong technical and customer-service focus. Medium to long-termSeventy-five per cent of all locally-used components manufactured in Australia. 50 per cent of Australian product exported. Continuing investment and innovation to develop both third generation cell technology and solutions for emerging opportunities such as large-scale desalination (potable water production) and sustainable, particularly distributed, hydrogen production.
WHAT IS THE POTENTIAL OF THE AUSTRALIAN PV INDUSTRY?

THE AUSTRALIAN PHOTOVOLTAIC INDUSTRY ROADMAP 45 //
Further assumptions pertinent to the modelling include those already made in theprevious chapters about the projections of future PV sales in each market sector.
Projections of future PV salesMarket growth projections of future PV sales are clearly open to some speculation,particularly as there is very little ‘real’ market experience on which to base growthexpectations. Even internationally, in industrialised countries there is no marketperformance history of PV as a fully economic alternative to traditional electricitysources, other than in specific remote industrial applications. Furthermore, it has notbeen possible so far to assess customer uptake where marketing and appropriatefinancial devices are fully functional.
The model in some way attempts to reconcile PV market growth expectations with the‘S-shaped’ product demand profile common to other consumer products: relatively slowdemand (early adopters) governs the early stages of a product’s life-cycle; subsequentlygrowth rates accelerate as the product gains mainstream interest, before eventuallyslowing as the market becomes saturated and demand is driven by replacement andupgrades.
A critical consideration therefore is the saturation limit (for each application sector). Thescenario modelling is therefore also informed by assumptions about the likely maximumsustainable annual sales for each individual PV application. Table 5.4 shows the ‘limitsto growth’ for each sector. These are presented in more detail below.
Finally, particularly under Business as Usual, a measure of price elasticity is introduced,such that annual sales growth is linked to the difference between the PV electricityprice1 and that of grid-supply. Thus as the price differentials decrease, the annual PVsales growth rates increase. This presupposes that the customer is able to finance theupfront capital cost of purchasing the PV system – a very important assumption.
Table 5.4 Estimates of maximum sustainable annual sales for PV applications
Application sector Maximum sustainable annual sales estimate
Off-grid domestic
Remote households, holiday homes, pastoral stations, isolated communities (Indigenous) 3.0 MW pa
Fringe-grid (potential market – needs different electrification approach) 20–30 MW pa
Off-grid non-domestic
Telecoms, water pumping, signalling, cathodic protection, electric fences, street lights, tourist facilities 14–16 MW pa
Mini-grids
Isolated communities (mines), public generation 7 MW pa
Grid-connected distributed
Residential rooftops, commercial BIPV 600 MW pa
Grid-connected centralisedNetwork strengthening, bulk power 200–2000 MW pa
Consumer devicesSmall portable electronic devices 10 MW pa
Following are the assumptions made in the scenario modelling regarding the limitingfactors to growth in the use of PV in each of the application sectors.
For the off-grid sectors in general, sustainable annual sales are based on 25 year(replacement) cycles and 50 per cent penetration of the identified potential market, theremainder being accounted for by competing technologies. Where PV is directlyreplacing diesel, it is further assumed that PV offsets two-thirds of the diesel capacity,the remainder being retained as backup generation plant.
Off-grid domesticThe total potential market, based on saturating existing off-grid residences, is estimatedat 150 MW.2 However, competing technologies, and existing penetration in this sectorsupport the view that the accessible market in the short to medium term based oncurrent system trends is perhaps only 25 per cent to 50 per cent of this capacity. A 1999assessment of diesel SPS market indicated a short to medium-term annual market of1000 to 2000 systems (or 1–4 MW per annum)3.

46 //
However, as costs decrease and experience grows, off-grid PV is expected to gain wideracceptance by the electricity industry as a viable alternative to grid-supplied electricityin fringe-grid locations. The theoretical long-term potential for fringe-grid replacementor augmentation is estimated to be in the order of 1000–1750 MW.4 Nevertheless, thismay be a difficult market to penetrate given that it involves either installing individualPV systems for each customer on a thin rural electricity line or disconnecting customersfrom the existing electricity network and providing them with individual PV RAPSsystems. Additionally, unless the electricity industry introduces differential price tariffsfor rural customers, the economic incentive for these customers to invest in PV is farless persuasive than for existing off-grid users who may be paying three times more perkilowatt-hour for diesel-generated electricity compared to the average domestic tariff.Hence, the PV investment may need to be made by the electricity network supplierrather than the customer.
In the long-term (beyond 2030), the sustainable annual market for off-grid domestic PVis tentatively estimated at 25–45 MW, however under current utility policies to continueextending the main electricity grid, this market sector is not expected to greatly exceed10 MW per annum.
For modelling purposes, the Sunrise 350 scenario assumes that, with successfuldemonstrations of the benefits of PV for electricity networks, inroads are made intofringe grid applications building towards and sustaining a market of around 30 MW perannum from 2017. This application is assumed not to be accessible under the BAUscenario.
Off-grid non-domesticThe economic industrial applications that have driven demand for PV RAPS system inthe past will continue to present demand for PV, though this market sector is believed tobe largely saturated with growth dependent on major new infrastructure projects, suchas gas pipelines. The size of this sector is estimated at 2–4 MW per annum into thefuture, irrespective of PV industry development actions.
Estimates for the PV water pumping sub-sector are based on rebuilding demand fordecentralised pumping solutions (which traditionally used mechanical windpumps) tothe level experienced in 1960s and 1970s. At that time the total market was estimatedto consist of 500,000 units with annual sales in the order of 10,000 units. This implies apotential sustainable PV water pumping market of 10 MW per annum. This is seen asan alternative to piped water supply and also to address the growing salinity problemsassociated with rising water tables.
The long-term sustainable annual market for off-grid non-domestic PV is thereforeestimated to be in the order of 20 MW per annum. It is further assumed that, as per theoff-grid domestic sector, industry development initiatives under Sunrise 350 assistearlier penetration into emerging sectors, such as the mining regions.
Mini-grid systemsIn the longer term, penetration into the mining sector (where diesel-based generationcosts are much lower than other off-grid sectors due to the lower excise payable on thediesel fuel) is expected to increase, such that the ultimate potential market across thissub-sector is estimated to be at least 300 to 350 MW, or 10–15 MW per annum.
Grid-connected distributedThe potential market for grid-connected PV on residential and commercial buildings andother applications in the built-environment is extremely large. Incorporating 1.5kW of PVfor every existing residence in Australia implies a total market in the order of 10,500MW5, or in the long-term a sustainable market of at least 350 MW per annum. New-build residential sector construction rates also support a theoretical annual market inexcess of 600 MW, based on current progress of 150,000 new residences each year.
A large proportion of this opportunity (building to 50 per cent to 70 per cent) is expectedto be captured beyond 2015 as the costs of PV electricity approach residential retailtariffs. In the interim, however, demand is likely to be largely dictated by the availabilityor not of financial incentives to bridge the gap between the levelised cost of PVelectricity and the residential electricity price. Beyond 2005, without interim support tobuild on PVRP, the grid-connected distributed sector is expected to contract sharply andgrowth will not revive until the life-cycle economics favour PV over alternative electricitysupply options and adequate packages are available for financing purchases of PVsystems. This implies a BAU demand to 2010 in the order of only 2 MW per annum inthe absence of market stimulation incentives, compared to a dramatic ramping-up ofdemand to approximately 80 MW per annum in 2010 under the Sunrise 350 scenario.
The opportunity in the commercial sector is slightly harder to assess, given the lack ofavailable data about building stock. On the basis of energy demand comparisonsbetween the commercial and residential sectors, and assuming similar penetrationlevels and replacement cycles, the sustainable annual sales volume is estimated to beapproximately 200 MW. While some demand for PV product is expected to be generatedamong commercial building owners, a stronger driver initially will be the architecturaland building communities. A key factor in engaging these stakeholders will bepromotion and education and demonstration via a series of appropriate, accessibleexemplar projects.
WHAT IS THE POTENTIAL OF THE AUSTRALIAN PV INDUSTRY?

THE AUSTRALIAN PHOTOVOLTAIC INDUSTRY ROADMAP 47 //
Grid-connected centralisedIn an increasingly carbon-conscious environment, there is clearly an enormous potentialfor a variety of emerging technologies to contribute to future centralised powerapplications. For photovoltaics, the near-term opportunities are envisaged to bepredominately capacity and demand management related, particularly support for weakgrids. The potential sustainable volume of this subsector is extremely difficult to assess.However, there are clear opportunities for PV in areas such as sustainable hydrogenproduction as well as other vital future services such as large-scale desalination.
Based on the Australian National Hydrogen Study, 35.5 TWh/yr of electricity might berequired to achieve the 2030 ‘medium’ scenario6. Assuming PV is capable of capturing20 per cent of this potential, this equates to some 5GW of PV for this application aloneby 2030 (assuming approximately 1400 GWh/GWp). Note that by 2025 prices for PVelectricity from centralised generation are projected to be less than the prices paid byindustrial customers for grid-supplied electricity, so co-location could be entirely feasibleand PV’s penetration into the hydrogen economy might be greater than 20 per cent. Thisdepends amongst other issues on how the proposed carbon sequestration solutionprogresses, which might mean more reforming from coal rather than electrolysis from PV.
Conclusions of modellingAs with any forecasting, conclusions from the modelling ought to be handled with somecaution; the outputs are strongly dependent upon the validity of the assumptions usedand the accuracy of the input parameters. In developing the model, the Roadmapconsortium has sought to be robust in assessing the key inputs and cautious wheredoubt exists. While the ‘end of term’ indicators cannot be guaranteed, the generalimplications in terms of the relative scale of jobs and revenue created, and emissionsabated under the two alternative scenarios, are unmistakable:
� The off-grid application sectors are a vital near-term opportunity for PV industrydevelopment, including the basis for developing our regional exports. However,these sectors are not of sufficient volume to enable Australia to command anythingother than a marginal role on the global industry level in the medium to long-term.
� Significant off-grid market opportunity – perhaps as much as 50 per cent of the total– will not be available to the PV industry (or other distributed generation sources)while current rural electrification strategies remain.
� The grid-connected applications sectors present a much greater market opportunity(perhaps 20–75 times greater) than the identified off-grid potential. This hasproportionately similar implications for greenhouse gas abatement, jobs andrevenue creation.
� Until PV electricity generation costs approach comparable electricity prices there isunlikely to be significant uptake of PV technology without some additional incentiveor mandatory requirement upon would-be users.
� PVRP will expire in mid-2005. MRET even with the proposed 15 year deeming is currently insufficient to bridge-the-gap between PV electricity cost and electricity prices.
� PV has considerable potential for a variety of indirect electricity applications:desalination and hydrogen production in particular are key innovation areas to whichPV could be appropriately coupled.
� The commercial building sector represents a considerable, and so far virtuallyentirely untapped, opportunity both for reducing peak electricity demands andnetwork peak capacity. There is currently no significant Australian focus on thisapplication sector.
� Commercial building integration products are only slowly emerging on the globalmarket and these may not be appropriate for Australia or other relatively low-latitude countries. There is therefore a window of opportunity for the Australianindustry to address this opportunity.
� When existing incentives are removed, the capital cost of PV systems will remainhigh in comparison to the alternatives – notably diesel generators or grid-suppliedelectricity. Appropriate financing mechanisms or energy service approaches, andsupportive government policies and programs will therefore remain essential forfuture PV market development.
The PV industry worldwide is developing rapidly. Unless Australia implements a varietyof measures to stimulate and support interim domestic demand for PV our entireindustry will become increasingly marginalised on the world scene. A strong, long-termgrid-connect focused program would create an ‘innovation environment’ for localmanufacturers and systems integrators, to develop new integration products appropriatefor the domestic market and for export.

6// EXPORT MARKETSExport markets provide an important opportunity for Australian renewable energybusiness to leverage off proven skills and experience gained in Australia’s traditionalstand-alone power systems (SPS) markets.
Australian PV industry strengths in SPS are particularly relevant to developing countrymarkets. These have growing needs for reliable power generation technology –particularly in mini-grid and remote power applications.
Export markets have been important to date for a number of renewable energybusinesses, and have provided an important buffer against the stop-start approach to PVindustry support in Australia to date. With uncertainties in the traditional Australian off-grid market created by the removal of excise on petroleum products for off-grid powergeneration, the development of export markets becomes critical for existing renewableenergy businesses.
The Australian Government has developed bilateral agreements with the USA, China,Japan, the European Union, and New Zealand. The Australian Renewable Energy ExportNetwork (AREEN), in consultation with industry, has identified China, Thailand,Malaysia, the Philippines, Vietnam, Laos and the US as priority countries for Australianrenewable energy exports. These countries present significant opportunities forAustralian PV exports, alongside nations in the Pacific region.
Opportunities to export Australian R&D services and intellectual property
Innovations developed in Australia are already included in many PV productsmanufactured internationally. However, to date, the returns to Australia have not beenoptimised, although returns have repaid some government R&D funds. The key is toensure that our national returns from the development of Intellectual Property areadequate. This can be achieved through appropriate commercial arrangements, in theunderstanding that manufacture in Australia is sometimes not the best commercialoutcome for Australia, or is perhaps not possible due for instance to market barriers inthe venture capital sector. Other technology sectors in Australia have been developingthese skills in the export of Intellectual Property, and the PV industry needs to accessthese skills, with government assistance where necessary.
48 //
CASE STUDY: SPECIALISED SERVICE EXPORTING – GLOBAL SUSTAINABLE ENERGY SOLUTIONS (GSES)
GSES began in 1998 as a consortium of renewable energy systemdesigners and installers. The initial aim was to partner with businesses indeveloping companies, and to become involved in projects within thesecountries. A need was quickly identified for technical training in thedesign, installation and maintenance of systems, and GSES began toexport a training course suitable for small Solar Home Systems (SHS).
The first training course was conducted for Shell Solar in Sri Lanka in1999. The importance of developing local capacity in training wasimmediately recognised in order that a local trainer could continue toconduct training in their own language.
Over the next few years GSES conducted advanced courses in Sri Lanka,funded by the World Bank in stand-alone power systems, grid-connectedsystems and PV water pumping for senior technicians, all with the localtrainer acting as translator. The local trainer has continued to develop hisskills, and since 2001, has trained over 400 technicians who are nowinstalling SHS.
GSES have since expanded, and is now exporting similar training servicesto West Africa, APEC and ASEAN regions and work with a number ofinternational funding organisations.
�
EXPORT MARKETS
PV pumping system,Solomon Islands

THE AUSTRALIAN PHOTOVOLTAIC INDUSTRY ROADMAP 49 //
Market opportunities in developing countries
It is estimated that 2 billion people in developing countries do not have access toelectricity. To supply the minimum off-grid electrification using PV will require at least19,000 MWp1. PV systems can supply power to meet the needs of:
� Water pumping systems (potable water, irrigation and stock watering).
� Rural education (e.g. schools).
� Health care (e.g. health centres, vaccine refrigeration).
� Telecommunications (mobile phone networks, radiophones, satellite links).
� Solar Home Systems (SHS – lighting, TV, radio, refrigeration, ventilation).
� Local enterprise development (power for small factories, shops and light industry).
� Community Centres (village meeting halls, religious centres, municipal halls, clubs, cinemas).
� Sports facilities (lighting, audio visual, ventilation).
� Outdoor lighting & signage.
There are also traditional industrial opportunities for PV, such as large-scaletelecommunications, marine-based navigation systems, traffic and other exteriorsignage, street lighting, monitoring systems, signalling systems, parking meters,cathodic protection, end-of-grid strengthening, and UPS systems.
Australia has developed world-leading expertise in PV products and systems for off-gridpower supply, and manufactures some of the world’s most robust and reliablecomponents for these applications, which are suitable for all the markets describedabove. Indeed, there are a number of Australian firms which are already accessing avariety of export markets, such as Solar Sales, Solar Energy Systems, Alternative EnergySystems, BP Solar Australia, Power Solutions Australia, Selectronics, Latronics, GlobalSustainable Energy Solutions, and SMEC.
Asia represents by far the largest potential market for PV applications, and the demandfor SHS represents a major market development opportunity PV. Figure 6.1 shows themarket potential for PV SPS applications in developing countries, by region. Theenormous rural populations in Asia (particularly China and India) represent significantmarkets for stand-alone PV, and the expansion of this market is being assisted by majorprograms being undertaken in a number of countries by multilateral and bilateralorganisations. Figure 6.2 illustrates the market potential for PV systems in developingcountries, by application.
Figure 6.1 Market potential for stand-alone PV systems in the developing world, by regionSource: EPIA, 2003
Figure 6.2 Market potential for stand-alone PV systems in the developing world, by applicationSource: EPIA, 2003
Household electrificationCommunicationsHealth careEducationWater pumping
11%
6%4%
54%
25%
0
1,000
2,000
3,000
4,000
5,000
6,000
7,000
Potential PV peak power (MWp)
Centra
l Ameri
ca
& Carr
ibbea
n
South
America
North A
frica
Sahara
n Afric
a
Sub-Sah
aran A
frica
South
Africa
Middle
East
South
Asia
Centra
l Asia
East
Asia
Household electrificationCommunicationsHealth careEducationWater pumping

Significant market opportunities also exist for grid-connected PV systems. There arethree main applications for grid connected systems:
� Large central systems that will add capacity to the existing supply system.
� Grid distributed on residential and commercial buildings.
� Grid distributed with battery storage.
The third application is suitable for areas where the existing grid is ‘weak’ andblackouts or ‘brownouts’ are common. For instance, PV grid-connected systems withbattery storage are increasingly common in certain regions of India, and there areincreasing numbers of commercial, industrial and domestic premises connected to PV-powered UPS systems.
Specific market opportunities for Australia
China has 900 million people living in rural China, of which 10 per cent are withoutaccess to modern energy services. To meet this need a number of initiatives have beenintroduced. These include: the Brightness Program, which plans to provide electricity for23 million people in rural and remote regions by 2010 (2000 villages, 2 million homes);the Township project – ‘Song Dian Dao Xiang’, which will electrify 1061 townships –378 with small hydro, 666 with PV, 17 with PV-Wind hybrids. The total PV capacity fromthese programs alone is anticipated to be 20 MW. In early 2004 the Governmentannounced that they will spend US1.2 billion on PV over the next 5 years2. There arealready relationships being built between Australian and Chinese organisations, such asthe DSC co-development programme between the Chinese Academy of Science and STI.
As in most developing countries, the ASEAN market has historically been dominated byaid projects. In the 1990’s this region was led by Indonesia with many multilateral andbilateral programs. Sukatani was the first village to be ‘electrified’ with PV-poweredSolar Home Systems in Indonesia, and this provided the example and impetus for PVdevelopment in other developing countries in the region3. After some years of littleinvestment, PV electrification projects are again being developed by agencies such asthe World Bank.
The Philippines has a long history of aid-sponsored PV systems, beginning withGerman programs to electrify islands and remote communities with PV in the 1980s. Alarge $36 million partly Australian-funded project (MSIP) was undertaken in 1998/2000to provide institutional power (schools, health clinics, hospitals, village meeting halls,water pumping, street lighting) for some 400 villages mainly in the Central Visayas.
Today, there are a number of bilateral programs underway, as well as a large PVelectrification project funded by the World Bank4.
Thailand: BP Solar recently announced a US$20 million contract to supply PV powerproducts and services to Thailand-based Solartron Co Ltd.5 The products and serviceswill be used by Solartron in the construction of PV power systems for the government-funded Mega Rural Electrification Project, which will provide light to 120,000 homes.
The Government of Thailand has announced that it will increase their share ofrenewable energy from the present 0.5 per cent to 8 per cent by 2008. This will includePV with a PV grid-connect bill being passed in 2003.
In India, a country-wide PV program has been implemented by the Ministry of Non-Conventional Energy Sources (MNES) for about last two decades. The Program is aimedat developing the cost effective PV technology and its applications for large-scalediffusion in different sectors, especially in rural and remote areas. Major components ofPV program include R&D, Demonstration and Utilisation, Testing & Standardisation,Industrial and Promotional activities6.
There are about 80,000 unelectrified villages in India. Of these, about 18,000 villagescannot be electrified through extension of the conventional grid. The objective of theMNES village electrification program is to electrify all these villages through renewableenergy sources by the year 2012. A target for electrifying 5,000 such villages has beenfixed for the Tenth Plan period. Figure 6.3 shows the use of modules by market sector in India.
In addition, MNES is implementing two major schemes for deployment of stand-alonePV systems in the country. One scheme deals with demonstration and utilisation oflighting systems, off-grid power plants and other specialised systems; the other schemedeals with deployment.
Approximately 75 per cent of the 15 million rural households in Bangladesh are notconnected to the grid7. There is currently a World Bank program to electrify 700,000systems by the grid and 64,000 rural households with solar home systems.
EXPORT MARKETS
50 //

THE AUSTRALIAN PHOTOVOLTAIC INDUSTRY ROADMAP 51 //
The Asian Development Bank (ADB) has a new renewable energy development projectin Pakistan8. In Pakistan only 50 per cent of the population has access to electricity,and the remaining 50 per cent of the population without electricity live in rural andmountainous areas. Because of the remoteness and rough terrain, the extension of thenational grid to these areas is uneconomical. The ADB reports that development ofrenewable energy sources is environmentally friendly and will provide electricity to theremote areas and less-developed regions of the country. This will create jobopportunities and will be an instrument in providing input for poverty alleviation.
Figure 6.3 Use of modules by market sector in IndiaSource: MNES, 2004
The Pacific region includes many of the world’s communities that are most at riskfrom catastrophic events caused by climate change. Australia is already heavily involvedwith assisting Pacific Island nations with solving security issues offering strategic‘policing’, administrative and accounting assistance (for instance, in East Timor, SolomonIslands, PNG, Nauru). Many of these nations are extremely oil dependent, and this,together with rising oil prices and falling export earnings is further threatening theireconomic and political stability. This presents an opportunity for energy efficiency andrenewables to help ‘wean’ these countries off their oil dependence.
In other regions of the world, there are other PV programs that Australian companiescan access:
� The government in South Africa is to provide 40,000 PV systems to rural areas aspart of its electrification program, with funding from the German development bankKfW. International interested bidders were invited to submit applications to providethe solar home systems in Eastern Cape and North West.
� Morocco’s energy minister, Mohamed Boutaleb, has stated that solar energy inrural electrification will be increased by up to 10 per cent by 2007–08, comparedwith the current contribution of 3 per cent.
Market opportunities in industrialised countriesJapan, Germany and the USA have all had PV rebate programs for many years and morecountries are developing or planning new programs. These markets will continue togrow in coming years and provide opportunities for the Australian Industry.
The USA is covered by an Australian bilateral agreement, and additionally by theClimate Action Partnership and the proposed Free Trade Agreement. These mechanismsfacilitate the importation of Australian skills, services and products into the US market.There are enormous potential market opportunities for PV in the US today, facilitatedprimarily by:
� State-based renewable energy targets, backed by substantial support programs andfinancial incentives (Appendix 6 lists each of these programs by State).
� High awareness of renewable energy products and services across sectors.
� Long history of using PV systems in particularly off-grid application, but also tenyears’ experience with grid-tied PV systems.
� Substantial R&D funding for PV, provided to the National Renewable EnergyLaboratory (NREL) as well as to other national research institutes.
Exports 46
Others 16.8
Telecom 16.3
Powerplant 3.8
Pump 6.6
Street light 3.5
Home light 9.1 Lantern 4.9
CASE STUDY: PLASMATRONICS – MANUFACTURERS AND EXPORTERS
Melbourne based company, Plasmatronics, designs and manufactures robustelectronic regulating and metering devices for PV power systems. Currently, directexports comprise 40 per cent of their sales. Components are exported to Europe andSingapore, and installed in Middle Eastern countries, China, South-East Asia, SouthAmerica and through UN projects in Northern Africa.
�

Leveraging Australia’s aid programsAustralia, through AusAID, delivers our aid priorities. AusAID advises the Governmenton development policy and manages Australian development cooperation programsfocussed on achieving broad-based growth, stability and effective governance,particularly in our region9. The aid program’s objective is to advance Australia’s nationalinterest by assisting developing countries to reduce poverty and achieve sustainabledevelopment. Just as Germany’s development agency GTZ, the UK-OverseasDevelopment Agency, the European Union and other major donor countries incorporaterenewable energy technologies in the delivery of these objectives, so can Australia.Indeed, AidAID has already done so previously in programs in the Philippines, Indonesiaand Papua New Guinea. It has aid programs with all the countries in the Asia Pacificregion, and many of these lend themselves to utilising PV systems, in applications asdescribed above.
An opportunity needs to be created to develop the role of PV in the delivery ofAustralia’s strategic aid programs. In Indonesia, for example, Australia is working withthe Indonesian Ministry of Health and the World Bank to provide water and sanitation tolow-income communities, in West and East Java, West Nusa Tenggara, West and SouthSumatra, and Bangka Belitung and South Sulawesi.10 This will be achieved throughimproving the health behaviour and health services related to water borne diseases ofthe communities; providing safe, adequate, cost-effective, and easily accessible watersupply and sanitation services; and developing sustainability and effectiveness throughcommunity participation. PV could play a role in the delivery of health services, potablewater supplies in particular – but it needs to be allowed to compete in the project bybeing recognised as an appropriate delivery mechanism from the project informationdocument through to the tender specifications.
There are other programs under development within Australia’s aid program which couldoffer similar opportunities for PV.
Opportunities to access international programs
REEEPAustralia is investigating joining the Renewable Energy and Energy EfficiencyPartnership (REEEP).11 REEEP is a coalition of governments, businesses andorganisations committed to accelerating the development of renewable and energyefficiency systems. On April 28th, the United States joined REEEP, which is led by theUnited Kingdom.
Initiated at the Johannesburg World Summit on Sustainable Development (WSSD) inAugust 2002 by the UK Government, REEEP provides a framework within whichgovernments work together to meet their own sustainable energy objectives accordingto their own timetables. REEEP seeks to accelerate and expand the development ofrenewable energy and energy efficiency systems in economies and in energy portfolios.REEEP recognises that these sustainable energy systems can address the key challengesof sustainable development, notably improving energy security, fostering economicdevelopment, and greater social equity whilst reducing the environmental impact ofenergy consumption and production.
If Australia does join REEEP, it will facilitate:
� Australian companies further access to projects under tender.
� Australia to have government and/or industry representatives on the main Boards.
� Potentially host the Secretariat for Oceania (in itself bringing more exportopportunities).
International Energy Agency Implementing AgreementsAustralia is signatory to over 20 collaborative R&D Agreements, eight of which are onrenewable energy technologies. These include the Photovoltaic Power SystemsProgramme (PVPS), established in 1992.12
The objectives of PVPS are to:
� Contribute to the cost reduction of the PV power systems applications.
� Increase the awareness of the potential and value of PV power systems.
� Foster their market deployment by removing technical and non-technical barriers.
� Enhance technology cooperation with non-IEA countries.
EXPORT MARKETS
52 //

THE AUSTRALIAN PHOTOVOLTAIC INDUSTRY ROADMAP 53 //
These objectives fit well with Australia’s PV industry goals, as well as contributing to anunderstanding of the R&D and commercial barriers to the greater deployment of PV forboth stand-alone and grid-connect applications.
Australia has been active in Task I: Information Dissemination; Task III: Stand-alone andIsland Systems; Task 7: PV in the Built Environment (completed 2003); Task 9: PV inDeveloping Countries; and now Task 10: PV for the Urban Environment.
Australia’s participation is through the Australian PVPS Consortium, and is open to anyorganisation upon payment of fees. These fees pay for participation at the internationallevel, as well as partially funding local expertise. Funding to participate in thisinternational collaboration in other countries is typically provided to national experts bynational government support programs, which puts Australia at a disadvantage as itcannot participate at a level which would truly leverage the expertise and internationalcollaboration opportunities provided by the other 20 countries participating in PVPS. InTask 9, there are significant international trade opportunities which could be more fullyleveraged as well.13
Other international opportunitiesIn addition to the above opportunities, a number of other initiatives have commenced inrecent years to help in the delivery of energy to developing countries. These includeGlobal Village Energy Partnership (GVEP), African Renewable Energy EnterpriseDevelopment (AREED) which was followed by BREED for Brazil, and CREED for China.
How do we increase our PV exports?
Although the Australian PV industry has significant export potential, it faces a number oflocal and overseas challenges that need to be addressed.14
1. Increase access to international aid programs. The majority of industrialisedcountries receive significant assistance from their governments to accessdeveloping country markets. For instance, in the UK two trade promoters arededicated to the renewable energy market, financed through the UK Department forTrade and Industry’s export assistance scheme.15 The German government has justincreased its budget allocation the German aid agency, GTZ, by US$500 million.16
This is primarily to develop renewable energy projects in developing countries. TheUSA has traditionally supported its PV industry through developing internationalmarkets via national organisations such as NREL and others.
2. PV to be included in Australian Aid projects, as appropriate. Most othercountries recognise that health care, education, local development and otherdevelopment objectives are facilitated by the provision of cost-effective local energysupply options. In many cases, this energy can be supplied by PV systems, withapplications identified under technical assistance contracts, and services/systemsput out to tender (including local training and system support services). Somecountries have tied-aid, but most have open tendering systems. The difference toAustralia is that they allow renewable energy systems to play a key role asappropriate in delivering their development objectives.
3. Assistance to utilise bilateral agreements. There are a number of opportunitieswhich the Australian government is providing already through the development ofbilateral Agreements. These need to be explored for the ways in which these canassist the Australian PV industry.
One of the mechanisms already being developed is under the ‘Climate Action Partnership’(CAP) in the USA. As a result of an industry mission to the USA in May 2004, agreementhas been reached between the Australian Business Council for Sustainable Energy(BCSE) and the US Department of Energy (DOE) to develop the following:
� An Australian RE trade mission in August 2004 to NREL and the World RenewableEnergy Congress.
� This mission will be followed by a senior delegation of USA RE delegates to theWorld Energy Congress in Sydney (September 2004), which will facilitate furtherdiscussions between USA and Australian officials and organisations involved in the CAP.
Railway signalling, regional Victoria

� There is support for a trade mission of USA industry, led by the US-BCSE, to come toMelbourne to participate in the Australian BCSE’s Annual Conference in April 2005.
� There is agreement to work to increase Australia’s expertise in Building IntegratedPV through collaboration between experts in the USA and Australia over and aboveparticipation in the IEA PVPS Task 10: PV for the Urban Environment.
� Undertaking collaborative analysis on the role of renewable energy for peak powerdeployment on the grid and the value of avoiding costs associated with buildingother forms of peaking plant.
There are also significant opportunities to be explored within the European Union, toaccess their collaborative energy Research, Development and Demonstration programsunder the Sixth Framework. Through this Agreement Australian companies are alreadyable to participate in these programs, but are unable to receive any EU funding for theirparticipation (unlike EU-based organisations). The funding for participation at presenthas to come from the Australian organisations themselves (indeed CSIRO isparticipating in just such a project, with their own funding). Funding for Australian R, D & D projects could be linked to the Calls for Proposals and topics under Framework6, in order to leverage the millions which are allocated each round to renewable energyand energy efficiency projects.
4. Facilitate greater participation in international collaborative programs – this includes more comprehensive participation in the IEA PVPS activities, as well as accessing the collaborative R, D & D programs of the European Commission. This includes additional resources to compliment existing industry self-funding.
5. Assistance to become more ‘export savvy’ – AREEN undertook a series ofExporter Seminars around Australia in June 2004. These were primarily forrenewable energy companies who wish to increase their export expertise. AREENneeds to be strengthened to allow for a full-time person seconded from industry to:
� Develop, coordinate and run export training for PV companies.
� Provide international market information to the Australian renewable energyindustry.
� Raise the profile of the Australian renewable energy industry internationally,
� Liaise with industry in Australia and promote their products, services and expertiseoverseas (on an Australian not company-specific basis).
� Represent the Australian PV and/or renewable energy industry at trade shows.conferences and exhibitions overseas, and particularly in the main identified targetregion of Asia.
� Keep the industry informed on all the initiatives being developed globally that willbenefit the deployment of PV systems.
� Undertake market research on target markets, as well as on AREEN member needs.
EXPORT MARKETS
54 //
PV water pumping, Western Australia

THE AUSTRALIAN PHOTOVOLTAIC INDUSTRY ROADMAP 55 //
7// THE WAY FORWARD FOR THE AUSTRALIAN PV INDUSTRYThis Chapter provides an industry development framework for the PV industry and setsout how industry and government can work together to achieve the ‘Sunrise vision’outlined in Chapter 5. This development framework is supported by a detailed analysisof barriers that currently exist to industry growth which have been identified by industrytogether with proposed solutions, and are outlined in more detail in Appendix 7.
Key points� The global PV industry is expanding rapidly and Australia has well
established, and globally recognised strengths and capabilities in thisgrowing market, developed over the last thirty years.
� The PV industry has responded convincingly to government initiatives todate, with over 1100 people currently employed in the industry, and annualsales of over $200 million, more than half of which result from exports.
� The Australian industry is at the crossroads: whilst making great stridesover the last 10 years in reducing installed costs, the PV industry is stillrelatively immature and will continue to rely on government support tofurther reduce costs and improve market penetration.
� Countries like Japan, Germany and the USA have implemented aggressivepolicies to underpin the continued growth and development of PV in theircountries. This will mean that costs will continue to fall internationally and inAustralia.
� The real challenge for Australia is to determine whether this is an industrythat is worthy of continued support and whether the benefits to theAustralian economy are worth the continued investment by government andthe community.
� A significant component of this investment is a commitment to address ormake-good the impediments in energy markets that prevent the benefits ofPV being recognised and rewarded.
� The ‘Sunrise vision’ for the industry, of 350 MW installed capacity by 2010and 6,740 MW by 2020, requires a long-term policy framework fromgovernment that will underpin continued investment by industry.
� This will deliver considerable benefits to the Australian community by 2020,such as installed capacity of 6,740 MW, PV sector jobs of 31,600, revenuesof $5,160 million annually and nearly 10 million tonnes of CO2 avoided perannum.
� A broad policy framework is required from government that involvesmeasures that cover market stimulation, removing regulatory barriers and building industry capacity and capability. In relation to specific PVmarket sectors the following programs have been developed to support the above targets:– 150,000 roof-top program for the grid-connected market, the key feature
being the introduction of feed-in tariffs that recognise the benefits thatare provided by PV which go unrecognised in the market.
– diesel replacement program, the key feature being the ability of PV tointernalise a competitive cost advantage with diesel that includes excise.
– export market program that aims to build the export capability ofAustralian businesses and develop market opportunities for thesebusinesses.
� Industry for its part is prepared to continue to invest in the manufacturing,distribution, marketing, training and other infrastructure, as well ascontinued research, development and commercialisation to support therealisation of the vision.
The PV industry is growing internationally to be a significant global industry. Awarenessof the technology benefits is increasing, as innovative international governmentprograms take effect. This in turn results in industry development and a significantincrease in installed capacity. Accordingly, the cost of PV technology is continuing tofall. The global market has been doubling in size every two and a half years; PV modulecosts are currently falling by 18 per cent with every doubling of capacity.
The global PV industry includes new manufacturing capacity located in countries thatactively support PV and have growing local markets. In addition, the emphasis forapplication of PV in recent years has shifted internationally from off-grid to grid-connected markets.
Australia is currently at a crossroads in terms of its participation in this global market. Ithas built up considerable expertise in PV over several decades and currently holds aposition of some leadership internationally, particularly in the field of off-grid systems.
The issue for the Australian PV industry today is that there is enormous potential asidentified throughout this document. This potential has been built through a naturalcompetitiveness in Australian research and development, industry investment andgovernment policy support. Despite growth to date, the industry is not yet self-sustaining and advantages gained to date could be lost. The PV industry cannot continueto actively invest in industry development if the Australian government is not fullycommitted to the journey.

The industry has identified its strengths and necessary developments in technology andmarkets, but requires support and assistance to bridge the current commercial gap andincrease its positioning in the international market.
A strategic industry development framework is now required for Australia to leveragehistorical expertise and develop a growing domestic market, with associated benefitsinto the future. Global growth in the PV industry and resulting cost reductions willcontinue with or without Australian participation. The absence of a strategic industrydevelopment framework will see Australia as a net importer of PV systems andcomponents, thus losing local jobs and investment in manufacture and systemsdevelopment.
During the consultation process outlined in Chapter 1, Australian industry identified‘Sunrise’ targets for PV market expansion for 2010 and 2020 that is has the capability todeliver in cooperation with government. Investment of the Australian public’s funds inthe PV industry will provide significant returns. The main industry objective is to meetan installed capacity of 6,740 MW by 2020, which will result in PV sector jobs of31,600, revenue of $5,160 million annually and nearly 10 million tonnes of CO2 ofavoided in 2020. This is illustrated in Table 7.1.
Table 7.1 Sunrise targets
Australian PV industry 2003 actual 2010 2020
Installed Capacity (MW) 46 350 6,740
Employment 1000 5,290 31,600
Local sales revenue ($ million) 185 786 4,178
PV sector exports revenue ($ million) 19 444 2,438
CO2 abated in year (‘000 tonnes) 65 490 9,320
In 2003, there was 46 MW of PV capacity installed in Australia, with over 1,100 peopleare employed in the industry, and annual revenues of more than $200 million aregenerated.
Strategic domestic industry development activity by both Australian industry andgovernment to deliver industry’s full capability, as outlined in the ‘Sunrise targets’ candeliver a vibrant, billion-dollar PV industry in Australia by 2010. This industry woulddeliver a broad range of benefits to the Australian community, including:
� Continued growth in exports.
� Significant increase in local jobs and investments.
� Considerable long-term reductions in Australia’s greenhouse emissions.
� Offsetting large investments in electricity networks, particularly as a result of peakdemand constraints.
� Reduction in transmission and distribution.
� Improved security of supply as a result of a more distributed electricity system.
The Sunrise modelling identified the grid-connect market as the way for the PV industryto exponentially expand and become cost competitive. Off-grid applications, many ofwhich can be already cost competitive, will continue to grow but at a lower rate.
Figure 7.1 presents the results of the scenario modelling, and shows that the price of PVelectricity for residential dwellings will become competitive with grid-suppliedelectricity by 2020, as detailed in Chapter 5 and Appendix 4. The underlying powerprices against which PV competes are expected to grow at a faster rate than theConsumer Price Index, due to rising peak power demands, which will mean that peakprices will rise at a much faster rate average prices.
Figure 7.1 Prices of PV-generated & grid-supplied electricity for residential dwellings in AustraliaSource: Historical data and scenario modelling for the PV Roadmap
0.00
0.10
0.20
0.30
0.40
0.50
0.60
0.70
0.80
2000
2002
2004
2006
2008
2010
2012
2014
2016
2018
2020
2022
2024
2026
2028
2030
Comparativeelectricity prices
Distributed Grid-con PV LEC ($/kWh)
Retail electricity price(4% pa increase) $/kWh
[ ] Prices of PV-Generated & Grid-Supplied Electricity for Residential Dwellings in Australia[ ] Prices of PV-Generated & Grid-Supplied Electricity for Residential Dwellings in Australia
[For the above graph – remove lines for 2, 3 and 5 as ordered in the legend][For the above graph – remove lines for 2, 3 and 5 as ordered in the legend]
THE WAY FORWARD FOR THE AUSTRALIAN PV INDUSTRY
56 //

THE AUSTRALIAN PHOTOVOLTAIC INDUSTRY ROADMAP 57 //
Between 2004 and 2020, industry development policy approaches are required tosupport Australia’s emerging PV industry, in order to deliver competitive prices and thebenefits listed above well into the future. This is represented pictorially in Figure 7.2below, whereby a strategic government industry development policy framework wouldsupport investments by industry and sustain industry growth. In other words, ‘keep theball rolling’. This would also result in increased installed capacity, and ensure thatAustralian industry can deliver competitive prices and therefore associated benefits wellinto the future. Such long-term price reductions for PV would allow greater communityaccess to these benefits.
Figure 7.2 Outcomes of strategic industry development policySource: Adapted from Kurokawa and Aratani, 2004 1
To be effective, industry development must be based on sound policy principles thatdeliver sustainable growth. For the Australian PV industry these principles include the following:
� Clear and transparent policy development processes.
� Building a significant market demand for PV in Australia.
� Long-term certainty to underpin new investment and cost reductions.
� Stimulus to drive continuous innovation in technology, financing, applications and marketing.
� Providing a level playing field for competing technologies.
� Appropriate market decision making by informed stakeholders in the economy.
A successful strategy could be based upon an industry-government ‘covenant’, withlong-term commitments to key industry development outcomes. This more formalisedtype of relationship has been developed for the solar industry in the Netherlands, andcan be seen to be akin to previous Australian Government industry strategies such asthe Steel Industry Plan, Motor Vehicle Plan or the Clothing and Textile Plan. Such anapproach would create the mutually-supportive framework necessary to deliversustainable industry growth and a competitive industry.
Strategic policyframework, industrydevelopment
Long term costreductions andcontinuing benefits
Systemprices
Time20202004
46 MW
350 MW
6,740 MW
CASE STUDY: JAPAN
Japan has invested heavily in PV to build a strong, sustainable industry withJapanese companies producing 46 per cent of the global PV cell production.2
The government established the Sunshine Project in 1974. This requiredconsiderable government and industry investments to stimulate market uptake andto drive prices down. Figure 7.3 clearly shows how installed costs have fallendramatically over the 10 years from 1993 as the installed capacity has grown. Oncethe market was on its way subsidies have been slowly reduced as the industrystarts to stand on its own with solid growth. Figure 7.4 shows the progressivereduction in government support to 1999 as increases in installed capacity havedriven down installed costs.
The Japanese strategy was to invest heavily in supporting cell and moduletechnological development and manufacturing. In 1994, government subsidies wereat $15,000/kW, when the average system price was $33,000 – meeting around 50per cent of the cost of a system. Over time system prices have halved and thegovernment subsidy is closer to $3000/kW.
Japan has the strongest government support for PV worldwide. It therefore is notsurprising that by the end of 2003 Japan accounted for nearly half of global PV cellmanufacturing. The Japanese government spent US$223 million in 2003 to supportPV, and a further US$412 million was allocated to new energy entrepreneur supportprograms for regional introduction of new energy. Most of this funding providesincentives and support for residential customer installations. Specifically, the NewEnergy Foundation under the Ministry of Economy, Trade, and Industry (METI) nowprovides ¥90,000 per kW ($820 per kW) as a subsidy for residential installationssmaller than 10 kW. Subsidies have been reduced as prices have fallen since the
�

CASE STUDY: JAPAN CONTINUED
program started in 1993, and will eventually be phased out as PV becomes costcompetitive with other electricity generation technologies.3 In addition to national-level support, local governments also provide a wide range of incentives ($80 to$1,800 per kW plus low-interest loans). The result is average incentives of morethan $1,100 per kW installed and interest rates below 3 per cent. These incentivesand support lower the average cost of PV power generation from $0.36 to $0.32 per kWh.4
Japanese targets for PV are 4820 MW by 2010, and 100 GW cumulative installedcapacity by 2030.5 Japan is aiming to halve installation costs by 2010.
Figure 7.3 Growing the Japanese PV industrySource: METI, 2004
Japan’s policy for New and Renewable Energy Promotion has five major components:
� R, D&D (cost reduction, output stability).
� Support for introduction (by the business sector, for residential PV systems, and support for NGO promotional activities).
� Support for promotion of RE in Regional Governments (support for developing newenergy vision, and promotion of RE by regional governments).
� Voluntary action by private sector to purchase Renewable Energy Electricity (RECs,voluntary actions by power companies to purchase RE electricity).
� Renewable Portfolio Standard System (obligation rests with the electricity suppliers).6
Figure 7.4 Japanese government support for PVSource: Mitsuru Takeshita, 2003
0
10000
20000
30000
40000
50000
60000
1994 1995 1996 1997 1998 1999
Capacity installed(kW)
2000
4000
6000
8000
10000
12000
14000
Incentive(A$/kW)
kW Incentive
0
500
1000
1500
2000
2500
3000
3500
4000
1993 1994 1995 1996 1997 1998 1999 2000 2001 2002
Installed cost yen/kW
0
100
200
300
400
500
600
700
Installed capacity (MW)
Installed cost (yen/kW)
Installed capacity (MW)
�
THE WAY FORWARD FOR THE AUSTRALIAN PV INDUSTRY
58 //

THE AUSTRALIAN PHOTOVOLTAIC INDUSTRY ROADMAP 59 //
Industry development policy framework
To date, investment in the PV industry by the Australian Government has driven thefollowing investment in the PV industry by the private sector:
� Investment of more that $150 million in research and development, much of it in thepast three years.
� Investment in additional manufacturing facilities and creation of new jobs.
� Development of export markets, in the face of strong competition from countriesthat have access to flexibility mechanisms such as the Clean DevelopmentMechanism (CDM) and supported by aid budgets.
� Continued improvement and development of Standards, training and accreditation.
� Development and expansion of distribution and marketing channels.
� Development and expansion of education and training facilities.
� Promotion and demonstration of the benefits of PV through programs and activitiessuch as Solar House Day.
� Funding studies and research into the unquantified and unrewarded network andelectricity system benefits of PV.
� Participation in international collaborative programs such as the InternationalEnergy Agency PVPS program.
� Supporting the BCSE as an industry association to build industry capacity andcapability.
Further delivery of innovation and investment by the industry is detailed in Chapter 8.
Government rebate programs have provided much of the continued local marketstimulation. The Photovoltaic Rebate Program (PVRP) in particular has created growth ingrid-connected PV capacity in Australia in recent years. This program is currently due tobe complete in the financial year 2004/05. But where do we go from here?
A stable, long-term and transparent policy framework is needed for industry to have theconfidence to make significant investments across the PV sector supply chain. This willrequire a policy framework that involves the following strategic elements:
Market stimulation – this addresses specific market failures that prevent the benefitsthat PV provide being adequately recognised or rewarded. Market stimulation underpinsincreased demand by bridging the current cost gap in the key PV markets both on andoff-grid. Strategies include feed-in tariffs, enhancing MRET or other mechanisms toreward low emission generation, effective building codes and standards, credits fornetwork benefits, supporting diesel replacement, grants and rebates and strategicmarket development.
Removal of regulatory barriers – this addresses electricity market failures that resultin increased installation costs and delays arising from metering, connection and pricingarrangements.
Building industry capacity and capability – this includes supporting industrydevelopment activities that build local industry capacity and includes support for localmanufacture, exports, innovation, training and education.
The Australian PV industry has identified that, to reach its initial Sunrise target of 350MW of installed capacity by 2010, it requires policy support to bridge the cost-competitive gap so that the cost paid by grid-connected consumers effectively reducesfrom $12,000 at present ($8,000 after PVRP) to $5,000 per kW by 2010. Stimulation ofthe grid-connect market will have flow-on benefits to the off-grid market.
The cost at $5,000 per installed kilowatt has been identified by the industry as animportant benchmark that brings PV within the range of competitiveness. While still atthe high end of competitiveness $5,000/kW should be sufficient to enable the large-scale uptake of PV, particularly in the grid-connect market. It will still require significantinvestment in marketing and promotion by the industry. However, the industry is preparedto undertake this investment, if supported by a long-term industry development framework.
PV has enormous potential in Australia across a range of applications and activities. The 350 MW installed capacity target under the industry’s ‘Sunrise vision’ comprises thesector projections in Table 7.2.
PV street lighting,Mornington

Table 7.2 – ‘Sunrise 350’ projections by market sector
Installed capacity (MW) 2003 SunriseBy application sector actual 2010
Off-grid domestic
Remote households, holiday homes, pastoral stations, isolated communities (indigenous), fringe-grid 13.5 MW 44 MW
Off-grid non-domestic
Telecoms, water pumping, signalling, cathodic protection, electric fences, street lights, tourist facilities 20 MW 94 MW
Off-grid mini-grids
Isolated communities (mines), public generation 6.0 MW 12 MW
Grid-connected distributed
Residential rooftops, commercial BIPV 4.5 MW 163 MW
Grid-connected centralised
Network strengthening, bulk power 1.4 MW 38 MW
Consumer devices
Small portable electronic devices 0.2 MW 1 MW
TOTAL 46 MW 350 MW
PV industry activity frameworkTo deliver the ‘Sunrise vision’ for 2010 requires specific ‘joined-up’ actions and activitiesby both industry and government. The policy framework required by government is setout below in relation to specific PV market sectors. This identifies a comprehensiveapproach that considers market stimulation, addresses impediments and builds industrycapacity and capability.
For its part, Australia’s PV industry will continue to build on and leverage its investmentto date. Specific actions for industry are listed below and a more comprehensivecoverage of the research, development and innovation activities and opportunities areset out in Chapter 8.
1. Continue to drive installed system costs downwards through:� Investing in the expansion of manufacturing facilities, including modules and
balance of systems components.
� Investing in improved manufacturing, logistics and resourcing processes.
� Improve component standardisation (and product standardisation whereappropriate) so as to reduce unit costs.
� Continued investment in research and development to improve systemperformance and lower cost per kWh of system output.
� Developing new products and installation methods for both existing and new markets.
� Increasing the efficiency of the supply chain to bring services to customers inmore timely and cost-effective manner.
� Develop innovative financing approaches that reduce the effective cost tocustomers.
� Develop synergies with other industry sectors such as building and construction(particularly new buildings), electricity distribution businesses with regard to network strengthening and connection, as well as infrastructure owners and operators.
� Develop innovative and flexible supply channels, including through establishedindustries, to access new and expanding market segments.
� Improved system packaging and integration to deliver lower installed costs.
2. Continue to improve quality, reliability and performance of PV systems� Continue the development of Standards, training and accreditation of designers
and installers of PV systems.
� Continue investment in expanding and extending system and component testing.
� Continue to invest in development of process and control equipment to optimisesystem performance.
� Continue to improve after sales-service availability and costs.
3. Continue to expand and develop markets and applications for PV� Continue to differentiate service provided by PV from alternative fossil fuel
generation.
� Continue work on promotion of the benefits that PV delivers and seeking to getthese recognised and rewarded in the market.
� Increase marketing, consumer awareness-building and education.
� Undertake extensive promotion and training within the building industry and trades.
� Seek out higher value markets that provide a premium by recognising aesthetics,reliability and security of supply.
� Develop product solutions that are valued by different market sectors, e.g. building integrated PV systems, new and improved industrial applications,transport market solutions, etc.
� Partner with existing industries and supply chains, to streamline marketing and
THE WAY FORWARD FOR THE AUSTRALIAN PV INDUSTRY
60 //

THE AUSTRALIAN PHOTOVOLTAIC INDUSTRY ROADMAP 61 //
supply and to develop products and energy solutions for new markets.
� Support trade initiatives and the further development of channels and markets overseas.
� Continue to develop export markets for Australian-made components, systemsand services.
4. Support industry capacity building� Continue support for development of training and education infrastructures.
� Increase international collaboration on research and development, marketdevelopment and Standards.
� Undertake regular market surveys to ascertain customer requirements forproducts and services.
Proposed Government PV policy frameworkTo support industry’s actions, the following policy roadmap provides government with aportfolio approach for sustainable industry development policy mechanisms that delivermultiple benefits to both the PV industry and the Australian community more broadly.This will consolidate Australia’s international competitiveness, promote innovation andinvestment and increase the range of economic and social benefits which PV candeliver.
The policy framework is set out in two steps: the first step is the broad-based industrydevelopment and energy market initiatives that are required to establish an overallenergy market framework that facilitates the development of the PV industry. Step 2involves a suite of measures that focus on the three specific PV markets: grid-connect,off-grid and exports. With the input and support of the PV industry, these will stimulatethe particular market segment and address the impediments that are preventing the fullpotential of PV being realised.
Step 1 — Broad-based industry development initiativesThis step considers the broader energy market initiatives that are required to buildindustry capacity and capability. The initiatives in this first step are set out below.
Greenhouse price signalThe introduction of a greenhouse price signal into the electricity sector would ensurethat investment, purchasing and operating decisions would internalise the cost ofgreenhouse gas emissions. This would also recognise the greenhouse benefits ofinstalling PV rather than being achieved by emission-intensive coal-fired powergeneration.
Carbon dioxide has been projected by the Australian Greenhouse Office7 to be priced atbetween $8 and $13 per MWh of generation. The NSW Benchmark Scheme currentlyprices carbon at $10.50. In addition, carbon products currently trading in the Europeanemissions trading market have been priced at 9.75 Euro (or roughly $17.00) per tonne of C02.
The reduction of greenhouse emission is an important priority for governments. But untilthe cost is incorporated into the energy market, the benefit that PV provides in thisregard fails to get recognised.
Changes to make MRET more effective as an industry development initiativeOne particular hurdle to the uptake of PV is high up-front cost of capital. As an industrydevelopment scheme, the Mandatory Renewable Energy Target (MRET) addresses thisissue for PV with provisions for ‘deeming’ Renewable Energy Certificates (RECs) to theamount of electricity offset over a given period, and making these available upfront atthe time of purchase. However, the current five year deeming provisions within MREThave not effectively increased uptake of PV and can be improved by making thefollowing changes:
� RECs equivalent to a minimum of 20 years of deemed production to be available ‘upfront’ compared with five years at present. This lines up with the current 20 yearplus guarantees from PV module suppliers; to the extent that module suppliers areprepared to offer longer guarantees, then this should also be recognised.
� Maximum system size under which deeming provisions to apply to be increasedfrom 10 kW at present to 100 kW.
� Where the deemed REC approach is used, the PV system should be installed by anaccredited system installer. This builds confidence in the ability of the system toperform and deliver on expectations over its lifetime.
� There has also been some consideration of PV being provided with more than oneREC per MWh of generation to recognise the other distributed generation benefitsprovided by PV to the electricity system.

Building industry capacity and capability
Industry development support
Targeted funding programs are important to underpin industry development activities indelivering sustainable industry growth. These activities include developing industrystandards, developing a skilled and accredited workforce, as well as participation ininternational taskforces on industry development. The following programs identify theissue specific programs required:
� Continued development of industry Standards and associated testing programs.
� Continued support for training and accreditation initiatives for systems designersand installers.
� Participation in the International Energy Agency PVPS.
� Industry, community and education outreach programs.
Support for innovation and commercialisation
Continued innovation and commercialisation in the areas of technology, financing,applications and marketing is critical for Australian industry to maintain a competitiveadvantage over time.
Technology areas for innovation include module materials, battery capability for remotepower systems and system optimisation. Application innovation may include uses of PVas a building material and other methods of integration within the urban environment.Innovative financing approaches may become a vital part of market development andprovide greater access opportunities for the community. Innovative marketing strategiesby both government and industry have the potential to enhance and develop greatercommunity understanding of the technology and its related benefits.
Government has a crucial role to play in leveraging strategic research and developmentfunding, including the provision of funding to cover these areas. This should best beadministered by an appropriate organisation that is informed by industry as to itsrequirements.
Step 2 — Sector-specific programsIn addition to the broader energy market and the general industry capacity-buildinginitiatives, specific programs have been identified that focus on the three specific PVmarkets: grid-connect, off-grid and exports. These programs provide a suite of measuresthat will stimulate the particular market segments and address the impediments thatare preventing the full potential of PV being realised.
1. 150,000 Roofs by 2010 program – grid-connect marketThis program consists of five measures geared to the development of the grid-connectmarket so that by 2010 this market has grown to 200 MW installed capacity and thetotal installed PV capacity in Australia has grown to 350 MW. Like other developedcountries, the grid-connect market will drive future growth of Australia’s PV industry. To achieve large-scale deployment, PV systems must be available at $5000 per installedkW to consumers. At this level PV becomes economically viable for customers. At $5000per kW,8 a PV system can be amortised economically over a 25 year mortgage. Theeconomic viability would be achieved by the policy framework delineated below.
The 150,000 rooftop figure is symbolic of capacity and will include systems that aregrid-connected, but not on domestic roofs.
Figure 7.5 outlines the industry development framework by installed cost and systemvolume required to deliver grid-connected PV systems at a competitive cost tocustomers. Note that in the period until 2010, targeted industry development funding isrequired. This could be delivered as targeting strategic markets in order to increaseinstalled volume or via an extended PVRP rebate program.
Figure 7.5 Installed cost reduction curve
RECs with 20 years deemingupfront
Feed in tariff to recognise network benefits
$/kW
5000
Number of rooftops10,000 100,000
Targeted industry development support
THE WAY FORWARD FOR THE AUSTRALIAN PV INDUSTRY
62 //

THE AUSTRALIAN PHOTOVOLTAIC INDUSTRY ROADMAP 63 //
It is important that the work done to provide growth in the grid-connect market bemaintained by extending the existing PV Rebate Program, or an equivalent strategy, untilsuch time as the proposed industry development measures are implemented. Failure todo so will create a hiatus that will cause the industry to stall.
It is also important that all areas of Australia have access to initiatives under thisproposed program. This nationwide approach will enable the market to choose its best locations, and will support accredited installer in regional, as well as metropolitan areas.
Reward network benefits of grid-connect systems through a ‘feed in tariff’
A ‘feed in tariff’ is proposed as the optimum industry development method for the grid-connect market to follow on from PVRP. Feed-in tariffs work by arranging for all PVcustomers to be paid a higher value for electricity that is produced from their PV system.This approach has been demonstrated to be very effective in a number of countries,such as Germany.
The higher value for the electricity fed into the grid reflects the considerable benefitsthat distributed PV systems provide to the electricity distribution system that are notcurrently recognised or rewarded. These include contribution to meeting peak powerrequirements and network integrity and security (for more detailed information onbenefits see Chapter 4).
The additional network value that is provided by PV is priced at $130 to $200 per MWh.This price is higher in regional and end-of-grid areas, and the additional value should bereflected in the final delivered price to the consumer.
The feed-in tariff has the potential to provide long-term market certainty for investmentin the PV industry, and is a transparent market-based mechanism. In addition, it is notsubject to any potential variability or uncertainty in program budgets. Localmanufacturers and suppliers would thus have more certainty to drive investment in theirfacilities.
CASE STUDY: GERMANY – FEED IN LAW AND TARIFFS
The ‘Feed-in Law’ in Germany, which came into effect April, 2000, permitscustomers to receive preferential tariffs for PV-generated electricitydepending on the nature and size of the installation. For ground-mountedsystems, the new tariffs permit up to 45.7 € cents/kWh. PV installations onbuildings receive higher rates of up to 57.4 € cents/kWh. However, the Feed-in Law also requires that the tariff paid for PV electricity is reduced by 5 percent per year, and by 6.5 per cent per annum for ground-mounted systems.The tariffs for approved renewable energy projects are fixed for a 20 yearperiod from the plant commissioning.
Some 20,000 PV systems, yielding an output of about 145 MW, wereinstalled in 2003, almost twice the volume installed in the previous year. With these additions, the total solar electricity capacity in Germany is nowestimated at over 400 MW.9 According to current estimates, the German PVmarket generated total revenues of over € 800 million in 2003.
The German Government provided, through the KfW Bank, loans totalling 1.7 billion euros for the procurement of PV systems under the 100,000 RoofsProgram, which terminated at the end of 2003. Loans are still available, butunder slightly less advantageous conditions. Some German states havesubsidy programs for PV installations that can be used in combination withthe national Feed-in Law.
The German Solar Industry Association (Bsi) expects a growth rate in excessof 50 per cent for the German PV sector during 2004, with sales of over € 1billion, equal to 200 MWp of new installation. The great public interest inphotovoltaics is the result of the new feed-in tariffs introduced at the start ofthe year. The Bsi has forecast that as a result of the current boom, the costsof solar power will drop by 5 per cent per year. Over the past five years,German companies have invested over € 1 billion in solar manufacturingplant. During 2003, over 10,000 people were employed in production,distribution and installation.10
�

Incorporation into Building Codes and Standards A number of state governments are implementing mandatory minimum energyperformance standards for new residential buildings. The Building Sustainability Index(BASIX) which was introduced into NSW on 1 July 2004 will require new residentialhomes to progressively reduce greenhouse emissions so that by 2006 new homes willproduce 40 per cent less emissions that the current NSW average. This provides animportant opportunity for PV to be incorporated into new residential buildings andprovides building developers with a number of options to meet the greenhousereduction requirements.
This model should be developed and rolled out into other states and also rolled out intonew non-residential buildings. States such as Victoria and South Australia haveintroduced minimum five star energy efficiency requirements for new residentialbuildings. At present these schemes do not give credit to customers who install PV, butthere is potential for this to occur in the future.
All energy performance schemes should appropriately recognise and reward thecontribution of PV systems to electricity supply for the building envelope.
Support for market developmentTargeted programs are important to underpin community acceptance and understandingof PV and to support industry development. In the case of the grid-connect market theseactivities could include:
� Improving the visibility of PV in the built environment through an expansion of solarschools programs, and this extending to other government and community facilities.
� New government and public buildings to be required to consider PV integrated withenergy efficiency measures in the design phase.
� Support outreach education programs to highlight the benefits of PV including thefurther development of curriculum materials for schools.
� Support the development of iconic high profile PV projects, such as the 200 kWQueen Victoria market site in Victoria. Each state should develop at least four suchfacilities by 2010, perhaps through design competitions, which would create evengreater awareness.
� Training and promotion to increase the expertise and awareness on PV technologyof building designers, engineers, planners and consultants.
� Marketing and promotion of the benefits and opportunities that PV can deliver.
Creating a level economic playing fieldPV technology will compete more effectively in Australia’s energy markets when currentmarket distortions are addressed, creating a level playing field with economicallyefficient outcomes.
This requires that power prices to consumers are more cost reflective in terms oflocation and time of use. In this way, consumers are provided with price signals inproportion to the impact that their electricity use has on investment required in thenetwork and in new generation.
Processes and requirements for the connection and deployment of PV systems currentlyact as a significant hurdle to investing in a PV system. The connection should bestreamlined by standardising connection agreements to best practice and enablingcustomers to choose a metering system with a minimum requirement of digital netmetering. Guidelines need to be established by state-based electricity regulatorsrelating to metering and connection of PV systems, to minimise costs to customers aswell as reduce delays in connecting systems to the electricity grid.
It is critical that all new homes install appropriate digital ’time of use’ meters that arecapable of measuring imports and exports, in a transition to introducing appropriatepricing practices.
Non-regional specific (or postage stamp) pricing practices make if difficult for PV tocompete in many markets, such as off-grid and end-of-grid applications, where the costof supplying electricity is higher. These practices should be made transparent byrequiring retailers to publish the real costs of supply per region, and to work towardscharging regionally appropriate prices and offering rebates for the quantity of anyreductions in price made by uniform pricing practices.
Table 7.3 PV Installations by year in Germany (in Megawatts)
1990 1991 1992 1993 1994 1995 1996 1997 1998 1999 2000 2001 2002 2003
Total 0.60 1.00 3.10 3.5 4.0 5.9 10.6 14.5 12.6 16.5 44.0 80.0 83.0 145.0
Source: Solarbuzz, Fast Energy Facts, 2004
THE WAY FORWARD FOR THE AUSTRALIAN PV INDUSTRY
64 //

THE AUSTRALIAN PHOTOVOLTAIC INDUSTRY ROADMAP 65 //
2. Diesel replacement program – off-grid market developmentOff-grid power systems have become increasingly competitive with diesel powergeneration units. They offer many benefits, including significant fuel savings, 24 hourreliable power supply and quiet, non-polluting operation.
A funding support program that continues to provide a financial incentive in off-gridmarkets is essential for further market development at this stage of development. Thisfinancial incentive needs to capture the additional values of utilising off-grid and small-grid PV systems over diesel technology.
PV in off-grid applications is currently disadvantaged through the operation ofsubsidised pricing for customers supplied through remote grids, particularly inQueensland, NT and WA. In addition, changes to the fuel excise arrangements,proposed in the Prime Minister’s 2004 Energy Statement,11 will mean that all powergeneration outside metropolitan areas will be able to use diesel and other petroleumproducts excise free. This undermines the competitive position of PV, is counter to thegovernment’s own RRPGP program, and serves to increase Australia’s dependence onimported fossil fuels.
To deliver the ‘Sunrise vision’ for off-grid applications the following measures arerequired:
� Diesel used for public generation should continue to accrue excise. This brings itinto line with diesel used in metropolitan areas and recognises the adverseenvironmental, security of supply and balance of payments impacts that comes fromreliance on imported petroleum products.
� Customers in remote areas, not connected to public grids, who chose to installrenewable energy rather than rely on diesel, should be able to internalise the valueof the excise that would have been paid had the system been in metropolitan areas.
� Governments should progressively introduce more cost-reflective and transparentpricing practices for remote consumers. There also needs to be a requirement forretailers to charge regionally appropriate prices, and offer rebates to consumerswho install renewable energy systems equivalent to the difference between the fullcost of supplying that customer and the uniform price actually paid by the customer.
3. Facilitating exportsThere are significant opportunities for Australia to increase the export of products,systems and services in line with expertise in off-grid PV. There will be additionalopportunities in the future, as the industry increases its expertise in the on-grid PVmarket. These opportunities are outlined in more detail in Chapter 6.
Initiatives which would assist in the development of export markets include thefollowing:
� Increase access to international aid programs by proving funding assistance tosupport the employment of industry experts to promote Australian capabilitiesoverseas, and to identify and disseminate overseas opportunities locally.
� PV to be included in Australian Aid projects in recognition that health care,education, capacity building and other development objectives are facilitated by theprovision of cost-effective local energy supply options. PV systems in particular canplay a key role in delivering these.
� Assistance to utilise Australian bilateral agreements to leverage opportunities formarket development and industry collaboration.
� Facilitate greater participation in international collaborative programs, includingmore comprehensive participation in the IEA PVPS activities, as well as accessingthe collaborative R,D&D programs of the European Commission. This includesadditional resources to compliment existing industry self-funding.
� Assistance to build Australian industry capacity to export. Existing networks, suchas AREEN, need to be strengthened to allow for a full-time person seconded fromindustry to support capacity building and market development.
The above measures provide a comprehensive framework to deliver on the potential ofPV and ensure that the ‘Sunrise vision’ is achieved by 2010.
The Prime Minister’s Energy Statement included a number of measures that will haveimplications for achieving the Sunrise vision. The key initiatives to impact on the PV industry are:
� The $75 million Solar Cities initiative will provide a limited opportunity fordeployment of PV in some locations. However, it is only a short-term measure andlimited in its application.
� The $100 million Renewable Energy Development Initiative has the potential toassist in building industry capability and capacity and could also provide assistancein the development of domestic and export market opportunities.
� The removal of excise from fuels used for power generation in non-metropolitanareas will reduce the competitive position of PV in the stand-alone power market,which had been the traditional market for PV in Australia and in export markets.
These measures, while providing some limited assistance towards achieving the Sunrisetargets, do not obviate the need for a strategic industry development policy frameworkthat can underpin long-term investment.

66 //
8// CREATING THE DRIVERS FOR INNOVATION
The PV Roadmap is a means of defining where in the innovation cycle the Australian PVindustry currently sits and of identifying what now needs to be done, who should do itand who should fund it. The history of PV R&D in Australia has been discussed in Passeyet al1 and in previous chapters, and the issues facing commercialisation of PV technologieshave been covered separately by Watt2. However, the new and expanded markets whichthe PV industry wishes to pursue over the coming decades will need a combination oftechnical, market and policy innovation in order to achieve successful diffusion.
This Roadmap takes into account the discussions about the respective roles ofgovernment and the private sector in stimulating investment in science, R&D, skills andthe commercialisation of good ideas, as outlined in Backing Australia’s Ability3. Inparticular, it looked at the initiatives already in place to stimulate innovation in thebusiness sector (as well as the new programs outlines in the June 2004 Prime Minister’sEnergy Statement), stimulating interaction and transferring ideas, and thecommercialisation of these ideas.
The Renewable Energy Technology Roadmap4 identified Innovation Priorities forAustralia’s renewable energy technologies. The priority view was that there is a need toconsolidate and refine Australia’s strengths in renewable energy. This is also theconclusion from this PV Roadmap consultation process, with similar views beingexpressed for R&D, commercialisation, and a market focus on solutions (rather thantechnology for technology’s sake), The one area of major differentiation is in identifyinglong-term, transparent policy support from government as a turn-key mechanism indelivering the ‘Sunrise vision’. This joined-upon thinking between government andindustry is necessary in order to create the right investment environment, which will inturn stimulate innovation in R&D, product design and delivery, and streamliningservices. Other area of differentiation between the two Roadmaps is in identifying theneed for demonstration, in order to mitigate some of the real and perceived risksassociated with supporting new technologies, applications, and start-up companies.
Policy supportPV research has been supported over the past two decades by various governmentresearch, development and commercialisation programs. However, there has been nooverall or coordinated PV research strategy for Australia. The PV research group at theUniversity of NSW has gained a significant advantage over other groups by being
awarded successive Australian Research Council (ARC) grants. This has been key to theestablishment and maintenance of their infrastructure and research teams necessary forsuccessful outcomes. However, it has often meant that funding agencies have had tochoose between continued funding of this Centre and funding for worthy proposals byother research groups.
At the industry level, international developments in manufacturing and applications arenow moving very rapidly. PV is an international commodity and the market is verycompetitive. Countries such as Japan and the Netherlands have had twenty yearstrategic plans for PV, and Japan now dominates the world market. It is within thiscontext that Australian companies are now making decisions about manufacturing andcommercialising Australian PV developments. Government development programs in thepast have operated within a policy framework which has given no clear indication ofAustralia’s long term commitment to PV at a government level. Hence they have tendedto result in boom – bust cycles, with little longer term industry development.
Photon science and technology, including photovoltaics, has recently been added to theARC’s priority research list and clean energy generally is now one of the key focus areasof the government’s innovation strategy. The PV sector must use these listings as thebasis for seeking specific commitments for action on a number of fronts:
Strategic industry statusIf Australia is to maintain its presence in the burgeoning PV sector, it should now belooking to establishing PV as a strategic industry sector. Such status would be a clearindication of Australia’s long term commitment to both the development and theapplication of PV, which in turn would provide confidence and reduce uncertaintyamongst research groups, potential industry partners, investors and end-users. Thisstatus should be:
� Reflected in Australia’s long-term energy strategy.
� Used as the background for specific market expansion targets, via MRET or othermechanisms.
� Recognised in energy regulations at Local, State and Commonwealth levels.
� Used to encourage an increased interest in PV by the financial sector and henceease the difficulties of raising capital currently experienced by new PV entrants.
� Used to argue for preferential R&D tax incentives for industry.

67 //
PV R,D&D FundStrategic industry status should be accompanied by the establishment of a research,development, demonstration (R,D&D) and commercialisation framework for PV, withfunding and joint administration shared between the Commonwealth Government (bothARC and the recently announced renewable energy R&D fund), State governments andindustry. This would facilitate:
� Technology transfer from researchers to industry, which has been identifiedinternationally as one of the most difficult stages in the innovation cycle. Jointindustry/research efforts, such as the US PVMaT program have been successful inallowing both competitive research funding and successful industry take-up ofresearch outcomes.
� Development of several research groups with the ability to focus long-term on arange of strategic technologies and markets.
� A more co-ordinated approach to the establishment of research facilities, instead ofcompeting with each other for scarce funds.
� An increased emphasis on research into applications, balance of systemcomponents and consumer requirements. These areas have been highlighted ascritical to the successful deployment of PV, but have received relatively little fundingsupport in the past, because ARC funding tends to be focussed at the researchrather than the application end of the innovation chain.
� Establishment of a Cooperative Research Centre for solar energy, to further facilitatethe long-term collaboration between industry, universities and government agencies.
Technical innovationThe PV industry has seen important Australian technical innovations over the past threedecades, in research, off-grid applications, industry development and export markets.Australian researchers have led the world in crystalline silicon cell efficiencies for overa decade, with an Australian invention, the ‘Saturn’ cell, being the most successful newcrystalline silicon cell technology to be commercialised world-wide over the pastdecade. Australia is also at the forefront of DSC technology developments. Australiapioneered the large-scale use of photovoltaics for telecommunications, remotesignalling and remote area power supply, while its expertise in manufacturing, systemdesign and technical training are world-recognised. This wide ranging expert base hastaken decades to establish and represents valuable intellectual capital for Australia.
Despite its 20 year history, PV is still an emerging industry, and developments are nowrapid. If Australia is to maintain and capitalise on its PV investments, it must ensurethat its own market allows for continued innovation and accelerated application of PV,
and that it is able keep its place in the international arena. Continued innovation isnecessary to:
� Better service growing markets.
� Capture new markets.
� Improve products and delivery.
� Reduce costs.
� Meet new implementation challenges.
� Develop new products.
For society more generally, the platform needs to be developed now to enable a choiceof energy futures.
Technology innovation in itself is not, however, sufficient for successful PV diffusion.Haas5 has found that it requires a combination of technology development, socialacceptance, market development and customer awareness, as illustrated in Figure 8.1.
Figure 8.1 Components essential to successful PV diffusionSource, Haas, IR, 2002 6
SuccessfulDiffusion
Society
Markets
Technology
Customer
THE AUSTRALIAN PHOTOVOLTAIC INDUSTRY ROADMAP
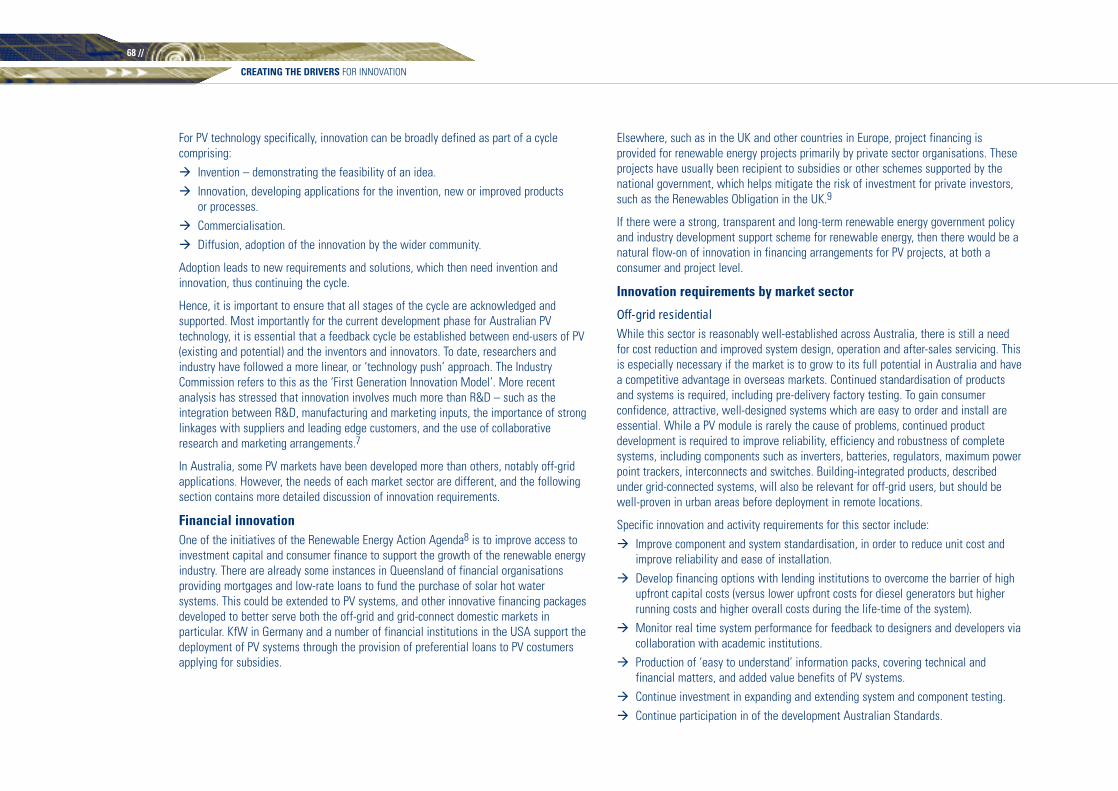
68 //
CREATING THE DRIVERS FOR INNOVATION
For PV technology specifically, innovation can be broadly defined as part of a cyclecomprising:
� Invention – demonstrating the feasibility of an idea.
� Innovation, developing applications for the invention, new or improved products or processes.
� Commercialisation.
� Diffusion, adoption of the innovation by the wider community.
Adoption leads to new requirements and solutions, which then need invention andinnovation, thus continuing the cycle.
Hence, it is important to ensure that all stages of the cycle are acknowledged andsupported. Most importantly for the current development phase for Australian PVtechnology, it is essential that a feedback cycle be established between end-users of PV(existing and potential) and the inventors and innovators. To date, researchers andindustry have followed a more linear, or ‘technology push’ approach. The IndustryCommission refers to this as the ‘First Generation Innovation Model’. More recentanalysis has stressed that innovation involves much more than R&D – such as theintegration between R&D, manufacturing and marketing inputs, the importance of stronglinkages with suppliers and leading edge customers, and the use of collaborativeresearch and marketing arrangements.7
In Australia, some PV markets have been developed more than others, notably off-gridapplications. However, the needs of each market sector are different, and the followingsection contains more detailed discussion of innovation requirements.
Financial innovationOne of the initiatives of the Renewable Energy Action Agenda8 is to improve access toinvestment capital and consumer finance to support the growth of the renewable energyindustry. There are already some instances in Queensland of financial organisationsproviding mortgages and low-rate loans to fund the purchase of solar hot watersystems. This could be extended to PV systems, and other innovative financing packagesdeveloped to better serve both the off-grid and grid-connect domestic markets inparticular. KfW in Germany and a number of financial institutions in the USA support thedeployment of PV systems through the provision of preferential loans to PV costumersapplying for subsidies.
Elsewhere, such as in the UK and other countries in Europe, project financing isprovided for renewable energy projects primarily by private sector organisations. Theseprojects have usually been recipient to subsidies or other schemes supported by thenational government, which helps mitigate the risk of investment for private investors,such as the Renewables Obligation in the UK.9
If there were a strong, transparent and long-term renewable energy government policyand industry development support scheme for renewable energy, then there would be anatural flow-on of innovation in financing arrangements for PV projects, at both aconsumer and project level.
Innovation requirements by market sector
Off-grid residentialWhile this sector is reasonably well-established across Australia, there is still a needfor cost reduction and improved system design, operation and after-sales servicing. Thisis especially necessary if the market is to grow to its full potential in Australia and havea competitive advantage in overseas markets. Continued standardisation of productsand systems is required, including pre-delivery factory testing. To gain consumerconfidence, attractive, well-designed systems which are easy to order and install areessential. While a PV module is rarely the cause of problems, continued productdevelopment is required to improve reliability, efficiency and robustness of completesystems, including components such as inverters, batteries, regulators, maximum powerpoint trackers, interconnects and switches. Building-integrated products, describedunder grid-connected systems, will also be relevant for off-grid users, but should bewell-proven in urban areas before deployment in remote locations.
Specific innovation and activity requirements for this sector include:
� Improve component and system standardisation, in order to reduce unit cost andimprove reliability and ease of installation.
� Develop financing options with lending institutions to overcome the barrier of highupfront capital costs (versus lower upfront costs for diesel generators but higherrunning costs and higher overall costs during the life-time of the system).
� Monitor real time system performance for feedback to designers and developers viacollaboration with academic institutions.
� Production of ‘easy to understand’ information packs, covering technical andfinancial matters, and added value benefits of PV systems.
� Continue investment in expanding and extending system and component testing.
� Continue participation in of the development Australian Standards.
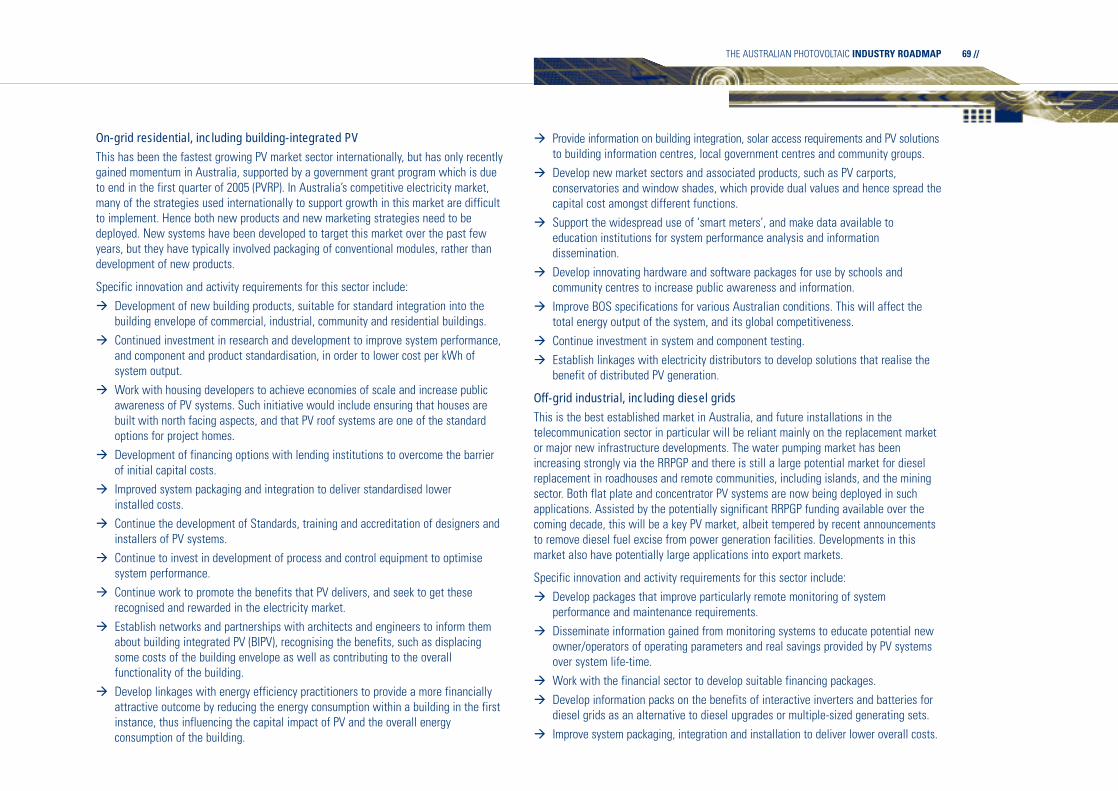
69 //
On-grid residential, including building-integrated PVThis has been the fastest growing PV market sector internationally, but has only recentlygained momentum in Australia, supported by a government grant program which is dueto end in the first quarter of 2005 (PVRP). In Australia’s competitive electricity market,many of the strategies used internationally to support growth in this market are difficultto implement. Hence both new products and new marketing strategies need to bedeployed. New systems have been developed to target this market over the past fewyears, but they have typically involved packaging of conventional modules, rather thandevelopment of new products.
Specific innovation and activity requirements for this sector include:
� Development of new building products, suitable for standard integration into thebuilding envelope of commercial, industrial, community and residential buildings.
� Continued investment in research and development to improve system performance,and component and product standardisation, in order to lower cost per kWh ofsystem output.
� Work with housing developers to achieve economies of scale and increase publicawareness of PV systems. Such initiative would include ensuring that houses arebuilt with north facing aspects, and that PV roof systems are one of the standardoptions for project homes.
� Development of financing options with lending institutions to overcome the barrierof initial capital costs.
� Improved system packaging and integration to deliver standardised lower installed costs.
� Continue the development of Standards, training and accreditation of designers andinstallers of PV systems.
� Continue to invest in development of process and control equipment to optimisesystem performance.
� Continue work to promote the benefits that PV delivers, and seek to get theserecognised and rewarded in the electricity market.
� Establish networks and partnerships with architects and engineers to inform themabout building integrated PV (BIPV), recognising the benefits, such as displacingsome costs of the building envelope as well as contributing to the overallfunctionality of the building.
� Develop linkages with energy efficiency practitioners to provide a more financiallyattractive outcome by reducing the energy consumption within a building in the firstinstance, thus influencing the capital impact of PV and the overall energyconsumption of the building.
� Provide information on building integration, solar access requirements and PV solutionsto building information centres, local government centres and community groups.
� Develop new market sectors and associated products, such as PV carports,conservatories and window shades, which provide dual values and hence spread thecapital cost amongst different functions.
� Support the widespread use of ‘smart meters’, and make data available toeducation institutions for system performance analysis and informationdissemination.
� Develop innovating hardware and software packages for use by schools andcommunity centres to increase public awareness and information.
� Improve BOS specifications for various Australian conditions. This will affect thetotal energy output of the system, and its global competitiveness.
� Continue investment in system and component testing.
� Establish linkages with electricity distributors to develop solutions that realise thebenefit of distributed PV generation.
Off-grid industrial, including diesel gridsThis is the best established market in Australia, and future installations in thetelecommunication sector in particular will be reliant mainly on the replacement marketor major new infrastructure developments. The water pumping market has beenincreasing strongly via the RRPGP and there is still a large potential market for dieselreplacement in roadhouses and remote communities, including islands, and the miningsector. Both flat plate and concentrator PV systems are now being deployed in suchapplications. Assisted by the potentially significant RRPGP funding available over thecoming decade, this will be a key PV market, albeit tempered by recent announcementsto remove diesel fuel excise from power generation facilities. Developments in thismarket also have potentially large applications into export markets.
Specific innovation and activity requirements for this sector include:
� Develop packages that improve particularly remote monitoring of systemperformance and maintenance requirements.
� Disseminate information gained from monitoring systems to educate potential newowner/operators of operating parameters and real savings provided by PV systemsover system life-time.
� Work with the financial sector to develop suitable financing packages.
� Develop information packs on the benefits of interactive inverters and batteries fordiesel grids as an alternative to diesel upgrades or multiple-sized generating sets.
� Improve system packaging, integration and installation to deliver lower overall costs.
THE AUSTRALIAN PHOTOVOLTAIC INDUSTRY ROADMAP

� Continue the development of Standards and training of designers and installers ofsuch PV systems.
� Continue investment in expanding and extending system and component testing.
� Continue to invest in development of process and control equipment to optimisesystem performance.
Centralised grid-connected systemsAustralia has only four central grid-connected PV systems of ‘reasonable’ size, thesebeing 400 kW at Singleton, 50 kW at Queanbeyan and Dubbo, plus the circa 200 kWroof top system on the Queen Victoria Market in Melbourne. The centralised grid-connected market is gaining interest internationally, and Australia may be well-placedto develop key aspects of new technical approaches. Australia may also serve as a sitefor internationally funded installations, if emission trading schemes are established.
There is also considerable experience from the 20 kWp tracking system at Kalbarri site,in Western Australia, which was installed to provide grid support to the ‘end’ of a longpower line.
Specific innovation and requirements for this sector include:
� Develop linkages with electricity distributors on the deployment of PV, with orwithout storage, for line support and peak load shaving.
� Support academic institutions in the monitoring and analysis of installed systems.
� Develop rapid deployment products for large-scale systems.
� Continued investment in research and development to improve system performanceand lower cost per kWh of system output.
� Work with local authorities to obtain feedback on regional grid conditions andopportunities for PV.
� Continue to invest in development of process and control equipment to optimisesystem performance.
� Continue investment in system and component testing.
� Develop new market sectors where there are existing structures, such as PV carparks, sports facility roofs, industrial rooftops, etc., to spread the capital cost acrossmulti-functional applications.
Small portable devicesThis market has been one of steady growth, with current international sales of 10 MWer annum. This is a market with the potential for very high growth as wireless devicesbecome universal, because PV offers the possibility of wireless power to match thewireless communication. For Australia to stake a claim in this market sector, it will benecessary to proceed with:
� Development of suitable cell technologies, which work well in low light conditions(e.g. indoors), such as DSC.
� Undertaking R&D into duel function devices, such as the CEGS (combined energygeneration and storage) devices underdevelopment at STI.
� Develop strategic alliances with the overseas major manufactures of wirelessdevices.
� Develop business models which ensure fair returns to Australia when overseasmanufacture is necessary.
� Continue investment in product testing.
� New products and new market applications.
CREATING THE DRIVERS FOR INNOVATION
70 //
PV-powered garden light

71 //
9// CONCLUSIONS
The PV industry is developing into a multi-billion dollar industry globally, as concerns forthe environment and energy security continue to increase, and installed PV costscontinue to fall.
In order for Australia to continue to attract a share of the considerable investment beingmade worldwide in PV, a vibrant national market is required. This can be achieved by along-term policy framework that gives industry confidence to invest, leverages thegrowing public concerns for the environment and support for renewable energy, andmakes good economic sense.
Such an approach can create a billion dollar PV industry in Australia with significantexports, delivering local jobs and investment, while contributing to significant long-termreductions in Australia’s greenhouse emissions.
The Australian PV industry is at the crossroads. Australia was recognised as a worldleader in PV a number of years ago, largely driven by the extensive roll-out of PV in off-grid applications – our traditional market.
PV module manufacturing has taken place in Australia since 1976, and we are currentlyonly one of four countries exporting PV modules. We have vast solar resources that arethe envy of many Northern Hemisphere countries. Australia has leading PV technologies,world-class researchers, a number of promising start-up companies, and breadth (butnot depth) to the existing industry in terms of BOS manufacture, distribution andwholesaling, systems packaging, integration and installation, and export capability.
Our position in the international rankings has however slipped, due to reducedcompetitive advantages, and we now risk losing our place in this growing and dynamicindustry.
Australia’s PV industry, like those of other developed countries, has been supported bygovernment support programs. These programs, while they have been ad hoc, havedelivered an industry that employs over 1,100 people and has annual sales of over $200million, of which exports account for over $100 million. Importantly, government supporthas leveraged increasing domestic sales and as a result installed costs have continuedto fall.
Unfortunately the PV industry globally has not yet reached the stage where it can beself-sustaining. Continuing government support is required to build a market that canunderpin continued reductions in cost. This Roadmap, therefore, sets out the nature ofthe government support required and in turn what the industry will do to deliver on theindustry potential.
The dividend for Australia in supporting the ‘Sunrise vision’ is that a sustainabledynamic and vibrant industry will result by 2010, with the following dimensions:
Installed capacity (MW) 350
Employment 5,290
Local sales revenue ($ million) 786
PV sector exports ($ million) 444
CO2 abated in year (‘000 tonnes) 490
Government has in the past made decisions about which industries it will support anddevelop and those that it will not. Technologies not supported have gone offshore, andother countries have benefited from the IP developed in Australia. We are alreadystarting to see this with the PV industry, and the transfer of the UNSW / Pacific SolarPV cell technology to Germany in 2004.
The ‘Sunrise vision’ requires government assists industry to remove many of theimpediments and barriers to large-scale, economic deployment in Australia. Theseinclude the current electricity market impediments, such as lack of efficient time andlocational pricing that currently constrain the uptake of PV. Or, until such time that theseare rectified needs to implement compensatory measures that reward the benefitsprovided by the large scale deployment of PV.
This Roadmap for the PV industry thus requires government and industry to worktogether to implement a strategy which will stimulate long-term growth of the market inAustralia, and to leverage the resultant expertise and capacity to build a vibrant exportindustry. The actions in the Roadmap can be summarised as follows:
Government to provide an industry development framework that supports newinvestment and includes:
Market stimulation – this addresses specific market impediments that prevent thebenefits that PV provide being adequately recognised or rewarded. Market stimulationunderpins increased demand by bridging the current cost competitive gap in the key PVmarkets of off-grid and grid-connect. This includes feed-in tariffs, enhancing theMandatory Renewable Energy Target, implementing effective building codes andstandards, supporting diesel replacement, and providing financial support for strategicmarket development.
THE AUSTRALIAN PHOTOVOLTAIC INDUSTRY ROADMAP

CONCLUSIONS
72 //
Removal of regulatory barriers – this addresses electricity market impediments thatresult in increased installation costs and delays arising from metering, connection andpricing arrangements.
Building industry capacity and capability – this includes supporting industrydevelopment activities that build local industry capacity and includes support forexports, innovation, training and education.
Australia’s PV industry would continue to build on and leverage its investment todate, with specific actions as follows:
Continue to drive installed system costs downwards – undertake investment inmanufacturing and research and development to reduce manufacturing costs andimprove system performance. Develop new products and installation methods, continueto improve the efficiency of supply channels and improve system packaging andintegration.
Continue to improve quality, reliability and performance – continue thedevelopment of standards, training and accreditation and investment in expanding andextending system and component testing. Investment in development of process andcontrol equipment to optimise system performance.
Continue to expand and develop products, markets and applications – continueto differentiate service provided by PV and promote the benefits that PV delivers andseeking to get these recognised and rewarded in the market. Continue buildingconsumer awareness and development of product solutions that are valued by differentmarket sectors. Support trade initiatives and the further development of channels andmarkets overseas.
Support capacity building – continue support for development of training andeducation infrastructure and international collaboration on research and development,market development and standards.
Australia has the makings of a world class industry. The industry is poised to make therequired investment if it is provided with a long term-policy framework that enables PVto compete on its merit and the benefits that it provides are recognised and rewarded.

THE AUSTRALIAN PHOTOVOLTAIC INDUSTRY ROADMAP 73 //
// NOTES
// Executive summary1 Renewable Energy Industry in Australia, BCSE, September 2003 and includes bulk power sales for all renewable
power plants including pre-existing hydro projects2 European Photovoltaic Industry Association for the European Commission (1995). Photovoltaics in 2010 (PV2010).3 Watt, M. & Outhred, H. 1999 Electricity Industry Sustainability: Policy Options, ACRE, p. 30
2// The Australian and international context for photovoltaics1 http://www.nrel.gov/ncpv/pdfs/25847X.pdf 2 http://paris.fe.uni-lj.si/pvnet/files/Roadmap_Final_1.pdf3 http://www.oja-services.nl/iea-pvps/conference/downloads/s52_kobayashi.pdf4 International Energy Agency, International Energy Agency, Energy Statistics of OECD Countries, 2001–2002 –
2004 Edition, Paris, 20045 BP Ltd, The BP Statistical Review of World Energy, 2004 , June 20046 Shell International, Van der Veer, J, Dutch/Shell Group and Dawson: Shell International Renewables, Press Release
from Shell International, London, October 19977 The Shell Report 2003, Meeting the energy challenge, Seventh report of the Royal Dutch/Shell Group of
Companies, The Hague, May 20038 EREC is comprised of the 6 European RE associations, namely EPIA – European Photovoltaic Industry Association,
ESHA – European Small Hydropower Association, ESIF – European Solar Industry Federation, EUBIA – EuropeanBiomass Industry Association, EWEA – European Wind Energy Association, EUREC Agency – European RenewableEnergy Research Centres Agency
9 European Renewable Energy Council, Renewable Energy Target for Europe 20% by 2020 10 Turton, 2004, for the Institute for Applied Systems Analysis, Laxenburg, Austria 11 Graham, Greenhouse Science, what it means for energy, Conference of the Australian Business Council for
Sustainable Energy, Sydney, 200412 Answers to questions by the Minister for Foreign Affairs, the Minister for Trade
and their representatives in the Senate, Question without Notice,http://www.dfat.gov.au/qwon/2002/qwn_020627d.html
13 Royal Commission on Environmental Pollution, 22nd REPORT: Energy – The Changing Climate, London, June 2000
14 Department of Trade and Industry, New & Renewable Energy. Prospects for the 21st Century, London, March 1999
15 The Energy Review, A Performance and Innovation Unit Report, Cabinet Office, London, February 200216 Business Council for Sustainable Energy et al, A Clean Energy Future for Australia, March 200417 Howard, John, Securing Australia’s Energy Future, Commonwealth of Australia, Canberra, 200418 A Clean Energy Future for Australia, March 2004, ibid19 http://www.detya.gov.au/mapping/pubs/case_studies/photovoltaics.pdf
3// The Australian PV industry1 International Energy Agency, Greenhouse Gas R&D Programme, ‘The potential of Solar Electricity to Reduce CO2
Emissions, Report Number PH4/14’, 20032 Ibid3 Watt, Muriel for the International Energy Agency, Co-operative Programme on Photovoltaic Power Systems, Task 1,
National Survey Report of PV Power Applications in Australia 2003, Sydney, June 20044 International Energy Agency, Trends in Photovoltaic Applications Survey report of selected IEA countries between
1992 & 2002, Report IEA-PVPS t1-12:20035 Greenpeace and the European Photovoltaic Industry Association, Solar Generation, 2002
4// The PV market1 Watt, Muriel for the International Energy Agency, Co-operative Programme on Photovoltaic Power Systems, Task 1,
June 20042 International Energy Agency Photovoltaic Power Systems Programme (2003). Trends in Photovoltaic Applications:
Survey Report of Selected IEA Countries between 1992 and 2002. IEA-PVPS3 Okumoto, Nami, Outline of New and Renewable Energy Policy in Japan, Ministry of Economy, Trade and Industry,
Tokyo, May 2004; http://www.eere.energy.gov/ US DOE Energy Efficiency and Renewable Energy (EERE) home page4 European Photovoltaic Industry Association for the European Commission (1995). Photovoltaics in 2010 (PV2010)5 Watt, M. & Outhred, H. 1999 Electricity Industry Sustainability: Policy Options, ACRE, p.306 National Renewable Energy Laboratory, PV Manufacturing R&D Program (PVMaT), hppt://www.nrel.gov/pvmat/
downloaded June 20047 The Berlin European Conference for Renewable Energy ‘Intelligent Policy Options’, June 20048 www.erec-renewables.org, June 20049 Jager-Waldau, A., PV Status Report 2003. Research, Solar Cell Production and Market Implementation in Japan, US
and the European Union’, European Commission JRC, 200310 Energy Strategies, ACRE, CAT, GSES, Assessment of Diesel Use in Remote Area Power Supply, Australian
Greenhouse Office, 199911 Assumes 2.5% of 7 million households and average 3–5 kW PV–SPS system12 Potential for Building Integrated Photovoltaics Report IEA T7-4: 200113 National Electricity Market Management Company, 2003 Statement of Opportunity for the National Electricity
Market, 200314 Watt, M., Oliphant, M. et al, Using PV to Meet Peak Summer Electricity Loads, 200315 EcoGeneration, October/November 200316 Watt, M. (2001), Added Values of Photovoltaic Power Systems, Report IEA-PVPS, March 200117 Gutschner, M., Potential for Building Integrated Photovoltaics, IEA-PVPS Task 7, July 200218 Watt, ibid19 Howard, John, Securing Australia’s Energy Future, Commonwealth of Australia, Canberra, 2004
5// What is the potential of the Australian PV Industry?1 In most cases this will be the retail price since PV electricity mostly competes at the retail level rather than
the wholesale level2 Assumes 30,000 to 40,000 off-grid residences (holiday homes, pastoral stations and small indigenous communities)
and average 5 kW PV SPS system. Note that under current support mechanisms, off-grid residences are eligible forPVRP support to a maximum of 1.0 kW and the average off-grid domestic system size is 1 kWp. Watt, M. NationalSurvey Report of PV Applications in Australia, 2002
3 Energy Strategies et al, ‘Assessment of Diesel Use in Remote Area Power Supply’, 19994 Assumes 2.5% of 7 million households located in viable fringe-grid locations and average 3–5 kW PV SPS system.
This acknowledges that competing technologies (particularly small wind and micro-hydro generators) wouldprobably be a more cost-effective solution for some 30% of this theoretical potential
5 Assumes 7 million households each with 1.5kW grid-connected PV. Note that as PV prices fall, particularly beyond2015/2020 when PV electricity is competitive with grid-supplied electricity, the incentive will be to install largersystems, in the order of 3–5kW to offset more of the contribution from the grid – i.e. the potential market in thismarket sector could be 2–3 times greater than indicated
6 The medium hydrogen scenario assumes hydrogen penetration to support 10% of transport energy requirementsand 3% of distributed generation. National Hydrogen Study, A report prepared by ACIL Tasman and ParsonsBrinckerhoff for the Department of Industry, Tourism and Resources, Canberra, 2003
NOTES TO THE ROADMAP
74 //
6// Export markets1 European Renewable Energy Exports Council, Export Strategy, Brussels, 20042 PV News, Feb 20043 Gregory, J A et al, Financing Renewable Energy Systems, A Guide for Development Workers, London, 19964 Philippines Rural Power Project, World Bank Project ID P066397 5 Solaraccess, May 24 20046 Ministry of Non-Conventional Energy Sources website, http://www.mnes.nic.in/ downloaded May 20047 World Bank Report 23887-BD May 2002: Project Appraisal Document – Bangladesh8 Asian Development Bank, PPTA: PAK34339-09 http://www.ausaid.gov.au/about/objective.cfm10 WSLIC II is a six-year, US$ 106 million project funded through grant assistance from Australia, the IDA, the
Indonesian Government and the beneficiaries themselves. This project aims to improve the health status,productivity and quality of life of poor communities in under-served rural villages in the project provinces.http://www.indo.ausaid.gov.au/projects/wslic.html
11 http://www.reeep.org/12 http://www.iea-pvps.org/13 http://www.oja-services.nl/iea-pvps/tasks/index.htm14 Please note: whilst the opportunities identified in this section relate to expanding PV exports, many of the
initiatives would also relate to increasing exports for other renewable energy technologies15 http://www.dti.gov.uk/energy/renewables/renewables_uk/trade_promoters.shtml16 GTZ is an enterprise for international cooperation with worldwide operations. On behalf of the German government,
GTZ also offers its know-how and services in international markets on a commercial basis. http://www.gtz.de/
7// The way forward for the Australian PV industry1 Okumoto, Nami, Outline of New and Renewable Energy Policy in Japan, Ministry of Economy, Trade and Industry,
Tokyo, May 20042 Photon International, March 2004 3 International Energy Agency/OECD, Experience Curves for Energy Technology Policy, Paris,4 Okumoto, ibid; Agency for Natural Resources and Energy, ‘Energy in Japan’, www.enecho.meti.gov.jp5 Kurokawa, Kossuke and Aratani, Fukuo, Perceived Technical Issues Accompanying Large PV Development and
Japanese ‘PV2030’, 19th EU-PVSEC, Paris June 20046 Okumoto, ibid7 National Emission Trading, Crediting the Carbon, Discussion paper 3, Australian Greenhouse Office, October 19998 Current consumer price for a 1 kW PV system is $12,2009 Solabuzz, FAST SOLAR ENERGY FACTS, http://www.solarbuzz.com/FastFactsGermany.htm, downloaded July 200410 Renewable Energy World, May–June 200411 Howard, ibid
8// Creating the drivers for innovation1 Passey, Robert, Watt, Muriel & Collins, Richard, Review of Government Support for Photovoltaics in Australia,
ACRE Policy Group, March 2003 2 Watt, M., The Commercialisation of Photovoltaics Research in Australia, University of NSW, Sydney, 20033 Backing Australia’s Ability, Real Results, Real Jobs, The Government’s Innovation Report 2001–2002, Canberra, 20034 Australian Business Council for Sustainable Energy, ACRE, Australian Greenhouse Office, Industry, Tourism,
Resources, Renewable Energy Technology Roadmap, Commonwealth of Australia, October 20025 Haas, R., Building PV Markets – Customers and Prices, Renewable Energy World. May–June 20026 Ibid7 Australian Chamber of Commerce and Industry, Innovation: Leading Australian Business, Kingston, 20038 www.industry.gov.au/agendas9 The Renewables Obligation, introduced by the UK in 2002, is similar to Australia’s Mandatory Renewable Energy
Target, in that it places an obligation on electricity suppliers to source an increasing proportion of generation fromrenewable energy sources. It was one of the major recommendations from the RCEP provides a stable and long-term market for renewable energy, remaining in place until 2027. Yearly targets have been set up to the 2010/2011period. http://www.dti.gov.uk/energy/renewables/policy/renewables_obligation.shtml

THE AUSTRALIAN PHOTOVOLTAIC INDUSTRY ROADMAP 75 //
// REFERENCES‘Addressing peak demand’, EcoGeneration, Issue 20, October/November 2003
Agency for Natural Resources and Energy, Energy in Japan,hppt://www.enecho.meti.gov.jp
Aitken, D, W., Transitioning to a renewable energy future, The International Solar EnergySociety, Freiburg, 2003
Australian Business Council for Sustainable Energy, ACRE, Australian GreenhouseOffice, Industry, Tourism, Resources, Renewable energy technology roadmap,Commonwealth of Australia, October 2002
Australian Business Council for Sustainable Energy et al, A clean energy future for Australia, March 2004
Australian Business Council for Sustainable Energy, Background paper on the PVindustry in Australia, Carlton, February 2003
Australian Chamber of Commerce and Industry, Innovation: leading Australian business,Kingston, 2003, downloaded June 2004 fromhttp://www.acci.asn.au/text_files/policies/Innovation_2003.pdf
Australian Greenhouse Office, National Emissions Trading, Creating the Carbon,Canberra, 1999
‘Backing Australia’s ability, real results, real jobs’, The Government’s innovation report2001–2002, Canberra, 2003
Bell J, J., A survey of Canadian policies to compensate small power producers forelectricity fed to the grid: net metering and net billing, 2003.
BP Solar, BP Solar Australia’s MRET submission, 2003
BP, The BP Statistical review of World Energy 2004, June 2004.http://www.bp.com/statisticalreview2004
‘Bringing solar within everyone’s reach’, EcoGeneration, Issue 16, February/March 2003
Charles River Associates for Integral Energy, Impact of air conditioning on integralenergy’s network, Melbourne, May 2003
Department for Trade and Industry, Renewables obligation,http://www.dti.gov.uk/energy/renewables/policy/renewables_obligation.shtml,downloaded May 2004
Department of Trade and Industry, New & renewable energy – prospects for the 21stcentury, London, March 1999. Available from www.dti.gov.uk/renew/condoc
Downer, Alexander, Answers to questions by the Minister for Foreign Affairs, theMinister for Trade and their representatives in the Senate, Question without Notice,http://www.dfat.gov.au/qwon/2002/qwn_020627d.html
Dunn, S. ,’Micropower – changing the landscape of power production’ RenewableEnergy World, November–December, 2000.
Ellis, Mark & Associates, Economic oerformance and contribution of the sustainableenergy industry 2002, Australia and Victoria, Lilyfield, Sept 2002
Endo, Eiichi and Tamura, Yoshihiko, Cost-effectiveness analysis of R&D on solar cells inJapan, Summary for the International PVSEC-12, Japan, 2004
Energetics, US Photovoltaic Industry, PV industry roadmap workshop, Illinois, September 1999.
Energy Strategies, ACRE, CAT, GSES, Assessment of diesel use in remote area powerSsupply, Australian Greenhouse Office, 1999
Environmental finance news, June 2003, http://www.environmental-finance.com/2003/0306jun/news.htm#jn7
ESTIR, Scientific and technological references energy technology indicators, September, 2002.
EurObserv’ER / European Renewable Energy Centres Agency (EUREC Agency),Photovoltaic energy barometer 2003, Brussels, 2003,http://www.eurec.be/projects/RE_barometer.htm
European Photovoltaics Industry Association, Solarelectricity in 2010. Building on adecade of industrial and political commitment, Brussels, 2004.
European Renewable Energy Council, Export strategy, Brussels, 2004
European Renewable Energy Council, Renewable energy scenario to 2040. Half of theglobal energy supply from renewables in 2040, Brussels, 2004.
European Renewable Energy Council, Renewable energy target for Europe, 20 per centby 2020, Brussels 2004
G8 Renewable Energy Task Force, Chairman’s report, July 2001
Greenpeace and the European photovoltaic Industry Association, Solar Generation, 2002
Gregory, Jenniy et al., Financing renewable energy projects, A guide for developmentworkers, IT Publications, London, 1996
Gutschner, M., Potential for building integrated photovoltaics, IEA-PVPS Task 7, July 2002
Haas, R, Market deployment strategies for PV systems in the built environment, An evaluation of incentives, support programmes and marketing activities, IEA-PVPSTask 7, September 2002
Haas, R., ‘Building PV markets – customers and prices’, Renewable Energy World,May–June 2002

Howard, John, Securing Australia’s energy future, Department of the Prime Minister andCabinet, Commonwealth of Australia, Canberra, 2004.
Ingrouille, Stephen, Introduction to photovoltaic technology and applications and a briefhistory of photovoltaics in Australia, Carlton, May 2004.
International Energy Agency, Greenhouse gas R&D programme, The potential of solareectricity to reduce CO2 emissions, Report number PH4/14, March 2003
International Energy Agency, Energy statistics of OECD countries, 2001–2002, 2004 Edition, Paris, 2004
International Energy Agency, Environmental benefits of renewables in the power sector,http://www.iea.org/pubs/studies/files/benign/full/06-bene.htm
International Energy Agency, Renewable energy – market and policy trends in IEAcountries, Paris, 2004.
International Energy Agency, Renewables information – 2003 edition, Paris, 2003
International Energy Agency, Trends in photovoltaic applications, survey report ofselected IEA countries between 1992 & 2002, Report IEA-PVPS t1-12:2003.
International Energy Agency/OECD, Experience curves for energy technology policy,Paris, 2000 http://www.iea.org/public/studies/curves.htm
International Energy Agency/OECD, Experience curves for energy technology policy,Paris, 2000
Jager-Waldau, A., PV status report 2003. Research, solar cell production and marketimplementation in Japan, US and the European Union’, European Commission JRC,2003
Jawetz, Pincas et al for the e7, Renewable energy technology diffusion, Final Report,USA 2003
Kurokawa, Kossuke and Aratani, Fukuo, Perceived technical issues accompanying largePV development and Japanese ‘PV2030’, 19th EU-PVSEC, Paris June 2004
Little, Arthur D., Potential cost reduction in PV systems, ETSU for the Department ofTrade and Industry, London 2001.
Lorentzen, J., The role of certificate systems in supporting the development ofrenewable energy in the EU, European Commission, Brussels, 2003 .
MacGill, I. Passey R. Watt, M., Australian renewable energy case studies – DraftOctober. The Australian CRC for Renewable Energy Policy Group, 2001.
MacGill, Iain, Passey, Rob & Watt, Muriel, The economic development and job creationpotential of renewable energy, Australian Case Studies, ACRE Policy Group, October 2001
Mandatory Renewable Energy Target Review – Renewable opportunities, a review ofthe operation of the Renewable Energy Electricity Act (2000),http://www.mretreview.gov.au/report/index.html
Maycock, P. (ed), Photovoltaic news. Volume 23 No.3 March, PV Energy Systems Inc,Virginia, 2004.
Mott Macdonald for the UK Department of Trade and Industry, Renewable supply chaingap analysis, Summary report, London, January 2004
Muriel Watt and Iain MacGill, PV research and development in Australia – where tofrom here? Proceedings of the National Conference and Exhibition of the AustralianBusiness Council for Sustainable Energy, Brisbane, April 2003..
National Energy Market Management Company, 2003 Statement of Opportunities for theNational Electricity Market, Mansfield, 2003
National Hydrogen Study, A report prepared by ACIL Tasman and Parsons Brinckerhofffor the Department of Industry, Tourism and Resources, Canberra, 2003
National Institute of Advanced Industrial Science and Technology, Cost-effectivenessanalysis of R&D on solar cells in Japan, retrieved March 2004,http://www.aist.go.jp/ETL/etl/divisions/~6436/index-e.html
National Renewable Energy Laboratory, PV manufacturing R&D program (PVMaT),http://www.nrel.gov/pvmat/pvmat_frame.shtml?pvmatoverview.html, downloadedJune 2004
Niermeijer, P., Demand for RECS certificates, Salzburg, 2003.
Okumoto, Nami, Outline of new and renewable energy policy in Japan, Ministry ofEconomy, Trade and Industry, Tokyo, May 2004
Passey, Robert, Watt, Muriel & Collins, Richard, Review of government support forphotovoltaics in Australia, ACRE Policy Group, March 2003
Peak lopping for diesel mini-grids, PV power, IEA PVPS newsletter, Issue 19, December 2003
Pearman, Graham, Greenhouse science, what it means for energy, Conference of theAustralian Business Council for Sustainable Energy, Sydney, 2004
Prasad, Deo and Snow, Mark, Designing with solar power, A source book for buildingintegrated photovoltaics (BIPV), IEA-PVPS Task 7, May 2004
REEP – IEA and REEEP, Putting efficiency at the heart of sustainable energy,http://www.reeep.org/index.cfm?articleid=765
Refocus, Jan/Feb 2003, International Solar Energy Society.
REFERENCES
76 //

THE AUSTRALIAN PHOTOVOLTAIC INDUSTRY ROADMAP 77 //
Renewable energy action agenda, third implementation report, Australian BusinessCouncil for Sustainable Energy and the Department for Industry, Tourism andResources, Carlton, 2003
Renewable Energy World, May–June 2004
Rogel, M., Tipping Point. Will Japan become the first mass market for solar power.Cambridge Energy Research Associates, Massachusetts, 2004.
Royal Commission on Environmental Pollution, 22nd REPORT: Energy – the changingclimate, presented to Parliament by Command of Her Majesty, London, June 2000,http://www.rcep.org.uk/
Solar Catalyst Group, Solar opportunity assessment report, Washington DC, 2003
Solarbuzz, Fast solar energy facts, http://www.solarbuzz.com/FastFactsGermany.htm,downloaded July 2004
Solarbuzz, Solar module price highlights – March 2004,http://www.solarbuzz.com/ModulePrices
‘Solar power – the next silicon rising star’, EcoGeneration, Issue 16, February/March 2003
Soros, P., Summary of AusIndustry products, version 7.2, 2004
Takeshita, Mitura, Sustainable Energy and the Global Environment – Japan’s response,presentation, NEDO, Sydney, 2003
The energy review, A performance and innovation unit report, Cabinet Office, London,February 2002
The Shell report 2003, Meeting the energy challenge – our progress in contributing tosustainable development, Seventh report of the Royal Dutch/Shell Group ofCompanies on their progress in contributing to sustainable development, The Hague,May 2003.
Turton, H., Greenhouse gas emissions in industrialised countries. Where does Australiastand? Discussion paper number 66, The Australia Institute, 2004
United Nations Development Program, World energy assessment – energy and thechallenges of sustainability, New York, 2000
United Nations Development Program, World energy assessment, energy and thechallenge of sustainability, New York, 2000
Van der Veer, J, Dutch/Shell Group and Dawson: Shell international renewables, Pressrelease from Shell International, London, October 1997
Watt, M, Added values of photovoltaic power systems, Report IEA-PVPS T1-09:2001,International Energy Agency, March 2001
Watt, M., The commercialisation of photovoltaics research in Australia, a report for science and innovation mapping for DEST, University of NSW, Sydney,September 2003
Watt, M. Oliphant, H. Outhred and R. Collins, Using PV to meet peak summer electricityloads, ANZSES conference, Melbourne, 2003.
Watt, M., Co-operative programme on photovoltaic power systems, University of NSW,Sydney, 2003.
Watt, M., The value of PV in summer peaks, University of NSW, Sydney, 2004.
Watt, Muriel for the International Energy Agency, Co-operative programme onphotovoltaic power systems, Task 1, National survey report of PV power applicationsin Australia 2003, Sydney, June 2004
// WEBSITEShttp://energy.sourceguides.com/businesses/index.shtml Renewable Energy Businesses
in the World.
http://www.aseanenergy.org/pressea/thailand/countryprofile/renewable_energy_sources.htm PRESSEA Thailand – Country Profile Renewable Energy Sources
http://www.ausaid.gov.au/country/default.cfm AusAID Country Programs
http://www.cordis.lu/eesd/src/indicators.htm CORDIS EESD Library Scientific andTechnological References – Energy Technology Indicators
http://www.cordis.lu/eesd/src/proj_eng.htm CORDIS EESD Funded Projects Part B Energy
http://www.creia.net/ Chinese Renewable Energy Industry Association
http://www.daws.com.au/Projects/Denham.html Diesel and Wind Systems, Denham, WA
http://www.dti.gov.uk/ Department of Trade and Industry Homepage
http://www.dti.gov.uk/energy/inform/energy_stats/renewables/index.shtml DTI EnergyStatistics Renewables
http://www.eere.energy.gov/ US DOE Energy Efficiency and Renewable Energy (EERE)Home Page
http://www.eere.energy.gov/state_energy/policy_options.cfm State – Policy IssuesWhat are the Policy Options for Renewable Energy
http://www.eia.doe.gov/cneaf/solar.renewables/page/renewelec.html#rea2001Renewables in Electricity
http://www.eia.doe.gov/fuelrenewable.html Renewable Energy Data, Tables and Charts
http://www.epia.org European Photovoltaic Industry Association
http://www.eppo.go.th/index-E.html EPPO Energy Policy and Planning Office, Thailand
http://www.erec-renewables.org/berlin2004.htm EREC Events
http://www.eurec.be/ European Renewable Energy Centres Agency
http://www.euromoneyenergy.com/energy.asp Euromoney Energy Events
http://europa.eu.int/comm/dgs/energy_transport/index_en.html EURPOA – Directorate-General Energy and Transport – Home Page
http://europa.eu.int/comm/research/energy/nn/nn_rt_pv1_en.html EUROPA – Research– Energy – Non-Nuclear Energy – Research Topics – Photovoltaics
http://www.fco.gov.uk/ Foreign and Commonwealth Office Home
http://www.fse-directory.net/search United National Environment Program, FinancingSustainable Energy Directory
http://www.globalclimate.org/ Global Climate
http://www.greenhouse.gov.au/ Australian Greenhouse Office
http://www.greenhouse.gov.au/international/kyoto/mechanisms.html Australian firmsand the market based mechanism of the Kyoto Protocol
http://www.greenpeace.org/international_en/ Greenpeace International
http://www.iea-pvps.org/ IEA PV Power Systems Program
http://www.industry.gov.au/ Australian Department for Industry, Tourism and Resources
http://www.jxj.com/ James and James Science Publishers
htp://www.mnes.nic.in/ Ministry of Non-Conventional Energy Sources, Government of India
http://www.meti.go.jp/english/aboutmeti/data/a234004e.html Japan Agency ofIndustrial Science and Technology
http://www.novem.org ‘Tailor-made Sustainability’, Novem, Dutch Agency for EnergyEfficiency and Renewable Energy.
http://www.nrel.gov/ US National Renewable Energy Laboratory (NREL)
http://www.originenergy.com.au/home/home_subnav.php?pageid=174 Origin EnergyAustralia – For My Home – Solar Energy.
http://www.platts.com/ Platts Energy Bulletin
http://www.platts.com/features/emissions/emissionsindex.shtml Platts Guide to theEmissions Marketplace
http://www.reeep.org/index.cfm?articleid=4 Renewable Energy and Energy EfficiencyProgram, Innovative Financing
http://www.re-focus.net/index.html REFOCUS The International Renewable EnergyMagazine
http://www.solaraccess.com/news/story?storyid=6793 Renewable Energy News- BPSolar Lands Major Thailand Contract
http://www.solarbuzz.com/Links/OffGrid.htm Solar Energy Markets Off Grid.
http://www.uneptie.org/energy/ United nations Environment program (UNEP) Energy Unit
http://www.unf.org United Nations Foundation
http://www.worldbank.org/ The World Bank Group
78 //

79 //
// GLOSSARY AND ABBREVIATIONSABARE Australian Bureau of Agricultural and Resource Economics
AC Alternating Current
ACRE Australian Cooperative Research Centre for Renewable Energy
ACT Australian Capital Territory
ADB Asian Development Bank
AERL Australian Energy Research Laboratories
AGO Australian Greenhouse Office
ANU Australian National University
ANZSES Australia and New Zealand Solar Energy Society
APEC Asia Pacific Economic Cooperation
ARC Australian Research Council
AREEN Australian Renewable Energy Export Network
ASEAN Association of South East Asian Nations
a-Si Amorphous Silicon
BAU Business as Usual
BASIX Building Sustainability Index
BCA Building Code of Australia
BCSE [Australian] Business Council for Sustainable Energy
BIPV Building Integrated Photovoltaics
BOS Balance of System
Bsi German Solar Industry Association
CAP Climate Action Partnership
CdTe Cadmium Telluride
CDM Clean Development Mechanism
CEGS Combined Energy Generation and Storage
CERES Centre for Education and Research into Environmental Strategies
CHAPS Combined Heat and Power Solar system
CIS Copper Indium Diselinide
COP Conference of the Parties
CREIA Chinese Renewable Energy Industry Association
c-Si Crystalline silicon
CSIRO Commonwealth Scientific and Industrial Research Organisation
DC Direct Current
DEUS [NSW] Department of Energy, Utilities and Sustainability
DOE Department of Energy (US)
DSC Dye Sensitised Cells
DSM Demand System Management
DSNP Distributed Service Network Provider
DTI Department of Trade and Industry (UK)
EPIA European Photovoltaic Industry Association
ERDC Energy Research and Development Corporation
EREC European Renewable Energy Council
ESAA Electricity Supply Association of Australia
EU European Union
GEF Global Environment Facility
GSES Global Sustainable Energy Solutions Pty Ltd
GST Goods and Services Tax
GTZDeutscheGesellschaft für Technische Zusammenarbeit GmbH, German Technical Cooperation, is an enterprise for international cooperation with worldwide operations, on behalf of the German government
GVEP Global Village Energy Partnership
GW Gigawatt
GWh Gigawatt hours
GWp Gigawatt peak
IEA International Energy Agency
IP Intellectual Property
ITR Department of Industry Tourism and Resources
KfW KfW Bankgruppe (owner by the German government (80%) and the Länder (20%)); development bank
kVA Kilovolt ampere
kW/m2 Kilowatts per square metre
kWh/m2 Kilowatt hours per square metre
THE AUSTRALIAN PHOTOVOLTAIC INDUSTRY ROADMAP

GLOSSARY AND ABBREVIATIONS
80 //
kWp Kilowatt peak
MJ Megajoule
MJ/m2 Megajoules per square metre
MNES Ministry of Non-conventional Energy Sources (India)
MOU Memorandum of Understanding
MPPT Maximum Power Point Tracker
MRET Mandatory Renewable Energy Target
MW Megawatt
MWh Megawatt hours
MWp Megawatt peak
Mt Million tonnes
NEM National electricity markets
NEMMCO National Electricity Market Management Company
NGOs Non-Government Organisations
Ni-cd Nickel Cadmium
NREL National Renewable Energy Laboratory
NSW New South Wales
O&M Operation and maintenance
OECD Organisation for Economic Co-Operation and Development
ORER Office of the Renewable Energy Regulator
Pa Per annum
PAWA Power and Water Authority
PV Photovoltaic [solar electricity]
PVMaT PV Manufacturing Program (USA)
PVPS Photovoltaic Power Systems Program [of the IEA]
PVRP Photovoltaic Rebate Program
R&D Research and Development
R,D&D Research, Development & Demonstration
RAPAS Remote Area Power Assistance Scheme
RCEP The Royal Commission on Environmental Pollution (UK)
RECP Renewable Energy Commercialisation Program
RECs Renewable Energy Certificates
REEEP Renewable Energy and Energy Efficiency Partnership
REID Renewable Energy Industry Development [program, of the AGO]
RISE Research Institute for Sustainable Energy
RRPGP Renewable Remote Power Generation Program
RTOs Registered Training Organisations
SEAV Sustainable Energy Authority Victoria
SECV State Electricity Commission of Victoria
SEDA [NSW] Sustainable Energy Development Authority
SEDO [WA] Sustainable Energy Development Office
SHS Solar Home System
SMUD Sacramento Municipal Utility District
SPS Stand-alone Power Systems (previously referred to as RAPs)
STI Sustainable Technology International
TAFE Technical And Further Education
TWh Terawatt hours
TWh/yr Terawatt hours per year
UK United Kingdom of Great Britain and Northern Ireland
UNDP United Nations Development Programme
UNEP United Nations Environment Programme
UNSW University of New South Wales
UPS Uninterruptible Power Supply
USA United States of America
USD United States Dollars
W Watts
Wh Watt hours
WWF World-Wide Fund for Nature
W/m2 Watts per square metre
€ Euro dollar
¥ Japanese yen

81 //
// APPENDICES
Appendix 1: The science of photovoltaics
Appendix 2: Chronology of the development of the PV industry
Appendix 3: Australian Government support programs
Appendix 4: Summary of US state policies
Appendix 5: Summary of USA state-based financial incentives
Appendix 6: PV modelling scenarios
Appendix 7: Key barriers to development of PV market in Australia
Appendix 8: Domestic market estimates by application sector
THE AUSTRALIAN PHOTOVOLTAIC INDUSTRY ROADMAP

82 //
APPENDIX 1// THE SCIENCE OF SOLAR PHOTOVOLTAICS
The solar resourceSolar energy as a resource is available where ever the sun shines. The quantity of theavailable resource is dependent on the latitude of the location, the local climaticconditions, and in most locations, the time of year.
A location close to the equator and in the middle of a continent, where there is littlecloud cover, will generally have the greatest available resource. Moving away from theequator, the available resource is reduced and this reduction is increased when the siteis near a coast where cloud from the ocean is typical
The instantaneous radiant solar power (called irradiance) is measured in Watts persquare metre (W/m2) and the energy from the sun arrives at the earth’s surface with apeak value of about 1kW/ m2. The instantaneous radiant solar power varies throughoutthe day as a result of the sun moving across the sky. The available solar powerincreases during the morning and peaks at about solar noon and then decreases in theafternoon as the sun ‘sinks’ down to the western horizon.
The total quantity of solar energy received over a day (called irradiation) is measured inmegajoules (MJ) per square metre. Manufacturers rate their PV modules at a peakpower value, that is, when the power from the sun is 1kW/ m2. To determine the dailyoutput of the PV module requires the daily solar energy to be converted to a kWh/m2
figure. This is obtained by dividing the MJ per square metre by 3.6.
Solar energy expressed in kWh/m2 is also called peak sun hours. The number of peaksun hours for the day is the representative (or equivalent) number of hours for whichenergy at the rate of 1kW/m2 is hitting the earth’s surface. Multiplying the peak sunhours by the peak power rating of a solar module determines the maximum amount ofenergy supplied by that module during the day.
At any given location, the available solar radiation is a maximum on the plane thatpoints directly at the sun. In reality with grid connected systems, the PV modules couldface either north east or north west, subject to the direction the roof of the building isfacing. When a PV module is not facing true north, the available solar resource isreduced. The angle between true north and that which the module faces is known asthe azimuth.
The available solar radiation data has been used to develop world maps showingaverage irradiation contours. An example of one of these maps is shown in Figure XX.This map shows the average value of irradiation received each day on an optimal tiltedsurface during the month with lowest solar radiation received on that surface.
Most of Europe, where there is a large demand for grid connected systems, generallyhas an average figure below 3 kWh/m2 per day. In the developing countries, particularlythe African Continent and through South East Asia, figures are above 4 kWh/m2 per day,which is ideal for stand alone power systems.
Australia, being a largely dry continent, has an excellent solar resource. Most of thecountry (generally north of latitude 35 degrees south) is above 4 kWh/m2 per day in theworst month of the year, which is ideal for stand-alone and grid connected systems. It isonly in the south western section of Victoria, south-eastern corner of South Australiaand in Tasmania where the average solar irradiation in the worst month is between 2and 3 kWh/m2 per day.
Photovoltaic science and technologies
Photovoltaics, as the word implies (photo = light, voltaic = electricity), convert sunlightdirectly into electricity. Photovoltaic (PV) or solar cells are made of special materialscalled semiconductors, such as silicon, which is currently the most commonly usedmaterial. Basically, when light strikes the cell, a certain portion of it is absorbed withinthe semiconductor material. This means that the energy of the absorbed light istransferred to the semiconductor. The energy knocks electrons loose, allowing them toflow freely. PV cells also all have one or more electric fields that act to force electronsfreed by light absorption to flow in a certain direction. This flow of electrons is acurrent, and by placing metal contacts on the top and bottom of the PV cell, we candraw that current off to use externally. This current, together with the cell’s voltage(which is a result of its built-in electric field or fields), defines the power (measured inwatts) that the PV cell can produce.
Silicon has some special chemical properties, especially in its crystalline form. Siliconhas excess electrons which can be freed by photons (light energy) and thereforecaptured as electricity. The silicon in a PV cell is modified slightly so that it will work asa PV cell. In particular, it contains impurities – other atoms mixed in with the siliconatoms, changing the way it reacts. We usually think of impurities as somethingundesirable, but in this case, PV cells wouldn’t work without them. Consider silicon withan atom of phosphorous here and there, maybe one for every million silicon atoms.Phosphorous has five electrons in its outer shell, silicon has four. It still bonds with thesilicon atoms, but phosphorous has one spare electron which doesn’t form part of a bond.
When energy is added to pure silicon, it can cause a few electrons to break free of theirbonds and leave their atoms. A hole is left behind in each case. These electrons thenwander randomly around the crystalline lattice looking for another hole to fall into.These electrons are called free carriers, and can carry electrical current. There are sofew of them in pure silicon, however, that they aren’t very useful. Impure silicon with

83 //
phosphorous atoms mixed in is a different story. It takes a lot less energy to knock looseone of the extra phosphorous electrons because they aren’t tied up in a bond. Theprocess of adding impurities on purpose is called doping, and when doped withphosphorous, the resulting silicon is called N-type (‘n’ for negative) because of theprevalence of free electrons. N-type doped silicon is a much better conductor than puresilicon.
However, only part of the PV cell is N-type. The other part is doped with boron, whichhas only three electrons in its outer shell instead of four, to become P-type silicon.Instead of having free electrons, P-type silicon (‘p’ for positive) has free holes. Holesreally are just the absence of electrons, so they carry the opposite (positive) charge.They move around just like electrons.
Every PV cell has at least one electric field. Without an electric field, the cell wouldn’twork, and this field forms when the N-type and P-type silicon are in contact. Suddenly,the free electrons in the N side, which have been searching for holes to fall into, moveto fill all the free holes on the P side. The electron flow provides the current, and thecell’s electric field causes a voltage. With both current and voltage, we have power,which is the product of the two.
The maximum energy that most cells can absorb from sunlight to produce electricity isabout 25 per cent. However, in practice the efficiency is closer to 17 per cent or less.
Figure A1.1 Operation of a PV cell
The band gap also determines the strength (voltage) of the electric field, and if it’s toolow, then what is made up in extra current (by absorbing more photons), is lost byhaving a small voltage. Power is voltage times current, and the optimal band gap,balancing these two effects, is around 1.4 eV for a cell made from a single material.
Figure A1.2 Composition of a PV module
There are a few more steps left before we can really use the cell. Silicon is a very shinymaterial, which means that it is very reflective. Photons that are reflected can’t be usedby the cell. For that reason, an antireflective coating is applied to the top of the cell toreduce reflection losses to less than 5 per cent. The final step is the glass cover platethat protects the cell from the elements. PV modules are made by connecting severalcells (usually 36) in series and parallel to achieve useful levels of voltage and current,and putting them in a sturdy frame complete with a glass cover and positive andnegative terminals on the back.
Single crystal silicon isn’t the only material used in PV cells. Polycrystalline silicon isalso used to cut manufacturing costs, although resulting cells aren’t as efficient assingle crystal silicon. Amorphous silicon, which has no crystalline structure and isformed by deposition onto a substrate, is also used, again in an attempt to reduceproduction costs. Other materials used include gallium arsenide, copper indiumdiselenide and cadmium telluride. These technologies are discussed in the followingsection. Since different materials have different band gaps, they are ‘tuned’ to differentwavelengths, or photons of different energies. One way efficiency has been improved isto use two or more layers of different materials with different band gaps. The higherband gap material is on the surface, absorbing high-energy photons while allowinglower-energy photons to be absorbed by the lower band gap material beneath. Thistechnique can result in much higher efficiencies. Such cells, called multi-junction cells,can have more than one electric field.
A Cover glassB Anti-reflective coatingC Contact grid
D N-type SIE P-type SIF Back contact
Sunlight
© 2000 How Stuff Works
A B C D EF
++ + + + + + + + + +
–
– – – – – – – – – –Load
A
B
AB
n-type siliconp-type silicon
photons
© 2000 How Stuff Works
8"
THE AUSTRALIAN PHOTOVOLTAIC INDUSTRY ROADMAP

THE SCIENCE OF SOLAR PHOTOVOLTAICS
84 //
PV cell and module technologies1
An individual PV cell is small in size and produces a small DC voltage, regardless of celltype. Thus they are typically connected in series and parallel to produce moresubstantial voltages and currents, and packaged in PV modules for ease of installationand environmental protection. PV modules are configured either as flat panels or inconcentrating systems where lenses or mirrors are used to focus sunlight on the cells.
Several different types of PV cell are manufactured, using a range of materials andproduction methods. Thin film cells are made by depositing thin layers of semi-conductor on low cost backing, such as glass, steel or plastic. Silicon is used to producemonocrystalline, polycrystalline and amorphous cells. Other materials are also used,including gallium arsenide, copper indium diselenide, cadmium telluride, and dyesensitised titania. Cells made from thicker silicon still dominate the market.
Crystalline silicon (c-Si)Crystalline silicon is the leading commercial material for PV cells. Its advantages includestable performance, low module manufacturing costs and mostly non-toxic materialsused in final production. It exists in several forms:
Monocrystalline or single crystalline siliconMonocrystalline silicon is the most common and efficient commercial technologyavailable. Monocrystalline silicon cells are, however, approaching their limit ofefficiency (about 25 per cent) this limit is determined by the band gap energy of silicon,meaning they can only absorb about one quarter of the light that strikes the cell.
Crystalline silicon cells work as described in the general solar overview above, and aremanufactured by cutting silicon wavers from one homogenous crystal in which all siliconatoms are arranged in the same direction. The monocrystal is manufactured using eitherthe Czochralski method or the floating-zone (FZ) technique.
Efficiency
� Lab 24%
� Commercial 13–18%
Embodied Energy 5600–24200 MJ/m2
Multicrystalline or polycrystalline siliconEfficiency: The operation of multicystalline PV cells is essentially the same asmonocrystalline cells. The differences exist in the way the PV cells are manufactured. Inmulticrystalline cell production a cast block of silicon is sawed first into bars and theninto wafers. These wafers are then joined in series to form PV modules.
Efficiency
� Lab 20%
� Commercial 12–17%
Embodied energy 2700–8300 MJ/m2
A new method of using c-Si cells has been developed by the Australian NationalUniversity and is being commercialised by Origin Energy. The Sliver‚ cell technologyinvolves slicing cells into thin strips and then positioning the strips into modules withvarying separations, depending on transparency and module output requirements. Thequantity of silicon required for a given power output can be significantly reduced.Micromachined using innovative manufacturing techniques to less than 70 microns thick(thinner than a human hair) from monocrystalline silicon, Sliver® cells demonstrateefficiencies of 19.5 per cent. While Sliver® cell efficiencies are competitive with otherconventional solar cells, they perform much better than most other thin filmtechnologies. Sliver® cell trial modules tested by Sandia National Laboratories in theUnited States show efficiencies comparable with other solar power module productsnow on the market.
Sliver® cells also differ radically from conventional solar cells in size and shape. Theyare long, ultra thin, quite flexible and perfectly bifacial. This is unlike conventional solarcells which are typically square or round, up to 4 to 5 times thicker, quite rigid andusually single sided. Pilot production is expected in Adelaide in late 2004.
Ribbon and sheet technologyRibbon and sheet silicon, as the name suggests, is formed as a ribbon or sheet ofsilicon. This can be formed by extracting either a hollow tube or two parallel dendritesfrom molten silicon. These processes result in either a ribbon or sheet of silicon whichcan then be cut into the desired length for module production.
This process is viewed as having possibilities for cost reduction compared to the mono-and multi-crystalline manufacture described above, however current production islimited, and the efficiency of these types of panels is relatively low.

THE AUSTRALIAN PHOTOVOLTAIC INDUSTRY ROADMAP 85 //
Efficiency
� Lab 16%
� Commercial 10% (Evergreen solar)
Embodied energy Not available
Thin layer siliconThin-layer crystalline silicon PV cells are believed to offer low cost high efficiencyproduction. Thin-layer silicon is considered to be <50 nanometers thick and is depositedon a foreign substrate. Potential advantages of thin-layer approaches include less siliconusage, lower deposition temperatures relative to melt growth and monolithic moduleconstruction possibilities.
Disadvantages include incomplete light absorption and therefore the probable need forlight-trapping. The challenge for successful thin-layer silicon is to produce a 10 to 50-nanometre silicon layer of sufficient electronic quality with a diffusion length greaterthan the layer thickness and a grain size comparable to the thickness. A fast depositionrate of >10m/min on a low-cost substrate such as glass is also needed. There is not yetany significant quantity of thin-layer crystalline silicon in commercial production for PVbecause only partial successes have been achieved in meeting the challenge.Improvements in substrate quality are necessary for high quality consistency andefficient PV cells.
One such technology is being developed by Pacific Solar Australia, in a joint venturewith Unisearch, the commercial arm of the University of NSW, and a number of publicand private investors. The technology consists of multiple very thin layers ofpolycrystalline silicon on glass of approximately 3mm thickness. Pilot production hascommenced and full production is planned in Germany for 2005.
Efficiency
� Lab 8.2%
� Commercial No commercial production
Embodied Energy Not available
Thin film technologiesThin film photovoltaic cells use layers of semiconductor materials only a fewmicrometers thick, attached to an inexpensive backing such as glass, flexible plastic, orstainless steel.
Amorphous silicon (A-Si)Amorphous silicon is one semiconductor material used for thin film modules; it differsfrom the panels previously described because it does not have a crystalline structure.
The advantage of these modules is that they can be produced cheaply. They do howevercarry some disadvantages, such as lower efficiency, and so are much larger (surfacearea per watt) than the other technologies and they also deteriorate, at least initially,with exposure to the sun. This is due to the Staebler-Wronski effect.
After a brief period of commercial production of larger scale modules by a number ofmanufacturers, amorphous silicon is now less than 10 per cent of the PV market andessentially used for purpose made roofing products and for very small applications, suchas calculators and watches.
Efficiency
� Lab 13%
� Commercial 6–9%
Embodied energy 1010–2750 MJ/m2
Copper indium diselenide (CIS)This type of thin layer PV cell has shown the highest efficiency of the thin film modules,in fact it has proven to be as efficient as polycrystalline silicon cells. These efficientmodules have been developed by including gallium and graded layers (differing levels ofGallium) in the cells to increase efficiency.
Before CIS modules can become commercially viable, some issues need to be resolvedregarding manufacturing. CIS is efficient because it is complex, and this complexitymakes manufacturing difficult and expensive. This technology is fairly new and there isno commercial production, however National Renewable Energy Laboratory in USA haspatented some technologies for commercial production.
Efficiency
� Lab 18%
� Commercial No commercial modules
Embodied energy Not available
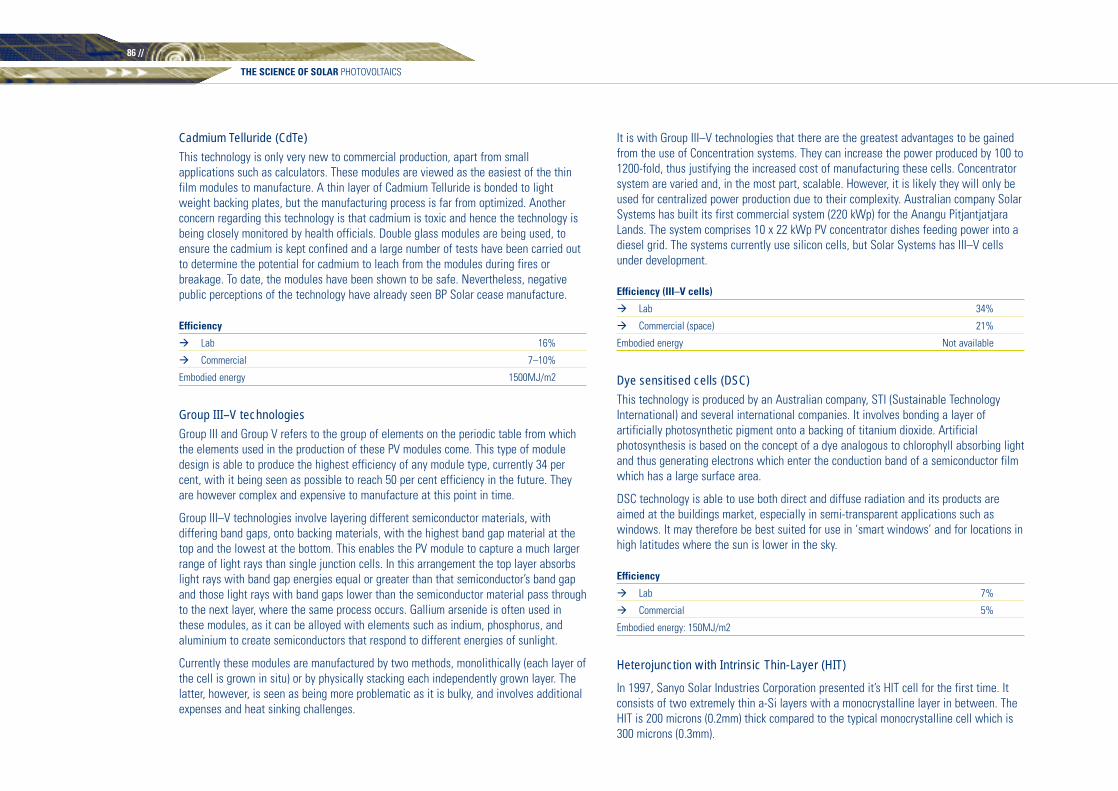
THE SCIENCE OF SOLAR PHOTOVOLTAICS
86 //
Cadmium Telluride (CdTe)This technology is only very new to commercial production, apart from smallapplications such as calculators. These modules are viewed as the easiest of the thinfilm modules to manufacture. A thin layer of Cadmium Telluride is bonded to lightweight backing plates, but the manufacturing process is far from optimized. Anotherconcern regarding this technology is that cadmium is toxic and hence the technology isbeing closely monitored by health officials. Double glass modules are being used, toensure the cadmium is kept confined and a large number of tests have been carried outto determine the potential for cadmium to leach from the modules during fires orbreakage. To date, the modules have been shown to be safe. Nevertheless, negativepublic perceptions of the technology have already seen BP Solar cease manufacture.
Efficiency
� Lab 16%
� Commercial 7–10%
Embodied energy 1500MJ/m2
Group III–V technologiesGroup III and Group V refers to the group of elements on the periodic table from whichthe elements used in the production of these PV modules come. This type of moduledesign is able to produce the highest efficiency of any module type, currently 34 percent, with it being seen as possible to reach 50 per cent efficiency in the future. Theyare however complex and expensive to manufacture at this point in time.
Group III–V technologies involve layering different semiconductor materials, withdiffering band gaps, onto backing materials, with the highest band gap material at thetop and the lowest at the bottom. This enables the PV module to capture a much largerrange of light rays than single junction cells. In this arrangement the top layer absorbslight rays with band gap energies equal or greater than that semiconductor’s band gapand those light rays with band gaps lower than the semiconductor material pass throughto the next layer, where the same process occurs. Gallium arsenide is often used inthese modules, as it can be alloyed with elements such as indium, phosphorus, andaluminium to create semiconductors that respond to different energies of sunlight.
Currently these modules are manufactured by two methods, monolithically (each layer ofthe cell is grown in situ) or by physically stacking each independently grown layer. Thelatter, however, is seen as being more problematic as it is bulky, and involves additionalexpenses and heat sinking challenges.
It is with Group III–V technologies that there are the greatest advantages to be gainedfrom the use of Concentration systems. They can increase the power produced by 100 to1200-fold, thus justifying the increased cost of manufacturing these cells. Concentratorsystem are varied and, in the most part, scalable. However, it is likely they will only beused for centralized power production due to their complexity. Australian company SolarSystems has built its first commercial system (220 kWp) for the Anangu PitjantjatjaraLands. The system comprises 10 x 22 kWp PV concentrator dishes feeding power into adiesel grid. The systems currently use silicon cells, but Solar Systems has III–V cellsunder development.
Efficiency (III–V cells)
� Lab 34%
� Commercial (space) 21%
Embodied energy Not available
Dye sensitised cells (DSC)This technology is produced by an Australian company, STI (Sustainable TechnologyInternational) and several international companies. It involves bonding a layer ofartificially photosynthetic pigment onto a backing of titanium dioxide. Artificialphotosynthesis is based on the concept of a dye analogous to chlorophyll absorbing lightand thus generating electrons which enter the conduction band of a semiconductor filmwhich has a large surface area.
DSC technology is able to use both direct and diffuse radiation and its products areaimed at the buildings market, especially in semi-transparent applications such aswindows. It may therefore be best suited for use in ‘smart windows’ and for locations inhigh latitudes where the sun is lower in the sky.
Efficiency
� Lab 7%
� Commercial 5%
Embodied energy: 150MJ/m2
Heterojunction with Intrinsic Thin-Layer (HIT)
In 1997, Sanyo Solar Industries Corporation presented it’s HIT cell for the first time. Itconsists of two extremely thin a-Si layers with a monocrystalline layer in between. TheHIT is 200 microns (0.2mm) thick compared to the typical monocrystalline cell which is300 microns (0.3mm).

87 //
While the performance of most crystalline cells drops by 0.4 to 0.5 per cent with eachdegree Centigrade increase in temperature, HIT only decreases by 0.33.
Sanyo released the technology in commercial modules in April 2003 as one of thehighest efficiency PV technologies on the market. Efficiency
� Lab 21%
� Commercial 19.55%
Embodied energy Not available
Balance of system componentsA PV system produces electrical energy and, depending on the design of the power-conditioning unit, a grid-connected PV system can also contribute to local voltagecontrol and waveform improvement. With the addition of energy storage (usually in theform of batteries), a grid-connected PV system can also improve reliability of supply tohigh-value end-uses by providing an uninterruptible power supply (UPS) function. Byadding more storage, an autonomous power supply system can be created that cansupply local load without grid connection, providing that the PV system is sizedappropriately to the requirements of the load.
Though the PV array is the central part of any PV power system, other equipment isrequired to either allow the output of the array to connect to loads (off-grid systems) orto interconnect to the grid (grid connect systems). This equipment is typically referred toas Balance of System (BOS) components.
Figure 3 shows the typical system schematic for a PV off-grid system. The systemincludes a solar regulator (or controller), battery bank and it may or may not include aninverter. Simple systems, for example solar lighting or telecommunication systems,typically operate directly from the controller/battery system. Multi-function systems, forexample power systems for rural Australian households, would use an inverter so thatstandard 240 volt ac appliances can be used.
Figure A1.3Schematic of typical off-grid system
Figure 4 shows the schematic of a grid-connected system. Other than wiring andmetering, the only additional equipment required is a grid interactive inverter.
Figure A1.4 Schematic of typicalgrid interactivesystem
PV arrayGrid interactive
inverter
Grid
Regulator or controller
Inverter
Battery
PV array
THE AUSTRALIAN PHOTOVOLTAIC INDUSTRY ROADMAP

THE SCIENCE OF SOLAR PHOTOVOLTAICS
88 //
BatteriesPower can be supplied by a PV module only when there is sufficient solar radiation, andonly during the day. Therefore, there are only a few applications, like water pumping,where a PV module can be directly connected to the load. However, in many stand-alonesystem applications, the demand for electricity may be at night or in cloudy weather, sothere needs to be a way to store the energy generated from the PV modules during theday for later use.
Many systems for energy storage have been tried but at present battery storage is themost convenient and cost effective for stand alone power supply systems. Batteriesstore potential energy in the chemical bonds of the materials within the battery. Atpresent, the most cost effective batteries for PV power systems are vented lead acidbatteries which are made up of battery cells, each of which produce 2 volts nominal.
Not all batteries are the same. Batteries are designed to meet specific requirements. Acar battery is designed to provide large currents for a short period of time to start amotor. Although the operating principles are the same, the design of a car battery,particularly the plates and the acid level within the electrolyte, is completely different toa battery required in a stand alone PV system. The latter need smaller currents forlonger periods and are known as deep cycle batteries. They must be suitable for deepdischarging but also be able to be recharged effectively by the typical charging currentsavailable from the PV array.
Though wet lead acid batteries are the most common batteries used in stand alonepower systems, other types of batteries can be used. These include:
� Valve regulated lead acid (VRLA).
� Gel batteries.
� Nickel Cadmium (Ni-cd)
Batteries under development but not fully commercialized include:
� Vanadium redox battery.
� Zinc-bromine battery.
Solar regulator Batteries are the ‘heart’ of off-grid power systems. They must be protected fromovercharging (which causes plate corrosion, gassing and loss of water) and fromdischarging below their cut-off voltage, which can cause permanent damage to thebattery and loss of capacity. Regulators (sometimes called controllers) are an essentialpart of any battery based electrical system to prevent overcharging of the battery andsubsequent damage.
When a battery is being charged the battery’s voltage will rise. At a certain voltage(typically between 14V and 15V for a 12V battery), nominated by the batterymanufacturer, the battery will be assumed to be charged. The voltage should not riseabove this level. At this voltage level the solar regulator must then control the chargingcurrent from the PV array to ensure the battery is not overcharged.
Some regulators will include an LCD screen that can show:
� Charge current.
� Battery voltage.
� Load current.
� Battery state of charge.
Some of these regulators can also perform a system control function by incorporatingswitches that can be programmed to be opened and closed at certain times or voltages.These switches could be used to connect the PV array to certain loads (eg. pumps) whenthe batteries are fully charged or to start a genset if the battery voltage is low.
Another type of regulator is known as the Maximum Power Point Tracker (MPPT). Thesetrack the maximum power point of the PV array and since this voltage point is higherthan that required to charge the battery , the extra voltage (actually power) iselectronically transferred by a DC-DC power converter into extra charging current at thelower battery charging voltage. The MPPT’s then perform as a regulator and prevent thebattery from being overcharged by reducing the charge current when the ‘boost’ voltageis reached and then maintaining a ‘float’ voltage for the rest of the day.
Inverters
Off-grid systems
PV modules produce power as DC, that is direct current, and batteries store energy asDC. Many appliances can be manufactured to operate from DC power. In Solar HomeSystems in developing countries the system is only DC and the householders use DClights and some have DC TVs, radios and other appliances.
The power grid supplies power as AC, alternating current. In Australia the typicalvoltage is 240V, in Europe 220 to 230V and in USA 110V.
To convert the DC power from the batteries to 240V AC an electronic device called aninverter is used. In principle this unit uses electronic switching to convert the DC voltagefrom the battery bank to an AC voltage of similar value. A transformer is then used toconvert from the smaller AC voltage to 240V, the same voltage as the battery bank.

89 //
Sine wave inverters are the standard inverter installed in the Australian market. Theyare available in different configurations, including:
� Inverter only: These convert DC battery power to AC power as previously described.
� Inverter/charger: These act as a standard inverter but when connected to anotherAC generator source, they work backwards by converting the AC power to DC powerand charging the batteries (similar to a standard battery charger).
� Interactiveinverter: These act as a standard inverter but when the genset starts, theinverters will synchronise with the genset, then parallel with the genset and thenconnect the loads to the genset before reverting to a battery charger.
Grid interactive
A grid interactive inverter converts the DC power from the PV array to AC power whichis then supplied to the local load or exported or fed into the local AC power grid. In mostcountries the inverter must meet many safety and protection requirements before beingapproved for grid connection.
In general the inverter must be able to:
� Synchronise with the grid before connecting the PV array power to the grid.
� Immediately disconnect from the grid when the grid has failed (blackout).
� Continuously monitor the grid for variation of certain technical parameters (e.g. voltage, frequency) and disconnect immediately from the grid under certainspecified variations.
� Not supply the loads directly while still connected to the grid, but when the grid hasfailed (No Islanding).
The standard grid interactive inverter is designed only to supply power to the grid andtherefore not to operate with a battery. To achieve maximum output from the PV arraythe inverter will incorporate a maximum power point tracker (MPPT). This is part of theinbuilt electronics of the inverter and not a separate device.
THE AUSTRALIAN PHOTOVOLTAIC INDUSTRY ROADMAP

90 //
APPENDIX 2// CHRONOLOGY OF THE DEVELOPMENT OF THE PV INDUSTRY1
This chronology has been prepared to give indicative time frames fort he development ofthe PV industry in Australia, and to place it in a global timeframe as well. It is notexhaustive, and a more in-depth analysis of the development of the PV industry is availablein the publication, From Space to Earth, The Story of Solar Electricity, by John Perlin.
1839 ‘Edmond Becquerel discovers the photovoltaic effect, the first of several effects discovered in the 19th century; he observes a voltage between two electrodes in an electrolyte produced by exposing one electrode to light’.
1876 ‘William G. Adams and R. E. Day conduct an experimental study on the photovoltaic properties of selenium and discover the effect in selenium barrier-cells’.
1930 The photovoltaic effect of light on selenium is rediscovered by B. Lange.
1931 ‘The photovoltaic effect of light on selenium is rediscovered for the second time in two years, this time by L. Bergmann’.
1954 ‘Bell Telephone scientists D. M. Chaplin, Calvin Souther Fuller and G. L. Pearson, following an idea put forward… by Paul Rappaport, develop the silicon photovoltaic cell, which can produce electric power from sunlight’.
1979 Tideland Energy establish first solar manufacturing plant in the Southern Hemisphere with help from the government
1980 Field tests in Australia on crystalline silicon modules by Telecom Research Laboratories start.
1981 ‘Adam Heller, Barry Miller and Ferdinand A. Theil announce a liquid junction cell that converts 11.5 per cent of solar energy into electricity’.
1983 ‘A team of German scientists develops a ‘wet’ solar cell that has an energy conversion efficiency of 9.5 per cent’.
1988 ~ Field tests in Australia on amorphous silicon modules by Telecom Research Laboratories start.
1984 ~ PV cell efficiency – under one-sun illumination – reaches 17 per cent.
1984 Texas Instruments begin exploring a PV manufacturing process called Spheral Solar™ – ‘spheres of silicon embedded into aluminium that creat a highly flexible durable cell’. {Graf, 1993}
1985 ~ ‘The first non-concentrating silicon solar cell to exceed 20 per cent efficiency was made at the University of New South Wales (UNSW)’. {Thorpe et al 1993}
1985 BP purchases American owned PV manufacturing plant in Sydney from Tideland Energy and establishes BP Solar.
1985 BP license Laser Grooved Buried Grid technology from UNSW.
1989 Establishment of Centre for Photovoltaic Devices and Systems at UNSW
1989 ‘Scientists at the High Technology Centre of Boeing develop a stacked photovoltaic cell that converts 37 per cent of solar radiation into electricity; the cell consists of two types of photovoltaic materials mounted on top of each other; the upper cell consists of gallium arsenide and captures the energy of blue light, while the second cell is made of gallium antimonide, converting red light into electricity’.
1989 ‘Scientists at Scandia National Laboratories develop a single photovoltaic cellcontaining silicon that converts 20.3 per cent of radiation into electricity’.
1989 BP Solar awarded turnkey project for 1,000 Lighting Kits in Sri Lanka.
1990 BP Solar establish ‘Pilot’ Production of ‘Saturn’ (UNSW)high efficiency cell technology.
1991 ‘Michael Gratzel and co-workers at the Swiss Federal Institute of Technology in Lausanne patent a type of transparent solar panel that supplies electricity and can be fitted on buildings as ordinary windows’.
1992 Centre for Sustainable Energy Systems at Australian National University (ANU) begins solar cell fabrication and significant R & D
BP Solar awarded US$2m Contract for Rural Infrastructure Project in Sri Lanka
1993 PV cell efficiency of 23.1 per cent – under one-sun illumination – achieved by UNSW.
1993 Project Aurora, one of Australia’s first grid interactive PV systems was installed at CERES in Melbourne and connected to the (then) Brunswick
1 A Brief History of Photovoltaics in Australia, prepared by Stephen Ingourille, Going Solar, on behalf of Business Council for Sustainable Energy for the Australian PV Roadmap, June 2004

91 //
Electricity Supply Department. The system (designed by Butler Solar) included 48 PV modules (supplied by Going Solar in Victoria) and a 14 kW 3 phase grid interactive inverter (from Butler/Siemens).
1993 24kW of ‘buried contact’ solar cells installed ‘to power a funicular railway near the parliament house in Bern, Switzerland’. {Thorpe et al 1993} The cells were manufactured in Spain under licence to UNSW.
1993 Nine of the top ten cars in the long distance ‘Sunrayce 93’ from Arlington, Texas to Minneapolis near the Canadian border, use ‘buried contact’ solar cells developed by the UNSW.
1994 ANU research into Combined Heat and Power Solar (CHAPS) systems beings.
1995 ANU multicrystalline cell research begins – resulting in world record efficiencies.
1995 BP Solar awarded US$5m contract for East-West Pipeline TelecommunicationsProject in Saudi Arabia.
1996 BP Solar awarded US$4m contract for rural infrastructure project (MORD1) in Malaysia.
1996 BP Solar supply A$44M worth of systems to 36,400 homes in Indonesia.
1997 Epilift technique invented at ANU – and lead to research into current Sliver®
technology
1997 200kW ‘solar farm’ established near Singleton in NSW by energyAustralia using BP Solar modules.
1997 600kW aid project to supply PV on houses in the Philippines by BP Solar
1998 Boral (now Origin Energy) invests $3.6 million over 3.5 years to commercialise ANU Epilift tewchnology.
1998 BP Solar supply 100kW of PV for the Wilpena Pound solar diesel hybrid power plant in South Australia
1998 629 homes (initially) in the Sydney Olympic Village supplied with grid interactive PV systems by BP Solar.
1998 BP Solar awarded contract for provision of innovative PV systems for the grid connected lighting towers in the Olympic Boulevard
1998 Solarex awarded Exporter of the Year in the category of medium size business.
1999 BP merges with Amoco worldwide and as a consequence the Sydney-based
Solarex and BP companies merge with the eventual establishment of a new factory at Sydney Olympic Park in Sydney.
1999 BP Solar receives RECP grant for improvements to performance and manufacture of polycrystalline cells.
1999 Melbourne utility, CitiPower, initiates ‘100 PV Roofs Program’. (Most systems installed by Allied Solar in the two months before the GST was introduced.)
2000 BP Solar relocates all manufacturing, sales and engineering to Sydney OlympicPark, Sydney, expanding capacity by 400 per cent.
2001 BP Solar opens Sydney Olympic Park manufacturing Facility (25 MW capacity by end of year)
2002 Australia’s largest PV array – 199.2 kWp – installed on the roof of the Queen Victoria Market sheds.
2002 ANU CHAPS system launched.
2003 Demonstration ANU CHAPS system installed on Bruce Hall.
2003 BP Solar increased capacity of Sydney Olympic Park manufacturing facility to 35MW.
2003 ~ Origin Energy establishes plant in South Australia to manufacture Sliver cell technology developed by Andrew Blakers of ANU.
2004 Australia Post releases set of four renewable energy stamps. Philatelic Department reports unprecedented interest with demand outstripping prediction by 75 per cent.
~ Dates are indicative
THE AUSTRALIAN PHOTOVOLTAIC INDUSTRY ROADMAP

92 //
APPENDIX 3// AUSTRALIAN SUPPORT PROGRAMS FOR PV
Directly supported national programs
PVRP – Photovoltaics Rebate ProgramThe PVRP program commenced in January 2000 to encourage the development and useof building mounted PV, in particular in the grid connected market. Since the RRPGP (seebelow) was not planned to operate in Victoria and only has limited funding in NewSouth Wales, the PVRP was also available to be used for stand alone systems.
The program is funded by the Australian Government and administered by the States.The initial funding was $31 million over 4 years and was due to finish at the end of2003. In February 2003, the program had been oversubscribed for the 2002/2003financial year and was capped to $100,000 per month. In the 2003/04 Budget,announced in May 2003, the program received an extra $3.6 million for 2003/04 (totalfunding $5.8 million available for the year, making a total of $40.4million) and also $5.8million for the 2004/05 financial year. The program is now due for completion aroundJune 2005. Of this funding, $1 million has been assigned for demonstrative PV projectsby property developer companies. These projects are to be selected via a competitivebidding process.
Initially, grants of $5.50 per Watt were available for both new systems and extensionsto existing systems, up to 1500 Watts. Therefore the maximum grant was $8250. Sincethere was a rapid uptake of the grants in the first 6 months (see figure 4.4) the ruleswere changed to $5 per Watt for new systems ($7500 the maximum grant) and $2.50per Watt for system upgrades.
At the time of the May 2003 budget, new rules were announced:
� All new residential systems – $4 per watt grant up to a 1000 watt system.(Maximum grant $4000).
� For system upgrades – $2.50 per watt grant up to a 1000 watts (maximum grant $2500).
� For Community buildings – $4 per watt up to a 2000 watt system (maximum grant $8000).
Since the start of the program, over 5000 systems have been installed, representingover 5.7MWp of PV installed.
RRPGP – Remote Renewable Power Generation ProgramThe purpose of this program is to:
� Increase the use of renewable energy for power generation in off-grid areas.
� To reduce diesel use.
� To assist the Australian renewable energy industry.
� To assist in meeting the infrastructure needs of indigenous communities.
� To reduce greenhouse gas emissions.
Core funding for this program is provided to the States by the Australian government, onthe basis of diesel fuel excise collected in the years 2001/02 to 2003/04 from diesel fuelused by public generators not connected to main electricity grids. Grants of up to 50 percent of the capital cost of renewable energy systems are available for dieselreplacement. The program is administered by State governments, with additionalfunding provided by some States. Up to $200 million is expected to be available over thelife of the program, which can extend to 2010. As at the end of April 2004, $130m ofRRPGP funds has been committed.
A specific allocation of $8 million has been made to the Aboriginal and Torres StraitIslander Commission (ATSIC) to assist with the development of industry capability andlocal understanding of renewable energy systems in indigenous communities.
Each State has established a slightly different program, to meet the specific needs oflocal off-grid applications. However, in general, the target groups are indigenous andother small communities, commercial operations, including pastoral properties, touristfacilities and
2.1 MWp of PV has so far been installed under generic State programs, and 1MWp hasbeen installed or approved in large PV projects, including solar arrays and dishconcentrators. Although RRPGP is not PV specific, most systems installed to dateinclude some PV and PV makes up a significant proportion of installed capacity. $128million has been allocated to date under the program.

93 //
OVERVIEW: BUSHLIGHT
The Bushlight program will operate over 4yrs, from 2002 to 2006. Its funding of $8 million comes from the Australian Greenhouse Office (RRPGP program) and ATSIS
$4 million has been expended to date on project deployment, with approximately 200 remote Communities visited, and 15 systems installed (35 kWp total). Typical household systems are designed to deliver 6–8 kWh per day, and cost around $75,000.
Bushlight has a number of expected outcomes
Improve design of RE systems. This is happening on three levels
� Small household systems – approximately 30 installed or currently being installed, with design review underway. Systems typically designed to meet energy needsof single house or house plus shelters.
� Community systems – Design loads in range of 10–32 kWh per day. Typically supply a small group of houses.
� Larger hybrid systems – Design loads 30–150 kWh per day. Typically supply large group of houses.
Improve community capacity to manage energy services
� Education (see below)
� Access to information (see below)
� Community Energy Planning (CEP) process. Regional teams carry out this process with about 30 communities involved so far. Energy decisions are owned anddocumented by the community with very positive results so far. Based on a participative planning process including significant community based education in the areasof energy sources and uses, energy efficiency, demand side management, RE system operation and troubleshooting. Key element of CEP is agreement on how systemswill be serviced, maintained and financed. CEP is appropriately documented to record decisions and to ensure ongoing community access to information.
Improve access to service provision
� Self support Community based support
� Training as many people in the community as possible to operate, troubleshoot and carry out very basic maintenance of RE systems
� Resource Agencies
� Developed a short course to train office and field staff of resource agencies to usefully answer questions about RE systems and to provide first level support in the field.
� Will be rolling this out comprehensively over the next year
� Technical Service Providers
� Identifying people who will support remote area communities
� Ensuring the right resources are available
� Drawings and parts list available on disk before visit to community
� Spare parts kit available in each region
� Increasing the number of BCSE accredited people who can respond to technical service calls.
�
THE AUSTRALIAN PHOTOVOLTAIC INDUSTRY ROADMAP

AUSTRALIAN SUPPORT PROGRAMS FOR PV
94 //
Mandatory Renewable Energy TargetThe Mandatory Renewable Energy Target (MRET) was introduced by the AustralianGovernment in 2001. MRET requires electricity retailers to meet annually increasingrenewable energy targets. The scheme aims to deliver 9500GWh of additionalrenewable energy from 1997 levels (15,970GWh) by 2010 and continues to 2020 (seegraph below). Under MRET, Renewable Energy Certificates (RECs) are created; 1 REC = 1MWh. Once RECs are created from generation or ‘deeming’, they can then be traded.Retailers must surrender RECs to meet their renewable energy target. The scheme iscurrently undergoing a scheduled review. For solar photovoltaic (PV) systems, five yearsof RECs can be created upfront, or deemed, on installation of the system for expectedgeneration (and every five years thereafter). BCSE believes that PV systems should beeligible for 20 years deeming upfront, in line with product guarantees, for more effectiveindustry development. ‘Deeming’ is an innovative feature which we believe is unique toMRET, but which has significant potential application to schemes in many othercountries.
Indirect government PV support programsIn addition to the two grant programs above, the Australian Government over the last 5years has initiated a number of other programs which can provide indirect support forPV. Note that the RECP funding has been fully committed, but some of the fundedprojects are still being completed. The indirect programs include:
Renewable Energy Commercialisation Program (RECP)
The RECP operated from 1998 to 2002 and had an initial budget of $56 million, of which$6 million was allocated to industry development (see below).
The RECP (Commercialisation) had a total of six rounds and provided funding between$100,000 and $1 million to support competitively selected projects which demonstrated:
� Strong commercialisation potential (or, for feasibility studies and/or prototypedevelopment, a clear pathway to commercialisation).
� Contribution to the wider development and diversification of Australia’s renewableenergy industry, domestically and/or internationally.
� Reduction of greenhouse gas emissions.
Approximately $11.3 million was allocated to PV related projects.
Renewable Energy Industry Development (REID)
This $6 million program continued until 2003 with three rounds of funding beingcompleted. The programs funded were for renewable energy not just for PV, but $1.3million has been allocated to contribute to the development of the PV industry. Thetypes of projects supported helped the PV industry through such activities as promotion,support and development of training, accreditation programs, standards developmentand product testing.
Renewable Energy Equity Fund (REEF)
The Renewable Energy Equity Fund is a $26.5 million (approx) venture capital fundestablished to increase investment in renewable energy technologies through theprovision of equity finance. It is funded to $18 million (approx) under the AustralianGovernment’s REEF program and $8.5 million (approx) from private sources. The Fundinvests in high growth emerging Australian companies with domestic and global marketpotential in the renewable energy industry.
State Government ProgramsAll states are involved in administering the PVRP and RRPGP (all states except Victoriaand Tasmania) and some states have additional programs and/or contribute funds toexisting federal programs. Some programs are dedicated to PV while other programs aredesigned for all Renewable Energy technologies. State government programs for PVinclude the following.
Victoria
Over the last 4 years, Victoria has allocated $6,772,456, under PVRP. This equates to1,419,109 kWp installed, with system sizes ranging from 4.5 kW to 19.2 kW, and costingbetween $10,000 to $28,000.
The Victorian Renewable Energy Assistance Program (REAP) ran for a two year periodover 1995 and 1996. This followed the earlier Remote Area Power Supply IncentiveScheme (RAPSIS) run by the SECV. The initial budget was $100,000 of state governmentfunding and $40,00 of funding from Eastern Energy and Powecor. REAP provided amaximum of $300o for RAPS systems
The objectives were to encourage the use of RE components in the supply of electricityin off grid residential situations and to improve the quality of installations of thesesystems.

95 //
New South Wales
SEDA/DEUS’s Renewables Investment Program (RIP) provides funding assistance forrenewable energy projects in NSW through regular six monthly funding rounds.Appropriate projects are funded on a competitive basis based on greenhouse gassavings, the level of innovation displayed, the degree of market transformation andcommercial returns. The RIP provides loans of up to 40 per cent and grants (if available)of up to 20 per cent of the total capital cost of projects. RIP grants were made availablefor two innovative solar projects in 2002/03.
The SEDA-administered Building Integrated PV Rebates end as of end June 2004. SinceJuly 2003 SEDA has been providing grants purely for investment properties (up to$2400/1kWp) and businesses (up to $4800/2kWp), which are not eligible for PVRPsupport.
SEDA also supports broad PV industry development under its solar program throughactivities such as the ‘Who Buys Solar Power’ market surveys and facilitatingcooperation between the PV and the Electricity Supply industries in NSW.
SEDA initiated a program called ‘Solar in Schools’ (SIS) in 1999 and is currently engagedwith Phase 3 of the program. SIS provides participating schools across NSW with a PVsystem. The participating schools receive:
� Installation of a 1.5kW (nominal) grid-connected solar power system
� A ‘Solar Explorer’ educational resource kit for use within the school.
� Teachers’ training to use the kits and the related SIS website.
Other schools not directly participating in the program can also learn about solar energy,access historical performance data from participating schools and benefit from theresults of the program through the national solar schools education website:www.solarschools.net
The Solar in Schools program commenced in November 1999 with a pilot program of 18schools. This was a partnership between the Sustainable Energy Development Authority(SEDA), the NSW Department of Education and Training (DET) and Integral Energy. SEDAdeveloped educational resources, provided financial support and managed the program.DET supplied financial support. Integral Energy supplied equipment and carried outinstallations.
In 2002, SEDA and DET extended Solar in Schools to a further 25 schools (Phase 2), so that today, more than 20,000 school children in 43 NSW Solar Schools are learningabout renewable energy, energy efficiency and global warming through the Solar inSchools program. with 70.56kWp of PV in total. Total program expenditure to date is$950,000. SEDA created between 25 and 50 new Solar Schools in 2003.
Northern Territory
Under RRPGP implementation there have been 120 SPV installations and 70 waterpumping systems approved for rebates. The Total approved rebate to date amounts to$10.3 million. The expected annual diesel fuel savings will be 1.53 million litres, andthere will be expected annual GHG savings of 4100 tonnes. Total RE installed capacityapproved in the Territory under the RRPGP is 1.44 MW. The break-up of this is asfollows:
� Concentrators 720 kW
� PV fuel saver 280 kW
� PV Hybrid 325 kW
� PV stand alone 63 kW
� PV/Wind 9 kW
� PV Water pumping 47 kW
Queensland
Working Property Rebate Program (WPRS)
A joint Queensland Government and Commonwealth initiative, this scheme applies tofamily owned working properties located in selected remote shires in Western andNorthern Queensland not connected to the main or Mount Isa electricity grids.Applications from properties outside these basic criteria will be considered on a case bycase basis.
The WPRS is designed to encourage the use of renewable energy, reduce the use ofdiesel, and service the power needs of working properties in remote Queensland. Thepurpose of the scheme is to make appropriate and reliable electricity supplies availableto remote working properties, thereby improving the quality of life.
It assists with the installation of large Stand-alone Power Systems (SPS). It is fundedunder the RRPGP ($8M) and by the Queensland Government ($4M). The scheme iscurrently expected to continue until the earliest of mid 2006 or funds are exhausted.
Applicants who satisfy the conditions of the scheme may be eligible for a rebate of upto $175,000. The maximum rebate is funded as follows:
� Commonwealth funding 50 percent up to $150,000.
� State funding 15 percent up to $25,000.
The rebate is payable on new renewable energy generating equipment, essentialenabling equipment and essential non-equipment expenditure.
THE AUSTRALIAN PHOTOVOLTAIC INDUSTRY ROADMAP

AUSTRALIAN SUPPORT PROGRAMS FOR PV
96 //
Applicants may also be eligible for an additional funding of five percent of the cost ofthe rebateable items or $10,000 (whichever is the lesser) to be used to assist with thecost of replacing batteries at the end of their useful life.
Renewable Energy Diesel Replacement Scheme (REDRS)
The aim of the REDRS is to encourage the use of renewable energy and reduce the useof diesel, in meeting electricity generation requirements in off-grid areas of Queensland(areas not connected to the main or Mount Isa electricity grids). The program providesfinancial support for the installation of new renewable energy stand-alone powergeneration systems, or incorporation of renewable energy generating equipment withinexisting generation for off-grid users of diesel for electricity supply (including domestic,commercial and industrial properties, and remote communities).
Applicants who satisfy the conditions of the scheme may be eligible for a rebate of 50percent. The maximum rebate applicable for installations servicing domestic premises is$150,000. The rebate is payable on new renewable energy generating equipment,essential enabling equipment and essential non-equipment expenditure.
It is funded under the RRPGP (approx. $17M). The scheme is currently expected tocontinue until the earliest of mid 2006 or funds are exhausted.
Western Australia
RRPGP
Funding applications for large projects have to be individually assessed and approved byboth the State and Commonwealth Governments. Funding may also be available forscoping studies that assess the viability of potential renewable energy projects.
Remote Area Power Supply Program
The Remote Area Power Supply Program provides rebates for renewable energy powersystems used instead of diesel generation in off-grid areas of WA. Rebates areavailable for systems serving Aboriginal communities, businesses and households.
The Remote Area Power Supply Program is proposed to run from July 2001 to June 2008with total funding of up to $20 million available for eligible projects. The programprovides rebates of 55 per cent of the capital cost of renewable energy systems, up to amaximum of $550,000. The Program is jointly funded by the Commonwealth and WAGovernments. Funding applications made under the Program are assessed and approvedby the Sustainable Energy Development Office.
Renewable Energy Water Pumping Program
The Renewable Energy Water Pumping Program provides rebates for medium and largesized renewable energy based pumps, such as solar pumps and windmills, used insteadof diesel based pumps in off-grid areas of WA. Total funding of up to $4.8m is expectedto be available under the Renewable Energy Water Pumping Program from February2002 to June 2006. The program provides rebates on the capital cost of the renewableenergy component of eligible pumping systems. The maximum rebate available is:
� $20,000 per site, for pastoral stations, communities and towns only.
� $10,000 per site, for farms and other sites.
Eligibility for the program is limited to businesses, government agencies andincorporated organisations that are registered for the GST.
Industry support programsIndustry support programs that help improve the capabilities of the local renewableenergy industry and increase understanding amongst end-users are recognised as beingimportant in meeting the Renewable Remote Power Generation Program objectives.
Renewable Remote Power Generation Program funding may be available for industrysupport programs that relate directly to the use of renewable energy generation in off-grid areas, including training, information provision, equipment testing and developmentof standards, renewable resource and system applicability studies and demonstrationprojects.
South Australia
The RRPGP in SA will finish on the 30 June 2004. SA’s total funding allocation under theprogram is dependant on the certified DFE in SA. Energy SA estimates SA’s total DFEover the four years of the program to be $8.65m as the figure for the 03/04 financialyear is yet to be certified.
Under the RRPGP, 276 stand-alone power systems (SAPS) have been installed with$6.4m being paid out in rebates. The systems collectively have 537 kW of photovoltaiccapacity and 60 kW of wind generating capacity.
Thirty-two systems are yet to be installed, with approximately $1.4m approved inrebates. The 32 systems have a combined photovoltaic capacity of 108 kW and 60 kWof wind generating capacity.

97 //
Some of the remaining $.85m of SA’s RRPGP funding has been spent on Administrationand Industry Support, whilst the remaining funds have been pre-committed to the RAESsubsidised Public Generators budget line to make up for the shortfall of funds allocatedto this scheme during the four-years of the RRPGP in SA.
The ‘Solar School’s Program’ is being subsidised through the Australian Government’sPhotovoltaic Rebate Program (PVRP). The first successful sites in the three-year SA SolarSchools Program were announced in May 2004 by the Premier of South Australia, Mike Rann.
These sites will now become the first schools and preschools to receive funding tofacilitate the installation of a 2 kW array of photovoltaics. Sites will harness energyfrom the sun and will produce electricity for their own use. The photovoltaics will begrid-connected, enabling schools to become net providers of electricity when power isnot required in buildings, for example, during school holidays and weekends.
The SA Solar Schools Program will continue until December 2005 by which time it willhave taken solar power to over one hundred schools and preschools. In doing so theprogram complements the recently released South Australia Strategic Plan whichemphasises the importance of sustainability in our State’s future. A key objective of theState Government’s plan is to make South Australia world-renowned for being ‘clean,green and sustainable,’ with a target to lead Australia in the production of wind andsolar power within ten years. The significance of the SA Solar Schools Program ishighlighted with the Premier announcing his aim to extend the SA Solar SchoolsProgram to 300 schools by 2014.
THE AUSTRALIAN PHOTOVOLTAIC INDUSTRY ROADMAP

SCENARIO MODELLING
98 //
APPENDIX 4// SCENARIO MODELLING
Model structure and assumptions
The PV Roadmap model consists of four main inter-related modules:
� Module price-progress engine, which determines likely module price correspondingto cumulative global market volume.
� A global market growth engine, which simply projects future cumulative marketvolume year by year on the basis of consistent annual growth rates.
� An Australian market growth engine which is used to determine future local marketvolume year by year on the basis of annual market growth expectations in five mainmarket segments (off-grid domestic, off-grid non-domestic, mini-grids, grid-connected distributed and grid-connected centralised).
� A PV electricity price calculator which equates module prices to life-cycle systemcosts, establishes the amount of electricity generated by a typical system over itslifetime and accordingly determines the levelised cost of PV electricity on a year byyear basis for comparison to retail tariffs.
The price-progress engine establishes a module price for any cumulative market volumeaccording to historical price-experience growth rates, which demonstrate that moduleprices have reduced by approximately 18 per cent for every doubling of cumulativeproduction experience (i.e. 82 per cent Progress Ratio). This effect has also translatedinto cost reductions in other ‘balance of system’ components. For the purposes of themodel, balance of system prices are projected to fall at the same rate as module prices.
The model operates on the principle that price-reductions are not in themselves time-dependent. Instead, the timing of when a particular module price point will be achievedis driven by the global market growth rate: a very small growth rate equates to slowproduction experience and so delays price reductions, whereas large growth in theglobal PV market requires rapid production increases and correspondingly tends toaccelerate price reductions. This is a strong premise behind the market stimulationprograms of many major PV manufacturing countries; creating or sustaining a high-levelof demand for PV through various market incentives is expected to bring forward thepoint at which PV energy services are competitive with alternative service options, andin particular the point when PV is competitive with tariffs for grid-supplied electricity.
The Australian market growth engine is largely independent of the global growthmodule, and is used to determine the impact of alternative Australian industry andmarket development scenarios, in terms of jobs, local and export sales, productioncapacity and emissions abatement. However the two are inextricably inter-related inrespect of certain key outputs – notably the Australian industry share of the globalmarket, and indirectly in terms of the sales revenue generated as the global scenarioselected (global market growth rate) establishes the module price and hence value ofsystem sales. This engine is strongly reliant upon industry experience to determine likelyfuture growth patterns, and in assessing future market growth it is also essential thatwe have a good appreciation of the ‘limits to growth’ in each of the market segments.These were discussed in more detail in Chapter 3. Likewise, industry best estimateshave been adopted to establish expectations for the likely proportion of componentexports and imports under different Australian scenarios.
The PV electricity price calculator’s purpose is largely to determine the point at which PVelectricity is likely to be competitive with grid-supplied electricity. It also serves toassess the ‘price gap’ (i.e. the difference between PV and grid-supplied electricity) yearby year, which to some extent is used to colour expectations about likely local marketgrowth. The expectation is that as PV electricity prices approach and then improve ongrid-supplied electricity prices, natural demand for PV will increase. In reality, this is anoversimplification of PV decision making processes as comparative price is by no meansthe only driver for end-user investment in PV. It is, nonetheless, likely to exertreasonable influence on market growth rates. This elasticity of demand with respect toenergy prices is acknowledged in the Australian market growth module.
The key assumptions in the scenario modelling are summarised in Table A4.1.

99 //
Table A4.1 Key assumptions in the PV Roadmap model
International PV module price development Continues to decline at 18 per cent per doubling of cumulative production (For global market growth of 25 per cent this equates to 6.2 per cent annual price decrease; Global market growth of 30 per cent equates to 7.2 per cent annual decrease). Note that 18 per cent reduction is the average market price-experience rate recorded over the past fifteen years.
Global market growth expectations Targets in the three main industrialised PV market regions (Europe, Japan, USA) require over 11 GW of PV generation capacity to be installed by 2010. This equates to an average annual market growth rate of approximately 23 per cent per annum. This takes no account of additional demand in the rest of the world – i.e. it excludes amongst many others the requirements of Australia, China and India. A 25 per cent average global growth rate is therefore not unrealistic – certainly in the 2010 timeframe – and indeed 30 per cent is believed to be more representative of future demand. Note that for IEA-PVPS countries, which currently account for 65 per cent to 75 per cent of the global demand for PV modules, market growth rates have averaged over 33 per cent for the past five years and over 36 per cent in the last three years.
Australian module prices Reflect average international prices. As such, it is international market development that largely drives Australian hardware cost reductions.
System cost components Modules represent 50 per cent of the system hardware cost: inverter(s) represents 25 per cent; other ‘BOS’, balance of system components (support structure, protection, cabling etc.), account for the remaining 25 per cent.
BOS price reduction Same rate as module price reduction. (This is supported by Japanese experience under the 70,000 Rooftops Program.)
Installation cost component Installation as a component of the total system price also decreases at 18 per cent, though on the basis of local installed experience, rather than international experience. This means that while an Australian program which builds the local market faster than the global average might have only a small effect on system hardware cost reduction rate, it is expected to have a more pronounced impact on the installation component. Additionally it is assumed that a minimum cost ‘floor’ of $300/kW exists (i.e. irrespective of future hardware cost reductions, it will not be possible to install a system for less than $300/kW).
Operation and maintenance costs Estimated at slightly under 1 per cent of the total system (hardware) cost.
System lifetime (modules) 25 years.
Replacement costs Assumes that the inverter needs replacing after 25 years. This is not necessarily reflective of current systems, where inverters may typically need replacing after 15–20 years. However, 25–30 year inverter lifetimes are expected within the 2010 timeframe (indeed Pacific Solar’s module-integrated inverters are already designed to exceed 1 million hours MTBF) and as such for purposes of determining price convergence point the use of the longer lifetime is valid.
Application sector energy costs In order to estimate the generation cost from systems other than residential PV systems, simple scale factors have been applied. The scale factors used are:� Centralised grid-connect systems = x 0.9 (result of lower capital cost/kW).� Domestic RAPS = x 1.3 (result of higher capital cost, higher life-cycle replacement costs and lower system yield)� Non-domestic RAPS = x 1.2 (result of higher capital cost, higher life-cycle replacement costs and lower system yield).
Retail electricity prices Main estimates for ‘price convergence’ refer to residential tariffs. The retail electricity price adopted is based on an Australia-wide average as reported by ESAA (12.4c/kWh, 2001 figures). It is felt to be largely representative of tariffs in NSW and Victoria. However it is likely to be conservative in respect of South Australia, implying that the price convergence point in SA may occur rather earlier than predicted by the model (all other assumptions remaining valid).
Average retail electricity price increases 3 per cent per annum (real).
Renewable energy certificates RECs are estimated to have a value of 35 $/MWh. It is assumed that there will be no substantial change to the deeming provisions for PV under MRET, i.e. RECS may be deemed in 5 year blocks.
System yield For estimating lifetime energy generation, a PV system annual yield of 1382 kWh/kW is adopted, in line with MRET Deeming Zone 3, which is valid for main population centres in ACT, NSW, QLD, SA and WA. It underestimates expected yield for centres in NT, and overestimates for VIC and TAS.. (It is assumed that the deeming rate accounts for slight performance deterioration due to module degradation expected over the life of the system.)
Electricity demand growth For the purposes of estimating PV contribution to future national electricity production, an average electricity demand growth of 2.6 per cent is adopted.
Discount rate 5 per cent is applied.
CO2 abatement potential Calculated on the basis of current national average emission intensity of 1.12 Tonnes CO2-e / MWh estimated from AGO’s greenhouse challenge workbook.
THE AUSTRALIAN PHOTOVOLTAIC INDUSTRY ROADMAP

SCENARIO MODELLING
100 //
Scenario descriptions
‘Business as Usual’ scenarioUnder the ’Business as Usual’ scenario, demand for PV over the next ten years willcontinue to be largely driven by off-grid, rural/remote applications where PV is alreadycompetitive, for example telecommunications and other industrial applications, as wellas for individual remote houses, pastoral stations and isolated mini-grids for rural orremote communities. Beyond 2010, the diesel replacement market for mining regions isexpected to become more accessible.
Industrial applications aside, growth within the off-grid sector to 2010 is expected toremain largely reliant on capital subsidies available under the Renewable RemotePower Generation Program . Industry consensus, as determined during the Roadmapconsultation process, estimates the sustainable annual market for off-grid PVapplications, while current practices of widespread cross-subsidy of rural networksremain, to be approximately 25 MW. Over 80 per cent of this is in the non-domesticsector (i.e. industrial applications and mini-grids). Even under BAU, all off-grid sectorsare anticipated to rise to their respective sustainable limits by 2012–2015 and maintainthese levels thereafter. The BAU scenario also acknowledges some demand elasticityeffects as system prices decline.
With the termination of the Photovoltaic Rebate Program (PVRP) in 2005, and in theabsence of other measures, demand for grid-connected systems (which is highly pricesensitive, and currently a market strongly influenced by incentives) is expected to falter.According to PV users’ surveys by SEDA in New South Wales , the availability and sizeof the PVRP subsidy does have an influence on purchasing decisions. A survey ofresidential PV system purchases between 2002 and 2003 indicated that in the order of60 per cent of users would not have invested in PV in the absence of the rebate.Accordingly, under the BAU scenario, residential PV demand is anticipated to halveimmediately post PVRP, and it will take most of the rest of the decade before demandreturns to the levels experienced under PVRP.
The remaining drivers for on-grid systems, such as state government initiatives for PV inschools, together with investments from committed ‘green’ householders will returndemand for grid-connected distributed PV to around the level of 1 MW per year in 2010.Thereafter we anticipate strong growth in demand for grid-connected PV initially drivenby adoption of PV by electricity network service providers to support weak grids and tooffset investment in distribution network augmentation. Subsequently, demand will betaken-up by residential customers as PV electricity prices become increasinglycompetitive with household tariffs (expected to occur between 2015 and 2020 drivenlargely by international module price reductions).
Demand growth rates for centralised systems are expected to peak towards the middle2020s, reflecting PV’s increasing competitiveness with industrial electricity tariffs.Strong growth rates are expected to remain in both the distributed and centralised grid-connect markets to 2030.
Under the BAU scenario it is likely that existing PV manufacturers will effectively beforced to end their production in Australia in the near term. Without a home market ofat least 50 per cent of production, there is little justification for global industries toretain their production capacity here and manufacturing is likely to be switched closer tothe final market overseas. This will result in significant job losses which are notexpected to be regained for over a decade.
‘Sunrise 350’ scenarioThe initial target of the Sunrise 350 scenario is that Australia will seek to have installedapproximately 350 MW of PV by the end of 2010. Establishing this goal is itself asignificant measure, which is expected to galvanise the industry and provide theframework for action over the coming few years. The target for 2010 is acknowledged tobe ambitious, requiring over 125 MW to be installed during 2010 alone. However, it isan achievable goal if underpinned by the coordinated and focused industry and marketdevelopment plan outlined in the Roadmap, and one which delivers substantial benefitsto Australia over the BAU approach.
Under the Sunrise 350 scenario, the PV industry picture to 2010 is governed largely bystimulated demand for distributed grid-connected systems through government supportprograms for residential rooftop PV and building integration in the commercial sector.Sunrise 350 envisions annual growth rates in the distributed grid-connected sectorincreasing to 100 per cent within three years (i.e. twice as much new capacity will beinstalled in 2007 as was installed in 2006), and maintaining this to 2010. Post 2010, thedistributed grid-connect support program is expected to begin to be phased out anddemand will stabilise at the sustainable annual level (approximately 600 MW pa) by2017. This coincides with PV electricity prices converging with the price of grid-suppliedelectricity. Beyond 2017, government support measures are expected to be phased outfor new PV systems (though enabling measures such as access to finance, streamlinedconnection procedures, installer competency training etc. must remain).
Over a similar time period, mandated requirements on electricity network serviceproviders to assess PV in grid-support configurations will kick-start demand forcentralised PV. This is expected to confirm the unpriced benefits provided by PV toelectricity networks and to build electricity industry confidence in PV that can sustainannual growth rates of 25 per cent to 35 per cent to 2020 (annual growth rates graduallydiminishing towards the end of the term). Beyond 2020, new applications for centralisedPV emerge, for instance as part of a clean hydrogen economy to create an energy carrier

101 //
for the transport sector, which can sustain long-term growth rates in the order of 15 percent. This is expected to see centralised PV demand approach the estimated sustainablelimit for this application sector of 2000 MW per annum by 2030.
Demand patterns for PV in the off-grid market sectors are expected to be quite similar tothose predicted for the BAU scenario, with the exception that the disruption to the off-grid domestic sector resulting from the cessation of PVRP is avoided, while additionalenabling measures (e.g. better access to finance, expansion of support policies, andstronger local industry capability resulting from the program) will support additionaldemand for off-grid non-domestic applications.
A further important consideration is that the Sunrise 350 scenario anticipates muchheavier reliance on domestically manufactured PV modules and inverters than BAU, onthe expectation that the stronger industry development measures serve to build a moreglobally competitive local industry that can better stave-off overseas competition. Theassumption is that in the long-term 75 per cent of demand under the Sunrise 350scenario is met by local production, compared to 50 per cent under BAU.
THE AUSTRALIAN PHOTOVOLTAIC INDUSTRY ROADMAP

102 //
APPENDIX 5// SUMMARY OF USA STATE POLICIES AND INITIATIVES1
Note – virtually all states have similar solar access and easement legislation.
Program Policy / initiative SummaryArizona
Environment Portfolio Standards (EPS) State utilities to source electricity from renewables. 0.2% in 2001 increasing to 1.1% in 2007, then 1.1% to 2012 50% must be PV in 2001 to 2004, then 60% PV
Salt River Project Net metering For PV systems up 10 kWac net exported power purchased at average market price.
Tuscon Electric Power Net metering for up to 500 kW of PV in the region. For PV systems up 10 kW net exported power credited against following months bill..
Arizona Corporation Commission Cost benefit analysis For remote locations, utilities must conduct a cost/benefit analysis to compare the cost of line extension with the cost of installation of a stand alone photovoltaic system
California
Renewable Energy Portfolio Renewable Portfolio Standards 2002 Bill Electricity retailers to increase their use of renewable resources by at least 1% per year.Retailers must produce at least 20% of their retail electricity sales from renewables by 2017.
Net metering Net metering law California’s investor-owned electric utilities and rural cooperatives, must allow net metering for all customer for systems up to 1 MW. Los Angeles Department of Water and Power, the largest municipal utility in the nation, and the Sacramento Municipal Utility District (SMUD) already offered net metering.
Colorado
Renewable Portfolio Standards Electric Energy Supply Policy – Fort Collins Policy objectives include the following:�Develop and implement policies and programs that �Reduce consumption 10% by 2012 (from 2002 baseline)
support renewable energy, sustainable practices, �Reduce peak day electric demand 15% by 2012 (from 2002 baseline)reduction or global warming, and the design and �Develop and implement effective DSMt programsconstruction of energy efficient buildings �Develop a plan to evaluate a systems benefit charge, efficiency programs, incentive programs,
�Develop and implement policies that require the use educational programs, revolving loan programs and innovative rate structuresof energy efficient design principles in the renovation �Whenever possible, integrate efforts related to energy efficiency, renewable resources,and construction of all City facilities green buildings (energy code), sustainable practices and education.
Connecticut
Renewable Portfolio Standards 10% of all retail electricity to come from RE sources by 2010
Net metering 1998 Act Utilities and distribution companies to offer net metering for systems up to 100 kW. Distribution companies only have to offer to residential customers.
Delaware
Net metering Act 1999 Net metering of RE systems up to 25 kW
Georgia
Net metering Act 1999 Net metering of RE systems up to 25 kW
1 Summarised from http://www.dsireusa.org, downloaded June 2004

103 //
Program Policy / initiative Summary
Hawaii
Renewable Portfolio Standards 2004 enforceable standard Each electric utility is required to establish the following RPS percentages: (1) 7% of its net electricity sales by December 31, 2003.(2) 8% of its net electricity sales by December 31, 2005.(3) 10% of its net electricity sales by December 31, 2010.(4) 15% of its net electricity sales by December 31, 2015. (5) 20 % of its net electricity sales by December 31, 2020.
Net metering Act 2001, amended 2004 Net metering to capacity limit 50 kW. Utilities have to offer net metering until total net metering capacity equals 0.5% of each utility’s peak demand, which corresponds to a total ‘cap’ of approximately 10 MW for the state. No payment for a net excess.
Idaho
Net metering All utilities voluntarily offer net metering.
Illinois
Renewable Portfolio Standards Resource Development and Energy Security Act The legislation adopted a state-wide renewable energy goal of at least 5% of total energy by 2010, and at least 15% by 2020.
Net metering April 2000 voluntary decision by Commonwealth Edison Net metering of photovoltaic and wind energy systems up to 40 kW. Customer paid utility’s avoided cost on a monthly basis. Also an additional annual payment for the customer’s total excess power during the year (up to the amount of power taken by the customer). Customers are paid the difference between the average avoided cost and the average retail rate paid by the customer during the year.
Green Power purchasing 2002 executive order Commitment by the state to purchase 5% green power by 2010. The amount of renewable energypurchased will grow to at least 15% by 2020.
City of Chicago The City of Chicago signed an agreement to purchase 20% of their electricity used by 2005.
Indiana
Net metering Renewable Energy Systems System capacity limit of 10 kW to a total capacity limit of 13.2 MW.
Iowa
Net metering Iowa Utilities Board Net metering allowed and net excess purchased at utilities’ avoided cost.
Green power Iowa Utilities Board Investor owned utilities to purchase 105 MW of renewable energy. All utilities to offer green power.
Maine
Renewable Portfolio Standards 1999 Ruling Requirement for utilities to supply at least 30% of energy from eligible ‘small’ renewable resources of up to 80 MW capacity. Annual reports on compliance with penalties being paid to a renewable energy resource R & D fund.
Net metering 1987 Net metering with net excess rolling over to the next month. Annual net excess is granted to the utility at no cost.
THE AUSTRALIAN PHOTOVOLTAIC INDUSTRY ROADMAP

SUMMARY OF USA STATE POLICIES AND INITIATIVES
104 //
Program Policy / initiative SummaryMaryland
Renewable Portfolio Standards Renewable Energy Portfolio Standard In 2006 utilities must supply 1% of retail sales from eligible RE sources which then increases at 1%and Credit Trading Act, 2004 per annum until 2018. A US$0.002/kWh penalty for shortfalls to be paid to Maryland’s RE Fund.
Net metering 1997 law Net metering for residential and school PV systems up to 80 kW. Utilities to supply meters and offer the programme at no extra charge.
Green power Executive order 2001 6% of electricity consumed at State facilities to come from approved RE sources, with a 50% cap on landfill sources. The order also calls for a reduction in energy use in state buildings of 10% by 2005 and 15% by 2010 and the use of energy efficient products.
Massachusetts
Renewable Portfolio Standards Regulations 2002 All retail electricity to utilise new RE sources for at least 1% of their power supply in 2003, increasing to 4% by 2009, then at 1% pa.Non compliance payments of US 5c per kWh is paid to the state’s renewable energy trust.
Net metering 1997 amendment Net metering for facilities up to 60 kW capacity, with net excess rolling to the following month.
Minnesota
Renewable Portfolio Standards 2003 amendment In 2005, at least 1% of the retail electric to be from eligible RE sources. To be increased by 1% pa until 2015.
Net metering 1983 Utilities must purchase net excess generation at the average retail rate.
Green Power Utilities in Minnesota must offer customers the option to purchase green power. Rates charged for green power must be based on the difference between the cost of the renewable energy and the same amount of non-renewable energy.
Montana
Net metering 1999 Up to 10 kW. Utilities are not obliged to buy excess.
Green Power 2003 Default electricity suppliers must provide green power option.
Nevada
Renewable Portfolio Standard 1997 % Renewables Date 5% 01/01/2003 7% 01/01/2005 9% 01/01/2007 11% 01/01/2009 13% 01/01/2011 15% 01/01/2013 Not less than 5% of the renewable energy must be generated from solar renewable energy systems.
RECs 2002 Energy providers can buy and sell RECs. PV allowed 2.4 RECs /kWh
Net metering 1997 amended 2003 30 kW cap. Customer generators are billed monthly except in situations in which the customer and the utility agree on annual billing. Net excess generation is credited to the utility
New Hampshire
Net metering 1998 amended 2001 Up to 25 kW capacity. Total capped at 0.05% of annual peak demand.
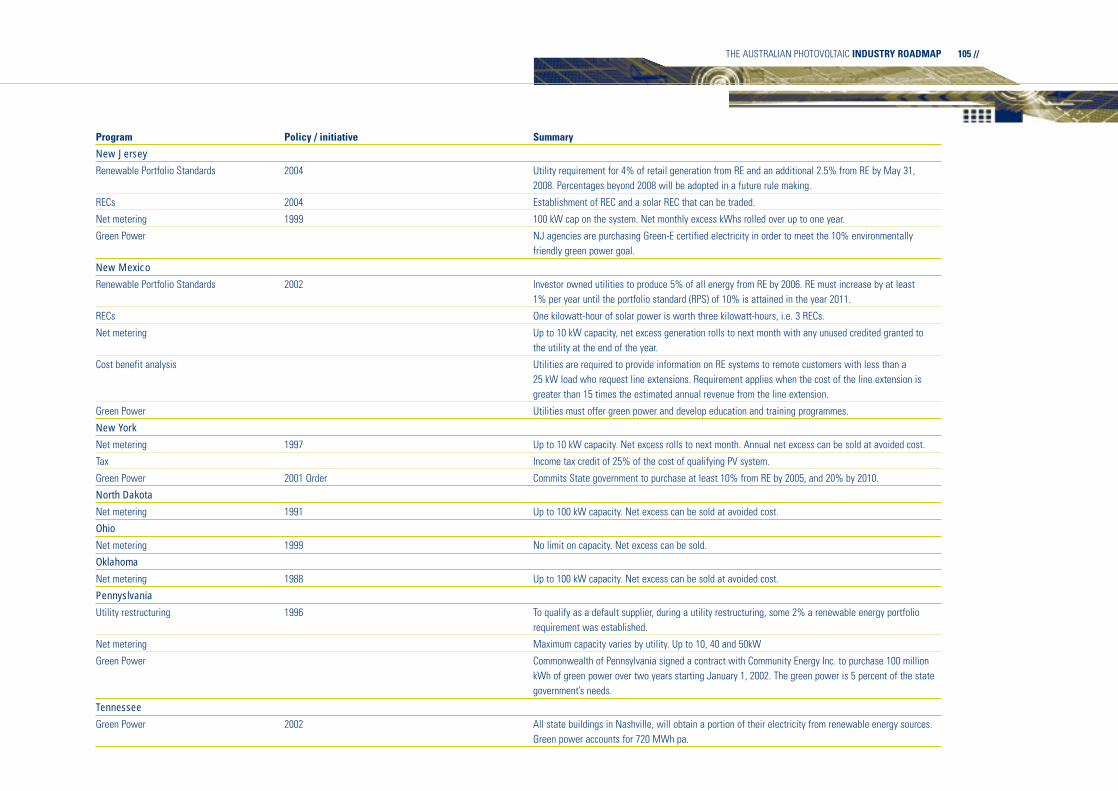
105 //
Program Policy / initiative Summary
New Jersey
Renewable Portfolio Standards 2004 Utility requirement for 4% of retail generation from RE and an additional 2.5% from RE by May 31, 2008. Percentages beyond 2008 will be adopted in a future rule making.
RECs 2004 Establishment of REC and a solar REC that can be traded.
Net metering 1999 100 kW cap on the system. Net monthly excess kWhs rolled over up to one year.
Green Power NJ agencies are purchasing Green-E certified electricity in order to meet the 10% environmentally friendly green power goal.
New Mexico
Renewable Portfolio Standards 2002 Investor owned utilities to produce 5% of all energy from RE by 2006. RE must increase by at least 1% per year until the portfolio standard (RPS) of 10% is attained in the year 2011.
RECs One kilowatt-hour of solar power is worth three kilowatt-hours, i.e. 3 RECs.
Net metering Up to 10 kW capacity, net excess generation rolls to next month with any unused credited granted to the utility at the end of the year.
Cost benefit analysis Utilities are required to provide information on RE systems to remote customers with less than a 25 kW load who request line extensions. Requirement applies when the cost of the line extension is greater than 15 times the estimated annual revenue from the line extension.
Green Power Utilities must offer green power and develop education and training programmes.
New York
Net metering 1997 Up to 10 kW capacity. Net excess rolls to next month. Annual net excess can be sold at avoided cost.
Tax Income tax credit of 25% of the cost of qualifying PV system.
Green Power 2001 Order Commits State government to purchase at least 10% from RE by 2005, and 20% by 2010.
North Dakota
Net metering 1991 Up to 100 kW capacity. Net excess can be sold at avoided cost.
Ohio
Net metering 1999 No limit on capacity. Net excess can be sold.
Oklahoma
Net metering 1988 Up to 100 kW capacity. Net excess can be sold at avoided cost.
Pennyslvania
Utility restructuring 1996 To qualify as a default supplier, during a utility restructuring, some 2% a renewable energy portfolio requirement was established.
Net metering Maximum capacity varies by utility. Up to 10, 40 and 50kW
Green Power Commonwealth of Pennsylvania signed a contract with Community Energy Inc. to purchase 100 million kWh of green power over two years starting January 1, 2002. The green power is 5 percent of the state government’s needs.
Tennessee
Green Power 2002 All state buildings in Nashville, will obtain a portion of their electricity from renewable energy sources.Green power accounts for 720 MWh pa.
THE AUSTRALIAN PHOTOVOLTAIC INDUSTRY ROADMAP

SUMMARY OF USA STATE POLICIES AND INITIATIVES
106 //
Program Policy / initiative SummaryTexasNet metering 2002 MW New Renewables by Date
400 MW 01/01/2002 400 MW 01/01/2003 850 MW 01/01/2004 850 MW 01/01/2005 1,400 MW 01/01/2006 1,400 MW – MW 01/01/2007 2,000 MW 01/01/2008 2,000 MW 01/01/2009–2019
REC trading Utilities allocated targets based upon retail sales. The penalty is the lesser of $50 per MWh or 200% of the average cost of credits traded during the year
Net metering Net consumption is billed at the applicable tariff and excess generation by the customers during a billingcycle is purchased by utilities at rates not to exceed the avoided cost (fuel cost only, no capacity component)
Cost benefit analysis Where the utility requires a customer to pay a contribution toward the construction of extending utility power lines to a remote location, the utility must provide information about on-site renewable energy technology options
Utah
Net metering 2002 To 25 kW. Net excess bought at avoided cost.
VermontNet metering 1998 on To 10 kW. Farmers to 150 kW.
Monthly net excess rolls to next month.
VirginiaNet metering 2004 Residential to 10 kW
Commercial to 500 kW
Monthly net excess rolls to next month.
WashingtonNet metering Net metering up to 25 kW. Net excess rolls to next month. Any net excess at year end is credited to utility.
Green Power 2001 Mandated that utilities must offer green power.
WisconsinRenewable Portfolio Bill 1999. Percentage of renewables 0.5% by 12/31/2001
0.85% by 12/31/2003 1.2% by 12/31/2005 1.55% by 12/31/2007 1.9% by 12/31/2009 2.2% by 12/31/2011
Net metering Order 1992 Utilities pay retail rate for excess net generation
Wyoming
Net Metering Bill 2001 Net metering for systems up to 25 kW

107 //
APPENDIX 6// SUMMARY OF THE STATE-BASED FINANCIALINCENTIVES IN THE USA1
There are a variety of schemes administered by the various states in the USA whichsupport renewable energy systems including. Some of these are common over a numberof states, others are individually-administered and funded schemes. This appendix liststhe schemes which include PV and which could have relevance for Australian conditions.
Mainstay Energy Rewards Program – Green Tag Purchase Program: MainstayEnergy is a private company offering customers who install, or have installed,renewable energy systems the opportunity to sell the green tags (also known asrenewable energy credits, or RECs) associated with the energy generated by thesesystems. These green tags will be brought to market as Green-e* certified products.Through the Mainstay Energy Rewards Program, participating customers receive regular,recurring payments. The amount of the payments depends on the type of renewableenergy technology, the production of electricity by that system, and the length of thecontract period. Mainstay offers 3, 5, and 10-year purchase contracts. The longer thecontract period, the greater the incentive payment on a $/kWh basis. Typical payments,which are made quarterly, are as follows: Solar PV: 2¢/kWh – 5¢/kWh (estimated$50–$250/year for residential systems, $300–$3000/year for commercial). MainstayEnergy is the first company in the US to purchase green tags from small-scalerenewable producers on a national scale. The Mainstay Rewards Program currently hasabout 200 participants – both commercial and residential, located across 18 states.
BEF – Renewable Energy Grant: Using revenues generated from the sales of GreenTags, Bonneville Environmental Foundation (BEF), a not-for-profit organization, acceptsproposals for funding for renewable energy projects located in the Pacific Northwest.Any private person, organization, local or tribal government located in the PacificNorthwest may participate. Projects that generate electricity are preferred. Acceptableprojects include solar photovoltaics, solar thermal electric, solar hot water, wind, hydro,biomass, and animal waste-to-energy.
BEF may deliver funding through various means, including grants, loans, convertibleloans, guarantees, and direct investments in renewable energy projects. BEF renewableenergy grants and investments may range from a few thousand dollars for smallinstallations, to significant investments in central station grid-connected renewableenergy projects. If a BEF grant is requested for a generating project, the BEF share willnot exceed 33 per cent of total capital costs, and zero per cent of operating costs. BEFgenerally does not fund residential and small business renewable energy projects withgrants or investments. States participating in this scheme include Idaho, Montana,Oregon and Washington State.
THE AUSTRALIAN PHOTOVOLTAIC INDUSTRY ROADMAP
1 http://www.dsireusa.org

SUMMARY OF THE STATE-BASED FINANCIAL INCENTIVES IN THE USA
108 //
State Type of scheme Details relating to PV
Arizona Personal tax credit Solar and Wind Energy Systems Credit: this isma credit against the personal income tax in the amount of 25 per cent of the cost of a solar or wind energy device.
Sales tax exemption Solar and Wind Equipment Sales Tax Exemption: sales tax exemption for solar and wind energy equipment purchased from a retailer.
Utility rebate program APS – EPS Credit Purchase Program: Through the EPS Credit Purchase Program, Arizona Public Service offers customers who install photovoltaic systems the opportunity to sell the credits associated with the energy generated by these systems to APS
EP-SunShare PV buydown Tucson Electric Power created the SunShare hardware buydown program to encourage residential and business customers to install new photovoltaic equipment.
California Corporate tax credit Solar or Wind Energy System Credit – Corporate: provides personal and corporate income tax credits for the purchase and installation of solar energy systems.
Local rebate program San Diego – Residential Solar Electric Incentive for Homes Destroyed in Wildfires: $6.57 million2 in funding, and offering incentives of $4 per watt for installing solar electric (photovoltaic) systems of 0.5 to 5 kW on a new home that replaces a home destroyed by Cedar, Paradise or Otay 2003 wildfires.
Personal tax credit Solar or Wind Energy System Credit – Personal: The law provides personal and corporate income tax credits for the purchase and installation of solar energy systems.
Production incentive Supplemental Energy Payments (SEPs): Retail sellers are California’s three largest investor-owned utilities: PG&E, SDG&E, and SCE. Payments cover the above costs of renewable energy and should be made for contracts of 3 to 10 years.
State rebate program Emerging Renewables (Rebate) Program: This provides rebates for the purchase of four types of renewable energy generating 50 kW or less. Total funding under the program is $118 million. SELFGEN – Self-Generation Program: this provides incentives to encourage customers to produce energy using renewables including PV.Solar Schools Program: On May 19, 2004, the Energy Commission adopted specific funding and eligibility requirements for the Solar Schools element of the Emerging Renewables Program (ERP).
Utility rebate program Anaheim Public Utilities – PV Buydown Program: Rebate through the Anaheim Advantage Residential PV Buydown Program for customers with qualifying PV systems that are 3–20 kW and which do not exceed the historical or current electric needs of the electricity consumer at the site of installation.Burbank Water & Power – Residential & Commercial Solar Support: Burbank Water & Power offers residential customers a rebate of$3 per Watt for PV systems of up to 2 kW, for a maximum incentive of $6,000. The utility offers business customers a rebate of $3 per Watt for PV systems of up to 3 kW, for a maximum incentive of $9,000.City of Palo Alto Utilities– PV Partners: Initiated a PV rebate program which offers up to $4/Watt to Palo Alto Utility customers who install qualifying PV systems. CPAU offers information to help customers plan and buy their systems.LADWP – Solar Incentive Program: Solar buydown program designed to encourage the use of renewable energy through the installation of PV systems by residents and businesses in Los Angeles. LADWP has budgeted $20 million for this fiscal year and $16 million for the following year to help meet the rise in demand.Redding Electric – Vantage Renewable Energy Rebate Program: Residential and business customers of Redding Electric Utility are eligible to apply for rebates of up to 50% of project costs for PV and solar thermal systems. The rebate program encourages the developmentand demonstrates the benefits of solar technology in REU’s service territory.
Delaware State rebate program Green Energy Program Rebates: The purpose of the program is to introduce renewable energy technologies into the Delaware market byreducing the net system costs through the use of rebates.
2 All dollar ($) amounts in this Appendix are in US dollars

109 //
State Type of scheme Details relating to PV
Hawaii Corporate tax credit Corporate Solar and Wind Energy Credit: the Hawaii Energy Tax Credits: Allow individuals or corporations an income tax credit of 35 per cent of the cost of equipment and installation of a PV system
Industry recruitment High Technology Business Investment Tax Credit: Offers a 100 per cent tax credit on an equity investment in a qualified high tech business. The purpose of this credit is to encourage investment in Hawaii’s high tech companies.
Personal tax credit Residential Solar and Wind Energy Credit: The Hawaii energy tax credits allow individuals or corporations an income tax credit of 35 per cent of the cost of equipment and installation of a PV system.
Idaho Personal deduction Solar, Wind, and Geothermal Deduction: This statute allows taxpayers an income tax deduction of 40 per cent of the cost of a solar, wind or geothermal device used for heating or electricity generation.
State loan program Low-interest Loans for Renewable Energy Resource Program: This makes funds available at a 4 per cent interest rate for PV projects.Residential loans are available from $1,000 to $10,000. In commercial and industrial sectors there is a minimum loan amount of $1,000 and a maximum cap of $100,000. Loans are repaid in five years or less.
Illinois Grant program Illinois Clean Energy Community Foundation Grants: The ICECF supports programs and projects that will improve energy efficiency, develop renewable energy resources, and preserve and enhance natural areas throughout Illinois. The ICECF provides financial support in three principal ways: grantmaking; partnerships with public agencies; and direct initiatives. The ICECF identifies strategic opportunities to undertake large-scale, high-impact projects and special initiatives that further its program objectives in energy efficiency, renewable energy and natural areas conservation.
Property tax exemption Special Assessment for Renewable Energy Systems: This statute allows for a special assessment of PV systems for property tax purposes. Solar equipment is valued at no more than a conventional energy system.
State grant program Renewable Energy Resources Program (RERP) Grants This promotes the development and adoption of renewable energy within the state.
Utility rebate program Chicago Photovoltaic Incentive Program (PIP): ComEd, in partnership with Spire Solar Chicago, offers Chicago property owners a rebate to help support locally-based PV manufacturing and the installation of photovoltaic systems. Under the PV Incentive Program (PIP), individuals and organizations are eligible for ComEd rebates on grid-tied PV systems purchased from Spire Solar Chicago.
Maryland Corporate tax credit Clean Energy Incentive Act (Corporate Credit): Sales tax exemptions or income tax credits when purchasing certain qualifying high & Personal tax credit efficiency appliances, electric and hybrid-electric vehicles, and certain renewable resource energy systems. An individual or a corporation
may claim a state income tax credit of 15 per cent of the total installed cost of a PV system.Personal Income Tax Credit for Green Buildings: This income tax credit applies to nonresidential and residential multifamily buildings of at least 20,000 square feet that are constructed or rehabilitated to meet criteria set forth by the US Green Building Council or other similar criteria.
State grant program Solar Energy Grant Program the solar energy grant program provides financial incentives to homeowners and businesses that install solar energy devices.
Massachusetts Corporate deduction Alternative Energy and Energy Conservation Patent Exemption (Corporate): Corporate and personal income tax deductions for any income received from the sale of or royalty income from a patent that is deemed beneficial for energy conservation or alternative energy development. This deduction is unique among incentives in that it targets patents and not simply real property.Solar and Wind Energy System Deduction: Businesses may deduct from net income, for state tax purposes, costs incurred from the installation of any PV systems. The installation must be located in Massachusetts and used exclusively in the trade or business of the corporation.
Corporate exemption Solar and Wind Power Systems Excise Tax Exemption: This exempts solar and wind energy systems from the corporate excise tax for the length of the system’s depreciation period.
THE AUSTRALIAN PHOTOVOLTAIC INDUSTRY ROADMAP

SUMMARY OF THE STATE-BASED FINANCIAL INCENTIVES IN THE USA
110 //
State Type of scheme Details relating to PV
Personal deduction Alternative Energy and Energy Conservation Patent Exemption (Personal): Offers both corporate and personal income tax deductions for any income received from the sale of or royalty income from a patent that is deemed beneficial for energy conservation or alternative energy development.
Personal tax credit Renewable Energy State Income Tax Credit: This provides a 15 per cent credit against the state income tax for the cost of a renewable energy system (including installation) installed on an individual’s primary residence.
Production incentive Mass Energy and People’s Power & Light (a sister organization serving Rhode Island), are buying green attributes from PV systems in Massachusetts and Rhode Island. The renewable energy attributes from PV systems will be packaged together with wind, small hydro and biomass renewable energy certificates and sold as New England GreenStartSM, a new renewable energy-based electricity product soldthrough ‘GreenUp’, a new green pricing program being offered by National Grid, the utility serving most of Massachusetts and Rhode Island.Mass Energy and PP&L are offering to purchase renewable energy certificates at a rate of $60 per Megawatt-hour (or $.06 per kWh) for a period of three years from PV systems installed after 1998.
Property tax exemption Local Property Tax Exemption: PV and wind powered devices utilized as a primary or auxiliary power system for the purpose of heating orotherwise supplying the energy needs of taxable property qualify for property tax exemptions for a period of 20 years from the date of installation.
Sales tax exemption Renewable Energy Equipment Sales Tax Exemption: This exempts PV systems from the state sales tax. This exemption is limited to systems which will be used in an individual’s principal residence and is not available to commercial users.
State grant program Commercial, Industrial, & Institutional Initiative Grants: offers a total of $6,000,000 in grant funding to expand the use of distributed renewable energy generation at commercial, industrial and institutional facilities in Massachusetts. The building or facility utilizing the powergenerated by the project must be grid-connected and greater than 50 per cent of the renewable energy produced must be consumed on-site.
State rebate program Clustered PV Installation Program: Six Massachusetts organizations are facilitating the installation of approximately 250 PV systems on homes and businesses in clustered regions throughout the state. These organizations will provide outreach activities in their communities and offer installation rebates to lower the PV system purchase cost for consumers. Open PV Installation Program: MTC has awarded more than $1.4 million to 9 organizations in the first round of its Open PV Installation Grant program. These organizations will facilitate the installation of and provide financial incentives for approximately 300 kW of PV throughout the state. Eligible PV projects must be pre-approved and installed by PV experts with licensed installers and electricians.
Minnesota Property tax exemption Wind and Solar-Electric (PV) Systems Exemption: This excludes from property taxation the value added by PV systems.
Sales tax exemption Solar-Electric (PV) Sales Tax Exemption: Certain energy-efficient products (including PV systems) are exempt from the state sales tax.
State rebate program Solar-Electric (PV) Rebate Program: The Minnesota Department of Commerce administers a PV rebate program, funded by Xcel Energy, to buy down the up-front costs of grid-connected solar-electric (PV) systems by $2,000 per kW, with a maximum award of $8,000 per system.
Utility grant program Renewable Development Fund Grants: To provide direct grants totalling up to $25 million to support new development projects (totallingapproximately $15 million) that result in the production of renewable energy, and research and development projects (totalling approximately $10 million) to lead these technologies toward full commercialization.
Montana Corporate exemption Corporate Property Tax Reduction for New/Expanded Generating Facilities: Montana generating plants producing 1 MW or more by means of an alternative renewable energy source are eligible for the new or expanded industry property tax reduction on the local mill levy during the first nine years of operation, subject to approval by the local government. If so approved, the facility is taxed at 50 percent of its taxable value in the first five years after the construction permit is issued.Generation Facility Corporate Tax Exemption: New generating facilities built in Montana with a nameplate capacity of less than 1 MW and using an alternative renewable energy source are exempt from property taxes for 5 years after start of operation.
Corporate tax credit Alternative Energy Investment Corporate Tax Credit: Commercial and net metering alternative energy investments of $5,000 or more are eligible for a tax credit of up to 35 per cent against individual or corporate tax on income generated by the investment.

111 //
State Type of scheme Details relating to PV
Personal tax credit Residential Alternative Energy System Tax Credit: Residential taxpayers who install an energy system using a recognized non-fossil form of energy on their home after 12/31/01 are eligible for a tax credit equal to the amount of the cost of the system and installation of the system,not to exceed $500. The tax credit may be carried over for the next four taxable years.
Property tax exemption Renewable Energy Systems Exemption: Montana’s property tax exemption for buildings using a recognized non-fossil form of energy generation, including PV may be claimed for 10 years after installation of the property.
State loan program Alternative Energy Revolving Loan Program: provides loans to individuals and small businesses to install alternative energy systems that generate energy for their own use. Net metering is allowed. The program is funded by air quality penalties collected by the Departmentof Environmental Quality.NorthWestern Energy – USB Renewable Energy Fund: provides funding to its customers for renewable energy projects. The Universal System Benefits Program requires all electric and gas utilities to establish USB funds for low-income energy assistance, weatherization, nergy efficiency activities, and development of renewable energy resources.
Utility rebate program NorthWestern Energy – PV Rebate Program: Electricity distribution customers may qualify for a rebate of $4 per Watt (peak DC) for the installation of a PV system up to a maximum of $8,000.00 per customer. Under this PV rebate program, rebates are available for grid-tied PV systems only.NorthWestern Energy – PV Systems for Fire Stations: In 2003, six fire stations served by the NorthWestern Energy electric distribution system qualified for free solar electric systems of up to a maximum of 2 kW in size. Under the project, roof-mounted, grid-tied photovoltaic systems will be installed on the roofs of the fire stations. The systems have a battery bank to provide un-interruptible power supply (UPS), and include a performance-monitoring component.NorthWestern Energy – Sun4Communities: NorthWestern Energy is recruiting ten Montana communities to participate in its new Sun4Communities project. The Sun4Communities project enables secondary schools and city and county government buildings to qualify for free solar energy systems. Sun4Communities is an expansion of the popular Sun4Schools project, which installed photovoltaic systems on 27 middle and high schools in Montana between 1999 and 2003. Each system will be capable of generating two kW and will provide a portion of the building’s electricity needs. Any excess electricity produced by the system will be fed into the utility grid through a net metering agreement.
New Jersey State grant program Renewable Energy Advanced Power Program: The New Jersey Board of Public Utilities has issued a request for proposals for a competitive incentive and financing program to encourage development of distributed renewable electricity generation projects. Projects will be expected to supply electricity to the PJM Power Pool, or to large power users, by installing a minimum of 1 MW power generation attheir facility or by aggregating a minimum of 1 MW of renewable electricity generation systems into one proposal. This solicitation is designed to provide seed grants and access to capital in order to make renewably-powered electricity cost competitive with conventional power plants.
Renewable Energy Economic Development Program (REED): Provides funding in the form of a recoverable grant for the development of renewable energy businesses, renewable technologies and market infrastructure through the Renewable Energy Economic Development (REED) program. The concept is to provide seed capital for new businesses or business ventures and then to transition the business into traditional capital markets. Total program funding at this time is $5.0 million. The REED program is open to applicants who seek funding for research, business development, commercialization and technology demonstrations of innovative products or services that advance the delivery of renewable energy systems to the marketplace. Innovations in the renewable energy industry in terms of technology, services, system integration, financing, and supporting systems and fuels are sought. The REED program is not intended to provide financing for construction and installation of renewable energy systems. The minimum award amount is $50,000 and the maximum is $500,000.
THE AUSTRALIAN PHOTOVOLTAIC INDUSTRY ROADMAP

THE AUSTRALIAN PHOTOVOLTAIC INDUSTRY ROADMAP 112 //
State Type of scheme Details relating to PV
State loan program Reduced Energy Demand Options for Local Governments and Schools (REDO): Offering local governments and schools a low-interest, long-term financing program – the Reduced Energy Demand Options for Local Governments and Schools (REDO). Financing under this program will cover the entire incremental cost of energy efficiency and renewable energy projects, enabling the governmental entities to finance the projects completely, with no up front capital necessary.
State rebate program New Jersey Clean Energy Rebate Program: Provides for investments in energy efficiency and renewable energy through the ‘Societal Benefits Charge’ collected from all electric public utility customers. Renewable energy programs include a customer-sited renewables rebate program administered by the state’s utilities.
New York Personal tax credit Solar and Fuel Cell Electric Generating Equipment Tax Credit: This personal income tax credit applies to expenditures on PV equipment used on residential property, and includes provisions for the net metering of the same equipment. There is a 10 kW limit on the size of equipment eligible for net metering. There is also a state-wide limit on the amount of total capacity that may be net metered.
Property tax exemption Solar and Wind Energy Systems Exemption: This provides a 15-year real property tax exemption for solar and wind energy systems constructed in New York State. The intent of the law is to encourage the installation of solar, wind and farm waste energy equipment systems and ensure property owners that their real property taxes will not increase as a result of the installation of these systems.
State grant program Renewables R&D Grant Program: This competitive research program is run by the New York State Energy Research and Development Authority (NYSERDA). The program is to assist companies in development, testing and commercialization of renewable energy technologies that will be manufactured in New York. NYSERDA provides funding support along the product development-to-commercialization continuum and provides the due diligence necessary to acquire private sector funding.
State loan program Energy $mart Loan Fund: The New York Energy $mart(SM) Loan program, administered by the NYSERDA, provides reduced-interest loans through participating lenders to finance renovation or construction projects that improve a facility’s energy efficiency or incorporate renewable energy systems. There are currently over 80 participating lenders. Any commercial, industrial, retail, agricultural, non-profit, residential, or multifamily facility is eligible for this program, which cuts interest rates by 4 per cent for up to a 10-year term (previously a 4.5 per cent reduction and 5-year term). To qualify for the loan program, the facility must be an electricity distribution customer of one of thestate’s six investor-owned utilities.
State rebate program Energy $mart New Construction Program: Designed to accelerate the incorporation of energy efficiency and renewable energy sources in the design, construction, and operation of commercial, industrial, institutional, and multifamily buildings. The New Construction Program provides opportunities to implement permanent energy efficiency and load management improvements in building envelopes and major systems at the time of new construction or substantial renovation. Incentives to install building-integrated photovoltaics (BIPV), etc. are also available.PV Incentive Program (up to 15 kW): Provides incentives of $4 to $5 per Watt (DC) to eligible installers for the installation of approved, grid-connected, PV systems up to 15 kW. Incentives are only available to eligible installers and incentives must be passed on to customers. Once eligible, installers reserve incentives for approved systems, for specific customers, on a first-come, first-served basis, for as long as funds (~$2.5 million) are available. The program continuously accepts applications from installers who would like to participate in the program. The goal is to increase the network of eligible installers across the State, offering customers a choice of qualified or certified installers in their area.
Utility rebate program LIPA – Solar Pioneer Program: The Solar Pioneer Program (1999–2008) encourages the use of solar energy among Long Island homeowners and businesses and to help make the installation of a PV system more affordable. The Solar Pioneer Program is a five-year Clean Energy Initiative that is part of LIPA’s $32 million commitment to developing clean energy alternatives.

State Type of scheme Details relating to PV
North Carolina Corporate tax credit Renewable Energy Tax Credit – Corporate: Provide an expanded tax credit of 35 per cent of the cost of renewable energy property constructed, purchased or leased by a taxpayer and placed into service in North Carolina during the taxable year. There is a maximum limit of $10,500 for residential PV systems; and a maximum of $250,000 for all solar, wind, hydro and biomass applications on commercial and industrial facilities.
Industry recruitment Renewable Energy Equipment Manufacturer Incentive: In addition to North Carolina’s 35 per cent corporate tax credit for renewable energy installations, the state offers a corporate income tax credit to manufacturers of renewable energy products and equipment. The credit is equal to 25 per cent of the installation and equipment costs of construction, with no maximum limit.
Personal tax credit Renewable Energy Tax Credit – Personal: Provides for an expanded tax credit of 35 per cent of the cost of renewable energy property constructed, purchased or leased by a taxpayer and placed into service in North Carolina during the taxable year. The credit is subject to various ceilings depending on sector and the type of renewable energy system. The credit can be taken against franchise tax, income tax or,if the taxpayer is an insurance company, against the gross premiums tax.
Production incentive TVA – Green Power Switch® Generation Partners Program: TVA and participating power distributors currently offer a dual metering option to residential and small commercial consumers (non-demand metered) through the Green Power Switch® Generation Partners program. Through this program, TVA will purchase the entire output of a qualifying system ($0.15 per kWh) through a participating power distributor and the consumer will receive a credit for the power generated. Participation in this program is entirely up to the discretion of the power distributor.
State loan program Energy Improvement Loan Program: Available to businesses, local governments and non-profit organizations (including public schools) that demonstrate energy efficiency, use of renewable energy resources, energy cost savings or reduced energy demand. Loans with an interest rate of 1 per cent are available for certain renewable energy and energy recycling projects.
North Dakota Corporate tax credit Geothermal, Solar, and Wind Corporate Credit: Allows any taxpayer to claim an income tax credit of 3 per cent per year for five years & Personal tax credit for the cost of equipment and installation of a PV system.
Property tax exemption Geothermal, Solar, and Wind Property Exemption: Exempts PV systems from local property taxes. Qualifying systems can be stand-alone or part of a conventional system, but only the renewable energy portion of the total system is eligible.
Oregon Corporate tax credit Business Energy Tax Credit: For investments in energy conservation, recycling, renewable energy resources, or less-polluting transportation fuels. The 35 percent tax credit is taken over five years. To date, more than 6,500 energy tax credits have been awarded to Oregon businesses. Altogether, those investments save or generate energy worth about $100 million a year.
Personal tax credit Residential Energy Tax Credit: Homeowners and renters who pay Oregon income taxes are eligible for the Residential Energy Tax Credit ifthey purchase a range of energy efficient and/or renewable energy systems.
Property tax exemption Renewable Energy Systems Exemption: The added value to any property from the installation of a qualifying renewable energy system not be included in the assessment of the property’s value for property tax purposes. This exemption is intended for end users and does not apply to property owned by anyone directly or indirectly involved in the energy industry.
State grant program New Renewable Energy Resources Grants: The Open Solicitations program is designed to support renewable energy projects that do not already have an established incentive program developed and launched by the Energy Trust of Oregon. The program does not fund R&D or pre-commercial activities.
State loan program Small Scale Energy Loan Program (SELP): The sale of bonds is made on a periodic basis and, occasionally, to accommodate a particularly large loan request. Loans are available to individuals, businesses, schools, cities, counties, special districts, state and federal agencies, public corporations, cooperatives, tribes, and non-profits. Though there is no legal maximum loan, the largest single loan has been $16.8 million.
State rebate program Solar Electric Buy-down Program: Available to customers of Pacific Power and PGE who install new PV systems on their new or existinghomes, commercial and community buildings, farms, and municipal facilities.
SUMMARY OF THE STATE-BASED FINANCIAL INCENTIVES IN THE USA
113 //

SUMMARY OF THE STATE-BASED FINANCIAL INCENTIVES IN THE USA
114 //
State Type of scheme Details relating to PV
Utility rebate program Ashland – Solar Electric Program: The City of Ashland encourages electricity customers to install PV systems and interconnect them with the electrical supply grid by offering a one time cash rebate. In order to qualify, the system must be a net metered system interconnected with the City’s electrical grid and must comply with all of the City’s net metering requirements. The system must have unobstructed solar access between the hours of 10 am to 2 pm on December 21.OTEC – Photovoltaic Rebate Program: Customers of Oregon Trail Electric Cooperative (OTEC) who install grid-connected PV systems are eligible for a rebate of $600/kW of installed capacity. Systems must meet OTEC’s net metering and interconnection agreement to be eligible. Customers who choose to net meter will receive a bi-directional meter from OTEC.
Rhode Island Personal tax credit Renewable Energy Personal Tax Credit: Eligible technologies for Rhode Island’s personal renewable energy tax credit include photovoltaics (on and off-grid minimum system sizes apply).
Production Incentive People’s Power & Light – Renewable Energy Certificate Incentive: See entry under Massachusetts for GreenStartSM, and ‘GreenUp’.
Renewable Generation Supply Incentive: The Renewable Energy Fund has funding available to support eligible new renewables projectslocated in New England which serve Rhode Island customers. Facilities may either be customer-sited or bulk power supply projects. Applicants may be either (a) generators, (b) wholesale intermediaries, or current or potential suppliers of retail electricity to Rhode Island customers with agreements with specific eligible generators or (c) end-users proposing supply installations in excess of 25 kW nameplate capacity. The method of distributing available funds will be in the form of a production incentive for a specified amount per kWh produced and delivered to Rhode Island consumers over a specified term, up to a total cap on the award.
Property tax exemption Renewable Energy Property Tax Exemption: For purposes of local municipal property tax assessment, renewable energy systems cannotbe assessed at more than the value of a conventional heating, hot water, or other energy production system. Qualifying technologies includephotovoltaics, etc.
State grant program PV Grant for Commercial, Industrial and Institutional Buildings: The Rhode Island Renewable Energy Fund has issued a Request for Proposals (RFP) for funding to support the installation of PV applications on commercial, industrial and institutional buildings in Rhode Island. Eligible projects include new PV installations which will demonstrate the use of PV systems as viable distributed generation resources, raise awareness in the public and business community of the new and opportunities for renewables in Rhode Island, and advance the infrastructure necessary to install and support future Rhode Island PV applications. RFP for Purchase/Sale of Renewable Electricity to Large Customers: This is designed to encourage the purchase of renewable energy-based electricity supply by large electricity customers in Rhode Island, including business, government, and institutional customers. Supports proposals by large electric customers and/or registered retail electricity suppliers for the purchase or sales of green power to largeelectricity customers in Rhode Island. The intent is to buy-down but not eliminate entirely the cost premium associated with purchasing green power. Possible funding structures include, but are not limited to: Customer Rebates: A fixed grant to either the supplier or the customer, distributed upon green power delivery, intended to buy-down a portion of the cost of the purchase; and a Purchase Incentive:A cents/kWh incentive offered to the customer or the marketer based on kWh of green power purchased/sold.
State rebate program PV & Wind Rebate Program: a $5 per watt buy-down up to 50 per cent of the system cost is available to the state’s residents, businessesand non-profits for the installation of PV systems. Installations on schools, non-profits, and local government buildings enjoy higher levels ofincentives provided they are high visibility locations, or in the case of non-profits, include education and outreach about renewable energy as part of their mission. Incentives are available for up to 90 per cent of the first $50,000, 80 per cent of the next $50,000, and 70 per cent of installation costs over $100,000.Small Customer Incentive Program for Green Power Marketers: Financial incentives to retail electricity suppliers registered in Rhode Island who offer eligible green power products to residential and small business consumers in the state. Products eligible for this incentive are either ‘bundled’ electricity supply offerings from competitive energy suppliers or tradable renewable certificate (TRC) offerings (either sold through the Narragansett Electric Company GreenUp Program, or independently) that meet the product eligibility requirements. The incentive structure specified can support the enrollment of approximately 15,000 customers.

115 //
State Type of scheme Details relating to PV
Utah Corporate tax credit Renewable Energy Systems Tax Credit – Corporate: Applies to 10 per cent of the cost of installation of a system up to $50,000. For residential buildings owned by the business, the credit is 25 per cent of the cost of installation of a system up to a maximum credit of $2,000 per system.
Personal tax credit Renewable Energy Systems Tax Credit – Personal: Utah’s individual income tax credit for renewable energy systems on residential buildings applies to 25 per cent of the cost of installation of a system up to a maximum credit of $2,000 per system.
Sales tax exemption Renewable Energy Sales Tax Exemption: Sales of equipment and machinery used to generate electricity from renewable resources are exempt from the state sales tax.
Washington Industry recruitment High Technology Product Manufacturers Excise Tax Exemption: Washington’s High Technology Sales/Use Tax Deferral exempts qualifying high technology manufacturers from the sales and use tax. The definition of high technology includes the development of alternative energy sources.Chelan County PUD –- Sustainable Natural Alternative Power (SNAP) Producers Program: Encourages customers to install alternative power generators such as PV and connect them to the District’s electrical distribution system by offering an incentive payment based on the system’s production. The amount paid on a $/kWh basis by Chelan County PUD to SNAP Producers will depend on the total amount contributed by SNAP Purchasers through the utility’s green pricing program and the total amount generated by all SNAP Producers.Orcas Power & Light – Production Incentive: Orcas Power and Light (OPALCO), an electric cooperative serving Washington’s San Juan Islands, provides an interconnection incentive for residential and commercial members who generate energy from PV etc. To receive an incentive, members must sign an Agreement for Interconnection granting OPALCO rights to the system’s Green Tags. Solar generators can choose either a net metering or buy/sell option.
Sales tax exemption Sales and Use Tax Exemption: Sales and use tax exemption for solar, wind, and landfill gas electric generating facilities to include fuel cells. In addition, the exemption now applies to smaller systems, with a generating capacity of at least 2 kW.
Puget Sound Energy – Solar PV System Rebate: Rebate to residential electricity customers who install a PV system on their home.The rebate incentive amount depends on the level of capacity and in which county the PV system is installed.
Wisconsin Property tax exemption Solar and Wind Energy Equipment Exemption: Any value added by a solar or wind energy system is exempted from general property taxes.
State grant program Focus on Energy – Grant Programs: Focus on Energy offers several grant programs to support the development of renewable energy. Financial support is provided thorugh: Business & Marketing Grants for developing business skills and marketing materials for organizations and businesses that provide renewable energy services; and Feasibility Study Grants for assessing the feasibility of using complex, customer-sited renewable energy systems. Feasibility Study Grants are intended to increase the ability of businesses or organizations to make informed decisions about using renewable energy systems by understanding and solving technical uncertainties. Implementation grants provide financial support for large renewable energy projects (greater than 20 kW or 5,000 therms per year).
State loan program Focus on Energy – Loan Program: Offers low-interest loans to finance renewable energy projects on existing owner-occupied single-family and duplex homes. Homeowners can borrow $2,500 – $20,000 at an interest rate of 1.99%. Loan terms vary from three to 10 years. Systems must be installed by a participating contractor.
State rebate program Focus on Energy – Cash-Back Reward: Offers Cash-Back Rewards for installing or expanding renewable energy systems on businesses and homes. Payments are based on an estimate of the amount of electricity or therms produced annually.
Utility rebate program Wisconsin Municipal Utility Solar Energy Cash Allowance: Many of Wisconsin’s municipal utilities support customer use of solar energy by providing cash incentives for qualifying projects.
THE AUSTRALIAN PHOTOVOLTAIC INDUSTRY ROADMAP
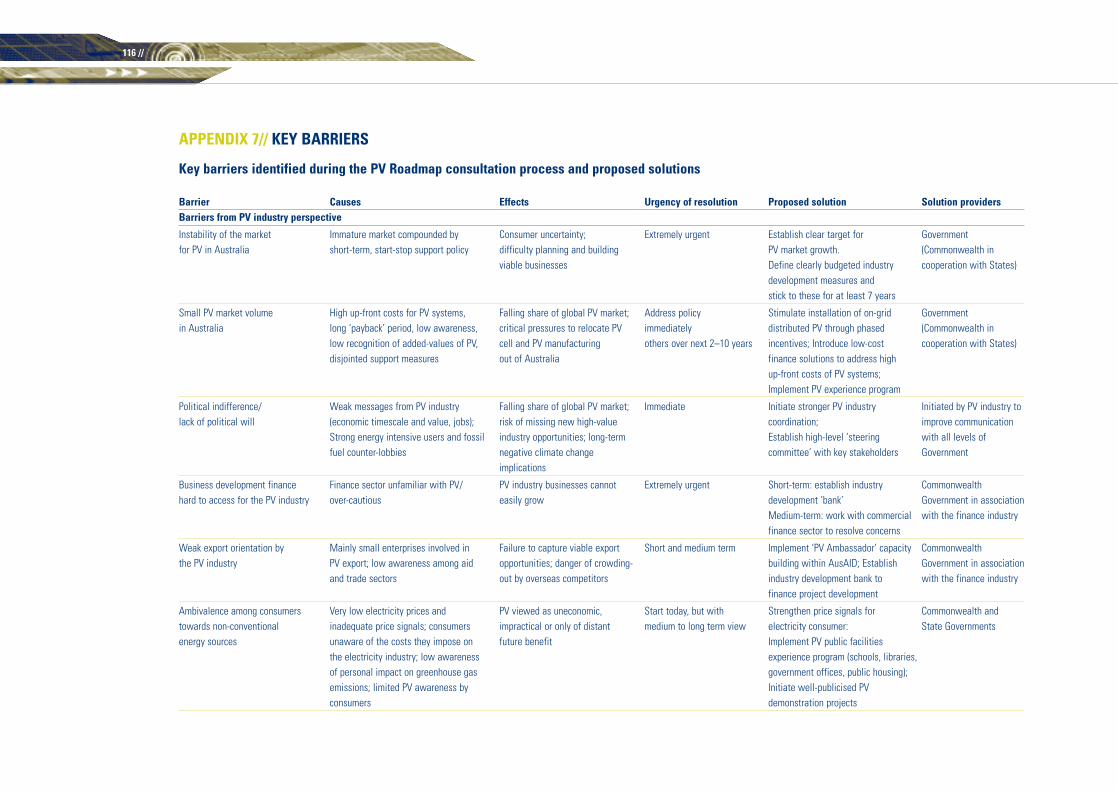
APPENDIX 7// KEY BARRIERS
Key barriers identified during the PV Roadmap consultation process and proposed solutions
Barrier Causes Effects Urgency of resolution Proposed solution Solution providersBarriers from PV industry perspective
Instability of the market Immature market compounded by Consumer uncertainty; Extremely urgent Establish clear target for Government for PV in Australia short-term, start-stop support policy difficulty planning and building PV market growth. (Commonwealth in
viable businesses Define clearly budgeted industry cooperation with States)development measures and stick to these for at least 7 years
Small PV market volume High up-front costs for PV systems, Falling share of global PV market; Address policy Stimulate installation of on-grid Government in Australia long ‘payback’ period, low awareness, critical pressures to relocate PV immediately distributed PV through phased (Commonwealth in
low recognition of added-values of PV, cell and PV manufacturing others over next 2–10 years incentives; Introduce low-cost cooperation with States)disjointed support measures out of Australia finance solutions to address high
up-front costs of PV systems;Implement PV experience program
Political indifference/ Weak messages from PV industry Falling share of global PV market; Immediate Initiate stronger PV industry Initiated by PV industry to lack of political will (economic timescale and value, jobs); risk of missing new high-value coordination; improve communication
Strong energy intensive users and fossil industry opportunities; long-term Establish high-level ‘steering with all levels of fuel counter-lobbies negative climate change committee’ with key stakeholders Government
implications
Business development finance Finance sector unfamiliar with PV/ PV industry businesses cannot Extremely urgent Short-term: establish industry Commonwealthhard to access for the PV industry over-cautious easily grow development ‘bank’ Government in association
Medium-term: work with commercial with the finance industryfinance sector to resolve concerns
Weak export orientation by Mainly small enterprises involved in Failure to capture viable export Short and medium term Implement ‘PV Ambassador’ capacity Commonwealththe PV industry PV export; low awareness among aid opportunities; danger of crowding- building within AusAID; Establish Government in association
and trade sectors out by overseas competitors industry development bank to with the finance industryfinance project development
Ambivalence among consumers Very low electricity prices and PV viewed as uneconomic, Start today, but with Strengthen price signals for Commonwealth and towards non-conventional inadequate price signals; consumers impractical or only of distant medium to long term view electricity consumer: State Governmentsenergy sources unaware of the costs they impose on future benefit Implement PV public facilities
the electricity industry; low awareness experience program (schools, libraries,of personal impact on greenhouse gas government offices, public housing);emissions; limited PV awareness by Initiate well-publicised PV consumers demonstration projects
116 //

THE AUSTRALIAN PHOTOVOLTAIC INDUSTRY ROADMAP 117 //
Barrier Causes Effects Urgency of resolution Proposed solution Solution providers
Apparently small Widespread rural grid availability/ Reduced opportunity for PV in Medium to long term Initiate projects to demonstrate Initiated by the PVoff-grid market for PV uniform tariffs potentially economic viability of PV for fringe-grid locations; industry in cooperation
applications Work with electricity industry to with all levels of define more appropriate policies Government and the for distributed generation as an electricity industryalternative to network expansion in remote areas; Implement specialised off-grid promotion and finance programs for water pumping and desalination
Barriers from other stakeholders perspectives
High up-front cost/long payback Small market volumes (little Demand and experience remain Short and medium term Continue to reduce prices of PV Initiated by the PVperiod for PV systems mass-production effect); limited (service) low; competitors with large system components industry in cooperation
industry experience; technologies still subsidised markets pull ahead; Develop consumer finance packages with all levels of being optimised (especially grid-connect) for installation of PV systems; Government and the
Include costs of BIPV systems in electricity, finance and building construction costs; building industriesProvide incentives for early adopters of BIPV systems; Reward non-energy benefits of PV (eg use of PV as an alternative to network expansion in remote areas)
Complex ‘purchase’ procedures Subsidy and RECs programs are new Reluctance by consumers to deal Immediate Streamline application procedures Initiated by the PV(subsidies, RECs interconnection, and unfamiliar to the consumer; with the complexities involved in for subsidies and creation of RECs; industry in cooperationbuy-back) electricity industry is unfamiliar with purchasing PV systems Establish a common interconnection with all levels of
PV and applies inappropriate procedures and buyback agreement for PV Government and thefor interconnection and buyback systems throughout Australia; electricity industry
Train installers to deal with all the procedures on behalf of the consumer
Apprehension about PV amongst Risk-averse electricity industry with PV overlooked or discounted as a Next 2–5 years Quantify, demonstrate and publicise Initiated by the PVelectricity industry little experience of PV, uncertainty about viable demand management or added-values of PV through monitored industry in cooperation
added value claims because little distributed generation option (only demonstration projects; with the electricityquantification of unpriced benefits has for distant future) Establish high-level ‘steering industrybeen carried out committee’ with key stakeholders in
the electricity industry

Barrier Causes Effects Urgency of resolution Proposed solution Solution providers
PV electricity is not dispatchable/ PV is an intermittent resource; no ideal Electricity industry see PV as a Medium term Focus on development of storage R&D by the PV industrycannot fully displace firm convention storage solution as yet niche generation technology technology; Work on interfacing PV (including universitiesgeneration of uncertain value with future-focussed technologies and research institutes)
(e.g. hydrogen & fuel cells)
Building developers are largely Little PV exposure and experience in The main opportunity for PV Short and medium term Demonstrate appropriate BIPV Initiated by the PV unfamiliar with PV and unaware the building industry; little awareness is inaccessible applications; Quantify and report industry in cooperation of its potential value to them of their ability to influence the energy costs and benefits of BIPV; with all levels of
sources used in buildings and therefore Introduce more stringent building Government and the reduce operating costs minimum energy performance building industry
standards
Lack of strategic R&D support Closure of Government funding programs Collapse of research groups High Establishment of a Strategic PV Commonwealth and State Reduction in educational R&D Fund Governments in opportunities cooperation with the
PV industry
KEY BARRIERS
118 //

THE AUSTRALIAN PHOTOVOLTAIC INDUSTRY ROADMAP 119 //
APPENDIX 8// DOMESTIC MARKET ESTIMATES BY APPLICATION
Application Description/comments Typical PV unit size Market potential Current penetration Maximum sustainable Assumptions(average) annual sales estimate
Off-grid domesticRemote households Traditional market, 1–3 kW (1.5) 30,000–45,000 8,000–13,000 systems 3.0 MW pa 25 year cycle, 50% penetration.
increasing penetration households (150 MW) (12 MW) Offsetting 2/3 of diesel capacity. N.B typical diesel capacity 7.5kW
Holiday homes Usually good correlatation 0.5–1 kW (1.5) Included in above Included in above Included in above Offsetting diesel and petrolto typical time and profile generators, or grid extensionof occupancy
Pastoral stations Traditional market, 2.5 kW+ 44MW Included in above Included in above Offsetting diesel generatorsincreasing penetration (Included in above)
Isolated communities Increasing market, Need to add 19.3 MW Included in above Included in above Offsetting diesel generators(Indigenous) especially for mini-grids (Included in above)
Fringe-grid Hard to access with 3–5 kW (assumes 5% of 7 million households Nil 20–30 MW pa 25 year cycle, 50% penetration.current electrification as per remote household) 1000–1750 MWpolicy
Sector total 3.0 MW(25+ MW with different electrification approach)
Off-grid non-domesticTelecoms Standard application 0.2–1.0 kW Very High 2–3 MW pa StableWater pumping Potential for addressing 0.1–2.0 kW Windpump market was Small 10 MW pa (?) 25 year cycle, 50% penetration
salinity issues 500k units and 10k units pa of ‘old’ windpump marketSignalling Road, rail, airport 10W–2 kW 0.5 MW Best estimateCathodic protection Standard application 50W–0.2 kW 0.2 MW StableElectric fences Standard product 10–20 W 0.1 MW Best estimateLighting Street lighting, 50W – 0.1kW 1–2 MW pa Best estimate
remote lightingIsolated communities Reports suggest not easily 330 MW Negligible 4.4 MW pa 25 year cycle, 50% penetration.(Mines) accessible before 2010 Offsetting 2/3 of diesel capacityTourist facilities Driven by ecotourism 15 MW Negligible 0.3 MW pa 25 year cycle, 50% penetration.Public generation 200–19000 kW 195 MW Negligible 2.6 MW pa 25 year cycle, 50% penetration.
Offsetting 2/3 of diesel capacity
Sector total 20 MW

Application Description/comments Typical PV unit size Market potential Current penetration Maximum sustainable Assumptions(average) annual sales estimate
Grid-connected distributedResidential rooftops New market, 1–3 kW (1.5) 95% of 7,000,000 3,000 systems (3.5MW) 400 MW pa 25 year cycle, 50% penetration,
significant potential households (6–20 GW) future system size 3kWCommercial BIPV Emerging market, 10–100kW (3.8–11.5 GW) Small (<0.5MW) 200 MW pa 25 year cycle, 50% penetration
significant potential
Sector total 600 MW
Grid-connected centralisedNetwork strengthening Support for weak grids 100–1000kW Small (0.5 MW) Included in below
(some overlap with fringe-grid and distributed generation), but mainly utility driven
Bulk power Future desert PV and/or >1 MW 2003 Elec Demand of 2 Nil At least 200 MW, possibly Lower figure is 20% penetrationHydrogen production 230 TWh (i.e. >160 GW PV up to 2000 MW pa of power for H2 production by 2030.
at full penetration). Higher is 20% penetration of 030 demand est. 400 TWh total power sector (less 2030 electricity demand distributed capacity which for H2 = 35.5 TWh generates potentially 42TWhpa)
Sector total 200–2000 MW
Small portable electronic devicesSmall portable Particularly next 1–10 W Could be very large 10 MW Best estimateelectronic devices generation PV modules
which perform in low light conditions
Sector total 10 MW
DOMESTIC MARKET ESTIMATES BY APPLICATION
120 //

AUSTRALIAN BUSINESS COUNCIL FOR SUSTAINABLE ENERGY