THE APPLICATION OF OWAs IN EXPERTISE PROCESSES: THE ... - M. E. Sansalvador... · OWAs are...
18
Economic Computation and Economic Cybernetics Studies and Research, Issue 3/2017, Vol. 51 ________________________________________________________________________________ 73 Professor Manuel E. SANSALVADOR, PhD E-mail: [email protected] Professor José M. BROTONS, PhD E-mail: [email protected] Department of Economic and Financial Studies Miguel Hernández University - Elche (Alicante). Spain THE APPLICATION OF OWAs IN EXPERTISE PROCESSES: THE DEVELOPMENT OF A MODEL FOR THE QUANTIFICATION OF HIDDEN QUALITY COSTS Abstract. This paper will introduce a fuzzy model for the quantification of hidden quality costs based on the aggregation of subjective information. The proposed model will be able to properly aggregate and summarize subjective opinions expressed by experts about the costs to be quantified, thereby achieving an adequate level of objectivity. To do so,a Probabilistic Uncertain Ordered Weighted Average operator is used, establishing as weighting factors both the confidence the organization has in each expert and, thanks to an original and specifically designed tool, the company’s position on Crosby’s well-known Quality Management Maturity Grid. Finally, in order to refine the results, the values obtained will undergo Contra-Expertise through Ordered Weighted Average Expertons. Once the theoretical model has been described, it will be applied to a case study: the quantification of the cost of loss of image in one insurance brokerage firm. Keywords: Quality Management; Quality Cost; Fuzzy Logic;Ordered Weighted Average; Case Study. JEL Classification: C02; M10;M49 1. Introduction The first written reference about the term “quality cost” was by Juran at the beginning of the 1950s. Specifically, his book Quality Control Handbook (Juran, 1951) defines what he calls the “cost of poor quality” as “the sum of all costs that would disappear if there were no quality problems.” This position relates very closely to Campanella’s point of view, according to which: “any cost that would not have occurred if the quality were perfect, contributes to quality cost” (Campanella, 1999). The essence of measuring quality cost can be found in the fact that each identified quality problem brings with it a visible recoverable cost which can be assigned a value (Campanella, 1999). However, what happens when, because of
Transcript of THE APPLICATION OF OWAs IN EXPERTISE PROCESSES: THE ... - M. E. Sansalvador... · OWAs are...
Economic Computation and Economic Cybernetics Studies and Research, Issue 3/2017, Vol. 51
________________________________________________________________________________
73
Professor Manuel E. SANSALVADOR, PhD
E-mail: [email protected]
Professor José M. BROTONS, PhD
E-mail: [email protected]
Department of Economic and Financial Studies
Miguel Hernández University - Elche (Alicante). Spain
THE APPLICATION OF OWAs IN EXPERTISE PROCESSES: THE
DEVELOPMENT OF A MODEL FOR THE QUANTIFICATION OF
HIDDEN QUALITY COSTS
Abstract. This paper will introduce a fuzzy model for the quantification of
hidden quality costs based on the aggregation of subjective information. The
proposed model will be able to properly aggregate and summarize subjective
opinions expressed by experts about the costs to be quantified, thereby achieving
an adequate level of objectivity. To do so,a Probabilistic Uncertain Ordered
Weighted Average operator is used, establishing as weighting factors both the
confidence the organization has in each expert and, thanks to an original and
specifically designed tool, the company’s position on Crosby’s well-known Quality
Management Maturity Grid. Finally, in order to refine the results, the values
obtained will undergo Contra-Expertise through Ordered Weighted Average
Expertons. Once the theoretical model has been described, it will be applied to a
case study: the quantification of the cost of loss of image in one insurance
brokerage firm.
Keywords: Quality Management; Quality Cost; Fuzzy Logic;Ordered
Weighted Average; Case Study.
JEL Classification: C02; M10;M49
1. Introduction
The first written reference about the term “quality cost” was by Juran at the
beginning of the 1950s. Specifically, his book Quality Control Handbook (Juran,
1951) defines what he calls the “cost of poor quality” as “the sum of all costs that
would disappear if there were no quality problems.” This position relates very
closely to Campanella’s point of view, according to which: “any cost that would
not have occurred if the quality were perfect, contributes to quality cost”
(Campanella, 1999).
The essence of measuring quality cost can be found in the fact that each
identified quality problem brings with it a visible recoverable cost which can be
assigned a value (Campanella, 1999). However, what happens when, because of
Manuel E. Sansalvador, José M. Brotons
_________________________________________________________________
74
the nature of the problem, it is impossible to carry out an objective valuation of the
quality cost?
The aim of this paper is to answer this question. A new methodology will
be developed, which we believe will improve the quantification process of certain
elements of quality cost, which are called “hidden” because of the inherent
difficulties for their estimation.
A great part of the literature written about the measurement of hidden
quality costs stems from the study by Kotler (1991), and in particular, that by
Albright and Roth (1992), where different methods for calculating such costs are
outlined. Since then, several authors have dealt with the quantification of hidden
quality costs from different perspectives (see for example, Robison, 1997;
Chiadamrong, 2003; Freiesleben, 2004; Snieska et.al.,2013). But authors have
traditionally used Probabilistic Theory as a mathematical instrument to quantify
hidden quality costs. However, the use of Probabilistic Theory requires assigning
precise numbers to each event, when in reality, as the estimations they are, they
would be better described by vague assertions, and therefore, approximate. Indeed,
such theory does not contemplate the imprecision and subjectivity underlying any
process of quantifying hidden quality costs. In order to overcome this problem, we
propose using fuzzy logic and the concept of possibility.
The application of fuzzy set theory is a suitable approach in cases where
uncertainty is due to incompleteness or imprecision. Several authors have dealt
with uncertainty using fuzzy sets (e.g., Klirand Yuan, 1995; Zimmermann, 2000;
Zadeh, 2005; Brotons andTerceño, 2010). On the other hand, applying fuzzy logic
in management accounting is not new. For example Terceño and Vigier (2011)
developed a model of financial economic diagnosis of companies, which on the
basis of a simple scheme of cause effect, simulate the action of the analyst in its
task of diagnosis.
This paper will introduce a model for the quantification of hidden quality
costs based on the aggregation of subjective information. In order to improve the
treatment of the subjectivity and uncertainty existing in information supplied by
experts, the use of the Experton Theory (Kaufmann, 1987) and application of
OWAs are proposed. This is a very interesting instrument which permits the
aggregation of the experts’ opinion and gives consistency to the results.
SinceYager (1988) introduced this aggregation technique based on ordered
weighted averaging(OWA), extensive literature has been published about it
(SadiqandTesfamariam, 2007; ZarghamiandSzidarovszky, 2009;Dong et. al.
2010;Casanovas et. al., 2015). However, this paper introduces a completely
innovative application of the tools described for their use in the management and
measurement of quality. Added to this, the model has an original development
towards the aggregation of experts' opinions. These opinions are weighted
according to the level of confidence in each expert and the company’s position on
Crosby’s Quality Management Maturity Grid (Crosby, 1979), which should be
especially noted for its originality.
The Application of OWAs in Expertise Processes: The Development of a Model
for the Quantification of Hidden Quality Costs
__________________________________________________________________
75
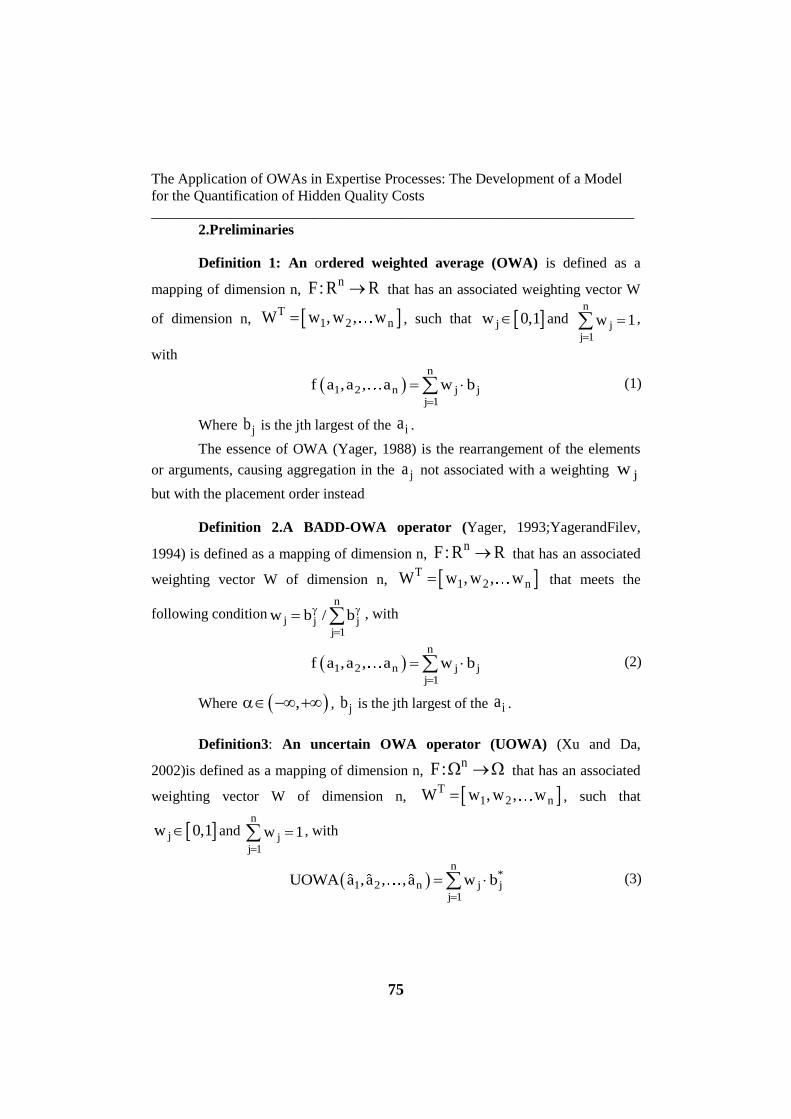
2.Preliminaries
Definition 1: An ordered weighted average (OWA) is defined as a
mapping of dimension n, nF: R R that has an associated weighting vector W
of dimension n, T1 2 nW w , w , w , such that jw 0,1 and
n
jj 1
w 1
,
with
n
1 2 n j jj 1
f a ,a , a w b
(1)
Where jb is the jth largest of the ia .
The essence of OWA (Yager, 1988) is the rearrangement of the elements
or arguments, causing aggregation in the ja not associated with a weighting jw
but with the placement order instead
Definition 2.A BADD-OWA operator (Yager, 1993;YagerandFilev,
1994) is defined as a mapping of dimension n, nF: R R that has an associated
weighting vector W of dimension n, T1 2 nW w , w , w that meets the
following conditionn
j j jj 1
w b / b
, with
n
1 2 n j jj 1
f a ,a , a w b
(2)
Where , , jb is the jth largest of the ia .
Definition3: An uncertain OWA operator (UOWA) (Xu and Da,
2002)is defined as a mapping of dimension n, nF: that has an associated
weighting vector W of dimension n, T1 2 nW w , w , w , such that
jw 0,1 and n
jj 1
w 1
, with
n
*1 2 n j j
j 1
UOWA a ,a , ,a w b
(3)
Manuel E. Sansalvador, José M. Brotons
_________________________________________________________________
76
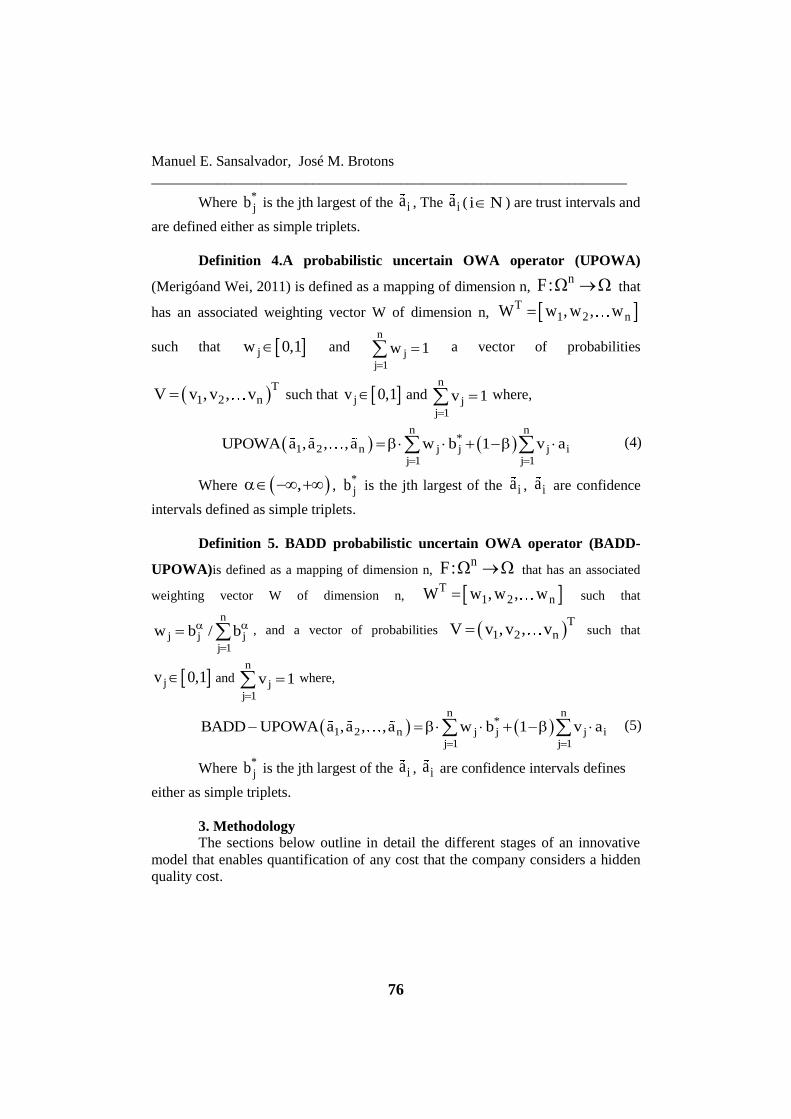
Where *jb is the jth largest of the ia , The ia ( i N ) are trust intervals and
are defined either as simple triplets.
Definition 4.A probabilistic uncertain OWA operator (UPOWA)
(Merigóand Wei, 2011) is defined as a mapping of dimension n, nF: that
has an associated weighting vector W of dimension n, T1 2 nW w , w , w
such that jw 0,1 and n
jj 1
w 1
a vector of probabilities
T
1 2 nV v ,v , v such that jv 0,1 and n
jj 1
v 1
where,
n n
*1 2 n j j j i
j 1 j 1
UPOWA a ,a , ,a w b 1 v a
(4)
Where , , *jb is the jth largest of the ia , ia are confidence
intervals defined as simple triplets.
Definition 5. BADD probabilistic uncertain OWA operator (BADD-
UPOWA)is defined as a mapping of dimension n, nF: that has an associated
weighting vector W of dimension n, T1 2 nW w , w , w such that
n
j j jj 1
w b / b
, and a vector of probabilities T
1 2 nV v ,v , v such that
jv 0,1 and n
jj 1
v 1
where,
n n
*1 2 n j j j i
j 1 j 1
BADD UPOWA a ,a , ,a w b 1 v a
(5)
Where *jb is the jth largest of the ia , ia are confidence intervals defines
either as simple triplets.
3. Methodology
The sections below outline in detail the different stages of an innovative
model that enables quantification of any cost that the company considers a hidden
quality cost.
The Application of OWAs in Expertise Processes: The Development of a Model
for the Quantification of Hidden Quality Costs
__________________________________________________________________
77
3.1. First valuation of Hidden Quality Cost by H experts
First of all, based on their knowledge and the information provided a priori
by the organization, a number of H experts are asked to carry out a first valuation
of the Hidden Quality Cost to be quantified. Since the experts are likely to use
approximations, the information will be gathered through confidence triplets or
triangular fuzzy numbers (TFN).
1 2 3i i i iQ q ,q ,q , i 1, ,H (6)
The results given by the different experts are aggregated and summarized
by applying BADD-UPOWA. To do so, the experts’ opinions are weighted
according to the level of confidence the company has in each of them and the
company’s position on Crosby’s Quality Management Maturity Grid, which is
particularly innovative.
3.2. Use of the Quality Management Maturity Grid for the aggregation
of the experts' predictions about Hidden Quality Cost.
Crosby is an important reference in the study of the behavior of Quality
Costs in organizations. Through his Quality Management Maturity Grid he
analyzed the evolution of quality costs with respect to the development of Quality
Management by simply observing the attitude of the human component of the
organization towards it.
The grid created by Crosby identifies five stages of maturity which
describe the different phases a company goes through and the consequent costs
incurred. These stages go from ignorance and total lack of confidence in quality to
reaching an ideal situation where quality management is considered an essential
part of the organization.
According to Crosby, although the companies situated at the first stage
“Uncertainty” do not make any estimation of Quality Cost, these costs can reach
and even surpass 20% of sales. As a company promotes the implementation of
quality and advances through the stages of the Maturity Grid, Quality Cost
decreases. Therefore, at the “Awakening” stage these costs are around 18%, at the
“Enlightenment” stage they reach approximately 12% of sales, at the “Wisdom”
stage they reach 8% and finally at the “Certainty” stage Quality Cost can represent
2.5% of sales (Crosby, 1979).
Whether we more or less agree or disagree with the percentages provided
by this prestigious author, the fact is that as a company advances in Crosby's
Maturity Grid by suitably reinforcing quality management, it will make fewer
mistakes and these mistakes will also incur lower costs. Therefore, Quality Cost in
general and hidden quality cost in particular will decrease.
On the basis of this premise, the company’s position on Crosby's Maturity
Grid will be introduced as a weighting factor. This will be done in such a way that
for companies situated at the first stages of the table, the highest values given by
Manuel E. Sansalvador, José M. Brotons
_________________________________________________________________
78
the H experts will be weighted more, and in contrast, for the companies situated in
the final stages, more importance will be given to the lower values.
The development of this innovative proposal requires positioning the
company on Crosby's Maturity Grid, so it will be necessary to have the opinion of
new experts, logically different from the previous experts, who could be internal
(with the necessary training) or external to the company
3.2.1.Determining the company’s membership for each of the stages of
Crosby’s Maturity Grid.
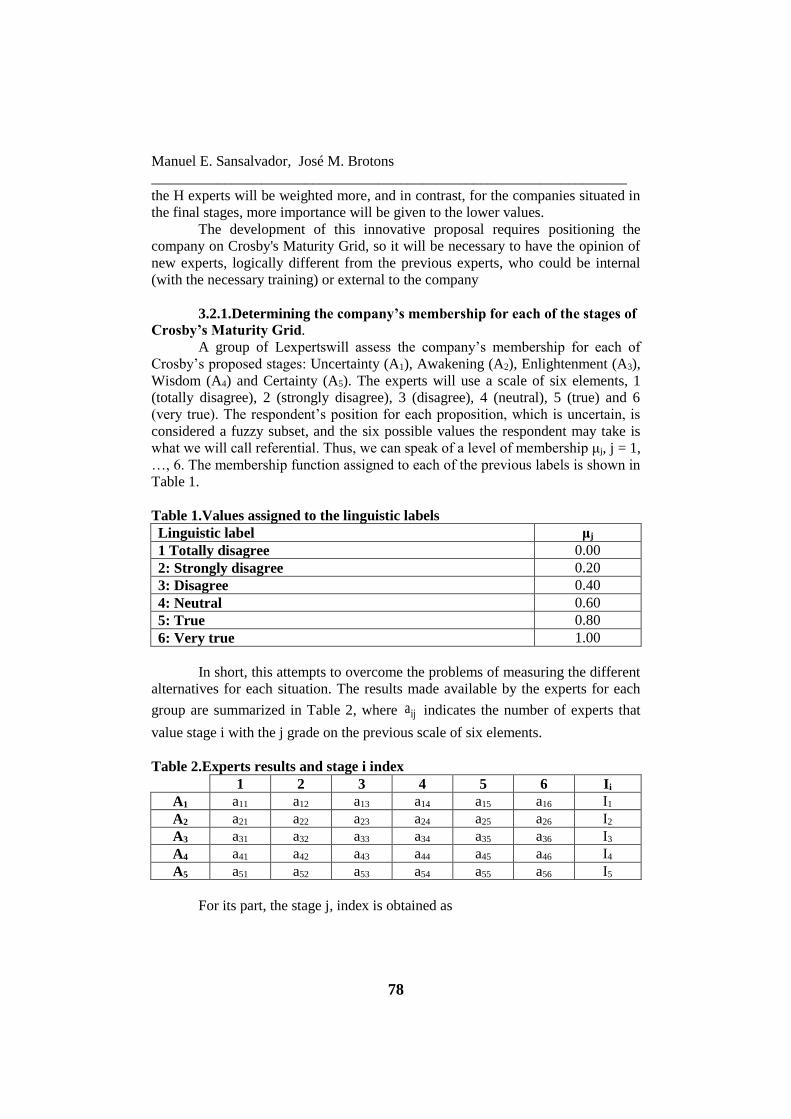
A group of Lexpertswill assess the company’s membership for each of
Crosby’s proposed stages: Uncertainty (A1), Awakening (A2), Enlightenment (A3),
Wisdom (A4) and Certainty (A5). The experts will use a scale of six elements, 1
(totally disagree), 2 (strongly disagree), 3 (disagree), 4 (neutral), 5 (true) and 6
(very true). The respondent’s position for each proposition, which is uncertain, is
considered a fuzzy subset, and the six possible values the respondent may take is
what we will call referential. Thus, we can speak of a level of membership μj, j = 1,
…, 6. The membership function assigned to each of the previous labels is shown in
Table 1.
Table 1.Values assigned to the linguistic labels
Linguistic label μj
1 Totally disagree 0.00
2: Strongly disagree 0.20
3: Disagree 0.40
4: Neutral 0.60
5: True 0.80
6: Very true 1.00
In short, this attempts to overcome the problems of measuring the different
alternatives for each situation. The results made available by the experts for each
group are summarized in Table 2, where ija indicates the number of experts that
value stage i with the j grade on the previous scale of six elements.
Table 2.Experts results and stage i index
1 2 3 4 5 6 Ii
A1 a11 a12 a13 a14 a15 a16 I1
A2 a21 a22 a23 a24 a25 a26 I2
A3 a31 a32 a33 a34 a35 a36 I3
A4 a41 a42 a43 a44 a45 a46 I4
A5 a51 a52 a53 a54 a55 a56 I5
For its part, the stage j, index is obtained as
The Application of OWAs in Expertise Processes: The Development of a Model
for the Quantification of Hidden Quality Costs
__________________________________________________________________
79
6
j i ikk 1
1I a , j 1,2, 5
L
. (7)
Where L is the number of experts that value the company’s membership
function for each of the stages of Crosby's Maturity Grid.
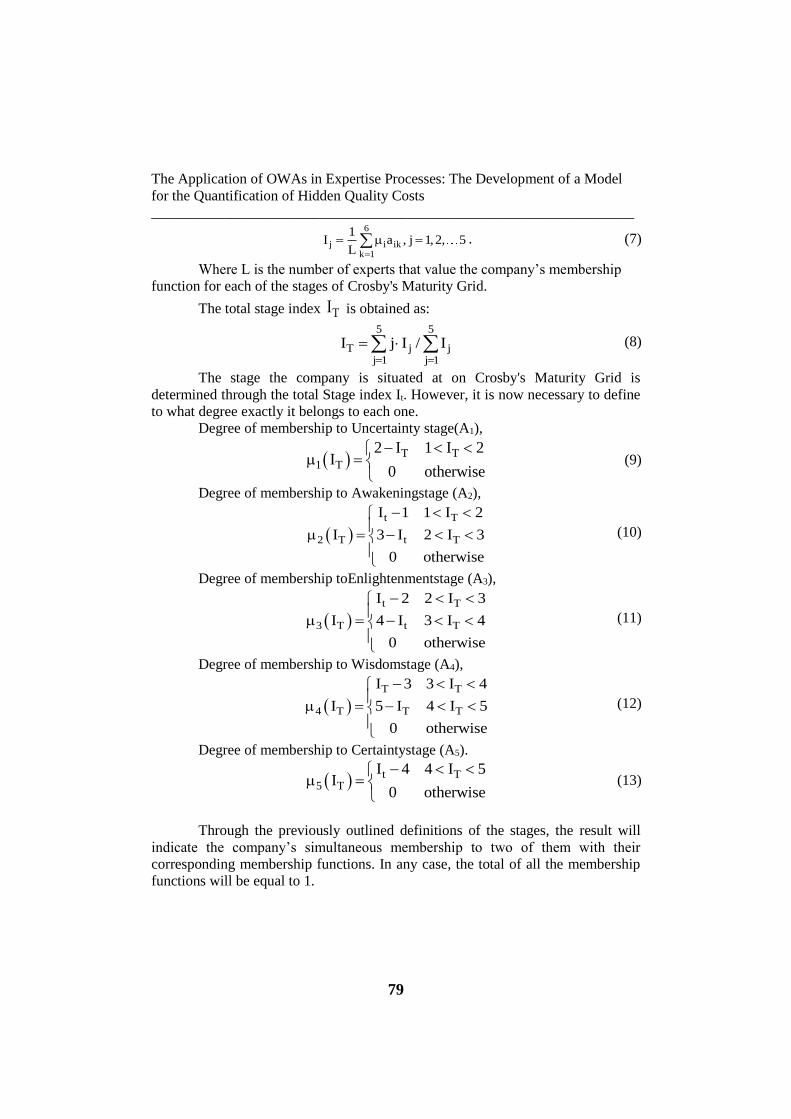
The total stage index TI is obtained as:
5 5
T j jj 1 j 1
I j I / I
(8)
The stage the company is situated at on Crosby's Maturity Grid is
determined through the total Stage index It. However, it is now necessary to define
to what degree exactly it belongs to each one.
Degree of membership to Uncertainty stage(A1),
T T
1 T
2 I 1 I 2I
0 otherwise
(9)
Degree of membership to Awakeningstage (A2),
t T
2 T t T
I 1 1 I 2
I 3 I 2 I 3
0 otherwise
(10)
Degree of membership toEnlightenmentstage (A3),
t T
3 T t T
I 2 2 I 3
I 4 I 3 I 4
0 otherwise
(11)
Degree of membership to Wisdomstage (A4),
T T
4 T T T
I 3 3 I 4
I 5 I 4 I 5
0 otherwise
(12)
Degree of membership to Certaintystage (A5).
t T5 T
I 4 4 I 5I
0 otherwise
(13)
Through the previously outlined definitions of the stages, the result will
indicate the company’s simultaneous membership to two of them with their
corresponding membership functions. In any case, the total of all the membership
functions will be equal to 1.
Manuel E. Sansalvador, José M. Brotons
_________________________________________________________________
80
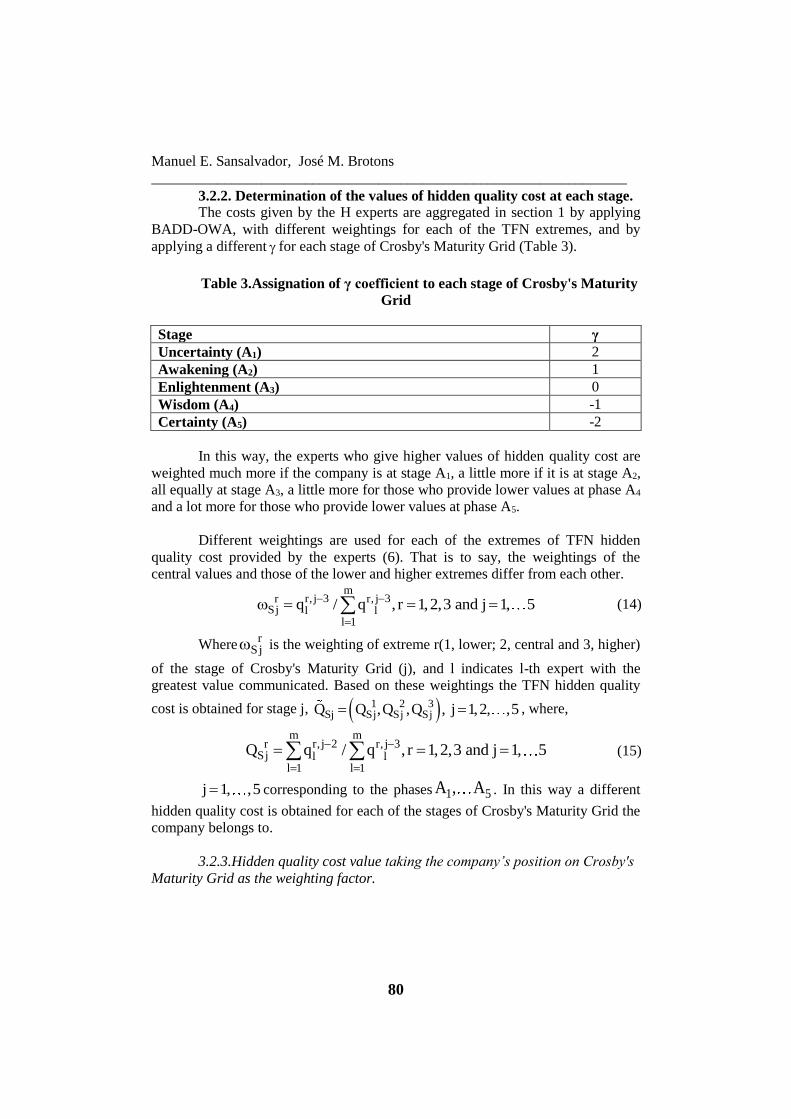
3.2.2. Determination of the values of hidden quality cost at each stage.
The costs given by the H experts are aggregated in section 1 by applying
BADD-OWA, with different weightings for each of the TFN extremes, and by
applying a different for each stage of Crosby's Maturity Grid (Table 3).
Table 3.Assignation of γ coefficient to each stage of Crosby's Maturity
Grid
Stage γ
Uncertainty (A1) 2
Awakening (A2) 1
Enlightenment (A3) 0
Wisdom (A4) -1
Certainty (A5) -2
In this way, the experts who give higher values of hidden quality cost are
weighted much more if the company is at stage A1, a little more if it is at stage A2,
all equally at stage A3, a little more for those who provide lower values at phase A4
and a lot more for those who provide lower values at phase A5.
Different weightings are used for each of the extremes of TFN hidden
quality cost provided by the experts (6). That is to say, the weightings of the
central values and those of the lower and higher extremes differ from each other.
m
r,j 3 j 3r r,Sj l l
l 1
q / q , r 1,2,3 and j 1, 5
(14)
Wherer
S j is the weighting of extreme r(1, lower; 2, central and 3, higher)
of the stage of Crosby's Maturity Grid (j), and l indicates l-th expert with the
greatest value communicated. Based on these weightings the TFN hidden quality
cost is obtained for stage j, 1 2 3Sj Sj Sj SjQ Q ,Q ,Q , j 1,2, ,5 , where,
m m
r,j 2 j 3r r,Sj l l
l 1 l 1
Q q / q , r 1,2,3 and j 1, 5
(15)
j 1, ,5 corresponding to the phases 1 5A , A . In this way a different
hidden quality cost is obtained for each of the stages of Crosby's Maturity Grid the
company belongs to.
3.2.3.Hidden quality cost value taking the company’s position on Crosby's
Maturity Grid as the weighting factor.
The Application of OWAs in Expertise Processes: The Development of a Model
for the Quantification of Hidden Quality Costs
__________________________________________________________________
81
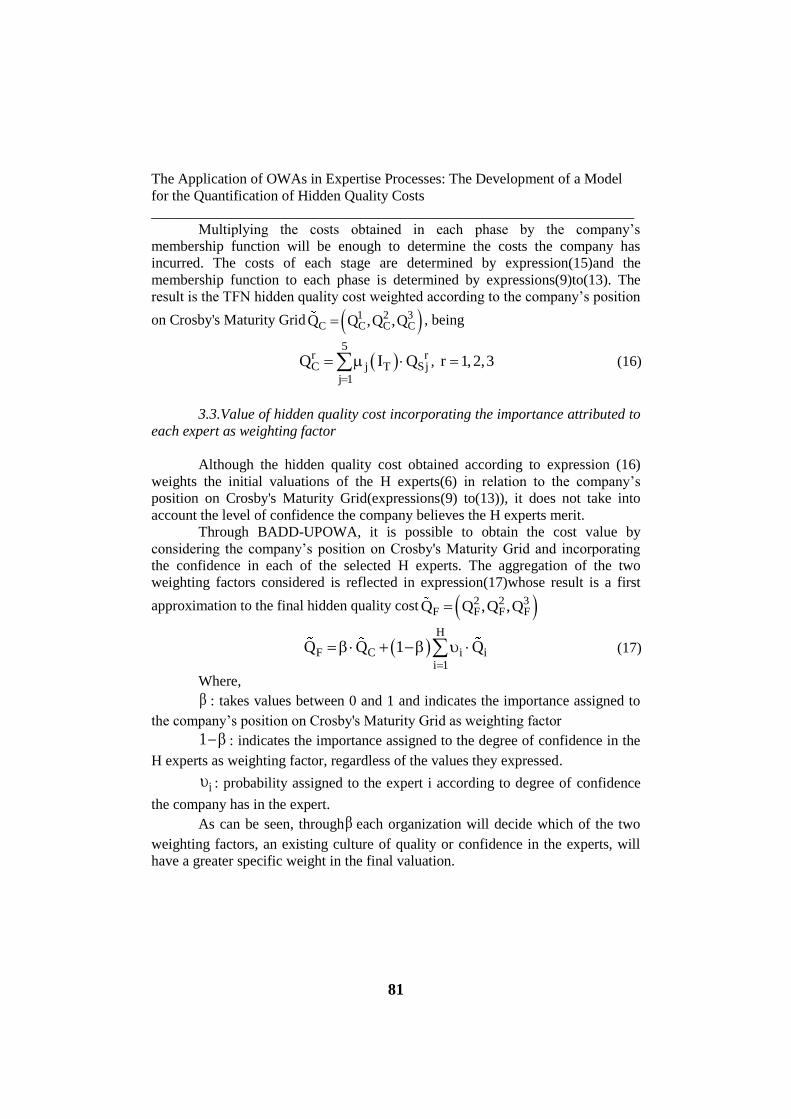
Multiplying the costs obtained in each phase by the company’s
membership function will be enough to determine the costs the company has
incurred. The costs of each stage are determined by expression(15)and the
membership function to each phase is determined by expressions(9)to(13). The
result is the TFN hidden quality cost weighted according to the company’s position
on Crosby's Maturity Grid 1 2 3C C C CQ Q ,Q ,Q , being
5
r rC j T Sj
j 1
Q I Q
, r 1, 2,3 (16)
3.3.Value of hidden quality cost incorporating the importance attributed to
each expert as weighting factor
Although the hidden quality cost obtained according to expression (16)
weights the initial valuations of the H experts(6) in relation to the company’s
position on Crosby's Maturity Grid(expressions(9) to(13)), it does not take into
account the level of confidence the company believes the H experts merit.
Through BADD-UPOWA, it is possible to obtain the cost value by
considering the company’s position on Crosby's Maturity Grid and incorporating
the confidence in each of the selected H experts. The aggregation of the two
weighting factors considered is reflected in expression(17)whose result is a first
approximation to the final hidden quality cost 2 2 3F F F FQ Q ,Q ,Q
H
F C i ii 1
Q Q 1 Q
(17)
Where,
: takes values between 0 and 1 and indicates the importance assigned to
the company’s position on Crosby's Maturity Grid as weighting factor
1 : indicates the importance assigned to the degree of confidence in the
H experts as weighting factor, regardless of the values they expressed.
i : probability assigned to the expert i according to degree of confidence
the company has in the expert.
As can be seen, through each organization will decide which of the two
weighting factors, an existing culture of quality or confidence in the experts, will
have a greater specific weight in the final valuation.
Manuel E. Sansalvador, José M. Brotons
_________________________________________________________________
82
Although 1 2 3F F F FQ Q ,Q ,Q summarizes the final hidden quality cost
value analyzed, in order to provide a greater consistency to the analysis carried out,
we propose that the results obtained undergo Contra-Expertise.
3.4.Revision of the information obtained applying the BADD-UPOWA
Contra-Expertise method: final quantification of hidden quality cost.
Contra-Expertise consists of applying to new experts, different from those
who made the first expertise, who will comment on the opinions of the first
experts, thereby increasing the objectivity of the new opinions about the resulting
values. The application of BADD-UPOWA in the grouping of the new opinions
about hidden quality cost, permits introducing the same weighting factors as before
into the analysis. The following three stages are proposed:
3.4.1. Calculation of hidden quality cost according to the company's
position on Crosby's Maturity Grid
First we obtain the M-Expertons, defined as Experton, where opinions are
provided in triplets of confidence instead of in confidence intervals or true values,
which permits greater sensibility as well as greater approximation by the experts.
Afterwards, the M-Expertons, defined in the interval [0,1], will be transformed into
R-Expertons, whose interval comprehends the universe of values that the variable
can take, in this case hidden quality cost expressed in Euros. The steps to be
followed in this first stage are given below:
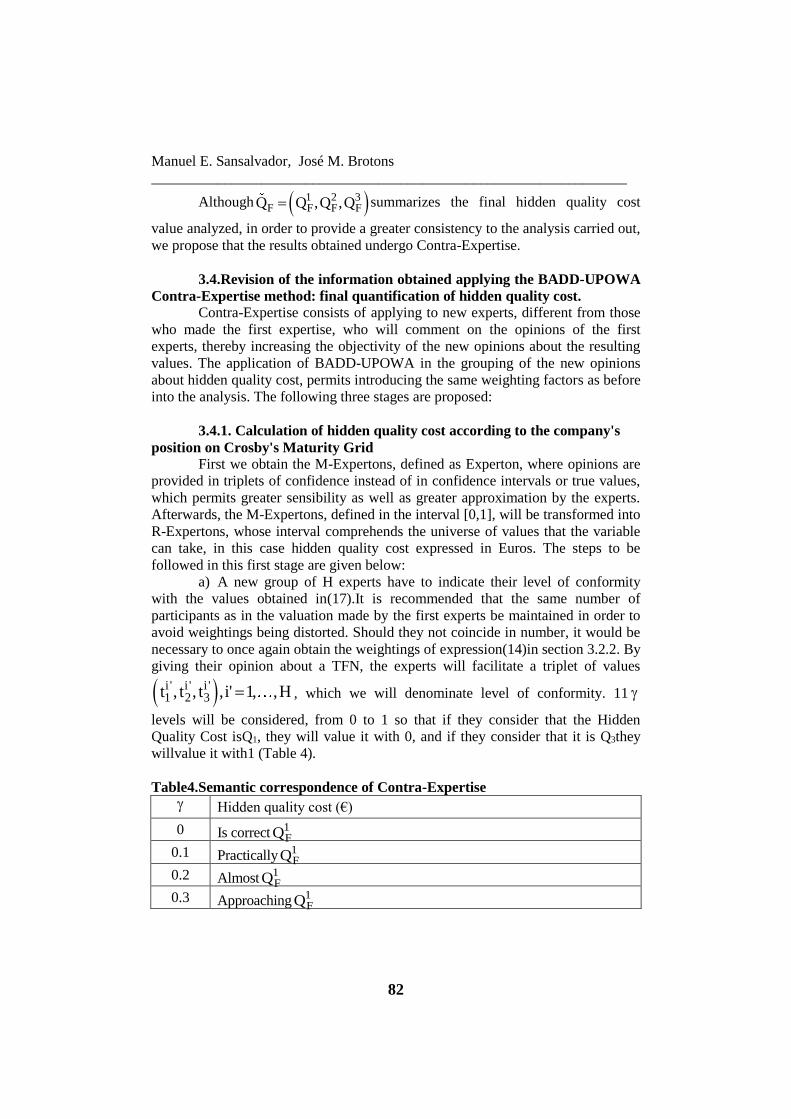
a) A new group of H experts have to indicate their level of conformity
with the values obtained in(17).It is recommended that the same number of
participants as in the valuation made by the first experts be maintained in order to
avoid weightings being distorted. Should they not coincide in number, it would be
necessary to once again obtain the weightings of expression(14)in section 3.2.2. By
giving their opinion about a TFN, the experts will facilitate a triplet of values
i ' i ' i '1 2 3t , t , t ,i' 1, ,H , which we will denominate level of conformity. 11
levels will be considered, from 0 to 1 so that if they consider that the Hidden
Quality Cost isQ1, they will value it with 0, and if they consider that it is Q3they
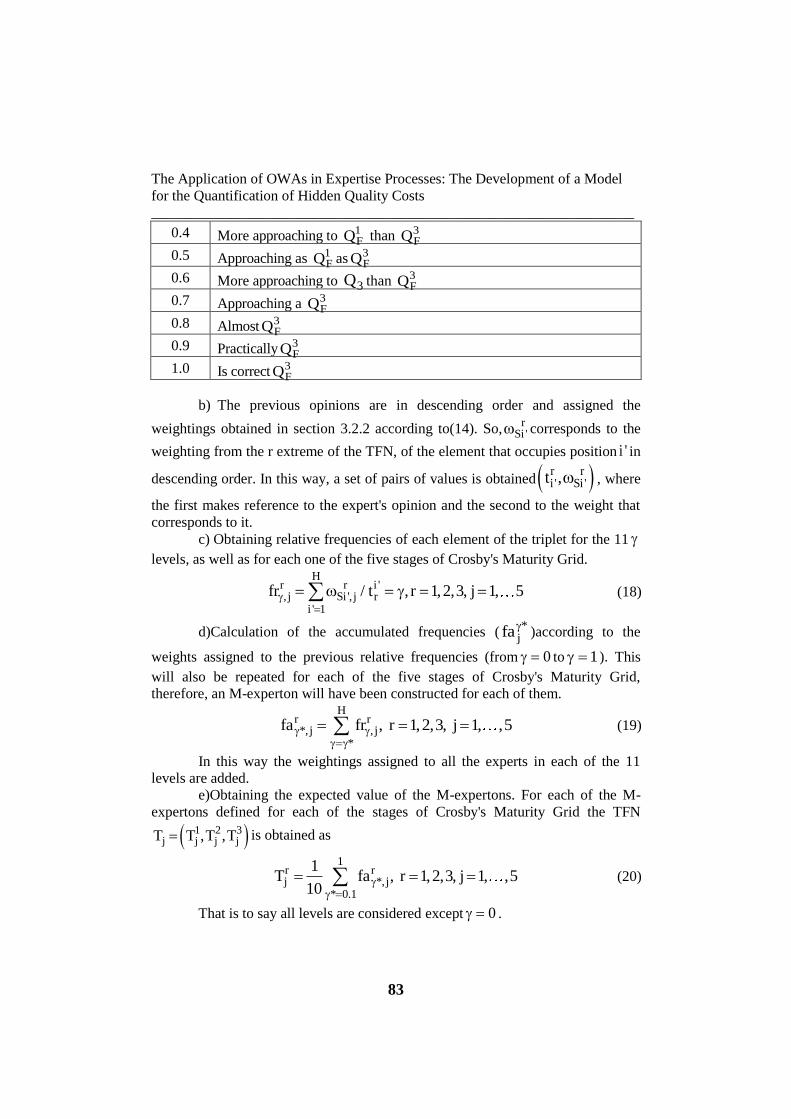
willvalue it with1 (Table 4).
Table4.Semantic correspondence of Contra-Expertise
Hidden quality cost (€)
0 Is correct 1FQ
0.1 Practically 1FQ
0.2 Almost 1FQ
0.3 Approaching 1FQ
The Application of OWAs in Expertise Processes: The Development of a Model
for the Quantification of Hidden Quality Costs
__________________________________________________________________
83
0.4 More approaching to 1FQ than 3
FQ
0.5 Approaching as 1FQ as 3
FQ
0.6 More approaching to 3Q than 3FQ
0.7 Approaching a 3FQ
0.8 Almost 3FQ
0.9 Practically 3FQ
1.0 Is correct 3FQ
b) The previous opinions are in descending order and assigned the
weightings obtained in section 3.2.2 according to(14). So,r
Si ' corresponds to the
weighting from the r extreme of the TFN, of the element that occupies position i ' in
descending order. In this way, a set of pairs of values is obtained r ri ' Si 't , , where
the first makes reference to the expert's opinion and the second to the weight that
corresponds to it.
c) Obtaining relative frequencies of each element of the triplet for the 11
levels, as well as for each one of the five stages of Crosby's Maturity Grid.
H
r r i ', j Si ', j r
i ' 1
fr / t , r 1,2,3, j 1, 5
(18)
d)Calculation of the accumulated frequencies (*
jfa )according to the
weights assigned to the previous relative frequencies (from 0 to 1 ). This
will also be repeated for each of the five stages of Crosby's Maturity Grid,
therefore, an M-experton will have been constructed for each of them.
H
r r*, j , j
*
fa fr , r 1,2,3, j 1, ,5
(19)
In this way the weightings assigned to all the experts in each of the 11
levels are added.
e)Obtaining the expected value of the M-expertons. For each of the M-
expertons defined for each of the stages of Crosby's Maturity Grid the TFN
1 2 3j j j jT T ,T ,T is obtained as
1
r rj *, j
* 0.1
1T fa , r 1,2,3, j 1, ,5
10
(20)
That is to say all levels are considered except 0 .
Manuel E. Sansalvador, José M. Brotons
_________________________________________________________________
84
f) The triplets obtained for each of the stages according to expression(20)
are multiplied by the degree of membership to these stages, expressions (9) to (13),
thereby obtaining the triplet 1 2 3L L ,L ,L , where
5
r rj T j
j 1
L I T , r 1,2,3
(21)
In this way, based on the five triplets (one per stage), a triplet summarizing
the information provided by the experts is achieved.
g) Calculation of the R-Experton hidden quality cost. Its value
1 2 3R R ,R ,R , is obtained as,
r 1 3 1 rR Q Q Q L , r 1,2,3 (22)
However, the result obtained does not take into consideration the
company's confidence in each of the experts that participated in the Contra-
Expertise.
3.4.2. Obtaining hidden quality cost according to the confidence
inspired by the experts
a)Assignation of probabilities *i ', i' 1, H to each of the experts
participating in the Contra-Expertise in order to weight their opinions according to
the level of confidence they deserve from the company and obtaining the
corresponding M-experton 1 2 3P P ,P ,P , being,
I
r r* *i ' i '
i ' 1
P t , r 1,2,3
(23)
b)Obtaining the R-experton corresponding to the confidence inspired by
the experts 1 2 3S S ,S ,S ,
r 1 3 1 rS Q Q Q P , r 1,2,3 (24)
3.4.3. Final valuation of hidden quality cost
Aggregation of the costs by taking into account the weighting factors
considered i is reflected in expression(25), where the company will define the
weight that it wants to give each of these factors through a coefficient * 0,1 .
In this way, it is possible to summarize the final value of the hidden quality cost
through the TFN 1 2 3IF IF IF IFQ Q ,Q ,Q ,
The Application of OWAs in Expertise Processes: The Development of a Model
for the Quantification of Hidden Quality Costs
__________________________________________________________________
85
r * r * rIFQ R 1 S (25)
Although the triplet obtained informs about the values that hidden quality
cost ranges between, if required, this TFN could be defuzzified through any of the
known methods obtaining the final result through a crisp value.
4. Case study
After developing the theoretical model, we decided to apply the proposed
methodology to a real case. For this purpose, we collaborated with an insurance
brokerage firm with an insurance portfolio for 2015 valued at 1.2 million euros,
which can be considered representative of the industry average in Spain. Hidden
quality cost par excellence, as much for its importance as well as the extreme
difficulty in measuring it, is the loss of income as a consequence of deterioration in
the image of the company (Freiesleben, 2004). In this sense, it was decided to
quantify the cost incurred from the harm to the company’s image caused by a
mistake.
To be exact, when filling in the insurance policy for SMEs, the insurance
brokerage firm omitted the existence of combustible materials used in the building
of an industrial unit. Afterwards a fire broke out and completely destroyed the unit,
which was then covered in the local news media. When the existence of these
materials was made evident to the insurance company, they refused payment of
compensation for loss. After several appeals against this decision, which prolonged
the whole process, the client was finally paid through the public liability policy
which legislation obliges all insurance brokers or insurance brokerage firms to
have. However, this incident had an important impact in the area, causing harm to
the insurance broker image.
Once the hidden quality cost to be quantified was determined, a first group
of experts was selected, entirely made up of associated insurance mediators and
adjusters. In accordance with Robbins (1994), the number of participants required
for the decision making problems ranges between 5 and 7. For this reason 6 experts
were selected for each of the expertize phases, providing them all with extensive
information about the study to be made, the characteristics of the company, the
business developed and the composition and importance of the client portfolio.
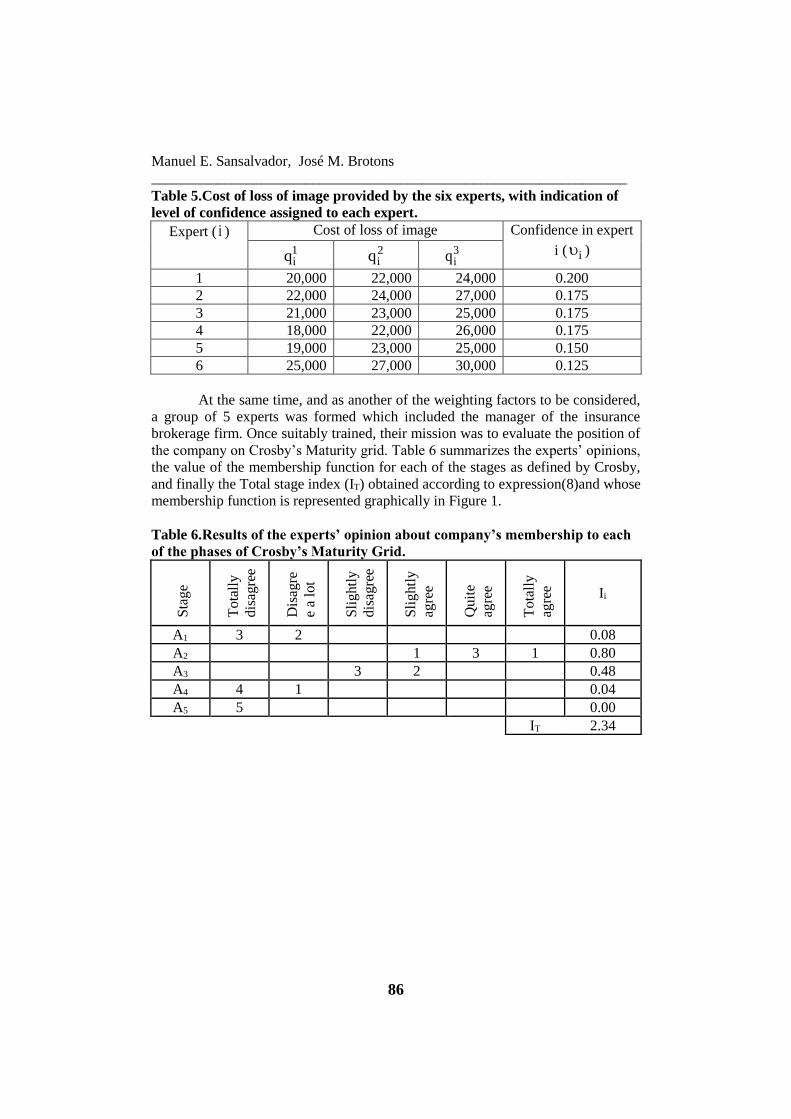
After analyzing the information, the first 6 experts made their first
calculations of the cost of loss of image, whose limits ranged between 18,000 and
30,000€. Table 5 shows the valuations carried out by the experts just as they were
facilitated through triplets of confidence, as well as the degree of confidence that
the company has in each of these experts(we should remember that it is one of the
two weighting factors to be considered).
Manuel E. Sansalvador, José M. Brotons
_________________________________________________________________
86
Table 5.Cost of loss of image provided by the six experts, with indication of
level of confidence assigned to each expert.
Expert ( i ) Cost of loss of image Confidence in expert
i ( i ) 1iq
2iq
3iq
1 20,000 22,000 24,000 0.200
2 22,000 24,000 27,000 0.175
3 21,000 23,000 25,000 0.175
4 18,000 22,000 26,000 0.175
5 19,000 23,000 25,000 0.150
6 25,000 27,000 30,000 0.125
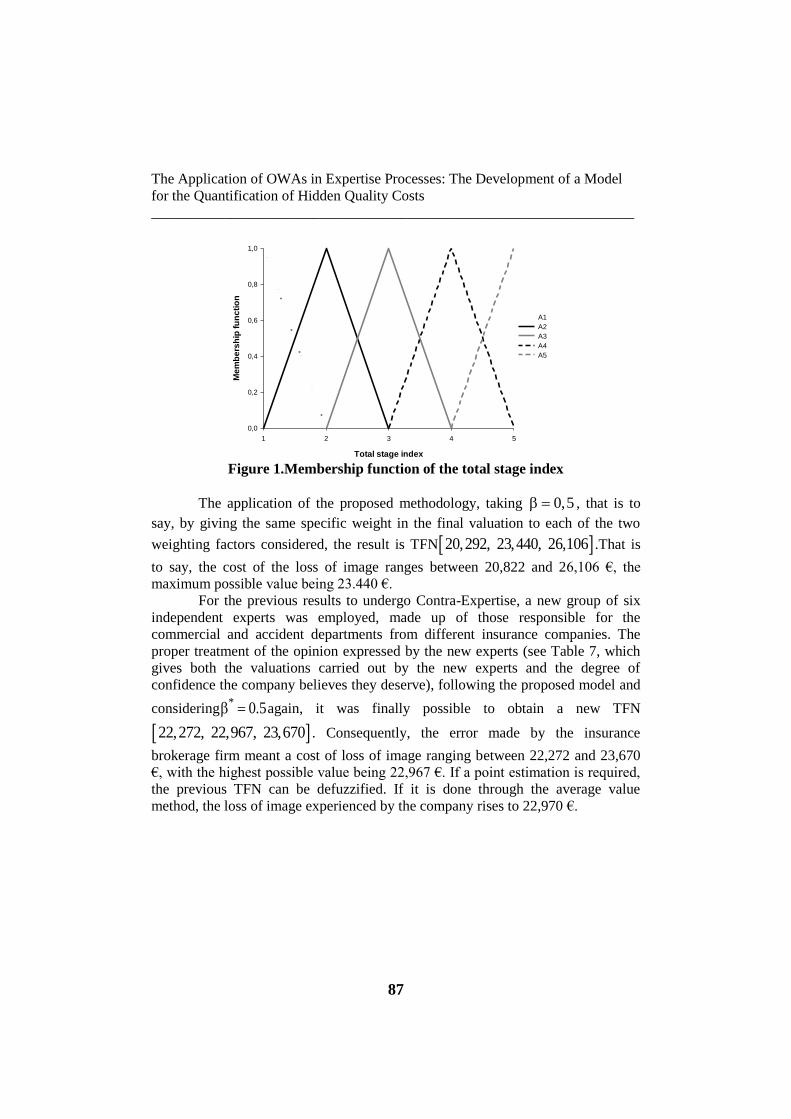
At the same time, and as another of the weighting factors to be considered,
a group of 5 experts was formed which included the manager of the insurance
brokerage firm. Once suitably trained, their mission was to evaluate the position of
the company on Crosby’s Maturity grid. Table 6 summarizes the experts’ opinions,
the value of the membership function for each of the stages as defined by Crosby,
and finally the Total stage index (IT) obtained according to expression(8)and whose
membership function is represented graphically in Figure 1.
Table 6.Results of the experts’ opinion about company’s membership to each
of the phases of Crosby’s Maturity Grid.
Sta
ge
Tota
lly
dis
agre
e
Dis
agre
e a
lot
Sli
ghtl
y
dis
agre
e
Sli
ghtl
y
agre
e
Quit
e
agre
e
Tota
lly
agre
e Ii
A1 3 2
0.08
A2
1 3 1 0.80
A3
3 2
0.48
A4 4 1
0.04
A5 5
0.00
IT 2.34
The Application of OWAs in Expertise Processes: The Development of a Model
for the Quantification of Hidden Quality Costs
__________________________________________________________________
87
Total stage index
1 2 3 4 5
Me
mb
ers
hip
fu
nc
tio
n
0,0
0,2
0,4
0,6
0,8
1,0
A1
A2
A3
A4
A5
Figure 1.Membership function of the total stage index
The application of the proposed methodology, taking 0,5 , that is to
say, by giving the same specific weight in the final valuation to each of the two
weighting factors considered, the result is TFN 20,292, 23,440, 26,106 .That is
to say, the cost of the loss of image ranges between 20,822 and 26,106 €, the
maximum possible value being 23.440 €.
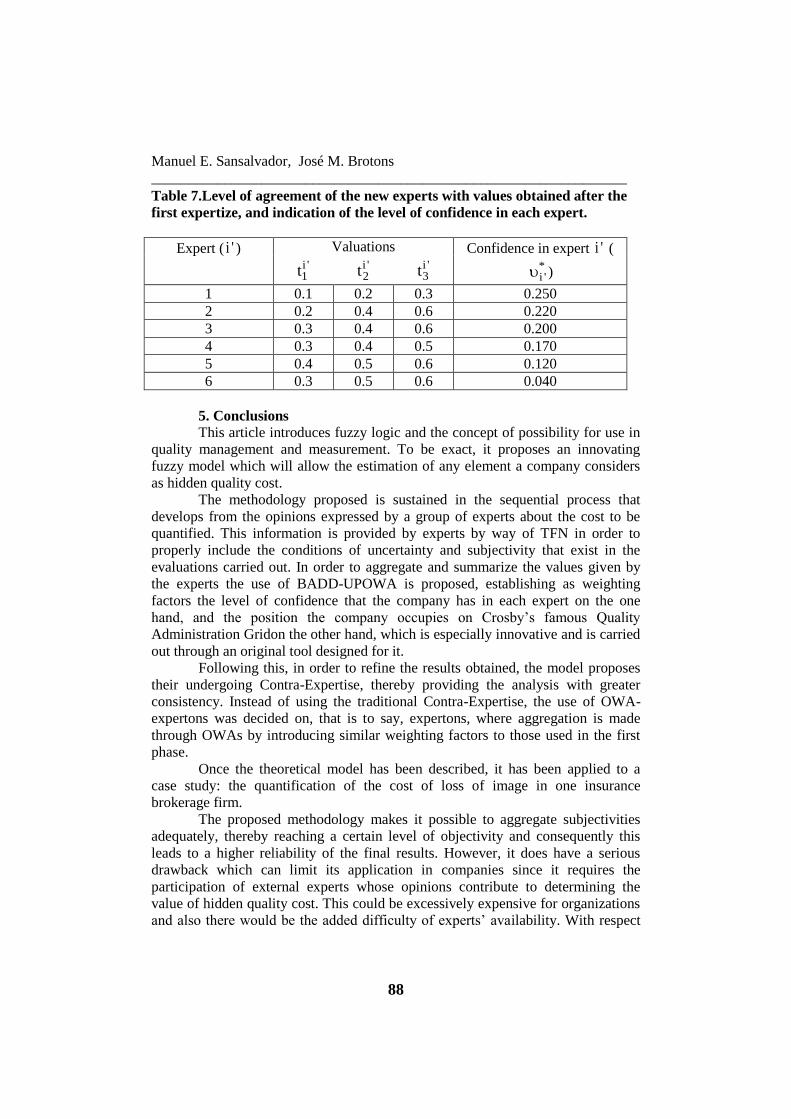
For the previous results to undergo Contra-Expertise, a new group of six
independent experts was employed, made up of those responsible for the
commercial and accident departments from different insurance companies. The
proper treatment of the opinion expressed by the new experts (see Table 7, which
gives both the valuations carried out by the new experts and the degree of
confidence the company believes they deserve), following the proposed model and
considering* 0.5 again, it was finally possible to obtain a new TFN
22,272, 22,967, 23,670 . Consequently, the error made by the insurance
brokerage firm meant a cost of loss of image ranging between 22,272 and 23,670
€, with the highest possible value being 22,967 €. If a point estimation is required,
the previous TFN can be defuzzified. If it is done through the average value
method, the loss of image experienced by the company rises to 22,970 €.
Manuel E. Sansalvador, José M. Brotons
_________________________________________________________________
88
Table 7.Level of agreement of the new experts with values obtained after the
first expertize, and indication of the level of confidence in each expert.
Expert ( i ' ) Valuations Confidence in expert i ' (*i ' )
i '1t
i '2t
i '3t
1 0.1 0.2 0.3 0.250
2 0.2 0.4 0.6 0.220
3 0.3 0.4 0.6 0.200
4 0.3 0.4 0.5 0.170
5 0.4 0.5 0.6 0.120
6 0.3 0.5 0.6 0.040
5. Conclusions
This article introduces fuzzy logic and the concept of possibility for use in
quality management and measurement. To be exact, it proposes an innovating
fuzzy model which will allow the estimation of any element a company considers
as hidden quality cost.
The methodology proposed is sustained in the sequential process that
develops from the opinions expressed by a group of experts about the cost to be
quantified. This information is provided by experts by way of TFN in order to
properly include the conditions of uncertainty and subjectivity that exist in the
evaluations carried out. In order to aggregate and summarize the values given by
the experts the use of BADD-UPOWA is proposed, establishing as weighting
factors the level of confidence that the company has in each expert on the one
hand, and the position the company occupies on Crosby’s famous Quality
Administration Gridon the other hand, which is especially innovative and is carried
out through an original tool designed for it.
Following this, in order to refine the results obtained, the model proposes
their undergoing Contra-Expertise, thereby providing the analysis with greater
consistency. Instead of using the traditional Contra-Expertise, the use of OWA-
expertons was decided on, that is to say, expertons, where aggregation is made
through OWAs by introducing similar weighting factors to those used in the first
phase.
Once the theoretical model has been described, it has been applied to a
case study: the quantification of the cost of loss of image in one insurance
brokerage firm.
The proposed methodology makes it possible to aggregate subjectivities
adequately, thereby reaching a certain level of objectivity and consequently this
leads to a higher reliability of the final results. However, it does have a serious
drawback which can limit its application in companies since it requires the
participation of external experts whose opinions contribute to determining the
value of hidden quality cost. This could be excessively expensive for organizations
and also there would be the added difficulty of experts’ availability. With respect
The Application of OWAs in Expertise Processes: The Development of a Model
for the Quantification of Hidden Quality Costs
__________________________________________________________________
89
to this, we suggest that a future line of research should be to seek practical
solutions which reduce costs and make it possible for a maximum number of
organizations to access the model developed.
REFERENCES
[1] Albright, T. and Roth, H. (1992),The measurement of Quality Costs: An
Alternative Paradigm. Accounting Horizons, 6 (2), 15 – 27;
[2] Brotons, J.M. and Terceño, A. (2010), A Risk Premium in The Spanish
Market: An Empirical Study; Economic Computation and Economic
Cybernetics Studies and Research, 1(44), 81-99;
[3] Campanella, J. (1999), Principles of Quality Costs: Principles,
Implementation and Use. Milwaukee: ASQ Quality Press;
[4] Casanovas, M, Torres, A. and Merigó, J. (2015), Decision Making
Processes of Non-life Insurance Pricing Using Fuzzy Logic and OWA
Operators. Economic Computation and Economic Cybernetics Studies and
Research, 49(2), 169 – 187;
[5] Chiadamrong, N. (2003), The Development of an Economic Quality Cost
Model. Total Quality Management & Business Excellence, 14(9), 999-1014;
[6] Crosby, P. (1979). Quality is free: The Art of Making Quality Certain. New
York: Penguin Books;
[7] Dong, Y., Xu, Y., Li, H. and Feng, B. (2010), The OWA-based Consensus
Operator under Linguistic Representation Models Using Position Indexes.
European Journal of Operational Research, 203 (2), 455–463;
[8] Freiesleben, J. (2004), On the Limited Value of Cost of Quality Models. Total Quality Management & Business Excellence, 15(7), 959–969;
[9] Juran, J. (1951), Quality Control Handbook. New York : McGraw-Hill;
[10] Kaufmann, A. (1987), Les Expertons. Paris: Ed. Hermès;
[11] Klir, B. and Yuan, B. (1995), Fuzzy Sets and Fuzzy Logic. London: Prentice
Hall;
[12] Kotler, P. (1991), Strategies for Marketing Service Excellence. The First
Global Conference, Management Centre Europe (London, March);
[13] Merigó, J.M. and Wei, G. (2011), Probabilistic Aggregation Operators and
their Application in Uncertain Multi-person Decision-making.
Technological and Economic Development of Economy, 17(2), 335-351;
[14] Robbins, S.P. (1994), Organizational Behavior (9th ed.). New Jersey:
Prentice-Hall;
[15] Robison, J. (1997), Integrate Quality Costs Concepts into Team´s Problem-
Solving Efforts. Quality Progress, March, 25 – 30;
Manuel E. Sansalvador, José M. Brotons
_________________________________________________________________
90
[16] Sadiq, R. and Tesfamariam, S. (2007), Probability Density Functions
Based Weights for Ordered Weighted Averaging (OWA) Operators: An
Example of Water Quality Indices. European Journal of Operational
Research, 182 (3), 1350–1368;
[17] Snieska, V., Daunoriene, A. and Zekeviciene, A. (2013), Hidden Costs in
the Evaluation of Quality Failure Costs. Inzinerine Ekonomika-Engineering
Economics, 24(3), 176-186;
[18] Terceño, A. and Vigier, H. (2011), Economic-financial Forecasting Model
of Businesses Using Fuzzy Relations. Economic Computation and Economic
Cybernetics Studies and Research, 45 (1/2011), 215-233;
[19] Yager R.R. (1993), Families of OWA Operators. Fuzzy Sets and Systems, 59
(2), 125-148;
[20] Yager, R.R. Filev, D.P. (1994), Essentials of Fuzzy Modeling and Control.
New York: John & Wiley Sons;
[21] Yager, R.R. (1988), On Ordered Weighted Averaging Aggregation
Operators in Multicriteria Decision-making. IEEE Transactions on Systems,
Man and Cybernetics, 18(1), 183-190;
[22] Zadeh, L.A. (2005), Towards a Generalized Theory of Uncertainty (GTU)—
an Outline. Information Science, 72, 1–40;
[23] Zarghami, M. and Szidarovszky, F. (2009), Revising the OWA Operator
for Multi Criteria Decision Making Problems under Uncertainty. European
Journal of Operational Research, 198 (1), 259–265;
[24] Zimmermann, H.J. (2000), An Application-oriented View of Modeling
Uncertainty. European Journal of Operational Research, 122, 190–198.