The Admission Benchmarking Study - Amazon S3 Admission Benchmarking Study A Study of the Cost to...
25
The Admission Benchmarking Study A Study of the Cost to Recruit a Traditional Student and the Admission Funnel at NACCAP Member Institutions Fall 2016 Edition Tim Fuller Senior Vice President/Owner NACCAP Enrollment Research Project Leader Thayle Heggie, Project Manager January 29, 2018
Transcript of The Admission Benchmarking Study - Amazon S3 Admission Benchmarking Study A Study of the Cost to...
The Admission Benchmarking Study
A Study of
the Cost to Recruit a Traditional Student
and the Admission Funnel
at NACCAP Member Institutions Fall 2016 Edition
Tim Fuller Senior Vice President/Owner
NACCAP Enrollment Research Project Leader Thayle Heggie, Project Manager
January 29, 2018
1
Introduction
This is the 24rd annual Admission Benchmarking Study (ABS). The purpose of the study is to help
institutions compare their budget resources, staffing, return on investment and admission funnel ratios
to similar institutions for the recruitment of traditional undergraduate students. For most NACCAP
members, tuition and related revenues provide at least 85% of their total revenue, underscoring the
importance of a regular and careful review of student recruitment resources, staffing and ratios.
The study follows NACCAP’s regional boundaries for these purposes and breaks participants into five
levels of enrollment. Participants are also divided into Christian liberal arts (defined as membership in
the CCCU), Bible college (defined as accredited by ABHE) and an “other” category (includes Christian
liberal arts institutions who are not members of the CCCU). Perhaps the most helpful grouping of all is
the ability each participating institution has to create its own comparison set using the “watch list”
feature, allowing for a mix of regions and other key variables.
The study does not include analysis of enrollment by adult learners in degree completion programs at
either the undergraduate or graduate level, nor does it include data on traditional graduate programs
and/or seminaries. NACCAP’s leadership continues to explore the issues of the cost to recruit and other
recruitment benchmarks for the adult and graduate programs on member campuses.
Coordination of data collection and analysis continues under the leadership of Tim Fuller, Credo Senior
Vice President/Owner and former Senior Research Fellow for the Council for Christian Colleges and
Universities (CCCU). Thayle Heggie has served faithfully for several years as Project Manager for this
important research.
Methodology
There are more than 200 NACCAP members with undergraduate programs for traditional students. The
chief enrollment officer at each of these institutions was invited to participate in the study via email.
Multiple reminders from the project team, as well as NACCAP’s headquarters, helped increase the
participation rate. 86 member institutions chose to share their complete data, and those members will
have access to the member-by-member results; summary results such as those outlined in this report
are available to all NACCAP members and, through the postings on www.naccapresearch.org, to other
interested parties. Participants sharing their data and receiving access to full study findings agree not to
share the member-by-member results with non-participating members and other higher education
entities, including non-member institutions, associations and consulting firms.
2
Participants completed four separate worksheets that outlined data elements as follows:
• Budget resources
• Enrollment data (new students and total)
• Staffing and salary information
• Admission funnel numbers
The data from each participant was reviewed by the project team, compared against key ratios and
other data checks to ensure accuracy, reviewed against other participants’ data and then finalized for
inclusion in overall, regional and enrollment size breakdowns. In some cases, potential errors were
caught by website functionality; in others through project team review.
Several other NACCAP members completed portions of the study – their partial data is not included in
the analysis that follows.
Participants
As mentioned above, 86 NACCAP members participated in the Fall 2016 study. Participation by region
and enrollment size is outlined in the chart that follows:
NACCAP Admission Benchmarking Study
2016 Participant Breakdown
Institution
NACCAP Region Enrollment * Type
Canada 8 Smallest (<450) 15 CCCU 54
Great Lakes 16 Small (451 - 799) 21 ABHE 17
Midwest 13 Medium (800 - 1,199) 15 Other 15
Northeast 10 Large (1,200 - 1,799) 18
Northwest 9 Largest (> 1,799) 17
Southeast 20
Southwest 10 * defined as full-time enrollment
in traditional undergraduate programs
3
Study Limitations
Much of the data in this study is self-reported. It has been analyzed carefully – in some cases, numerous
emails and phone calls to clarify data questions took place. The most common areas under discussion
were:
• Professional and support staff FTEs
• Funds split between multiple budgets, especially marketing dollars on campuses where
marketing is a centralized function
The website worksheets on which data was entered and analyzed include validity tests that flagged
some of the above issues; others came up as the project team reviewed the data in comparison to other
participants and/or due to experience with particular institutions. Other data points such as budget
amounts for advertising, publications and travel do not lend themselves to ratio analysis or other means
of verification so the project team has, for the most part, taken them at face value. In a few cases the
project team has investigated further, always working towards the kind of uniform comparison that
makes this study most helpful.
An issue that causes some challenges in reporting and gathering data is the increasing number of
institutions with centralized marketing functions. In this model, much of the decision making about
marketing activity and all or nearly all the funding for publications, advertising, direct mail and the
website is gathered together, making it difficult to isolate funds devoted solely to the recruitment of
traditional undergraduate students.
The results of the study are reviewed in the pages that follow. Even though some questions may still
exist about the veracity of certain data points, the overall value of the study is sound, providing good
comparisons in key budget, staffing and funnel categories that are critical to enrollment managers and
the institutions they serve. Please contact the project team with any question regarding data.
Cost to Recruit a Student
A major focus of this study is determining both institution-specific costs to recruit one new student as
well as averages across the whole participant group, regions and levels of enrollment. The cost of
recruiting a student includes typical budget items like travel, publications, direct mail, electronic media
and other forms of advertising, campus visits, phone, postage and office supplies. Professional and
support staff salaries, student wages and fringe benefits are also included, the latter through an
estimated “tax” applied uniformly across all participants to account for institutional differences. A
survey of a sampling of chief financial officers with whom Credo works suggested that 30% was a
reasonable estimate for a benefits “tax” (including the value of tuition benefits for employees and their
dependents). Other factors such as the square footage the admission office occupies or “taxes” for
shared services such as custodial, maintenance or IT were not included in this study.
4
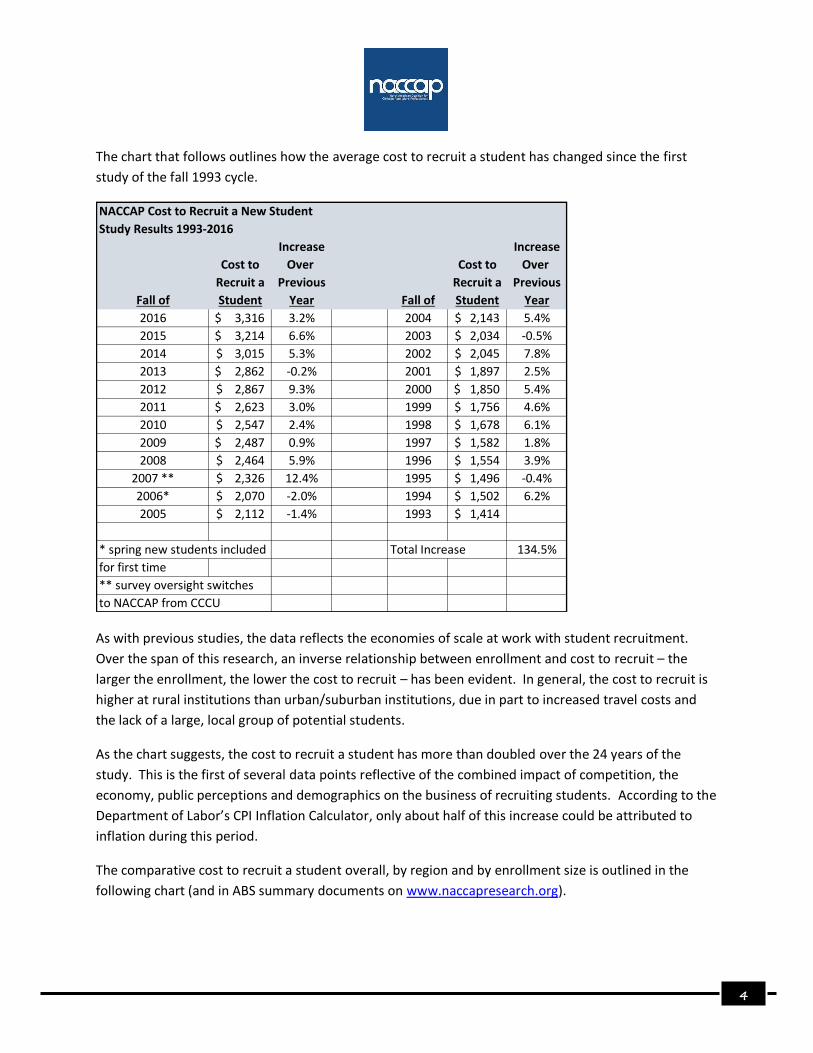
The chart that follows outlines how the average cost to recruit a student has changed since the first
study of the fall 1993 cycle.
NACCAP Cost to Recruit a New Student
Study Results 1993-2016
Increase Increase
Cost to Over Cost to Over
Recruit a Previous Recruit a Previous
Fall of Student Year Fall of Student Year
2016 3,316$ 3.2% 2004 2,143$ 5.4%
2015 3,214$ 6.6% 2003 2,034$ -0.5%
2014 3,015$ 5.3% 2002 2,045$ 7.8%
2013 2,862$ -0.2% 2001 1,897$ 2.5%
2012 2,867$ 9.3% 2000 1,850$ 5.4%
2011 2,623$ 3.0% 1999 1,756$ 4.6%
2010 2,547$ 2.4% 1998 1,678$ 6.1%
2009 2,487$ 0.9% 1997 1,582$ 1.8%
2008 2,464$ 5.9% 1996 1,554$ 3.9%
2007 ** 2,326$ 12.4% 1995 1,496$ -0.4%
2006* 2,070$ -2.0% 1994 1,502$ 6.2%
2005 2,112$ -1.4% 1993 1,414$
* spring new students included Total Increase 134.5%
for first time
** survey oversight switches
to NACCAP from CCCU
As with previous studies, the data reflects the economies of scale at work with student recruitment.
Over the span of this research, an inverse relationship between enrollment and cost to recruit – the
larger the enrollment, the lower the cost to recruit – has been evident. In general, the cost to recruit is
higher at rural institutions than urban/suburban institutions, due in part to increased travel costs and
the lack of a large, local group of potential students.
As the chart suggests, the cost to recruit a student has more than doubled over the 24 years of the
study. This is the first of several data points reflective of the combined impact of competition, the
economy, public perceptions and demographics on the business of recruiting students. According to the
Department of Labor’s CPI Inflation Calculator, only about half of this increase could be attributed to
inflation during this period.
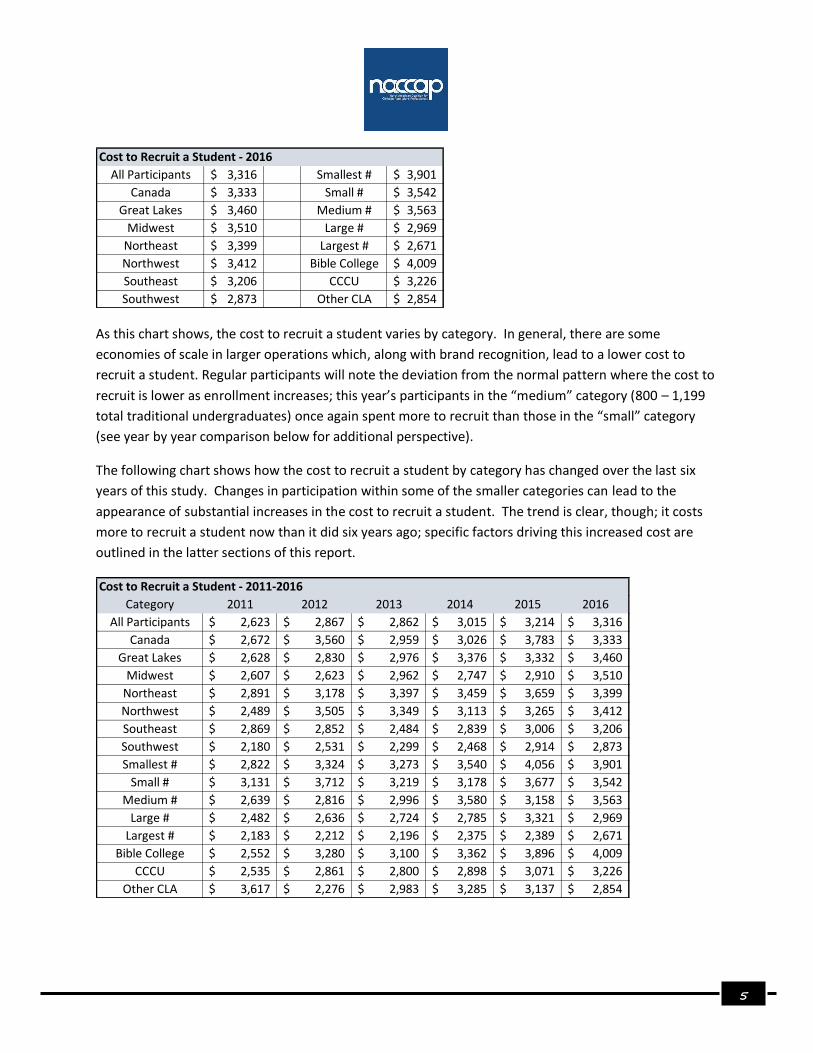
The comparative cost to recruit a student overall, by region and by enrollment size is outlined in the
following chart (and in ABS summary documents on www.naccapresearch.org).
5
Cost to Recruit a Student - 2016
All Participants 3,316$ Smallest # 3,901$
Canada 3,333$ Small # 3,542$
Great Lakes 3,460$ Medium # 3,563$
Midwest 3,510$ Large # 2,969$
Northeast 3,399$ Largest # 2,671$
Northwest 3,412$ Bible College 4,009$
Southeast 3,206$ CCCU 3,226$
Southwest 2,873$ Other CLA 2,854$
As this chart shows, the cost to recruit a student varies by category. In general, there are some
economies of scale in larger operations which, along with brand recognition, lead to a lower cost to
recruit a student. Regular participants will note the deviation from the normal pattern where the cost to
recruit is lower as enrollment increases; this year’s participants in the “medium” category (800 – 1,199
total traditional undergraduates) once again spent more to recruit than those in the “small” category
(see year by year comparison below for additional perspective).
The following chart shows how the cost to recruit a student by category has changed over the last six
years of this study. Changes in participation within some of the smaller categories can lead to the
appearance of substantial increases in the cost to recruit a student. The trend is clear, though; it costs
more to recruit a student now than it did six years ago; specific factors driving this increased cost are
outlined in the latter sections of this report.
Cost to Recruit a Student - 2011-2016
Category 2011 2012 2013 2014 2015 2016
All Participants 2,623$ 2,867$ 2,862$ 3,015$ 3,214$ 3,316$
Canada 2,672$ 3,560$ 2,959$ 3,026$ 3,783$ 3,333$
Great Lakes 2,628$ 2,830$ 2,976$ 3,376$ 3,332$ 3,460$
Midwest 2,607$ 2,623$ 2,962$ 2,747$ 2,910$ 3,510$
Northeast 2,891$ 3,178$ 3,397$ 3,459$ 3,659$ 3,399$
Northwest 2,489$ 3,505$ 3,349$ 3,113$ 3,265$ 3,412$
Southeast 2,869$ 2,852$ 2,484$ 2,839$ 3,006$ 3,206$
Southwest 2,180$ 2,531$ 2,299$ 2,468$ 2,914$ 2,873$
Smallest # 2,822$ 3,324$ 3,273$ 3,540$ 4,056$ 3,901$
Small # 3,131$ 3,712$ 3,219$ 3,178$ 3,677$ 3,542$
Medium # 2,639$ 2,816$ 2,996$ 3,580$ 3,158$ 3,563$
Large # 2,482$ 2,636$ 2,724$ 2,785$ 3,321$ 2,969$
Largest # 2,183$ 2,212$ 2,196$ 2,375$ 2,389$ 2,671$
Bible College 2,552$ 3,280$ 3,100$ 3,362$ 3,896$ 4,009$
CCCU 2,535$ 2,861$ 2,800$ 2,898$ 3,071$ 3,226$
Other CLA 3,617$ 2,276$ 2,983$ 3,285$ 3,137$ 2,854$

6
Staffing/Recruiting: Size of Staff and Relevant Ratios
NACCAP institutions participating in this study spend, on average, 56.1% of their budget resources on
personnel including salaries, fringe benefits and student wages. One of the most frequently discussed
topics within this study is how the staff resources an institution has committed to the
recruitment/admission function compare to relevant benchmarks. The study gathers staffing
information in three categories:
• Professional staff
• Recruiting staff (a subset of professional staff defined as those who have a recruitment territory)
• Support staff
Each category is reported in an FTE format to capture the portion of an employee’s time devoted to the
undergraduate admission/recruitment function or to recruitment in the case of the recruitment FTE.
At first glance, the data suggests campuses are cutting back on admission staff in a few categories. At a
time where the pressure to meet or exceed new student enrollment targets continues to rise (for fall
2017, almost 76% of 148 NACCAP members reporting their fall funnel data missed their new student
enrollment goal), it is highly unlikely staff sizes are decreasing. The explanation for the drop in some
categories is due to differences in institutional participation rates.
Here is an overview of staffing FTEs by category for the last five years of the study:
Staff Size - Professional Staff FTE Staff Size - Recruiting FTE
2012 2013 2014 2015 2016 2012 2013 2014 2015 2016
Overall 9.0 9.0 9.0 9.6 8.8 Overall 6.5 6.3 6.3 6.5 6.0
Canada 6.9 7.0 6.7 5.5 7.5 Canada 5.2 4.8 4.9 3.8 5.8
Great Lakes 9.3 10.2 10.1 10.7 9.9 Great Lakes 6.5 7.0 6.8 7.0 6.6
Midwest 10.5 10.0 9.5 10.2 9.2 Midwest 7.9 7.4 7.0 7.6 6.8
Northeast 8.8 7.9 7.8 8.8 8.0 Northeast 6.9 5.8 6.1 6.4 5.5
Northwest 7.0 8.1 8.8 8.2 7.9 Northwest 5.0 5.9 6.3 5.5 5.2
Southeast 8.9 8.3 8.2 9.1 7.1 Southeast 6.0 5.6 5.4 6.1 4.6
Southwest 8.6 9.1 10.0 11.4 12.7 Southwest 5.8 6.1 6.7 7.6 8.6
Smallest 4.9 4.6 4.3 4.2 4.2 Smallest 3.4 3.1 2.9 2.8 2.8
Small 6.7 6.5 6.5 6.6 6.3 Small 4.8 4.5 4.5 4.7 4.1
Medium 8.5 8.6 8.5 9.0 8.9 Medium 6.0 6.0 5.6 5.9 6.0
Large 9.1 9.5 9.4 9.7 9.0 Large 7.0 6.9 6.7 6.8 6.0
Largest 13.2 13.8 14.4 14.8 15.7 Largest 9.1 9.5 9.8 10.0 11.3
ABHE 5.4 5.3 4.9 5.0 4.7 ABHE 3.8 3.7 3.5 3.5 2.9
CCCU 9.8 9.8 10.1 10.7 10.4 CCCU 7.0 6.9 7.1 7.3 7.3
Other 9.3 8.2 8.4 9.2 7.8 Other 6.4 5.5 4.9 6.0 5.0
7
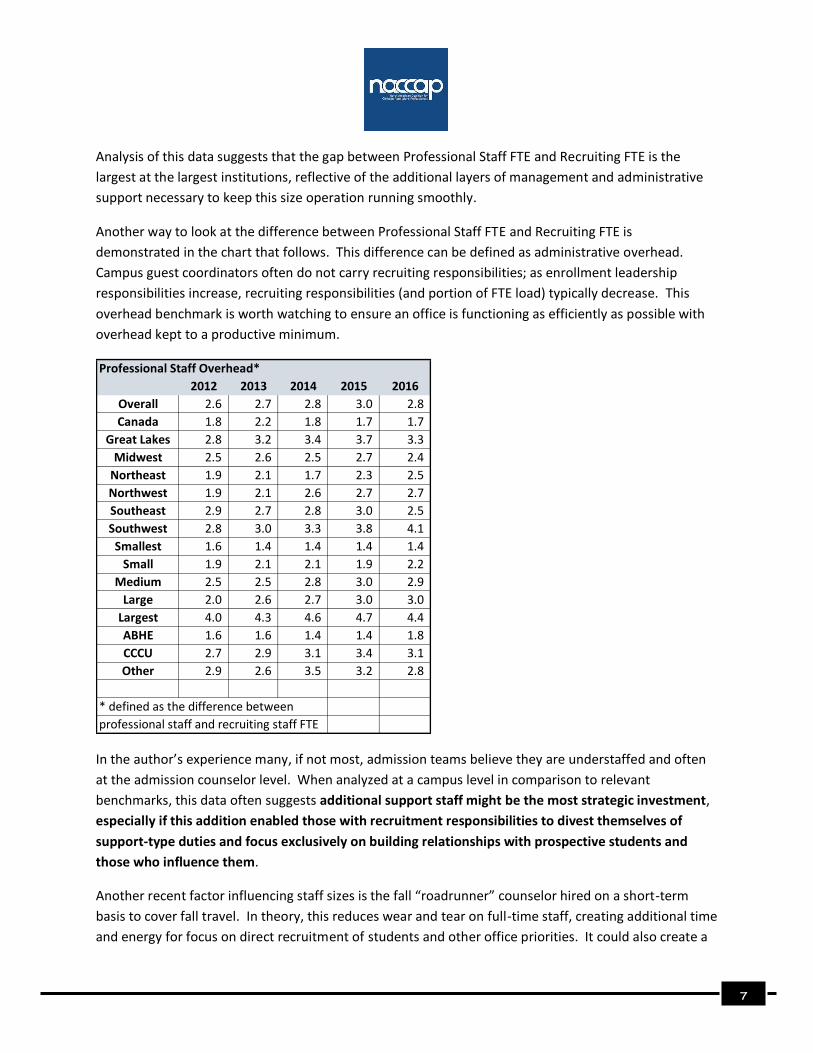
Analysis of this data suggests that the gap between Professional Staff FTE and Recruiting FTE is the
largest at the largest institutions, reflective of the additional layers of management and administrative
support necessary to keep this size operation running smoothly.
Another way to look at the difference between Professional Staff FTE and Recruiting FTE is
demonstrated in the chart that follows. This difference can be defined as administrative overhead.
Campus guest coordinators often do not carry recruiting responsibilities; as enrollment leadership
responsibilities increase, recruiting responsibilities (and portion of FTE load) typically decrease. This
overhead benchmark is worth watching to ensure an office is functioning as efficiently as possible with
overhead kept to a productive minimum.
Professional Staff Overhead*
2012 2013 2014 2015 2016
Overall 2.6 2.7 2.8 3.0 2.8
Canada 1.8 2.2 1.8 1.7 1.7
Great Lakes 2.8 3.2 3.4 3.7 3.3
Midwest 2.5 2.6 2.5 2.7 2.4
Northeast 1.9 2.1 1.7 2.3 2.5
Northwest 1.9 2.1 2.6 2.7 2.7
Southeast 2.9 2.7 2.8 3.0 2.5
Southwest 2.8 3.0 3.3 3.8 4.1
Smallest 1.6 1.4 1.4 1.4 1.4
Small 1.9 2.1 2.1 1.9 2.2
Medium 2.5 2.5 2.8 3.0 2.9
Large 2.0 2.6 2.7 3.0 3.0
Largest 4.0 4.3 4.6 4.7 4.4
ABHE 1.6 1.6 1.4 1.4 1.8
CCCU 2.7 2.9 3.1 3.4 3.1
Other 2.9 2.6 3.5 3.2 2.8
* defined as the difference between
professional staff and recruiting staff FTE
In the author’s experience many, if not most, admission teams believe they are understaffed and often
at the admission counselor level. When analyzed at a campus level in comparison to relevant
benchmarks, this data often suggests additional support staff might be the most strategic investment,
especially if this addition enabled those with recruitment responsibilities to divest themselves of
support-type duties and focus exclusively on building relationships with prospective students and
those who influence them.
Another recent factor influencing staff sizes is the fall “roadrunner” counselor hired on a short-term
basis to cover fall travel. In theory, this reduces wear and tear on full-time staff, creating additional time
and energy for focus on direct recruitment of students and other office priorities. It could also create a

8
ready pool of trained counselor candidates should an opening arrive. For some enrollment leaders,
minimizing time on the road for full-time team members is an attempt to encourage longer tenures.
Time will tell if these goals are achieved and if these gains offset the potential loss of regional
connections for a well-trained counselor serving a territory over a period of several years.
Staff Size - Support Staff FTE
2012 2013 2014 2015 2016
Overall 3.3 3.1 3.2 3.3 2.9
Canada 1.8 1.4 1.6 0.8 1.0
Great Lakes 3.6 4.1 4.0 4.1 4.2
Midwest 3.3 3.0 3.2 3.3 2.8
Northeast 3.9 2.8 3.0 2.6 2.5
Northwest 2.4 2.8 2.6 2.1 1.7
Southeast 3.0 2.5 2.6 3.1 2.7
Southwest 3.2 3.6 3.6 5.0 4.4
Smallest 1.9 0.7 0.8 1.1 1.2
Small 1.8 1.6 1.8 1.6 1.5
Medium 2.6 2.5 2.7 2.5 2.5
Large 3.7 3.3 3.0 3.5 3.3
Largest 5.2 6.0 6.1 6.2 6.0
ABHE 1.9 1.1 1.3 1.2 1.3
CCCU 3.7 3.6 3.7 4.0 3.7
Other 2.3 1.6 1.7 2.1 1.6
One of the most frequently asked questions about this study relates to the number of new students that
a professional staff member does/should generate. Presidents and board members often ask this
question, looking to either evaluate the performance of their current team or calculate the potential
return on investment in an additional admission counselor. As a reminder, the Recruiting FTE in this
study represents the proportion of the Professional Staff FTE who actually recruit students directly (as in
manage a recruitment territory or population) as opposed to supporting these efforts through
administrative oversight (most vice presidents/deans) and other tasks (data and systems, admission
marketing, campus visit, tele-counseling or communication flow coordination, etc.).
The summary numbers that follow create a comparison point to answer these questions, or at least
begin to answer them. Enrollment managers and others should exercise caution in the application of
these numbers, recognizing that there are many other factors at work in determining the effectiveness
of an enrollment team or admission counselor. Consider the difference, for example, in the work of an
admission counselor responsible for recruiting students solely within a 25-mile radius of a suburban or
urban campus with that of a counselor on a rural campus responsible for a four-state area in the Great
Plains. Consider recruiting for a campus that has a long history and strong reputation against the far
different challenge recruiting for a struggling campus. Both examples underscore the note of caution
expressed above.
9
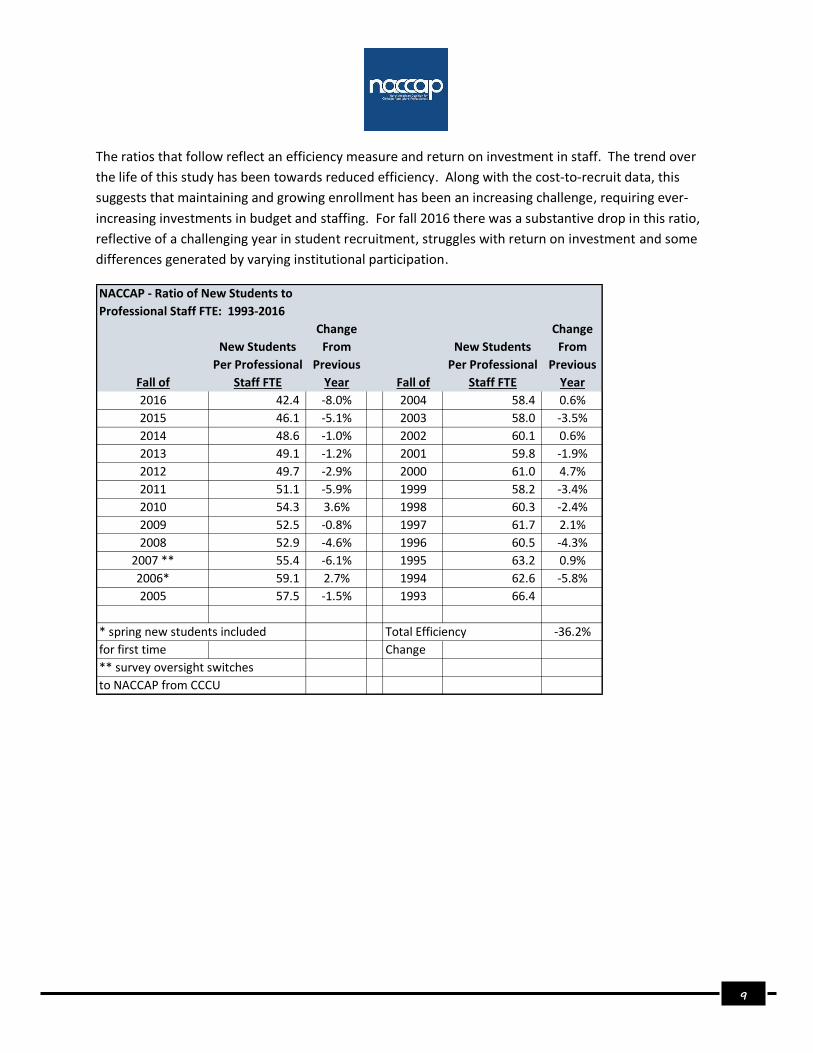
The ratios that follow reflect an efficiency measure and return on investment in staff. The trend over
the life of this study has been towards reduced efficiency. Along with the cost-to-recruit data, this
suggests that maintaining and growing enrollment has been an increasing challenge, requiring ever-
increasing investments in budget and staffing. For fall 2016 there was a substantive drop in this ratio,
reflective of a challenging year in student recruitment, struggles with return on investment and some
differences generated by varying institutional participation.
NACCAP - Ratio of New Students to
Professional Staff FTE: 1993-2016
Change Change
New Students From New Students From
Per Professional Previous Per Professional Previous
Fall of Staff FTE Year Fall of Staff FTE Year
2016 42.4 -8.0% 2004 58.4 0.6%
2015 46.1 -5.1% 2003 58.0 -3.5%
2014 48.6 -1.0% 2002 60.1 0.6%
2013 49.1 -1.2% 2001 59.8 -1.9%
2012 49.7 -2.9% 2000 61.0 4.7%
2011 51.1 -5.9% 1999 58.2 -3.4%
2010 54.3 3.6% 1998 60.3 -2.4%
2009 52.5 -0.8% 1997 61.7 2.1%
2008 52.9 -4.6% 1996 60.5 -4.3%
2007 ** 55.4 -6.1% 1995 63.2 0.9%
2006* 59.1 2.7% 1994 62.6 -5.8%
2005 57.5 -1.5% 1993 66.4
* spring new students included Total Efficiency -36.2%
for first time Change
** survey oversight switches
to NACCAP from CCCU

10
As mentioned above, the study breaks out professional staff with specific recruiting responsibilities.
Since year-to-year comparisons offer limited value initially, the following chart reflects the differences
by region and enrollment for the last five years of the study. This data is another of several indicators in
this study about how much more challenging it is to recruit traditional new students each year.
NACCAP - Ratio of New Students to
Professional Staff Recruiting FTE
2012 2013 2014 2015 2016
Overall 70.3 71.1 72.0 68.2 65.6
Canada 43.8 54.6 48.6 47.2 46.0
Great Lakes 71.8 72.1 68.7 68.8 66.1
Midwest 65.7 58.1 69.0 67.8 57.7
Northeast 53.9 56.0 54.6 50.0 57.3
Northwest 54.6 69.1 80.4 65.1 65.1
Southeast 80.6 79.8 78.2 74.0 70.5
Southwest 91.5 102.3 96.0 87.1 72.1
Smallest 46.5 42.9 45.8 40.1 50.5
Small 55.0 56.1 60.0 50.8 55.0
Medium 64.2 62.4 60.5 59.4 54.4
Large 73.1 78.1 77.5 69.3 80.6
Largest 95.7 106.1 101.0 101.0 85.9
ABHE 57.6 57.6 55.4 40.8 54.7
CCCU 73.0 75.2 75.8 75.5 68.1
Other 70.5 59.0 77.0 61.7 68.7
As with the cost to recruit data, there is a correlation between enrollment and this Recruiting FTE.
Typically, the larger the school, the larger the number of new students generated per counselor,
although this year, due in large measure to a few institutions in the Smallest and Small category, the
typical pattern did not repeat completely. This correlation probably reveals more about institutional
momentum and marketing strength than it does about individual admission counselor effectiveness or
productivity.
In addition to the notes of caution mentioned above, it is important to understand what this last ratio
does not, or at least may not mean for staffing decisions. It does not mean, for example, that a Great
Lakes region campus looking to grow by 66 new students should expect the mere addition of a full-time
admission counselor focused exclusively on recruiting will accomplish this goal. On some campuses the
best way to focus more energy and effort on recruiting new students may be to hire another support
staff person who can relieve counselors of routine tasks that are keeping them from building
relationships with prospective students. On other campuses, admission counselors may be highly
efficient and focused already with reasonably-sized territories where further sub-division may not add
to efficiencies and generate a positive return on investment; rather, the institution may need to make
additional investments in marketing to build overall awareness or develop a better mix of programs.
11
New Student Patterns by Term and Enrollment Type
Most new students enroll at participating institutions in the fall semester; on average, 92.1 % of the
31,693 new students who enrolled in the 2016 recruitment cycle enrolled in the fall. While spring
semester enrollment is generally neither typical or preferred, campuses that organize themselves to
leverage spring enrollment, including support services and new student orientation, may see solid
returns on investment. On most NACCAP campuses, fall-to-spring attrition and December graduates
outnumber new spring semester students, creating a net loss in enrollment. Housing is often available
as is space in classes, creating further rationale for some spring semester recruitment initiatives.
Of the new students who enrolled at participating institutions in fall 2016, 26.4% were transfers, a
noticeable increase from 2015’s 21.8%. In recent years, many private colleges and universities have
become much more intentional with transfer recruitment strategies, so it is encouraging to see this
improved performance and a greater return on an investment in transfers.
Participating NACCAP schools reflect the gender ratio present in North American higher education today
with women representing 55.5% of total student enrollment in traditional programs. Participants whose
enrollment reflect a more balanced gender split usually achieve this based on program offerings, the
presence of a football team or a more selective admission picture that allows for shaping of the new
student class.
What do these ratios mean for individual campuses? Comparing individual campus ratios to overall,
regional and/or enrollment-based ratios may reveal a potential source of untapped students. On the
other hand, and for example, a low transfer ratio may reflect institutional strategy out of a position of
enrollment strength, indicating a strong preference for enrolling new students for four years, not two or
three.

12
Spending by Category
In the 2015-16 budget year, the participating institutions spent over $102 million on salaries, fringe
benefits, student wages and other student recruitment expenses, an average of approximately $1.19
million per institution. If you consider only 86 of the 200 plus eligible NACCAP institutions participated
in the study and extrapolate these results, the projected economic impact of student recruitment efforts
among NACCAP member institutions exceeds $238 million (and this figure only covers the recruitment
of students in traditional programs)!
The largest proportion of budget resources was allocated to labor costs – salaries, fringe benefits and
student wages. On average, participating institutions spent 56.1% of their budget dollars on labor costs,
an increase from the 2015 figure of 54.4%.
The category “Percentage vs. Total Non-Salary Budget Dollars” gives a clear picture of institutional
strategy and priority. For example, one college or university with limited resources may choose to
commit funds to personnel to make recruitment as personal as possible; another may spend more on a
dynamic website and extensive direct mail, generating good impressions and a wider audience.
Please see the summary documents for specific category spending and percentage averages.
Compensation
The study captures salary information for new admission counselors and other professional positions in
the admission office. New counselor salary information is shared on a school-by-school basis for
participating institutions; other salary information is reported in summary form only since it represents
the individual salary information for a specific person. “Length of service” and “Time in current
position” data is also gathered to provide some additional context for salary figures. No attempt is
made to capture variances in fringe benefits, either from institution to institution or between positions.
The following chart shows average compensation patterns for the last four years of the study. The most
helpful comparisons are within regions or enrollment categories since they account for differences in
cost of living or institutional resources. Additional information including salary means by region and
enrollment size is available on the summary documents from this study. Information about how length
of service and other factors impact salary is available upon request.

13
Admission Professional
Salary Survey
2013-2017 2013-14 2014-15 2015-16 2016-17
Salary Change Salary Change Salary Change Salary
Admission Counselor 30,582$ 2.66% 31,397$ 1.62% 31,905$ 0.10% 31,938$
Senior Admission Counselor 34,546$ 5.76% 36,536$ 2.23% 37,351$ -0.03% 37,338$
Assistant Director 39,682$ 1.57% 40,306$ 1.28% 40,821$ 1.35% 41,371$
Associate Director 44,514$ -0.37% 44,349$ 6.43% 47,201$ 2.18% 48,228$
Director of Admission 57,507$ 1.88% 58,588$ 4.38% 61,157$ 0.18% 61,269$
VP/Dean of Enrollment 91,780$ 3.41% 94,908$ 6.30% 100,885$ -6.84% 93,983$
The changes in participation in the study probably explain most of the average salary increases over the
last few years. These salary figures do not reflect additional compensation losses that may have
occurred around fringe benefits. In recent years, many private colleges and universities have rolled back
retirement account matching, increased health insurance participation fees/deductibles and taken other
steps to curb personnel costs. Given the critical dependence on tuition revenues and the corresponding
importance of maintaining an experienced, talented admission team, these compensation patterns
cause concern for enrollment leaders and those to whom they report. Institutions looking to break the
cycle of constant turnover in the all-too-critical admission counselor role should create clear avenues for
promotion, professional development and salary increases designed to attract and keep good people in
these vital positions.
The salary data from this study provide a foundational context on which to build a staff retention plan
with promotions and compensation improvements. Customized salary case studies can be created upon
request. For example, an enrollment leader from a campus in the Midwest reached out several years
ago, eager to determine a competitive salary for a newly approved associate director position. Careful
research by project staff enabled him to create the right salary for this new position as well as a
reasoned, data-informed plan to present to his cabinet colleagues for enrollment office compensation
throughout his team.
The biggest year-over-year gains were realized at the three highest levels. Enrollment leadership skills
and a successful track record are becoming an increasingly rare combination; these salary trends reflect
one strategy to attracting and keeping strong enrollment leaders.
The existence of a senior admission counselor position reflects the value that many institutions place on
experienced counselors remaining on the recruitment team for more than the typical tenure. 52.3% of
the participating institutions report the presence of a senior counselor position, an increase from last
year’s 46.7%; for those who do, the average difference between a starting counselor and a senior
counselor salary is just over $4,400. Four institutions place tremendously high value on the senior
counselor position with salary bumps exceeding $10,000/year over a starting counselor salary (and one
of these has a bump exceeding $20,000)!
14
Nine NACCAP members provide vehicles for at least one member of the admission team. Only five of
the 86 participating institutions give admission counselors a car as a part of their compensation package.
Two directors and six vice presidents receive a car or car allowance as part of their compensation
package. For purposes of this study, $5,000 was added to the salary figure to account for the provision
of a vehicle.
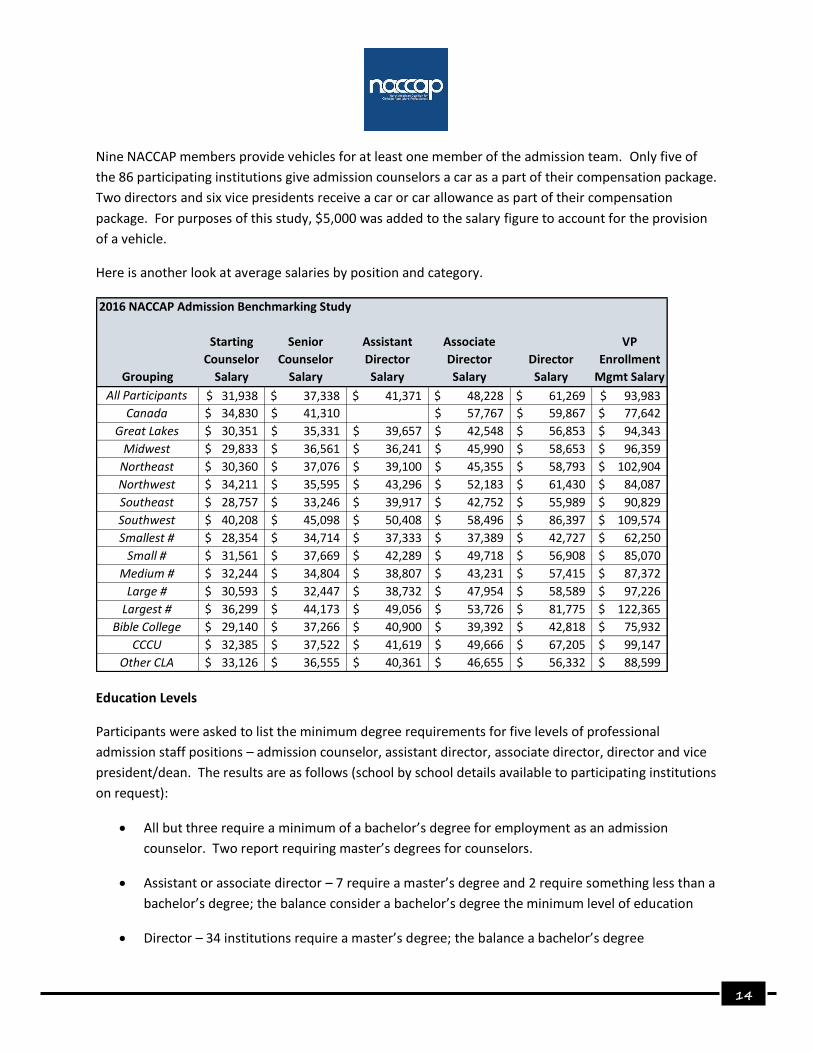
Here is another look at average salaries by position and category.
2016 NACCAP Admission Benchmarking Study
Grouping
Starting
Counselor
Salary
Senior
Counselor
Salary
Assistant
Director
Salary
Associate
Director
Salary
Director
Salary
VP
Enrollment
Mgmt Salary
All Participants 31,938$ 37,338$ 41,371$ 48,228$ 61,269$ 93,983$
Canada 34,830$ 41,310$ 57,767$ 59,867$ 77,642$
Great Lakes 30,351$ 35,331$ 39,657$ 42,548$ 56,853$ 94,343$
Midwest 29,833$ 36,561$ 36,241$ 45,990$ 58,653$ 96,359$
Northeast 30,360$ 37,076$ 39,100$ 45,355$ 58,793$ 102,904$
Northwest 34,211$ 35,595$ 43,296$ 52,183$ 61,430$ 84,087$
Southeast 28,757$ 33,246$ 39,917$ 42,752$ 55,989$ 90,829$
Southwest 40,208$ 45,098$ 50,408$ 58,496$ 86,397$ 109,574$
Smallest # 28,354$ 34,714$ 37,333$ 37,389$ 42,727$ 62,250$
Small # 31,561$ 37,669$ 42,289$ 49,718$ 56,908$ 85,070$
Medium # 32,244$ 34,804$ 38,807$ 43,231$ 57,415$ 87,372$
Large # 30,593$ 32,447$ 38,732$ 47,954$ 58,589$ 97,226$
Largest # 36,299$ 44,173$ 49,056$ 53,726$ 81,775$ 122,365$
Bible College 29,140$ 37,266$ 40,900$ 39,392$ 42,818$ 75,932$
CCCU 32,385$ 37,522$ 41,619$ 49,666$ 67,205$ 99,147$
Other CLA 33,126$ 36,555$ 40,361$ 46,655$ 56,332$ 88,599$
Education Levels
Participants were asked to list the minimum degree requirements for five levels of professional
admission staff positions – admission counselor, assistant director, associate director, director and vice
president/dean. The results are as follows (school by school details available to participating institutions
on request):
• All but three require a minimum of a bachelor’s degree for employment as an admission
counselor. Two report requiring master’s degrees for counselors.
• Assistant or associate director – 7 require a master’s degree and 2 require something less than a
bachelor’s degree; the balance consider a bachelor’s degree the minimum level of education
• Director – 34 institutions require a master’s degree; the balance a bachelor’s degree

15
• VP/Dean – 15 institutions consider a bachelor’s degree the minimum qualification, 3 require a
doctorate, and 68 require a master’s degree.
This question about qualifications was answered in most cases by the person occupying the chief
enrollment officer position, typically the vice president or dean. The question of minimum qualifications
for a chief enrollment officer might have been answered differently by a president. A vice president
with a master’s degree might conclude that he/she has minimal credentials, for example, even though
the president might choose to require a doctorate the next time the position is open. A vice president
with an earned doctorate might conclude that his/her successor would be required to have the same
degree when, in fact, the president might see this differently.
The Admission Funnel
The study measures five key recruitment data points and the yield rates they produce. The institutional
view of the recruitment process, whereby a large number of potential students produces a relatively
small number of matriculating new students, is commonly referred to as the admission funnel. Unlike
the funnels used in kitchens and garages, though, everything put into the top of this funnel does not
come out the bottom! The funnel concept illustrates the narrowing process from inquiry through
application to eventual enrollment – some colleges and universities carry this concept further, extending
the funnel to persistence to the sophomore year, to graduation and even to the point of becoming a
productive member of the alumni association.
Increasing numbers of stealth applicants have changed some funnel dynamics as more and more
students bypass the inquiry stage. This change has forced colleges to rework communication plans to fill
gaps for stealth applicants.
Definitions are critical in developing meaningful comparisons – for purposes of this study, the five key
recruitment data points were defined as follows for the study’s exclusive focus on new students in
traditional, undergraduate programs:
1. Inquiries – potential first-year college students who expressed interest in the institution. For
example, this number was not to include those who were targeted with direct mail efforts but
never responded.
2. Applicants – potential first-year college students who applied for admission.
3. Completed applicants – potential first-year college students who submitted an application for
admission as well as all other required documents (SAT/ACT scores, high school transcript,
recommendation(s), etc.) so that an admission decision could be made on their behalf.
16
4. Admitted applicants – potential first-year college students who were admitted to the institution,
regardless of their eventual college choice.
5. Enrolled students – as the label implies, those potential first-year college students who decided
to enroll at the institution.
Six different yield rates emerge from these five key funnel points and are presented on the summary
documents.
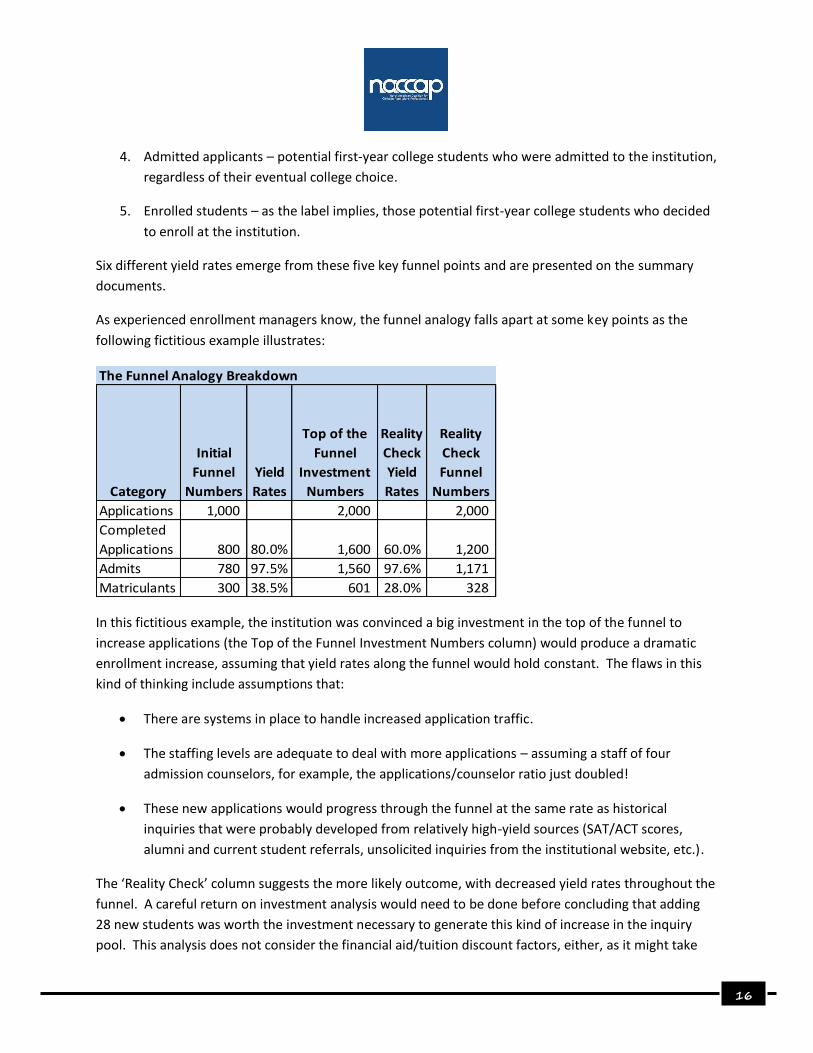
As experienced enrollment managers know, the funnel analogy falls apart at some key points as the
following fictitious example illustrates:
The Funnel Analogy Breakdown
Category
Initial
Funnel
Numbers
Yield
Rates
Top of the
Funnel
Investment
Numbers
Reality
Check
Yield
Rates
Reality
Check
Funnel
Numbers
Applications 1,000 2,000 2,000
Completed
Applications 800 80.0% 1,600 60.0% 1,200
Admits 780 97.5% 1,560 97.6% 1,171
Matriculants 300 38.5% 601 28.0% 328
In this fictitious example, the institution was convinced a big investment in the top of the funnel to
increase applications (the Top of the Funnel Investment Numbers column) would produce a dramatic
enrollment increase, assuming that yield rates along the funnel would hold constant. The flaws in this
kind of thinking include assumptions that:
• There are systems in place to handle increased application traffic.
• The staffing levels are adequate to deal with more applications – assuming a staff of four
admission counselors, for example, the applications/counselor ratio just doubled!
• These new applications would progress through the funnel at the same rate as historical
inquiries that were probably developed from relatively high-yield sources (SAT/ACT scores,
alumni and current student referrals, unsolicited inquiries from the institutional website, etc.).
The ‘Reality Check’ column suggests the more likely outcome, with decreased yield rates throughout the
funnel. A careful return on investment analysis would need to be done before concluding that adding
28 new students was worth the investment necessary to generate this kind of increase in the inquiry
pool. This analysis does not consider the financial aid/tuition discount factors, either, as it might take
17
more financial aid resources to attract these potential students who lack a strong connection to the
institution.
This example is a reminder of several important admission funnel principles:
• More applications (or inquiries) are not always a good thing if they are the wrong “more” in
terms of mission fit.
• The point is not to get more applications; the point is to enroll more students, and more
applications may distract you from the more important goal.
This study focuses exclusively on the admission portion of the funnel and on potential first-year college
students only. Transfers are not part of the funnel discussion herein.
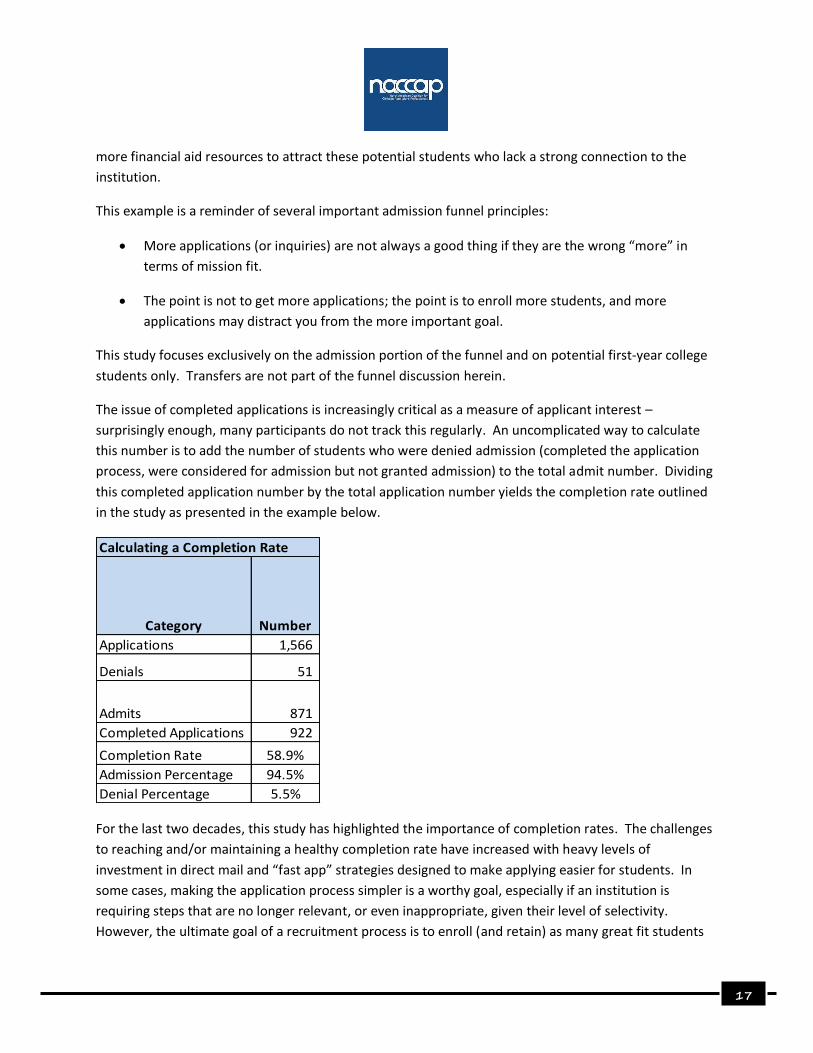
The issue of completed applications is increasingly critical as a measure of applicant interest –
surprisingly enough, many participants do not track this regularly. An uncomplicated way to calculate
this number is to add the number of students who were denied admission (completed the application
process, were considered for admission but not granted admission) to the total admit number. Dividing
this completed application number by the total application number yields the completion rate outlined
in the study as presented in the example below.
Calculating a Completion Rate
Category Number
Applications 1,566
Denials 51
Admits 871
Completed Applications 922
Completion Rate 58.9%
Admission Percentage 94.5%
Denial Percentage 5.5%
For the last two decades, this study has highlighted the importance of completion rates. The challenges
to reaching and/or maintaining a healthy completion rate have increased with heavy levels of
investment in direct mail and “fast app” strategies designed to make applying easier for students. In
some cases, making the application process simpler is a worthy goal, especially if an institution is
requiring steps that are no longer relevant, or even inappropriate, given their level of selectivity.
However, the ultimate goal of a recruitment process is to enroll (and retain) as many great fit students
18
as possible and increasing application totals may not always be a means to this end. For some
institutions, increasing the completion rate may be a more productive strategy than increasing
application totals.
A low completion rate may be a sign of one or more of the following factors:
• An application which takes minimal effort to complete – this can lead to misleading application
totals
• Application requirements which are too rigorous – a good admission office exercise is comparing
your application requirements to your top five competitors on a regular basis. Requiring three
recommendations at a time when your competitors are not requiring any should inspire
reflection on the reasons for each recommendation and its actual utility in making admission
decisions.
• The need for additional focus on completion rates by territory managers – set a completion rate
goal for your team based on your recent performance and/or relevant NACCAP benchmarking
data, then hold them accountable to achieve this goal.
The example above also highlights one of the most misunderstood concepts in admission, perpetuated
by U.S. News & World Report and other college publications reporting “acceptance rates” which make
campuses appear much more selective than they are. In most of these publications, the reported
acceptance rate compares admitted applicants to total applicants, not completed applicants. While it is
technically true that an incomplete application represents behavior befitting an “applicant,” the reality
is they were not denied admission if they never fulfilled the requirements necessary to have such a
decision rendered.
Why does this matter? Misreporting acceptance rates does not give a true picture of selectivity and
even the academic climate on the campus, perhaps discouraging some potential students and giving a
false impression to others.
The Funnel Study Summary documents from the 2016 Admission Benchmarking Study highlight both
average numbers and yield rates along the funnel for the overall study as well as by the regional and
total enrollment breakdowns that are typically more helpful – here are a few highlights from this
summary:
• On average, 17.3% of all inquiries apply for admission – these rates varied widely by region and
enrollment size and increased from last year’s 15.25%. The variations in this rate are reflective
of changes in participation (smaller institutions tend to have higher inquiry to application rates)
and the continued emphasis on high-volume top of the funnel strategies. The increase for this
year may suggest several factors:

19
o Continued de-emphasis of mass “top of the funnel” strategies and a switch to more
focused efforts
o The stealth applicant factor
o More consistent application of predictive modeling to recruiting strategies.
• Over the last five years of this study, the overall completion rate dropped from 72% to 68.6%. In
other words, the average college or university with 1,000 applicants could count on 314 of these
students dropping out of the application process prior to an admission decision. As mentioned
earlier in this study, enrollment leaders should focus their teams on improving completion rates
by studying their causes and developing appropriate action plans.
• 91.1% of all completed applicants were granted admission – therefore, there is little room to
grow the new student population at the typical participating institution by dropping admission
standards.
• On average, 39.2% % of all admitted students enrolled for fall 2016, a sizeable increase from last
year’s 36.7% and a reversal of a pattern of decline in this key metric from the 44% figure for fall
2010.
The chart that follows highlights average yield rates down the funnel for the overall, regional and
enrollment categories of this study.

20
Average Yield Rates - 2016 Study
Grouping
Inquiry to
Application
App to
Completed
App
Completed
App to
Admitted
Admitted to
Enrolled
Inquired to
Enrolled
All Participants 17.3% 68.6% 91.1% 39.2% 4.1%
Canada 20.8% 77.3% 92.1% 60.6% 8.9%
Great Lakes 15.3% 74.7% 93.8% 32.9% 3.7%
Midwest 24.7% 64.6% 89.1% 33.8% 4.2%
Northeast 11.8% 70.3% 92.9% 44.5% 3.5%
Northwest 16.9% 68.9% 91.8% 31.8% 3.8%
Southeast 15.1% 61.9% 89.5% 41.3% 3.0%
Southwest 18.4% 67.6% 89.0% 35.9% 3.6%
Smallest * 18.5% 61.3% 97.2% 59.3% 6.7%
Small* 17.4% 68.0% 89.2% 45.2% 4.3%
Medium* 13.3% 69.9% 91.7% 32.6% 3.1%
Large* 20.3% 68.3% 90.8% 28.1% 3.5%
Largest* 16.9% 74.7% 87.7% 31.5% 3.1%
Bible College 16.3% 60.4% 96.8% 56.8% 5.9%
CCCU 15.0% 71.4% 89.4% 32.8% 3.1%
Other CLA 26.8% 67.6% 90.4% 42.1% 5.6%
* Enrollment categories for total, full-time undergraduates in traditional programs
Smallest: 0 to 450
Small: 451 to 799
Medium: 800 to 1,199
Large: 1,200 to 1,799
Largest: 1,800 or more
21
Using this Study
Beyond the gathering of historical trends and comparison points, this study is most valuable to
individual institutions attempting to determine how key ratios, spending levels and the cost to recruit
compare to peer institutions. Strategies employed by past participants to effectively utilize this study
include:
• Tracking year-to-year patterns and setting targets – are you making progress key strategic
metrics?
• Using the budget categories and funnel definitions in this study as a means of altering standard
operating procedures to align with participants for comparison purposes
• Reviewing budget percentages and the priorities they reflect against key peer
institutions/competitors and developing strategies accordingly
o To reallocate resources
o To leverage additional budget resources/staffing
When utilizing study data for these purposes, remember to find the right comparison group and
carefully consider institutional differences. There are lots of successful models for budgeting and
staffing; the model which works for someone else may not work for you given your unique setting and
mission.
Consider involving several team members in the review of your institutional data, making use of the
tools on the research site for displaying your data against some key benchmark groups or individual
campuses. As you look at your data, try and imagine how the data might appear to your president or
CFO; how would you address their questions about it?
Your study of the data should result in some areas for further investigation and even some short and
long-term goals to increase or restructure staff resources, improve your ratios and develop more
efficient processes and systems (doing more with less). Consider how you will share your analysis of the
data and your resulting goals with your team and your leadership colleagues.
The data from the study raises several important questions, though. First of all, in a time where
institutional resources are scarce and it is costing more to recruit, are there alternatives to ongoing
increases to recruitment and marketing budgets? The cost to recruit a student more than doubled in 24
years; can the Christian college industry absorb this pattern going forward?

22
At tuition-driven institutions, increased net revenue comes from one or more of several sources:
• Enrollment growth (traditional, online, non-traditional and graduate)
• More efficient use of existing resources in recruiting, financial aid and marketing
• Improved retention
Increases in annual fund and endowment, changes in program mix (deleting unproductive curricular and
co-curricular programs, adding new tuition generating programs), cooperative ventures with other
institutions (group purchasing, partnerships, mergers/acquisitions) and the development of alternative
revenue streams (summer conference revenue, athletics/academics camps, etc.) are other potential
sources of net revenue as well. Since this study focuses on the enrollment of traditional new students,
the next few paragraphs address some possible answers to the questions raised in the preceding
paragraph.
Rather than simply accepting this rising cost to recruit a student, here are some recommendations to
consider with a goal of more efficient/effective recruitment operations and strategies:
• Technology and streamlining processes and systems – the author continues to be surprised by
highly manual operations in relatively sophisticated admission offices; as funnel volume grows
through aggressive top of the funnel strategies and because of a buyer’s market, manual
processes are often not scalable without significant investments in additional staff. Does your
ERP (and/or CRM) facilitate efficient gathering, storing, retrieving, analysis and application of
data?
• Organizational capabilities – to borrow language from the author Jim Collins, do you have the
right people in the right seats on the bus? Do you have enough of the right people? Finding the
right people to carry out key recruitment tasks is critical to efficient, effective operations. How
is your team configured to gather data, develop strategies, provide welcoming experiences for
campus guests, lead at several levels, build critical campus partnerships and recruit students?
• Analytics and metrics – how carefully are you studying the return on investments you are
making in marketing and recruiting? For example, the answer to enrollment declines is not
solely increasing the volume of leads without a careful analysis of their likelihood to enroll at
your institution and/or the necessary resources to effectively communicate with and nurture
them. Aggressive, top-of-the-funnel strategies can backfire. In some cases, it may be better to
focus on more modest approaches to building the enrollment funnel. In other cases, the high-
volume approach needs to be accompanied by a focus on the systems, processes and staffing
(levels and deployment) necessary to maximize their impact. In all cases, it is essential to count
the added cost versus the needed additional enrollment numbers; in other words, the return on
investment.
23
Another target for analytics and metrics is other peer and aspirational campuses. What can you
learn from studying their metrics like funnel ratios and cost to recruit a student? Close attention
to the data might reveal some peers who are both successful and efficient, creating
opportunities for conversation with them.
The data in this study focuses exclusively on admission and recruitment factors such as budget,
staffing and funnel ratios; and on some promotional/marketing factors. In the language of the
classic “4 P’s of Marketing,” issues related to Product, Place and Price (and People) are also critical in
achieving strategic enrollment health.
For example:
• Does the college offer the right programs in the right delivery modality with appropriate levels
of student engagement in the learning process? Are you relevant to your target audience?
• Are faculty functioning both as great classroom professors and personal mentors for students
exploring their sense of calling in light of their gifts and talents?
• Does the physical environment, the factors of Place, help drive enrollment decisions?
• How is Price factored into the enrollment equation through financial aid and other strategies?
• Are you organized for marketing success and to prioritize enrollment marketing in particular?
What messages are you using to drive traffic to your website and move students down the
funnel?
• Are you alone in this effort or are others in key functions helping you? Wise enrollment leaders
are experts at mobilizing key campus partners to help achieve enrollment goals.
As a reminder, participants agree not to share the school-by-school results of this study with other
members, organizations, etc. The summarized results are considered public information and, as such,
will be posted on www.naccapresearch.org, utilized as the basis for presentations at the annual NACCAP
conference and used in other forms and venues.
About the Author
Tim Fuller serves as Project Leader for NACCAP Enrollment Research and this annual study. He joined
Credo in 2007 after a 27-year enrollment career at Houghton College (NY). During his tenure in
enrollment leadership at Houghton he served as both Vice President and then President of NACCAP
(1985-1988) and also served on the CCCU’s Commission of Chief Enrollment Officers for 14 years (1990–
2004). In 1993 he began conducting a cost to recruit study for the CCCU, building on similar work done
for several years prior for the Christian College Consortium. In Tim’s current role as Senior Vice
President at Credo, he leads the firm’s work with Christian colleges and universities in the areas of
enrollment, strategic planning, research and comprehensive projects.
24
Thayle Heggie serves as Project Manager for NACCAP Enrollment Research. She is a graduate of Guilford
College and joined Credo after a 13-year career in the admission office of her alma mater specializing in
transfer recruitment and campus guest experiences.
Several members of Credo’s Enrollment Solutions team (Amy Tomko, Dave Burke and Roger Kieffer)
contributed to the concluding section of this study, offering insights on the application of this data based
on their campus and enrollment consulting experience.
For more information about this study, please contact Tim or Thayle via:
Phone – (336) 585-1044
Email – [email protected] or [email protected]
For more information about Credo please visit www.credohighered.com


![Privilege Benchmarking Study - 2016 [Infographic]](https://static.fdocuments.us/doc/165x107/587269421a28ab31498b550d/privilege-benchmarking-study-2016-infographic.jpg)