![(] CHIEF EXECUTIVE OFFICE County of Los Angeles - Homeless …homeless.lacounty.gov/wp-content/uploads/2017/12/11.09... · 2017. 12. 11. · homeless families and individuals who](https://static.fdocuments.us/doc/165x107/5ff05c2c416b211e47203095/-chief-executive-office-county-of-los-angeles-homeless-2017-12-11-homeless.jpg)
The 2017 Annual Homeless Assessment Report … 2017 Annual Homeless Assessment Report (AHAR) to...
100
The 2017 Annual Homeless Assessment Report (AHAR) to Congress DECEMBER 2017 PART 1: Point-in-Time Estimates of Homelessness e U.S. Department of Housing and Urban Development OFFICE OF COMMUNITY PLANNING AND DEVELOPMENT
Transcript of The 2017 Annual Homeless Assessment Report … 2017 Annual Homeless Assessment Report (AHAR) to...

The 2017 Annual Homeless Assessment Report (AHAR) to CongressDECEMBER 2017
PART 1:Point-in-Time Estimates of Homelessness
The U.S. Department of Housing and Urban DevelopmentOFFICE OF COMMUNITY PLANNING AND DEVELOPMENT
DRAFTAcknowledgements
AUTHORS: Meghan Henry, Rian Watt, Lily Rosenthal, and Azim Shivji, Abt Associates
PRINCIPAL INVESTIGATORS: Dr. Jill Khadduri, Abt Associates, and Dr. Dennis Culhane, National Center on Homelessness among Veterans, University of Pennsylvania
DATA COLLECTION MANAGERS:Azim Shivji and Rian Watt, Abt Associates
DATA COLLECTORS AND REVIEWERS:Korrin Bishop, Molly Brune, Tanya de Sousa, Marissa Hashizume, Tyler Morrill, Arturo Nava, Jillian Ouellette, Lily Rosenthal, Azim Shivji, Aubrey Sitler, Djaniele Taylor, and Rian Watt, Abt Associates, and Dan Treglia and Kalen Flynn, University of Pennsylvania
PROGRAMMERS/ANALYSTS:Azim Shivji and Tyler Morrill, Abt Associates, and Jon-Paul Oliva, GIS and Data Quality Consultant
REVIEWERS: Dr. Larry Buron, Abt Associates Dr. Alvaro Cortes, Abt Associates Karen DeBlasio and William Snow, U.S. Department of Housing and Urban Development
DESIGN AND PRODUCTION:Malcolm Jones, Abt Associates
DRAFT
ContentsKey Findings . . . . . . . . . . . . . . . . . . . . . . . . . . . . . . . . . . . .1
Definition of Terms . . . . . . . . . . . . . . . . . . . . . . . . . . . . . .2
Progress on the Preventing and Ending Homelessness . . . . . . . . . . . . . . . . . . . . . . . . . . . .4
About this Report . . . . . . . . . . . . . . . . . . . . . . . . . . . . . . .6
SECTION 1
Homelessness in the United States . . . . . . . . . . . . . . . . .7National Estimates . . . . . . . . . . . . . . . . . . . . . . . . . . . . . . . . . . . . . . . . 8State Estimates . . . . . . . . . . . . . . . . . . . . . . . . . . . . . . . . . . . . . . . . . . 12Estimates by CoC . . . . . . . . . . . . . . . . . . . . . . . . . . . . . . . . . . . . . . . . 16
SECTION 2
Homeless Individuals . . . . . . . . . . . . . . . . . . . . . . . . . . . .20National Estimates . . . . . . . . . . . . . . . . . . . . . . . . . . . . . . . . . . . . . . . 20State Estimates . . . . . . . . . . . . . . . . . . . . . . . . . . . . . . . . . . . . . . . . . . 24Estimates by CoC . . . . . . . . . . . . . . . . . . . . . . . . . . . . . . . . . . . . . . . . 28
SECTION 3
Homeless Families with Children . . . . . . . . . . . . . . . . . .32National Estimates . . . . . . . . . . . . . . . . . . . . . . . . . . . . . . . . . . . . . . . 32State Estimates . . . . . . . . . . . . . . . . . . . . . . . . . . . . . . . . . . . . . . . . . . 36Estimates by CoC . . . . . . . . . . . . . . . . . . . . . . . . . . . . . . . . . . . . . . . . 40
SECTION 4
Unaccompanied Homeless Youth . . . . . . . . . . . . . . . . .44National Estimates . . . . . . . . . . . . . . . . . . . . . . . . . . . . . . . . . . . . . . . 44State Estimates . . . . . . . . . . . . . . . . . . . . . . . . . . . . . . . . . . . . . . . . . . 46Estimates by CoC . . . . . . . . . . . . . . . . . . . . . . . . . . . . . . . . . . . . . . . . 48
SECTION 5
Homeless Veterans . . . . . . . . . . . . . . . . . . . . . . . . . . . . .52National Estimates . . . . . . . . . . . . . . . . . . . . . . . . . . . . . . . . . . . . . . . 52State Estimates . . . . . . . . . . . . . . . . . . . . . . . . . . . . . . . . . . . . . . . . . . 54Estimates by CoC . . . . . . . . . . . . . . . . . . . . . . . . . . . . . . . . . . . . . . . . 58
SECTION 6
Chronically Homeless Individuals . . . . . . . . . . . . . . . . . .62National Estimates . . . . . . . . . . . . . . . . . . . . . . . . . . . . . . . . . . . . . . . 62State Estimates . . . . . . . . . . . . . . . . . . . . . . . . . . . . . . . . . . . . . . . . . . 64Estimates by CoC . . . . . . . . . . . . . . . . . . . . . . . . . . . . . . . . . . . . . . . . 68
SECTION 7
National Inventory of Beds . . . . . . . . . . . . . . . . . . . . . . .72
Appendix . . . . . . . . . . . . . . . . . . . . . . . . . . . . . . . . . . . . .78


1
Key Findings
On a single night in 2017, 553,742 people were experiencing homelessness in the United States. For every 10,000 people in the country, 17 were experiencing homelessness. Approximately two-thirds (65%) were staying in emergency shelters or transitional housing programs, and about one-third (35%) were in unsheltered locations.
Homelessness increased for the first time in seven years. The number of people experiencing homelessness increased by a little less than one percent between 2016 and 2017. This increase reflected a nine percent increase in the number of people experiencing homelessness in unsheltered locations, which was partially offset by a three percent decline in the number of people experiencing homelessness in sheltered locations.
Recent increases in homelessness were driven mostly by specific changes happening within cities. Increases in the numbers of unsheltered individuals in the 50 largest cities accounted for nearly all of the national increase.
The number of people experiencing homelessness in families with children declined by five percent between 2016 and 2017—10,055 fewer people and 3,294 fewer family households. As of 2017, 184,661 people in families with children were experiencing homelessness, 33 percent of the homeless population.
In 2017, 40,799 people were experiencing homelessness as unaccompanied youth—that is, people under the age of 25 experiencing homelessness on their own. Most unaccompanied youth (88%) were between the ages of 18 and 24. Unaccompanied youth were more likely to be unsheltered (55%) than both all people experiencing homelessness (35%) and all people
experiencing homelessness as individuals (48%).
Between 2016 and 2017, the number of veterans experiencing homelessness increased for the first time since 2010. Nonetheless, homelessness among veterans dropped 45 percent since 2009. The two percent increase during the past year was almost entirely accounted for by increases among unsheltered veterans in major cities.
There were 12 percent more individuals with chronic patterns of homelessness in 2017 than in 2016, but has declined by 27 percent since 2007. Unlike other increases in the last year, the increase in chronic homelessness included both sheltered populations (8% increase) and unsheltered populations (14% increase).
Percent of Homeless PeopleBy Household Type and Sheltered Status, 2017
Individuals,Sheltered
People in Families,
Unsheltered
People in Families,
Sheltered
Individuals, Unsheltered
65% Sheltered35%30%
32%3%
35% Unsheltered
All People Individuals Families with Children
Unaccompanied Homeless Youth Veterans
Individuals with Chronic Patterns of
Homelessness
2017 PIT Estimate: 553,742 369,081 184,661 40,799 40,056 86,962
Change from 2016 +1% +4% -5% +2% +12%

2
Chronically Homeless Individual refers to an individual with a disability who has been continuously homeless for one year or more or has experienced at least four episodes of homelessness in the last three years where the combined length of time homeless in those occasions is at least 12 months.
Chronically Homeless People in Families refers to people in families in which the head of household has a disability and has either been continuously homeless for one year or more or has experienced at least four episodes of homelessness in the last three years where the combined length of time homeless in those occasions is at least 12 months.
Continuums of Care (CoC) are local planning bodies responsible for coordinating the full range of homelessness services in a geographic area, which may cover a city, county, metropolitan area, or an entire state.
Emergency Shelter is a facility with the primary purpose of providing temporary shelter for homeless people.
Homeless describes a person who lacks a fixed, regular, and adequate nighttime residence.
Housing Inventory Count (HIC) is produced by each CoC and provides an annual inventory of beds that assist people in the CoC who are experiencing homelessness or leaving homelessness.
Individual refers to a person who is not part of a family with children during an episode of homelessness. Individuals may be homeless as single adults, unaccompanied youth, or in multiple-adult or multiple-child households.
Other Permanent Housing is housing with or without services that is specifically for formerly homeless people but that does not require people to have a disability.
Parenting Youth are people under age 25 who are the parents or legal guardians of one or more children (under age 18) who are present with or sleeping in the same place as that youth parent, where there is no person over age 24 in the household.
Parenting Youth Household is a household with at least one parenting youth and the child or children for whom the parenting youth is the parent or legal guardian.
People in Families with children are people who are homeless as part of a household that has at least one adult (age 18 and older) and one child (under age 18).
Permanent Supportive Housing (PSH) is a housing model designed to provide housing assistance (project- and tenant-based) and supportive services on a long-term basis to formerly homeless people. HUD’s Continuum of Care program, authorized by the McKinney-Vento Act, funds PSH and requires that the client have a disability for eligibility.
Point-in-Time Counts are unduplicated 1-night estimates of both sheltered and unsheltered homeless populations. The 1-night counts are conducted by CoCs nationwide and occur during the last week in January of each year.
Rapid Rehousing is a housing model designed to provide temporary housing assistance to people experiencing homelessness, moving them quickly out of homelessness and into permanent housing.
Safe Havens provide temporary shelter and services to hard-to-serve individuals.
Sheltered Homelessness refers to people who are staying in emergency shelters, transitional housing programs, or safe havens.
Transitional Housing Programs provide people experiencing homelessness a place to stay combined with supportive services for up to 24 months.
Definition of TermsPlease note: Key terms are used for AHAR reporting purposes and accurately reflect the data used in this report. Definitions of these terms may differ in some ways from the definitions found in the Homeless Emergency Assistance and Rapid Transition to Housing (HEARTH) Act and in HUD regulations.
3
Unaccompanied Homeless Youth (under 18) are people in households with only children who are not part of a family with children or accompanied by their parent or guardian during their episode of homelessness, and who are under the age of 18.
Unaccompanied Homeless Youth (18-24) are people in households without children who are not part of a family with children or accompanied by their parent or guardian during their episode of homelessness, and who are between the ages of 18 and 24.
Unsheltered Homelessness refers to people whose primary nighttime location is a public or private place not designated for, or ordinarily used as, a regular sleeping accommodation for people (for example, the streets, vehicles, or parks).
Veteran refers to any person who served on active duty in the armed forces of the United States. This includes Reserves and National Guard members who were called up to active duty.

4
The U.S. Department of Housing and Urban Development and other federal agencies collaborate with state and local partners to prevent and end homelessness across the country. This coordinated effort to end homelessness continues to be a key to making progress to preventing and ending homelessness.
GOAL
Prevent and end chronic homelessness • The number of individuals experiencing chronic homelessness declined by 18 percent, or over 19,000 people, between 2010 and 2017.
• Just under 87,000 individuals experiencing homelessness on a particular night in January 2017 had chronic patterns of homelessness. Nearly seven in ten individuals experiencing chronic homelessness were staying outdoors, in abandoned buildings, or other locations not suitable for human habitation rather than staying in shelters, reflecting the high degree of vulnerability of this population.
• In 2017, there were nearly 94,000 more permanent supportive housing (PSH) beds dedicated to people with chronic patterns of homelessness than there were in 2010.
GOAL
Prevent and end homelessness among Veterans • Between 2010 and 2017, the number of veterans experiencing homelessness was cut nearly in half. Veteran homelessness has dropped by 46 percent, or by more than 34,000 people since 2010.
• On a single night in January 2017, just more than 40,000 veterans were experiencing homelessness. A majority (62%) were staying in emergency shelters or transitional housing programs.
GOAL
Prevent and end homelessness for families, youth, and children• In January 2017, about 185,000 people in families with children experienced homelessness, about 57,000 fewer people than in 2010, a 24 percent decline.
• Just fewer than 22,000 people were in families with children in which the head of household was under the age of 25
• More than 40,000 people under the age of 25 were unaccompanied youth—that is, homeless on their own rather than as part of a family. About 36,000 youth between the ages of 18 and 24 were homeless by themselves, as were about 4,800 youth under the age of 18.
GOAL
Set a path to ending all types of homelessness• In January 2017, almost 554,000 people were homeless on a single night, with nearly two-thirds (65%) found in emergency shelters or transitional housing programs.
• While the number of people experiencing homelessness increased by just under one percent between 2016 and 2017, homelessness has declined by more than 83,000 people since 2010, a 13 percent reduction. The recent increase in homelessness is attributable to an increase in the number of individuals staying in unsheltered locations in major cities.
Progress on Preventing and Ending Homelessness

5
6
The Department of Housing and Urban Development (HUD) releases the Annual Homeless Assessment Report to Congress (AHAR) in two parts. Part 1 provides Point-in-Time (PIT) estimates, offering a snapshot of homelessness—both sheltered and unsheltered—on a single night. The one-night counts are conducted during the last 10 days of January each year. The PIT counts also provide an estimate of the number of people experiencing homelessness within particular homeless populations, such as people with chronic patterns of homelessness and veterans experiencing homelessness.
This year serves as the baseline year for estimates of unaccompanied youth, that is, people under the age of 25 who are experiencing homelessness on their own, not in the company of their parent or guardian, and who are not part of a family. Also for the first time this year, Part 1 of the AHAR includes some examination of the changes in demographic characteristics of people experiencing homelessness.
To understand our nation’s capacity to serve people who are currently or formerly experiencing homelessness, this report also provides counts of beds in emergency shelters, transitional housing programs, safe havens, rapid rehousing programs, permanent supportive housing programs, and other permanent housing.
In 2017, the PIT estimates of people experiencing homelessness in sheltered and unsheltered locations, as well as the number of beds available to serve them, were reported by 399 Continuums of Care (CoC) nationwide. These 399 CoCs covered virtually the entire United States. The Northern Mariana Islands are the newest CoC and reported PIT and HIC data for the first time in 2017.
HUD has methodological standards for conducting the PIT counts, and CoCs use a variety of approved methods to produce the counts. The guide for PIT methodologies can be found here: https://www.hudexchange.info/resource/4036/point-in-time-count-methodology-guide. HUD reviews the data for accuracy and quality prior to creating the estimates for this report.
About This Report

7
Estimates of HomelessnessIN THE UNITED STATES
8
1National Estimates Homelessness in the United States
Data source: PIT 2007–2017
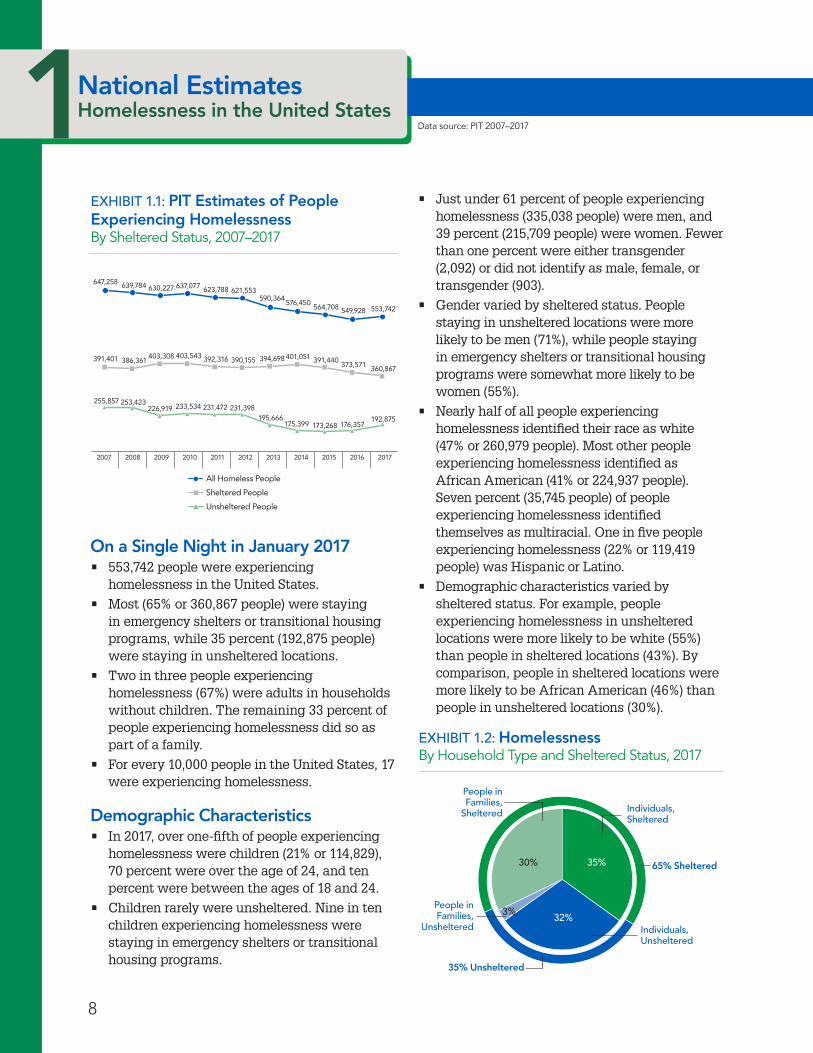
On a Single Night in January 2017• 553,742 people were experiencing
homelessness in the United States.
• Most (65% or 360,867 people) were staying in emergency shelters or transitional housing programs, while 35 percent (192,875 people) were staying in unsheltered locations.
• Two in three people experiencing homelessness (67%) were adults in households without children. The remaining 33 percent of people experiencing homelessness did so as part of a family.
• For every 10,000 people in the United States, 17 were experiencing homelessness.
Demographic Characteristics• In 2017, over one-fifth of people experiencing
homelessness were children (21% or 114,829), 70 percent were over the age of 24, and ten percent were between the ages of 18 and 24.
• Children rarely were unsheltered. Nine in ten children experiencing homelessness were staying in emergency shelters or transitional housing programs.
EXHIBIT 1 .2: HomelessnessBy Household Type and Sheltered Status, 2017
EXHIBIT 1 .1: PIT Estimates of People Experiencing HomelessnessBy Sheltered Status, 2007–2017
2007 2008 2009 2010 20122011 2013 2014 2015 2016 2017
647,258 639,784 630,227 637,077 623,788 621,553590,364
576,450564,708 549,928 553,742
391,401
255,857 253,423226,919 233,534 231,472 231,398
175,399 173,268 176,357192,875
386,361403,308 403,543 392,316 390,155 394,698 401,051 391,440
373,571 360,867
195,666
All Homeless People
Sheltered People
Unsheltered People
• Just under 61 percent of people experiencing homelessness (335,038 people) were men, and 39 percent (215,709 people) were women. Fewer than one percent were either transgender (2,092) or did not identify as male, female, or transgender (903).
• Gender varied by sheltered status. People staying in unsheltered locations were more likely to be men (71%), while people staying in emergency shelters or transitional housing programs were somewhat more likely to be women (55%).
• Nearly half of all people experiencing homelessness identified their race as white (47% or 260,979 people). Most other people experiencing homelessness identified as African American (41% or 224,937 people). Seven percent (35,745 people) of people experiencing homelessness identified themselves as multiracial. One in five people experiencing homelessness (22% or 119,419 people) was Hispanic or Latino.
• Demographic characteristics varied by sheltered status. For example, people experiencing homelessness in unsheltered locations were more likely to be white (55%) than people in sheltered locations (43%). By comparison, people in sheltered locations were more likely to be African American (46%) than people in unsheltered locations (30%).
Individuals,Sheltered
People in Families,
Unsheltered
People in Families,
Sheltered
Individuals, Unsheltered
65% Sheltered35%30%
32%3%
35% Unsheltered

The 2017 Annual Homeless Assessment Report to Congress: Part 1
9
All Homeless People Sheltered People Unsheltered People
# % # % # %
Total 553,742 100 360,867 100 192,875 100
Age
Under 18 114,829 20 .7 103,289 28 .6 11,540 6 .0
18 to 24 53,438 9 .7 31,742 8 .8 21,696 11 .2
Over 24 385,475 69 .6 225,836 62 .6 159,639 82 .8
Gender
Female 215,709 39 .0 160,606 44 .5 55,103 28 .6
Male 335,038 60 .5 198,935 55 .1 136,103 70 .6
Transgender 2,092 0 .4 1,100 0 .3 992 0 .5
Does not identify as male, female or transgender
903 0 .2 226 0 .1 677 0 .4
Ethnicity
Non-Hispanic 434,323 78 .4 285,867 79 .2 148,456 77 .0
Hispanic 119,419 21 .6 75,000 20 .8 44,419 23 .0
Race
White 260,979 47 .1 154,489 42 .8 106,490 55 .2
African American 224,937 40 .6 167,489 46 .4 57,448 29 .8
Asian 6,760 1 .2 3,703 1 .0 3,057 1 .6
Native American 16,796 3 .0 8,724 2 .4 8,072 4 .2
Pacific Islander 8,525 1 .5 4,485 1 .2 4,040 2 .1
Multiple Races 35,745 6 .5 21,977 6 .1 13,768 7 .1
EXHIBIT 1 .3: Demographic Characteristics of People Experiencing Homelessness2017
EXHIBIT 1 .4: Change in Number of People Experiencing Homelessness2007–2017
Change 2016–2017 Change 2010–2017 Change 2007–2017
# % # % # %
Total 3,814 0.7 -83,335 -13.1 -93,516 -14.4
Sheltered People -12,704 -3 .4 -42,676 -10 .6 -30,534 -7 .8
Unsheltered People 16,518 9 .4 -40,659 -17 .4 -62,982 -24 .6
10
1National Estimates Homelessness in the United States
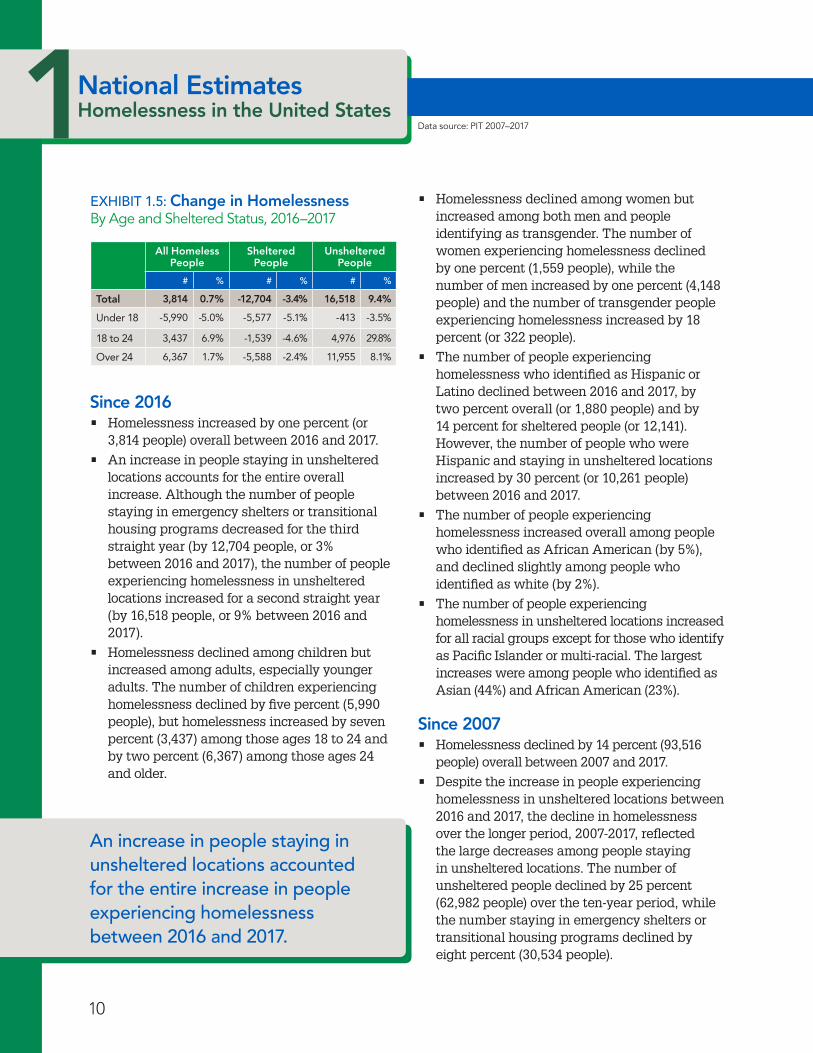
Since 2016• Homelessness increased by one percent (or
3,814 people) overall between 2016 and 2017.
• An increase in people staying in unsheltered locations accounts for the entire overall increase. Although the number of people staying in emergency shelters or transitional housing programs decreased for the third straight year (by 12,704 people, or 3% between 2016 and 2017), the number of people experiencing homelessness in unsheltered locations increased for a second straight year (by 16,518 people, or 9% between 2016 and 2017).
• Homelessness declined among children but increased among adults, especially younger adults. The number of children experiencing homelessness declined by five percent (5,990 people), but homelessness increased by seven percent (3,437) among those ages 18 to 24 and by two percent (6,367) among those ages 24 and older.
• Homelessness declined among women but increased among both men and people identifying as transgender. The number of women experiencing homelessness declined by one percent (1,559 people), while the number of men increased by one percent (4,148 people) and the number of transgender people experiencing homelessness increased by 18 percent (or 322 people).
• The number of people experiencing homelessness who identified as Hispanic or Latino declined between 2016 and 2017, by two percent overall (or 1,880 people) and by 14 percent for sheltered people (or 12,141). However, the number of people who were Hispanic and staying in unsheltered locations increased by 30 percent (or 10,261 people) between 2016 and 2017.
• The number of people experiencing homelessness increased overall among people who identified as African American (by 5%), and declined slightly among people who identified as white (by 2%).
• The number of people experiencing homelessness in unsheltered locations increased for all racial groups except for those who identify as Pacific Islander or multi-racial. The largest increases were among people who identified as Asian (44%) and African American (23%).
Since 2007• Homelessness declined by 14 percent (93,516
people) overall between 2007 and 2017.
• Despite the increase in people experiencing homelessness in unsheltered locations between 2016 and 2017, the decline in homelessness over the longer period, 2007-2017, reflected the large decreases among people staying in unsheltered locations. The number of unsheltered people declined by 25 percent (62,982 people) over the ten-year period, while the number staying in emergency shelters or transitional housing programs declined by eight percent (30,534 people).
Data source: PIT 2007–2017
All Homeless People
Sheltered People
Unsheltered People
# % # % # %
Total 3,814 0.7% -12,704 -3.4% 16,518 9.4%
Under 18 -5,990 -5 .0% -5,577 -5 .1% -413 -3 .5%
18 to 24 3,437 6 .9% -1,539 -4 .6% 4,976 29 .8%
Over 24 6,367 1 .7% -5,588 -2 .4% 11,955 8 .1%
EXHIBIT 1 .5: Change in HomelessnessBy Age and Sheltered Status, 2016–2017
An increase in people staying in unsheltered locations accounted for the entire increase in people experiencing homelessness between 2016 and 2017 .
The 2017 Annual Homeless Assessment Report to Congress: Part 1
11
12
1State EstimatesHomelessness in the United States
Data source: PIT 2007–2017; Excludes Puerto Rico and U.S. territories
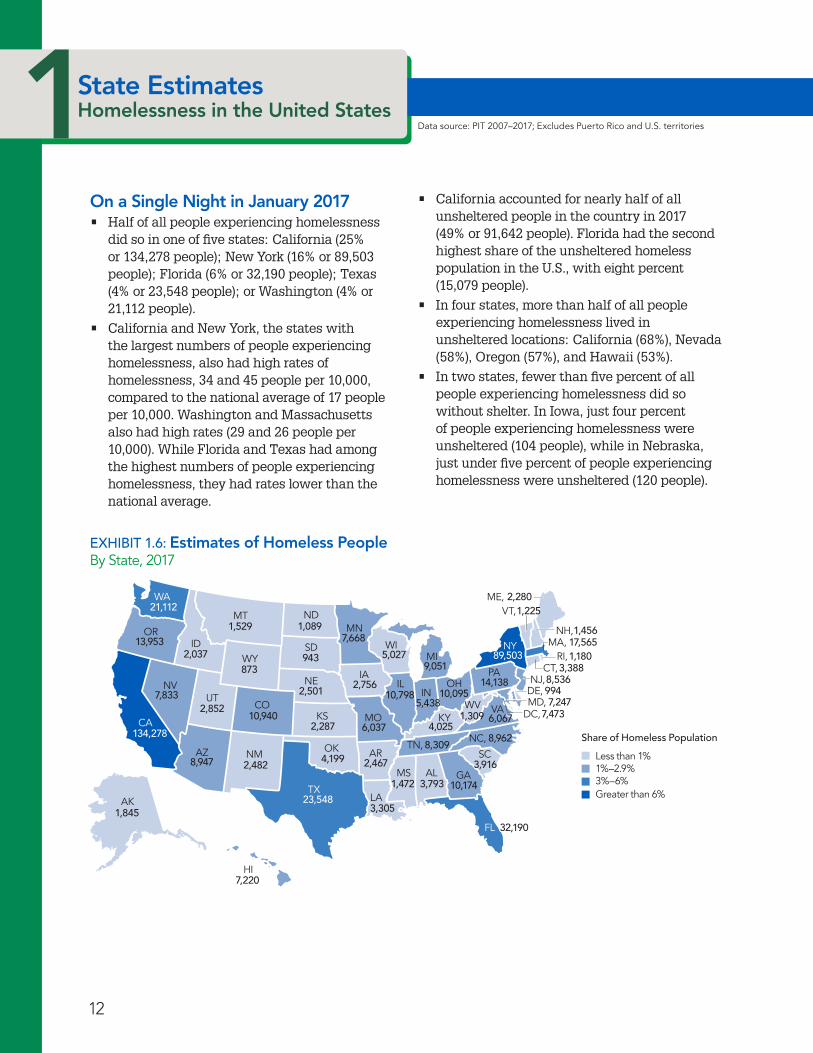
On a Single Night in January 2017• Half of all people experiencing homelessness
did so in one of five states: California (25% or 134,278 people); New York (16% or 89,503 people); Florida (6% or 32,190 people); Texas (4% or 23,548 people); or Washington (4% or 21,112 people).
• California and New York, the states with the largest numbers of people experiencing homelessness, also had high rates of homelessness, 34 and 45 people per 10,000, compared to the national average of 17 people per 10,000. Washington and Massachusetts also had high rates (29 and 26 people per 10,000). While Florida and Texas had among the highest numbers of people experiencing homelessness, they had rates lower than the national average.
873943
1,309
10,174
32,190
10,095
6,067
8,9624,025
8,309
5,438
5,0279,051
10,798
7,668
3,916
1,472 3,793
1,089
2,756
6,037
2,501
10,940
7,833
8,947
2,287
4,199
23,548
2,467
3,305
1,52913,953
21,112
134,278
2,482
7,220
2,037
2,852
1,845
994
7,4737,247
1,18017,565
3,38889,503
8,53614,138
1,456
1,2252,280ME,
NH,
VT,
NY MA,RI,
CT,NJ,
DE,
DC,
PA
VAWV
NC,
SC
GA
FL
AL
TN,
KY
OHIL
MIWI
MN
IA
MO
AR
LATX
OK
KS
NE
SD
NDMT
WA
OR
CA
AK
HI
WY
CO
NMAZ
UTNV
ID
IN
MS
MD,
Share of Homeless Population
Less than 1%1%–2.9%
Greater than 6%3%–6%
EXHIBIT 1 .6: Estimates of Homeless People By State, 2017
• California accounted for nearly half of all unsheltered people in the country in 2017 (49% or 91,642 people). Florida had the second highest share of the unsheltered homeless population in the U.S., with eight percent (15,079 people).
• In four states, more than half of all people experiencing homelessness lived in unsheltered locations: California (68%), Nevada (58%), Oregon (57%), and Hawaii (53%).
• In two states, fewer than five percent of all people experiencing homelessness did so without shelter. In Iowa, just four percent of people experiencing homelessness were unsheltered (104 people), while in Nebraska, just under five percent of people experiencing homelessness were unsheltered (120 people).

13
The 2017 Annual Homeless Assessment Report to Congress: Part 1
EXHIBIT 1 .7: States with the Highest and Lowest Rates of Unsheltered People Experiencing Homelessness2017
CALIFORNIA
134,278 Homeless91,642 Unsheltered
68.2%
RHODE ISLAND
1,180 Homeless69 Unsheltered
5.8%17,565 Homeless991 Unsheltered
5.6%
MISSISSIPPIHAWAII
48.8%7,220 Homeless3,800 Unsheltered
52.6%
NEVADA
7,883 Homeless4,578 Unsheltered
58.4%
OREGON
13,953 Homeless7,967 Unsheltered
57.1%
MASSACHUSETTS
2,501 Homeless120 Unsheltered
4.8%
NEBRASKA
2,756 Homeless104 Unsheltered
IOWA
Lowest Rates
Highest Rates
1,472 Homeless719 Unsheltered
89,503 Homeless4,555 Unsheltered
5.1%
NEW YORK
3.8%
EXHIBIT 1 .8: Largest Changes in Homelessness by StateBy State, 2007–2017
2016–2017 2007–2017Largest Increases
CALIFORNIA 16,136 / 13 .7% NEW YORK 26,902 / 43 .0%
NEW YORK 3,151 / 3 .6% MASSACHUSETTS 2,438 / 16 .1%
OREGON 715 / 5 .4% DISTRICT OF COLUMBIA 2,153 / 40 .5%
NEVADA 435 / 5 .9% HAWAII 1,150 / 18 .9%
TEXAS 426 / 1 .8% MONTANA 379 / 33 .0%Largest Decreases
GEORGIA -2,735 / -21 .2% TEXAS -16,240 / -40 .8%
MASSACHUSETTS -2,043 / -10 .4% FLORIDA -15,879 / -33 .0%
FLORIDA -1,369 / -4 .1% GEORGIA -9,465 / -48 .2%
PENNSYLVANIA -1,201 / -7 .8% NEW JERSEY -8,778 / -50 .7%
SOUTH CAROLINA -1,135 / -22 .5% ARIZONA -5,699 / -38 .9%a Due to methodological changes, Colorado, North Dakota, South Dakota, Michigan, and Wyoming were excluded from the list of largest
decreases from 2007-2017.
14
1State Estimates Homelessness in the United States
Changes Over Time• The number of people experiencing
homelessness declined in 30 states and the District of Columbia between 2016 and 2017. The largest absolute decreases were in Georgia (2,735 fewer people), Massachusetts (2,043 fewer people), and Florida (1,369 fewer people). The largest percentage decreases were in South Carolina (23%), Georgia (21%), and Louisiana (17%).
• The number of people experiencing homelessness increased in 20 states between 2016 and 2017. The largest absolute increases were in California (16,136 people), New York (3,151 people), and Oregon (715 people). The largest percentage increases were in North Dakota (18%), California (14%), New Mexico (10%), and Vermont (10%).
• The number of people experiencing homelessness declined in 36 states between 2007 and 2017. The largest decreases were in Texas (16,240 fewer people or 41%), Florida (15,879 people or 33%), and Georgia (9,465 people or 48%).
• The number of people experiencing homelessness increased in 14 states, plus the District of Columbia, between 2007 and 2017. The largest absolute increases were in New York (26,902 more people or 43%), Massachusetts (2,438 people or 16%), and the District of Columbia (2,153 people or 41%).
Despite a national increase between 2016 and 2017, the number of people experiencing homelessness declined in 30 states and the District of Columbia during that time period .
The 2017 Annual Homeless Assessment Report to Congress: Part 1
15
16
1Estimates by CoCHomelessness in the United States
Data source: PIT 2007–2017; Excludes Puerto Rico and U.S. territories
Continuums of Care (CoC) Were Divided into Three Geographic Categories1
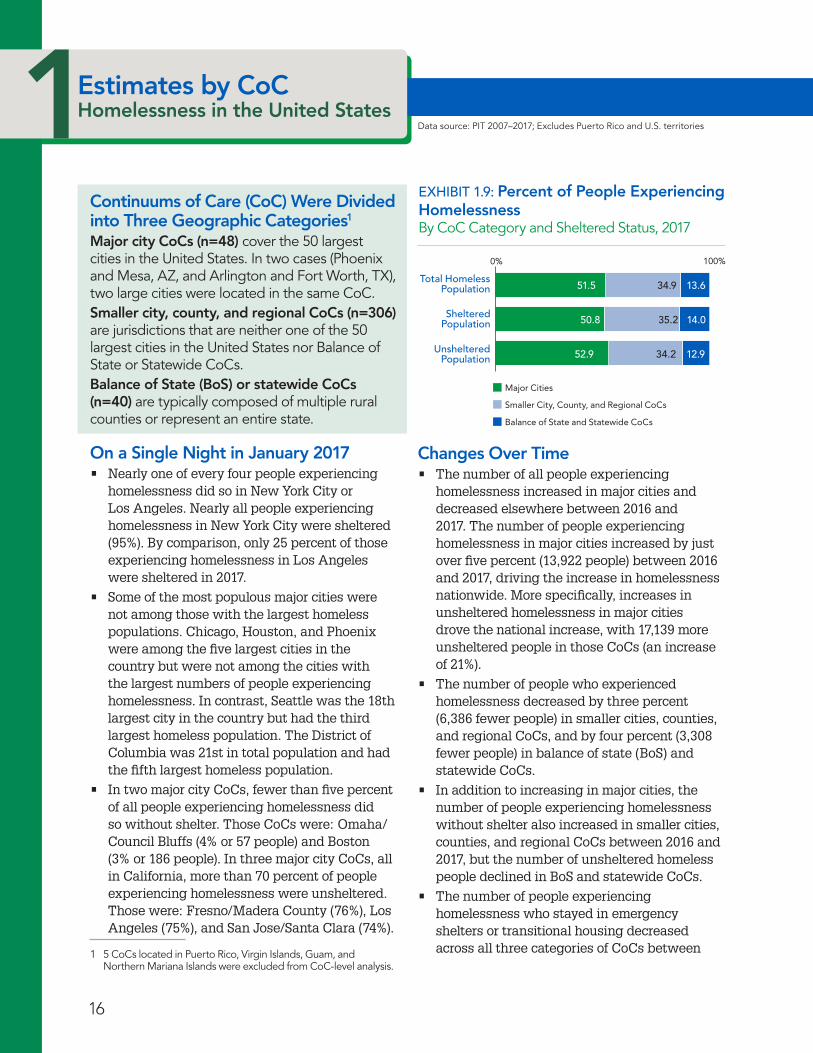
Major city CoCs (n=48) cover the 50 largest cities in the United States. In two cases (Phoenix and Mesa, AZ, and Arlington and Fort Worth, TX), two large cities were located in the same CoC.Smaller city, county, and regional CoCs (n=306) are jurisdictions that are neither one of the 50 largest cities in the United States nor Balance of State or Statewide CoCs.Balance of State (BoS) or statewide CoCs (n=40) are typically composed of multiple rural counties or represent an entire state.
On a Single Night in January 2017• Nearly one of every four people experiencing
homelessness did so in New York City or Los Angeles. Nearly all people experiencing homelessness in New York City were sheltered (95%). By comparison, only 25 percent of those experiencing homelessness in Los Angeles were sheltered in 2017.
• Some of the most populous major cities were not among those with the largest homeless populations. Chicago, Houston, and Phoenix were among the five largest cities in the country but were not among the cities with the largest numbers of people experiencing homelessness. In contrast, Seattle was the 18th largest city in the country but had the third largest homeless population. The District of Columbia was 21st in total population and had the fifth largest homeless population.
• In two major city CoCs, fewer than five percent of all people experiencing homelessness did so without shelter. Those CoCs were: Omaha/Council Bluffs (4% or 57 people) and Boston (3% or 186 people). In three major city CoCs, all in California, more than 70 percent of people experiencing homelessness were unsheltered. Those were: Fresno/Madera County (76%), Los Angeles (75%), and San Jose/Santa Clara (74%).
1 5 CoCs located in Puerto Rico, Virgin Islands, Guam, and Northern Mariana Islands were excluded from CoC-level analysis.
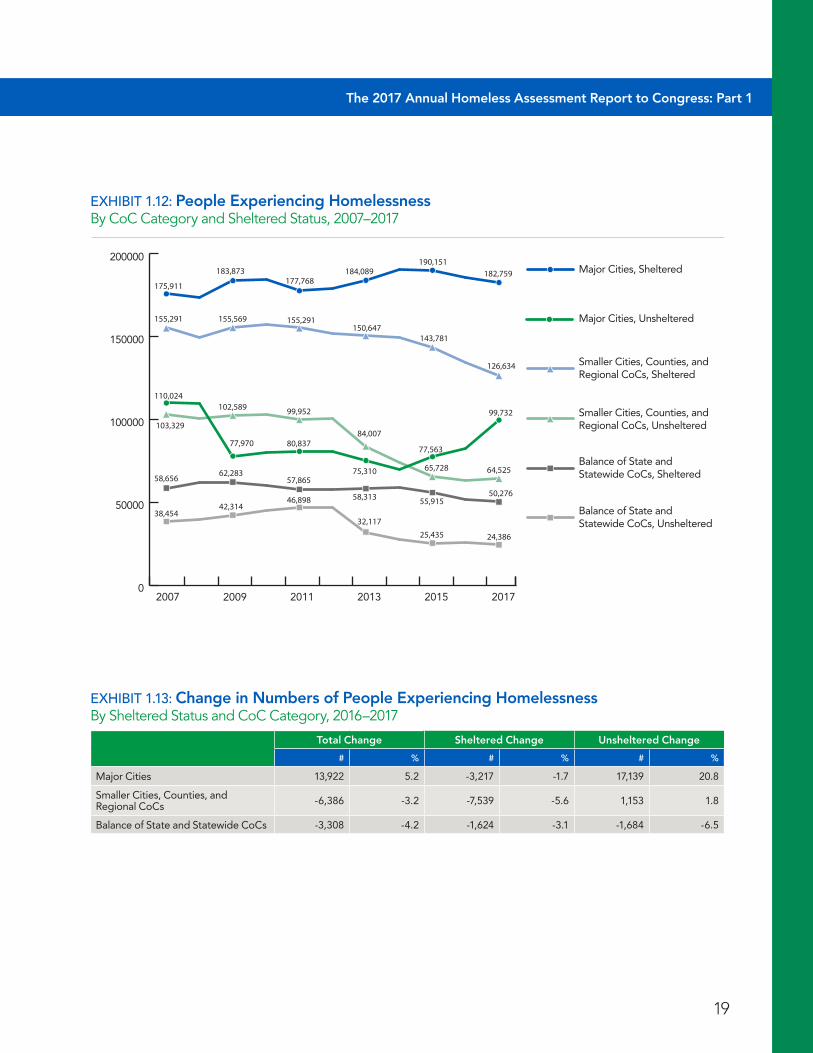
Changes Over Time• The number of all people experiencing
homelessness increased in major cities and decreased elsewhere between 2016 and 2017. The number of people experiencing homelessness in major cities increased by just over five percent (13,922 people) between 2016 and 2017, driving the increase in homelessness nationwide. More specifically, increases in unsheltered homelessness in major cities drove the national increase, with 17,139 more unsheltered people in those CoCs (an increase of 21%).
• The number of people who experienced homelessness decreased by three percent (6,386 fewer people) in smaller cities, counties, and regional CoCs, and by four percent (3,308 fewer people) in balance of state (BoS) and statewide CoCs.
• In addition to increasing in major cities, the number of people experiencing homelessness without shelter also increased in smaller cities, counties, and regional CoCs between 2016 and 2017, but the number of unsheltered homeless people declined in BoS and statewide CoCs.
• The number of people experiencing homelessness who stayed in emergency shelters or transitional housing decreased across all three categories of CoCs between
Total HomelessPopulation
ShelteredPopulation
UnshelteredPopulation
0% 100%
51.5
50.8
52.9 34.2
35.2
34.9 13.6
14.0
12.9
Major Cities
Smaller City, County, and Regional CoCs
Balance of State and Statewide CoCs
EXHIBIT 1 .9: Percent of People Experiencing HomelessnessBy CoC Category and Sheltered Status, 2017
The 2017 Annual Homeless Assessment Report to Congress: Part 1
17
2016 and 2017. The number of people experiencing homelessness who stayed in emergency shelters or transitional housing programs dropped by two percent (3,217 fewer people) in major cities, by three percent (1,624 people) in BoS and statewide CoCs, and by six percent (7,539 people) in smaller cities, counties, and regional CoCs.
• Across the longer time period, 2007-2017, homelessness declined across all combinations of CoC categories and shelter status, except for sheltered homelessness in major cities, which increased by four percent. Unsheltered homelessness in major cities declined by nine percent over the same period.
• Unsheltered homelessness in smaller cities, counties, and regional CoCs declined by 38 percent between 2007 and 2017.
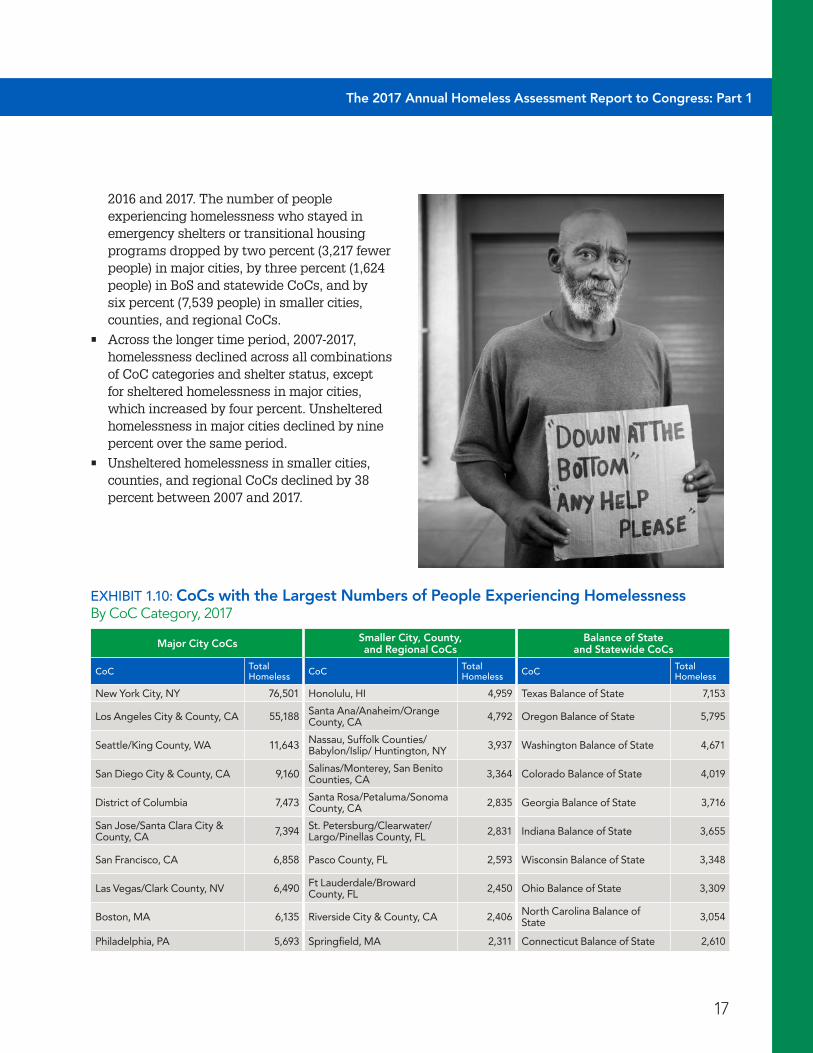
EXHIBIT 1 .10: CoCs with the Largest Numbers of People Experiencing Homelessness By CoC Category, 2017
Major City CoCs Smaller City, County, and Regional CoCs
Balance of State and Statewide CoCs
CoC Total Homeless CoC Total
Homeless CoC Total Homeless
New York City, NY 76,501 Honolulu, HI 4,959 Texas Balance of State 7,153
Los Angeles City & County, CA 55,188 Santa Ana/Anaheim/Orange County, CA 4,792 Oregon Balance of State 5,795
Seattle/King County, WA 11,643 Nassau, Suffolk Counties/Babylon/Islip/ Huntington, NY 3,937 Washington Balance of State 4,671
San Diego City & County, CA 9,160 Salinas/Monterey, San Benito Counties, CA 3,364 Colorado Balance of State 4,019
District of Columbia 7,473 Santa Rosa/Petaluma/Sonoma County, CA 2,835 Georgia Balance of State 3,716
San Jose/Santa Clara City & County, CA 7,394 St . Petersburg/Clearwater/
Largo/Pinellas County, FL 2,831 Indiana Balance of State 3,655
San Francisco, CA 6,858 Pasco County, FL 2,593 Wisconsin Balance of State 3,348
Las Vegas/Clark County, NV 6,490 Ft Lauderdale/Broward County, FL 2,450 Ohio Balance of State 3,309
Boston, MA 6,135 Riverside City & County, CA 2,406 North Carolina Balance of State 3,054
Philadelphia, PA 5,693 Springfield, MA 2,311 Connecticut Balance of State 2,610

18
National Estimates Homelessness in the United States
Data source: PIT 2007–2017; Excludes Puerto Rico and U.S. territories1Estimates by CoCHomelessness in the United States
Major City CoCs Smaller City, County, and Regional CoCs
Balance of State and Statewide CoCs
CoC Total Homeless
% Unsheltered CoC Total
Homeless%
Unsheltered CoC Total Homeless
% Unsheltered
Highest Rates
Fresno/Madera County, CA
2,016 75 .8Inyo, Mono, Alpine Counties, CA
121 95 .9Oklahoma Balance of State
432 67 .8
Los Angeles City & County, CA
55,188 74 .7 Pasco County, FL 2,593 93 .1
Hawaii Balance of State
2,261 65 .3
San Jose/Santa Clara City & County, CA
7,394 73 .7 Lake County, CA 401 93 .0
Oregon Balance of State
5,795 65 .0
Oakland/Alameda County, CA
5,629 68 .6
Fort Pierce/St . Lucie, Indian River, Martin Counties , FL
1,732 89 .4Colorado Balance of State
4,019 62 .4
Las Vegas/Clark County, NV
6,490 67 .1 Imperial County, CA 1,154 88 .9
Nevada Balance of State
237 61 .2
Boston, MA 6,135 3 .0 Lenawee County, MI 128 0 .0
Nebraska Balance of State
506 2 .8
Omaha/Council Bluffs, NE
1,389 4 .1
Sioux City/Dakota, Woodbury Counties, IA
288 0 .7 Iowa Balance of State 1,792 2 .8
New York City, NY 76,501 5 .1 Clinton
County, NY 126 0 .8Wisconsin Balance of State
3,348 4 .1
Memphis/Shelby County, TN
1,426 5 .5Northwest Minnesota, MN
288 1 .0 Delaware Statewide 994 5 .8
Indianapolis, IN 1,783 7 .1 Sullivan
County, NY 167 1 .2 Rhode Island Statewide 1,180 5 .8
EXHIBIT 1 .11: CoCs with the Highest and Lowest Rates of Unsheltered People Experiencing HomelessnessBy CoC Category, 2017
The 2017 Annual Homeless Assessment Report to Congress: Part 1
19
Total Change Sheltered Change Unsheltered Change
# % # % # %
Major Cities 13,922 5 .2 -3,217 -1 .7 17,139 20 .8
Smaller Cities, Counties, and Regional CoCs -6,386 -3 .2 -7,539 -5 .6 1,153 1 .8
Balance of State and Statewide CoCs -3,308 -4 .2 -1,624 -3 .1 -1,684 -6 .5
EXHIBIT 1 .13: Change in Numbers of People Experiencing HomelessnessBy Sheltered Status and CoC Category, 2016–2017
EXHIBIT 1 .12: People Experiencing HomelessnessBy CoC Category and Sheltered Status, 2007–2017
0
50000
100000
150000
200000
Balance of State and Statewide CoCs, Unsheltered
Balance of State and Statewide CoCs, Sheltered
Smaller Cities, Counties, and Regional CoCs, Unsheltered
Smaller Cities, Counties, and Regional CoCs, Sheltered
Major Cities, Unsheltered
Major Cities, Sheltered
2007 2009 2011 2013 2015 2017
175,911
183,873177,768
184,089190,151
182,759
110,024
103,329
77,970 80,837
75,310
77,563
99,732
155,291 155,569 155,291150,647
143,781
126,634
102,589 99,952
84,007
65,728 64,52558,656
62,28357,865
58,313 55,91550,276
38,45442,314
46,898
32,117
25,435 24,386

20
1National Estimates Homelessness in the United States2 National Estimates
Homeless IndividualsData source: PIT 2007–2017
On a Single Night in January 2017• There were 369,081 people experiencing
homelessness in households without children, representing 67 percent of the total homeless population.
• Almost half of all people experiencing homelessness as individuals were staying in unsheltered locations, 48 percent or 175,937 people.
Demographic Characteristics• Most individuals experiencing homelessness
(88 percent) were over the age of 24. People between 18 and 24 years old made up just 10 percent of homeless individuals, and only one percent of homeless individuals were under 18 years old.
• More than seven in ten people homeless as individuals were men, 71 percent or 262,011 men. The remaining 29 percent were women (just over 28 percent or 104,315 women), transgender, or people who did not identify as male, female or transgender.
EXHIBIT 2 .1: PIT Estimates of Homeless Individuals By Sheltered Status, 2007–2017
2007 2008 2009 2010 20122011 2013 2014 2015 2016 2017
647,258
412,700
213,073
199,627 199,670176,136 182,922 181,779 182,997
165,047 151,041 152,806 157,204175,937
204,855 215,995 212,218 205,834 199,159 203,127 209,148 205,616 198,008
404,525 392,131 395,140 387,613 382,156368,174 360,189 358,422 355,212 369,081
193,144
639,784 630,227 637,077 623,788 621,553590,364
576,450 564,708549,928 533,742
Sheltered Individuals
Total Individuals
All Homeless People
Unsheltered Individuals
• Women made up a somewhat greater share of sheltered individuals (30%) than of unsheltered individuals (26%).
• Across both sheltered and unsheltered people experiencing homelessness as individuals, 19 percent identified themselves as Hispanic or Latino. They were much more likely to be staying in unsheltered locations than in shelters. Almost a quarter unsheltered individuals were Hispanic (23%) compared to just 15 percent of sheltered individuals identifying as Hispanic.
• Just over half of people experiencing homelessness as individuals were white (52% or 192,671 people). An even higher percentage of unsheltered homeless individuals were white (55% or 96,448 people, while African Americans accounted for 36 percent of all homeless individuals (or 132,399 people) but only 31 percent of unsheltered individuals (or 53,844 people).

21
The 2017 Annual Homeless Assessment Report to Congress: Part 1
EXHIBIT 2 .2: Demographic Characteristics of Homeless Individuals2017
CharacteristicAll Homeless Individuals Sheltered Individuals Unsheltered Individuals
# % # % # %
Total homeless 369,081 100 193,144 100 175,937 100
Age
Under 18 5,110 1.4 2,329 1.2 2,781 1.6
18 to 24 38,030 10.3 17,891 9.3 20,139 11.4
Over 24 325,941 88.3 172,924 89.5 153,017 87.0
Gender
Female 104,315 28.3 58,017 30.0 46,298 26.3
Male 262,011 71.0 133,964 69.4 128,047 72.8
Transgender 2,007 0.5 1,030 0.5 977 0.6
Other Gender 748 0.2 133 0.1 615 0.3
Ethnicity
Non-Hispanic 299,960 81.3 164,692 85.3 135,268 76.9
Hispanic 69,121 18.7 28,452 14.7 40,669 23.1
Race
White 192,671 52.2 96,223 49.8 96,448 54.8
African American 132,399 35.9 78,555 40.7 53,844 30.6
Asian 4,841 1.3 2,008 1.0 2,833 1.6
Native American 12,248 3.3 4,785 2.5 7,463 4.2
Pacific Islander 4,223 1.1 1,531 0.8 2,692 1.5
Multiple Races 22,699 6.2 10,042 5.2 12,657 7.2
EXHIBIT 2 .3: Change in Numbers of Homeless IndividualsBy Sheltered Status, 2007–2017
Change 2016–2017 Change 2010–2017 Change 2007–2017
# % # % # %
Total Homeless Individuals 13,869 3.9 -26,059 -6.6 -43,619 -10.6
Sheltered Individuals -4,864 -2 .5 -19,074 -9 .0 -19,929 -9 .4
Unsheltered Individuals 18,733 11 .9 -6,985 -3 .8 -23,690 -11 .9
EXHIBIT 2 .4: Change in Numbers of Homeless IndividualsBy Age and Sheltered Status, 2016-2017
Total Change Sheltered Change Unsheltered Change
# % # % # %
Under 18 997 24 .2 -126 -5 .1 1,123 67 .7
18 to 24 4,179 12 .3 -480 -2 .6 4,659 30 .1
Over 24 8,693 2 .7 -4,258 -2 .4 12,951 9 .2
22
1National Estimates Homelessness in the United States2 National Estimates
Homeless Individuals
Since 2016• The number of people experiencing
homelessness as individuals—that is, in households without children--increased by four percent (13,869 more individuals) between 2016 and 2017. This increase was driven entirely by an increase in the number of unsheltered individuals (a 12% rise). Sheltered homelessness among individuals decreased by 4,864 people (or 3%).
• Homelessness among individuals increased across all age groups. The number of children (people under 18) experiencing homelessness as individuals increased by 997, the number of people between the ages of 18 and 24 increased by 4,179, and the number of people homeless as individuals over the age of 24 increased by 8,693.
• For each age group, increases were driven entirely by increases in the number of people experiencing homelessness in unsheltered locations, while the number of sheltered individuals declined across all age groups.
• For people over the age of 24 experiencing homelessness as individuals, the unsheltered number increased by nine percent (12,951 people), while the number of those sheltered decreased by two percent (or 4,258 fewer people),
Data source: PIT 2007–2017
• There were five percent more women experiencing homelessness as individuals in 2017 than in 2016, driven by a 14 percent rise in unsheltered women. There were three percent more men and 11 percent more unsheltered men. The only group for whom the rise in the sheltered number drove an overall increase was people who identified as transgender (310 more transgender individuals in shelter in 2017 than in 2016).
• The number of people experiencing homelessness as individuals who identified as Hispanic or Latino increased by 14 percent overall, compared to two percent for non-Hispanic or Latino individuals. Unsheltered homelessness among Hispanic individuals increased at a greater rate than among non-Hispanic individuals (by 35% compared to 6%). At the same time, the Hispanic population experienced declines in sheltered homelessness at a greater rate than non-Hispanic individuals (a 7% decline compared to a 2% decline).
• Homelessness among African American individuals increased by six percent overall (or 7,299 people) and by 27 percent among the unsheltered population (or 11,399 people). Homelessness among white individuals increased by two percent overall (or 2,856 people) and by seven percent among the unsheltered population (or 5,944 people).
Since 2007 • Over a longer time period, 2007-2017, individual
homelessness declined by 11 percent (43,619 fewer people). This decline was comprised of both a decline in the number of homeless individuals in unsheltered locations – which dropped by 12 percent (23,690 fewer people) – and in sheltered locations, which dropped by nine percent (or 19,929 people).
The increase in the number of people experiencing homelessness as individuals was driven entirely by an increase in the number of unsheltered individuals (a 12% rise) .

23
The 2017 Annual Homeless Assessment Report to Congress: Part 1
23
24
1National Estimates Homelessness in the United States2 State Estimates
Homeless Individuals
EXHIBIT 2 .5: Estimates of Homeless Individuals By State, 2017
622
1,882
1,865
611
1,698
7,571
6,488
1,423
2,824
4,535
1,500
3,768
2,6455,628
3,899
2,5591,100
2,9852,068
832987
1,309
14,781
112,756
1,354
615
3,5835,077
8,271
4,028
6,044
8026,267
2,2085,433
776
6971,352
1,032
2,896
7,422
22,768
16,708
37,390
3,6236,6886,894
6,137
10,434
7,281
3,032
ME,
NH,
VT,
NY MA,RI,
CT,NJ,
DE,
DC,
PA
VAWV
NC,
SC
GA
FL
AL
TN,
KY
OHIL
MIWI
MN
IA
MO
AR
LATX
OK
KS
NE
SD
NDMT
WA
OR
CA
AK
HI
WY
CO
NMAZ
UTNV
ID
IN
MS
MD,
Share of Homeless Individuals
Less than 1%1%–2.9%
Greater than 6%3%–6%
Data source: PIT 2007–2017; Excludes Puerto Rico and U.S. territories
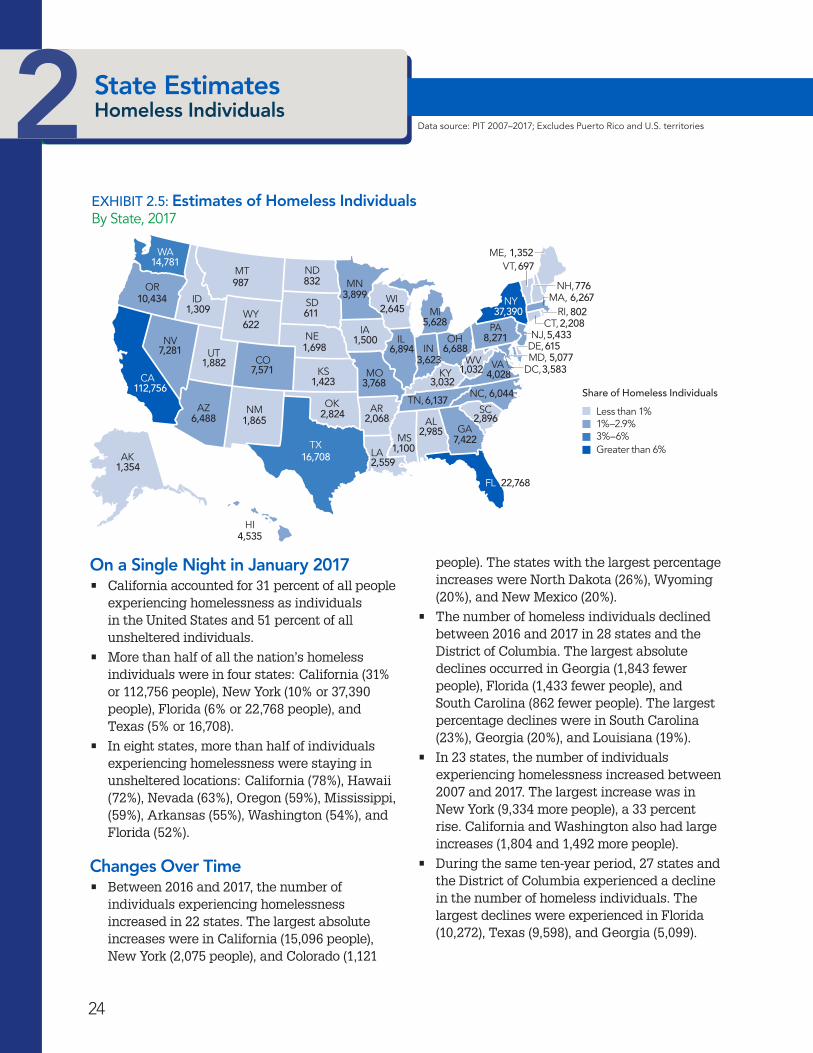
On a Single Night in January 2017• California accounted for 31 percent of all people
experiencing homelessness as individuals in the United States and 51 percent of all unsheltered individuals.
• More than half of all the nation’s homeless individuals were in four states: California (31% or 112,756 people), New York (10% or 37,390 people), Florida (6% or 22,768 people), and Texas (5% or 16,708).
• In eight states, more than half of individuals experiencing homelessness were staying in unsheltered locations: California (78%), Hawaii (72%), Nevada (63%), Oregon (59%), Mississippi, (59%), Arkansas (55%), Washington (54%), and Florida (52%).
Changes Over Time• Between 2016 and 2017, the number of
individuals experiencing homelessness increased in 22 states. The largest absolute increases were in California (15,096 people), New York (2,075 people), and Colorado (1,121
people). The states with the largest percentage increases were North Dakota (26%), Wyoming (20%), and New Mexico (20%).
• The number of homeless individuals declined between 2016 and 2017 in 28 states and the District of Columbia. The largest absolute declines occurred in Georgia (1,843 fewer people), Florida (1,433 fewer people), and South Carolina (862 fewer people). The largest percentage declines were in South Carolina (23%), Georgia (20%), and Louisiana (19%).
• In 23 states, the number of individuals experiencing homelessness increased between 2007 and 2017. The largest increase was in New York (9,334 more people), a 33 percent rise. California and Washington also had large increases (1,804 and 1,492 more people).
• During the same ten-year period, 27 states and the District of Columbia experienced a decline in the number of homeless individuals. The largest declines were experienced in Florida (10,272), Texas (9,598), and Georgia (5,099).
25
The 2017 Annual Homeless Assessment Report to Congress: Part 1
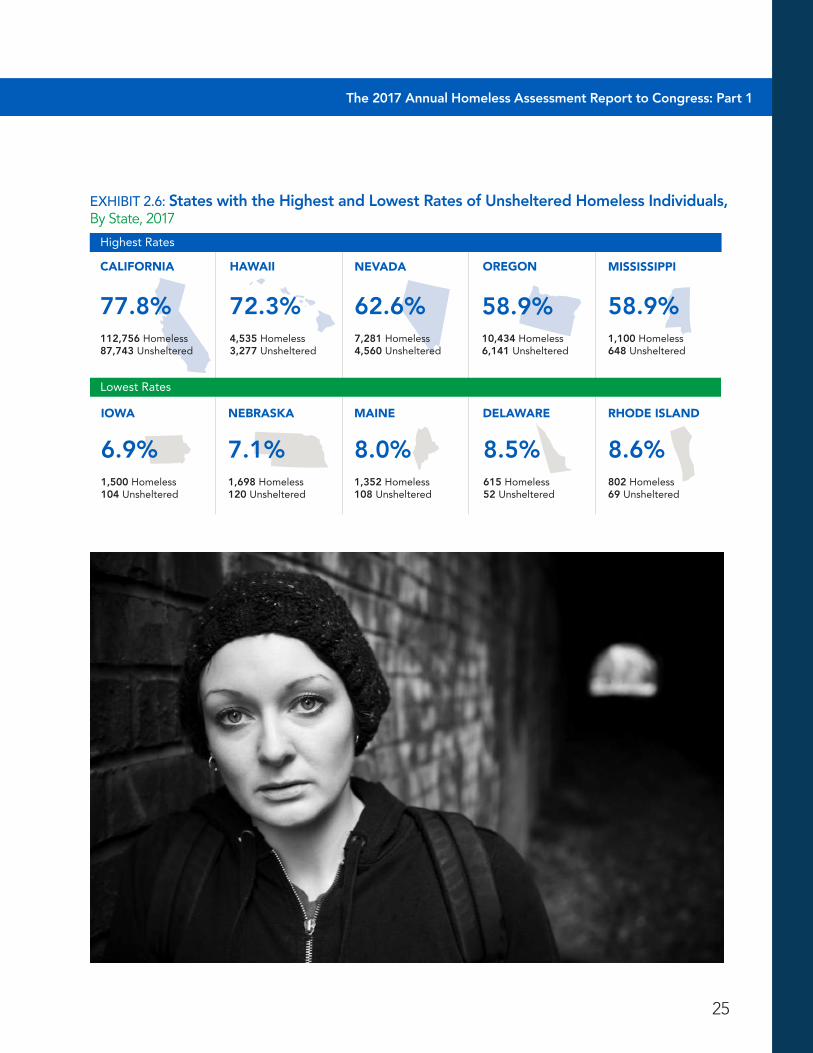
EXHIBIT 2 .6: States with the Highest and Lowest Rates of Unsheltered Homeless Individuals, By State, 2017
CALIFORNIA
112,756 Homeless87,743 Unsheltered
77.8%
NEBRASKA
1,698 Homeless120 Unsheltered
7.1%
IOWA
1,500 Homeless104 Unsheltered
6.9%802 Homeless69 Unsheltered
8.6%615 Homeless52 Unsheltered
8.5%
MISSISSIPPINEVADA
10,434 Homeless6,141 Unsheltered
58.9%1,100 Homeless648 Unsheltered
58.9%
HAWAII OREGON
4,535 Homeless3,277 Unsheltered
72.3%7,281 Homeless4,560 Unsheltered
62.6%
DELAWARE RHODE ISLAND
1,352 Homeless108 Unsheltered
8.0%
MAINE
Lowest Rates
Highest Rates

26
1National Estimates Homelessness in the United States2 State Estimates
Homeless IndividualsData source: PIT 2007–2017; Excludes Puerto Rico and U.S. territories
EXHIBIT 2 .7: Largest Changes in Homeless Individuals By State, 2007–2017
2016–2017 2007–2017Largest Increases
CALIFORNIA 15,096 / 15 .5% NEW YORK 9,334 / 33 .3%
NEW YORK 2,075 / 5 .9% CALIFORNIA 1,804 / 1 .6%
COLORADO 1,121 / 17 .4% WASHINGTON 1,492 / 11 .2%
OREGON 1,055 / 11 .2% HAWAII 1,200 / 36 .0%
WASHINGTON 881 / 6 .3% NEVADA 804 / 12 .4%Largest Decreasesa
GEORGIA -1,843 / -19 .9% FLORIDA -10,272 / -31 .1%
FLORIDA -1,433 / -5 .9% TEXAS -9,598 / -36 .5%
SOUTH CAROLINA -862 / -22 .9% GEORGIA -5,099 / -40 .7%
LOUISIANA -617 / -19 .4% NEW JERSEY -3,539 / -39 .4%
TENNESSEE -515 / -7 .7% ARIZONA -3,532 / -35 .2%a Due to methodological changes, Michigan was excluded from the list of largest decreases from 2007-2016.

27
The 2017 Annual Homeless Assessment Report to Congress: Part 1
27
28
1National Estimates Homelessness in the United States2 Estimates by CoC
Homeless Individuals
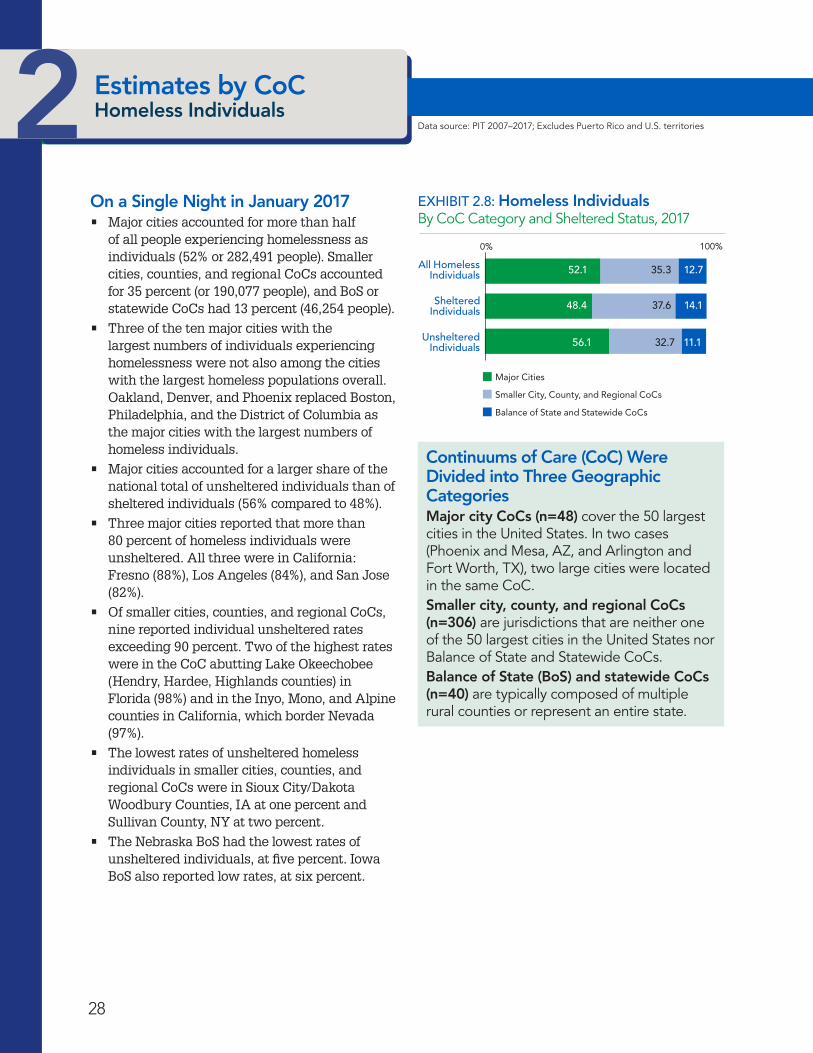
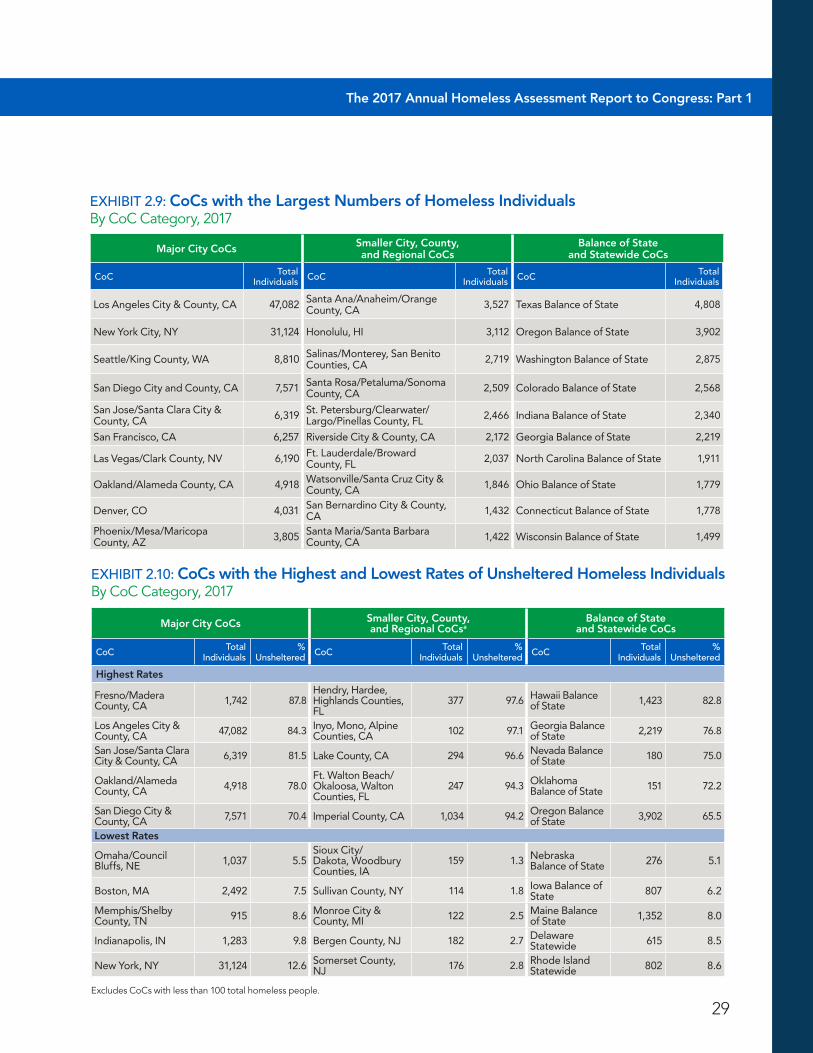
On a Single Night in January 2017• Major cities accounted for more than half
of all people experiencing homelessness as individuals (52% or 282,491 people). Smaller cities, counties, and regional CoCs accounted for 35 percent (or 190,077 people), and BoS or statewide CoCs had 13 percent (46,254 people).
• Three of the ten major cities with the largest numbers of individuals experiencing homelessness were not also among the cities with the largest homeless populations overall. Oakland, Denver, and Phoenix replaced Boston, Philadelphia, and the District of Columbia as the major cities with the largest numbers of homeless individuals.
• Major cities accounted for a larger share of the national total of unsheltered individuals than of sheltered individuals (56% compared to 48%).
• Three major cities reported that more than 80 percent of homeless individuals were unsheltered. All three were in California: Fresno (88%), Los Angeles (84%), and San Jose (82%).
• Of smaller cities, counties, and regional CoCs, nine reported individual unsheltered rates exceeding 90 percent. Two of the highest rates were in the CoC abutting Lake Okeechobee (Hendry, Hardee, Highlands counties) in Florida (98%) and in the Inyo, Mono, and Alpine counties in California, which border Nevada (97%).
• The lowest rates of unsheltered homeless individuals in smaller cities, counties, and regional CoCs were in Sioux City/Dakota Woodbury Counties, IA at one percent and Sullivan County, NY at two percent.
• The Nebraska BoS had the lowest rates of unsheltered individuals, at five percent. Iowa BoS also reported low rates, at six percent.
EXHIBIT 2 .8: Homeless Individuals By CoC Category and Sheltered Status, 2017
All HomelessIndividuals
ShelteredIndividuals
UnshelteredIndividuals
0% 100%
52.1
48.4
56.1 32.7
37.6
35.3 12.7
14.1
11.1
Major Cities
Smaller City, County, and Regional CoCs
Balance of State and Statewide CoCs
Data source: PIT 2007–2017; Excludes Puerto Rico and U.S. territories
Continuums of Care (CoC) Were Divided into Three Geographic CategoriesMajor city CoCs (n=48) cover the 50 largest cities in the United States. In two cases (Phoenix and Mesa, AZ, and Arlington and Fort Worth, TX), two large cities were located in the same CoC.Smaller city, county, and regional CoCs (n=306) are jurisdictions that are neither one of the 50 largest cities in the United States nor Balance of State and Statewide CoCs.Balance of State (BoS) and statewide CoCs (n=40) are typically composed of multiple rural counties or represent an entire state.
The 2017 Annual Homeless Assessment Report to Congress: Part 1
29
EXHIBIT 2 .10: CoCs with the Highest and Lowest Rates of Unsheltered Homeless Individuals By CoC Category, 2017
Major City CoCs Smaller City, County, and Regional CoCsa
Balance of State and Statewide CoCs
CoC Total Individuals
% Unsheltered CoC Total
Individuals%
Unsheltered CoC Total Individuals
% Unsheltered
Highest Rates
Fresno/Madera County, CA 1,742 87 .8
Hendry, Hardee, Highlands Counties, FL
377 97 .6 Hawaii Balance of State 1,423 82 .8
Los Angeles City & County, CA 47,082 84 .3 Inyo, Mono, Alpine
Counties, CA 102 97 .1 Georgia Balance of State 2,219 76 .8
San Jose/Santa Clara City & County, CA 6,319 81 .5 Lake County, CA 294 96 .6 Nevada Balance
of State 180 75 .0
Oakland/Alameda County, CA 4,918 78 .0
Ft . Walton Beach/Okaloosa, Walton Counties, FL
247 94 .3 Oklahoma Balance of State 151 72 .2
San Diego City & County, CA 7,571 70 .4 Imperial County, CA 1,034 94 .2 Oregon Balance
of State 3,902 65 .5
Lowest Rates
Omaha/Council Bluffs, NE 1,037 5 .5
Sioux City/Dakota, Woodbury Counties, IA
159 1 .3 Nebraska Balance of State 276 5 .1
Boston, MA 2,492 7 .5 Sullivan County, NY 114 1 .8 Iowa Balance of State 807 6 .2
Memphis/Shelby County, TN 915 8 .6 Monroe City &
County, MI 122 2 .5 Maine Balance of State 1,352 8 .0
Indianapolis, IN 1,283 9 .8 Bergen County, NJ 182 2 .7 Delaware Statewide 615 8 .5
New York, NY 31,124 12 .6 Somerset County, NJ 176 2 .8 Rhode Island
Statewide 802 8 .6
Excludes CoCs with less than 100 total homeless people.
EXHIBIT 2 .9: CoCs with the Largest Numbers of Homeless Individuals By CoC Category, 2017
Major City CoCs Smaller City, County, and Regional CoCs
Balance of State and Statewide CoCs
CoC Total Individuals CoC Total
Individuals CoC Total Individuals
Los Angeles City & County, CA 47,082 Santa Ana/Anaheim/Orange County, CA 3,527 Texas Balance of State 4,808
New York City, NY 31,124 Honolulu, HI 3,112 Oregon Balance of State 3,902
Seattle/King County, WA 8,810 Salinas/Monterey, San Benito Counties, CA 2,719 Washington Balance of State 2,875
San Diego City and County, CA 7,571 Santa Rosa/Petaluma/Sonoma County, CA 2,509 Colorado Balance of State 2,568
San Jose/Santa Clara City & County, CA 6,319 St . Petersburg/Clearwater/
Largo/Pinellas County, FL 2,466 Indiana Balance of State 2,340
San Francisco, CA 6,257 Riverside City & County, CA 2,172 Georgia Balance of State 2,219
Las Vegas/Clark County, NV 6,190 Ft . Lauderdale/Broward County, FL 2,037 North Carolina Balance of State 1,911
Oakland/Alameda County, CA 4,918 Watsonville/Santa Cruz City & County, CA 1,846 Ohio Balance of State 1,779
Denver, CO 4,031 San Bernardino City & County, CA 1,432 Connecticut Balance of State 1,778
Phoenix/Mesa/Maricopa County, AZ 3,805 Santa Maria/Santa Barbara
County, CA 1,422 Wisconsin Balance of State 1,499

30
1National Estimates Homelessness in the United States2 Data source: PIT 2007–2017; Excludes Puerto Rico and U.S. territories
Estimates by CoCHomeless Individuals
Between 2016 and 2017, individual homelessness increased by nine percent (15,540 people) in the nation’s major cities . Los Angeles accounted for 60% of this increase .
Changes Over Time• Between 2016 and 2017 individual homelessness
increased by nine percent (15,540 people) in the nation’s major cities. This increase was driven by a 22 percent increase in unsheltered individuals (17,663 more people). Los Angeles accounted for half (8,758) of the entire increase in unsheltered individuals.
• After Los Angeles, New York reported the second largest increase, with 2,159 more individuals experiencing homelessness. This increase was evenly split between people staying in sheltered and unsheltered locations.
• Smaller cities, counties, and regional CoCs saw a slight decline in the number of people experiencing homelessness as individuals (1% or 1,253 fewer people) since 2016. There was a three percent decline in the number of sheltered individuals (2,499 fewer people), which offset a two percent increase (1,246 more people) in the number of unsheltered individuals.
• In BoS and statewide CoCs, individual homelessness from 2016 to 2017 remained flat.
• From 2007 to 2017, smaller cities, counties, and regional CoCs experienced the largest declines in the number of homeless individuals, with 34,203 fewer people (or 21%). The number of unsheltered individuals in this CoC category declined by 27 percent (or 21,334) during the same time period.
• BoS and statewide CoCs experienced declines in homeless individuals between 2007 and 2017, with 13 percent fewer homeless individuals, nine percent fewer sheltered individuals, and 17 percent fewer unsheltered individuals in 2017 than in 2007.
• The number of homeless individuals in major cities in 2017 was slightly lower than the number of homeless individuals in 2007 (1% fewer people). However, in recent years the number of homeless individuals, unsheltered individuals in particular, in major cities has risen sharply. In 2017 there were only two percent more unsheltered individuals in major cities than there were in 2007 but 47 percent more than there were in 2014, the year after which the number began to rise.

The 2017 Annual Homeless Assessment Report to Congress: Part 1
31
EXHIBIT 2 .12: Change in Numbers of Homeless IndividualsBy Sheltered Status and CoC Category, 2016–2017
Total Change Sheltered Change Unsheltered Change
# % # % # %
Major Cities 15,540 8 .9 -2,123 -2 .2 17,663 22 .3
Smaller City, County, and Regional CoCs
-1,253 -1 .0 -2,499 -3 .3 1,246 2 .3
Balance of State and Statewide CoCs -17 0 .0 -159 -0 .6 142 0 .7
EXHIBIT 2 .11: Individuals Experiencing HomelessnessBy CoC Category and Sheltered Status, 2007–2017
0
20000
40000
60000
80000
100000
120000
Balance of State and Statewide CoCs, Unsheltered
Balance of State and Statewide CoCs, Sheltered
Smaller Cities, Counties, and Regional CoCs, Unsheltered
Smaller Cities, Counties, and Regional CoCs, Sheltered
Major Cities, Unsheltered
Major Cities, Sheltered
2007 2008 2009 2010 2011 2012 2013 2014 2015 2016 2017
96,989
95,14885,071 83,568 83,583
80,52478,848
72,202
73,69677,949
74,52277,091
66,33856,927 56,615
29,760
23,07824,587
27,10424,941
19,024 19,241
29,775 28,404 28,828 28,54227,013
75,413 70,73173,420
97,038101,432
92,943 92,602
97,118
93,039
32
1National Estimates Homelessness in the United States3National Estimates Homeless Families with Children
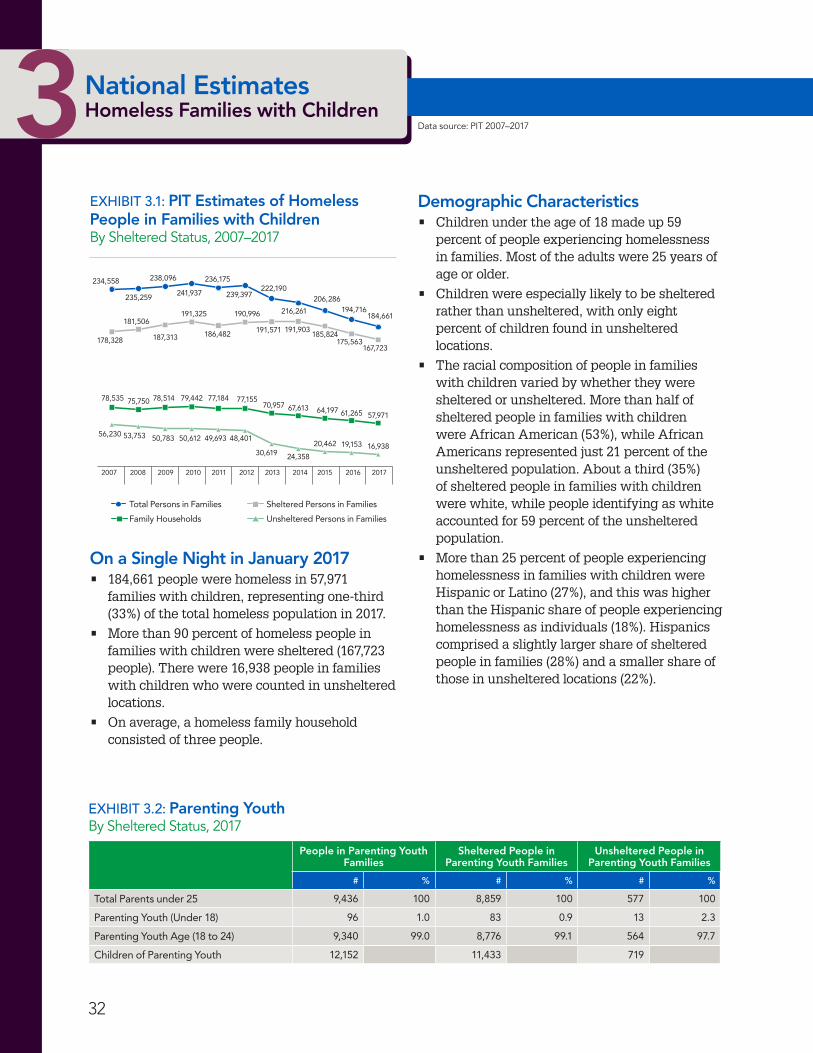
EXHIBIT 3 .1: PIT Estimates of Homeless People in Families with Children By Sheltered Status, 2007–2017
Demographic Characteristics• Children under the age of 18 made up 59
percent of people experiencing homelessness in families. Most of the adults were 25 years of age or older.
• Children were especially likely to be sheltered rather than unsheltered, with only eight percent of children found in unsheltered locations.
• The racial composition of people in families with children varied by whether they were sheltered or unsheltered. More than half of sheltered people in families with children were African American (53%), while African Americans represented just 21 percent of the unsheltered population. About a third (35%) of sheltered people in families with children were white, while people identifying as white accounted for 59 percent of the unsheltered population.
• More than 25 percent of people experiencing homelessness in families with children were Hispanic or Latino (27%), and this was higher than the Hispanic share of people experiencing homelessness as individuals (18%). Hispanics comprised a slightly larger share of sheltered people in families (28%) and a smaller share of those in unsheltered locations (22%).
2007 2008 2009 2010 20122011 2013 2014 2015 2016 2017
234,558
235,259
78,535 75,750 78,514 79,442 77,184 77,155
49,693 48,40150,783 50,61256,230 53,753
70,957 67,613
30,619 24,358
64,197
20,462 19,153
57,97161,265
16,938
178,328
181,506
187,313
191,325
186,482
190,996
191,571 191,903185,824
175,563167,723
238,096
241,937
236,175
239,397 206,286194,716
222,190
216,261184,661
Sheltered Persons in Families
Family Households
Total Persons in Families
Unsheltered Persons in Families
0
50000
100000
150000
200000
250000
Data source: PIT 2007–2017
On a Single Night in January 2017• 184,661 people were homeless in 57,971
families with children, representing one-third (33%) of the total homeless population in 2017.
• More than 90 percent of homeless people in families with children were sheltered (167,723 people). There were 16,938 people in families with children who were counted in unsheltered locations.
• On average, a homeless family household consisted of three people.
EXHIBIT 3 .2: Parenting Youth By Sheltered Status, 2017
People in Parenting Youth Families
Sheltered People in Parenting Youth Families
Unsheltered People in Parenting Youth Families
# % # % # %
Total Parents under 25 9,436 100 8,859 100 577 100
Parenting Youth (Under 18) 96 1 .0 83 0 .9 13 2 .3
Parenting Youth Age (18 to 24) 9,340 99 .0 8,776 99 .1 564 97 .7
Children of Parenting Youth 12,152 11,433 719

33
The 2017 Annual Homeless Assessment Report to Congress: Part 1
EXHIBIT 3 .4: Change in Number of Homeless People in Families with ChildrenBy Sheltered Status, 2007-2017
Change 2016-2017 Change 2010-2017 Change 2007-2017
# % # % # %
Persons in families -10,055 -5 .2 -57,276 -23 .7 -49,897 -21 .3
Sheltered -7,840 -4 .5 -23,602 -12 .3 -10,605 -5 .9
Unsheltered -2,215 -11 .6 -33,674 -66 .5 -39,292 -69 .9
Family households -3,294 -5 .4 -21,471 -27 .0 -20,564 -26 .2
EXHIBIT 3 .5: Change in Numbers of Homeless People in Families with Children By Age and Sheltered Status, 2016–2017
Total Change Sheltered Change Unsheltered Change
# % # % # %
Under 18 -6,987 -6 .0 -5,451 -5 .1 -1,536 -14 .9
18 to 24 -742 -4 .6 -1,059 -7 .1 317 25 .6
Over 24 -2,326 -3 .8 -1,330 -2 .5 -996 -13 .1
EXHIBIT 3 .3: Demographic Characteristics of Homeless People in Families with Children2017
CharacteristicAll Homeless People in Families Sheltered People in Families Unsheltered People in Families
# % # % # %
People in Families with Children
184,661 100 167,723 100 16,938 100
Age
Under 18 109,719 59.4 100,960 60.2 8,759 51.7
18 – 24 15,408 8.3 13,851 8.3 1,557 9.2
Over 24 59,534 32.2 52,912 31.5 6,622 39.1
Gender
Female 111,394 60.3 102,589 61.2 8,805 52.0
Male 73,027 39.5 64,971 38.7 8,056 47.6
Transgender 85 0.0 70 0.0 15 0.1
Don’t identify as male, female, or transgender 155 0.1 93 0.1 62 0.4
Ethnicity
Non-Hispanic 134,363 72.8 121,175 72.2 13,188 77.9
Hispanic 50,298 27.2 46,548 27.8 3,750 22.1
Race
White 68,308 37.0 58,266 34.7 10,042 59.3
African American 92,538 50.1 88,934 53.0 3,604 21.3
Asian 1,919 1.0 1,695 1.0 224 1.3
Native American 4,548 2.5 3,939 2.3 609 3.6
Pacific Islander 4,302 2.3 2,954 1.8 1,348 8.0
Multiple Races 13,046 7.1 11,935 7.1 1,111 6.6
34
1National Estimates Homelessness in the United States3National Estimates Homeless Families with Children
Additional Characteristics• Only five percent of homeless people in families
with children were in households with chronic patterns of homelessness (8,457 people). Those with chronic patterns of homelessness were more likely to be unsheltered than people in homeless families overall, with three in ten (29% or 2,477 people) currently staying in unsheltered locations.
• Approximately 17 percent of people in families who were under the age of 25 were people in parenting youth households. Nearly all of these parents (99%) were between 18 and 24 years of age.2
• Only six percent of people in families with a parent under 25 were found in unsheltered locations.
Since 2016• The number of homeless people in families with
children counted on a single night declined by five percent (or 10,055 people) between 2016 and 2017, as did the number of homeless family households (3,294 households).
• Declines occurred among both sheltered people in families with children (by 5% or 7,840 people) and unsheltered people in families with children (by 12% or 2,215 people).
• Between 2016 and 2017, family homelessness declined across all age groups, and the number of family members found in unsheltered locations declined for most, but not all, age groups. The number of children experiencing unsheltered homelessness with their parents declined by 15 percent. The only age group to experience an increase in unsheltered homelessness was people between the ages 18 and 24, an increase of 317 people or 26 percent. People in this age group may be the parent of
2 96 people under the age of 18 and their children are included in this estimate. People under the age of 18 who are experiencing homelessness with their children are reported under “child-only” households, and are also included in the individuals section of this report. They are not included in the total number of people experiencing homelessness in families.
Data source: PIT 2007–2017
the family, or they may be young adults in a household that has both another adult and at least one child under 18.
• Between 2016 and 2017, the number of people in families with children experiencing homelessness who identified as Hispanic or Latino declined by 17 percent, or 10,469 fewer people, including an eight percent decline in unsheltered homelessness. While sheltered homelessness among Hispanics dropped, it increased for non-Hispanic or Latino people in families over the same time period (by 2% or 2,300 people).
• Homelessness increased among people in families who identified as African American (by 3%), while declining among people in families with children who identified as white (by 10%).
Since 2007• Over the last 10 years, the number of homeless
people in families dropped by 21 percent (49,897 fewer people), and the number of homeless family households dropped by 26 percent (20,564 family households).
• This decline was driven by a substantial drop in the number of people counted in families with children staying in unsheltered locations. Between 2007 and 2017, the number of unsheltered people in families with children declined by 70 percent (or 39,292 people). The number of people in families with children staying in sheltered locations also declined, though by a more modest margin (by 6% or 10,605 people).

The 2017 Annual Homeless Assessment Report to Congress: Part 1
35
36
1National Estimates Homelessness in the United States3National Estimates Homeless Families with Children
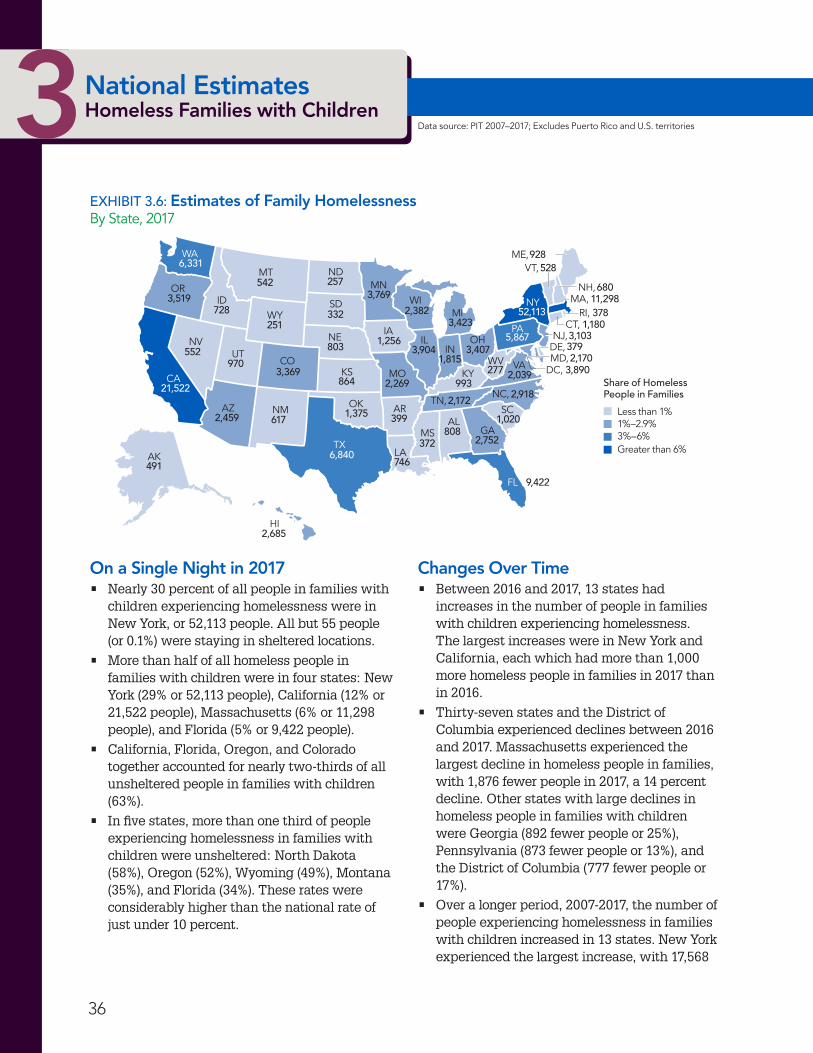
EXHIBIT 3 .6: Estimates of Family Homelessness By State, 2017
On a Single Night in 2017• Nearly 30 percent of all people in families with
children experiencing homelessness were in New York, or 52,113 people. All but 55 people (or 0.1%) were staying in sheltered locations.
• More than half of all homeless people in families with children were in four states: New York (29% or 52,113 people), California (12% or 21,522 people), Massachusetts (6% or 11,298 people), and Florida (5% or 9,422 people).
• California, Florida, Oregon, and Colorado together accounted for nearly two-thirds of all unsheltered people in families with children (63%).
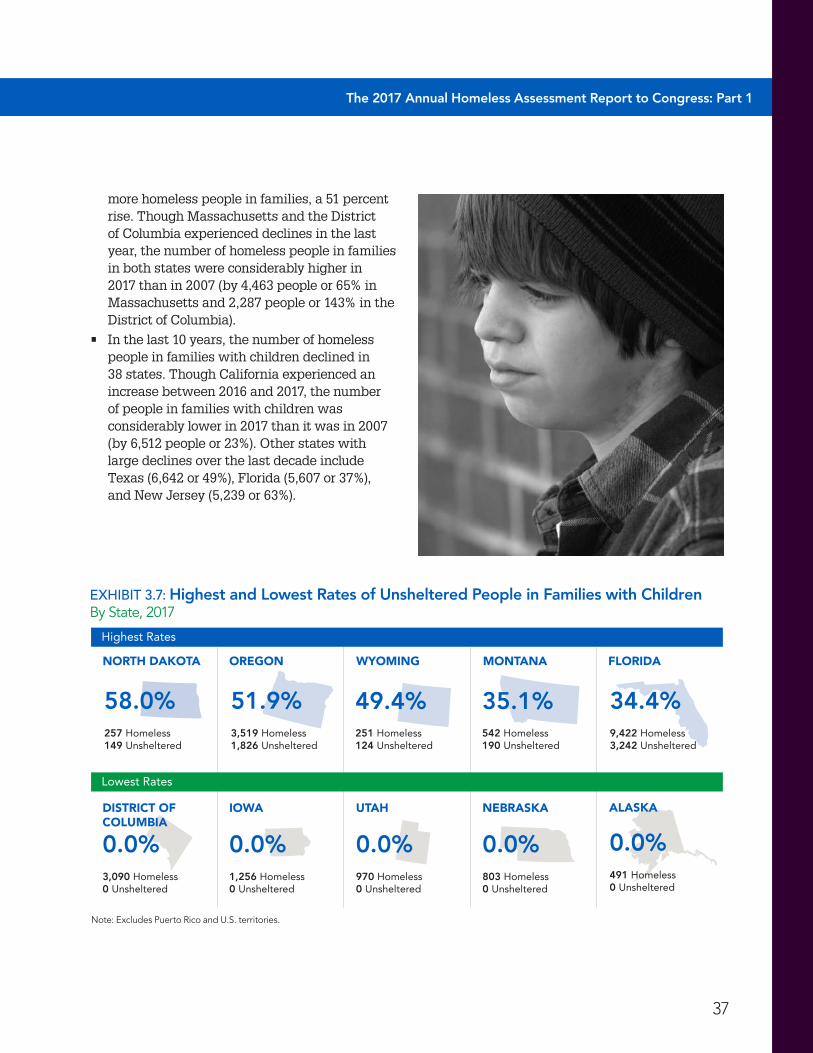
• In five states, more than one third of people experiencing homelessness in families with children were unsheltered: North Dakota (58%), Oregon (52%), Wyoming (49%), Montana (35%), and Florida (34%). These rates were considerably higher than the national rate of just under 10 percent.
3793,103
2,1703,407
3,423
3,890
9,422
277 2,039
2,918
1,8153,904
2,172
993
1,020
2,752
399808
37811,298
1,1805,867
52,113
680
528928
372
746
ME,
NH,
VT,
NY MA,RI,
CT,NJ,
DE,
DC,
PA
VAWV
NC,
SC
GA
FL
AL
TN,
KY
OHIL
MIWI
MN
IA
MO
AR
LATX
OK
KS
NE
SD
NDMT
WA
OR
CA
AK
HI
WY
CO
NMAZ
UTNV
ID
IN
MS
MD,
Share of Homeless People in Families
Less than 1%1%–2.9%
Greater than 6%3%–6%
251
3,369
617
491
257542
728
970
2,459
552
3,519
6,331
21,522
6,840
332
803 1,256
2,382
3,769
2,269864
1,375
2,685
Changes Over Time• Between 2016 and 2017, 13 states had
increases in the number of people in families with children experiencing homelessness. The largest increases were in New York and California, each which had more than 1,000 more homeless people in families in 2017 than in 2016.
• Thirty-seven states and the District of Columbia experienced declines between 2016 and 2017. Massachusetts experienced the largest decline in homeless people in families, with 1,876 fewer people in 2017, a 14 percent decline. Other states with large declines in homeless people in families with children were Georgia (892 fewer people or 25%), Pennsylvania (873 fewer people or 13%), and the District of Columbia (777 fewer people or 17%).
• Over a longer period, 2007-2017, the number of people experiencing homelessness in families with children increased in 13 states. New York experienced the largest increase, with 17,568
Data source: PIT 2007–2017; Excludes Puerto Rico and U.S. territories
37
The 2017 Annual Homeless Assessment Report to Congress: Part 1
EXHIBIT 3 .7: Highest and Lowest Rates of Unsheltered People in Families with ChildrenBy State, 2017
OREGON
DISTRICT OF COLUMBIA
3,090 Homeless0 Unsheltered
0.0%
3,519 Homeless1,826 Unsheltered
51.9%
NORTH DAKOTA
257 Homeless149 Unsheltered
58.0%
FLORIDA
9,422 Homeless3,242 Unsheltered
34.4%251 Homeless124 Unsheltered
49.4%
WYOMING
542 Homeless190 Unsheltered
35.1%
MONTANA
491 Homeless0 Unsheltered
0.0%
ALASKAIOWA
803 Homeless0 Unsheltered
0.0%1,256 Homeless0 Unsheltered
0.0%
UTAH
970 Homeless0 Unsheltered
0.0%
NEBRASKA
Lowest Rates
Highest Rates
more homeless people in families, a 51 percent rise. Though Massachusetts and the District of Columbia experienced declines in the last year, the number of homeless people in families in both states were considerably higher in 2017 than in 2007 (by 4,463 people or 65% in Massachusetts and 2,287 people or 143% in the District of Columbia).
• In the last 10 years, the number of homeless people in families with children declined in 38 states. Though California experienced an increase between 2016 and 2017, the number of people in families with children was considerably lower in 2017 than it was in 2007 (by 6,512 people or 23%). Other states with large declines over the last decade include Texas (6,642 or 49%), Florida (5,607 or 37%), and New Jersey (5,239 or 63%).
Note: Excludes Puerto Rico and U.S. territories.

38
1National Estimates Homelessness in the United States3State Estimates Homeless Families with Children
Data source: PIT 2007–2017; Excludes Puerto Rico and U.S. territories
Approximately 17 percent of people in families who were under the age of 25 were people in parenting youth households
EXHIBIT 3 .8: Largest Changes in Homeless People in Families with ChildrenBy State, 2007–2017
2016–2017 2007–2017Largest Increases
NEW YORK 1,076 / 2 .1% NEW YORK 17,568 / 50 .9%
CALIFORNIA 1,040 / 5 .1% MASSACHUSETTS 4,463 / 65 .3%
OKLAHOMA 265 / 23 .9% DISTRICT OF COLUMBIA 2,287 / 142 .7%
NEW HAMPSHIRE 141 / 26 .2% OKLAHOMA 136 / 11 .0%
MINNESOTA 97 / 2 .6% MISSISSIPPI 110 / 42 .0%Largest Decreases*
MASSACHUSETTS -1,876 / -14 .2% TEXAS -6,642 / -49 .3%
GEORGIA -892 / -24 .5% CALIFORNIA -6,512 / -23 .2%
PENNSYLVANIA -873 / -13 .0% FLORIDA -5,607 / -37 .3%
DISTRICT OF COLUMBIA -777 / -16 .6% NEW JERSEY -5,239 / -62 .8%
COLORADO -731 / -17 .8% GEORGIA -4,366 / -61 .3%a Due to methodological changes, Michigan was excluded from the list of largest decreases from 2007-2017.

The 2017 Annual Homeless Assessment Report to Congress: Part 1
39
40
1National Estimates Homelessness in the United States3Estimates by CoC Homeless Families with Children
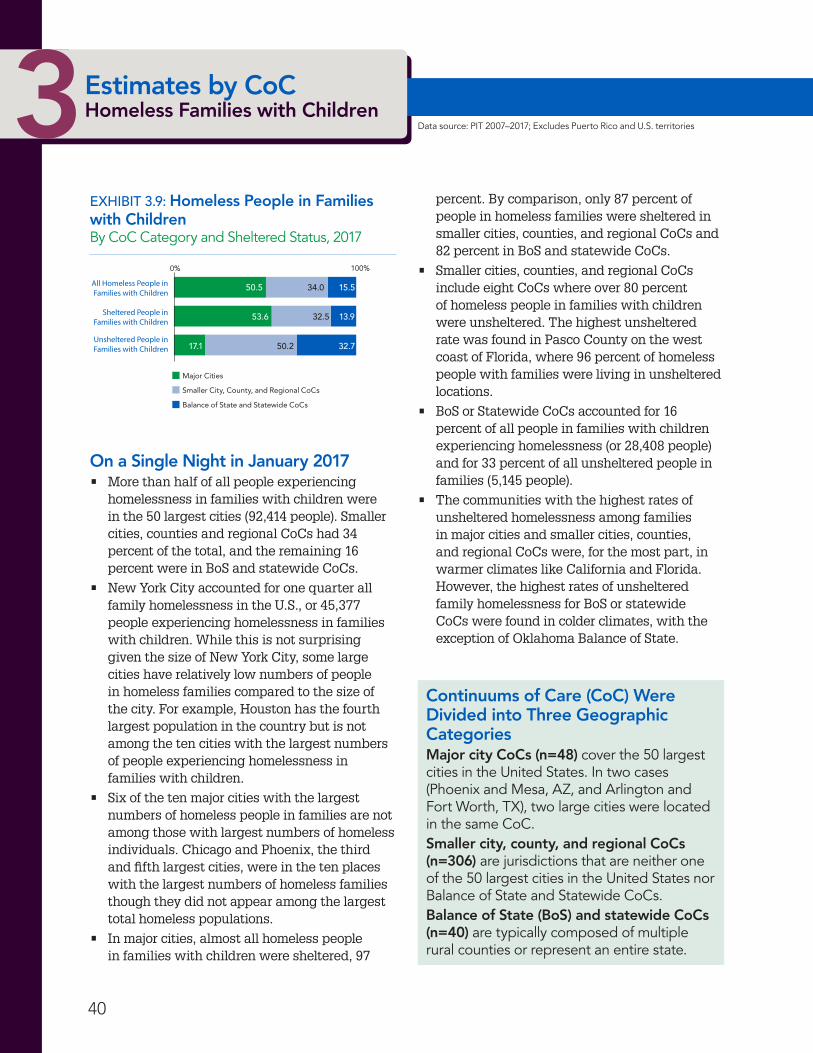
On a Single Night in January 2017• More than half of all people experiencing
homelessness in families with children were in the 50 largest cities (92,414 people). Smaller cities, counties and regional CoCs had 34 percent of the total, and the remaining 16 percent were in BoS and statewide CoCs.
• New York City accounted for one quarter all family homelessness in the U.S., or 45,377 people experiencing homelessness in families with children. While this is not surprising given the size of New York City, some large cities have relatively low numbers of people in homeless families compared to the size of the city. For example, Houston has the fourth largest population in the country but is not among the ten cities with the largest numbers of people experiencing homelessness in families with children.
• Six of the ten major cities with the largest numbers of homeless people in families are not among those with largest numbers of homeless individuals. Chicago and Phoenix, the third and fifth largest cities, were in the ten places with the largest numbers of homeless families though they did not appear among the largest total homeless populations.
• In major cities, almost all homeless people in families with children were sheltered, 97
percent. By comparison, only 87 percent of people in homeless families were sheltered in smaller cities, counties, and regional CoCs and 82 percent in BoS and statewide CoCs.
• Smaller cities, counties, and regional CoCs include eight CoCs where over 80 percent of homeless people in families with children were unsheltered. The highest unsheltered rate was found in Pasco County on the west coast of Florida, where 96 percent of homeless people with families were living in unsheltered locations.
• BoS or Statewide CoCs accounted for 16 percent of all people in families with children experiencing homelessness (or 28,408 people) and for 33 percent of all unsheltered people in families (5,145 people).
• The communities with the highest rates of unsheltered homelessness among families in major cities and smaller cities, counties, and regional CoCs were, for the most part, in warmer climates like California and Florida. However, the highest rates of unsheltered family homelessness for BoS or statewide CoCs were found in colder climates, with the exception of Oklahoma Balance of State.
Data source: PIT 2007–2017; Excludes Puerto Rico and U.S. territories
EXHIBIT 3 .9: Homeless People in Families with Children By CoC Category and Sheltered Status, 2017
0 100
Balance of State and Statewide CoCs
Smaller Cities, Counties, and Regional CoCs
Major Cities
Share of Unsheltered People in Families with Children
Share of Sheltered People in Families with Children
Share of All Homeless People in Families with Children
Unsheltered People in Families with Children
Sheltered People in Families with Children
All Homeless People in Families with Children
0% 100%
50.5
53.6
17.1 50.2
32.5
34.0 15.5
13.9
32.7
Major Cities
Smaller City, County, and Regional CoCs
Balance of State and Statewide CoCs
Continuums of Care (CoC) Were Divided into Three Geographic CategoriesMajor city CoCs (n=48) cover the 50 largest cities in the United States. In two cases (Phoenix and Mesa, AZ, and Arlington and Fort Worth, TX), two large cities were located in the same CoC.Smaller city, county, and regional CoCs (n=306) are jurisdictions that are neither one of the 50 largest cities in the United States nor Balance of State and Statewide CoCs.Balance of State (BoS) and statewide CoCs (n=40) are typically composed of multiple rural counties or represent an entire state.

41
The 2017 Annual Homeless Assessment Report to Congress: Part 1
Nearly 30 percent of all people in families with children experiencing
homelessness were in New York .
EXHIBIT 3 .10: CoCs with the Largest Numbers of Homeless People in Families with Children By CoC Category, 2017
Major City CoCs Smaller City, County, and Regional CoCs Balance of State and Statewide CoCs
CoC # of People in Families CoC # of People
in Families CoC # of People in Families
New York City, NY 45,377 Nassau, Suffolk Counties/Babylon/Islip/ Huntington, NY 2,943 Texas Balance of State 2,345
Los Angeles City & County, CA 8,106 Springfield, MA 1,941 Oregon Balance of State 1,893
District of Columbia 3,890 Honolulu, HI 1,847 Wisconsin Balance of State 1,849
Boston, MA 3,643 Pasco County, FL 1,755 Washington Balance of State 1,796
Seattle/King County, WA 2,833 Santa Ana/Anaheim/Orange County, CA 1,265 Massachusetts Balance of
State1,564
Philadelphia, PA 2,352 Yonkers/Mount Vernon/New Rochelle/Westchester, NY 1,163 Ohio Balance of State 1,530
Chicago, IL 1,933 Fort Pierce/St . Lucie, Indian River, Martin Counties, FL 982 Georgia Balance of State 1,497
Phoenix/Mesa/Maricopa County Regional, AZ 1,800 Eastern Pennsylvania 961 Colorado Balance of State 1,451
Minneapolis/Hennepin County, MN 1,662 Worcester City & County, MA 923 Indiana Balance of State 1,315
San Diego City and County, CA 1,589 Newark/Essex County, NJ 795 North Carolina Balance of
State 1,143

42
1National Estimates Homelessness in the United States3Estimates by CoC Homeless Families with Children
EXHIBIT 3 .11: CoCs with the Highest and Lowest Rates of Unsheltered Homeless People in Families with Children By CoC Category, 2017
Major City CoCs Smaller City, County, and Regional CoCs
Balance of State and Statewide CoCs
CoC
Total Homeless People in Families
% Unsheltered CoC
Total Homeless People in Families
% Unsheltered CoC
Total Homeless People in Families
% Unsheltered
Highest Rates
San Jose/Santa Clara City & County, CA
1,075 27 .5% Pasco County, FL 1,755 96 .3% Oklahoma Balance of State
281 65 .5%
Long Beach, CA 217 26 .3% El Dorado County, CA
156 88 .5% Oregon Balance of State
1,893 64 .1%
Los Angeles City & County, CA
8,106 18 .6% Fort Pierce/St . Lucie, Indian River, Martin Counties, FL
982 88 .0% Colorado Balance of State
1,451 62 .6%
San Diego City and County, CA
1,589 18 .4% Northwest North Carolina
267 85 .4% North Dakota Statewide
257 58 .0%
Portland-Gresham-Multnomah County, OR
657 11 .7% Central Oregon 284 83 .8% Wyoming Statewide
251 49 .4%
Lowest Rates
New York City CoC 45,377 0 .0% Nassau, Suffolk Counties/Babylon/Islip/ Huntington, NY
2,943 0 .0% Massachusetts Balance of State
1,564 0 .0%
District of Columbia CoC
3,890 0 .0% Springfield, MA 1,941 0 .0% Iowa Balance of State
985 0 .0%
Boston CoC, MA 3,643 0 .0% Yonkers/Mount Vernon/New Rochelle/Westchester, NY
1,163 0 .0% Kansas Balance of State
429 0 .0%
Miami/Dade County CoC, FL
1,175 0 .0% Quincy/Brockton/Weymouth/Plymouth City and County, MA
750 0 .0% Rhode Island Statewide
378 0 .0%
Memphis/Shelby County CoC, TN
511 0 .0% Salt Lake City & County, UT
699 0 .0% Nebraska Balance of State
230 0 .0%
Data source: PIT 2007–2017; Excludes Puerto Rico and U.S. territories
Note: Excludes CoCs with fewer than 100 total homeless people.
Changes over Time• Between 2016 and 2017, the number of
homeless people in families with children declined in all three types of CoCs. The largest percentage change occurred in BoS or statewide CoCs (by 3,291 or 10%), followed by smaller cities, counties, and regional CoCs (by 5,133 people or 8%), with more modest declines in major cities (1,618 or 2%).
• New York City and Los Angeles have experienced considerable fluctuations in the number of homeless people in families in recent years. These two communities experienced the largest increases between 2014 and 2015, the largest declines in people experiencing homelessness in families with children between 2015 and 2016, and between 2016 and 2017 represented two of the top three increases. Los Angeles had the largest
Fort Pierce/St . Lucie, Indian River, Martin Counties, FL
1457 87 .2

The 2017 Annual Homeless Assessment Report to Congress: Part 1
43
increase between 2016 and 2017, with 1,978 more people (or 32%). In New York, there were 819 more people in families experiencing homelessness, a two percent increase.
• Over a longer time period, 2007-2017, sheltered homelessness among people in families in major cities increased by 14 percent (10,798 people). Sheltered homelessness declined in smaller cities, counties, and regional CoCs (by 23%) and in BoS and statewide CoCs (by 20%)
during the same time period.
• Over the last decade, unsheltered homelessness declined dramatically across CoC categories. Homelessness among people in families in major cities declined by 82 percent (12,182 fewer people), 69 percent in smaller cities, counties, and regional CoCs (or 17,470 people), and by 67 percent in BoS and statewides (or 10,231 people).
EXHIBIT 3 .13: Change in Numbers of Homeless People in Families with ChildrenBy Sheltered Status and CoC Category, 2016-2017
Total Change Sheltered Change Unsheltered Change
# % # % # %
Major Cities -1,618 -1 .7 -1,094 -1 .2 -524 -16 .3
Smaller Cities, Counties, and Regional CoCs -5,133 -7 .6 -5,040 -8 .5 -93 -1 .2
Balance of State and Statewide CoCs -3,291 -10 .4 -1,465 -5 .9 -1,826 -26 .2
0
20000
40000
60000
80000
100000
0
20000
40000
60000
80000
100000
Balance of State and Statewide CoCs, Unsheltered
Balance of State and Statewide CoCs, Sheltered
Smaller Cities, Counties, and Regional CoCs, Unsheltered
Smaller Cities, Counties, and Regional CoCs, Sheltered
Major Cities, Unsheltered
Major Cities, Sheltered
2007 2008 2009 2010 2011 2012 2013 2014 2015 2016 2017
78,922
72,001 71,70870,123
54,432
70,220
28,896
14,876
4,274 5,424 4,579 4,143 2,694
15,37617,727
19,794
7,176 6,4115,145
22,86128,067
17,669
8,801 7,910
25,380
29,461 29,48532,508
27,37323,263
64,933
82,44184,825
93,03391,48789,720
Balance of State and Statewide CoCs, Unsheltered
Balance of State and Statewide CoCs, Sheltered
Smaller Cities, Counties, and Regional CoCs, Unsheltered
Smaller Cities, Counties, and Regional CoCs, Sheltered
Major Cities, Unsheltered
Major Cities, Sheltered
EXHIBIT 3 .12: People in Families with Children Experiencing HomelessnessBy CoC Category and Sheltered Status, 2007–2017
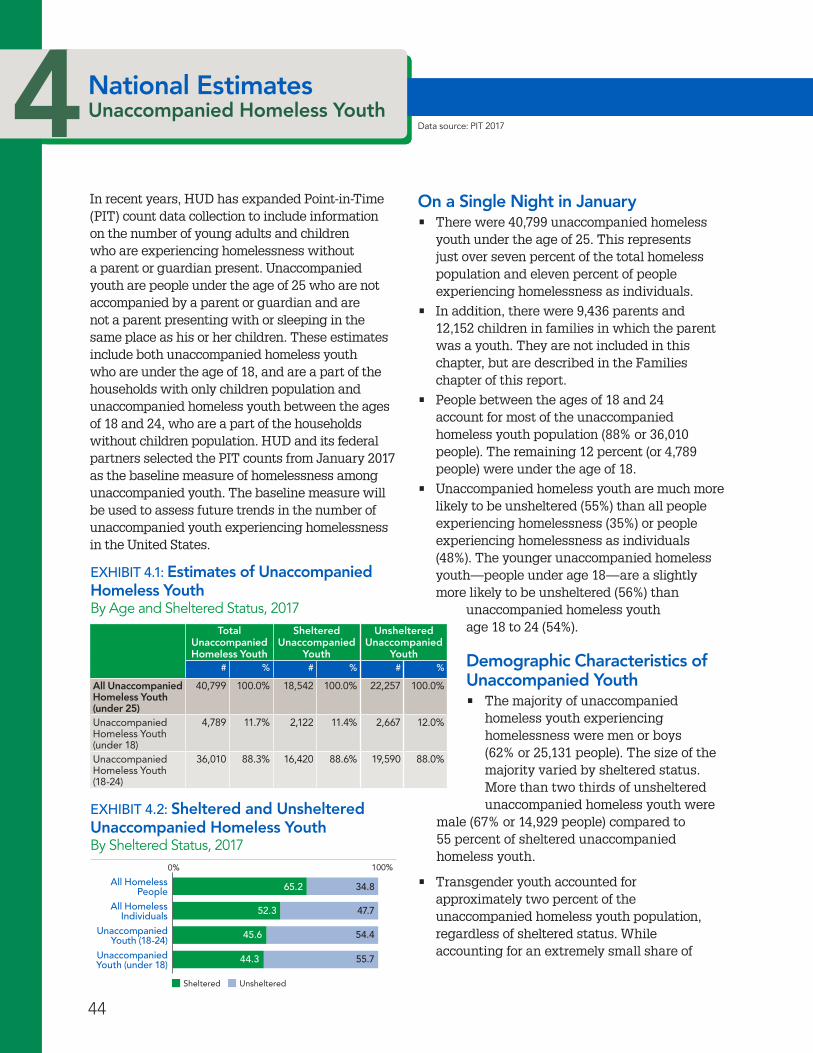
44
1National Estimates Homelessness in the United States4National Estimates Unaccompanied Homeless Youth
In recent years, HUD has expanded Point-in-Time (PIT) count data collection to include information on the number of young adults and children who are experiencing homelessness without a parent or guardian present. Unaccompanied youth are people under the age of 25 who are not accompanied by a parent or guardian and are not a parent presenting with or sleeping in the same place as his or her children. These estimates include both unaccompanied homeless youth who are under the age of 18, and are a part of the households with only children population and unaccompanied homeless youth between the ages of 18 and 24, who are a part of the households without children population. HUD and its federal partners selected the PIT counts from January 2017 as the baseline measure of homelessness among unaccompanied youth. The baseline measure will be used to assess future trends in the number of unaccompanied youth experiencing homelessness in the United States.
On a Single Night in January • There were 40,799 unaccompanied homeless
youth under the age of 25. This represents just over seven percent of the total homeless population and eleven percent of people experiencing homelessness as individuals.
• In addition, there were 9,436 parents and 12,152 children in families in which the parent was a youth. They are not included in this chapter, but are described in the Families chapter of this report.
• People between the ages of 18 and 24 account for most of the unaccompanied homeless youth population (88% or 36,010 people). The remaining 12 percent (or 4,789 people) were under the age of 18.
• Unaccompanied homeless youth are much more likely to be unsheltered (55%) than all people experiencing homelessness (35%) or people experiencing homelessness as individuals (48%). The younger unaccompanied homeless youth—people under age 18—are a slightly more likely to be unsheltered (56%) than
unaccompanied homeless youth age 18 to 24 (54%).
Demographic Characteristics of Unaccompanied Youth • The majority of unaccompanied homeless youth experiencing homelessness were men or boys (62% or 25,131 people). The size of the majority varied by sheltered status. More than two thirds of unsheltered unaccompanied homeless youth were
male (67% or 14,929 people) compared to 55 percent of sheltered unaccompanied homeless youth.
• Transgender youth accounted for approximately two percent of the unaccompanied homeless youth population, regardless of sheltered status. While accounting for an extremely small share of
EXHIBIT 4 .1: Estimates of Unaccompanied Homeless YouthBy Age and Sheltered Status, 2017
Total Unaccompanied Homeless Youth
Sheltered Unaccompanied
Youth
Unsheltered Unaccompanied
Youth# % # % # %
All Unaccompanied Homeless Youth (under 25)
40,799 100 .0% 18,542 100 .0% 22,257 100 .0%
Unaccompanied Homeless Youth (under 18)
4,789 11 .7% 2,122 11 .4% 2,667 12 .0%
Unaccompanied Homeless Youth (18-24)
36,010 88 .3% 16,420 88 .6% 19,590 88 .0%
Data source: PIT 2017
EXHIBIT 4 .2: Sheltered and Unsheltered Unaccompanied Homeless YouthBy Sheltered Status, 2017
0 100
Unsheltered
Sheltered
Unaccompanied Youth (under 18)
Unaccompanied Youth (18-24)
All Homeless Individuals
All Homeless People
UnaccompaniedYouth (under 18)
UnaccompaniedYouth (18-24)
All HomelessIndividuals
All HomelessPeople
0% 100%
65.2
52.3
44.3 55.7
47.7
45.6 54.4
34.8
Sheltered Unsheltered
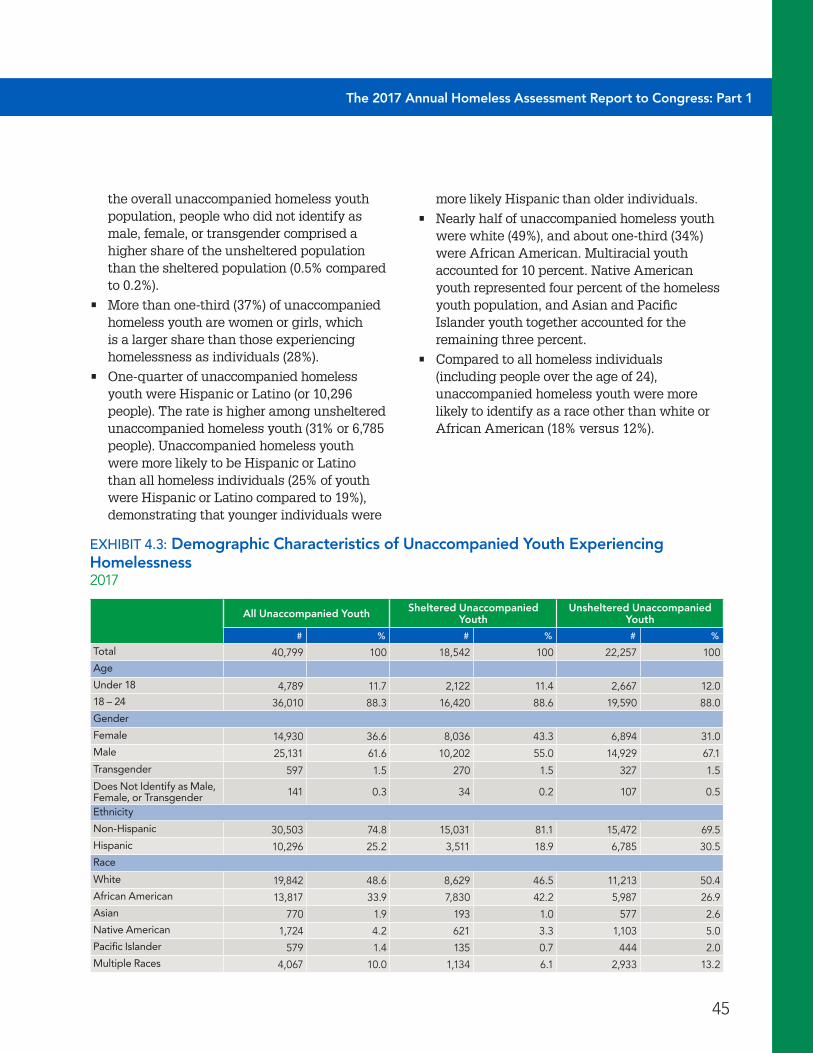
45
The 2017 Annual Homeless Assessment Report to Congress: Part 1
the overall unaccompanied homeless youth population, people who did not identify as male, female, or transgender comprised a higher share of the unsheltered population than the sheltered population (0.5% compared to 0.2%).
• More than one-third (37%) of unaccompanied homeless youth are women or girls, which is a larger share than those experiencing homelessness as individuals (28%).
• One-quarter of unaccompanied homeless youth were Hispanic or Latino (or 10,296 people). The rate is higher among unsheltered unaccompanied homeless youth (31% or 6,785 people). Unaccompanied homeless youth were more likely to be Hispanic or Latino than all homeless individuals (25% of youth were Hispanic or Latino compared to 19%), demonstrating that younger individuals were
more likely Hispanic than older individuals.
• Nearly half of unaccompanied homeless youth were white (49%), and about one-third (34%) were African American. Multiracial youth accounted for 10 percent. Native American youth represented four percent of the homeless youth population, and Asian and Pacific Islander youth together accounted for the remaining three percent.
• Compared to all homeless individuals (including people over the age of 24), unaccompanied homeless youth were more likely to identify as a race other than white or African American (18% versus 12%).
EXHIBIT 4 .3: Demographic Characteristics of Unaccompanied Youth Experiencing Homelessness2017
All Unaccompanied Youth Sheltered Unaccompanied Youth
Unsheltered Unaccompanied Youth
# % # % # %
Total 40,799 100 18,542 100 22,257 100Age
Under 18 4,789 11.7 2,122 11.4 2,667 12.018 – 24 36,010 88.3 16,420 88.6 19,590 88.0Gender
Female 14,930 36.6 8,036 43.3 6,894 31.0Male 25,131 61.6 10,202 55.0 14,929 67.1Transgender 597 1.5 270 1.5 327 1.5Does Not Identify as Male, Female, or Transgender 141 0.3 34 0.2 107 0.5
Ethnicity
Non-Hispanic 30,503 74.8 15,031 81.1 15,472 69.5Hispanic 10,296 25.2 3,511 18.9 6,785 30.5Race
White 19,842 48.6 8,629 46.5 11,213 50.4African American 13,817 33.9 7,830 42.2 5,987 26.9Asian 770 1.9 193 1.0 577 2.6Native American 1,724 4.2 621 3.3 1,103 5.0Pacific Islander 579 1.4 135 0.7 444 2.0Multiple Races 4,067 10.0 1,134 6.1 2,933 13.2
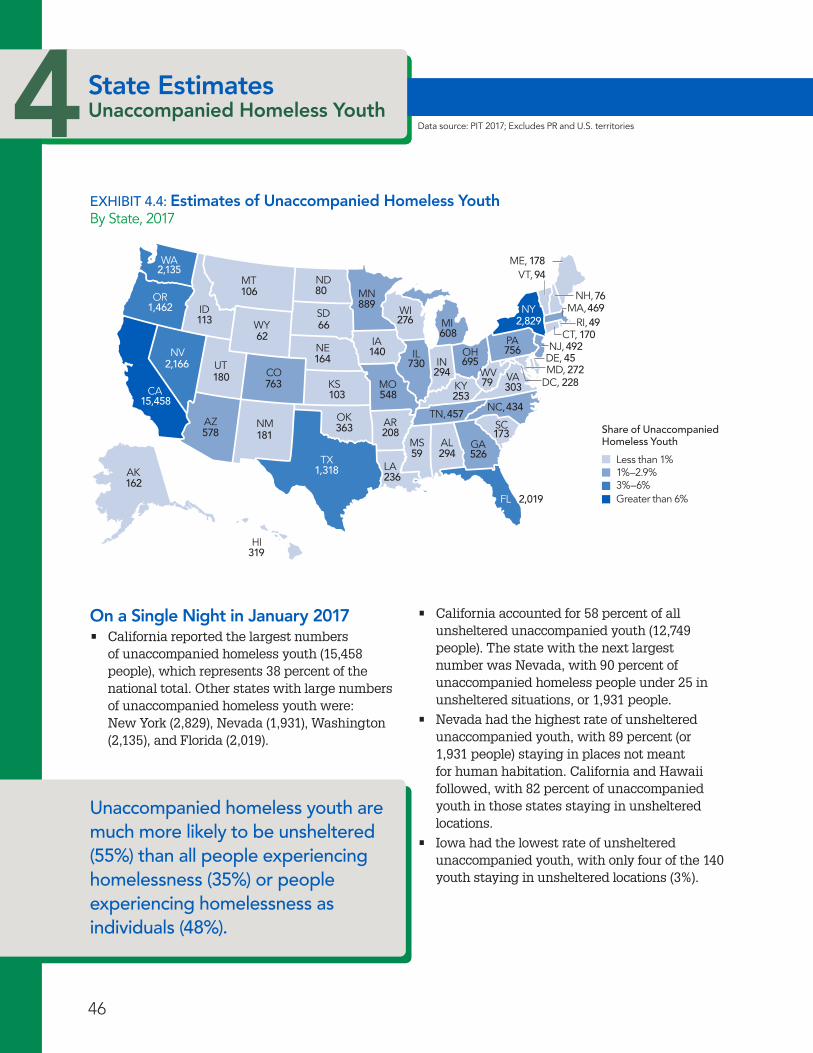
46
1National Estimates Homelessness in the United States4State Estimates Unaccompanied Homeless Youth
Data source: PIT 2017; Excludes PR and U.S. territories
On a Single Night in January 2017• California reported the largest numbers
of unaccompanied homeless youth (15,458 people), which represents 38 percent of the national total. Other states with large numbers of unaccompanied homeless youth were: New York (2,829), Nevada (1,931), Washington (2,135), and Florida (2,019).
EXHIBIT 4 .4: Estimates of Unaccompanied Homeless Youth By State, 2017
ME,
NH,
VT,
NY MA,RI,
CT,NJ,
DE,
DC,
PA
VAWV
NC,
SC
GA
FL
AL
TN,
KY
OHIL
MIWI
MN
IA
MO
AR
LATX
OK
KS
NE
SD
NDMT
WA
OR
CA
AK
HI
WY
CO
NMAZ
UTNV
ID
IN
MS
MD,
Share of Unaccompanied Homeless Youth
Less than 1%1%–2.9%
Greater than 6%3%–6%
62
763180
578
103
181
319
106
1131,462
2,135
1,318
15,458
66
140
276889
548
1642,166
363
80
45272
49
756
2,829170
492608
730
76
79253
457
526
303
434
228
2,019
294695
173
94178
469
59
236
294
208
162
• California accounted for 58 percent of all unsheltered unaccompanied youth (12,749 people). The state with the next largest number was Nevada, with 90 percent of unaccompanied homeless people under 25 in unsheltered situations, or 1,931 people.
• Nevada had the highest rate of unsheltered unaccompanied youth, with 89 percent (or 1,931 people) staying in places not meant for human habitation. California and Hawaii followed, with 82 percent of unaccompanied youth in those states staying in unsheltered locations.
• Iowa had the lowest rate of unsheltered unaccompanied youth, with only four of the 140 youth staying in unsheltered locations (3%).
Unaccompanied homeless youth are much more likely to be unsheltered (55%) than all people experiencing homelessness (35%) or people experiencing homelessness as individuals (48%) .
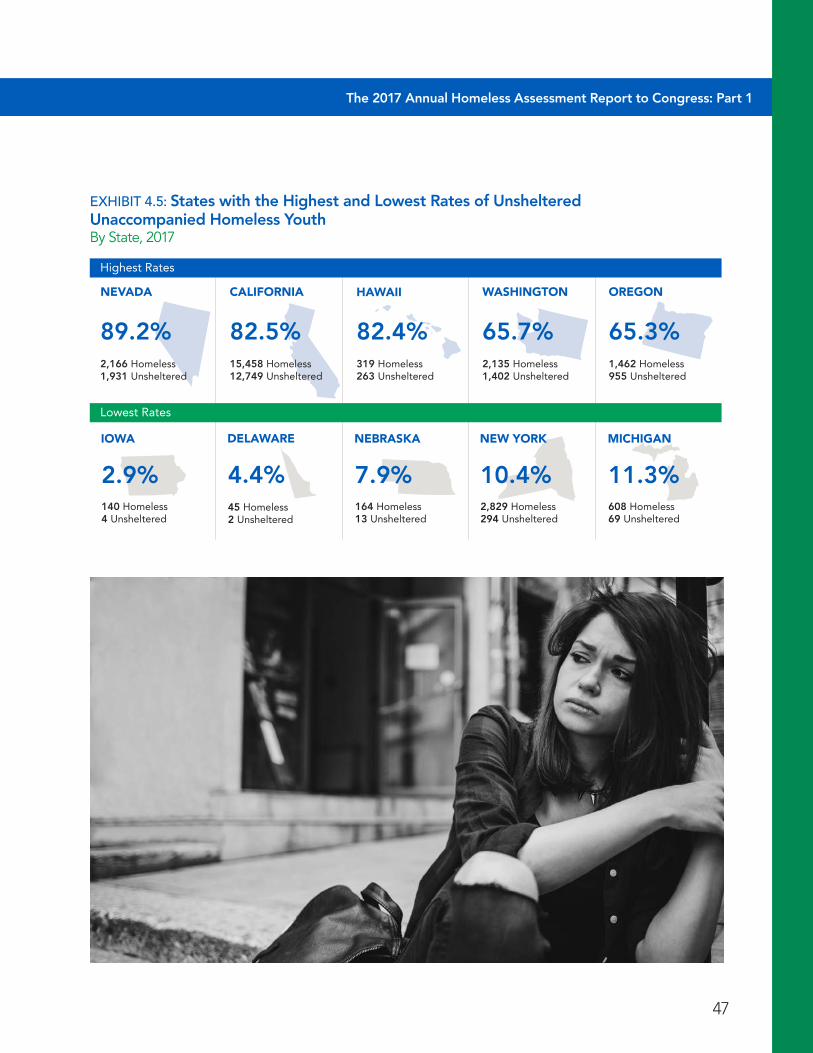
The 2017 Annual Homeless Assessment Report to Congress: Part 1
47
EXHIBIT 4 .5: States with the Highest and Lowest Rates of Unsheltered Unaccompanied Homeless YouthBy State, 2017
CALIFORNIA HAWAIINEVADA OREGON
2,166 Homeless1,931 Unsheltered
89.2%
140 Homeless4 Unsheltered
2.9%
319 Homeless263 Unsheltered
82.4%15,458 Homeless12,749 Unsheltered
82.5%1,462 Homeless955 Unsheltered
65.3%
WASHINGTON
2,135 Homeless1,402 Unsheltered
65.7%
IOWA
2,829 Homeless294 Unsheltered
10.4%
NEW YORK
608 Homeless69 Unsheltered
MICHIGAN
164 Homeless13 Unsheltered
7.9%
NEBRASKA
Lowest Rates
Highest Rates
45 Homeless2 Unsheltered
4.4%
DELAWARE
11.3%
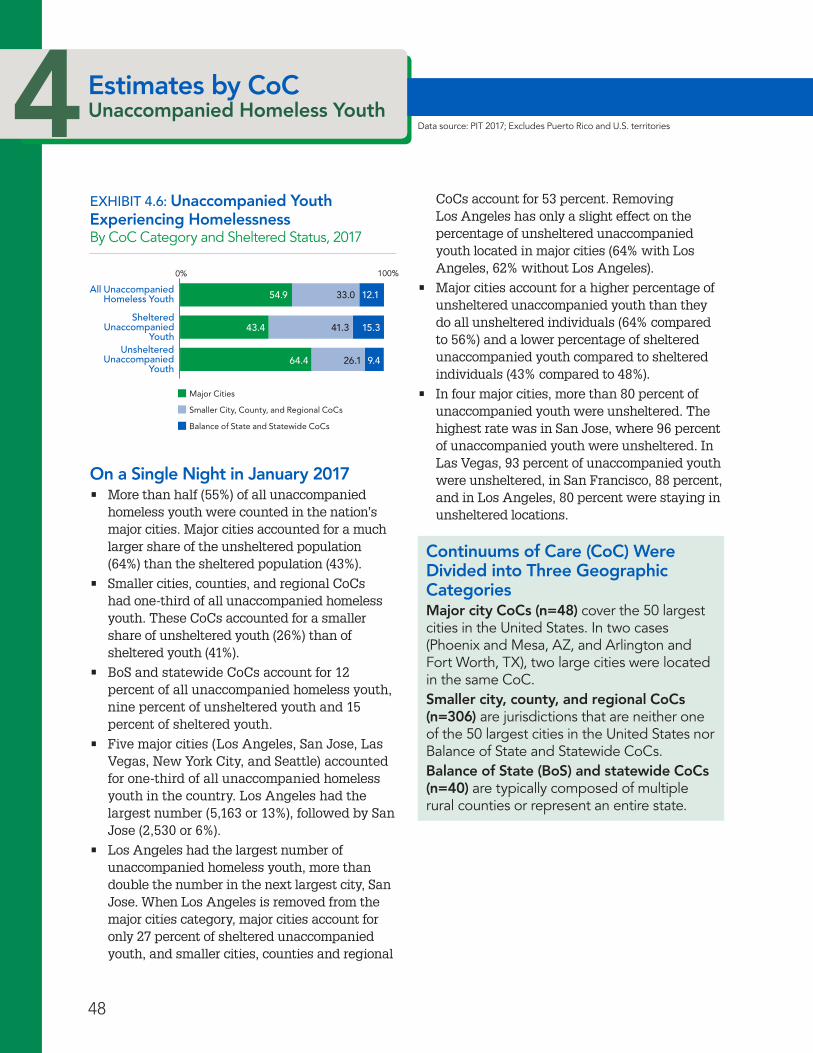
1National Estimates Homelessness in the United States4Estimates by CoCUnaccompanied Homeless Youth
EXHIBIT 4 .6: Unaccompanied Youth Experiencing Homelessness By CoC Category and Sheltered Status, 2017
0 100
Balance of State and Statewide CoCs
Smaller Cities, Counties, and Regional CoCs
Major Cities
All UnaccompaniedHomeless Youth
ShelteredUnaccompanied
YouthUnsheltered
UnaccompaniedYouth
0% 100%
54.9
43.4
64.4 26.1
41.3
33.0 12.1
15.3
9.4
Major Cities
Smaller City, County, and Regional CoCs
Balance of State and Statewide CoCs
On a Single Night in January 2017• More than half (55%) of all unaccompanied
homeless youth were counted in the nation’s major cities. Major cities accounted for a much larger share of the unsheltered population (64%) than the sheltered population (43%).
• Smaller cities, counties, and regional CoCs had one-third of all unaccompanied homeless youth. These CoCs accounted for a smaller share of unsheltered youth (26%) than of sheltered youth (41%).
• BoS and statewide CoCs account for 12 percent of all unaccompanied homeless youth, nine percent of unsheltered youth and 15 percent of sheltered youth.
• Five major cities (Los Angeles, San Jose, Las Vegas, New York City, and Seattle) accounted for one-third of all unaccompanied homeless youth in the country. Los Angeles had the largest number (5,163 or 13%), followed by San Jose (2,530 or 6%).
• Los Angeles had the largest number of unaccompanied homeless youth, more than double the number in the next largest city, San Jose. When Los Angeles is removed from the major cities category, major cities account for only 27 percent of sheltered unaccompanied youth, and smaller cities, counties and regional
CoCs account for 53 percent. Removing Los Angeles has only a slight effect on the percentage of unsheltered unaccompanied youth located in major cities (64% with Los Angeles, 62% without Los Angeles).
• Major cities account for a higher percentage of unsheltered unaccompanied youth than they do all unsheltered individuals (64% compared to 56%) and a lower percentage of sheltered unaccompanied youth compared to sheltered individuals (43% compared to 48%).
• In four major cities, more than 80 percent of unaccompanied youth were unsheltered. The highest rate was in San Jose, where 96 percent of unaccompanied youth were unsheltered. In Las Vegas, 93 percent of unaccompanied youth were unsheltered, in San Francisco, 88 percent, and in Los Angeles, 80 percent were staying in unsheltered locations.
Data source: PIT 2017; Excludes Puerto Rico and U.S. territories
48
Continuums of Care (CoC) Were Divided into Three Geographic CategoriesMajor city CoCs (n=48) cover the 50 largest cities in the United States. In two cases (Phoenix and Mesa, AZ, and Arlington and Fort Worth, TX), two large cities were located in the same CoC.Smaller city, county, and regional CoCs (n=306) are jurisdictions that are neither one of the 50 largest cities in the United States nor Balance of State and Statewide CoCs.Balance of State (BoS) and statewide CoCs (n=40) are typically composed of multiple rural counties or represent an entire state.

49
The 2017 Annual Homeless Assessment Report to Congress: Part 1
• Among smaller cities, counties, and regional CoCs, seven of the ten CoCs with the largest numbers of unaccompanied homeless youth experiencing homelessness were located in California. The CoC covering Monterey and San Benito Counties had the largest number (627).
• Eleven smaller cities, counties, and regional CoCs had rates of unsheltered unaccompanied youth above 90 percent. The highest rates were found in Santa Cruz, where 98 percent of unaccompanied homeless youth were staying in places not meant for human habitation, and Pasco County, Florida, which had an unsheltered rate of 96 percent.
• Of BoS and statewide CoCs, Hawaii BoS had the highest rate of unsheltered unaccompanied youth (95%), followed by Oregon BoS (77%).
EXHIBIT 4 .7: CoCs with the Largest Numbers of Unaccompanied Homeless Youth By CoC Category, 2017
Major City CoCs Smaller City, County, and Regional CoCs
Balance of State or Statewide CoCs
CoCTotal
Unaccompanied Homeless Youth
CoCTotal
Unaccompanied Homeless Youth
CoCTotal
Unaccompanied Homeless Youth
Los Angeles City & County, CA
5,163 Salinas/Monterey, San Benito Counties, CA
627 Oregon Balance of State 847
San Jose/Santa Clara City & County, CA
2,530 Watsonville/Santa Cruz City & County, CA
586 Texas Balance of State 417
Las Vegas/Clark County, NV
2,052 Santa Rosa/Petaluma/Sonoma County, CA
532 Washington Balance of State
314
New York City, NY 2,003 Pasco County, FL 329 Colorado Balance of State 240
Seattle/King County, WA 1,498 Riverside City & County, CA
257 Indiana Balance of State 221
San Francisco, CA 1,274 Vallejo/Solano County, CA 210 Ohio Balance of State 201
San Diego City and County, CA
1,160 Honolulu, HI 210 Maine Balance of State 178
Oakland/Alameda County, CA
991 San Luis Obispo County, CA
196 Georgia Balance of State 177
Metropolitan Denver Homeless Initiative, CO
436 San Bernardino City & County, CA
166 Wisconsin Balance of State
142
Phoenix/Mesa/Maricopa County Regional, AZ
320 St . Louis County, MO 155 Kentucky Balance of State 135
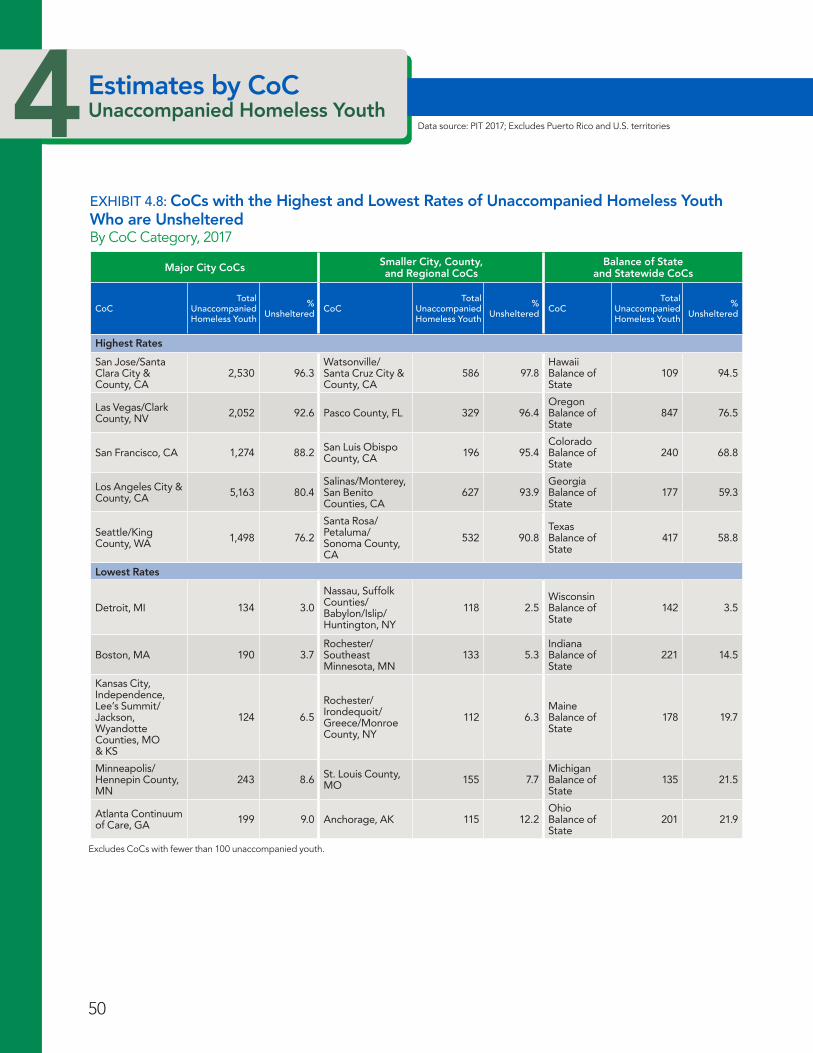
50
1National Estimates Homelessness in the United States4Estimates by CoCUnaccompanied Homeless Youth
Data source: PIT 2017; Excludes Puerto Rico and U.S. territories
EXHIBIT 4 .8: CoCs with the Highest and Lowest Rates of Unaccompanied Homeless Youth Who are Unsheltered By CoC Category, 2017
Major City CoCs Smaller City, County, and Regional CoCs
Balance of State and Statewide CoCs
CoCTotal
Unaccompanied Homeless Youth
% Unsheltered CoC
Total Unaccompanied Homeless Youth
% Unsheltered CoC
Total Unaccompanied Homeless Youth
% Unsheltered
Highest Rates
San Jose/Santa Clara City & County, CA
2,530 96 .3Watsonville/Santa Cruz City & County, CA
586 97 .8Hawaii Balance of State
109 94 .5
Las Vegas/Clark County, NV 2,052 92 .6 Pasco County, FL 329 96 .4
Oregon Balance of State
847 76 .5
San Francisco, CA 1,274 88 .2 San Luis Obispo County, CA 196 95 .4
Colorado Balance of State
240 68 .8
Los Angeles City & County, CA 5,163 80 .4
Salinas/Monterey, San Benito Counties, CA
627 93 .9Georgia Balance of State
177 59 .3
Seattle/King County, WA 1,498 76 .2
Santa Rosa/Petaluma/Sonoma County, CA
532 90 .8Texas Balance of State
417 58 .8
Lowest Rates
Detroit, MI 134 3 .0
Nassau, Suffolk Counties/Babylon/Islip/ Huntington, NY
118 2 .5Wisconsin Balance of State
142 3 .5
Boston, MA 190 3 .7Rochester/Southeast Minnesota, MN
133 5 .3Indiana Balance of State
221 14 .5
Kansas City, Independence, Lee’s Summit/Jackson, Wyandotte Counties, MO & KS
124 6 .5
Rochester/Irondequoit/Greece/Monroe County, NY
112 6 .3Maine Balance of State
178 19 .7
Minneapolis/Hennepin County, MN
243 8 .6 St . Louis County, MO 155 7 .7
Michigan Balance of State
135 21 .5
Atlanta Continuum of Care, GA 199 9 .0 Anchorage, AK 115 12 .2
Ohio Balance of State
201 21 .9
Excludes CoCs with fewer than 100 unaccompanied youth.

The 2017 Annual Homeless Assessment Report to Congress: Part 1
51
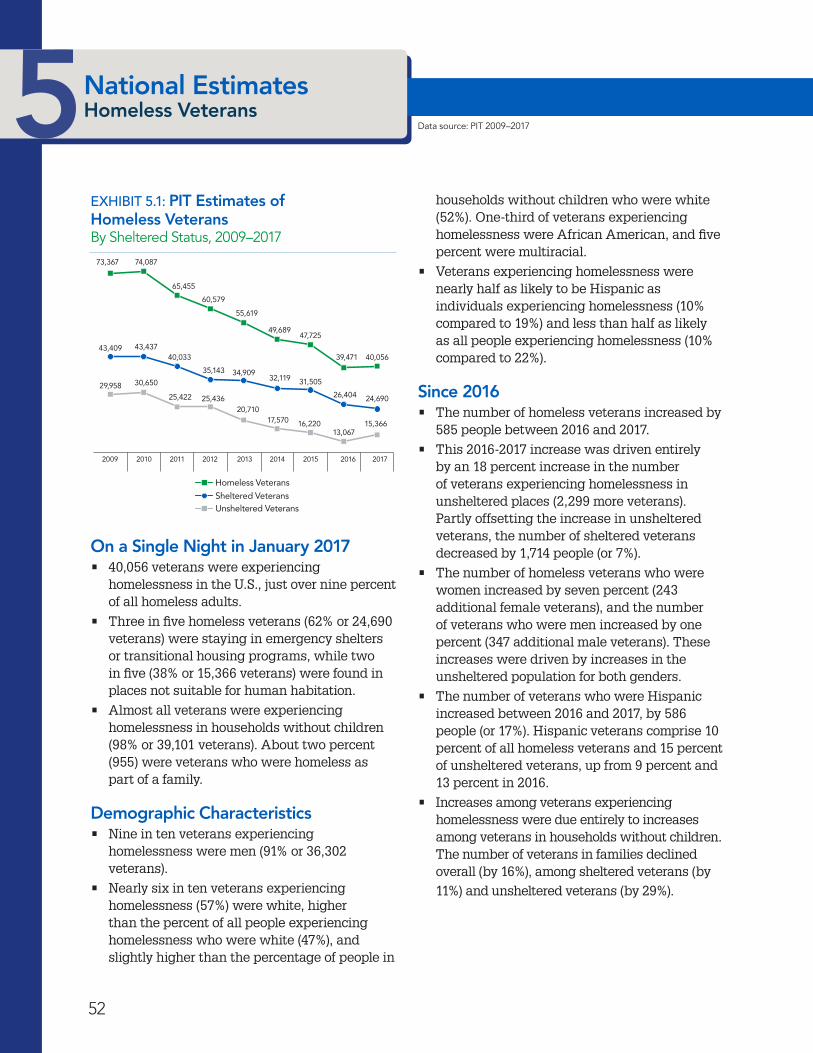
52
1National Estimates Homelessness in the United States5National Estimates Homeless Veterans
EXHIBIT 5 .1: PIT Estimates of Homeless Veterans By Sheltered Status, 2009–2017
10000
20000
30000
40000
50000
60000
70000
80000
2009 2010 2011 2012 2013 2014 2015 2016 2017
73,367 74,087
29,958 30,650
25,422 25,43620,710
17,570 16,22013,067
15,366
43,409 43,43740,033
35,143 34,90932,119
26,404
31,505
24,690
65,455
60,579
55,619
49,689
40,056
47,725
39,471
Unsheltered Veterans
Homeless VeteransSheltered Veterans
On a Single Night in January 2017 • 40,056 veterans were experiencing
homelessness in the U.S., just over nine percent of all homeless adults.
• Three in five homeless veterans (62% or 24,690 veterans) were staying in emergency shelters or transitional housing programs, while two in five (38% or 15,366 veterans) were found in places not suitable for human habitation.
• Almost all veterans were experiencing homelessness in households without children (98% or 39,101 veterans). About two percent (955) were veterans who were homeless as part of a family.
Demographic Characteristics• Nine in ten veterans experiencing
homelessness were men (91% or 36,302 veterans).
• Nearly six in ten veterans experiencing homelessness (57%) were white, higher than the percent of all people experiencing homelessness who were white (47%), and slightly higher than the percentage of people in
Data source: PIT 2009–2017
households without children who were white (52%). One-third of veterans experiencing homelessness were African American, and five percent were multiracial.
• Veterans experiencing homelessness were nearly half as likely to be Hispanic as individuals experiencing homelessness (10% compared to 19%) and less than half as likely as all people experiencing homelessness (10% compared to 22%).
Since 2016• The number of homeless veterans increased by
585 people between 2016 and 2017.
• This 2016-2017 increase was driven entirely by an 18 percent increase in the number of veterans experiencing homelessness in unsheltered places (2,299 more veterans). Partly offsetting the increase in unsheltered veterans, the number of sheltered veterans decreased by 1,714 people (or 7%).
• The number of homeless veterans who were women increased by seven percent (243 additional female veterans), and the number of veterans who were men increased by one percent (347 additional male veterans). These increases were driven by increases in the unsheltered population for both genders.
• The number of veterans who were Hispanic increased between 2016 and 2017, by 586 people (or 17%). Hispanic veterans comprise 10 percent of all homeless veterans and 15 percent of unsheltered veterans, up from 9 percent and 13 percent in 2016.
• Increases among veterans experiencing homelessness were due entirely to increases among veterans in households without children. The number of veterans in families declined overall (by 16%), among sheltered veterans (by 11%) and unsheltered veterans (by 29%).

53
The 2017 Annual Homeless Assessment Report to Congress: Part 1
Since 2009• Point-in-time data started to identify veterans
in 2009. The number of veterans experiencing homelessness increased between 2009 and 2010 and then dropped every year until this past year.
• Since 2009, veteran homelessness has dropped considerably, with 45 percent (or 33,311) fewer veterans experiencing homelessness in 2017 than in 2009.
• Veteran homelessness decreased both among those in shelters and those found in unsheltered locations. Between 2009 and 2017, the number of unsheltered veterans decreased by 49 percent (or 14,592 fewer veterans), and by 43 percent (or 18,719 fewer veterans) among those staying in shelters.
EXHIBIT 5 .2: Proportion of Adults Experiencing Homelessness Who Are VeteransSheltered Status, 2017
Sheltered Status # of Veterans Experiencing Homelessness
# of Adults Experiencing Homelessness
% of Adults Experiencing Homelessness Who are
VeteransTotal 40,056 438,913 9 .1Sheltered 24,690 257,578 9 .6Unsheltered 15,366 181,335 8 .5
EXHIBIT 5 .3: Demographic Characteristics of Homeless Veterans2017
CharacteristicAll Veterans Sheltered Veterans Unsheltered Veterans
# % # % # %
Total Veterans 40,056 100 24,690 100% 15,366 100Gender
Female 3,571 8.9 2,071 8.4 1,500 9.8Male 36,302 90.6 22,556 91.4 13,746 89.5Transgender 131 0.3 51 0.2 80 0.5Don’t Identify as Male, Female, or Transgender 52 0.1 12 0.0 40 0.3
EthnicityNon-Hispanic 35,912 89.7 22,781 92.3 13,131 85.5Hispanic 4,144 10.3 1,909 7.7 2,235 14.5RaceWhite 22,744 56.8 13,718 55.6 9,026 58.7African American 13,260 33.1 9,245 37.4 4,015 26.1Asian 447 1.1 188 0.8 259 1.7Native American 1,307 3.3 496 2.0 811 5.3Pacific Islander 376 0.9 134 0.5 242 1.6Multiple Races 1,922 4.8 909 3.7 1,013 6.6
EXHIBIT 5 .4: Change in Numbers of Homeless VeteransBy Sheltered Status, 2009–2017
2016–2017 2010–2017 2009–2017# % # % # %
Total Veterans 585 1 .5 -34,031 -45 .9 -33,311 -45 .4
Sheltered -1,714 -6 .5 -18,747 -43 .2 -18,719 -43 .1Unsheltered 2,299 17 .6 -15,284 -49 .9 -14,592 -48 .7

54
1National Estimates Homelessness in the United States5State Estimates Homeless Veterans
EXHIBIT 5 .5: Estimates of Homeless Veterans By State, 2017
91
285
57
95853
191583
536137
489
615
478
480
712
2,817
124
94
1,244
2,200
11,472
131ME,
NH,
VT,
NY MA,RI,
CT,NJ,
DE,
DC,
PA
VAWV
NC,
SC
GA
FL
AL
TN,
KY
OHIL
MIWI
MN
IA
MO
AR
LATX
OK
KS
NE
SD
NDMT
WA
OR
CA
AK
HI
WY
CO
NMAZ
UTNV
ID
IN
MS
MD,
Share of Homeless Veterans
Less than 1%1%–2.9%
Greater than 6%3%–6%
124
63
220
248
228 130
174
217
349
171
239
383
74281
329
864 862
773
963
757931
5381,078
970
269
615
205
1,251
2,093
832
Data source: PIT 2009-2017
On a Single Night in January 2017• Just under 30 percent of all veterans
experiencing homelessness were in California (29% or 11,472 veterans).
• In three states, more than half of all veterans experiencing homelessness were unsheltered. Those states were: California (67%), Hawaii (62%), and Oregon (53%).
• Three states sheltered more than 95 percent of homeless veterans. In Nebraska, only one percent of veterans were unsheltered, in Rhode Island only three percent, and in New York five percent.
• Some states with large numbers of homeless veterans are not among the states with the largest numbers of veterans. Oregon had the fifth largest number of veterans experiencing homelessness, but the 25th largest number of veterans. Colorado had the seventh largest homeless veteran population and the 19th largest population of all veterans. In Virginia, the reverse was true. The state had the eighth
largest population of veterans and was 25th in its population of veterans experiencing homelessness.
Since 2016• While homelessness among veterans increased
nationwide between 2016 and 2017, veteran homelessness decreased in 36 states and the District of Columbia. The largest absolute decreases were in Georgia (343 fewer veterans) and South Carolina (258). The largest percentage decrease was in Mississippi (60%), followed by North Dakota (36%), South Carolina (35%), and Utah (34%).
• The number of veterans experiencing homelessness increased in 14 states between 2016 and 2017. The largest absolute increases, and those driving the nationwide increase, were in California (1,860 more veterans), Washington (609), and Texas (432). The largest percentage increases were in Washington (41%), Kansas (28%), Texas (24%), and Montana (24%).
The 2017 Annual Homeless Assessment Report to Congress: Part 1
55
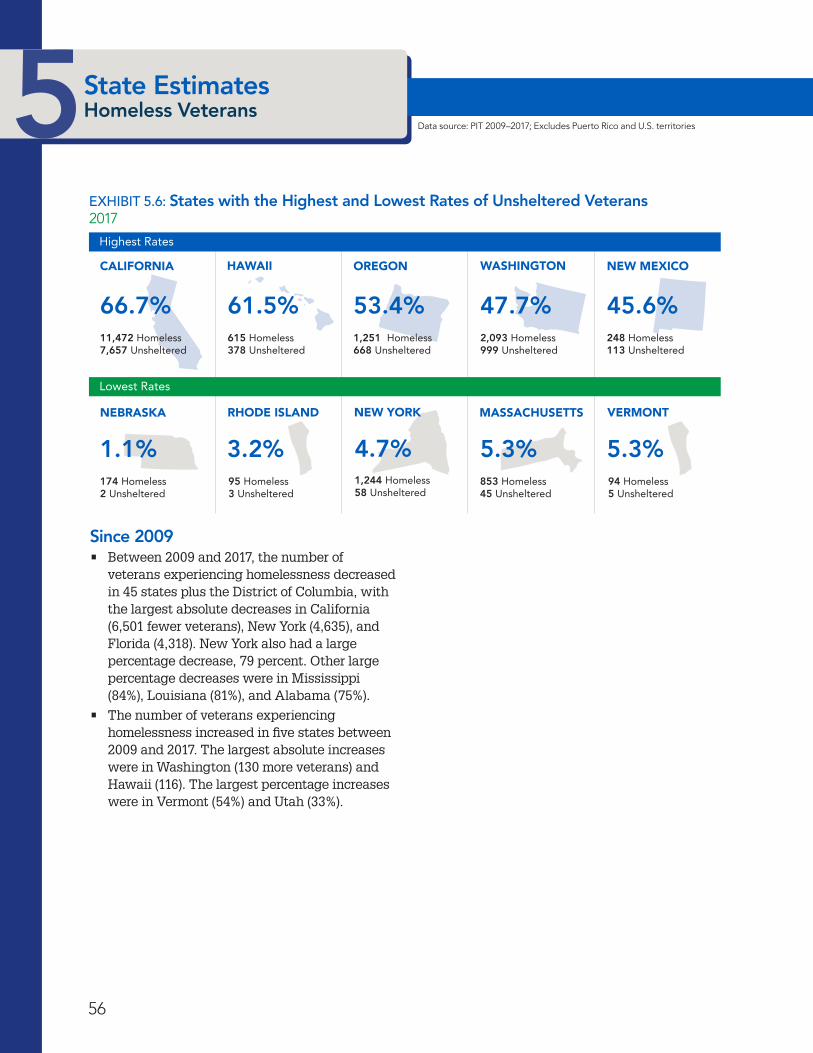
56
1National Estimates Homelessness in the United States5State Estimates Homeless Veterans
Data source: PIT 2009–2017; Excludes Puerto Rico and U.S. territories
EXHIBIT 5 .6: States with the Highest and Lowest Rates of Unsheltered Veterans2017
OREGONHAWAII
615 Homeless378 Unsheltered
61.5%
853 Homeless45 Unsheltered
5.3%
1,251 Homeless668 Unsheltered
53.4%
NEW MEXICO
248 Homeless113 Unsheltered
45.6%
CALIFORNIA
11,472 Homeless7,657 Unsheltered
66.7%
MASSACHUSETTS
174 Homeless2 Unsheltered
1.1%
NEBRASKA
Lowest Rates
Highest Rates
95 Homeless3 Unsheltered
3.2%
RHODE ISLAND
94 Homeless5 Unsheltered
5.3%
VERMONT
1,244 Homeless58 Unsheltered
4.7%
NEW YORK
WASHINGTON
2,093 Homeless999 Unsheltered
47.7%
Since 2009• Between 2009 and 2017, the number of
veterans experiencing homelessness decreased in 45 states plus the District of Columbia, with the largest absolute decreases in California (6,501 fewer veterans), New York (4,635), and Florida (4,318). New York also had a large percentage decrease, 79 percent. Other large percentage decreases were in Mississippi (84%), Louisiana (81%), and Alabama (75%).
• The number of veterans experiencing homelessness increased in five states between 2009 and 2017. The largest absolute increases were in Washington (130 more veterans) and Hawaii (116). The largest percentage increases were in Vermont (54%) and Utah (33%).
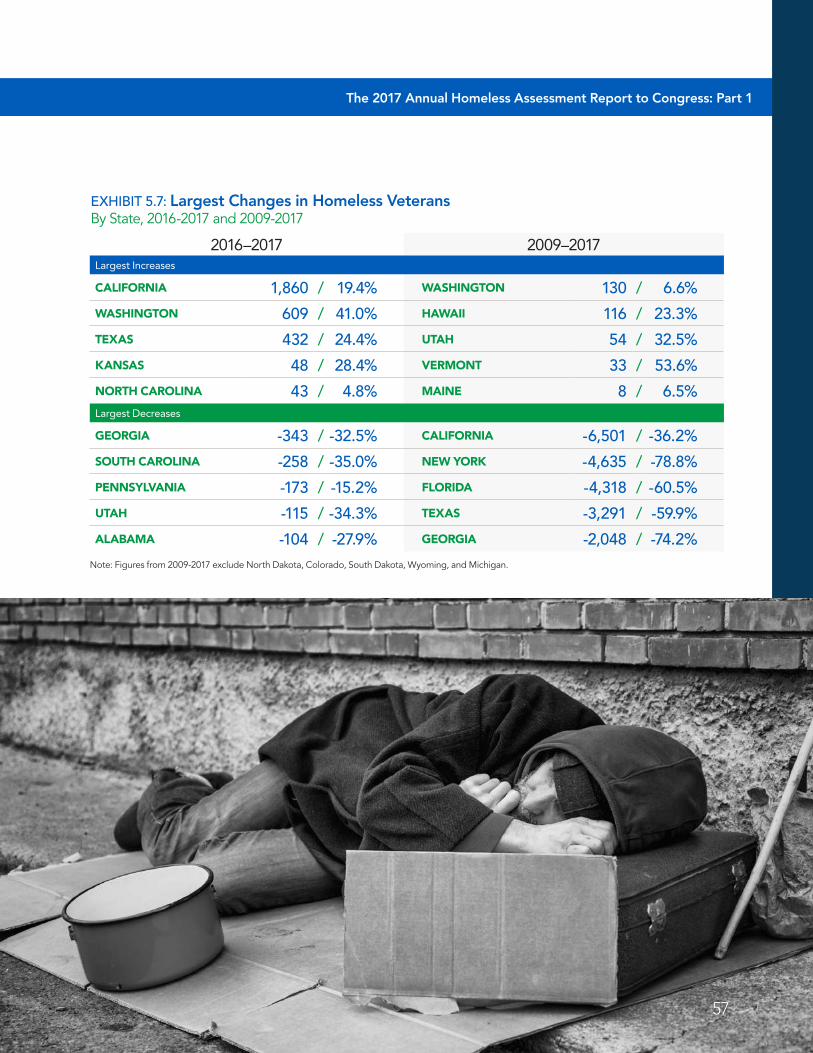
The 2017 Annual Homeless Assessment Report to Congress: Part 1
57
EXHIBIT 5 .7: Largest Changes in Homeless Veterans By State, 2016-2017 and 2009-2017
2016–2017 2009–2017Largest Increases
CALIFORNIA 1,860 / 19 .4% WASHINGTON 130 / 6 .6%
WASHINGTON 609 / 41 .0% HAWAII 116 / 23 .3%
TEXAS 432 / 24 .4% UTAH 54 / 32 .5%
KANSAS 48 / 28 .4% VERMONT 33 / 53 .6%
NORTH CAROLINA 43 / 4 .8% MAINE 8 / 6 .5%Largest Decreases
GEORGIA -343 / -32 .5% CALIFORNIA -6,501 / -36 .2%
SOUTH CAROLINA -258 / -35 .0% NEW YORK -4,635 / -78 .8%
PENNSYLVANIA -173 / -15 .2% FLORIDA -4,318 / -60 .5%
UTAH -115 / -34 .3% TEXAS -3,291 / -59 .9%
ALABAMA -104 / -27 .9% GEORGIA -2,048 / -74 .2%Note: Figures from 2009-2017 exclude North Dakota, Colorado, South Dakota, Wyoming, and Michigan.

58
1National Estimates Homelessness in the United States5Estimates by CoCHomeless Veterans
EXHIBIT 5 .8: Homeless Veterans By CoC Category and Sheltered Status, 2017
0 100
Balance of State and Statewide CoCs
Smaller Cities, Counties, and Regional CoCs
Major Cities
Homeless Veterans
ShelteredVeterans
UnshelteredVeterans
0% 100%
48.3
44.3
54.6 32.1
42.5
38.5 13.2
13.1
13.3
Major Cities
Smaller City, County, and Regional CoCs
Balance of State and Statewide CoCs
On a Single Night in January 2017• Nearly half of all homeless veterans were in
major cities (48%). Smaller cities, counties, and regional CoCs accounted for a 39 percent, while 13 percent of homeless veterans were in BoS and statewide CoCs.
• Major cities accounted for a higher percentage of unsheltered veterans than of sheltered veterans (55% versus 44%). In contrast, smaller cities, counties, and regional CoCs had a larger share of all sheltered veterans (43%) than of unsheltered veterans (32%).
• Some major cities with the largest numbers of homeless veterans are not among the cities with the largest numbers of veterans. Seattle, WA has the second largest number of homeless veterans but was 34th in its number of all veterans. San Antonio, TX and Jacksonville, FL had the second and fifth largest numbers of veterans but the 25th and 39th largest populations of homeless veterans.
• The five major cities with the highest percentage of homeless veterans staying in unsheltered locations were in California. Los Angeles had the highest rate, with 76 percent of homeless veterans staying in unsheltered locations there.
Data source: PIT 2009-2017; Excludes Puerto Rico and U.S. territories
• The smaller city, county, and regional CoCs of Santa Cruz City and County and Orange County in California had rates of unsheltered veterans at or above 85 percent (92% and 88%). Somerset County in New Jersey sheltered all veterans experiencing homelessness in 2017.
• Hawaii BoS and Georgia BoS had the highest rates of unsheltered veterans in the BoS and statewide category, with 86 percent and 75 percent, respectively.
Changes over Time• Between 2016 and 2017 all of the increases
in veteran homelessness occurred in major cities. The number of veterans experiencing homelessness increased by 12 percent in major cities (2,026 more veterans) but declined across the other two categories of CoCs. In major cities, a 48 percent increase in the number of unsheltered veterans was only partly offset by a six percent decline in sheltered veterans.
Continuums of Care (CoC) Were Divided into Three Geographic CategoriesMajor city CoCs (n=48) cover the 50 largest cities in the United States. In two cases (Phoenix and Mesa, AZ, and Arlington and Fort Worth, TX), two large cities were located in the same CoC.Smaller city, county, and regional CoCs (n=306) are jurisdictions that are neither one of the 50 largest cities in the United States nor Balance of State and Statewide CoCs.Balance of State (BoS) and statewide CoCs (n=40) are typically composed of multiple rural counties or represent an entire state.
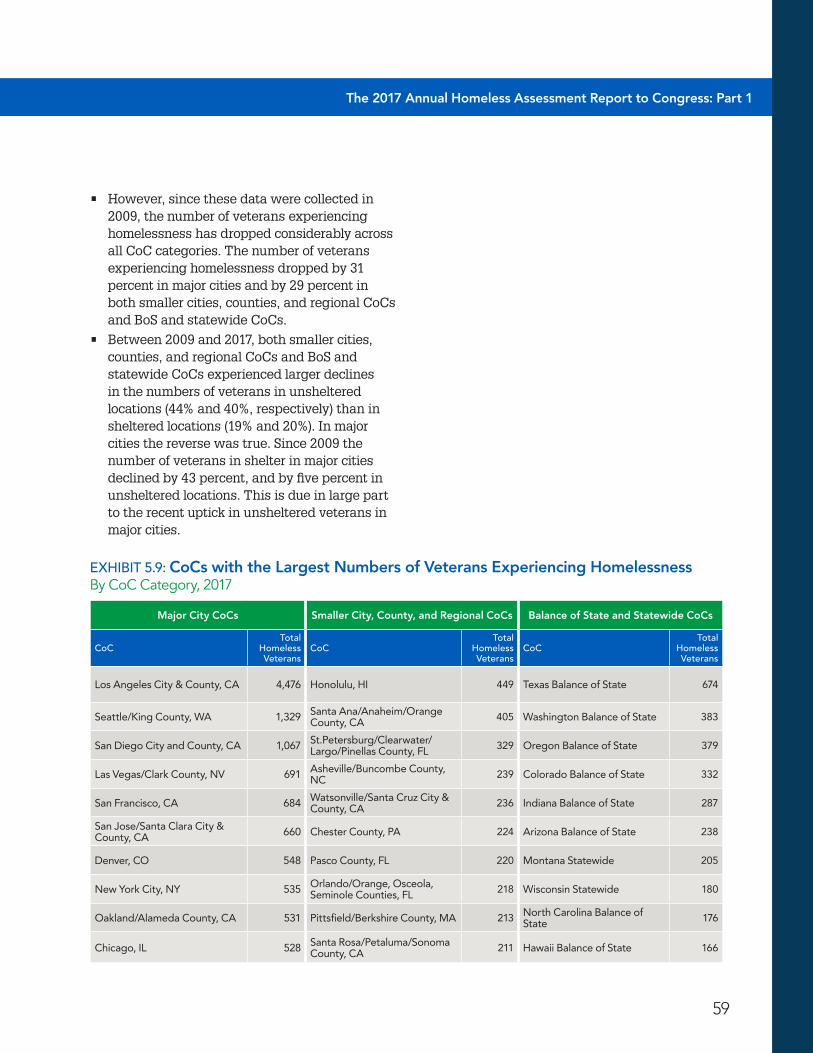
The 2017 Annual Homeless Assessment Report to Congress: Part 1
59
• However, since these data were collected in 2009, the number of veterans experiencing homelessness has dropped considerably across all CoC categories. The number of veterans experiencing homelessness dropped by 31 percent in major cities and by 29 percent in both smaller cities, counties, and regional CoCs and BoS and statewide CoCs.
• Between 2009 and 2017, both smaller cities, counties, and regional CoCs and BoS and statewide CoCs experienced larger declines in the numbers of veterans in unsheltered locations (44% and 40%, respectively) than in sheltered locations (19% and 20%). In major cities the reverse was true. Since 2009 the number of veterans in shelter in major cities declined by 43 percent, and by five percent in unsheltered locations. This is due in large part to the recent uptick in unsheltered veterans in major cities.
EXHIBIT 5 .9: CoCs with the Largest Numbers of Veterans Experiencing Homelessness By CoC Category, 2017
Major City CoCs Smaller City, County, and Regional CoCs Balance of State and Statewide CoCs
CoCTotal
Homeless Veterans
CoCTotal
Homeless Veterans
CoCTotal
Homeless Veterans
Los Angeles City & County, CA 4,476 Honolulu, HI 449 Texas Balance of State 674
Seattle/King County, WA 1,329 Santa Ana/Anaheim/Orange County, CA 405 Washington Balance of State 383
San Diego City and County, CA 1,067 St .Petersburg/Clearwater/Largo/Pinellas County, FL 329 Oregon Balance of State 379
Las Vegas/Clark County, NV 691 Asheville/Buncombe County, NC 239 Colorado Balance of State 332
San Francisco, CA 684 Watsonville/Santa Cruz City & County, CA 236 Indiana Balance of State 287
San Jose/Santa Clara City & County, CA 660 Chester County, PA 224 Arizona Balance of State 238
Denver, CO 548 Pasco County, FL 220 Montana Statewide 205
New York City, NY 535 Orlando/Orange, Osceola, Seminole Counties, FL 218 Wisconsin Statewide 180
Oakland/Alameda County, CA 531 Pittsfield/Berkshire County, MA 213 North Carolina Balance of State 176
Chicago, IL 528 Santa Rosa/Petaluma/Sonoma County, CA 211 Hawaii Balance of State 166
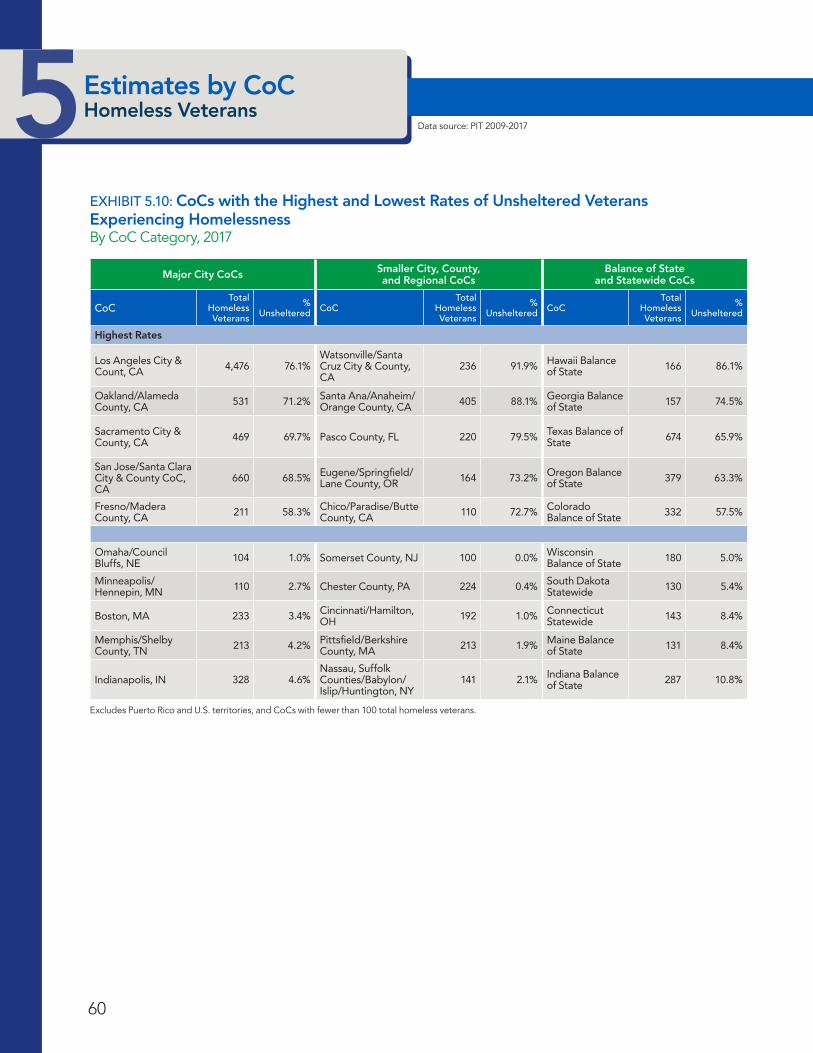
60
1National Estimates Homelessness in the United States5Estimates by CoCHomeless Veterans
Data source: PIT 2009-2017
EXHIBIT 5 .10: CoCs with the Highest and Lowest Rates of Unsheltered Veterans Experiencing Homelessness By CoC Category, 2017
Major City CoCs Smaller City, County, and Regional CoCs
Balance of State and Statewide CoCs
CoCTotal
Homeless Veterans
% Unsheltered CoC
Total Homeless Veterans
% Unsheltered CoC
Total Homeless Veterans
% Unsheltered
Highest Rates
Los Angeles City & Count, CA 4,476 76 .1%
Watsonville/Santa Cruz City & County, CA
236 91 .9% Hawaii Balance of State 166 86 .1%
Oakland/Alameda County, CA 531 71 .2% Santa Ana/Anaheim/
Orange County, CA 405 88 .1% Georgia Balance of State 157 74 .5%
Sacramento City & County, CA 469 69 .7% Pasco County, FL 220 79 .5% Texas Balance of
State 674 65 .9%
San Jose/Santa Clara City & County CoC, CA
660 68 .5% Eugene/Springfield/Lane County, OR 164 73 .2% Oregon Balance
of State 379 63 .3%
Fresno/Madera County, CA 211 58 .3% Chico/Paradise/Butte
County, CA 110 72 .7% Colorado Balance of State 332 57 .5%
Omaha/Council Bluffs, NE 104 1 .0% Somerset County, NJ 100 0 .0% Wisconsin
Balance of State 180 5 .0%
Minneapolis/Hennepin, MN 110 2 .7% Chester County, PA 224 0 .4% South Dakota
Statewide 130 5 .4%
Boston, MA 233 3 .4% Cincinnati/Hamilton, OH 192 1 .0% Connecticut
Statewide 143 8 .4%
Memphis/Shelby County, TN 213 4 .2% Pittsfield/Berkshire
County, MA 213 1 .9% Maine Balance of State 131 8 .4%
Indianapolis, IN 328 4 .6%Nassau, Suffolk Counties/Babylon/Islip/Huntington, NY
141 2 .1% Indiana Balance of State 287 10 .8%
Excludes Puerto Rico and U.S. territories, and CoCs with fewer than 100 total homeless veterans.
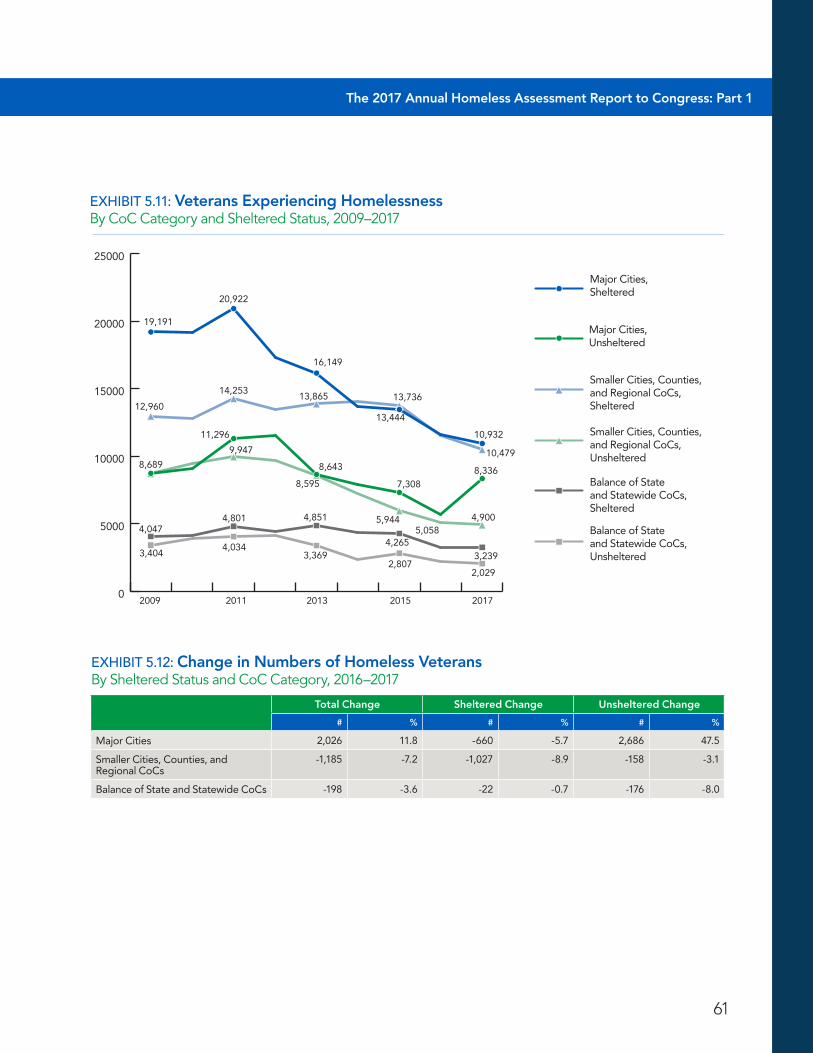
The 2017 Annual Homeless Assessment Report to Congress: Part 1
61
EXHIBIT 5 .12: Change in Numbers of Homeless VeteransBy Sheltered Status and CoC Category, 2016–2017
Total Change Sheltered Change Unsheltered Change
# % # % # %
Major Cities 2,026 11 .8 -660 -5 .7 2,686 47 .5
Smaller Cities, Counties, and Regional CoCs
-1,185 -7 .2 -1,027 -8 .9 -158 -3 .1
Balance of State and Statewide CoCs -198 -3 .6 -22 -0 .7 -176 -8 .0
0
5000
10000
15000
20000
25000
19,191
20,922
16,149
10,932
3,4044,034
3,3692,807
2,029
4,0474,801 4,851
4,2653,239
8,689
8,595
5,944 4,900
12,960
14,25313,865
13,444
10,479
11,296
7,308
8,643 8,336
Balance of State and Statewide CoCs, Unsheltered
Balance of State and Statewide CoCs, Sheltered
Smaller Cities, Counties, and Regional CoCs, Unsheltered
Smaller Cities, Counties, and Regional CoCs, Sheltered
Major Cities, Unsheltered
Major Cities, Sheltered
13,736
9,947
5,058
2009 2011 2013 2015 2017
EXHIBIT 5 .11: Veterans Experiencing HomelessnessBy CoC Category and Sheltered Status, 2009–2017
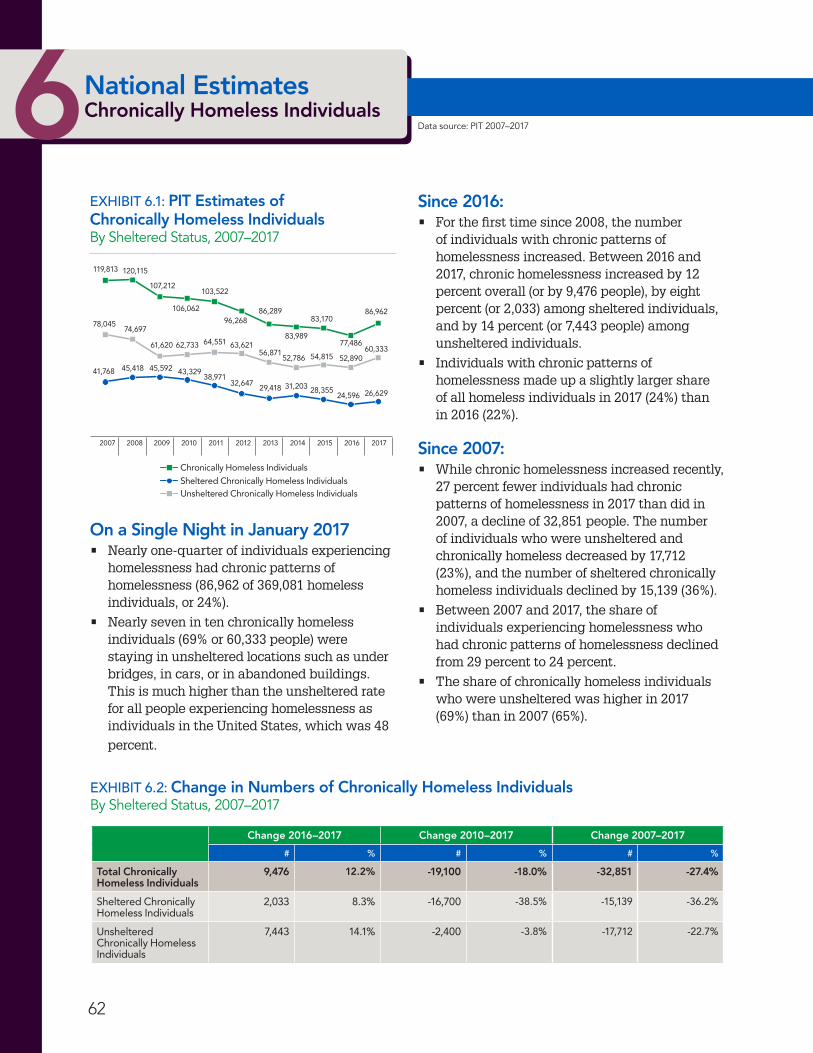
62
1National Estimates Homelessness in the United States6National Estimates Chronically Homeless Individuals
On a Single Night in January 2017• Nearly one-quarter of individuals experiencing
homelessness had chronic patterns of homelessness (86,962 of 369,081 homeless individuals, or 24%).
• Nearly seven in ten chronically homeless individuals (69% or 60,333 people) were staying in unsheltered locations such as under bridges, in cars, or in abandoned buildings. This is much higher than the unsheltered rate for all people experiencing homelessness as individuals in the United States, which was 48 percent.
0
30000
60000
90000
120000
150000
2007 2008 2009 2010 2011 2012 2013 2014 2015 2016 2017
119,813 120,115
41,768 45,418 43,32945,592
29,418 31,20338,971
32,64728,355
24,596 26,629
78,04574,697
61,620 62,733 64,551 63,62156,871
52,786 54,815 52,890
107,212
106,062
103,522
96,268
60,333
83,170
77,486
86,96286,289
83,989
Unsheltered Chronically Homeless Individuals
Chronically Homeless IndividualsSheltered Chronically Homeless Individuals
EXHIBIT 6 .1: PIT Estimates of Chronically Homeless IndividualsBy Sheltered Status, 2007–2017
Data source: PIT 2007–2017
Since 2016:• For the first time since 2008, the number
of individuals with chronic patterns of homelessness increased. Between 2016 and 2017, chronic homelessness increased by 12 percent overall (or by 9,476 people), by eight percent (or 2,033) among sheltered individuals, and by 14 percent (or 7,443 people) among unsheltered individuals.
• Individuals with chronic patterns of homelessness made up a slightly larger share of all homeless individuals in 2017 (24%) than in 2016 (22%).
Since 2007: • While chronic homelessness increased recently,
27 percent fewer individuals had chronic patterns of homelessness in 2017 than did in 2007, a decline of 32,851 people. The number of individuals who were unsheltered and chronically homeless decreased by 17,712 (23%), and the number of sheltered chronically homeless individuals declined by 15,139 (36%).
• Between 2007 and 2017, the share of individuals experiencing homelessness who had chronic patterns of homelessness declined from 29 percent to 24 percent.
• The share of chronically homeless individuals who were unsheltered was higher in 2017 (69%) than in 2007 (65%).
EXHIBIT 6 .2: Change in Numbers of Chronically Homeless IndividualsBy Sheltered Status, 2007–2017
Change 2016–2017 Change 2010–2017 Change 2007–2017
# % # % # %
Total Chronically Homeless Individuals
9,476 12.2% -19,100 -18.0% -32,851 -27.4%
Sheltered Chronically Homeless Individuals
2,033 8 .3% -16,700 -38 .5% -15,139 -36 .2%
Unsheltered Chronically Homeless Individuals
7,443 14 .1% -2,400 -3 .8% -17,712 -22 .7%

The 2017 Annual Homeless Assessment Report to Congress: Part 1
63
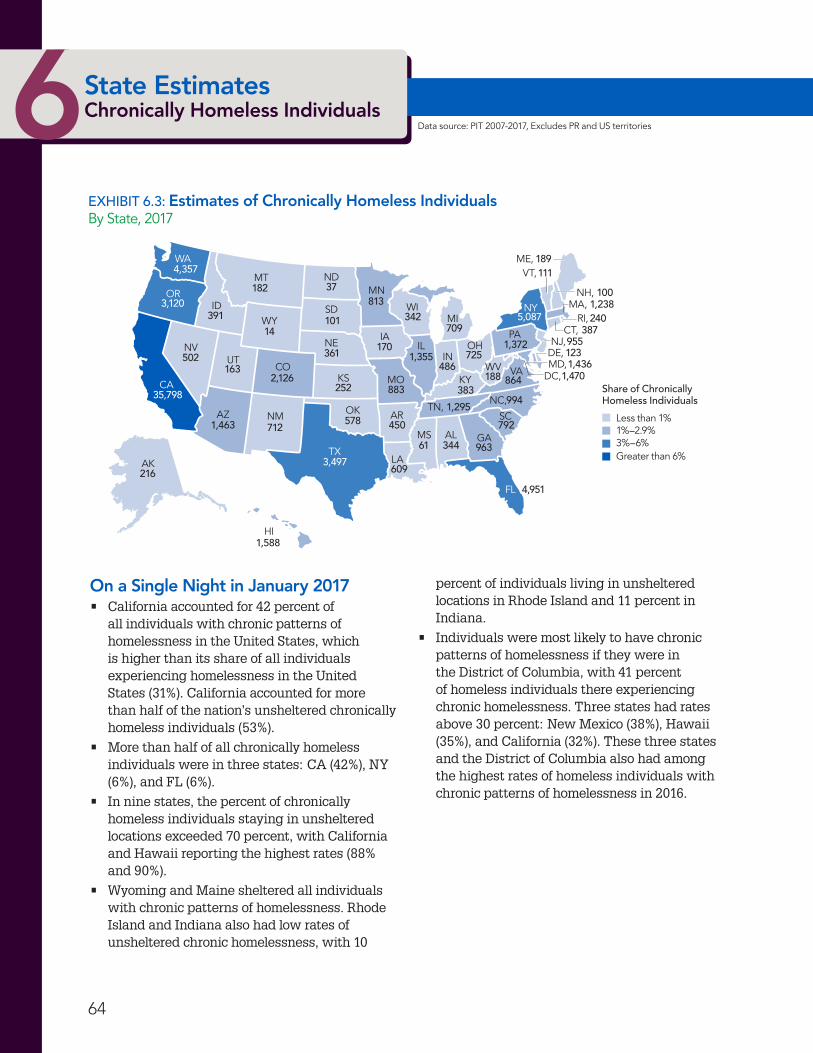
64
1National Estimates Homelessness in the United States6State Estimates Chronically Homeless Individuals
EXHIBIT 6 .3: Estimates of Chronically Homeless Individuals By State, 2017
On a Single Night in January 2017• California accounted for 42 percent of
all individuals with chronic patterns of homelessness in the United States, which is higher than its share of all individuals experiencing homelessness in the United States (31%). California accounted for more than half of the nation’s unsheltered chronically homeless individuals (53%).
• More than half of all chronically homeless individuals were in three states: CA (42%), NY (6%), and FL (6%).
• In nine states, the percent of chronically homeless individuals staying in unsheltered locations exceeded 70 percent, with California and Hawaii reporting the highest rates (88% and 90%).
• Wyoming and Maine sheltered all individuals with chronic patterns of homelessness. Rhode Island and Indiana also had low rates of unsheltered chronic homelessness, with 10
ME,
NH,
VT,
NY MA,RI,
CT,NJ,
DE,
DC,
PA
VAWV
NC,
SC
GA
FL
AL
TN,
KY
OHIL
MIWI
MN
IA
MO
AR
LATX
OK
KS
NE
SD
NDMT
WA
OR
CA
AK
HI
WY
CO
NMAZ
UTNV
ID
IN
MS
MD,
Share of Chronically Homeless Individuals
Less than 1%1%–2.9%
Greater than 6%3%–6%
101
361
252
578
170
883
609
450
342
1,355
709
7251,372
813
864
994
4,951
9633,497
35,798
5,087
1,463
1,588
486
383
1,295
792
188
111189
2401,238
387
100
14
2,126163
502
712
61 344
182
3913,120
4,357
216
37
1231,436
1,470
955
percent of individuals living in unsheltered locations in Rhode Island and 11 percent in Indiana.
• Individuals were most likely to have chronic patterns of homelessness if they were in the District of Columbia, with 41 percent of homeless individuals there experiencing chronic homelessness. Three states had rates above 30 percent: New Mexico (38%), Hawaii (35%), and California (32%). These three states and the District of Columbia also had among the highest rates of homeless individuals with chronic patterns of homelessness in 2016.
Data source: PIT 2007-2017, Excludes PR and US territories
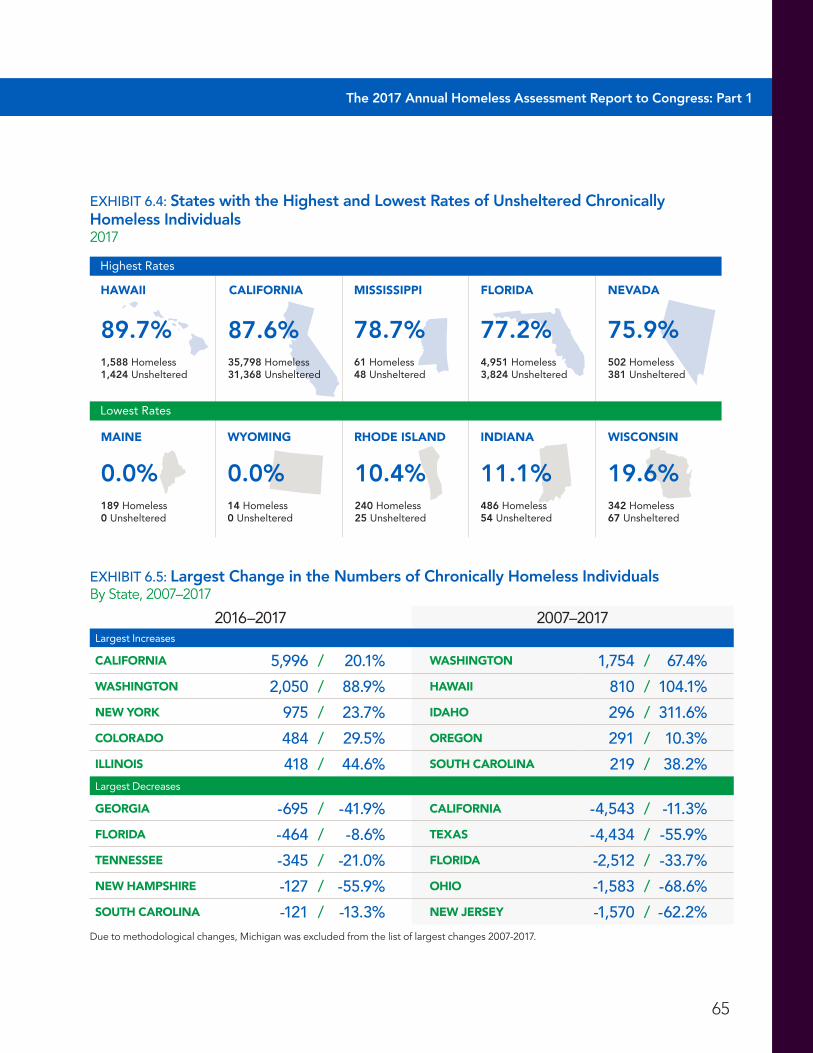
65
The 2017 Annual Homeless Assessment Report to Congress: Part 1
EXHIBIT 6 .4: States with the Highest and Lowest Rates of Unsheltered Chronically Homeless Individuals2017
CALIFORNIA NEVADAHAWAII
502 Homeless381 Unsheltered
75.9%
FLORIDA
4,951 Homeless3,824 Unsheltered
77.2%
MISSISSIPPI
61 Homeless48 Unsheltered
78.7%
240 Homeless25 Unsheltered
10.4%
35,798 Homeless31,368 Unsheltered
87.6%1,588 Homeless1,424 Unsheltered
89.7%
RHODE ISLAND
Lowest Rates
Highest Rates
189 Homeless0 Unsheltered
0.0%
MAINE
14 Homeless0 Unsheltered
0.0%
WYOMING
486 Homeless54 Unsheltered
11.1%
INDIANA
342 Homeless67 Unsheltered
19.6%
WISCONSIN
EXHIBIT 6 .5: Largest Change in the Numbers of Chronically Homeless IndividualsBy State, 2007–2017
2016–2017 2007–2017Largest Increases
CALIFORNIA 5,996 / 20 .1% WASHINGTON 1,754 / 67 .4%
WASHINGTON 2,050 / 88 .9% HAWAII 810 / 104 .1%
NEW YORK 975 / 23 .7% IDAHO 296 / 311 .6%
COLORADO 484 / 29 .5% OREGON 291 / 10 .3%
ILLINOIS 418 / 44 .6% SOUTH CAROLINA 219 / 38 .2%Largest Decreases
GEORGIA -695 / -41 .9% CALIFORNIA -4,543 / -11 .3%
FLORIDA -464 / -8 .6% TEXAS -4,434 / -55 .9%
TENNESSEE -345 / -21 .0% FLORIDA -2,512 / -33 .7%
NEW HAMPSHIRE -127 / -55 .9% OHIO -1,583 / -68 .6%
SOUTH CAROLINA -121 / -13 .3% NEW JERSEY -1,570 / -62 .2%Due to methodological changes, Michigan was excluded from the list of largest changes 2007-2017.
66
1National Estimates Homelessness in the United States6State Estimates Chronically Homeless Individuals
Changes Over Time• Over half of all states, 28, experienced an
increase between 2016 and 2017 in the number of individuals with chronic patterns of homelessness. California by far had the largest increase, with 5,996 more chronically homeless individuals in 2017 than in 2016. The next largest increase occurred in Washington, with 2,050 more individuals with chronic patterns of homelessness there in 2017. Other states with the largest absolute increases were: New York (975), Colorado (484), and Illinois (418).
• Of the 22 states and the District of Columbia that had declines in the number of chronically homeless individuals between 2016 and 2017, the largest absolute decreases occurred in Georgia (695 fewer people), Florida (464), and Tennessee (345).
• Over a longer period of time, 2007-2017, 38 states and the District of Columbia had decreases in chronic homelessness among individuals. California experienced the largest decline in the number of chronically homeless individuals, with 4,543 fewer chronically homeless individuals in 2017 than in 2007. Texas also experienced a considerable decline, with 4,434 fewer chronically homeless individuals. Other states with large absolute declines were: Florida (2,512 fewer people), Ohio (1,583), New Jersey (1,570), Massachusetts (1,552), and Georgia (1,521).
• Among the 12 states that experienced increases in the number of individuals with chronic patterns of homelessness between 2007 and 2017, the largest absolute increases occurred in Washington, with 1,754 more chronically homeless individuals in 2017 than in 2007. Other states with large absolute increases were: Hawaii (810 more chronically homeless individuals), Idaho (296), and Oregon (291).
Data source: PIT 2007–2017; Excludes Puerto Rico and U.S. territories
More than half of all chronically homeless individuals were in three states: CA (42%), NY (6%), and FL (6%) .

The 2017 Annual Homeless Assessment Report to Congress: Part 1
67 67
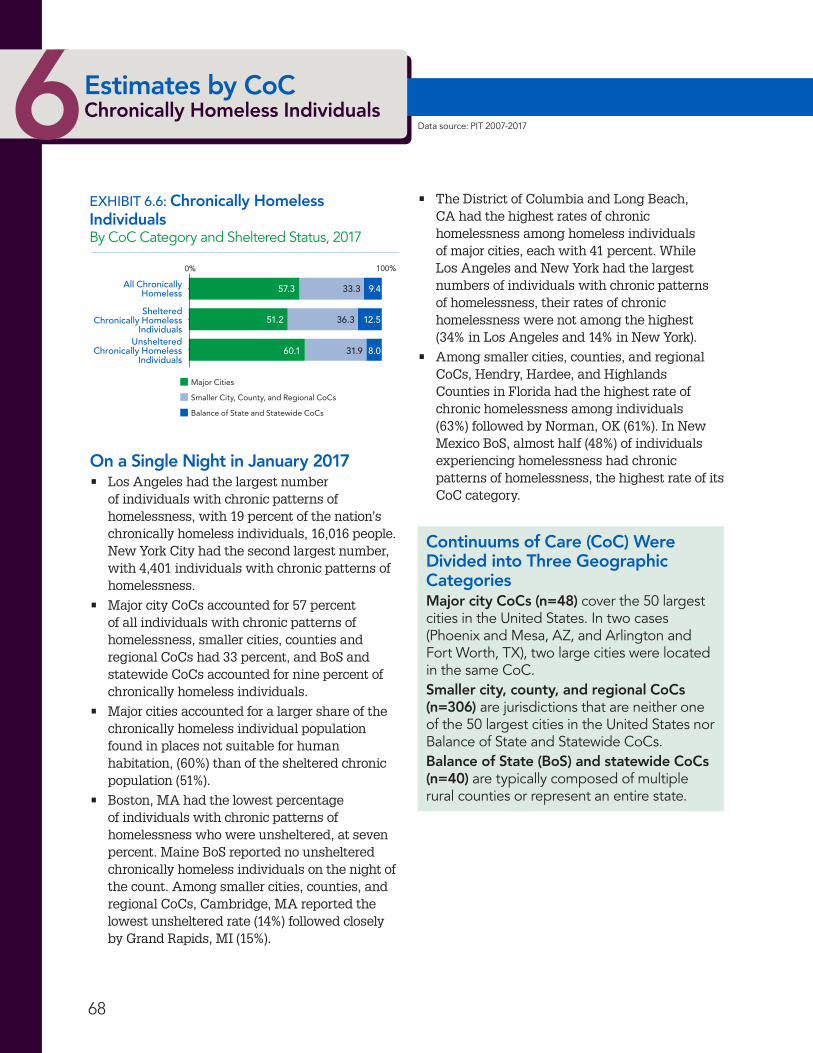
1National Estimates Homelessness in the United States
EXHIBIT 6 .6: Chronically Homeless Individuals By CoC Category and Sheltered Status, 20170 100
Balance of State and Statewide CoCs
Smaller Cities, Counties, and Regional CoCs
Major Cities
All Chronically Homeless
ShelteredChronically Homeless
IndividualsUnsheltered
Chronically Homeless Individuals
0% 100%
57.3
51.2
60.1 31.9
36.3
33.3 9.4
12.5
8.0
Major Cities
Smaller City, County, and Regional CoCs
Balance of State and Statewide CoCs
Data source: PIT 2007-2017
On a Single Night in January 2017• Los Angeles had the largest number
of individuals with chronic patterns of homelessness, with 19 percent of the nation’s chronically homeless individuals, 16,016 people. New York City had the second largest number, with 4,401 individuals with chronic patterns of homelessness.
• Major city CoCs accounted for 57 percent of all individuals with chronic patterns of homelessness, smaller cities, counties and regional CoCs had 33 percent, and BoS and statewide CoCs accounted for nine percent of chronically homeless individuals.
• Major cities accounted for a larger share of the chronically homeless individual population found in places not suitable for human habitation, (60%) than of the sheltered chronic population (51%).
• Boston, MA had the lowest percentage of individuals with chronic patterns of homelessness who were unsheltered, at seven percent. Maine BoS reported no unsheltered chronically homeless individuals on the night of the count. Among smaller cities, counties, and regional CoCs, Cambridge, MA reported the lowest unsheltered rate (14%) followed closely by Grand Rapids, MI (15%).
• The District of Columbia and Long Beach, CA had the highest rates of chronic homelessness among homeless individuals of major cities, each with 41 percent. While Los Angeles and New York had the largest numbers of individuals with chronic patterns of homelessness, their rates of chronic homelessness were not among the highest (34% in Los Angeles and 14% in New York).
• Among smaller cities, counties, and regional CoCs, Hendry, Hardee, and Highlands Counties in Florida had the highest rate of chronic homelessness among individuals (63%) followed by Norman, OK (61%). In New Mexico BoS, almost half (48%) of individuals experiencing homelessness had chronic patterns of homelessness, the highest rate of its CoC category.
6Estimates by CoCChronically Homeless Individuals
68
Continuums of Care (CoC) Were Divided into Three Geographic CategoriesMajor city CoCs (n=48) cover the 50 largest cities in the United States. In two cases (Phoenix and Mesa, AZ, and Arlington and Fort Worth, TX), two large cities were located in the same CoC.Smaller city, county, and regional CoCs (n=306) are jurisdictions that are neither one of the 50 largest cities in the United States nor Balance of State and Statewide CoCs.Balance of State (BoS) and statewide CoCs (n=40) are typically composed of multiple rural counties or represent an entire state.
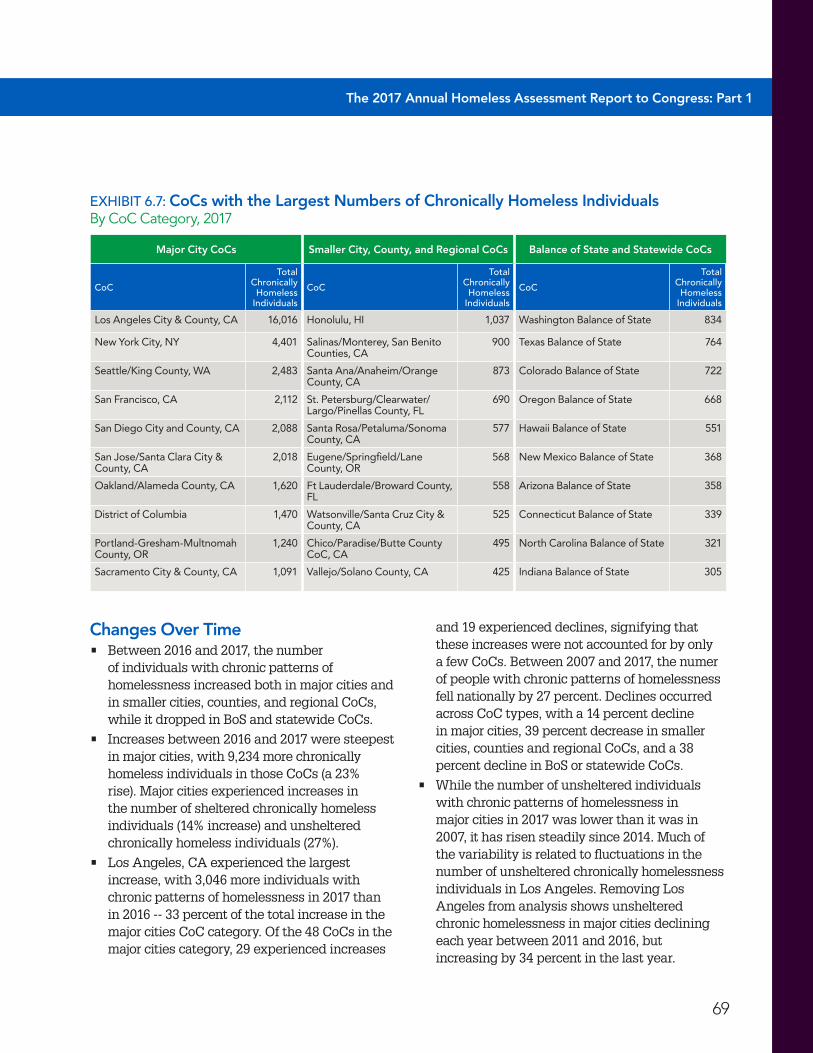
69
The 2017 Annual Homeless Assessment Report to Congress: Part 1
Changes Over Time• Between 2016 and 2017, the number
of individuals with chronic patterns of homelessness increased both in major cities and in smaller cities, counties, and regional CoCs, while it dropped in BoS and statewide CoCs.
• Increases between 2016 and 2017 were steepest in major cities, with 9,234 more chronically homeless individuals in those CoCs (a 23% rise). Major cities experienced increases in the number of sheltered chronically homeless individuals (14% increase) and unsheltered chronically homeless individuals (27%).
• Los Angeles, CA experienced the largest increase, with 3,046 more individuals with chronic patterns of homelessness in 2017 than in 2016 -- 33 percent of the total increase in the major cities CoC category. Of the 48 CoCs in the major cities category, 29 experienced increases
and 19 experienced declines, signifying that these increases were not accounted for by only a few CoCs. Between 2007 and 2017, the numer of people with chronic patterns of homelessness fell nationally by 27 percent. Declines occurred across CoC types, with a 14 percent decline in major cities, 39 percent decrease in smaller cities, counties and regional CoCs, and a 38 percent decline in BoS or statewide CoCs.
• While the number of unsheltered individuals with chronic patterns of homelessness in major cities in 2017 was lower than it was in 2007, it has risen steadily since 2014. Much of the variability is related to fluctuations in the number of unsheltered chronically homelessness individuals in Los Angeles. Removing Los Angeles from analysis shows unsheltered chronic homelessness in major cities declining each year between 2011 and 2016, but increasing by 34 percent in the last year.
EXHIBIT 6 .7: CoCs with the Largest Numbers of Chronically Homeless IndividualsBy CoC Category, 2017
Major City CoCs Smaller City, County, and Regional CoCs Balance of State and Statewide CoCs
CoC
Total Chronically
Homeless Individuals
CoC
Total Chronically
Homeless Individuals
CoC
Total Chronically
Homeless Individuals
Los Angeles City & County, CA 16,016 Honolulu, HI 1,037 Washington Balance of State 834
New York City, NY 4,401 Salinas/Monterey, San Benito Counties, CA
900 Texas Balance of State 764
Seattle/King County, WA 2,483 Santa Ana/Anaheim/Orange County, CA
873 Colorado Balance of State 722
San Francisco, CA 2,112 St . Petersburg/Clearwater/Largo/Pinellas County, FL
690 Oregon Balance of State 668
San Diego City and County, CA 2,088 Santa Rosa/Petaluma/Sonoma County, CA
577 Hawaii Balance of State 551
San Jose/Santa Clara City & County, CA
2,018 Eugene/Springfield/Lane County, OR
568 New Mexico Balance of State 368
Oakland/Alameda County, CA 1,620 Ft Lauderdale/Broward County, FL
558 Arizona Balance of State 358
District of Columbia 1,470 Watsonville/Santa Cruz City & County, CA
525 Connecticut Balance of State 339
Portland-Gresham-Multnomah County, OR
1,240 Chico/Paradise/Butte County CoC, CA
495 North Carolina Balance of State 321
Sacramento City & County, CA 1,091 Vallejo/Solano County, CA 425 Indiana Balance of State 305
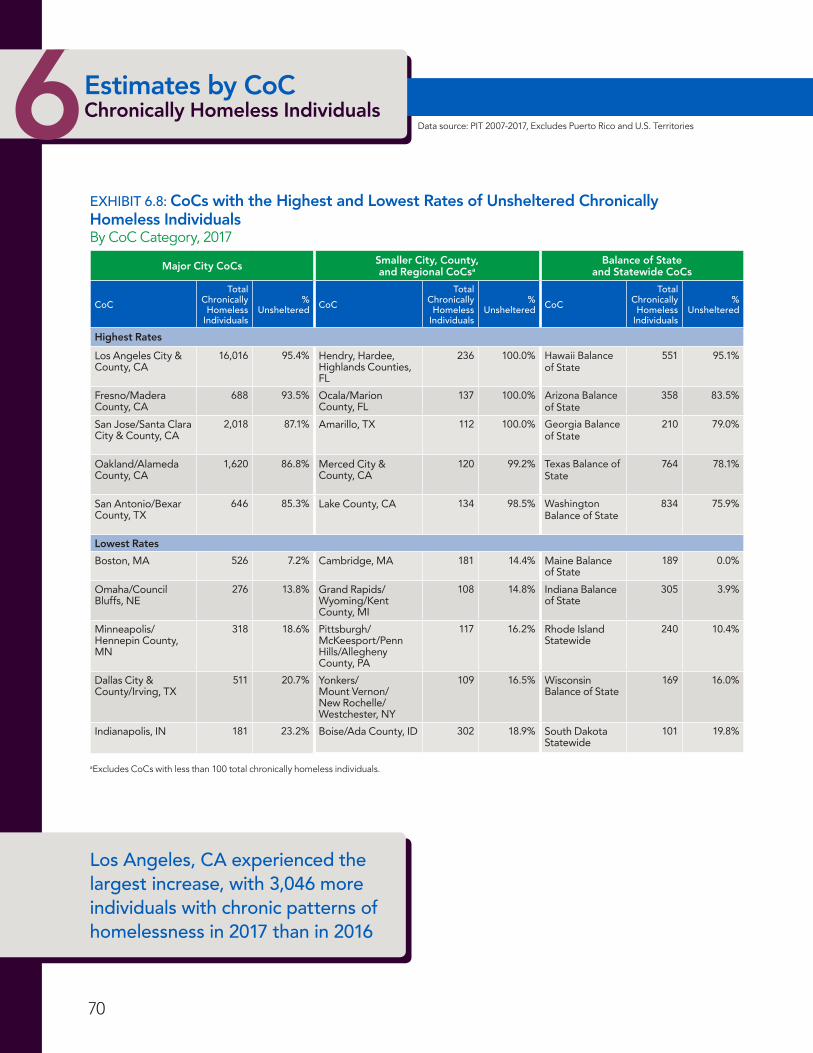
70
1National Estimates Homelessness in the United States6Estimates by CoCChronically Homeless Individuals
Data source: PIT 2007-2017, Excludes Puerto Rico and U.S. Territories
Los Angeles, CA experienced the largest increase, with 3,046 more individuals with chronic patterns of homelessness in 2017 than in 2016
EXHIBIT 6 .8: CoCs with the Highest and Lowest Rates of Unsheltered Chronically Homeless IndividualsBy CoC Category, 2017
Major City CoCs Smaller City, County, and Regional CoCsa
Balance of State and Statewide CoCs
CoC
Total Chronically
Homeless Individuals
% Unsheltered CoC
Total Chronically
Homeless Individuals
% Unsheltered CoC
Total Chronically
Homeless Individuals
% Unsheltered
Highest Rates
Los Angeles City & County, CA
16,016 95 .4% Hendry, Hardee, Highlands Counties, FL
236 100 .0% Hawaii Balance of State
551 95 .1%
Fresno/Madera County, CA
688 93 .5% Ocala/Marion County, FL
137 100 .0% Arizona Balance of State
358 83 .5%
San Jose/Santa Clara City & County, CA
2,018 87 .1% Amarillo, TX 112 100 .0% Georgia Balance of State
210 79 .0%
Oakland/Alameda County, CA
1,620 86 .8% Merced City & County, CA
120 99 .2% Texas Balance of State
764 78 .1%
San Antonio/Bexar County, TX
646 85 .3% Lake County, CA 134 98 .5% Washington Balance of State
834 75 .9%
Lowest Rates
Boston, MA 526 7 .2% Cambridge, MA 181 14 .4% Maine Balance of State
189 0 .0%
Omaha/Council Bluffs, NE
276 13 .8% Grand Rapids/Wyoming/Kent County, MI
108 14 .8% Indiana Balance of State
305 3 .9%
Minneapolis/Hennepin County, MN
318 18 .6% Pittsburgh/McKeesport/Penn Hills/Allegheny County, PA
117 16 .2% Rhode Island Statewide
240 10 .4%
Dallas City & County/Irving, TX
511 20 .7% Yonkers/Mount Vernon/New Rochelle/Westchester, NY
109 16 .5% Wisconsin Balance of State
169 16 .0%
Indianapolis, IN 181 23 .2% Boise/Ada County, ID 302 18 .9% South Dakota Statewide
101 19 .8%
aExcludes CoCs with less than 100 total chronically homeless individuals.
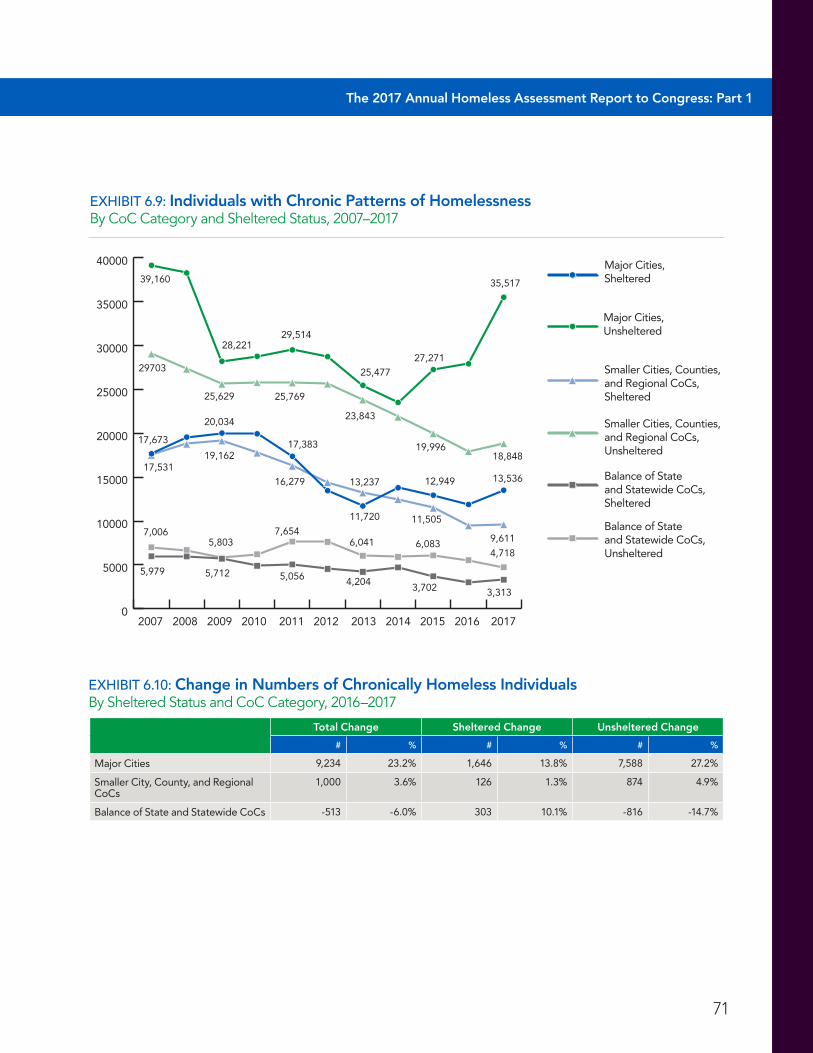
71
The 2017 Annual Homeless Assessment Report to Congress: Part 1
EXHIBIT 6 .10: Change in Numbers of Chronically Homeless IndividualsBy Sheltered Status and CoC Category, 2016–2017
Total Change Sheltered Change Unsheltered Change
# % # % # %
Major Cities 9,234 23 .2% 1,646 13 .8% 7,588 27 .2%
Smaller City, County, and Regional CoCs
1,000 3 .6% 126 1 .3% 874 4 .9%
Balance of State and Statewide CoCs -513 -6 .0% 303 10 .1% -816 -14 .7%
0
5000
10000
15000
20000
25000
30000
35000
40000
Balance of State and Statewide CoCs, Unsheltered
Balance of State and Statewide CoCs, Sheltered
Smaller Cities, Counties, and Regional CoCs, Unsheltered
Smaller Cities, Counties, and Regional CoCs, Sheltered
Major Cities, Unsheltered
Major Cities, Sheltered
0
5000
10000
15000
20000
25000
30000
35000
40000
2007 2008 2009 2010 2011 2012 2013 2014 2015 2016 2017
39,160
20,034
19,16217,383
16,279
11,720
13,237 12,949
11,505
13,536
9,611
28,221
25,629
29,514
27,271
17,673
17,531
5,8037,654
6,041 6,0834,718
7,006
5,712 5,056 4,2043,702 3,313
5,979
25,47729703
23,843
19,99618,848
25,769
35,517
Balance of State and Statewide CoCs, Unsheltered
Balance of State and Statewide CoCs, Sheltered
Smaller Cities, Counties, and Regional CoCs, Unsheltered
Smaller Cities, Counties, and Regional CoCs, Sheltered
Major Cities, Unsheltered
Major Cities, Sheltered
EXHIBIT 6 .9: Individuals with Chronic Patterns of HomelessnessBy CoC Category and Sheltered Status, 2007–2017

72
1National Estimates Homelessness in the United States7Inventory of Bedsin the United States
EXHIBIT 7 .1: Inventory of Beds for Homeless and Formerly Homeless People2007–2017
100000
150000
200000
250000
300000
350000
400000
2007 2008 2009 2010 2011 2012 2013 2014 2015 2016 2017
353,800
188,636195,724
207,589200,623
185,332201,879
197,192
173,224159,784
144,749
120,249
225,840229,206219,381
236,798
211,205 205,062
211,451 211,222
238,708 249,497
318,673
267,106 274,786264,440 264,629
277,537284,298
300,282
340,906
Permanent Supportive Housing
Emergency ShelterTransitional Housing
214,425 221,610
This section describes the nation’s capacity to house homeless and formerly homeless people using housing inventory data submitted by communities each year. These data provide estimates of the number of beds for two types of projects available on the night of the Point-in-Time count:
1. Shelter projects, serving people currently experiencing homelessness: Emergency Shelters, Transitional Housing projects, and Safe Havens
2. Permanent Housing projects, serving formerly homeless people: Rapid Rehousing, Permanent Supportive Housing, and Other Permanent Housing
Data source: HIC 2007–2017
On a Single Night in January 2017• 899,059 beds available on a year-round basis
were available in emergency shelters (ES), safe havens (SH), transitional housing (TH), rapid rehousing (RRH), permanent supportive housing (PSH), or other permanent housing (OPH).
• For the second consecutive year, a larger share of beds was dedicated to housing people who were formerly experiencing homelessness (56%) rather than to providing temporary places to stay in in emergency shelters, safe havens, or transitional housing programs (44%).
• Of the 399,439 beds dedicated to sheltering people currently experiencing homelessness, 70 percent were ES beds, and 30 percent were TH beds. Less than one percent of these beds were provided through SH projects (0.4%).
• Of the 499,620 beds in housing for formerly homeless people, 71 percent were in PSH. Smaller shares were in RRH (19%) and OPH (10%).
Note: The number of Permanent Supportive Housing beds in 2015 is lower than originally reported in the 2015 AHAR. The PSH inventory was reduced by 539 beds in the Riverside City and County CoC.
EXHIBIT 7 .2: Distribution of Bed Inventory By Type, 2017
EmergencyShelter
44.3%Beds for People
Experiencing Homelessness
PermanentSupportiveHousing
RapidRehousing
TransitionalHousing
39.4%
30.9%
13.4%
10.4%
5.8%
OtherPermanent
Housing
55.6%Permanent Housing Beds
Note: The small share of Safe Haven beds (0.1%) not included in this exhibit.
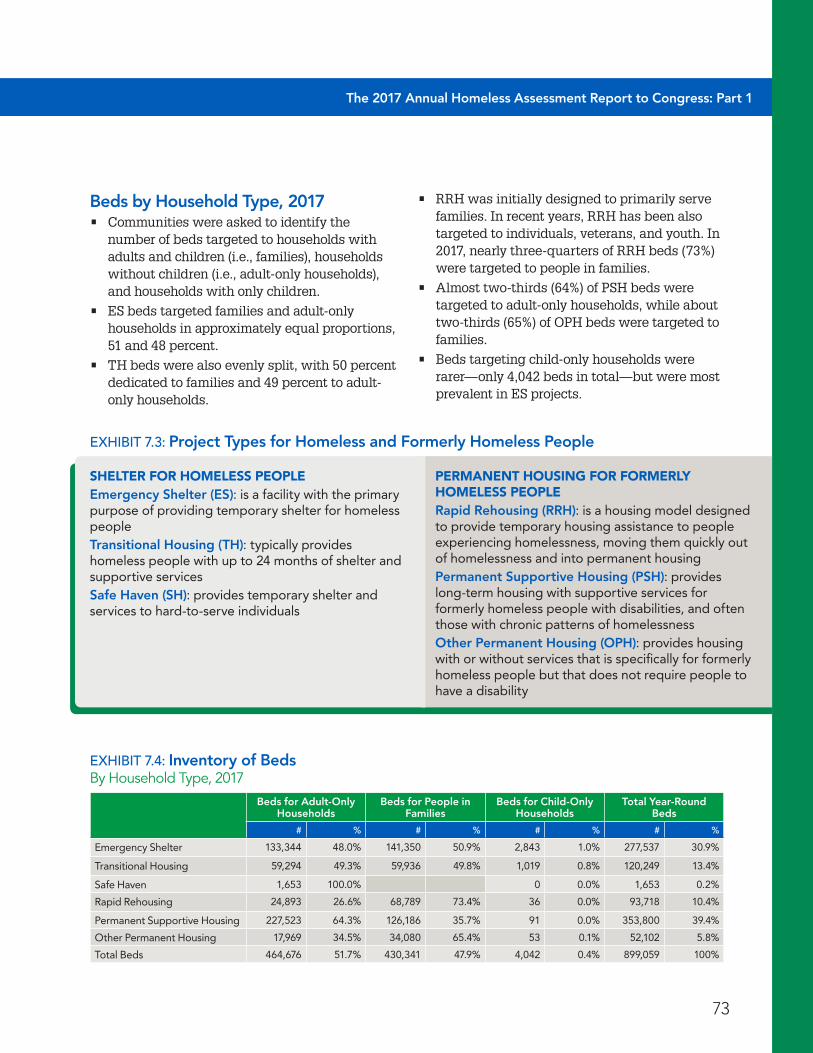
73
The 2017 Annual Homeless Assessment Report to Congress: Part 1
Beds by Household Type, 2017• Communities were asked to identify the
number of beds targeted to households with adults and children (i.e., families), households without children (i.e., adult-only households), and households with only children.
• ES beds targeted families and adult-only households in approximately equal proportions, 51 and 48 percent.
• TH beds were also evenly split, with 50 percent dedicated to families and 49 percent to adult-only households.
• RRH was initially designed to primarily serve families. In recent years, RRH has been also targeted to individuals, veterans, and youth. In 2017, nearly three-quarters of RRH beds (73%) were targeted to people in families.
• Almost two-thirds (64%) of PSH beds were targeted to adult-only households, while about two-thirds (65%) of OPH beds were targeted to families.
• Beds targeting child-only households were rarer—only 4,042 beds in total—but were most prevalent in ES projects.
SHELTER FOR HOMELESS PEOPLEEmergency Shelter (ES): is a facility with the primary purpose of providing temporary shelter for homeless peopleTransitional Housing (TH): typically provides homeless people with up to 24 months of shelter and supportive servicesSafe Haven (SH): provides temporary shelter and services to hard-to-serve individuals
PERMANENT HOUSING FOR FORMERLY HOMELESS PEOPLERapid Rehousing (RRH): is a housing model designed to provide temporary housing assistance to people experiencing homelessness, moving them quickly out of homelessness and into permanent housingPermanent Supportive Housing (PSH): provides long-term housing with supportive services for formerly homeless people with disabilities, and often those with chronic patterns of homelessnessOther Permanent Housing (OPH): provides housing with or without services that is specifically for formerly homeless people but that does not require people to have a disability
EXHIBIT 7 .3: Project Types for Homeless and Formerly Homeless People
EXHIBIT 7 .4: Inventory of BedsBy Household Type, 2017
Beds for Adult-Only Households
Beds for People in Families
Beds for Child-Only Households
Total Year-Round Beds
# % # % # % # %
Emergency Shelter 133,344 48 .0% 141,350 50 .9% 2,843 1 .0% 277,537 30 .9%
Transitional Housing 59,294 49 .3% 59,936 49 .8% 1,019 0 .8% 120,249 13 .4%
Safe Haven 1,653 100 .0% 0 0 .0% 1,653 0 .2%
Rapid Rehousing 24,893 26 .6% 68,789 73 .4% 36 0 .0% 93,718 10 .4%
Permanent Supportive Housing 227,523 64 .3% 126,186 35 .7% 91 0 .0% 353,800 39 .4%
Other Permanent Housing 17,969 34 .5% 34,080 65 .4% 53 0 .1% 52,102 5 .8%
Total Beds 464,676 51 .7% 430,341 47 .9% 4,042 0 .4% 899,059 100%
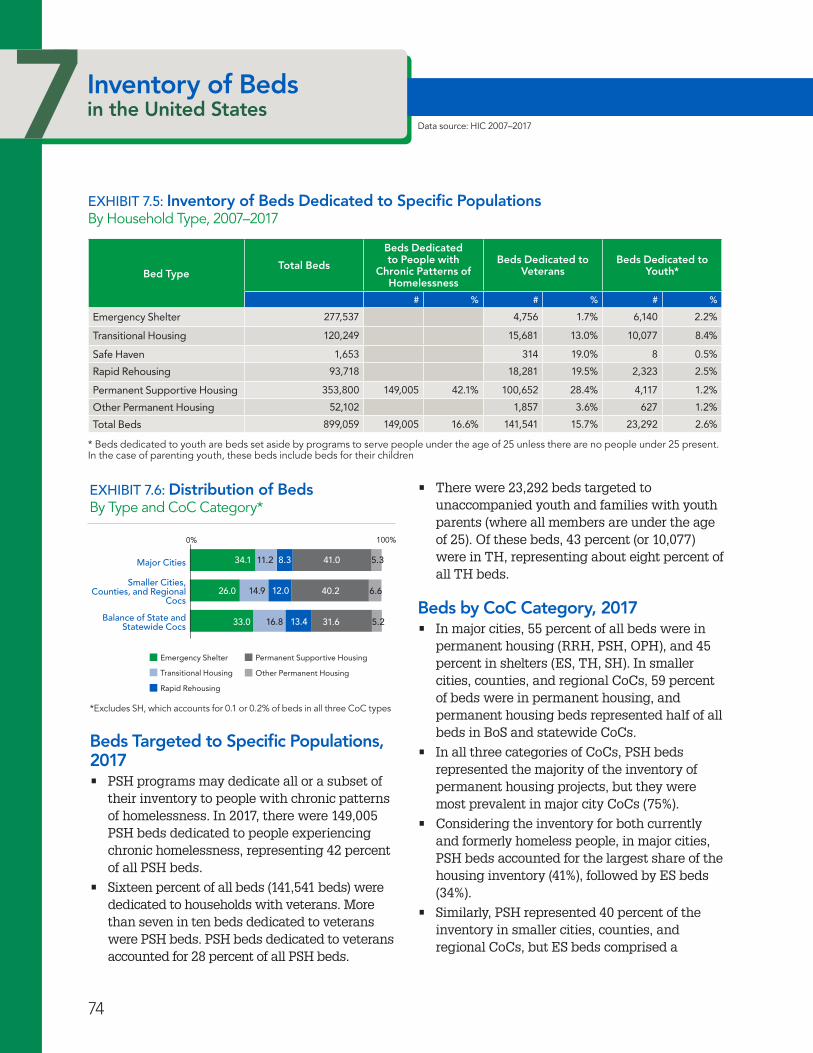
1National Estimates Homelessness in the United States7Inventory of Bedsin the United States
74
Beds Targeted to Specific Populations, 2017• PSH programs may dedicate all or a subset of
their inventory to people with chronic patterns of homelessness. In 2017, there were 149,005 PSH beds dedicated to people experiencing chronic homelessness, representing 42 percent of all PSH beds.
• Sixteen percent of all beds (141,541 beds) were dedicated to households with veterans. More than seven in ten beds dedicated to veterans were PSH beds. PSH beds dedicated to veterans accounted for 28 percent of all PSH beds.
Data source: HIC 2007–2017
• There were 23,292 beds targeted to unaccompanied youth and families with youth parents (where all members are under the age of 25). Of these beds, 43 percent (or 10,077) were in TH, representing about eight percent of all TH beds.
Beds by CoC Category, 2017• In major cities, 55 percent of all beds were in
permanent housing (RRH, PSH, OPH), and 45 percent in shelters (ES, TH, SH). In smaller cities, counties, and regional CoCs, 59 percent of beds were in permanent housing, and permanent housing beds represented half of all beds in BoS and statewide CoCs.
• In all three categories of CoCs, PSH beds represented the majority of the inventory of permanent housing projects, but they were most prevalent in major city CoCs (75%).
• Considering the inventory for both currently and formerly homeless people, in major cities, PSH beds accounted for the largest share of the housing inventory (41%), followed by ES beds (34%).
• Similarly, PSH represented 40 percent of the inventory in smaller cities, counties, and regional CoCs, but ES beds comprised a
EXHIBIT 7 .6: Distribution of Beds By Type and CoC Category*0 100
Balance of State and Statewide CoCs
Smaller Cities, Counties, and Regional CoCs
Major Cities
Major Cities
Smaller Cities, Counties, and Regional
Cocs
Balance of State and Statewide Cocs
0% 100%
34.1
26.0
33.0 31.6
40.2
41.0
16.8
14.9
11.2 5.3
6.6
5.2
8.3
12.0
13.4
Emergency Shelter
Transitional Housing
Rapid Rehousing
Permanent Supportive Housing
Other Permanent Housing
*Excludes SH, which accounts for 0.1 or 0.2% of beds in all three CoC types
EXHIBIT 7 .5: Inventory of Beds Dedicated to Specific PopulationsBy Household Type, 2007–2017
* Beds dedicated to youth are beds set aside by programs to serve people under the age of 25 unless there are no people under 25 present. In the case of parenting youth, these beds include beds for their children
Bed TypeTotal Beds
Beds Dedicated to People with
Chronic Patterns of Homelessness
Beds Dedicated to Veterans
Beds Dedicated to Youth*
# % # % # %
Emergency Shelter 277,537 4,756 1 .7% 6,140 2 .2%
Transitional Housing 120,249 15,681 13 .0% 10,077 8 .4%
Safe Haven 1,653 314 19 .0% 8 0 .5%
Rapid Rehousing 93,718 18,281 19 .5% 2,323 2 .5%
Permanent Supportive Housing 353,800 149,005 42 .1% 100,652 28 .4% 4,117 1 .2%
Other Permanent Housing 52,102 1,857 3 .6% 627 1 .2%
Total Beds 899,059 149,005 16 .6% 141,541 15 .7% 23,292 2 .6%
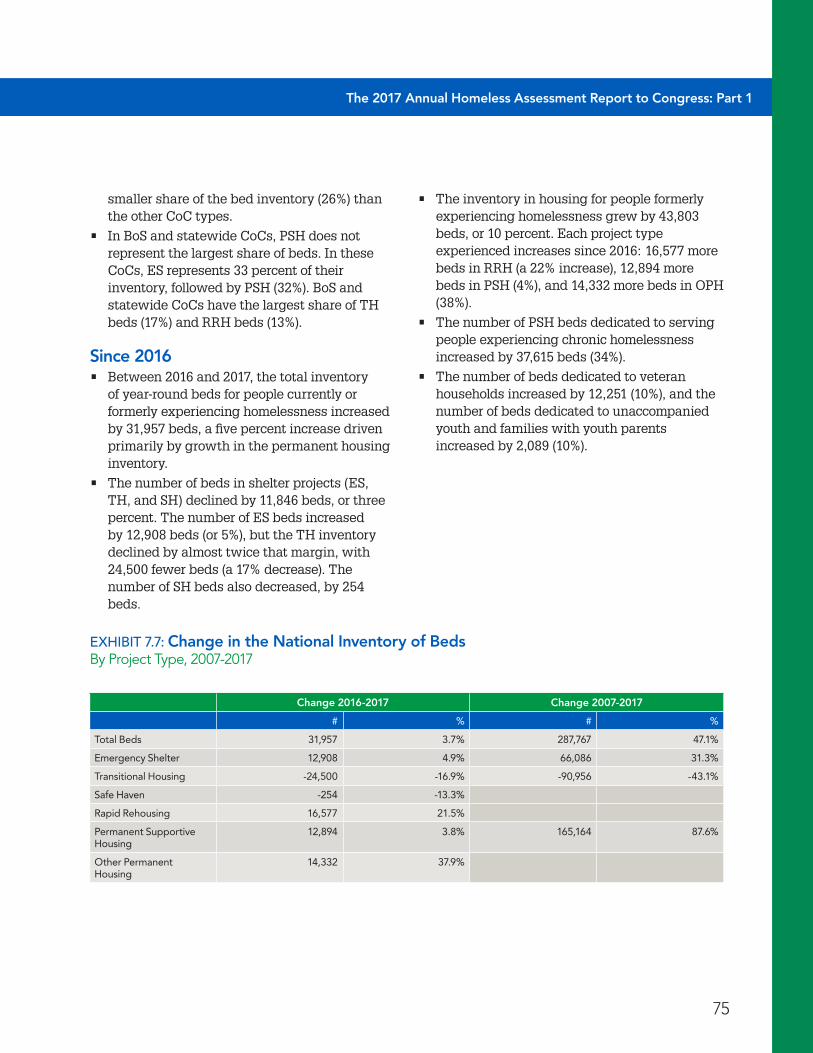
75
The 2017 Annual Homeless Assessment Report to Congress: Part 1
smaller share of the bed inventory (26%) than the other CoC types.
• In BoS and statewide CoCs, PSH does not represent the largest share of beds. In these CoCs, ES represents 33 percent of their inventory, followed by PSH (32%). BoS and statewide CoCs have the largest share of TH beds (17%) and RRH beds (13%).
Since 2016• Between 2016 and 2017, the total inventory
of year-round beds for people currently or formerly experiencing homelessness increased by 31,957 beds, a five percent increase driven primarily by growth in the permanent housing inventory.
• The number of beds in shelter projects (ES, TH, and SH) declined by 11,846 beds, or three percent. The number of ES beds increased by 12,908 beds (or 5%), but the TH inventory declined by almost twice that margin, with 24,500 fewer beds (a 17% decrease). The number of SH beds also decreased, by 254 beds.
• The inventory in housing for people formerly experiencing homelessness grew by 43,803 beds, or 10 percent. Each project type experienced increases since 2016: 16,577 more beds in RRH (a 22% increase), 12,894 more beds in PSH (4%), and 14,332 more beds in OPH (38%).
• The number of PSH beds dedicated to serving people experiencing chronic homelessness increased by 37,615 beds (34%).
• The number of beds dedicated to veteran households increased by 12,251 (10%), and the number of beds dedicated to unaccompanied youth and families with youth parents increased by 2,089 (10%).
EXHIBIT 7 .7: Change in the National Inventory of BedsBy Project Type, 2007-2017
Change 2016-2017 Change 2007-2017
# % # %
Total Beds 31,957 3 .7% 287,767 47 .1%
Emergency Shelter 12,908 4 .9% 66,086 31 .3%
Transitional Housing -24,500 -16 .9% -90,956 -43 .1%
Safe Haven -254 -13 .3%
Rapid Rehousing 16,577 21 .5%
Permanent Supportive Housing
12,894 3 .8% 165,164 87 .6%
Other Permanent Housing
14,332 37 .9%

76
1National Estimates Homelessness in the United States7Inventory of Bedsin the United States
Since 2007• There were 287,767 more beds in 2017 for
people currently or formerly experiencing homelessness than there were in 2007, an increase of 47 percent.
• In 2007, there were about as many ES beds (211,451) as there were TH beds (211,205). Over time, the ES inventory increased, more resources were devoted to permanent housing, and the TH inventory declined. Between 2007 and 2017, the number of TH beds dropped by 43 percent.
• The number of PSH beds has risen each year since 2007, as communities have increasingly devoted resources to PSH. Over the ten-year period from 2007 to 2017, the PSH inventory grew by 165,164 beds in total, an increase of 88 percent.
• Much of the increase in PSH beds is for beds targeting people experiencing chronic homelessness. The number of those beds increased dramatically between 2007 and 2017; 111,198 PSH beds for chronically homeless people were added in this 10-year period, a 294 percent increase.
Data source: HIC 2007–2017
EXHIBIT 7 .8: Inventory of PSH Beds for Chronically Homeless People2007-2017
2007 2008 2009 2010 20122011 2013 2015 2016 20172014
2007–2017
111,198294.1%
94,28295,066
111,390
149,005
4,491 11.9% 8,304
19.6% 4,6549.2% 12,708
23.0% 6,7299.9% 6,973
9.3% 12,61615.5% 784
0.8% 16,32417.2% 37,615
33.8%
37,80742,298
50,602 55,25667,964
74,69381,666
77
The 2017 Annual Homeless Assessment Report to Congress: Part 1
77
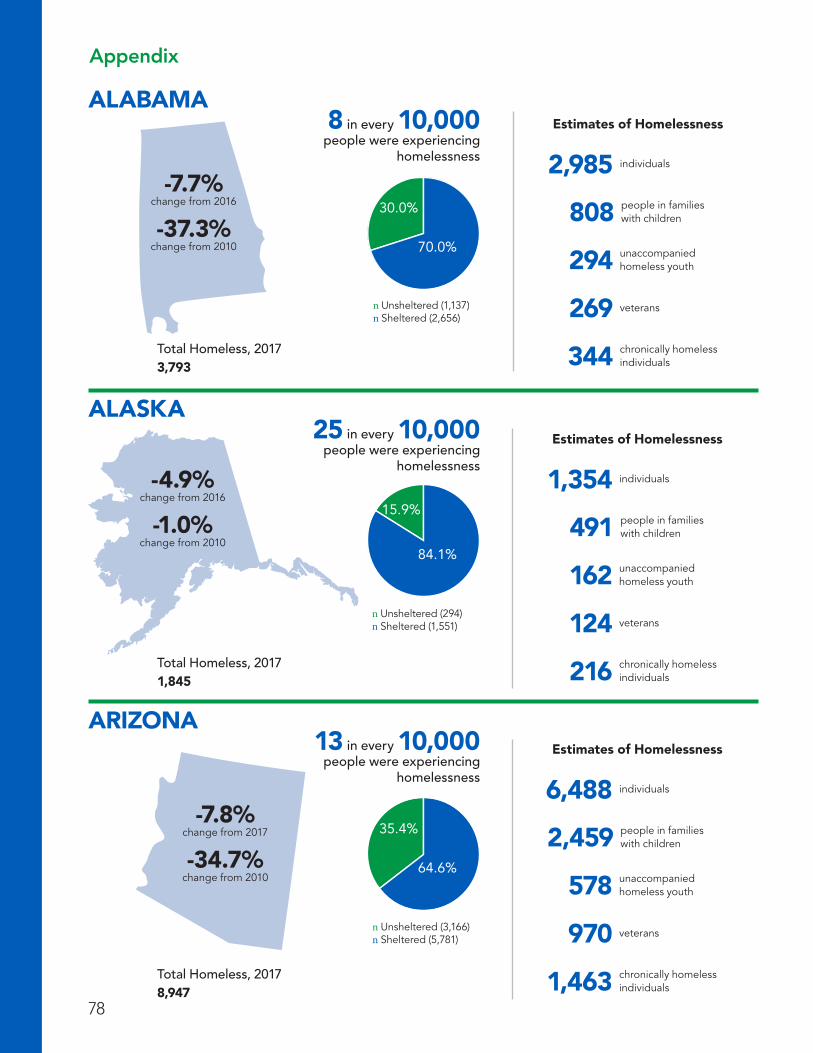
78
Appendix
ALASKA
ARIZONA
-4.9%change from 2016
-1.0%change from 2010
-7.8%change from 2017
-34.7%change from 2010
Total Homeless, 20171,845
Total Homeless, 20178,947
n Unsheltered (294) n Sheltered (1,551)
n Unsheltered (3,166) n Sheltered (5,781)
1,354 individuals
6,488 individuals
people in families with children491
people in families with children2,459
unaccompanied homeless youth162
unaccompanied homeless youth578
chronically homeless individuals216
chronically homeless individuals1,463
veterans124
veterans970
Estimates of Homelessness
Estimates of Homelessness
84.1%
15.9%
64.6%
35.4%
ALABAMA
-7.7%change from 2016
-37.3%change from 2010
Total Homeless, 20173,793
n Unsheltered (1,137) n Sheltered (2,656)
2,985 individuals
people in families with children808unaccompanied homeless youth294
chronically homeless individuals344
veterans269
Estimates of Homelessness
70.0%
30.0%
8 in every 10,000people were experiencing
homelessness
25 in every 10,000people were experiencing
homelessness
13 in every 10,000people were experiencing
homelessness
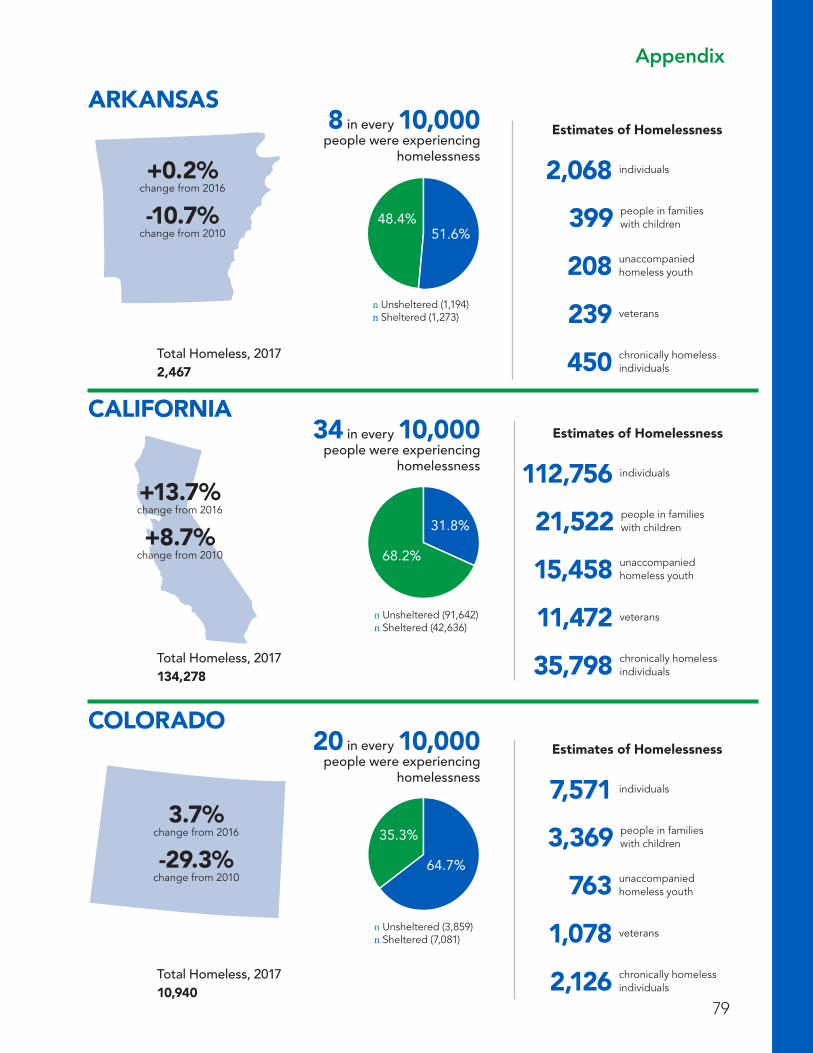
79
Appendix
51.6%48.4%
ARKANSAS
COLORADO
CALIFORNIA
+0.2%change from 2016
-10.7%change from 2010
+13.7%change from 2016
+8.7%change from 2010
3.7%change from 2016
-29.3%change from 2010
Total Homeless, 20172,467
Total Homeless, 2017134,278
Total Homeless, 201710,940
n Unsheltered (1,194) n Sheltered (1,273)
n Unsheltered (91,642) n Sheltered (42,636)
n Unsheltered (3,859) n Sheltered (7,081)
2,068 individuals
112,756 individuals
7,571 individuals
people in families with children399
people in families with children21,522
people in families with children3,369
unaccompanied homeless youth208
unaccompanied homeless youth15,458
unaccompanied homeless youth763
chronically homeless individuals450
chronically homeless individuals35,798
chronically homeless individuals2,126
veterans239
veterans11,472
veterans1,078
Estimates of Homelessness
Estimates of Homelessness
Estimates of Homelessness
68.2%
31.8%
64.7%
35.3%
8 in every 10,000people were experiencing
homelessness
34 in every 10,000people were experiencing
homelessness
20 in every 10,000people were experiencing
homelessness

80
Appendix
CONNECTICUT
DISTRICT OF COLUMBIA
DELAWARE
-13.2%change from 2016
-21.5%change from 2010
-7.1%change from 2016
+1.2%change from 2010
-10.5%change from 2016
+14.3%change from 2010
Total Homeless, 20173,388
Total Homeless, 2017994
Total Homeless, 20177,473
n Unsheltered (416) n Sheltered (2,972)
n Unsheltered (58) n Sheltered (936)
n Unsheltered (897) n Sheltered (6,576)
2,208 individuals
615 individuals
3,583 individuals
people in families with children1,180
people in families with children379
people in families with children3,890
unaccompanied homeless youth170
unaccompanied homeless youth45
unaccompanied homeless youth228
chronically homeless individuals387
chronically homeless individuals123
chronically homeless individuals1,470
veterans191
veterans91
veterans285
Estimates of Homelessness
Estimates of Homelessness
Estimates of Homelessness
87.7%
12.3%
94.2%
5.8%
88.0%
12.0%
10 in every 10,000people were experiencing
homelessness
10 in every 10,000people were experiencing
homelessness
110 in every 10,000people were experiencing
homelessness
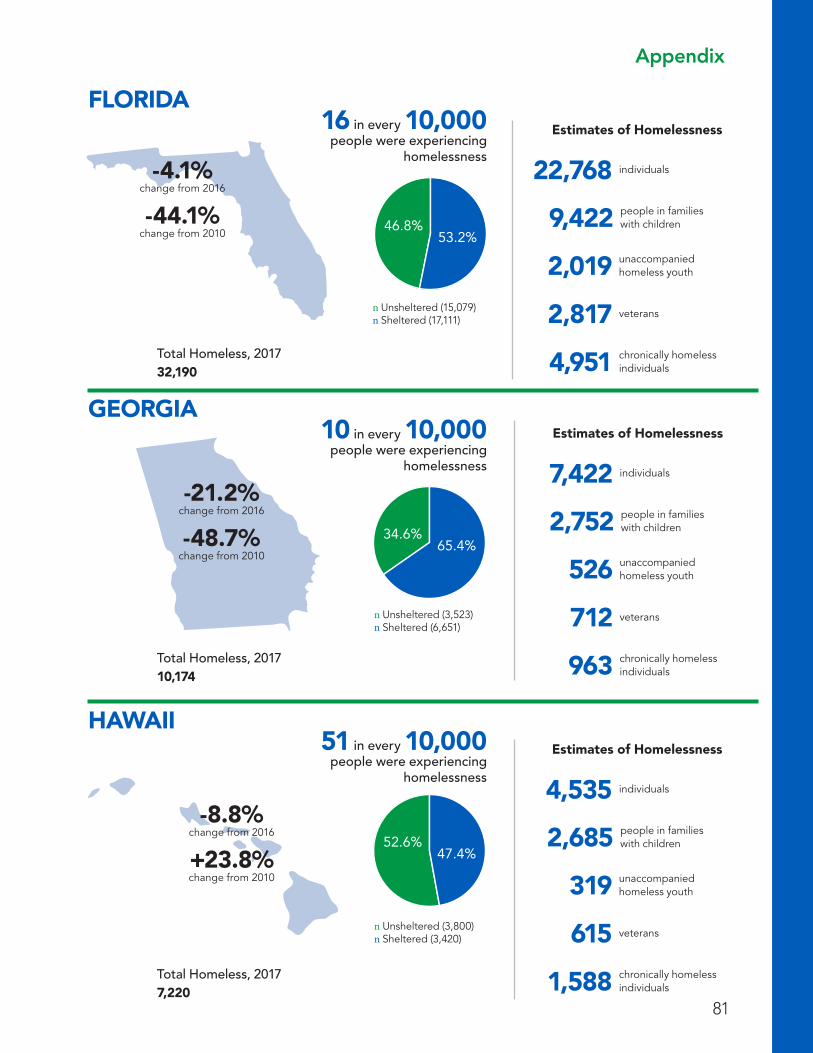
81
Appendix
FLORIDA
HAWAII
GEORGIA
-4.1%change from 2016
-44.1%change from 2010
-21.2%change from 2016
-48.7%change from 2010
-8.8%change from 2016
+23.8%change from 2010
Total Homeless, 201732,190
Total Homeless, 201710,174
Total Homeless, 20177,220
n Unsheltered (15,079) n Sheltered (17,111)
n Unsheltered (3,523) n Sheltered (6,651)
n Unsheltered (3,800) n Sheltered (3,420)
22,768 individuals
7,422 individuals
4,535 individuals
people in families with children9,422
people in families with children2,752
people in families with children2,685
unaccompanied homeless youth2,019
unaccompanied homeless youth526
unaccompanied homeless youth319
chronically homeless individuals4,951
chronically homeless individuals963
chronically homeless individuals1,588
veterans2,817
veterans712
veterans615
Estimates of Homelessness
Estimates of Homelessness
Estimates of Homelessness
53.2%46.8%
65.4%34.6%
47.4%52.6%
16 in every 10,000people were experiencing
homelessness
10 in every 10,000people were experiencing
homelessness
51 in every 10,000people were experiencing
homelessness
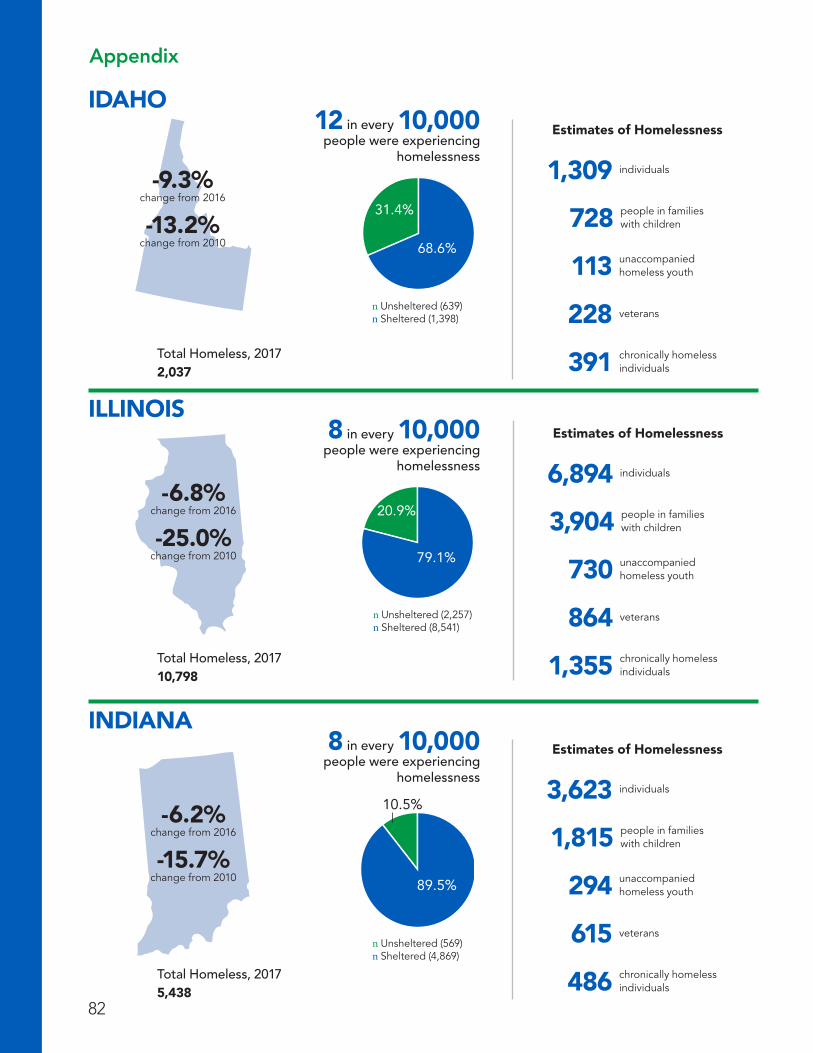
82
Appendix
IDAHO
INDIANA
ILLINOIS
-9.3%change from 2016
-13.2%change from 2010
-6.8%change from 2016
-25.0%change from 2010
-6.2%change from 2016
-15.7%change from 2010
Total Homeless, 20172,037
Total Homeless, 201710,798
Total Homeless, 20175,438
n Unsheltered (639) n Sheltered (1,398)
n Unsheltered (2,257) n Sheltered (8,541)
n Unsheltered (569) n Sheltered (4,869)
1,309 individuals
6,894 individuals
3,623 individuals
people in families with children728
people in families with children3,904
people in families with children1,815
unaccompanied homeless youth113
unaccompanied homeless youth730
unaccompanied homeless youth294
chronically homeless individuals391
chronically homeless individuals1,355
chronically homeless individuals486
veterans228
veterans864
veterans615
Estimates of Homelessness
Estimates of Homelessness
Estimates of Homelessness
68.6%
31.4%
79.1%
20.9%
89.5%
10.5%
12 in every 10,000people were experiencing
homelessness
8 in every 10,000people were experiencing
homelessness
8 in every 10,000people were experiencing
homelessness

83
Appendix
IOWA
KENTUCKY
KANSAS
-10.1%change from 2016
-8.6%change from 2010
+1.4%change from 2016
+13.0%change from 2010
-5.0%change from 2016
-39.2%change from 2010
Total Homeless, 20172,756
Total Homeless, 20172,287
Total Homeless, 20174,025
n Unsheltered (104) n Sheltered (2,652)
n Unsheltered (345) n Sheltered (1,942)
n Unsheltered (727) n Sheltered (3,298)
1,500 individuals
1,423 individuals
3,032 individuals
people in families with children1,256
people in families with children864
people in families with children993
unaccompanied homeless youth140
unaccompanied homeless youth103
unaccompanied homeless youth253
chronically homeless individuals170
chronically homeless individuals252
chronically homeless individuals383
veterans171
veterans217
veterans489
Estimates of Homelessness
Estimates of Homelessness
Estimates of Homelessness
96.2%
3.8%
84.9%
15.1%
81.9%
18.1%
9 in every 10,000people were experiencing
homelessness
8 in every 10,000people were experiencing
homelessness
9 in every 10,000people were experiencing
homelessness
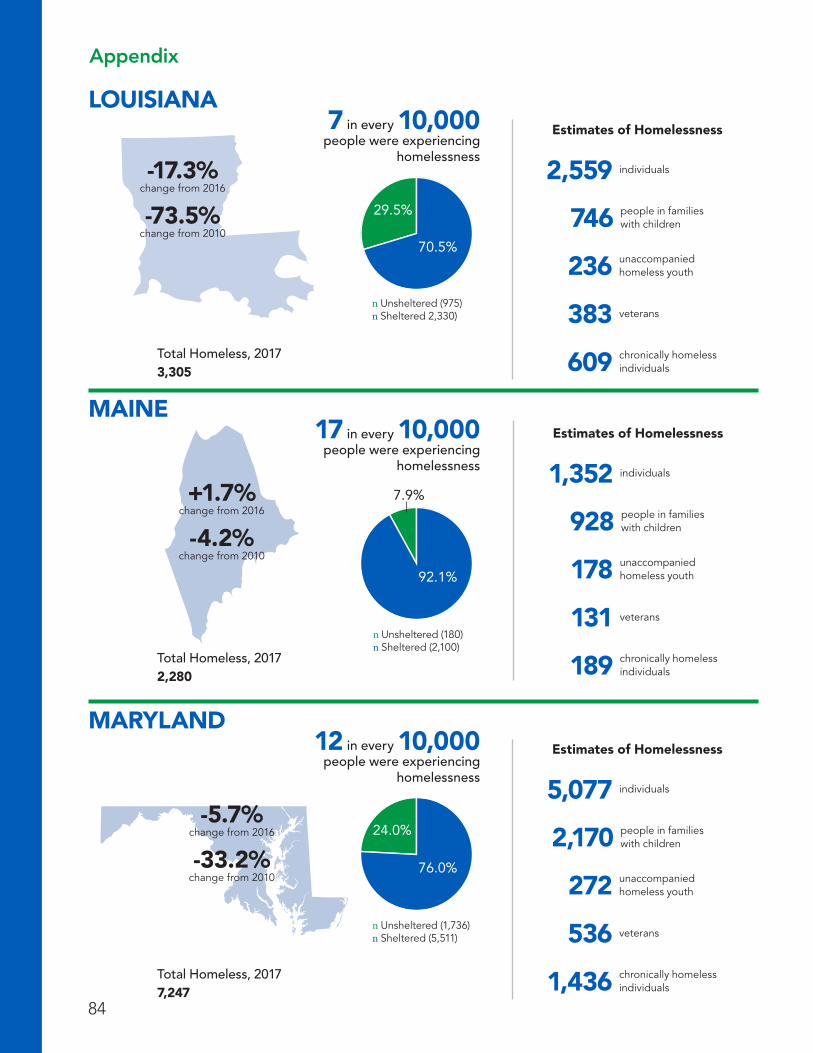
84
Appendix
LOUISIANA
MARYLAND
MAINE
-17.3%change from 2016
-73.5%change from 2010
+1.7%change from 2016
-4.2%change from 2010
-5.7%change from 2016
-33.2%change from 2010
Total Homeless, 20173,305
Total Homeless, 20172,280
Total Homeless, 20177,247
n Unsheltered (975) n Sheltered 2,330)
n Unsheltered (180) n Sheltered (2,100)
n Unsheltered (1,736) n Sheltered (5,511)
2,559 individuals
1,352 individuals
5,077 individuals
people in families with children746
people in families with children928
people in families with children2,170
unaccompanied homeless youth236
unaccompanied homeless youth178
unaccompanied homeless youth272
chronically homeless individuals609
chronically homeless individuals189
chronically homeless individuals1,436
veterans383
veterans131
veterans536
Estimates of Homelessness
Estimates of Homelessness
Estimates of Homelessness
70.5%
29.5%
92.1%
7.9%
76.0%
24.0%
7 in every 10,000people were experiencing
homelessness
17 in every 10,000people were experiencing
homelessness
12 in every 10,000people were experiencing
homelessness
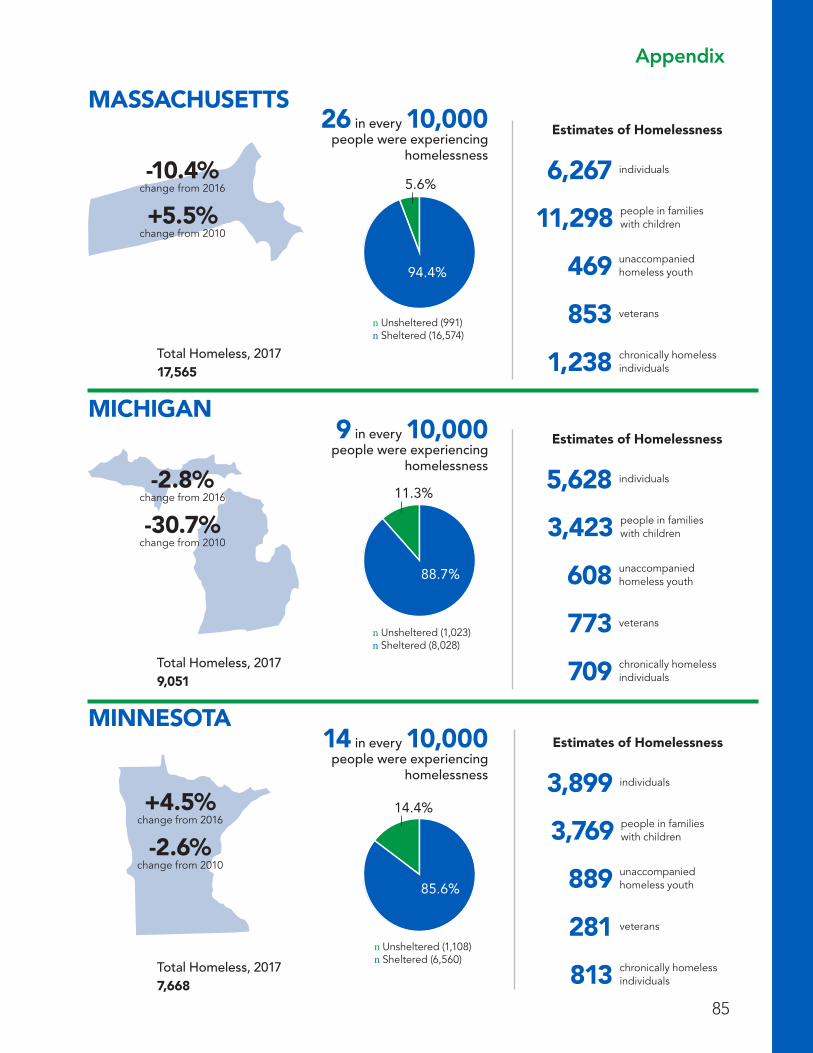
85
Appendix
MICHIGAN
MASSACHUSETTS
MINNESOTA
-2.8%change from 2016
-30.7%change from 2010
-10.4%change from 2016
+5.5%change from 2010
+4.5%change from 2016
-2.6%change from 2010
Total Homeless, 20179,051
Total Homeless, 201717,565
Total Homeless, 20177,668
n Unsheltered (1,023) n Sheltered (8,028)
n Unsheltered (991) n Sheltered (16,574)
n Unsheltered (1,108) n Sheltered (6,560)
5,628 individuals
6,267 individuals
3,899 individuals
people in families with children3,423
people in families with children11,298
people in families with children3,769
unaccompanied homeless youth608
unaccompanied homeless youth469
unaccompanied homeless youth889
chronically homeless individuals709
chronically homeless individuals1,238
chronically homeless individuals813
veterans773
veterans853
veterans281
Estimates of Homelessness
Estimates of Homelessness
Estimates of Homelessness
88.7%
11.3%
94.4%
5.6%
14.4%
85.6%
26 in every 10,000people were experiencing
homelessness
9 in every 10,000people were experiencing
homelessness
14 in every 10,000people were experiencing
homelessness

86
Appendix
MISSOURI
MONTANA
-2.5%change from 2016
-25.7%change from 2010
+7.8%change from 2016
-5.3%change from 2010
Total Homeless, 20176,037
Total Homeless, 20171,529
n Unsheltered (1,152) n Sheltered (4,885)
n Unsheltered (544) n Sheltered (985)
3,768 individuals
987 individuals
people in families with children2,269
people in families with children542
unaccompanied homeless youth548
unaccompanied homeless youth106
chronically homeless individuals883
chronically homeless individuals182
veterans538
veterans205
Estimates of Homelessness
Estimates of Homelessness
80.9%
19.1%
64.4%35.6%
MISSISSIPPI
-15.3%change from 2016
-46.3%change from 2010
Total Homeless, 20171,472
n Unsheltered (719) n Sheltered (753)
1,100 individuals
people in families with children372unaccompanied homeless youth59
chronically homeless individuals61
veterans57
Estimates of Homelessness
51.2%48.8%
5 in every 10,000people were experiencing
homelessness
10 in every 10,000people were experiencing
homelessness
15 in every 10,000people were experiencing
homelessness
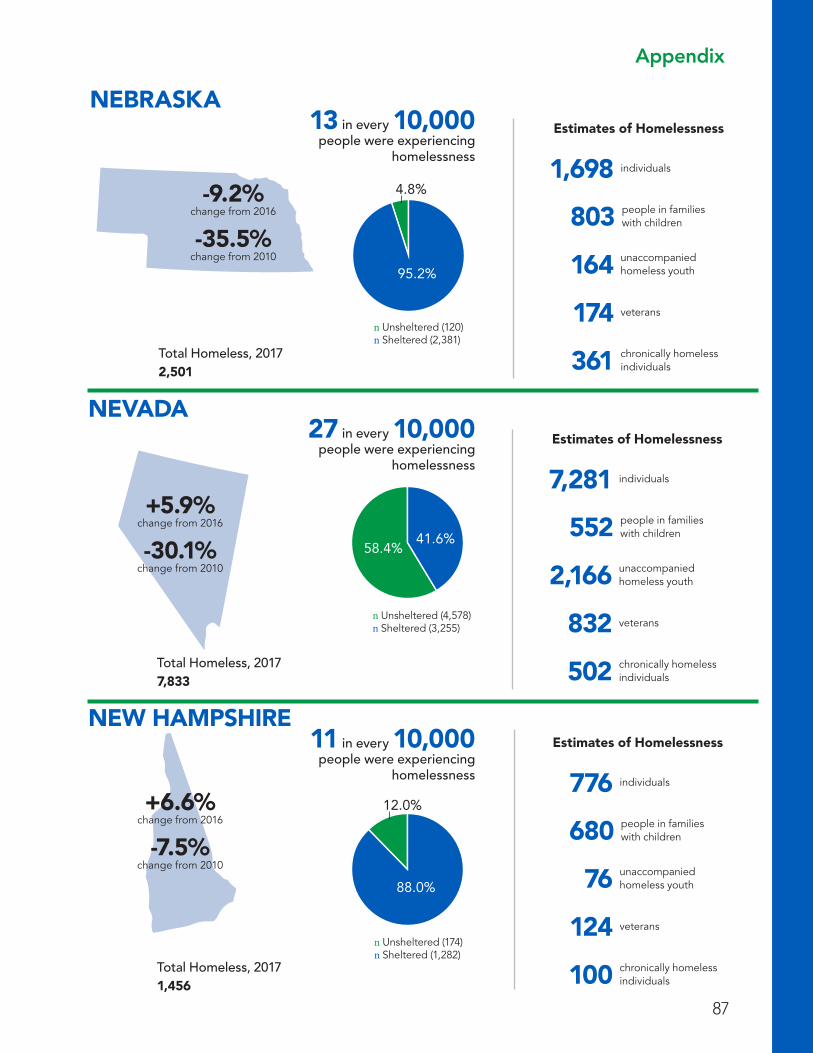
87
Appendix
NEBRASKA
-9.2%change from 2016
-35.5%change from 2010
Total Homeless, 20172,501
n Unsheltered (120) n Sheltered (2,381)
1,698 individuals
people in families with children803unaccompanied homeless youth164
chronically homeless individuals361
veterans174
Estimates of Homelessness
NEVADA
NEW HAMPSHIRE
+6.6%change from 2016
-7.5%change from 2010
+5.9%change from 2016
-30.1%change from 2010
Total Homeless, 20177,833
Total Homeless, 20171,456
n Unsheltered (4,578) n Sheltered (3,255)
n Unsheltered (174) n Sheltered (1,282)
7,281 individuals
776 individuals
people in families with children552
people in families with children680
unaccompanied homeless youth2,166
unaccompanied homeless youth76
chronically homeless individuals502
chronically homeless individuals100
veterans832
veterans124
Estimates of Homelessness
Estimates of Homelessness
41.6%58.4%
88.0%
12.0%
95.2%
4.8%
13 in every 10,000people were experiencing
homelessness
27 in every 10,000people were experiencing
homelessness
11 in every 10,000people were experiencing
homelessness
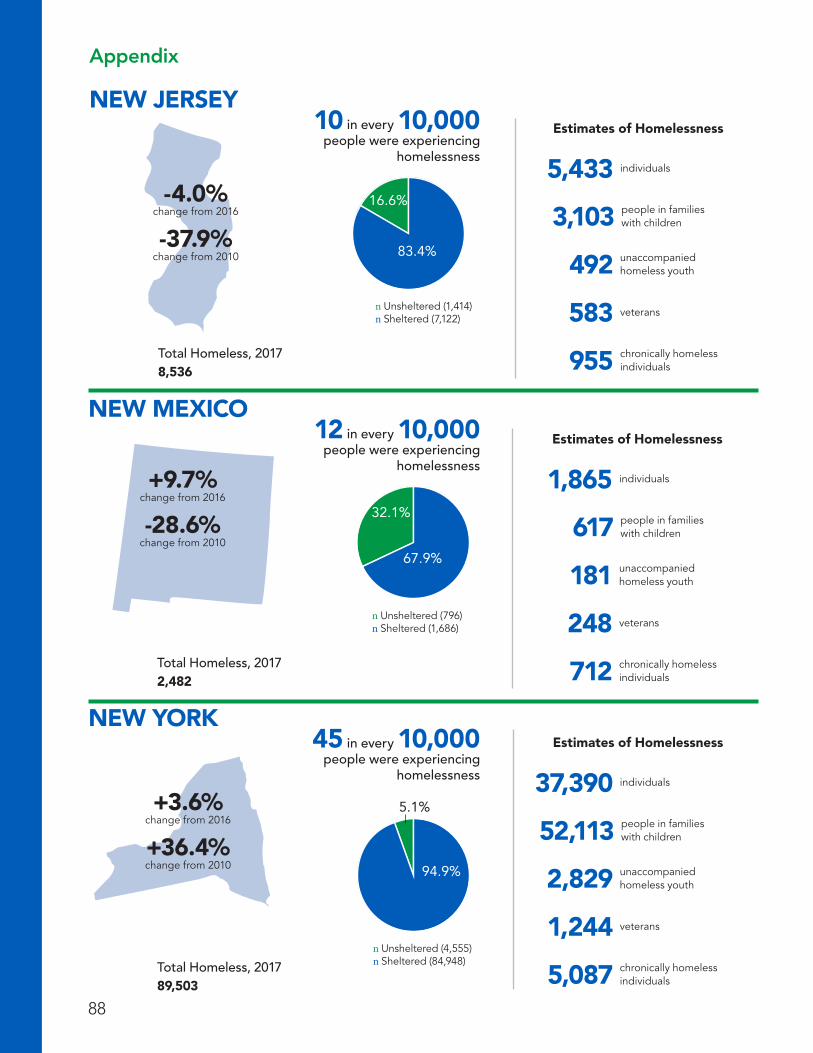
88
Appendix
NEW MEXICO
NEW YORK
+9.7%change from 2016
-28.6%change from 2010
+3.6%change from 2016
+36.4%change from 2010
Total Homeless, 20172,482
Total Homeless, 201789,503
n Unsheltered (796) n Sheltered (1,686)
n Unsheltered (4,555) n Sheltered (84,948)
1,865 individuals
37,390 individuals
people in families with children617
people in families with children52,113
unaccompanied homeless youth181
unaccompanied homeless youth2,829
chronically homeless individuals712
chronically homeless individuals5,087
veterans248
veterans1,244
Estimates of Homelessness
Estimates of Homelessness
67.9%
32.1%
94.9%
5.1%
NEW JERSEY
-4.0%change from 2016
-37.9%change from 2010
Total Homeless, 20178,536
n Unsheltered (1,414) n Sheltered (7,122)
5,433 individuals
people in families with children3,103unaccompanied homeless youth492
chronically homeless individuals955
veterans583
Estimates of Homelessness
83.4%
16.6%
10 in every 10,000people were experiencing
homelessness
12 in every 10,000people were experiencing
homelessness
45 in every 10,000people were experiencing
homelessness
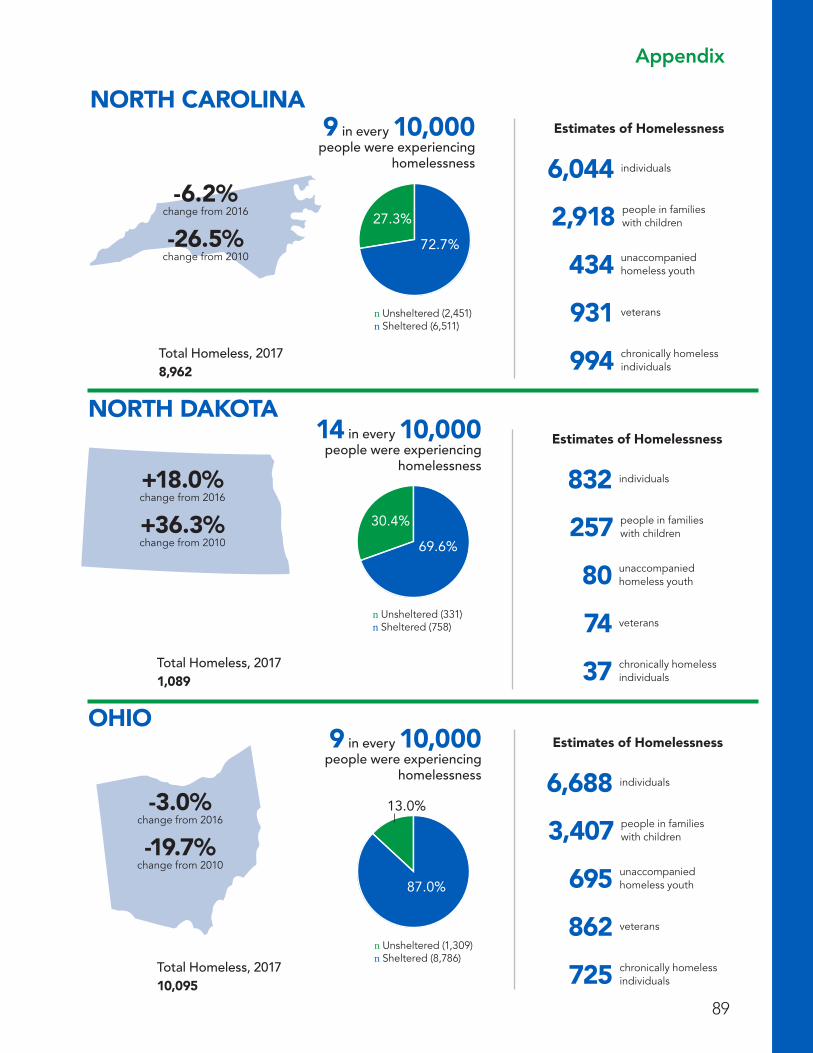
89
Appendix
NORTH CAROLINA
-6.2%change from 2016
-26.5%change from 2010
Total Homeless, 20178,962
n Unsheltered (2,451) n Sheltered (6,511)
6,044 individuals
people in families with children2,918unaccompanied homeless youth434
chronically homeless individuals994
veterans931
Estimates of Homelessness
NORTH DAKOTA
OHIO
+18.0%change from 2016
+36.3%change from 2010
-3.0%change from 2016
-19.7%change from 2010
Total Homeless, 20171,089
Total Homeless, 201710,095
n Unsheltered (331) n Sheltered (758)
n Unsheltered (1,309) n Sheltered (8,786)
832 individuals
6,688 individuals
people in families with children257
people in families with children3,407
unaccompanied homeless youth80
unaccompanied homeless youth695
chronically homeless individuals37
chronically homeless individuals725
veterans74
veterans862
Estimates of Homelessness
Estimates of Homelessness
69.6%
30.4%
87.0%
13.0%
72.7%
27.3%
9 in every 10,000people were experiencing
homelessness
14 in every 10,000people were experiencing
homelessness
9 in every 10,000people were experiencing
homelessness

90
Appendix
OREGON
PENNSYLVANIA
+5.4%change from 2016
-28.4%change from 2010
-7.8%change from 2016
-2.6%change from 2010
Total Homeless, 201713,953
Total Homeless, 201714,138
n Unsheltered (7,967) n Sheltered (5,986)
n Unsheltered (1,798) n Sheltered (12,340)
10,434 individuals
8,271 individuals
people in families with children3,519
people in families with children5,867
unaccompanied homeless youth1,462
unaccompanied homeless youth756
chronically homeless individuals3,120
chronically homeless individuals1,372
veterans1,251
veterans963
Estimates of Homelessness
Estimates of Homelessness
42.9%57.1%
87.3%
12.7%
OKLAHOMA
+2.2%change from 2016
-19.7%change from 2010
Total Homeless, 20174,199
n Unsheltered (1,115) n Sheltered (3,084)
2,824 individuals
people in families with children1,375unaccompanied homeless youth363
chronically homeless individuals578
veterans349
Estimates of Homelessness
73.4%
26.6%
11 in every 10,000people were experiencing
homelessness
34 in every 10,000people were experiencing
homelessness
11 in every 10,000people were experiencing
homelessness

91
Appendix
RHODE ISLAND
+1.7%change from 2016
-8.0%change from 2010
Total Homeless, 20171,180
n Unsheltered (69) n Sheltered (1,111)
802 individuals
people in families with children378unaccompanied homeless youth49
chronically homeless individuals240
veterans95
Estimates of Homelessness
SOUTH CAROLINA
SOUTH DAKOTA
-22.5%change from 2016
-12.5%change from 2010
-12.0%change from 2016
+29.0%change from 2010
Total Homeless, 20173,916
Total Homeless, 2017943
n Unsheltered (1,501) n Sheltered (2,415)
n Unsheltered (171) n Sheltered (772)
2,896 individuals
611 individuals
people in families with children1,020
people in families with children332
unaccompanied homeless youth173
unaccompanied homeless youth66
chronically homeless individuals792
chronically homeless individuals101
veterans480
veterans130
Estimates of Homelessness
Estimates of Homelessness
61.7%
38.3%
81.9%
18.1%
94.2%
5.8%
11 in every 10,000people were experiencing
homelessness
8 in every 10,000people were experiencing
homelessness
11 in every 10,000people were experiencing
homelessness
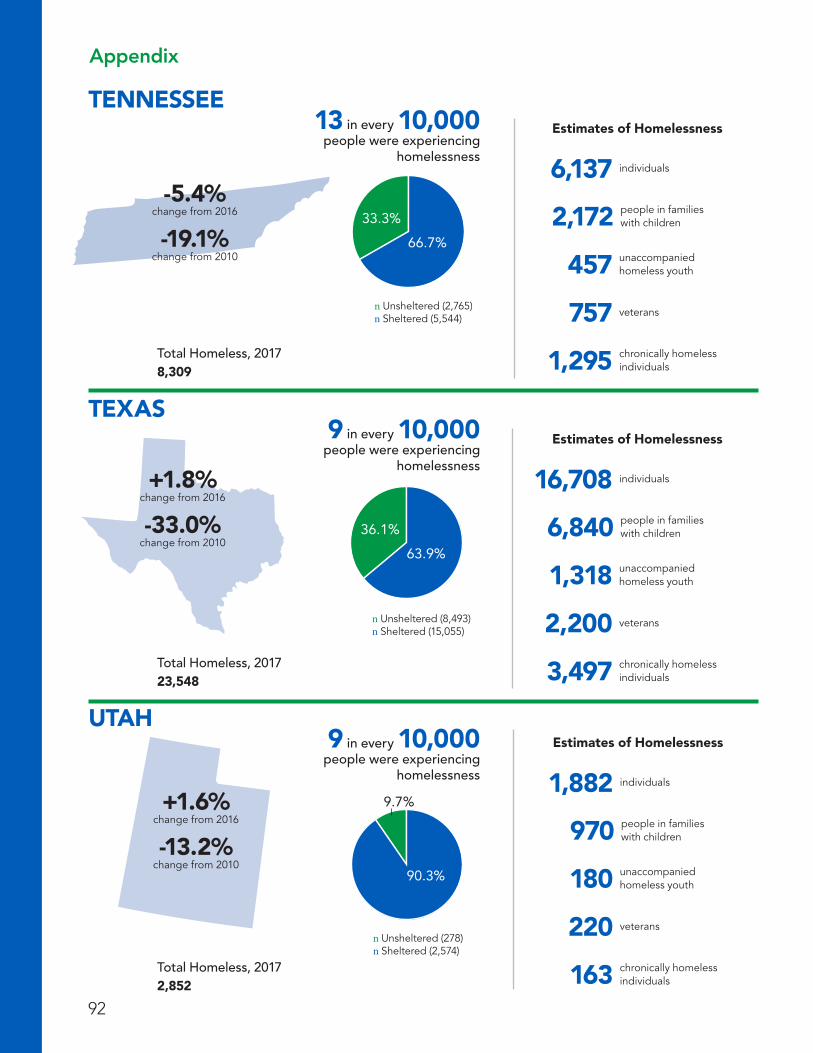
92
Appendix
TEXAS
UTAH
+1.8%change from 2016
-33.0%change from 2010
+1.6%change from 2016
-13.2%change from 2010
Total Homeless, 201723,548
Total Homeless, 20172,852
n Unsheltered (8,493) n Sheltered (15,055)
n Unsheltered (278) n Sheltered (2,574)
16,708 individuals
1,882 individuals
people in families with children6,840
people in families with children970
unaccompanied homeless youth1,318
unaccompanied homeless youth180
chronically homeless individuals3,497
chronically homeless individuals163
veterans2,200
veterans220
Estimates of Homelessness
Estimates of Homelessness
63.9%
36.1%
90.3%
9.7%
TENNESSEE
-5.4%change from 2016
-19.1%change from 2010
Total Homeless, 20178,309
n Unsheltered (2,765) n Sheltered (5,544)
6,137 individuals
people in families with children2,172unaccompanied homeless youth457
chronically homeless individuals1,295
veterans757
Estimates of Homelessness
66.7%
33.3%
13 in every 10,000people were experiencing
homelessness
9 in every 10,000people were experiencing
homelessness
9 in every 10,000people were experiencing
homelessness
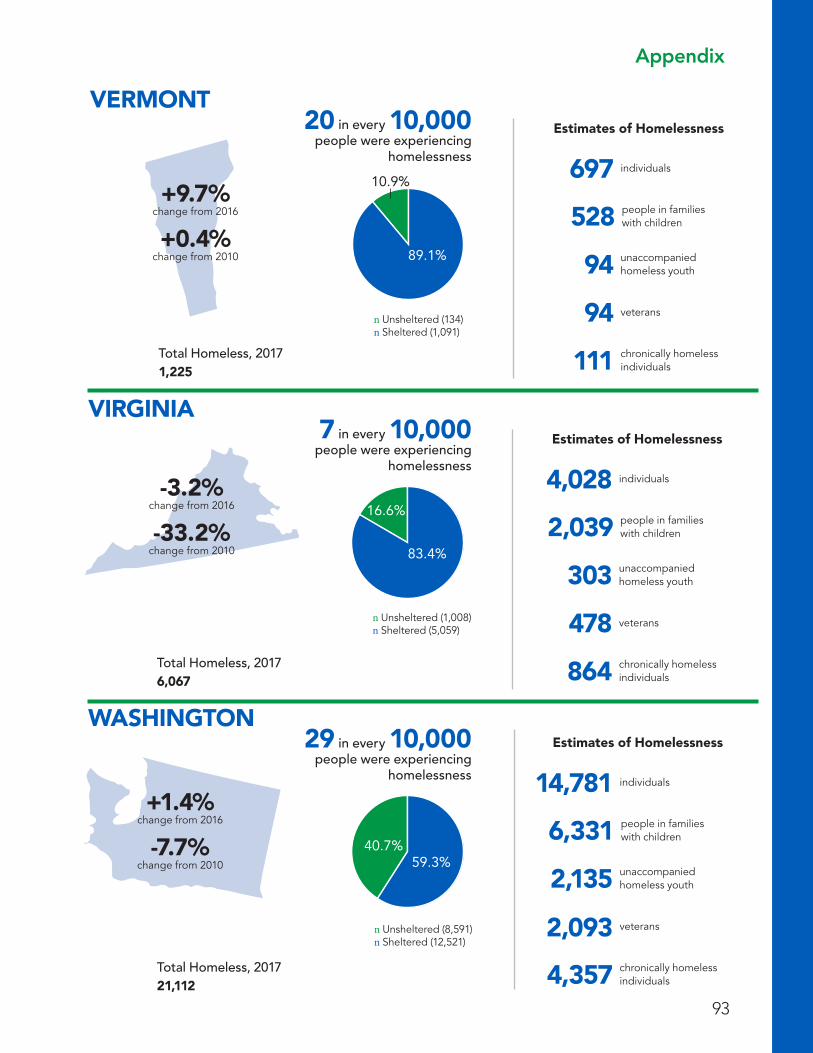
93
Appendix
VERMONT
+9.7%change from 2016
+0.4%change from 2010
Total Homeless, 20171,225
n Unsheltered (134) n Sheltered (1,091)
697 individuals
people in families with children528unaccompanied homeless youth94
chronically homeless individuals111
veterans94
Estimates of Homelessness
VIRGINIA
WASHINGTON
-3.2%change from 2016
-33.2%change from 2010
+1.4%change from 2016
-7.7%change from 2010
Total Homeless, 20176,067
Total Homeless, 201721,112
n Unsheltered (1,008) n Sheltered (5,059)
n Unsheltered (8,591) n Sheltered (12,521)
4,028 individuals
14,781 individuals
people in families with children2,039
people in families with children6,331
unaccompanied homeless youth303
unaccompanied homeless youth2,135
chronically homeless individuals864
chronically homeless individuals4,357
veterans478
veterans2,093
Estimates of Homelessness
Estimates of Homelessness
83.4%
16.6%
59.3%40.7%
89.1%
10.9%
20 in every 10,000people were experiencing
homelessness
7 in every 10,000people were experiencing
homelessness
29 in every 10,000people were experiencing
homelessness

94
Appendix
WISCONSIN
WYOMING
-11.6%change from 2016
-20.6%change from 2010
+1.9%change from 2016
+50.8%change from 2010
Total Homeless, 20175,027
Total Homeless, 2017873
n Unsheltered (340) n Sheltered (4,687)
n Unsheltered (363) n Sheltered (510)
2,645 individuals
622 individuals
people in families with children2,382
people in families with children251
unaccompanied homeless youth276
unaccompanied homeless youth62
chronically homeless individuals342
chronically homeless individuals14
veterans329
veterans63
Estimates of Homelessness
Estimates of Homelessness
93.2%
6.8%
58.4%41.6%
WEST VIRGINIA
-5.6%change from 2016
-42.2%change from 2010
Total Homeless, 20171,309
n Unsheltered (188) n Sheltered (1,121)
1,032 individuals
people in families with children277unaccompanied homeless youth79
chronically homeless individuals188
veterans137
Estimates of Homelessness
85.6%
14.4%
7 in every 10,000people were experiencing
homelessness
9 in every 10,000people were experiencing
homelessness
15 in every 10,000people were experiencing
homelessness

The U.S. Department of Housing and Urban DevelopmentOFFICE OF COMMUNITY PLANNING AND DEVELOPMENT