The 2016 CPA-Zicklin Index of Corporate Political...
55
The 2016 CPA-Zicklin Index of Corporate Political Disclosure and Accountability S&P 500 Review Shows Political Disclosure and Oversight Becoming Common Practice
-
Upload
vuongkhuong -
Category
Documents
-
view
217 -
download
0
Transcript of The 2016 CPA-Zicklin Index of Corporate Political...
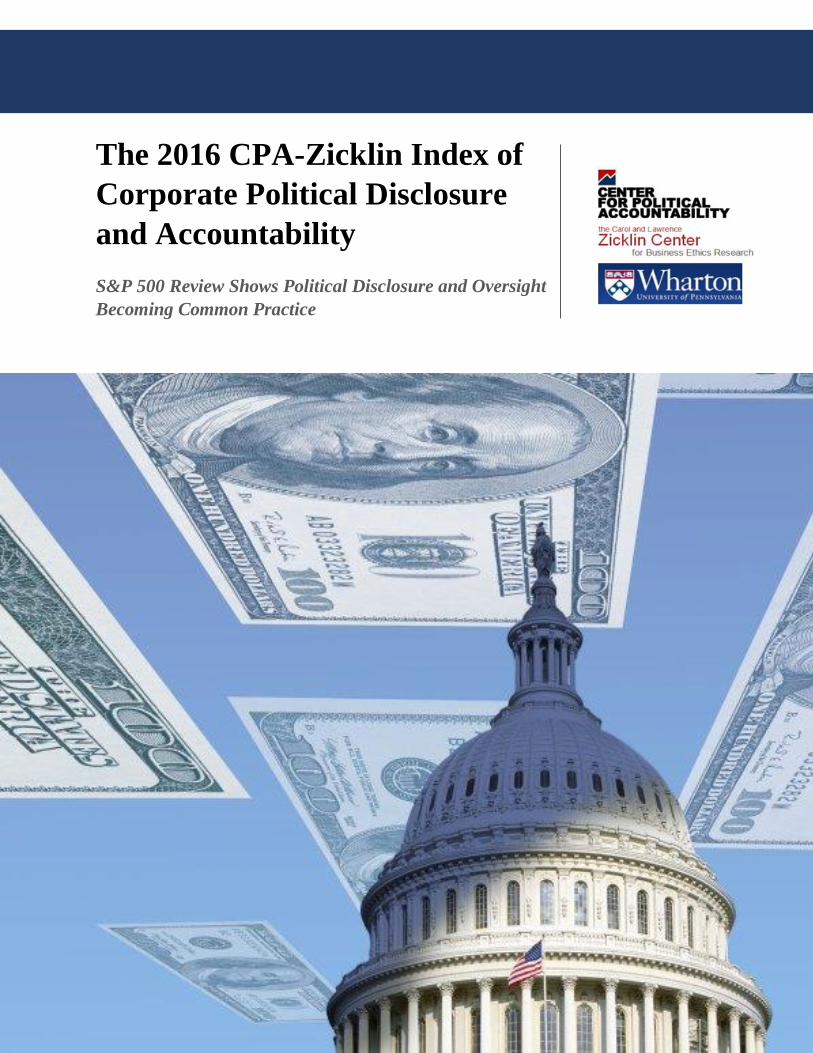
The 2016 CPA-Zicklin Index of
Corporate Political Disclosure
and Accountability
S&P 500 Review Shows Political Disclosure and Oversight
Becoming Common Practice

1
2
ABOUT THE CENTER FOR POLITICAL ACCOUNTABILITY
The Center for Political Accountability (CPA) is a non-profit, non-partisan organization working to bring transparency and accountability to corporate political spending. It was formed to address the secrecy that cloaks much of the political activity engaged in by companies and the risks this poses to shareholder value. Collaborating with more than a dozen shareholder advocates, CPA is the only group directly engaging companies to improve disclosure and oversight of their political spending. This includes soft money contributions and payments to trade associations and other tax-exempt organizations that are used for political purposes. The Center aims to encourage responsible corporate political activity, protect shareholders, and strengthen the integrity of the political process. As a result of the efforts of the CPA and its partners, 153 leading public companies, including 53 in the S&P 100, have adopted political disclosure and oversight.
ABOUT THE ZICKLIN CENTER FOR BUSINESS ETHICS AT THE WHARTON SCHOOL OF THE
UNIVERSITY OF PENNSYLVANIA
The Carol and Lawrence Zicklin Center for Business Ethics Research was established in 1997. The mission
of the Center is to sponsor and disseminate leading-edge research on critical topics in business ethics. It
provides students, educators, business leaders, and policy makers with research to meet the ethical,
governance, and compliance challenges that arise in complex business transactions. The Zicklin Center
supports research that examines those organizational incentives and disincentives that promote ethical
business practices, along with the firm-level features, processes, and decision-making associated with
failures of governance, compliance, and integrity.
Published September 29, 2016
NOTICES
Copyright © 2016 by the Center for Political Accountability. All rights reserved. No portion of this
material may be reproduced in any form or medium whatsoever without the express, written, prior
permission of the copyright holder. For information, please contact:
Bruce F. Freed
Center for Political Accountability
1233 20th St. NW, Suite 205
Washington, DC 20036
(202) 464-1570 Ext. 102 (voice)
(202) 464-1575 (fax)

3
4
TABLE OF CONTENTS
Foreword……………………………………………………………………………………………………………………………………………5
Acknowledgments………………………………………………………………………………………………………………………………6
2016 CPA-Zicklin Trendsetters…………………………………………………………………………………………………………….7
Executive Summary…………………………………………………………………………………………………………………………….9
Introduction………………………………………………………………………………………………………………………………………12
Why Corporate Political Disclosure and Accountability Matters More Than Ever and Is
Becoming Common Practice..…...……………..……………………………………………………………….……………..12
Scoring of the Index………………………………………….....…………………………………………………………………..15
I. Overall 2016 Results………………………………………………………………………………………………………………………16
Corporate Leaders in Disclosure and Political Accountability…………………………………………………….17
A High Scorer Among Companies New to the Index …………………………………………………………………18
Assessing Disclosure of Corporate Political Spending………………………………………………………………..18
Assessing Policies on Political Spending………………………………………………………………………………….…23
Restrictions on Political Spending………………………………………………………………………………………..……24
Assessing Board Oversight of Political Spending……………………………………………………………………….26
Index Performance by Company Size……………………………………………………………………………………..…29
Index Performance by Company Sector…………………………………………………………………………………….30
II. Voluntary Disclosure and Shareholder Engagement………………………………………………………………………31
III. Comparison of Companies Over Time…………………………………………………………………………………………..34
Comparison of Companies from 2015 to 2016………………………………………………………………………….34
Companies Have Shown Consistent Improvement Since 2012……………………………………………..….34
Most Improved Companies This Year………………………………………………………………………………………..35
Appendix A: Methodology…………………………………………………………………………………………………………………38
Appendix B: Glossary………………………………………………………………………………………………………………….…….39
Appendix C: Scoring Key……………………………………………………………………………………………………………………40
Appendix D: Scored Ranking of All Companies…………………………………………………………………………………..41
Appendix E: Scores of Companies That Do Not Spend……………………………………………………………………….54

5
FOREWORD
By Charles Kolb
While the Supreme Court’s Citizens United decision in 2010 may have triggered an outpouring of cash,
including large amounts of undisclosed “dark money” into American elections – federal, state, and
judicial – it has become increasingly clear that American corporations are opting in favor of transparency
in their political giving.
The 2016 CPA-Zicklin Index of Corporate Political Disclosure and Accountability, the sixth survey
conducted since 2011, depicts a strong and growing trend among S&P 500 companies that are placing
restrictions on political spending, devising clear policies to govern such spending, and enhancing board
oversight of public company engagement in the political process.
This development is excellent news for our political system, and it is also excellent news for the many
opponents of crony capitalism. As we continue to recover from serial economic bubbles in information
technology, real estate, and our capital markets, what was once seen as dynamic American capitalism
has struggled recently against populist criticism that somehow the “system is rigged” in favor of
“insiders.” The perception of a “pay-to-play” election and political system only feeds that image, and it
should be a serious concern for everyone when the resulting cynicism undermines confidence in our
business community.
The Center for Political Accountability urges all American corporations to be fully transparent in their
political spending. In the Center’s view, transparency mitigates risk, demonstrates sound board
governance, and reassures shareholders that the companies in which they invest are well-managed.
Today’s highly partisan political environment and 24/7 viral social media outlets only magnify and
intensify the risks associated with corporate political spending. The Center has never told companies not
to engage in political spending. Our message has been both consistent and clear: If you do engage in
political spending, do so openly, with board approval and shareholder disclosure.
A dynamic, growth-oriented capitalist system requires a level playing field in which companies focus on
how best to compete in the marketplace, not in the political arena. Many companies, of course, are
affected by government decisions, and they should be heard by our elected officials on the merits, and
not because of secret political contributions.
Secret corporate contributions foster the image of buying access and substantially increase the risk of
adverse consequences for a company’s brand, image, and bottom line. The Center is proud that this
year’s CPA-Zicklin Index once again demonstrates a wise and growing trend toward greater transparency
by so many prominent corporations.
Mr. Kolb was Deputy Assistant to the President for Domestic Policy, The White House, under President
George H.W. Bush. He is former president of the Committee for Economic Development and former
president of the French-American Foundation – United States. He is a former General Counsel of United
Way of America.
6
ACKNOWLEDGMENTS
The Center for Political Accountability thanks the Carol and Lawrence Zicklin Center for Business Ethics
Research (“Zicklin Center”) of The Wharton School of the University of Pennsylvania. CPA and the Zicklin
Center first announced in 2007 a collaborative effort on corporate governance and corporate political
accountability. CPA cosponsored with the Zicklin Center and Baruch College’s Robert Zicklin Center for
Corporate Integrity a 2008 conference on “Money, Politics and the Corporate Risk.” In 2010, CPA, the
Zicklin Center, and the UCLA School of Law cosponsored a conference on “Citizens United and the
Changing Political Role of the Corporation.” In 2013 and 2015, CPA, the Wharton School’s Zicklin Center,
New York University’s Stern School of Business, Columbia Law School and Baruch College’s Zicklin School
of Business cosponsored roundtables on integrating the teaching of corporate political accountability
into the curricula of U.S. business schools.
CPA is grateful to Lawrence Zicklin, whose wise counsel and generosity made the CPA-Zicklin Index
possible; Professor William S. Laufer of The Wharton School and director of its Zicklin Center, who first
proposed the Index to CPA in July 2009; and Peter Kinder, former president of KLD Research & Analytics
Inc., who helped develop the original list of indicators used in compiling the Index and worked closely
with CPA in testing and finalizing the indicators.
CPA thanks its advisory committee, created to develop an objective system for scoring companies’
policies and practices on political disclosure and accountability. The committee reviewed the report
before publication. Advisory committee members included: Julie Fox Gorte, Ph.D., Senior Vice President
for Sustainable Investing, Pax World Management Corp.; Peter Kinder, former president of KLD
Research & Analytics Inc.; Lloyd Kurtz, Chief Investment Officer, senior portfolio manager, Nelson
Capital Management; William S. Laufer, Professor of Legal Studies and Business Ethics, Sociology, and
Criminology, and Director, The Carol and Lawrence Zicklin Center for Business Ethics Research; and
Blaine Townsend, Senior Vice President, Director, Sustainable, Responsible and Impact Investing Group,
Bailard Inc.
CPA thanks the approximately 105 companies that responded directly to the Center when informed of
their preliminary 2016 CPA-Zicklin Index scores. These companies provided review and comments and
asked questions for clarification.
CPA is grateful to the Sustainable Investments Institute (Si2), which collected company data for the
Index. Si2 did not have a role in scoring and ranking the companies.
This report was written by Bruce Freed, CPA president; Karl Sandstrom, CPA counsel and Senior Counsel
with Perkins Coie; Nanya Springer, CPA associate director; Peter Hardin, CPA writer and editor; Caitlin
Moniz, CPA staff associate; and Chloe Heller, CPA intern. Kathryn Gansler, former staff associate,
assisted with the report.
7
2016 CPA-ZICKLIN TRENDSETTERS
8
*TESORO PETROLEUM CORP. AND SYMANTEC CORP. DID NOT GIVE PERMISSION TO USE THEIR LOGOS.

9
EXECUTIVE SUMMARY
“At Microsoft, we know that transparency is fundamental to earning trust by allowing
people to evaluate for themselves how we are meeting our commitments to corporate
responsibility. We’re pleased to be recognized again this year as a Top Five Company for the
2016 CPA-Zicklin Index on Corporate Political Disclosure and Accountability, because we
value the critical importance of transparency and accountability in policy development.”
Susan Hauser, Corporate Vice President, Business and Corporate Responsibility, Microsoft
“Capital One’s commitment to fairness, transparency and quality underpins everything we
do, these values are the foundation of our culture and the guidepost of our advocacy efforts.
We are pleased to be recognized as a consistent leader in this space.” Emily Weems, Vice
President, Government & Policy Affairs Group, Capital One
“Norfolk Southern is committed to good governance and engaging with our shareholders,
and transparency into how we do business is a cornerstone of our governance
program. We are pleased to be recognized for transparency in our bi-annual political
contributions report.” Virginia K. Fogg, General Counsel, Norfolk Southern Corporation
“At Coca-Cola, it is our goal to act responsibly in all of our political engagement activities.
Our policy is to adhere to high standards of compliance, corporate responsibility and
transparency, including compliance with applicable law governing political engagement.”
Kate Rumbaugh, Vice President – Government Relations, Coca-Cola North America
These executives and their companies are boldly bringing sunlight to political spending at a time when
political transparency in America has become diminished. Their companies have adopted policies and
practices that received high scores in the CPA-Zicklin Index of Political Disclosure and Accountability for
2016. They are in the vanguard of public companies voluntarily laying the foundation for a new route to
disclosure and accountability when Congress and regulatory systems are gridlocked, even as a
presidential election cycle witnesses blockbuster spending.
The 2016 Index breaks ground by comparing the transparency policies and practices of the entire S&P
500 across consecutive years; last year, the Index was expanded for the first time to encompass all
companies in the S&P 500. These are the largest and most influential public companies in the United
States. They are dominant political spenders, and they set the best practices for American business.
In a record-setting year for outside spending in U.S. elections and a banner year for secret “dark money”
spending,1 data from the 2016 Index reflect expansion of political disclosure and that is both dynamic
and sustained. The findings also demonstrate that it is becoming common practice. Indisputably, a
voluntary trend toward greater sunlight, board oversight and restrictions on political spending
continues:
1 Soo Rin Kim, “Super PAC spending hits $500 million, while 501(c)s hit the brakes,” OpenSecrets Blog, September 1, 2016, http://www.opensecrets.org/news/2016/09/super-pac-spending-reaches-500m.
10
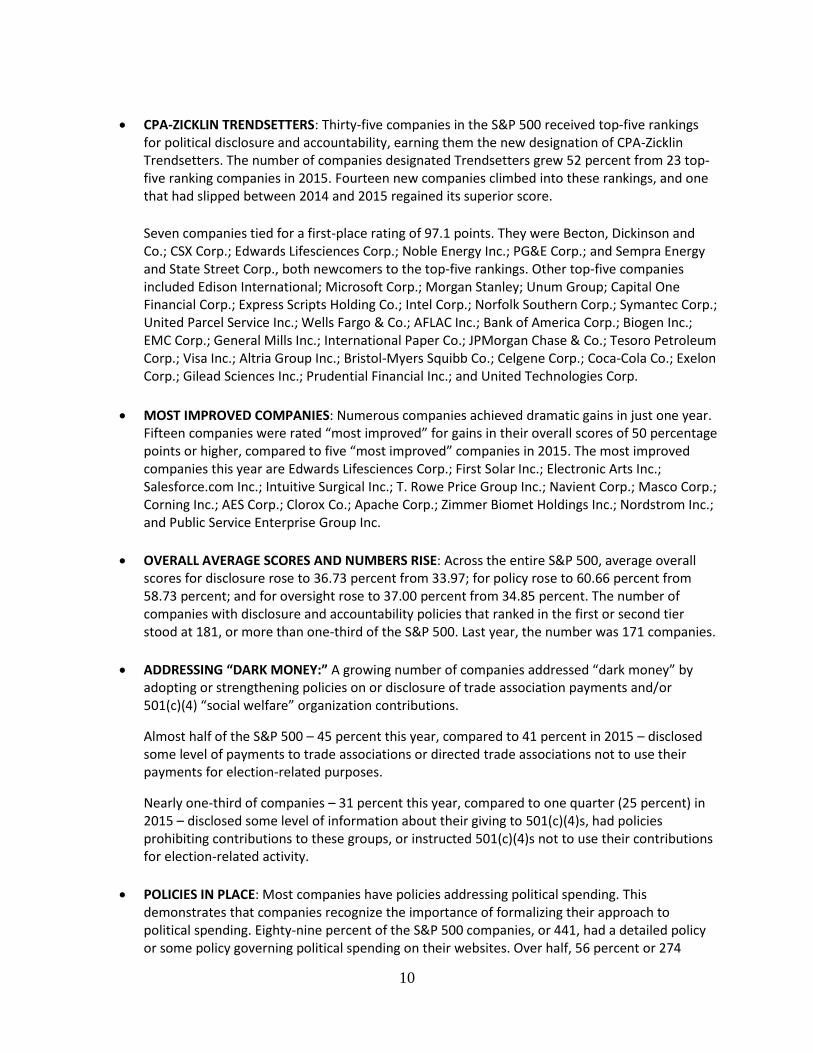
CPA-ZICKLIN TRENDSETTERS: Thirty-five companies in the S&P 500 received top-five rankings for political disclosure and accountability, earning them the new designation of CPA-Zicklin Trendsetters. The number of companies designated Trendsetters grew 52 percent from 23 top-five ranking companies in 2015. Fourteen new companies climbed into these rankings, and one that had slipped between 2014 and 2015 regained its superior score.
Seven companies tied for a first-place rating of 97.1 points. They were Becton, Dickinson and Co.; CSX Corp.; Edwards Lifesciences Corp.; Noble Energy Inc.; PG&E Corp.; and Sempra Energy and State Street Corp., both newcomers to the top-five rankings. Other top-five companies included Edison International; Microsoft Corp.; Morgan Stanley; Unum Group; Capital One Financial Corp.; Express Scripts Holding Co.; Intel Corp.; Norfolk Southern Corp.; Symantec Corp.; United Parcel Service Inc.; Wells Fargo & Co.; AFLAC Inc.; Bank of America Corp.; Biogen Inc.; EMC Corp.; General Mills Inc.; International Paper Co.; JPMorgan Chase & Co.; Tesoro Petroleum Corp.; Visa Inc.; Altria Group Inc.; Bristol-Myers Squibb Co.; Celgene Corp.; Coca-Cola Co.; Exelon Corp.; Gilead Sciences Inc.; Prudential Financial Inc.; and United Technologies Corp.
MOST IMPROVED COMPANIES: Numerous companies achieved dramatic gains in just one year. Fifteen companies were rated “most improved” for gains in their overall scores of 50 percentage points or higher, compared to five “most improved” companies in 2015. The most improved companies this year are Edwards Lifesciences Corp.; First Solar Inc.; Electronic Arts Inc.; Salesforce.com Inc.; Intuitive Surgical Inc.; T. Rowe Price Group Inc.; Navient Corp.; Masco Corp.; Corning Inc.; AES Corp.; Clorox Co.; Apache Corp.; Zimmer Biomet Holdings Inc.; Nordstrom Inc.; and Public Service Enterprise Group Inc.
OVERALL AVERAGE SCORES AND NUMBERS RISE: Across the entire S&P 500, average overall scores for disclosure rose to 36.73 percent from 33.97; for policy rose to 60.66 percent from 58.73 percent; and for oversight rose to 37.00 percent from 34.85 percent. The number of companies with disclosure and accountability policies that ranked in the first or second tier stood at 181, or more than one-third of the S&P 500. Last year, the number was 171 companies.
ADDRESSING “DARK MONEY:” A growing number of companies addressed “dark money” by adopting or strengthening policies on or disclosure of trade association payments and/or 501(c)(4) “social welfare” organization contributions.
Almost half of the S&P 500 – 45 percent this year, compared to 41 percent in 2015 – disclosed some level of payments to trade associations or directed trade associations not to use their payments for election-related purposes.
Nearly one-third of companies – 31 percent this year, compared to one quarter (25 percent) in 2015 – disclosed some level of information about their giving to 501(c)(4)s, had policies prohibiting contributions to these groups, or instructed 501(c)(4)s not to use their contributions for election-related activity.
POLICIES IN PLACE: Most companies have policies addressing political spending. This demonstrates that companies recognize the importance of formalizing their approach to political spending. Eighty-nine percent of the S&P 500 companies, or 441, had a detailed policy or some policy governing political spending on their websites. Over half, 56 percent or 274

11
companies, had a detailed policy governing political expenditures from corporate funds; 33 percent, or 164, had a brief or vague policy. In 2015, 52 percent, or 259 companies, had a detailed policy and 35 percent, or 176 companies, had a brief or vague policy.
BOARD OVERSIGHT: The number of companies with robust board oversight of political spending has increased sharply. In 2016, 111 companies have policies requiring board oversight of political spending and board committee review of company policy, political expenditures and trade association payments. This represents a 28 percent jump since 2015 when only 87 companies required board oversight. (Last year, the Center co-authored a Harvard Business Review article outlining the role of corporate directors in overseeing political disclosure and accountability.)
In summary, this first CPA-Zicklin Index comparison of the S&P 500 for two consecutive years reveals
significant progress. Even in one of the most high-spending election years in recent memory, there has
been a substantial increase in the number of companies that have achieved CPA-Zicklin’s Trendsetter
designation. They are providing a beacon for others, and more companies are learning how manageable
it is to adopt policies and practices that elevate them in the Index’s ranks.
Since its debut in 2011, this Index has documented a steady march toward sunlight and accountability.
More leading American companies have established political disclosure and accountability as
mainstream corporate practices. The Index also has identified persistent basement-dwellers, those
companies lagging behind in taking reasonable steps to safeguard themselves and shareholders against
the acknowledged risks posed by corporate spending on politics.

12
INTRODUCTION
Why Corporate Political Disclosure and Accountability Matters More Than Ever
and Is Becoming Common Practice
A rising tide of political spending – including shadowy “dark money” – is flooding election contests from
Washington to state and local elections, even down to local school board races. Six years after Citizens
United v. FEC, the Brennan Center for Justice reported this year,2 “the use of so-called dark money has
become disturbingly common. Contrary to the Supreme Court’s assumption that this unlimited spending
would be transparent to voters, at the federal level powerful groups have since 2010 poured hundreds
of millions of dollars into influencing elections while obscuring the sources of their funding.”
Americans are voicing alarm, meanwhile, over the power of corporations and other wealthy donors to
influence politics, and money in politics has played out as a white-hot issue in the 2016 presidential
contest. The death in February of Supreme Court Justice Antonin Scalia inflamed the debate even
further as critics of Citizens United saw what they consider to be an opening to overturn it.
At the same time, an unusual presidential contest between Republican Donald Trump and Democrat
Hillary Clinton has resulted in heightened efforts by the GOP and supporters to pump money into down-
ballot races out of fear the Republicans could lose control of one or both chambers of Congress.
What’s the result? Big donors, including corporations, are under more pressure to spend to influence
elections. Citizens United opened the door to unlimited corporate spending on elections; it accelerated
the growth of super PACs and the politically active nonprofit groups that now offer vastly expanded
conduits for political giving.
At press time, the 2016 election marks a banner cycle for dark money spending groups, paying out $52.9
million before the end of August, according to the Center for Responsive Politics.3 And while it was
unclear whether dark money spending will break records this year, long-term trends document sharply
escalating dark money in politics. “[T]he shift towards using nonprofit groups as vehicles for anonymous
political funds in federal elections is radical in its magnitude,” a study by the Center for Responsive
Politics and Wesleyan Media Project4 said last month.
“Between 2000 and 2006, non-disclosing groups averaged less than 18,000 ad spots per cycle. However,
after the Supreme Court loosened campaign finance restrictions – first in Wisconsin Right to Life v.
FEC in 2007, then in Citizens United in 2010 – the average ad count for non-disclosing groups over the
next four elections jumped to more than 219,000 per cycle,” the report said.
2 Chisun Lee, Katharine Valde, Benjamin T. Brickner, and Douglas Keith, “Secret Spending in the States,” Brennan Center for Justice, June 26, 2016, http://www.brennancenter.org/publication/secret-spending-states. 3 http://www.opensecrets.org/news/2016/09/super-pac-spending-reaches-500m 4 Robert Maguire, “STUDY: Outside groups, secret money far more prominent than ever before,” OpenSecrets Blog, August 24, 2016, https://www.opensecrets.org/news/2016/08/study-outside-groups-secret-money-far-more-prominent-than-ever-before.

13
Is it any surprise, then, to find dark money grabbing news headlines in races at all levels across the
country? Check out The Kansas City Star,5 reporting on U.S. Senate races: “Mysterious ‘dark money’
shadows Missouri, Kansas election campaigns.” Or OpenSecrets.org6 on another Midwestern Senate
race: “Ohio Senate race attracts highest outside spending in Congress, big share of dark money.” Or
Arizona Public Media on state corporation commission races, in “Republican Corporation Commission
Candidates Look to Move Past 'Dark Money' Debate.”7 Or, from The Associated Press about a former
state representative, “Former Montana Lawmakers Settles Dark Money Allegations.”8
The same secretive funding has even invaded state and local judicial elections. About a state Supreme
Court race, The American Prospect reported in April, “Dark Money Was the Real Winner in Wisconsin.”9
A Wichita Eagle headline said last month, “Dark money group seeks investigation of Kansas Supreme
Court justice.”10 And “Two of America’s Richest Men Secretly Tried to Sway Montana’s Judicial
Elections,” reported the Huffington Post11 in May.
Political disclosure systems have effectively collapsed at a time when dark money has become
increasingly integral to elections. These factors have made the Center for Political Accountability’s
campaign for corporate political disclosure and oversight more critical than ever. Today, 153 companies
engaged by CPA and/or its investor partners since 2003 have adopted political disclosure and
accountability policies using the Center’s proposed model. Overall, 305 companies have adopted some
level of political disclosure and accountability, some on their own and others as a result of CPA or
shareholder engagement.
The 2016 Index details how many leading public companies agree that disclosure and accountability
matter and are making it a common practice. They are taking steps to move toward the sunlight in a
hyper-charged political environment where even some of the most ardent defenders of secret spending
are cracking open the door. Here’s what The Business Roundtable advised in its “Principles of Corporate
5 Dave Helling, “Mysterious ‘dark money’ shadows Missouri, Kansas election campaigns,” The Kansas City Star, August 22, 2016, http://www.kansascity.com/news/politics-government/article97126722.html. 6 Alec Goodwin, “Ohio Senate race attracts highest outside spending in Congress, big share of dark money,” OpenSecrets Blog, June 20, 2016, https://www.google.com/url?q=http://www.opensecrets.org/news/ 2016/06/ohio-senate-race-attracts-highest-outside-spending-in-congress-big-share-of-dark-money/&sa=U&ved=0ahUKEwjUtqOmuoXPAhUDZCYKHe3nCUkQFggFMAA&client=internal-uds-cse&usg=AFQjCNHrBZa7XayOxn1GptzfTgsT59d48A. 7 Zachary Ziegler, “Republican Corporation Commission Candidates Look to Move Past ‘Dark Money’ Debate,” Arizona Public Media, August 16, 2016, https://news.azpm.org/p/arizona-news/2016/8/17/93828-republican-corporation-commission-candidates-look-to-move-past-dark-money-debate. 8 Matt Volz, “Former Montana lawmaker settles dark money allecgations,” Associated Press, September 6, 2016, http://flatheadbeacon.com/2016/09/06/former-montana-lawmaker-settles-dark-money-allegations. 9 Justin Miller, “Checks: Political Money & Democracy,” The American Prospect, April 6, 2016, http://prospect.org/blog/checks/dark-money-was-real-winner-wisconsin. 10 Bryan Lowry, “Dark money group seeks investigation of Kansas Supreme Court justice,” The Wichita Eagle, August 23, 2016, http://www.kansas.com/news/politics-government/article97449942.html. 11 Paul Blumenthal, “Two of America’s Richest Men Secretly Tried to Sway Montana’s Judicial Elections,” The Huffington Post, May 1, 2016, http://www.huffingtonpost.com/entry/montana-dark-money-judicial-race_us_572b9f4ce4b016f378951c8f.
14
Governance/2016,” which it described as “providing public companies with the most modern guidance
for upholding the highest ethical standards and delivering long-term economic value”:
Corporations have an important perspective to contribute to the public policy dialogue and
discussions about the development, enactment and revision of the laws and regulations that
affect their businesses and the communities in which they operate and their employees reside.
To the extent that the company engages in political activities the board should have oversight
responsibility and consider whether to adopt a policy on disclosure of these activities.12
For the first time, the 2016 Index reviews the political transparency, decision-making and oversight
practices of the entire S&P 500 for a second consecutive year. The Index gives investors a tool to
evaluate their companies’ policies and practices for disclosure and accountability. It helps companies
assess whether they are following best practices for disclosure and accountability, and the extent to
which they are executing a commitment to these principles.
12 Business Roundtable, Principles of Corporate Governance 2016, August 2016, https://businessroundtable.org/ sites/default/files/Principles-of-Corporate-Governance-2016.pdf.
15
Disclaimer Research for the 2016 Index was based primarily on qualitative information, measuring distinctive characteristics, properties and attributes reflected in each company’s website. The Index measures only a company’s policies as publicly disclosed on a company’s website. It does not make any judgments about a company’s political spending, nor does it guarantee the accuracy of information that companies have presented. While CPA does not intend to make significant changes to the indicators or their interpretations in 2017, it reserves the right to do so. In that case, companies will be alerted in advance.
Box 1. SCORING OF THE INDEX
Interpretation and Scoring. The Index’s accuracy depends upon consistency and fairness in scoring. In order to analyze companies accurately and consistently across 24 indicators, we must adhere closely to our rigorous scoring guidelines. CPA scores each company based solely on the information that is publicly available on the company’s website and without regard to how the company was scored in previous years. This ensures that companies are scored on their current disclosure practices and policies. CPA consults with its Scoring Advisory Committee in order to be as consistent, fair and accurate as possible. Companies are also given the opportunity to speak with CPA about the Index scoring process and their individual scores before the Index is published.
CPA’s practice is to announce any revisions to the Index’s 24 indicators or their interpretations one
year in advance. No revisions or changes in data interpretation and scoring are planned for 2017.
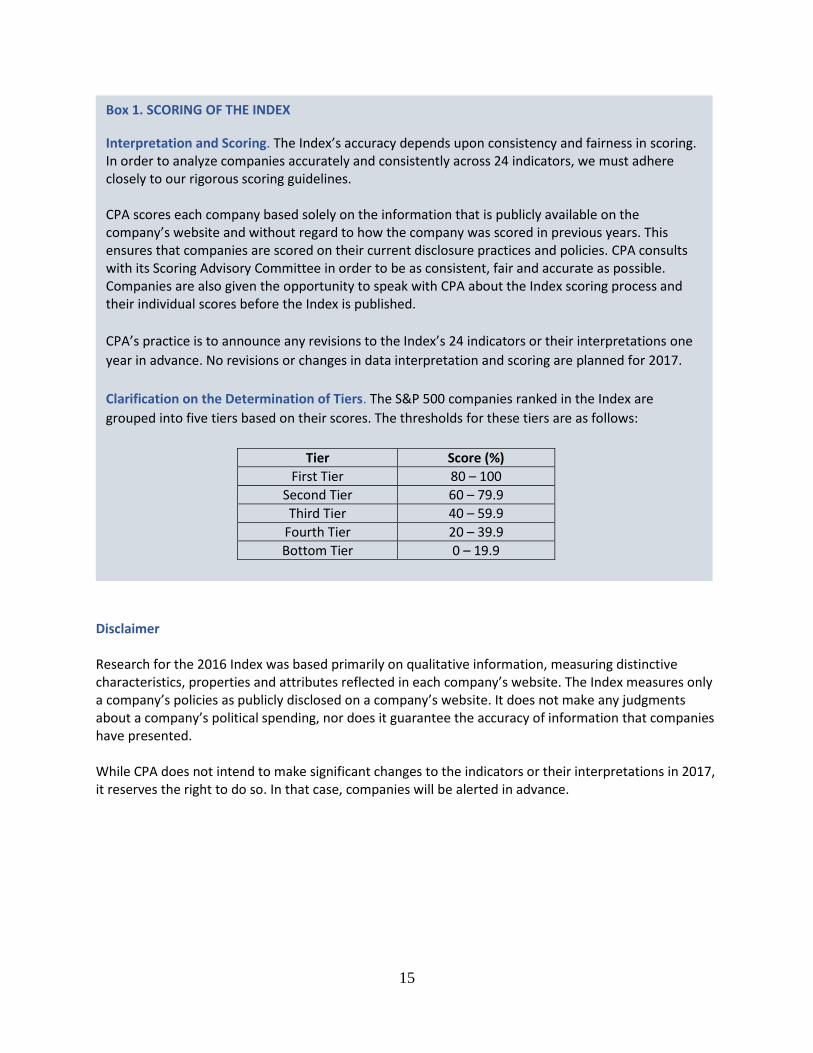
Clarification on the Determination of Tiers. The S&P 500 companies ranked in the Index are
grouped into five tiers based on their scores. The thresholds for these tiers are as follows:
Tier Score (%)
First Tier 80 – 100
Second Tier 60 – 79.9
Third Tier 40 – 59.9
Fourth Tier 20 – 39.9
Bottom Tier 0 – 19.9
16
I. OVERALL 2015 RESULTS
The Center for Political Accountability began engaging corporations on political spending in 2003, asking
them to voluntarily disclose and oversee political spending. Few, if any, companies disclosed their
political spending then. In 2016, the sixth annual CPA-Zicklin Index reflects a continuing embrace by a
growing number of leading American companies of greater political disclosure and accountability.
The 2016 Index for the first time evaluates a second consecutive year of transparency and accountability
practices for the entire S&P 500.
For all 49313 companies studied in the 2016 Index, the average total score was 42.34 percent (up from 39.80 percent last year) on a scale of zero to 100. The companies occupying the top-five rankings also increased.
Since one year ago, the number of companies making political expenditures and scoring in the top-five rankings – with percentages of 91.4 percent or higher – increased dramatically to 35 companies from 23. These companies earned the newly bestowed designation of CPA-Zicklin Trendsetters.
Fourteen companies that were included in the 2015 study (Edwards Life Sciences Corp., Sempra Energy, State Street Corp., Morgan Stanley, Express Scripts Holding Co., Symantec Corp., Bank of America Corp., International Paper Co., Tesoro Petroleum Corp., Altria Group Inc., Visa Inc., Celgene Corp., Coca-Cola Co., and United Technologies Corp.) are new to these top echelons of the Index. (Wells Fargo & Co. ranked in the top five in 2014 but not in 2015.)
The average score for all 35 Trendsetter companies was 94 percent, up from 93.3 percent last year.
13 The Index’s list of companies is based on the S&P 500 as of May 2016. In January 2016, Avago acquired Broadcom Corp. and the merged entity became Broadcom Ltd. SanDisk was acquired by Western Digital on May 12, 2016. Coca-Cola Enterprises Inc. merged with two other European bottlers of Coca-Cola on May 31, 2016. Baxalta Inc. was acquired by Shire PLC on June 3, 2016. Cablevision was acquired by Altice on June 22, 2016. Columbia Pipeline Group Inc. was acquired by TransCanada on July 5, 2016.
17
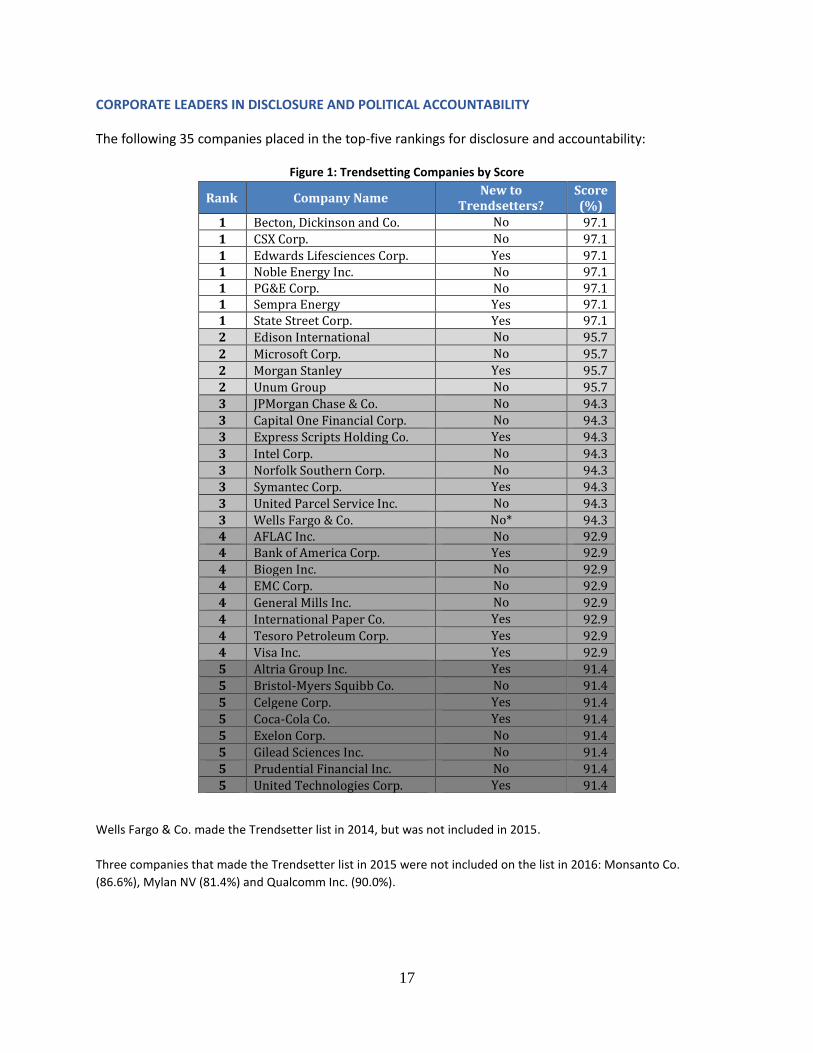
CORPORATE LEADERS IN DISCLOSURE AND POLITICAL ACCOUNTABILITY
The following 35 companies placed in the top-five rankings for disclosure and accountability:
Figure 1: Trendsetting Companies by Score
Wells Fargo & Co. made the Trendsetter list in 2014, but was not included in 2015.
Three companies that made the Trendsetter list in 2015 were not included on the list in 2016: Monsanto Co.
(86.6%), Mylan NV (81.4%) and Qualcomm Inc. (90.0%).
Rank Company Name New to
Trendsetters? Score (%)
1 Becton, Dickinson and Co. No 97.1
1 CSX Corp. No 97.1
1 Edwards Lifesciences Corp. Yes 97.1 1 Noble Energy Inc. No 97.1 1 PG&E Corp. No 97.1 1 Sempra Energy Yes 97.1 1 State Street Corp. Yes 97.1
2 Edison International No 95.7
2 Microsoft Corp. No 95.7
2 Morgan Stanley Yes 95.7
2 Unum Group No 95.7
3 JPMorgan Chase & Co. No 94.3
3 Capital One Financial Corp. No 94.3
3 Express Scripts Holding Co. Yes 94.3
3 Intel Corp. No 94.3
3 Norfolk Southern Corp. No 94.3
3 Symantec Corp. Yes 94.3
3 United Parcel Service Inc. No 94.3
3 Wells Fargo & Co. No* 94.3 4 AFLAC Inc. No 92.9 4 Bank of America Corp. Yes 92.9
4 Biogen Inc. No 92.9
4 EMC Corp. No 92.9
4 General Mills Inc. No 92.9
4 International Paper Co. Yes 92.9
4 Tesoro Petroleum Corp. Yes 92.9
4 Visa Inc. Yes 92.9
5 Altria Group Inc. Yes 91.4
5 Bristol-Myers Squibb Co. No 91.4
5 Celgene Corp. Yes 91.4
5 Coca-Cola Co. Yes 91.4
5 Exelon Corp. No 91.4
5 Gilead Sciences Inc. No 91.4
5 Prudential Financial Inc. No 91.4
5 United Technologies Corp. Yes 91.4

18
A HIGH SCORER AMONG COMPANIES NEW TO THE INDEX
The average score for the 27 companies new to the Index was 11.5 percent. One newcomer scored high for its first appearance in the Index:
Company Overall Score (%) Disclosure (%) Policy (%) Oversight (%)
HP Inc. 86.0 77.8 100.0 44.4
A full list of companies and their scores is provided in Appendix D (page 41).
ASSESSING DISCLOSURE OF CORPORATE POLITICAL SPENDING
The Supreme Court strongly endorsed disclosure in Citizens United. “With the advent of the Internet, prompt disclosure of expenditures can provide shareholders and citizens with the information needed to hold corporations and elected officials accountable for their positions and supporters,” the Court wrote. It added, “Shareholders can determine whether their corporation’s political speech advances the corporation’s interests in making profits, and citizens can see whether elected officials are ‘in the pocket’ of so-called moneyed interests.”14 While more companies at the top of the S&P 500 are bringing in sunlight by disclosing their political spending, there continues to be resistance to disclosing payments to 501(c)(4) nonprofit organizations, which are permitted to conceal their donors.
Figure 2: Levels of Disclosure by Expenditure Type
14 Citizens United v. Federal Election Comm’n, 558 U.S. 310 (2010).
13%
15%
19%
27%
25%
28%
10%
7%
21%
5%
7%
7%
8%
19%
5%
11%
14%
17%
69%
59%
55%
57%
54%
48%
Payments to other tax-exempt, 501(c)(4)s
Direct independent political expenditures
Payments to trade associations
Ballot measures payments
Payments to national 527 groups
Candidates, parties and committees
Full Partial Doesn't give No disclosure

19
Figure 3: Number of Companies That Disclose by Expenditure Type
Type of political contribution
Disclose some level of information on contributions
Have policies prohibiting these contributions
2016 2015 2016 2015
State candidates, parties and committees
172 166 85 84
National 527 groups 157 163 70 65
Independent expenditures 107 113 98 83
Ballot measures 157 155 54 50
Trade associations 200 184 24 20
“Social welfare” or 501(c)(4) organizations
113 94 41 31
Direct Contributions
State candidates, parties and committees. In 2016, 52 percent of the 493 companies (no change from
52 percent in 2015) disclosed some level of information about the contributions to candidates, parties,
and committees or had policies prohibiting these contributions.
National 527 groups. In 2016, 46 percent of companies (no change from 46 percent in 2015) disclosed
some level of information on contributions to 527 organizations or had policies prohibiting these
contributions.
Independent expenditures. In 2016, 41 percent of companies (compared to 39 percent in 2015)
disclosed some level of information about their independent expenditures.
Ballot measures. In 2016, 43 percent of companies (compared to 41 percent in 2015) disclosed some
information or prohibit spending.

20
Indirect Contributions
Trade associations. In 2016, almost half of S&P 500 companies – 45 percent, compared to 41 percent in
2015 – disclosed some level of payments to trade associations or instructed trade associations not to
use their payments for election-related activity.
Box 2. BEST PRACTICE EXAMPLES: DISCLOSING PAYMENTS TO TRADE ASSOCIATIONS
Companies that have demonstrated best practice examples provide clear language about what they are
disclosing and make timely reports. These companies disclose the non-deductible portions (used for
political or lobbying activities) of their payments, including dues and special assessments, to trade
associations in a given year. Many companies use a threshold amount (e.g. $25,000 a year) to reduce the
burden of reporting and focus on the politically active trade associations for transparency.
Edwards Lifesciences Corp. “Edwards Lifesciences is a member of several industry and trade groups, including organizations that engage in lobbying activities. Edwards believes that membership in these organizations is consistent with the interests of patients, employees, the company and shareholders. The following table lists the amount of Edwards dues spent on federal-related lobbying activities. *Includes trade association memberships with total annual dues greater than $50,000.”
Microsoft Corp. “We publicly disclose and update annually a list of those trade associations to which Microsoft pays dues and makes other expenditures through our Legal & Community Affairs. Each year, Microsoft inquires and makes a reasonable effort to obtain from those associations where our dues and other expenditures total $25,000 or more and what portion of the company's dues or payments were used for lobbying expenditures or political contributions. This information is publically disclosed and updated annually.”

21
“Social welfare” or 501(c)(4) organizations. In 2016, almost one-third of companies (31 percent) –
compared to one quarter (25 percent) in 2015 – disclosed some level of information about their giving
to these organizations, had policies forbidding contributions to 501(c)(4)s, or instructed 501(c)(4)s not to
use their contributions for election-related activity.
39 companies disclosed payments to both 501(c)(4)s and trade associations (compared to 34 in 2015):
AFLAC Inc.
Altria Group Inc.
Apache Corp.
Baxter International Inc.
Boston Scientific Corp.
Bristol-Myers Squibb Co.
Capital One Financial Corp.
Celgene Corp.
CenturyLink, Inc.
CF Industries Holdings Inc.
Coca-Cola Co.
Consolidated Edison Inc.
CSX Corp.
Darden Restaurants Inc.
Edison International
EMC Corp.
Entergy Corp.
Exelon Corp.
Express Scripts Holding Co.
Fifth Third Bancorp
Freeport-McMoRan Copper & Gold Inc.
Hershey Co.
Intel Corp.
Microsoft Corp.
Newmont Mining Corp.
Noble Energy, Inc.
Norfolk Southern Corp.
Northrop Grumman Corp.
PG&E Corp.
PPL Corp.
Prudential Financial, Inc.
Sempra Energy
Southern Co.
Tesoro Petroleum Corp.
Thermo Fisher Scientific Inc.
Time Warner Inc.
United Parcel Service Inc.
United Technologies Corp.
Visa Inc.
Box 3. DISTINGUISHING 501(c)(4) ORGANIZATIONS THAT ENGAGE IN POLITICAL ACTIVITIES
Internal Revenue Code section 501(c)(4) exempts certain civic groups and nonprofit organizations
whose primary purpose is to promote social welfare from federal income tax obligations. Even
though such groups have always existed in varying forms, the U.S. Supreme Court’s decision in
Citizens United gave rise to a new wave of 501(c)(4) groups that actively engage in election-related
activities. Many of them make independent expenditures to advocate for a position in elections, and
some even raise secret funds for their sister super PACs.
In order to determine which 501(c)(4) groups to disclose, companies can look at an organization’s
activities and see if it engages in any political activities as defined by the Internal Revenue Service.
Using current regulatory definitions, including the IRS’s definition of “political intervention,” political
spending comprises:
• any direct or indirect contributions or expenditures on behalf of a candidate for public office or
referenda,
• any payments made to trade associations or tax-exempt entities used for intervening in a political
campaign, and
• any direct or indirect political expenditure that must be reported to the Federal Election
Commission, Internal Revenue Service or state disclosure agency.

22
53 companies restricted payments to either 501(c)(4)s or trade associations (compared to 40 in 2015):
Accenture PLC
AES Corp.
Air Products and Chemicals Inc.
Aon PLC
Apple Inc.
Archer Daniels Midland Co.
Automatic Data Processing Inc.
Bank of America Corp.
Bank of New York Mellon Corp.
Becton, Dickinson and Co.
Biogen Inc.
Boeing Co.
Campbell Soup Co.
Clorox Co.
Colgate-Palmolive Co.
Comcast Corp.
Costco Wholesale Corp.
Cummins Inc.
Danaher Corp.
Discover Financial Services Inc.
Edwards Lifesciences Corp.
Estee Lauder Companies Inc.
FedEx Corp.
First Solar Inc.
General Dynamics Corp.
Gilead Sciences Inc.
Goldman Sachs Group Inc.
HP Inc.
International Business Machines Corp.
International Paper Co.
Intuitive Surgical Inc.
JPMorgan Chase & Co.
Kansas City Southern
Kellogg Co.
Laboratory Corp. of America Holdings
Lowe's Cos.
Morgan Stanley
National Oilwell Varco Inc.
Navient Corp.
Nielsen Holdings NV
Nordstrom Inc.
Praxair Inc.
Ralph Lauren Corp.
Regions Financial Corp.
Schlumberger Ltd.
Sherwin-Williams Co.
State Street Corp.
Symantec Corp.
Target Corp.
TJX Companies Inc.
Unum Group
Wells Fargo & Co.
Western Digital Corp.
Three companies went from disclosing payments to 501(c)(4)s and trade associations in 2015 to restricting payments to either 501(c)(4)s or trade associations in 2016:
Becton, Dickinson and Co.
International Paper Co.
Unum Group

23
ASSESSING POLICIES ON POLITICAL SPENDING
The CPA-Zicklin Index reflects a wide range of policies posted by companies in the S&P 500 on political spending. Many of these companies are at least moving toward an articulated policy. Of the 493 companies included in the Index, 441 (89.5 percent) had at least some level of policy posted on their websites. Some of these policies are comprehensive and robust while others are not fully formed. Here is a summary of the policies:
Publicly available policies. In 2016, 56 percent of companies (compared to 52 percent in 2015) had a
detailed policy of giving posted on their websites, while 33 percent (compared to 35 percent in 2015)
provided brief, somewhat vague policies. A total of 438 companies (88.8 percent) disclosed either a
detailed or brief, somewhat vague policy governing political expenditures with corporate funds.
Parameters of giving. In 2016, 41 percent of companies (compared to 38 percent in 2015) fully
described to which political entities they will or will not give. Twenty-one percent (compared to 22
percent in 2015) provided some level of information about the recipients of their political giving.
Decision-making criteria. In 2016, 30 percent of companies (compared to 28 percent in 2015) provided
detailed information on the public policy priorities that become the basis of political spending decisions,
while 10 percent (compared to 12 percent in 2015) provided vague language on what drives their giving.
Figure 4: Number of Companies with Political Spending Oversight Policies
Contents of Policy Detailed policy on website Brief/vague policy on website
2016 2015 2016 2015
Governs political expenditures from corporate funds
274 259 164 176
Describes political entities to which company does or does not contribute
204 189 102 107
Describes public policy priorities upon which political spending decisions are based
149 139 51 61
Note: 156 companies disclosed or prohibited giving to 501(c)(4)s or trade associations (compared to 136
in 2015) – a 15 percent increase.
Why is political spending policy so important? By setting out objective criteria for political spending, a company provides a context for decision-making. An articulated policy provides a means for evaluating the risks and benefits of political spending; measuring whether such spending is consistent and aligned with a company’s overall goals and values; determining a rationale for the expenditures; and judging whether the spending achieves its goals.

24
RESTRICTIONS ON POLITICAL SPENDING
Data from the 2016 Index reflect that many companies have placed restrictions on their political spending. This represents a major change since 2004, when few imposed such restrictions or had clear policies to that effect. No Political Spending: There are eight companies that did not spend from their corporate treasuries to
influence elections and asked trade associations not to use their payments for political purposes.
Accenture PLC
HP Inc.
IBM Corp.
Nielsen Holdings NV
Praxair, Inc.
Schlumberger Ltd.
The Goldman Sachs Group
Automatic Data Processing Inc.
Note: Colgate Palmolive and Morgan Stanley were removed from this list in 2016; HP Inc. was added.
Some Restrictions on Spending: 143 companies (29 percent) placed some level of restriction on their political spending, compared with 124 (25 percent) in 2015.
Figure 5: Number of Companies That Restrict Spending (by Contribution Type)
Kind of Contribution Number of Companies That Restrict
2016 2015
Direct independent expenditures 98 83
Candidates, parties and committees
85 84
527 groups 70 65
Ballot measures 54 50
501(c)(4)s 41 31
Trade associations 24 20
PAC Spending Only: 15 companies had policies whereby political expenditures were only made through
employee-funded Political Action Committees (PACs):
Accenture PLC
Aon PLC
BB&T Corp.
Discover Financial Services
Hess Corp.
Kinder Morgan Inc.
Nielsen Holdings NV
Iron Mountain Inc.
Vulcan Materials Co.
L-3 Communications
Praxair, Inc.
Symantec Corp.
Teradata Corp.
The Goldman Sachs Group
Hartford Financial Services
25
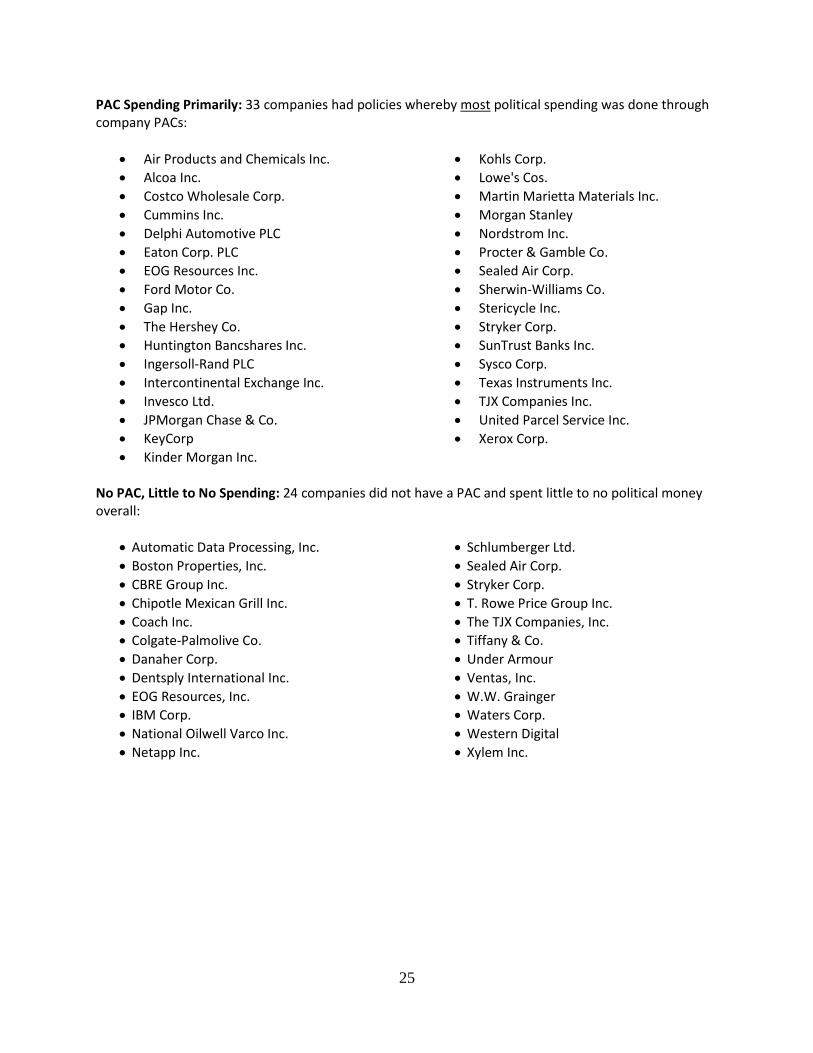
PAC Spending Primarily: 33 companies had policies whereby most political spending was done through company PACs:
Air Products and Chemicals Inc.
Alcoa Inc.
Costco Wholesale Corp.
Cummins Inc.
Delphi Automotive PLC
Eaton Corp. PLC
EOG Resources Inc.
Ford Motor Co.
Gap Inc.
The Hershey Co.
Huntington Bancshares Inc.
Ingersoll-Rand PLC
Intercontinental Exchange Inc.
Invesco Ltd.
JPMorgan Chase & Co.
KeyCorp
Kinder Morgan Inc.
Kohls Corp.
Lowe's Cos.
Martin Marietta Materials Inc.
Morgan Stanley
Nordstrom Inc.
Procter & Gamble Co.
Sealed Air Corp.
Sherwin-Williams Co.
Stericycle Inc.
Stryker Corp.
SunTrust Banks Inc.
Sysco Corp.
Texas Instruments Inc.
TJX Companies Inc.
United Parcel Service Inc.
Xerox Corp.
No PAC, Little to No Spending: 24 companies did not have a PAC and spent little to no political money overall:
Automatic Data Processing, Inc.
Boston Properties, Inc.
CBRE Group Inc.
Chipotle Mexican Grill Inc.
Coach Inc.
Colgate-Palmolive Co.
Danaher Corp.
Dentsply International Inc.
EOG Resources, Inc.
IBM Corp.
National Oilwell Varco Inc.
Netapp Inc.
Schlumberger Ltd.
Sealed Air Corp.
Stryker Corp.
T. Rowe Price Group Inc.
The TJX Companies, Inc.
Tiffany & Co.
Under Armour
Ventas, Inc.
W.W. Grainger
Waters Corp.
Western Digital
Xylem Inc.

26
ASSESSING BOARD OVERSIGHT OF POLITICAL SPENDING
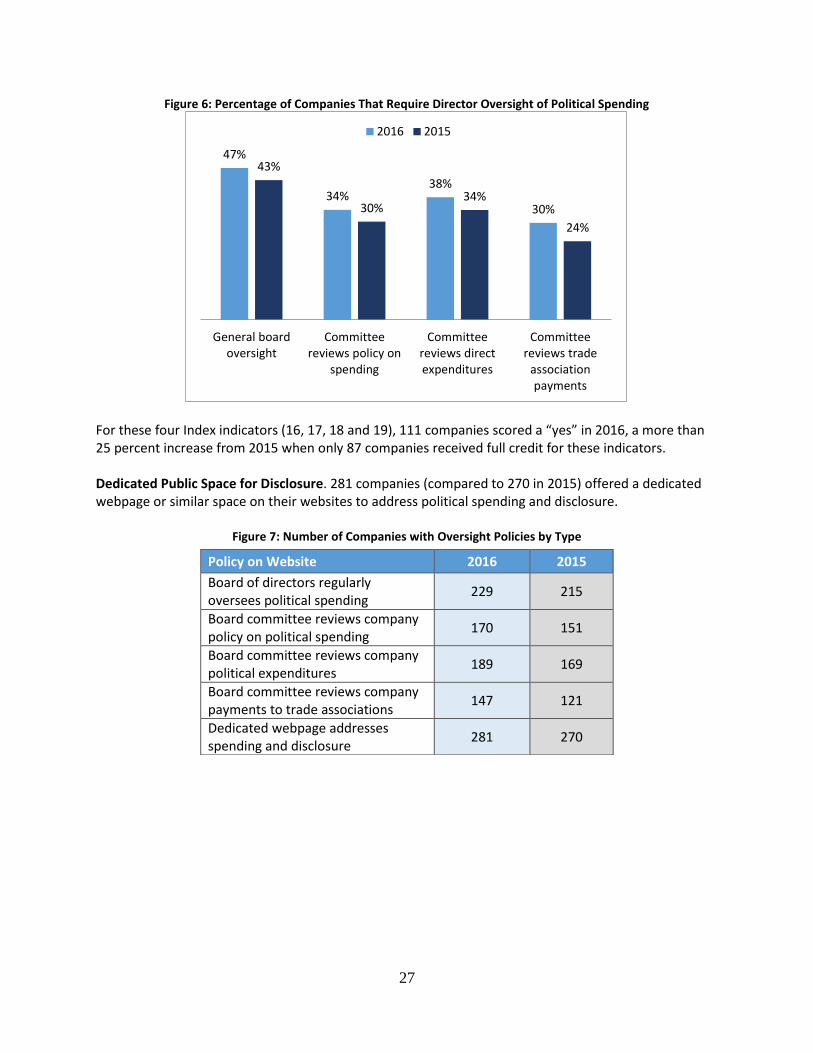
“To the extent that the company engages in political activities, the board should have oversight responsibility,”15 The Business Roundtable’s “Principles of Corporate Governance/2016” advised in August. To provide directors a framework, CPA leaders wrote in a Harvard Business Review article they co-authored last year, “We have developed a framework to help boards make decisions concerning corporate political spending – decisions that are informed; consistent with company strategies, policies, and values; and that mitigate risks as much as possible.” To accomplish this, directors must be able to do three central things: 1) decide whether the company should engage in political spending; 2) decide whether to disclose that spending; and 3) ensure that appropriate oversight and other policies and procedures are in place.”16 Data from the 2016 Index indicate that slightly less than half of companies in the S&P 500 require some level of board oversight of their political contributions and expenditures. Board Oversight. In 2016, 47 percent of companies (compared to 43 percent in 2015) said their boards of directors regularly oversee political spending. Board Committee Reviews Policy. In 2016, 34 percent of companies (compared to 30 percent in 2015) said that a board committee reviews company policy on political spending. Board Committee Reviews Expenditures. In 2016, 38 percent of companies (compared to 34 percent in 2015) said that a board committee reviews company political expenditures. Board Committee Reviews Trade Association Payments. In 2016, 30 percent of companies (compared to 24 percent in 2015) said that a board committee reviews company payments to trade associations.
15 https://businessroundtable.org/sites/default/files/Principles-of-Corporate-Governance-2016.pdf 16 Constance E. Bagley, Bruce Freed, and Karl Sandstrom, Harvard Business Review, October 30, 2015, https://www.google.com/url?sa=t&rct=j&q=&esrc=s&source=web&cd=1&ved=0ahUKEwjKoKXR5qTJAhUGwiYKHd6qDgEQFggdMAA&url=https%3A%2F%2Fhbr.org%2F2015%2F10%2Fa-board-members-guide-to-corporate-political-spending&usg=AFQjCNEfc-dPRvz0AN0N4QywpCRYZAMPkw&sig2=5fABDBkpNlvZ-GNxhPZwgw&bvm=bv.108194040,d.eWE.
Why is board oversight so important? Board oversight of corporate political spending assures
internal accountability to shareholders and to other stakeholders. It has made such inroads in
boardrooms across America that it is becoming a corporate governance standard.
27
Figure 6: Percentage of Companies That Require Director Oversight of Political Spending
For these four Index indicators (16, 17, 18 and 19), 111 companies scored a “yes” in 2016, a more than 25 percent increase from 2015 when only 87 companies received full credit for these indicators. Dedicated Public Space for Disclosure. 281 companies (compared to 270 in 2015) offered a dedicated webpage or similar space on their websites to address political spending and disclosure.
Figure 7: Number of Companies with Oversight Policies by Type
47%
34%38%
30%
43%
30%34%
24%
General boardoversight
Committeereviews policy on
spending
Committeereviews directexpenditures
Committeereviews trade
associationpayments
2016 2015
Policy on Website 2016 2015
Board of directors regularly oversees political spending
229 215
Board committee reviews company policy on political spending
170 151
Board committee reviews company political expenditures
189 169
Board committee reviews company payments to trade associations
147 121
Dedicated webpage addresses spending and disclosure
281 270

28
Box 4. ASSESSING COMPLIANCE MEASURES
Companies that adopt best practice examples disclose an internal process for ensuring compliance with their own political spending policies. These companies go beyond stating an adherence to all existing laws and regulations; they establish a process for making sure that their own spending policies are followed. Strong internal compliance statements can be brief or lengthy. The key is for a company to describe how it ensures internal compliance.
Merck & Co. Inc. "To ensure compliance with Merck policy and federal and state law, outside legal experts provide periodic guidance to the company on required disclosure of its political activities. We also perform periodic audits to assess and enforce compliance with Merck’s policy governing its corporate and PAC contributions, and we require those individuals who recommend corporate political contributions in the United States to certify their knowledge of and adherence to our corporate Policy and Principles Governing Corporate Political and Political Action Committee Contributions."
Altria Group Inc. “Altria conducts regular trainings, compliance system reviews, and internal audits to ensure all PAC and corporate political contributions are made in accordance with the law and company policies.”

29
INDEX PERFORMANCE BY COMPANY SIZE A review of the scores of different-sized companies shows that there is a strong positive correlation between the size of a company and the detail and breadth of its political disclosure and accountability policies. The eight non-spending companies are included in this table because of their robust policies.
Figure 8: Company Sizes and Scores by Tier
*As of September 14, 2016.
First Tier Second Tier Third Tier Fourth Tier Bottom Tier
Total Number of Companies 94 96 60 49 194
Average Market Cap* $71.1 $52.2B $49.5B $24.6B $17.2B
Average Final Score (%) 89.2 69.8 50.3 30.9 6.6
Average Disclosure Score (%) 87.9 63.9 38.6 17.4 3.1
Average Policy Score (%) 97.5 91.3 82.9 64.8 20.1
Average Oversight Score (%) 84.4 62.5 44.5 27.8 1.8

30
INDEX PERFORMANCE BY COMPANY SECTOR When all companies in the 2016 Index were compared by industrial sector, the top-ranked sectors for political disclosure and accountability were Utilities, Health Care, Consumer Staples, Telecommunications Services and Materials.
Figure 9: Index Performance by Sector
Sector Average Score (%)
Number of Companies
in Sector Top Performer (Score)
2016 2015 change 2016 2015 2016 2015
Consumer Discretionary
33.0 31.3 + 1.7 83 84 Time Warner Inc.
(90.0) Time Warner Inc.
(90.0)
Consumer Staples
47.5 45.1 + 2.4 35 36 General Mills, Inc.
(92.9) General Mills, Inc.
(92.9)
Energy 39.5 42.1 - 2.6 37 41 Noble Energy, Inc.
(97.1) Noble Energy, Inc.
(97.1)
Financials 37.4 35.5 + 1.9 90 87 State Street Corp.
(97.1) Unum Corp.
(95.7)
Health Care 52.2 49.8 + 2.4 55 55
Becton, Dickinson and Co. (97.1)
Edwards Lifesciences Corp. (97.1)
Becton, Dickinson and Co. (97.1)
Industrials 38.9 37.1 + 1.8 66 66 CSX Corp.
(97.1) CSX Corp.
(97.1)
Information Technology
39.8 36.3 + 3.5 66 64 Microsoft Corp.
(95.7) Microsoft Corp.
(95.7)
Materials 46.2 47.3 - 1.1 27 29 International Paper
Co. (97.1) Monsanto Co.
(94.3)
Telecomm Services
47.0 46.7 + 0.3 5 6 AT&T Inc. (75.7)
CenturyLink, Inc. (75.7) CenturyLink, Inc.
(81.4)
Utilities 56.3 47.0 + 9.3 29 29 Sempra Energy (97.1)
PG&E Corp. (97.1) Edison International
(95.7)

31
II. VOLUNTARY DISCLOSURE AND SHAREHOLDER ENGAGEMENT
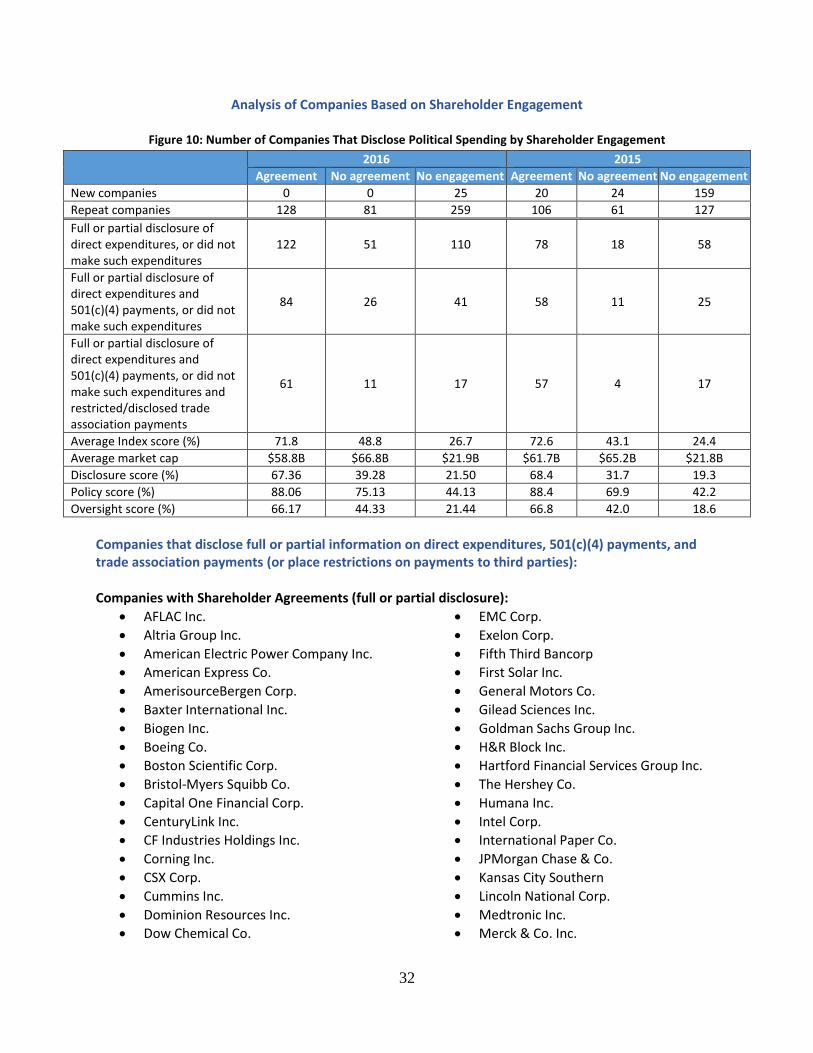
Over the past 13 years, 153 companies have adopted the political disclosure and accountability model proposed by CPA and its shareholder partners. Other companies have recognized the value of these practices and have adopted them without shareholder engagement, or without an agreement with shareholder groups. Many follow the Center’s model or have used the Index indicators as a template. Disclosure by All Companies Engaged by Shareholders: Of the 493 companies included in the 2016 Index, 209 companies have been formally engaged by shareholders with a resolution on the issue of corporate political spending disclosure and accountability. Of these companies, 128 have reached agreements with shareholders. A total of 284 companies have not received a shareholder resolution on the issue. For companies with an agreement, the average overall Index score is 71.8 percent, as compared to 48.8 percent for companies that were engaged but did not reach an agreement. The average score for companies that have not been engaged is 26.7 percent. Disclosure by Companies with No History of Shareholder Engagement: Of the 284 companies that have no history of shareholder engagement, 109 (38 percent) disclosed full or partial information on direct expenditures or said they do not make such expenditures. Thirty-two (11 percent) disclosed full or partial information on direct expenditures and 501(c)(4) payments, or said they don’t make such expenditures, and disclosed full or partial information on trade association payments or said they restrict such funds. In 2015, of the 286 companies without shareholder engagement, only 57 (20 percent) disclosed full or partial information on direct expenditures or said they did not make such expenditures. Only 17 (6 percent) disclosed full or partial information on direct expenditures and (501)(c)(4) payments, or said they did not make such expenditures, and disclosed full or partial information on trade association payments or said they restrict such funds.
32
Analysis of Companies Based on Shareholder Engagement
Figure 10: Number of Companies That Disclose Political Spending by Shareholder Engagement
2016 2015
Agreement No agreement No engagement Agreement No agreement No engagement
New companies 0 0 25 20 24 159
Repeat companies 128 81 259 106 61 127
Full or partial disclosure of direct expenditures, or did not make such expenditures
122 51 110 78 18 58
Full or partial disclosure of direct expenditures and 501(c)(4) payments, or did not make such expenditures
84 26 41 58 11 25
Full or partial disclosure of direct expenditures and 501(c)(4) payments, or did not make such expenditures and restricted/disclosed trade association payments
61 11 17 57 4 17
Average Index score (%) 71.8 48.8 26.7 72.6 43.1 24.4
Average market cap $58.8B $66.8B $21.9B $61.7B $65.2B $21.8B
Disclosure score (%) 67.36 39.28 21.50 68.4 31.7 19.3
Policy score (%) 88.06 75.13 44.13 88.4 69.9 42.2
Oversight score (%) 66.17 44.33 21.44 66.8 42.0 18.6
Companies that disclose full or partial information on direct expenditures, 501(c)(4) payments, and trade association payments (or place restrictions on payments to third parties): Companies with Shareholder Agreements (full or partial disclosure):
AFLAC Inc.
Altria Group Inc.
American Electric Power Company Inc.
American Express Co.
AmerisourceBergen Corp.
Baxter International Inc.
Biogen Inc.
Boeing Co.
Boston Scientific Corp.
Bristol-Myers Squibb Co.
Capital One Financial Corp.
CenturyLink Inc.
CF Industries Holdings Inc.
Corning Inc.
CSX Corp.
Cummins Inc.
Dominion Resources Inc.
Dow Chemical Co.
EMC Corp.
Exelon Corp.
Fifth Third Bancorp
First Solar Inc.
General Motors Co.
Gilead Sciences Inc.
Goldman Sachs Group Inc.
H&R Block Inc.
Hartford Financial Services Group Inc.
The Hershey Co.
Humana Inc.
Intel Corp.
International Paper Co.
JPMorgan Chase & Co.
Kansas City Southern
Lincoln National Corp.
Medtronic Inc.
Merck & Co. Inc.

33
MetLife Inc.
Microsoft Corp.
Monsanto Co.
Morgan Stanley
Mylan NV
Noble Energy Inc.
Norfolk Southern Corp.
Pioneer Natural Resources Co.
Praxair Inc.
Prudential Financial Inc.
Public Service Enterprise Group Inc.
Qualcomm Inc.
Regions Financial Corp.
Sempra Energy
Southern Co.
Staples Inc.
State Street Corp.
Target Corp.
Tesoro Petroleum Corp.
Thermo Fisher Scientific Inc.
United Parcel Service Inc.
United Technologies Corp.
Unum Group
Waste Management Inc.
Wells Fargo & Co.
Companies That Were Engaged, without Shareholder Agreements (full or partial disclosure):
AES Corp.
Bank of America Corp.
Express Scripts Holding Co.
Illinois Tool Works Inc.
International Business Machines Corp.
Newmont Mining Corp.
Northrop Grumman Corp.
PPL Corp.
Schlumberger Ltd.
Symantec Corp.
Valero Energy Corp.
Companies with No History of Shareholder Engagement (full or partial disclosure):
Accenture PLC
Automatic Data Processing Inc.
Bank of New York Mellon Corp.
Becton, Dickinson and Co.
Celgene Corp.
Consolidated Edison Inc.
Darden Restaurants Inc.
Edison International
Edwards Lifesciences Corp.
Estee Lauder Companies Inc.
Freeport-McMoRan Copper & Gold Inc.
HP Inc.
Kraft Heinz Co.
Navient Corp.
Nielsen Holdings NV
PG&E Corp.
Ralph Lauren Corp.
Companies with No History of Shareholder Engagement (full disclosure):
Accenture PLC
Automatic Data Processing Inc.
Bank of New York Mellon Corp.
Becton, Dickinson and Co.
Celgene Corp.
Darden Restaurants Inc.
Edison International
Edwards Lifesciences Corp.
Freeport-McMoRan Copper & Gold Inc.
HP Inc.
Kraft Heinz Co.
Nielsen Holdings NV
PG&E Corp.

34
III. COMPARISON OF COMPANIES OVER TIME
COMPARISON OF COMPANIES FROM 2015 TO 2016
A total of 462 companies were studied in both the 2015 and 2016 Indexes (excluding eight companies
that were in the no-spending category in 2016). For these 462 companies, the average overall score rose
to 43.3 percent in 2016, from 39.7 percent in 2015. For each Index category, the average score for the
461 companies climbed:
Figure 11: Average Index Scores by Year
Index Category 2016 Average Score (%) 2015 Average Score (%) Change (%)
Disclosure 36.91 33.78 + 3.13
Policy 62.25 58.45 + 3.80
Oversight 37.99 34.29 + 3.71
Eighty-six companies placed in the first tier (with scores from 80 to 100 percent) and 96 companies
placed in the second tier (with scores from 60 to 79 percent), compared with 69 companies in the first
tier and 100 in the second tier in 2015. For 2016, that comes to 182 companies in the first and second
tiers, up from 169 companies in 2015.
COMPANIES HAVE SHOWN CONSISTENT IMPROVEMENT SINCE 2012
A total of 174 companies have been included in each year’s Index since 2012, and their average score in
2016 is 63.0 percent, compared to 59.1 percent in 2015 and 38.1 percent in 2012. As a whole, these
companies’ scores have improved each year, suggesting that the more experience companies have with
the Index, the better they score and the more motivated they are to improve.
0.0
10.0
20.0
30.0
40.0
50.0
60.0
70.0
80.0
90.0
2012 2013 2014 2015 2016
Ave
rage
Sco
re
Year
Average Index Score over Time
Total
Disclosure
Policy
Oversight
*For companies that have been part of the Index since 2012
35
MOST IMPROVED COMPANIES THIS YEAR
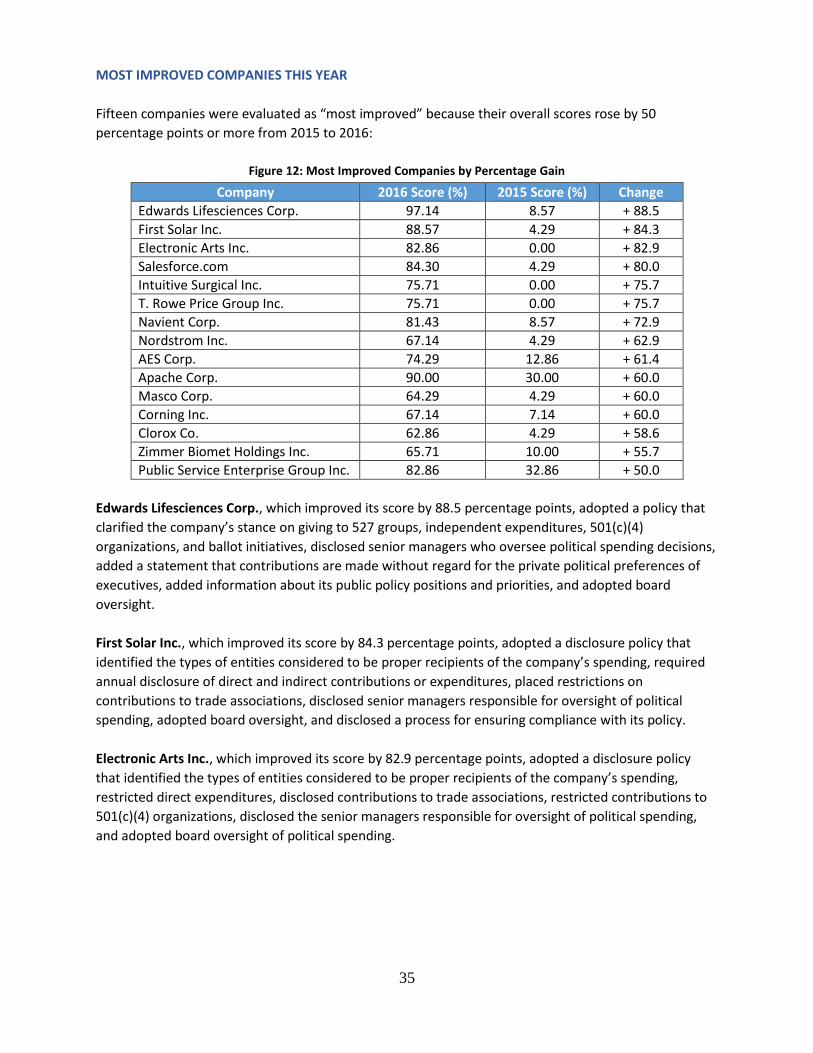
Fifteen companies were evaluated as “most improved” because their overall scores rose by 50
percentage points or more from 2015 to 2016:
Figure 12: Most Improved Companies by Percentage Gain
Company 2016 Score (%) 2015 Score (%) Change
Edwards Lifesciences Corp. 97.14 8.57 + 88.5
First Solar Inc. 88.57 4.29 + 84.3
Electronic Arts Inc. 82.86 0.00 + 82.9
Salesforce.com 84.30 4.29 + 80.0
Intuitive Surgical Inc. 75.71 0.00 + 75.7
T. Rowe Price Group Inc. 75.71 0.00 + 75.7
Navient Corp. 81.43 8.57 + 72.9
Nordstrom Inc. 67.14 4.29 + 62.9
AES Corp. 74.29 12.86 + 61.4
Apache Corp. 90.00 30.00 + 60.0
Masco Corp. 64.29 4.29 + 60.0
Corning Inc. 67.14 7.14 + 60.0
Clorox Co. 62.86 4.29 + 58.6
Zimmer Biomet Holdings Inc. 65.71 10.00 + 55.7
Public Service Enterprise Group Inc. 82.86 32.86 + 50.0
Edwards Lifesciences Corp., which improved its score by 88.5 percentage points, adopted a policy that
clarified the company’s stance on giving to 527 groups, independent expenditures, 501(c)(4)
organizations, and ballot initiatives, disclosed senior managers who oversee political spending decisions,
added a statement that contributions are made without regard for the private political preferences of
executives, added information about its public policy positions and priorities, and adopted board
oversight.
First Solar Inc., which improved its score by 84.3 percentage points, adopted a disclosure policy that
identified the types of entities considered to be proper recipients of the company’s spending, required
annual disclosure of direct and indirect contributions or expenditures, placed restrictions on
contributions to trade associations, disclosed senior managers responsible for oversight of political
spending, adopted board oversight, and disclosed a process for ensuring compliance with its policy.
Electronic Arts Inc., which improved its score by 82.9 percentage points, adopted a disclosure policy
that identified the types of entities considered to be proper recipients of the company’s spending,
restricted direct expenditures, disclosed contributions to trade associations, restricted contributions to
501(c)(4) organizations, disclosed the senior managers responsible for oversight of political spending,
and adopted board oversight of political spending.
36
Salesforce.com Inc., which improved its score by 80 percentage points, instituted a comprehensive
political spending policy, began disclosing some direct and indirect political contributions, clarified the
kinds of entities to which it gives, disclosed the senior managers responsible for oversight of political
spending, adopted board oversight of political spending, and instituted a process for ensuring
compliance with its policy.
Intuitive Surgical Inc., which improved its score by 75.7 percentage points, instituted a comprehensive
political spending policy that describes the company’s restrictions on direct and indirect political
contributions and discloses the senior managers responsible for oversight of such contributions.
T. Rowe Price Group Inc., which improved its score by 75.7 percentage points, adopted a political
spending policy which clarified the company’s prohibition on direct political contributions, and disclosed
some information about payments to trade associations.
Navient Corp., which improved its score by 72.9 percentage points, adopted a political spending policy
that clarifies the entities to which the company may give and requires disclosure of direct and indirect
political expenditures, discloses the managers with oversight responsibility, discloses the company’s
public policy positions and priorities, provides for board oversight, and discloses a statement about the
company’s compliance efforts.
AES Corp., which improved its score by 61.4 percentage points, adopted a political spending policy that
clarifies the entities to which the company may give, required disclosure of direct and indirect political
expenditures, disclosed senior managers with oversight responsibility, disclosed the company’s public
policy positions and priorities, and included a statement that contributions are made without regard for
the private political preferences of executives.
Masco Corp., which improved its score by 60 percentage points, adopted a comprehensive political
spending policy, instituted disclosure of direct political expenditures, disclosed senior managers with
oversight responsibility, and adopted board oversight of political spending.
Corning Inc., which improved its score by 60 percentage points, adopted a political spending policy,
began disclosing some direct and indirect political expenditures, added a statement that contributions
are made without regard for the private political preferences of executives, disclosed senior managers
with oversight responsibility, and adopted board oversight.
Clorox Co., which improved its score by 58.6 percentage points, adopted a political spending policy that
clarifies the entities to which the company may give, instituted disclosure of direct political
expenditures, identified senior managers with oversight responsibility, and added a statement that
contributions are made without regard for the private political preferences of executives.
Apache Corp., which improved its score by 57.1 percentage points, adopted a political spending policy
that clarifies the company’s restrictions on political spending, instituted disclosure of ballot measure and
indirect political expenditures, disclosed the managers with oversight responsibility, disclosed the
company’s public policy positions and priorities, provided for board oversight, and added a statement
about the company’s compliance efforts.

37
Zimmer Biomet Holdings Inc., which improved its score by 55.7 percentage points, disclosed a policy
that clarifies the company’s prohibition on direct political expenditures and discloses some indirect
political expenditures, disclosed the company’s public policy positions and priorities, and disclosed a
statement on its compliance procedures.
Nordstrom Inc., which improved its score by 54.3 percentage points, adopted a policy describing the
company’s prohibition on direct political contributions and contributions to 501(c)(4) organizations,
added a statement that any contributions would be made without regard for the private political
preferences of executives, and adopted board oversight.
Public Service Enterprise Group Inc., which improved its score by 50 percentage points, adopted a
political spending policy, instituted disclosure of direct and indirect expenditures, disclosed the senior
managers with oversight responsibility, and adopted board oversight.
38
APPENDIX A. METHODOLOGY
In late 2003, the Center for Political Accountability launched an initiative to persuade companies to adopt board oversight and disclosure of political spending. Today, the CPA-Zicklin Index provides a scorecard. It measures how corporations have changed their policies and practices over time, and it portrays how companies are positioning themselves for the future.
SCOPE OF RESEARCH
Scoring in the Index is based on publicly available information from each company’s website, collected by researchers at Sustainable Investments Institute (Si2) under the supervision of CPA staff.
For the purposes of this study, corporate political spending was defined as expenditures from corporate treasury funds, direct and indirect, used to sway votes on political candidates and ballot issues. See the Glossary at the end of this report for further explanation.
The study reviewed the corporate political spending practices of the S&P 500. The Index’s list of companies is based on the S&P 500 as of May 2016. In 2016, Avago acquired Broadcom Corp. and the merged entity became Broadcom Ltd. SanDisk was acquired by Western Digital on May 12, 2016. Coca-Cola Enterprises Inc. merged with two other European bottlers of Coca-Cola on May 31, 2016. Baxalta Inc. was acquired by Shire PLC on June 3, 2016. Cablevision was acquired by Altice on June 22, 2016. Columbia Pipeline Group Inc. was acquired by TransCanada on July 5, 2016. These exclusions resulted in a total of 493 companies in the 2015 Index.
SAFEGUARDING OBJECTIVITY
To develop an objective system for scoring companies, CPA established an advisory committee. (The members are listed in “Acknowledgments.”)
To determine company scores, CPA conducted an objective review of information available on company web sites. In some instances, the follow-up discussions with companies about their preliminary scores also contributed to this objective review.
CPA has worked in its research process to maintain openness and transparency. In June 2016, CPA sent letters to the S&P 500 informing them of the project and provided a copy of the indicators to be used in rating companies.
Approximately 130 companies, or 26 percent of the companies in the Index, replied with questions and comments. All information included in this report reflects publicly available data, as reviewed by CPA during its research period or at the time of this report.
ASSIGNING NUMERICAL SCORES TO RESPONSES
The “Scoring Key” on page 40 of this report lists the 2016 indicators and the maximum points given for each. Numerical scores were assigned following a simple arithmetic system, described below.
A response of “No” to an indicator resulted in a score of zero;
A response of “Yes” or “Not Applicable (N/A)” resulted in the maximum score; and
A response of “Partial” resulted in half of the maximum score.
The indicators that are highlighted in the Scoring Key are considered “key performance indicators” (KPIs), which are scored more heavily than the rest.

39
APPENDIX B: GLOSSARY
Ballot measure committee: A group formed to support or oppose the qualification or passage of a ballot initiative or referendum.
Direct political spending: Contributions to state legislative, judicial and local candidates; political parties and political committees (including those supporting or opposing ballot initiatives); and contributions to other political entities organized and operating under 26 U.S.C. Sec. 527 of the Internal Revenue Code, such as the Democratic and Republican Governors Associations, or so-called “Super PACs.”
Direct spending can also include independent expenditures, which may not be coordinated with any candidate or political committee.
Electioneering communication: A radio or television broadcast that refers to a federal candidate in the 30 days preceding a primary or 60 days preceding a general election (2 U.S.C. § 434(f)(3)).
Independent expenditure: A public communication that expressly advocates the election or defeat of a candidate and is not coordinated with a candidate or political party.
Indirect political spending: Payments to trade associations and other tax-exempt organizations used for political purposes. Under the federal tax code, civic leagues and social welfare organizations (501(c)(4) organizations) and business leagues and trade associations (501(c)(6) organizations) may engage in political campaign activity so long as the political activity does not comprise the group’s primary activity.
Indirect political spending may include independent expenditures when corporate payments to trade associations or 501(c)(4)s are in turn spent to purchase ads supporting or opposing candidates, or the trade associations or 501(c)(4)s pass these corporate payments to other organizations.
A company may not be aware that a portion of its dues or other payments is used for political activity.
Political activity/political spending: Any direct or indirect contributions or expenditures on behalf of or in opposition to a candidate for public office or referenda; any payments made to trade associations or tax-exempt entities used for influencing a political campaign; and any direct or indirect political expenditure that must be reported to the Federal Election Commission, Internal Revenue Service, or state disclosure agency.

40
APPENDIX C: SCORING KEY
A qualitative response of "Yes" or "Not Applicable" to an indicator is given the maximum score.
A qualitative response of "Partial" is given half of the maximum score.
A qualitative response of "No" is given a score of 0.
# Indicator Max Score
Dis
clo
sure
1
Does the company publicly disclose corporate contributions to political candidates, parties and committees, including recipient names and amounts given? 4
2
Does the company publicly disclose payments to 527 groups, such as governors associations and super PACs, including recipient names and amounts given? 4
3
Does the company publicly disclose independent political expenditures made in direct support of or opposition to a campaign, including recipient names and amounts given? 4
4
Does the company publicly disclose payments to trade associations that the recipient organization may use for political purposes? 6
5
Does the company publicly disclose payments to other tax-exempt organizations, such as 501(c)(4)s, that the recipient may use for political purposes? 6
6
Does the company publicly disclose a list of the amounts and recipients of payments made by trade associations or other tax exempt organizations of which the company is either a member or donor? 2
7
Does the company publicly disclose payments made to influence the outcome of ballot measures, including recipient names and amounts given? 4
8
Does the company publicly disclose the company’s senior managers (by position/title of the individuals involved) who have final authority over the company’s political spending decisions? 2
9
Does the company publicly disclose an archive of each political expenditure report, including all direct and/or indirect contributions, for each year since the company began disclosing the information (or at least for the past five years)? 4
Po
licy
10 Does the company disclose a detailed policy governing its political expenditures from corporate funds? 6
11
Does the company have a publicly available policy permitting political contributions only through voluntary employee-funded PAC contributions?
Yes/ No
12
Does the company have a publicly available policy stating that all of its contributions will promote the interests of the company and will be made without regard for the private political preferences of executives? 2
13
Does the company publicly describe the types of entities considered to be proper recipients of the company’s political spending? 2
14
Does the company publicly describe its public policy positions that become the basis for its spending decisions with corporate funds? 2
15
Does the company have a public policy requiring senior managers to oversee and have final authority over all of the company’s political spending? 2
16
Does the company have a publicly available policy that the board of directors regularly oversees the company’s corporate political activity? 2
Ove
rsig
ht
17 Does the company have a specified board committee that reviews the company’s policy on political expenditures? 2
18
Does the company have a specified board committee that reviews the company’s political expenditures made with corporate funds? 2
19
Does the company have a specified board committee that reviews the company’s payments to trade associations and other tax-exempt organizations that may be used for political purposes? 2
20 Does the company have a specified board committee that approves political expenditures from corporate funds? 2
21
Does the company have a specified board committee, composed entirely of outside directors, that oversees its political activity? 2
22 Does the company post on its website a detailed report of its political spending with corporate funds semiannually? 4
23
Does the company make available a dedicated political disclosure web page found through search or accessible within three mouse-clicks from homepage? 2
24
Does the company disclose an internal process for or an affirmative statement on ensuring compliance with its political spending policy? 2
TOTAL MAXIMUM RAW SCORE 70
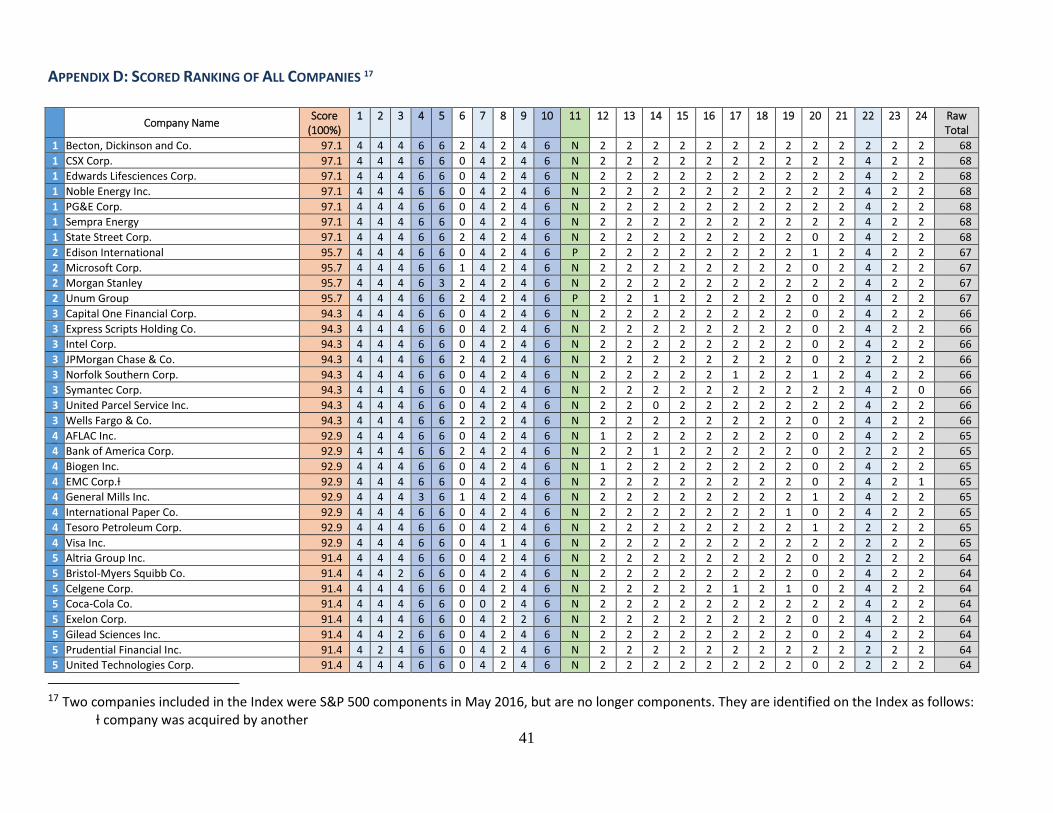
41
APPENDIX D: SCORED RANKING OF ALL COMPANIES 17
Company Name Score
(100%) 1 2 3 4 5 6 7 8 9 10 11 12 13 14 15 16 17 18 19 20 21 22 23 24 Raw
Total
1 Becton, Dickinson and Co. 97.1 4 4 4 6 6 2 4 2 4 6 N 2 2 2 2 2 2 2 2 2 2 2 2 2 68
1 CSX Corp. 97.1 4 4 4 6 6 0 4 2 4 6 N 2 2 2 2 2 2 2 2 2 2 4 2 2 68
1 Edwards Lifesciences Corp. 97.1 4 4 4 6 6 0 4 2 4 6 N 2 2 2 2 2 2 2 2 2 2 4 2 2 68
1 Noble Energy Inc. 97.1 4 4 4 6 6 0 4 2 4 6 N 2 2 2 2 2 2 2 2 2 2 4 2 2 68
1 PG&E Corp. 97.1 4 4 4 6 6 0 4 2 4 6 N 2 2 2 2 2 2 2 2 2 2 4 2 2 68
1 Sempra Energy 97.1 4 4 4 6 6 0 4 2 4 6 N 2 2 2 2 2 2 2 2 2 2 4 2 2 68
1 State Street Corp. 97.1 4 4 4 6 6 2 4 2 4 6 N 2 2 2 2 2 2 2 2 0 2 4 2 2 68
2 Edison International 95.7 4 4 4 6 6 0 4 2 4 6 P 2 2 2 2 2 2 2 2 1 2 4 2 2 67
2 Microsoft Corp. 95.7 4 4 4 6 6 1 4 2 4 6 N 2 2 2 2 2 2 2 2 0 2 4 2 2 67
2 Morgan Stanley 95.7 4 4 4 6 3 2 4 2 4 6 N 2 2 2 2 2 2 2 2 2 2 4 2 2 67
2 Unum Group 95.7 4 4 4 6 6 2 4 2 4 6 P 2 2 1 2 2 2 2 2 0 2 4 2 2 67
3 Capital One Financial Corp. 94.3 4 4 4 6 6 0 4 2 4 6 N 2 2 2 2 2 2 2 2 0 2 4 2 2 66
3 Express Scripts Holding Co. 94.3 4 4 4 6 6 0 4 2 4 6 N 2 2 2 2 2 2 2 2 0 2 4 2 2 66
3 Intel Corp. 94.3 4 4 4 6 6 0 4 2 4 6 N 2 2 2 2 2 2 2 2 0 2 4 2 2 66
3 JPMorgan Chase & Co. 94.3 4 4 4 6 6 2 4 2 4 6 N 2 2 2 2 2 2 2 2 0 2 2 2 2 66
3 Norfolk Southern Corp. 94.3 4 4 4 6 6 0 4 2 4 6 N 2 2 2 2 2 1 2 2 1 2 4 2 2 66
3 Symantec Corp. 94.3 4 4 4 6 6 0 4 2 4 6 N 2 2 2 2 2 2 2 2 2 2 4 2 0 66
3 United Parcel Service Inc. 94.3 4 4 4 6 6 0 4 2 4 6 N 2 2 0 2 2 2 2 2 2 2 4 2 2 66
3 Wells Fargo & Co. 94.3 4 4 4 6 6 2 2 2 4 6 N 2 2 2 2 2 2 2 2 0 2 4 2 2 66
4 AFLAC Inc. 92.9 4 4 4 6 6 0 4 2 4 6 N 1 2 2 2 2 2 2 2 0 2 4 2 2 65
4 Bank of America Corp. 92.9 4 4 4 6 6 2 4 2 4 6 N 2 2 1 2 2 2 2 2 0 2 2 2 2 65
4 Biogen Inc. 92.9 4 4 4 6 6 0 4 2 4 6 N 1 2 2 2 2 2 2 2 0 2 4 2 2 65
4 EMC Corp.ƚ 92.9 4 4 4 6 6 0 4 2 4 6 N 2 2 2 2 2 2 2 2 0 2 4 2 1 65
4 General Mills Inc. 92.9 4 4 4 3 6 1 4 2 4 6 N 2 2 2 2 2 2 2 2 1 2 4 2 2 65
4 International Paper Co. 92.9 4 4 4 6 6 0 4 2 4 6 N 2 2 2 2 2 2 2 1 0 2 4 2 2 65
4 Tesoro Petroleum Corp. 92.9 4 4 4 6 6 0 4 2 4 6 N 2 2 2 2 2 2 2 2 1 2 2 2 2 65
4 Visa Inc. 92.9 4 4 4 6 6 0 4 1 4 6 N 2 2 2 2 2 2 2 2 2 2 2 2 2 65
5 Altria Group Inc. 91.4 4 4 4 6 6 0 4 2 4 6 N 2 2 2 2 2 2 2 2 0 2 2 2 2 64
5 Bristol-Myers Squibb Co. 91.4 4 4 2 6 6 0 4 2 4 6 N 2 2 2 2 2 2 2 2 0 2 4 2 2 64
5 Celgene Corp. 91.4 4 4 4 6 6 0 4 2 4 6 N 2 2 2 2 2 1 2 1 0 2 4 2 2 64
5 Coca-Cola Co. 91.4 4 4 4 6 6 0 0 2 4 6 N 2 2 2 2 2 2 2 2 2 2 4 2 2 64
5 Exelon Corp. 91.4 4 4 4 6 6 0 4 2 2 6 N 2 2 2 2 2 2 2 2 0 2 4 2 2 64
5 Gilead Sciences Inc. 91.4 4 4 2 6 6 0 4 2 4 6 N 2 2 2 2 2 2 2 2 0 2 4 2 2 64
5 Prudential Financial Inc. 91.4 4 2 4 6 6 0 4 2 4 6 N 2 2 2 2 2 2 2 2 2 2 2 2 2 64
5 United Technologies Corp. 91.4 4 4 4 6 6 0 4 2 4 6 N 2 2 2 2 2 2 2 2 0 2 2 2 2 64
17 Two companies included in the Index were S&P 500 components in May 2016, but are no longer components. They are identified on the Index as follows: ƚ company was acquired by another
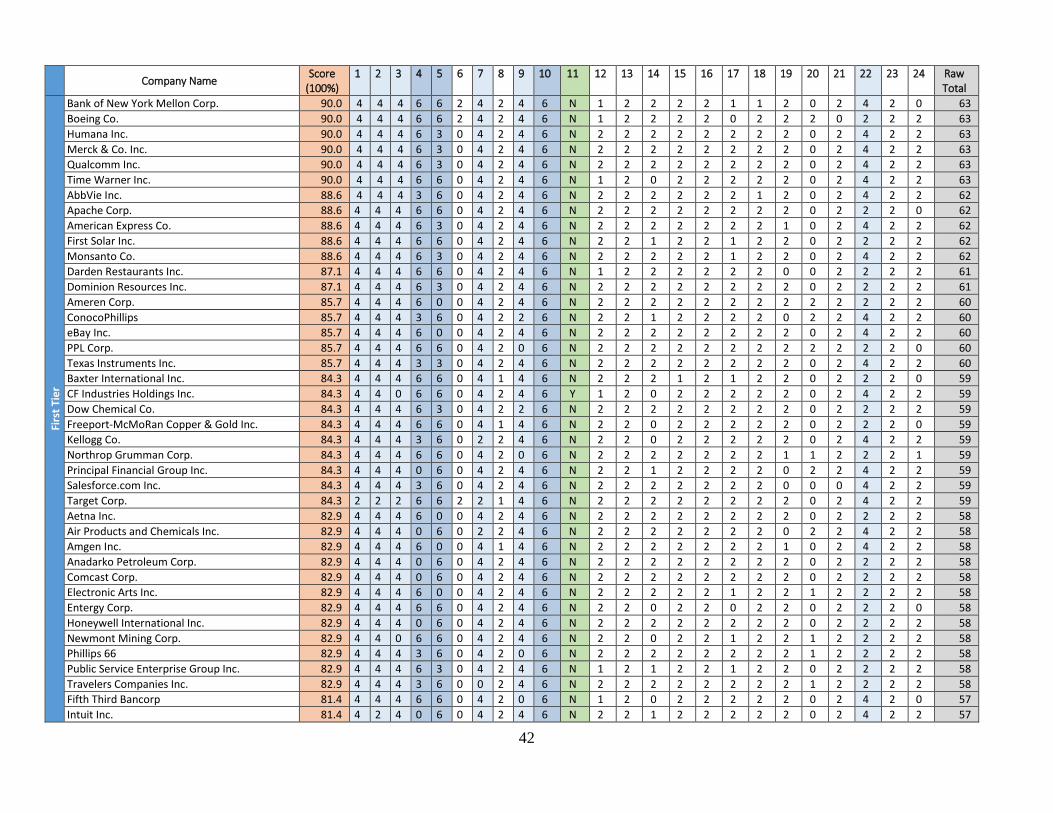
42
Company Name Score
(100%) 1 2 3 4 5 6 7 8 9 10 11 12 13 14 15 16 17 18 19 20 21 22 23 24 Raw
Total
Firs
t Ti
er
Bank of New York Mellon Corp. 90.0 4 4 4 6 6 2 4 2 4 6 N 1 2 2 2 2 1 1 2 0 2 4 2 0 63
Boeing Co. 90.0 4 4 4 6 6 2 4 2 4 6 N 1 2 2 2 2 0 2 2 2 0 2 2 2 63
Humana Inc. 90.0 4 4 4 6 3 0 4 2 4 6 N 2 2 2 2 2 2 2 2 0 2 4 2 2 63
Merck & Co. Inc. 90.0 4 4 4 6 3 0 4 2 4 6 N 2 2 2 2 2 2 2 2 0 2 4 2 2 63
Qualcomm Inc. 90.0 4 4 4 6 3 0 4 2 4 6 N 2 2 2 2 2 2 2 2 0 2 4 2 2 63
Time Warner Inc. 90.0 4 4 4 6 6 0 4 2 4 6 N 1 2 0 2 2 2 2 2 0 2 4 2 2 63
AbbVie Inc. 88.6 4 4 4 3 6 0 4 2 4 6 N 2 2 2 2 2 2 1 2 0 2 4 2 2 62
Apache Corp. 88.6 4 4 4 6 6 0 4 2 4 6 N 2 2 2 2 2 2 2 2 0 2 2 2 0 62
American Express Co. 88.6 4 4 4 6 3 0 4 2 4 6 N 2 2 2 2 2 2 2 1 0 2 4 2 2 62
First Solar Inc. 88.6 4 4 4 6 6 0 4 2 4 6 N 2 2 1 2 2 1 2 2 0 2 2 2 2 62
Monsanto Co. 88.6 4 4 4 6 3 0 4 2 4 6 N 2 2 2 2 2 1 2 2 0 2 4 2 2 62
Darden Restaurants Inc. 87.1 4 4 4 6 6 0 4 2 4 6 N 1 2 2 2 2 2 2 0 0 2 2 2 2 61
Dominion Resources Inc. 87.1 4 4 4 6 3 0 4 2 4 6 N 2 2 2 2 2 2 2 2 0 2 2 2 2 61
Ameren Corp. 85.7 4 4 4 6 0 0 4 2 4 6 N 2 2 2 2 2 2 2 2 2 2 2 2 2 60
ConocoPhillips 85.7 4 4 4 3 6 0 4 2 2 6 N 2 2 1 2 2 2 2 0 2 2 4 2 2 60
eBay Inc. 85.7 4 4 4 6 0 0 4 2 4 6 N 2 2 2 2 2 2 2 2 0 2 4 2 2 60
PPL Corp. 85.7 4 4 4 6 6 0 4 2 0 6 N 2 2 2 2 2 2 2 2 2 2 2 2 0 60
Texas Instruments Inc. 85.7 4 4 4 3 3 0 4 2 4 6 N 2 2 2 2 2 2 2 2 0 2 4 2 2 60
Baxter International Inc. 84.3 4 4 4 6 6 0 4 1 4 6 N 2 2 2 1 2 1 2 2 0 2 2 2 0 59
CF Industries Holdings Inc. 84.3 4 4 0 6 6 0 4 2 4 6 Y 1 2 0 2 2 2 2 2 0 2 4 2 2 59
Dow Chemical Co. 84.3 4 4 4 6 3 0 4 2 2 6 N 2 2 2 2 2 2 2 2 0 2 2 2 2 59
Freeport-McMoRan Copper & Gold Inc. 84.3 4 4 4 6 6 0 4 1 4 6 N 2 2 0 2 2 2 2 2 0 2 2 2 0 59
Kellogg Co. 84.3 4 4 4 3 6 0 2 2 4 6 N 2 2 0 2 2 2 2 2 0 2 4 2 2 59
Northrop Grumman Corp. 84.3 4 4 4 6 6 0 4 2 0 6 N 2 2 2 2 2 2 2 1 1 2 2 2 1 59
Principal Financial Group Inc. 84.3 4 4 4 0 6 0 4 2 4 6 N 2 2 1 2 2 2 2 0 2 2 4 2 2 59
Salesforce.com Inc. 84.3 4 4 4 3 6 0 4 2 4 6 N 2 2 2 2 2 2 2 0 0 0 4 2 2 59
Target Corp. 84.3 2 2 2 6 6 2 2 1 4 6 N 2 2 2 2 2 2 2 2 0 2 4 2 2 59
Aetna Inc. 82.9 4 4 4 6 0 0 4 2 4 6 N 2 2 2 2 2 2 2 2 0 2 2 2 2 58
Air Products and Chemicals Inc. 82.9 4 4 4 0 6 0 2 2 4 6 N 2 2 2 2 2 2 2 0 2 2 4 2 2 58
Amgen Inc. 82.9 4 4 4 6 0 0 4 1 4 6 N 2 2 2 2 2 2 2 1 0 2 4 2 2 58
Anadarko Petroleum Corp. 82.9 4 4 4 0 6 0 4 2 4 6 N 2 2 2 2 2 2 2 2 0 2 2 2 2 58
Comcast Corp. 82.9 4 4 4 0 6 0 4 2 4 6 N 2 2 2 2 2 2 2 2 0 2 2 2 2 58
Electronic Arts Inc. 82.9 4 4 4 6 0 0 4 2 4 6 N 2 2 2 2 2 1 2 2 1 2 2 2 2 58
Entergy Corp. 82.9 4 4 4 6 6 0 4 2 4 6 N 2 2 0 2 2 0 2 2 0 2 2 2 0 58
Honeywell International Inc. 82.9 4 4 4 0 6 0 4 2 4 6 N 2 2 2 2 2 2 2 2 0 2 2 2 2 58
Newmont Mining Corp. 82.9 4 4 0 6 6 0 4 2 4 6 N 2 2 0 2 2 1 2 2 1 2 2 2 2 58
Phillips 66 82.9 4 4 4 3 6 0 4 2 0 6 N 2 2 2 2 2 2 2 2 1 2 2 2 2 58
Public Service Enterprise Group Inc. 82.9 4 4 4 6 3 0 4 2 4 6 N 1 2 1 2 2 1 2 2 0 2 2 2 2 58
Travelers Companies Inc. 82.9 4 4 4 3 6 0 0 2 4 6 N 2 2 2 2 2 2 2 2 1 2 2 2 2 58
Fifth Third Bancorp 81.4 4 4 4 6 6 0 4 2 0 6 N 1 2 0 2 2 2 2 2 0 2 4 2 0 57
Intuit Inc. 81.4 4 2 4 0 6 0 4 2 4 6 N 2 2 1 2 2 2 2 2 0 2 4 2 2 57

43
Company Name
Score (100%)
1 2 3 4 5 6 7 8 9 10 11 12 13 14 15 16 17 18 19 20 21 22 23 24 Raw Total
Firs
t
MetLife Inc. 81.4 4 4 4 6 3 0 4 1 4 6 N 1 2 2 2 2 2 2 2 0 2 2 2 0 57
Mylan NV 81.4 4 4 4 6 3 0 4 2 0 6 N 1 2 1 2 2 2 2 2 0 2 4 2 2 57
Navient Corp. 81.4 4 4 4 6 6 0 0 2 4 6 N 0 2 2 2 2 1 2 2 0 2 2 2 2 57
Pfizer Inc. 81.4 4 4 4 3 0 0 4 2 4 6 N 2 2 2 2 2 2 2 2 0 2 4 2 2 57
Apple Inc. 80.0 4 4 2 6 0 0 4 2 4 6 N 2 1 2 2 2 1 2 2 0 2 4 2 2 56
BB&T Corp. 80.0 4 4 4 0 6 0 4 2 4 6 N 2 2 2 2 2 2 2 2 0 2 0 2 2 56
Dr. Pepper Snapple Group Inc. 80.0 4 4 0 3 6 0 4 2 4 6 N 2 2 2 2 2 1 2 2 0 2 2 2 2 56
General Electric Co. 80.0 4 4 4 0 0 0 4 2 4 6 N 2 2 2 2 2 2 2 2 2 2 4 2 2 56
Hartford Financial Services Group Inc. 80.0 4 4 4 6 3 1 4 2 0 6 N 0 2 0 2 2 2 2 2 2 2 4 2 0 56
Illinois Tool Works Inc. 80.0 4 4 4 6 3 0 4 2 4 6 N 2 2 2 2 2 0 2 0 1 2 0 2 2 56
MasterCard Inc. 80.0 4 4 4 6 0 0 0 2 4 6 N 2 2 2 2 2 2 2 2 0 2 4 2 2 56
Seco
nd
Tie
r
AmerisourceBergen Corp. 78.6 0 4 4 6 3 0 4 2 4 6 N 2 2 2 2 2 2 2 2 0 2 2 2 0 55
Ecolab Inc. 78.6 4 4 4 3 0 0 4 2 4 6 N 2 2 2 2 2 2 2 0 0 2 4 2 2 55
Lockheed Martin Corp. 78.6 4 4 4 3 0 0 4 2 4 6 N 2 2 2 2 2 2 2 2 0 2 2 2 2 55
Southern Co. 78.6 4 4 4 6 6 0 4 2 4 6 N 1 2 2 2 2 0 0 0 0 0 2 2 2 55
Anthem Inc. 77.1 4 4 0 6 0 0 4 2 4 6 N 2 2 2 2 2 2 2 2 0 2 2 2 2 54
Boston Scientific Corp. 77.1 4 4 4 6 6 0 4 1 0 6 N 1 2 2 2 2 0 2 2 0 2 2 2 0 54
CVS Health Corp. 77.1 4 0 4 6 0 0 4 2 4 6 N 2 2 2 2 2 2 2 2 0 2 4 2 0 54
Estee Lauder Companies Inc. 77.1 0 4 4 6 6 0 4 2 0 6 N 2 2 2 2 2 2 2 2 2 0 0 2 2 54
General Motors Co. 77.1 4 4 4 6 3 0 4 2 0 6 N 1 2 2 2 2 2 2 2 0 2 2 2 0 54
Johnson & Johnson 77.1 4 4 4 3 0 0 4 1 4 6 N 2 2 2 2 2 2 2 2 0 2 4 2 0 54
Abbott Laboratories 75.7 4 4 4 3 0 0 4 2 4 6 N 2 2 2 2 2 2 0 2 0 2 4 2 0 53
AT&T Inc. 75.7 4 4 0 3 0 0 4 2 4 6 N 2 1 2 2 2 1 2 2 2 2 4 2 2 53
CenturyLink Inc. 75.7 4 4 0 6 6 0 4 2 0 6 N 2 2 2 2 2 1 1 1 0 0 4 2 2 53
Cigna Corp. 75.7 4 4 0 6 0 0 4 2 4 6 N 1 2 2 2 2 2 2 2 0 2 2 2 2 53
Discover Financial Services Inc. 75.7 4 4 4 3 6 0 4 2 2 6 N 2 2 2 2 2 0 2 0 0 2 0 2 2 53
H & R Block Inc. 75.7 4 4 0 6 3 0 4 2 4 6 N 2 2 0 2 2 2 2 2 0 2 0 2 2 53
Intuitive Surgical Inc. 75.7 4 4 4 3 6 0 4 2 4 6 N 2 2 2 2 1 0 1 0 1 1 2 2 0 53
Mondelez International Inc. 75.7 4 4 4 6 0 0 4 1 4 6 N 1 2 0 1 2 2 2 2 0 2 2 2 2 53
Regions Financial Corp. 75.7 4 4 4 6 6 0 4 2 0 6 N 0 2 0 2 2 1 2 2 0 2 2 2 0 53
T. Rowe Price Group Inc. 75.7 4 4 4 3 6 0 4 2 2 6 N 1 2 2 2 2 1 2 0 2 2 0 2 0 53
U.S. Bancorp 75.7 4 0 4 6 0 0 4 2 4 6 N 1 2 2 2 2 2 2 2 0 2 4 2 0 53
Union Pacific Corp. 75.7 4 4 4 3 6 0 4 2 4 6 P 1 0 1 2 2 2 2 2 0 2 0 2 0 53
Amazon.com Inc. 74.3 4 4 4 3 3 0 4 2 0 6 N 2 2 2 2 2 2 2 2 0 2 2 2 0 52
Applied Materials Inc. 74.3 4 4 4 3 3 0 4 2 4 6 N 2 2 2 2 1 1 1 1 0 2 2 2 0 52
Costco Wholesale Corp. 74.3 4 4 4 6 0 1 0 2 4 6 N 1 2 1 1 2 1 2 2 1 2 2 2 2 52
Cummins Inc. 74.3 4 4 4 6 6 0 4 1 4 6 N 1 2 1 1 1 0 1 0 1 1 2 2 0 52
Danaher Corp. 74.3 4 4 4 0 6 0 4 2 4 6 N 0 2 0 2 2 2 2 0 0 2 2 2 2 52
Kraft Heinz Co. 74.3 4 4 4 6 3 0 4 2 4 6 N 0 2 1 2 2 0 0 0 0 0 4 2 2 52
Marathon Oil Corp. 74.3 0 2 4 6 0 0 4 2 4 6 N 2 2 2 2 2 2 2 2 0 2 2 2 2 52
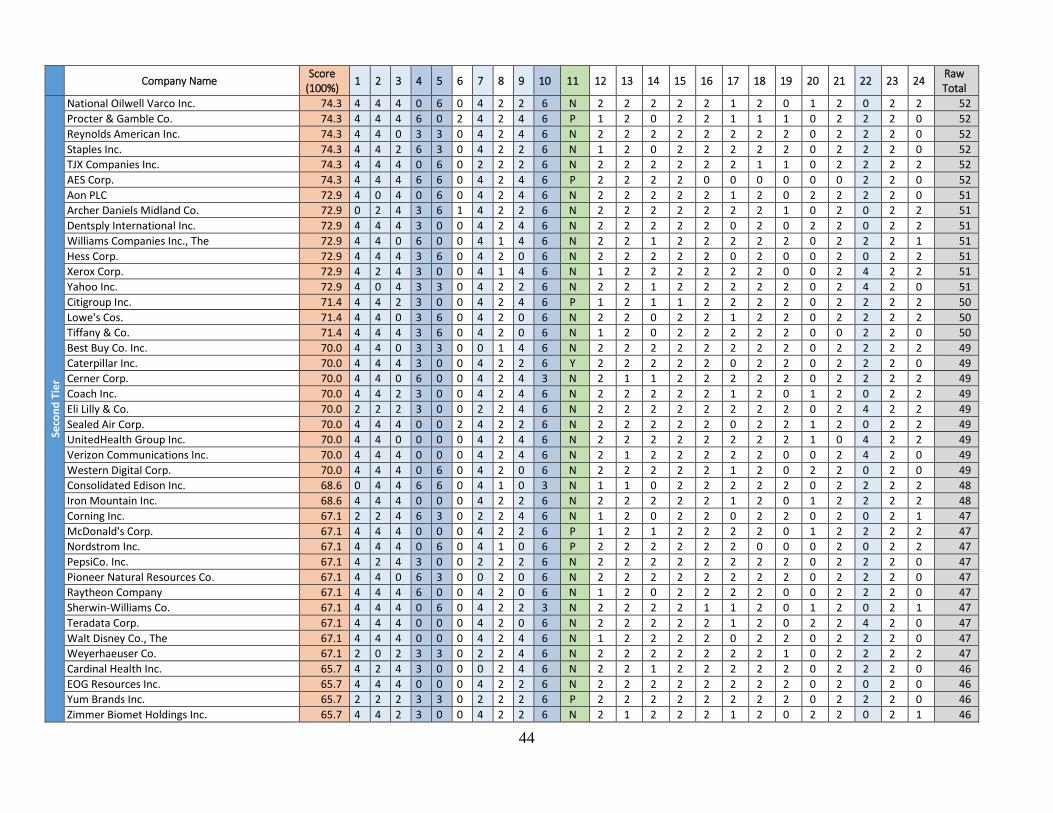
44
Company Name
Score (100%)
1 2 3 4 5 6 7 8 9 10 11 12 13 14 15 16 17 18 19 20 21 22 23 24 Raw Total
Seco
nd
Tie
r
National Oilwell Varco Inc. 74.3 4 4 4 0 6 0 4 2 2 6 N 2 2 2 2 2 1 2 0 1 2 0 2 2 52
Procter & Gamble Co. 74.3 4 4 4 6 0 2 4 2 4 6 P 1 2 0 2 2 1 1 1 0 2 2 2 0 52
Reynolds American Inc. 74.3 4 4 0 3 3 0 4 2 4 6 N 2 2 2 2 2 2 2 2 0 2 2 2 0 52
Staples Inc. 74.3 4 4 2 6 3 0 4 2 2 6 N 1 2 0 2 2 2 2 2 0 2 2 2 0 52
TJX Companies Inc. 74.3 4 4 4 0 6 0 2 2 2 6 N 2 2 2 2 2 2 1 1 0 2 2 2 2 52
AES Corp. 74.3 4 4 4 6 6 0 4 2 4 6 P 2 2 2 2 0 0 0 0 0 0 2 2 0 52
Aon PLC 72.9 4 0 4 0 6 0 4 2 4 6 N 2 2 2 2 2 1 2 0 2 2 2 2 0 51
Archer Daniels Midland Co. 72.9 0 2 4 3 6 1 4 2 2 6 N 2 2 2 2 2 2 2 1 0 2 0 2 2 51
Dentsply International Inc. 72.9 4 4 4 3 0 0 4 2 4 6 N 2 2 2 2 2 0 2 0 2 2 0 2 2 51
Williams Companies Inc., The 72.9 4 4 0 6 0 0 4 1 4 6 N 2 2 1 2 2 2 2 2 0 2 2 2 1 51
Hess Corp. 72.9 4 4 4 3 6 0 4 2 0 6 N 2 2 2 2 2 0 2 0 0 2 0 2 2 51
Xerox Corp. 72.9 4 2 4 3 0 0 4 1 4 6 N 1 2 2 2 2 2 2 0 0 2 4 2 2 51
Yahoo Inc. 72.9 4 0 4 3 3 0 4 2 2 6 N 2 2 1 2 2 2 2 2 0 2 4 2 0 51
Citigroup Inc. 71.4 4 4 2 3 0 0 4 2 4 6 P 1 2 1 1 2 2 2 2 0 2 2 2 2 50
Lowe's Cos. 71.4 4 4 0 3 6 0 4 2 0 6 N 2 2 0 2 2 1 2 2 0 2 2 2 2 50
Tiffany & Co. 71.4 4 4 4 3 6 0 4 2 0 6 N 1 2 0 2 2 2 2 2 0 0 2 2 0 50
Best Buy Co. Inc. 70.0 4 4 0 3 3 0 0 1 4 6 N 2 2 2 2 2 2 2 2 0 2 2 2 2 49
Caterpillar Inc. 70.0 4 4 4 3 0 0 4 2 2 6 Y 2 2 2 2 2 0 2 2 0 2 2 2 0 49
Cerner Corp. 70.0 4 4 0 6 0 0 4 2 4 3 N 2 1 1 2 2 2 2 2 0 2 2 2 2 49
Coach Inc. 70.0 4 4 2 3 0 0 4 2 4 6 N 2 2 2 2 2 1 2 0 1 2 0 2 2 49
Eli Lilly & Co. 70.0 2 2 2 3 0 0 2 2 4 6 N 2 2 2 2 2 2 2 2 0 2 4 2 2 49
Sealed Air Corp. 70.0 4 4 4 0 0 2 4 2 2 6 N 2 2 2 2 2 0 2 2 1 2 0 2 2 49
UnitedHealth Group Inc. 70.0 4 4 0 0 0 0 4 2 4 6 N 2 2 2 2 2 2 2 2 1 0 4 2 2 49
Verizon Communications Inc. 70.0 4 4 4 0 0 0 4 2 4 6 N 2 1 2 2 2 2 2 0 0 2 4 2 0 49
Western Digital Corp. 70.0 4 4 4 0 6 0 4 2 0 6 N 2 2 2 2 2 1 2 0 2 2 0 2 0 49
Consolidated Edison Inc. 68.6 0 4 4 6 6 0 4 1 0 3 N 1 1 0 2 2 2 2 2 0 2 2 2 2 48
Iron Mountain Inc. 68.6 4 4 4 0 0 0 4 2 2 6 N 2 2 2 2 2 1 2 0 1 2 2 2 2 48
Corning Inc. 67.1 2 2 4 6 3 0 2 2 4 6 N 1 2 0 2 2 0 2 2 0 2 0 2 1 47
McDonald's Corp. 67.1 4 4 4 0 0 0 4 2 2 6 P 1 2 1 2 2 2 2 0 1 2 2 2 2 47
Nordstrom Inc. 67.1 4 4 4 0 6 0 4 1 0 6 P 2 2 2 2 2 2 0 0 0 2 0 2 2 47
PepsiCo. Inc. 67.1 4 2 4 3 0 0 2 2 2 6 N 2 2 2 2 2 2 2 2 0 2 2 2 0 47
Pioneer Natural Resources Co. 67.1 4 4 0 6 3 0 0 2 0 6 N 2 2 2 2 2 2 2 2 0 2 2 2 0 47
Raytheon Company 67.1 4 4 4 6 0 0 4 2 0 6 N 1 2 0 2 2 2 2 0 0 2 2 2 0 47
Sherwin-Williams Co. 67.1 4 4 4 0 6 0 4 2 2 3 N 2 2 2 2 1 1 2 0 1 2 0 2 1 47
Teradata Corp. 67.1 4 4 4 0 0 0 4 2 0 6 N 2 2 2 2 2 1 2 0 2 2 4 2 0 47
Walt Disney Co., The 67.1 4 4 4 0 0 0 4 2 4 6 N 1 2 2 2 2 0 2 2 0 2 2 2 0 47
Weyerhaeuser Co. 67.1 2 0 2 3 3 0 2 2 4 6 N 2 2 2 2 2 2 2 1 0 2 2 2 2 47
Cardinal Health Inc. 65.7 4 2 4 3 0 0 0 2 4 6 N 2 2 1 2 2 2 2 2 0 2 2 2 0 46
EOG Resources Inc. 65.7 4 4 4 0 0 0 4 2 2 6 N 2 2 2 2 2 2 2 2 0 2 0 2 0 46
Yum Brands Inc. 65.7 2 2 2 3 3 0 2 2 2 6 P 2 2 2 2 2 2 2 2 0 2 2 2 0 46
Zimmer Biomet Holdings Inc. 65.7 4 4 2 3 0 0 4 2 2 6 N 2 1 2 2 2 1 2 0 2 2 0 2 1 46
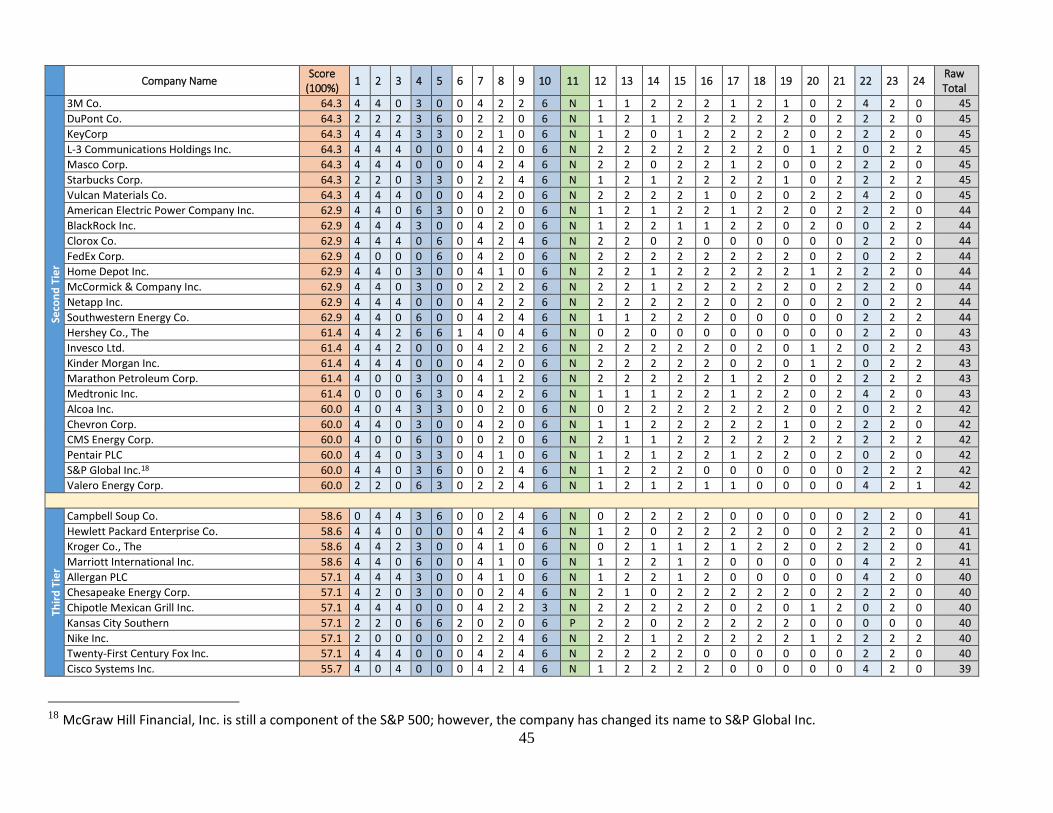
45
Company Name
Score (100%)
1 2 3 4 5 6 7 8 9 10 11 12 13 14 15 16 17 18 19 20 21 22 23 24 Raw Total
Seco
nd
Tie
r
3M Co. 64.3 4 4 0 3 0 0 4 2 2 6 N 1 1 2 2 2 1 2 1 0 2 4 2 0 45
DuPont Co. 64.3 2 2 2 3 6 0 2 2 0 6 N 1 2 1 2 2 2 2 2 0 2 2 2 0 45
KeyCorp 64.3 4 4 4 3 3 0 2 1 0 6 N 1 2 0 1 2 2 2 2 0 2 2 2 0 45
L-3 Communications Holdings Inc. 64.3 4 4 4 0 0 0 4 2 0 6 N 2 2 2 2 2 2 2 0 1 2 0 2 2 45
Masco Corp. 64.3 4 4 4 0 0 0 4 2 4 6 N 2 2 0 2 2 1 2 0 0 2 2 2 0 45
Starbucks Corp. 64.3 2 2 0 3 3 0 2 2 4 6 N 1 2 1 2 2 2 2 1 0 2 2 2 2 45
Vulcan Materials Co. 64.3 4 4 4 0 0 0 4 2 0 6 N 2 2 2 2 1 0 2 0 2 2 4 2 0 45
American Electric Power Company Inc. 62.9 4 4 0 6 3 0 0 2 0 6 N 1 2 1 2 2 1 2 2 0 2 2 2 0 44
BlackRock Inc. 62.9 4 4 4 3 0 0 4 2 0 6 N 1 2 2 1 1 2 2 0 2 0 0 2 2 44
Clorox Co. 62.9 4 4 4 0 6 0 4 2 4 6 N 2 2 0 2 0 0 0 0 0 0 2 2 0 44
FedEx Corp. 62.9 4 0 0 0 6 0 4 2 0 6 N 2 2 2 2 2 2 2 2 0 2 0 2 2 44
Home Depot Inc. 62.9 4 4 0 3 0 0 4 1 0 6 N 2 2 1 2 2 2 2 2 1 2 2 2 0 44
McCormick & Company Inc. 62.9 4 4 0 3 0 0 2 2 2 6 N 2 2 1 2 2 2 2 2 0 2 2 2 0 44
Netapp Inc. 62.9 4 4 4 0 0 0 4 2 2 6 N 2 2 2 2 2 0 2 0 0 2 0 2 2 44
Southwestern Energy Co. 62.9 4 4 0 6 0 0 4 2 4 6 N 1 1 2 2 2 0 0 0 0 0 2 2 2 44
Hershey Co., The 61.4 4 4 2 6 6 1 4 0 4 6 N 0 2 0 0 0 0 0 0 0 0 2 2 0 43
Invesco Ltd. 61.4 4 4 2 0 0 0 4 2 2 6 N 2 2 2 2 2 0 2 0 1 2 0 2 2 43
Kinder Morgan Inc. 61.4 4 4 4 0 0 0 4 2 0 6 N 2 2 2 2 2 0 2 0 1 2 0 2 2 43
Marathon Petroleum Corp. 61.4 4 0 0 3 0 0 4 1 2 6 N 2 2 2 2 2 1 2 2 0 2 2 2 2 43
Medtronic Inc. 61.4 0 0 0 6 3 0 4 2 2 6 N 1 1 1 2 2 1 2 2 0 2 4 2 0 43
Alcoa Inc. 60.0 4 0 4 3 3 0 0 2 0 6 N 0 2 2 2 2 2 2 2 0 2 0 2 2 42
Chevron Corp. 60.0 4 4 0 3 0 0 4 2 0 6 N 1 1 2 2 2 2 2 1 0 2 2 2 0 42
CMS Energy Corp. 60.0 4 0 0 6 0 0 0 2 0 6 N 2 1 1 2 2 2 2 2 2 2 2 2 2 42
Pentair PLC 60.0 4 4 0 3 3 0 4 1 0 6 N 1 2 1 2 2 1 2 2 0 2 0 2 0 42
S&P Global Inc.18 60.0 4 4 0 3 6 0 0 2 4 6 N 1 2 2 2 0 0 0 0 0 0 2 2 2 42
Valero Energy Corp. 60.0 2 2 0 6 3 0 2 2 4 6 N 1 2 1 2 1 1 0 0 0 0 4 2 1 42
Thir
d T
ier
Campbell Soup Co. 58.6 0 4 4 3 6 0 0 2 4 6 N 0 2 2 2 2 0 0 0 0 0 2 2 0 41
Hewlett Packard Enterprise Co. 58.6 4 4 0 0 0 0 4 2 4 6 N 1 2 0 2 2 2 2 0 0 2 2 2 0 41
Kroger Co., The 58.6 4 4 2 3 0 0 4 1 0 6 N 0 2 1 1 2 1 2 2 0 2 2 2 0 41
Marriott International Inc. 58.6 4 4 0 6 0 0 4 1 0 6 N 1 2 2 1 2 0 0 0 0 0 4 2 2 41
Allergan PLC 57.1 4 4 4 3 0 0 4 1 0 6 N 1 2 2 1 2 0 0 0 0 0 4 2 0 40
Chesapeake Energy Corp. 57.1 4 2 0 3 0 0 0 2 4 6 N 2 1 0 2 2 2 2 2 0 2 2 2 0 40
Chipotle Mexican Grill Inc. 57.1 4 4 4 0 0 0 4 2 2 3 N 2 2 2 2 2 0 2 0 1 2 0 2 0 40
Kansas City Southern 57.1 2 2 0 6 6 2 0 2 0 6 P 2 2 0 2 2 2 2 2 0 0 0 0 0 40
Nike Inc. 57.1 2 0 0 0 0 0 2 2 4 6 N 2 2 1 2 2 2 2 2 1 2 2 2 2 40
Twenty-First Century Fox Inc. 57.1 4 4 4 0 0 0 4 2 4 6 N 2 2 2 2 0 0 0 0 0 0 2 2 0 40
Cisco Systems Inc. 55.7 4 0 4 0 0 0 4 2 4 6 N 1 2 2 2 2 0 0 0 0 0 4 2 0 39
18 McGraw Hill Financial, Inc. is still a component of the S&P 500; however, the company has changed its name to S&P Global Inc.

46
Company Name
Score (100%)
1 2 3 4 5 6 7 8 9 10 11 12 13 14 15 16 17 18 19 20 21 22 23 24 Raw Total
Thir
d T
ier
Facebook Inc. 55.7 4 2 0 3 3 0 4 2 4 6 N 2 1 2 2 0 0 0 0 0 0 2 2 0 39
PulteGroup Inc. 55.7 4 0 0 3 0 0 4 2 4 6 N 0 1 0 2 2 1 2 2 0 2 0 2 2 39
Thermo Fisher Scientific Inc. 55.7 4 4 2 6 6 0 4 1 0 6 N 0 2 0 0 0 0 0 0 0 0 2 2 0 39
EQT Corp. 54.3 0 2 0 3 3 0 2 2 4 6 N 1 2 2 2 2 1 2 2 0 0 0 2 0 38
Huntington Bancshares Inc. 54.3 4 4 4 0 0 0 0 2 0 6 P 2 2 0 2 2 2 2 0 0 2 0 2 2 38
Johnson Controls Inc.ƚ 54.3 4 4 4 0 0 0 4 2 2 6 Y 2 2 2 2 0 0 0 0 0 0 2 2 0 38
Oracle Corp. 54.3 4 4 4 0 0 0 4 2 0 6 N 0 1 0 2 2 1 2 0 0 0 2 2 2 38
Southwest Airlines Co. 54.3 0 4 4 3 0 0 4 2 4 3 N 2 2 2 2 2 0 0 0 0 0 2 2 0 38
Alphabet Inc. 52.9 4 0 0 3 3 0 4 2 4 6 N 2 1 2 2 0 0 0 0 0 0 2 2 0 37
ConAgra Foods Inc. 52.9 2 2 4 3 0 0 0 2 0 6 N 2 2 0 2 2 2 2 2 0 2 0 2 0 37
Eastman Chemical Co. 52.9 0 0 2 6 0 0 0 2 0 6 N 1 2 0 2 2 2 2 2 0 2 2 2 2 37
Lincoln National Corp. 52.9 2 2 2 3 3 0 2 2 0 3 N 0 2 0 2 2 2 2 2 0 2 2 2 0 37
Pitney Bowes Inc. 52.9 0 2 2 0 0 0 4 2 0 6 Y 2 2 1 2 2 2 2 2 0 2 0 2 2 37
PNC Financial Services Group Inc. 52.9 4 0 0 3 0 0 0 1 4 6 N 1 2 0 2 2 2 2 2 0 2 2 2 0 37
Adobe Systems Inc. 51.4 4 4 0 3 0 0 0 2 4 6 N 1 2 2 2 0 0 0 0 0 0 2 2 2 36
Deere & Co. 51.4 2 4 4 3 3 0 2 2 0 6 N 2 2 0 2 0 0 0 0 0 0 2 2 0 36
Gap Inc. 51.4 2 4 0 3 0 0 0 2 0 6 N 2 2 2 2 2 1 2 0 0 2 2 2 0 36
Pinnacle West Capital Corp. 51.4 0 2 0 3 0 0 0 2 0 6 N 2 2 1 2 2 2 2 2 0 2 2 2 2 36
Under Armour Inc. 51.4 4 2 4 0 0 0 4 1 2 6 P 1 2 0 0 2 2 1 0 1 2 0 2 0 36
Waste Management Inc. 51.4 4 0 0 6 3 0 0 2 0 6 Y 2 2 2 2 1 0 0 0 0 0 2 2 2 36
Emerson Electric Co. 50.0 4 0 0 0 0 0 4 2 0 6 N 1 1 2 2 2 2 2 0 1 2 2 2 0 35
Occidental Petroleum Corp. 50.0 4 4 0 3 0 0 4 1 4 6 N 1 1 0 1 2 0 0 0 0 0 2 2 0 35
Ryder System Inc. 50.0 4 0 0 3 0 0 0 2 0 6 N 2 1 1 2 2 2 2 0 0 2 2 2 2 35
Xcel Energy Inc. 50.0 2 2 0 0 0 0 2 2 0 6 N 1 2 2 2 2 2 2 2 0 2 2 2 0 35
American International Group Inc. 48.6 4 4 4 0 0 0 4 1 0 3 N 1 1 0 2 2 2 2 0 0 2 0 2 0 34
Eaton Corp. PLC 48.6 4 0 2 0 0 0 4 1 0 6 N 0 2 0 2 2 1 2 2 0 2 2 2 0 34
Priceline.com Inc. 48.6 0 4 4 0 0 0 0 2 0 6 N 1 2 0 2 2 2 2 2 1 2 0 2 0 34
St. Jude Medical Inc. 48.6 2 2 2 3 3 0 2 2 0 6 N 2 2 2 2 0 0 0 0 0 0 2 2 0 34
Colgate-Palmolive Co. 47.1 4 0 4 6 0 2 0 1 2 6 Y 0 1 0 1 0 0 0 2 0 0 2 2 0 33
Exxon Mobil Corp. 47.1 4 4 0 0 0 0 0 2 4 6 N 0 2 2 2 2 0 0 0 0 0 2 2 1 33
Duke Energy Corp. 45.7 0 0 0 3 0 0 0 2 0 6 N 2 1 2 2 2 2 2 2 0 2 0 2 2 32
General Dynamics Corp. 45.7 0 4 0 3 6 0 0 2 0 6 N 1 2 2 2 2 0 0 0 0 0 0 2 0 32
News Corp. 45.7 2 2 2 0 0 0 2 2 4 6 P 2 2 1 2 0 1 0 0 0 0 2 2 0 32
Teco Energy Inc. 45.7 0 2 0 0 0 0 0 2 0 6 N 2 2 2 2 2 2 2 2 0 2 0 2 2 32
ADT Corp. 44.3 0 0 4 0 0 0 0 2 0 6 P 2 2 1 2 2 2 2 0 1 2 0 2 1 31
Interpublic Group of Companies Inc. 44.3 4 0 4 3 0 0 4 1 0 3 N 0 2 0 2 2 2 1 0 1 2 0 0 0 31
Wynn Resorts Ltd. 44.3 0 0 0 3 0 0 0 2 0 6 N 1 2 1 2 2 2 2 2 0 2 0 2 2 31
AGL Resources Inc. 42.9 0 0 0 3 0 0 0 2 0 6 N 2 1 1 2 2 2 2 2 0 2 0 2 1 30
Ameriprise Financial Inc. 42.9 4 0 2 0 0 0 0 2 0 6 N 1 1 0 2 2 2 2 0 0 2 2 2 0 30
Equity Residential 42.9 0 0 0 3 0 0 0 2 0 6 N 2 2 0 2 2 1 2 2 0 2 0 2 2 30
Fluor Corp. 42.9 0 0 2 3 0 0 0 2 0 6 N 2 2 1 2 2 2 2 0 0 2 0 2 0 30

47
Company Name
Score (100%)
1 2 3 4 5 6 7 8 9 10 11 12 13 14 15 16 17 18 19 20 21 22 23 24 Raw Total
DTE Energy Co. 41.4 0 0 0 3 0 0 0 2 0 6 Y 1 1 2 2 2 2 2 2 0 2 0 2 0 29
L Brands Inc. 41.4 2 2 0 6 0 0 2 2 0 6 N 1 1 1 2 0 0 0 0 0 0 2 2 0 29
Tractor Supply Co. 41.4 4 4 2 0 3 0 0 1 0 6 N 1 2 0 2 0 0 0 0 0 0 0 2 2 29
Allstate Corp. 40.0 0 0 0 3 3 0 0 2 0 6 N 2 2 2 2 2 0 0 0 0 0 0 2 2 28
Boston Properties Inc. 40.0 0 0 0 3 0 0 0 2 0 6 N 2 2 0 2 2 1 2 0 0 2 0 2 2 28
McKesson Corp. 40.0 0 2 4 3 0 0 0 2 0 6 N 1 2 2 2 2 0 0 0 0 0 0 2 0 28
Republic Services Inc. 40.0 0 0 0 3 0 0 0 1 0 6 P 2 1 2 2 2 1 2 2 0 2 0 2 0 28
Fou
rth
Tie
r
Bo
tto
m T
ier
AvalonBay Communities Inc. 38.6 0 0 0 0 0 0 0 2 0 6 N 2 2 1 2 2 2 2 0 0 2 0 2 2 27
Eversource Energy 38.6 2 0 2 0 0 0 0 2 0 6 N 2 1 0 2 2 0 2 2 0 2 0 2 0 27
Halliburton Co. 38.6 4 4 0 0 0 0 4 2 0 6 N 1 1 1 2 2 0 0 0 0 0 0 0 0 27
NiSource Inc. 38.6 0 0 2 3 0 0 0 2 0 6 P 1 2 0 2 2 1 2 0 0 2 0 2 0 27
NRG Energy Inc. 38.6 0 0 0 0 0 0 0 2 0 6 N 2 1 2 2 2 2 2 0 0 2 0 2 2 27
Progressive Corp. 38.6 0 0 0 0 0 0 0 1 0 6 N 2 2 1 1 2 2 2 2 0 2 0 2 2 27
Wyndham Worldwide Corp. 38.6 0 0 0 0 0 0 0 2 0 6 N 1 2 1 2 2 2 2 2 0 2 0 2 1 27
AutoZone Inc. 37.1 0 0 0 0 0 0 0 2 0 6 P 2 2 2 2 2 1 2 0 0 2 0 2 1 26
DaVita HealthCare Partners Inc. 37.1 0 0 0 3 0 0 0 1 0 6 N 1 1 0 1 2 2 2 1 2 2 0 2 0 26
Harley-Davidson Inc. 37.1 4 0 0 6 0 0 0 1 0 6 N 1 1 0 1 2 0 0 0 0 0 2 2 0 26
Rockwell Collins Inc. 37.1 2 4 4 3 0 0 0 2 0 3 N 2 2 0 2 0 0 0 0 0 0 0 2 0 26
SunTrust Banks Inc. 37.1 4 4 4 0 3 0 0 0 0 6 Y 1 2 0 0 0 0 0 0 0 0 0 2 0 26
Universal Health Services Inc. 37.1 0 0 0 0 0 0 0 2 0 6 N 2 2 0 2 2 2 2 2 0 2 0 2 0 26
Ventas Inc. 37.1 0 0 0 0 0 0 0 2 0 6 N 1 2 0 2 2 2 2 2 1 2 0 2 0 26
Waters Corp. 37.1 4 4 4 0 0 0 4 0 0 3 N 0 1 0 1 1 0 2 0 1 1 0 0 0 26
FMC Corp. 35.7 4 0 0 3 3 0 0 2 0 3 N 0 2 0 2 0 0 0 0 0 0 4 2 0 25
Range Resources Corp. 35.7 0 0 0 0 0 0 0 2 0 6 N 2 2 1 2 2 2 2 0 0 0 0 2 2 25
Motorola Solutions Inc. 34.3 0 0 0 3 0 0 0 2 0 6 N 2 1 2 2 2 0 0 0 0 0 0 2 2 24
PPG Industries Inc. 34.3 0 2 0 3 0 0 4 1 0 6 N 2 2 0 2 0 0 0 0 0 0 0 2 0 24
WEC Energy Group Inc. 34.3 0 2 0 3 0 0 0 1 4 3 N 0 1 1 1 1 1 0 0 0 1 2 1 2 24
Delta Air Lines Inc. 32.9 0 0 0 3 0 0 0 2 0 6 N 1 1 0 2 2 0 2 0 0 2 0 2 0 23
Spectra Energy Corp. 32.9 0 0 0 3 0 0 0 2 0 6 N 1 1 2 2 2 0 0 0 0 0 0 2 2 23
Whirlpool Corp. 32.9 0 4 0 3 0 0 0 1 0 6 N 1 2 2 0 0 0 0 0 0 0 2 2 0 23
Carmax Inc. 31.4 0 0 2 0 0 0 0 2 0 6 P 0 2 1 2 2 0 2 0 0 2 0 1 0 22
Comerica Inc. 31.4 4 4 0 3 0 0 0 1 0 6 N 0 1 0 1 0 0 0 0 0 0 0 2 0 22
PayPal Holdings Inc. 31.4 0 2 0 3 0 0 0 2 0 6 N 2 1 2 2 0 0 0 0 0 0 0 2 0 22
Goodyear Tire & Rubber Co. 30.0 0 0 0 0 0 0 0 2 0 6 N 0 1 0 2 2 2 2 0 0 2 0 2 0 21
Walgreen Co. 30.0 0 0 0 0 0 0 0 2 0 3 N 1 1 2 2 2 2 2 0 0 2 0 2 0 21
Endo International PLC 28.6 0 0 0 3 3 0 0 1 4 3 N 0 1 0 2 1 0 0 0 0 0 0 2 0 20
Oneok Inc. 28.6 0 0 0 6 0 0 0 0 0 3 N 1 1 2 0 1 1 1 0 0 2 0 2 0 20
Charles Schwab Corp. 27.1 0 0 0 0 0 0 0 2 0 6 N 0 1 0 2 2 0 2 0 0 2 0 2 0 19
Northern Trust Corp. 27.1 0 0 0 0 0 0 0 0 0 3 N 1 1 2 0 2 2 2 2 0 2 0 2 0 19
Ralph Lauren Corp. 27.1 2 0 0 6 3 2 0 0 0 3 N 0 1 0 0 0 0 0 2 0 0 0 0 0 19

48
Company Name
Score (100%)
1 2 3 4 5 6 7 8 9 10 11 12 13 14 15 16 17 18 19 20 21 22 23 24 Raw Total
Sysco Corp. 27.1 0 0 0 3 0 0 0 2 0 6 P 1 1 2 2 0 0 0 0 0 0 0 2 0 19
Cabot Oil & Gas Corp. 25.7 0 0 0 3 0 0 0 2 0 6 N 0 1 1 2 0 0 0 0 0 0 0 2 1 18
Ford Motor Co. 25.7 4 0 4 0 0 0 0 1 0 3 N 1 1 0 2 0 0 0 0 0 0 0 2 0 18
HCA Holdings Inc. 25.7 0 0 0 3 0 0 0 2 0 6 N 0 1 2 2 0 0 0 0 0 0 0 2 0 18
Mallinckrodt PLC 25.7 0 0 0 0 0 0 0 1 0 6 N 0 1 0 1 2 1 2 0 0 2 0 2 0 18
PerkinElmer Inc. 25.7 4 0 2 0 0 0 4 1 0 3 N 0 1 0 1 0 0 0 0 0 0 0 2 0 18
NextEra Energy Inc. 24.3 0 0 0 0 0 0 0 2 0 6 N 2 1 2 2 0 0 0 0 0 0 0 2 0 17
Stryker Corp. 24.3 4 0 2 0 0 0 0 1 0 3 N 1 1 1 1 1 0 1 0 1 0 0 0 0 17
Xylem Inc. 24.3 2 4 0 0 0 0 2 1 0 3 N 0 1 2 0 0 0 1 0 1 0 0 0 0 17
IntercontinentalExchange Inc. 22.9 4 0 4 3 0 0 0 0 0 3 N 0 1 0 0 0 0 0 0 0 0 0 1 0 16
Delphi Automotive PLC 21.4 4 4 2 0 0 0 0 0 0 3 N 1 1 0 0 0 0 0 0 0 0 0 0 0 15
Newfield Exploration Co. 21.4 0 0 0 0 0 0 0 2 0 6 N 0 1 0 2 2 0 0 0 0 0 0 2 0 15
Royal Caribbean Cruises Ltd. 21.4 0 0 0 0 0 0 0 2 0 6 N 1 2 0 2 0 0 0 0 0 0 0 2 0 15
Wal-Mart Stores Inc. 21.4 0 0 0 0 0 0 0 1 0 3 N 0 0 2 1 2 2 1 0 0 2 0 1 0 15
Assurant Inc. 20.0 0 0 4 0 0 0 0 2 0 3 N 0 1 0 2 0 0 0 0 0 0 0 2 0 14
Foot Locker Inc. 20.0 4 0 0 0 0 0 0 2 0 3 N 0 2 0 2 0 0 0 0 0 0 0 1 0 14
Bo
tto
m T
ier
FirstEnergy Corp. 18.6 0 0 0 0 0 0 0 1 0 6 N 2 1 0 1 0 0 0 0 0 0 0 2 0 13
Laboratory Corp. of America Holdings 18.6 2 0 0 0 6 0 0 2 0 3 N 0 0 0 0 0 0 0 0 0 0 0 0 0 13
XL Group PLC 18.6 0 0 0 0 0 0 0 2 0 3 N 0 0 0 1 0 2 1 0 0 2 0 0 2 13
Agilent Technologies Inc. 17.1 2 0 0 0 3 0 0 1 0 3 N 0 1 0 2 0 0 0 0 0 0 0 0 0 12
Discovery Communications Inc. 17.1 0 0 0 0 0 0 0 2 0 3 N 2 1 0 2 0 0 0 0 0 0 0 2 0 12
United Continental Holdings Inc. 17.1 0 0 0 0 0 0 0 1 0 3 P 0 0 0 0 2 2 1 1 0 2 0 0 0 12
W.W. Grainger Inc. 17.1 0 0 0 0 0 0 0 2 0 3 N 1 0 0 2 0 0 0 0 0 0 0 2 2 12
Carnival Corp. 15.7 0 0 0 3 0 0 0 2 0 3 N 0 1 0 2 0 0 0 0 0 0 0 0 0 11
Prologis Inc. 15.7 0 0 0 3 0 0 0 2 0 3 N 0 1 0 2 0 0 0 0 0 0 0 0 0 11
Stericycle Inc. 15.7 4 0 0 0 0 0 0 0 0 3 N 1 1 1 0 1 0 0 0 0 0 0 0 0 11
TE Connectivity Ltd. 15.7 0 0 0 0 0 0 0 1 0 3 N 1 1 2 1 0 0 0 0 0 0 0 2 0 11
Alliance Data Systems Corp. 14.3 0 0 0 0 0 0 0 2 0 3 N 0 1 0 2 0 0 0 0 0 0 0 2 0 10
Concho Resources Inc. 14.3 2 0 0 0 0 0 0 2 0 3 N 0 1 0 2 0 0 0 0 0 0 0 0 0 10
Dun & Bradstreet Corp. 14.3 0 0 0 0 0 0 0 0 0 3 N 0 0 0 0 2 2 1 0 2 0 0 0 0 10
Leggett & Platt Inc. 14.3 0 0 0 0 0 0 0 0 0 3 N 1 1 1 0 0 0 0 0 0 0 0 2 2 10
Molson Coors Brewing Co. 14.3 0 0 0 0 0 0 0 2 0 3 N 0 1 0 2 0 0 0 0 0 0 0 2 0 10
Newell Brands Inc. 14.3 0 0 0 0 0 0 0 0 0 3 N 0 0 0 0 2 2 1 0 0 2 0 0 0 10
Ulta Salon, Cosmetics & Fragrance Inc. 14.3 0 0 0 0 0 0 0 2 0 3 N 0 0 0 2 2 0 0 0 1 0 0 0 0 10
Western Union Co. 14.3 0 0 0 0 0 0 0 2 0 3 N 0 0 0 2 1 1 0 0 0 1 0 0 0 10
Alexion Pharmaceuticals Inc. 12.9 0 0 0 0 0 0 0 2 0 3 N 0 0 0 2 0 0 0 0 0 0 0 2 0 9
Flowserve Corp. 12.9 4 0 0 0 0 0 0 0 0 3 Y 0 1 0 0 0 0 0 0 0 0 0 1 0 9
Hormel Foods Corp. 12.9 2 0 0 0 0 0 0 2 0 3 N 0 0 0 2 0 0 0 0 0 0 0 0 0 9
Macy's Inc. 12.9 0 0 0 0 0 0 0 2 0 3 N 0 0 0 2 0 0 0 0 0 0 0 0 2 9
Mohawk Industries Inc. 12.9 2 0 0 0 0 0 0 0 0 3 N 0 1 0 2 0 0 0 0 0 1 0 0 0 9

49
Company Name
Score (100%)
1 2 3 4 5 6 7 8 9 10 11 12 13 14 15 16 17 18 19 20 21 22 23 24 Raw Total
Bo
tto
m T
ier
Perrigo Company PLC 12.9 4 0 0 0 0 0 0 0 0 3 P 0 0 0 0 0 0 0 0 0 0 0 2 0 9
Autodesk Inc. 11.4 0 0 0 0 0 0 0 2 0 3 N 0 1 0 2 0 0 0 0 0 0 0 0 0 8
Autonation Inc. 11.4 0 0 0 0 0 0 0 2 0 3 N 0 1 0 2 0 0 0 0 0 0 0 0 0 8
Baker Hughes Inc. 11.4 4 0 0 0 0 0 0 0 0 3 N 0 1 0 0 0 0 0 0 0 0 0 0 0 8
CBS Corp. 11.4 0 0 0 0 0 0 0 2 0 3 N 0 1 0 2 0 0 0 0 0 0 0 0 0 8
Chubb Ltd. 11.4 0 0 0 0 0 0 0 1 0 3 N 0 1 0 1 0 0 0 0 0 0 0 2 0 8
Cimarex Energy Company 11.4 0 0 0 0 0 0 0 2 0 3 N 0 1 0 2 0 0 0 0 0 0 0 0 0 8
Cognizant Technology Solutions Corp. 11.4 0 0 0 0 0 0 0 2 0 3 N 0 1 0 2 0 0 0 0 0 0 0 0 0 8
Crown Castle International Corp. 11.4 0 0 0 0 0 0 0 2 0 3 N 0 1 0 2 0 0 0 0 0 0 0 0 0 8
General Growth Properties Inc. 11.4 0 0 0 0 0 0 0 2 0 3 N 0 1 0 2 0 0 0 0 0 0 0 0 0 8
Host Hotels & Resorts Inc. 11.4 0 0 0 0 0 0 0 2 0 3 N 0 1 0 2 0 0 0 0 0 0 0 0 0 8
J.M. Smucker Co. 11.4 4 0 0 0 0 0 0 0 0 3 N 0 1 0 0 0 0 0 0 0 0 0 0 0 8
Kimberly-Clark Corp. 11.4 2 0 2 0 0 0 0 0 0 3 N 0 1 0 0 0 0 0 0 0 0 0 0 0 8
Microchip Technology Inc. 11.4 0 0 0 0 0 0 0 2 0 3 N 0 1 0 2 0 0 0 0 0 0 0 0 0 8
Qorvo Inc. 11.4 0 0 0 0 0 0 0 2 0 3 N 0 1 0 2 0 0 0 0 0 0 0 0 0 8
Quest Diagnostics Inc. 11.4 2 0 0 0 0 0 0 0 0 3 N 0 1 0 0 0 0 0 0 0 0 0 2 0 8
Snap-On Inc. 11.4 4 0 0 0 0 0 0 0 0 3 N 0 1 0 0 0 0 0 0 0 0 0 0 0 8
Owens-Illinois Inc. 11.4 0 0 0 3 0 0 0 1 0 3 N 0 0 0 1 0 0 0 0 0 0 0 0 0 8
Akamai Technologies Inc. 10.0 0 0 0 0 0 0 0 2 0 3 N 0 0 0 2 0 0 0 0 0 0 0 0 0 7
Allegion PLC 10.0 0 0 0 0 0 0 0 2 0 3 N 0 0 0 2 0 0 0 0 0 0 0 0 0 7
Bed, Bath & Beyond Inc. 10.0 0 0 0 0 0 0 0 0 0 3 N 0 0 0 0 2 0 0 0 2 0 0 0 0 7
Brown-Forman Corp. 10.0 0 0 0 0 0 0 0 2 0 3 N 0 0 0 2 0 0 0 0 0 0 0 0 0 7
C.H. Robinson Worldwide Inc. 10.0 0 0 0 0 0 0 0 2 0 3 N 0 0 0 2 0 0 0 0 0 0 0 0 0 7
CenterPoint Energy Inc. 10.0 0 0 0 0 0 0 0 2 0 3 N 0 0 0 2 0 0 0 0 0 0 0 0 0 7
CME Group Inc. 10.0 0 0 0 0 0 0 0 2 0 3 N 0 0 0 2 0 0 0 0 0 0 0 0 0 7
D.R. Horton Inc. 10.0 0 0 0 0 0 0 0 2 0 3 N 0 0 0 2 0 0 0 0 0 0 0 0 0 7
Devon Energy Corp. 10.0 0 0 0 0 0 0 0 2 0 3 N 0 0 0 2 0 0 0 0 0 0 0 0 0 7
FLIR Systems Inc. 10.0 0 0 0 0 0 0 0 2 0 3 N 0 0 0 2 0 0 0 0 0 0 0 0 0 7
Frontier Communications Corp. 10.0 0 0 0 0 0 0 0 2 0 3 N 0 0 0 2 0 0 0 0 0 0 0 0 0 7
HCP Inc. 10.0 0 0 0 0 0 0 0 0 0 3 N 0 1 0 0 2 0 0 0 1 0 0 0 0 7
International Flavors & Fragrances Inc. 10.0 0 0 0 0 0 0 0 2 0 3 N 0 0 0 2 0 0 0 0 0 0 0 0 0 7
Kohls Corp 10.0 0 0 0 0 0 0 0 2 0 3 N 0 0 0 2 0 0 0 0 0 0 0 0 0 7
Lennar Corp. 10.0 0 0 0 0 0 0 0 2 0 3 N 0 0 0 2 0 0 0 0 0 0 0 0 0 7
Marsh & McLennan Companies Inc. 10.0 0 0 0 0 0 0 0 2 0 3 N 0 0 0 2 0 0 0 0 0 0 0 0 0 7
Martin Marietta Materials Inc. 10.0 0 0 0 0 0 0 0 1 0 3 Y 0 0 0 1 0 0 0 0 0 0 0 2 0 7
O'Reilly Automotive Inc. 10.0 0 0 0 0 0 0 0 2 0 3 N 0 0 0 2 0 0 0 0 0 0 0 0 0 7
Quanta Services Inc. 10.0 4 0 0 0 0 0 0 0 0 3 P 0 0 0 0 0 0 0 0 0 0 0 0 0 7
Roper Technologies Inc. 10.0 0 0 0 0 0 0 0 2 0 3 N 0 0 0 2 0 0 0 0 0 0 0 0 0 7
Signet Jewelers Ltd. 10.0 0 0 0 0 0 0 0 2 0 3 N 0 0 0 2 0 0 0 0 0 0 0 0 0 7
Stanley Black & Decker Inc. 10.0 0 0 0 0 0 0 0 2 0 3 N 0 0 0 2 0 0 0 0 0 0 0 0 0 7
Total System Services Inc. 10.0 0 0 0 0 0 0 0 2 0 3 N 0 0 0 2 0 0 0 0 0 0 0 0 0 7
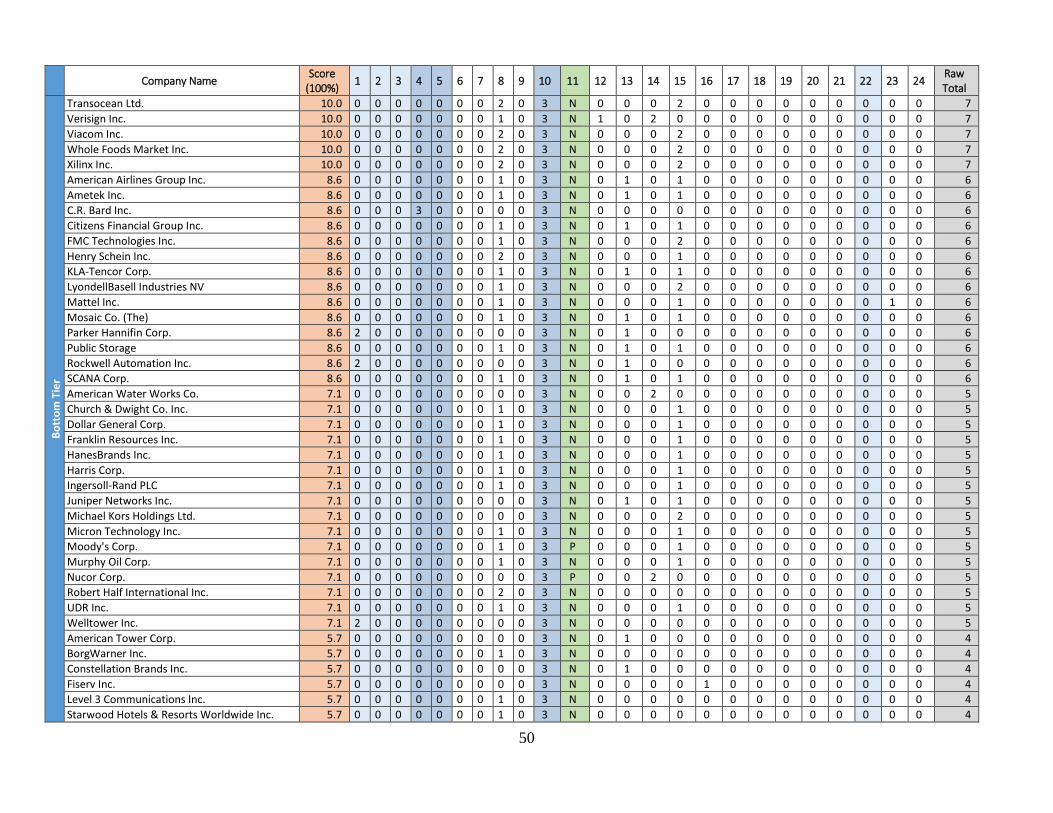
50
Company Name
Score (100%)
1 2 3 4 5 6 7 8 9 10 11 12 13 14 15 16 17 18 19 20 21 22 23 24 Raw Total
Bo
tto
m T
ier
Transocean Ltd. 10.0 0 0 0 0 0 0 0 2 0 3 N 0 0 0 2 0 0 0 0 0 0 0 0 0 7
Verisign Inc. 10.0 0 0 0 0 0 0 0 1 0 3 N 1 0 2 0 0 0 0 0 0 0 0 0 0 7
Viacom Inc. 10.0 0 0 0 0 0 0 0 2 0 3 N 0 0 0 2 0 0 0 0 0 0 0 0 0 7
Whole Foods Market Inc. 10.0 0 0 0 0 0 0 0 2 0 3 N 0 0 0 2 0 0 0 0 0 0 0 0 0 7
Xilinx Inc. 10.0 0 0 0 0 0 0 0 2 0 3 N 0 0 0 2 0 0 0 0 0 0 0 0 0 7
American Airlines Group Inc. 8.6 0 0 0 0 0 0 0 1 0 3 N 0 1 0 1 0 0 0 0 0 0 0 0 0 6
Ametek Inc. 8.6 0 0 0 0 0 0 0 1 0 3 N 0 1 0 1 0 0 0 0 0 0 0 0 0 6
C.R. Bard Inc. 8.6 0 0 0 3 0 0 0 0 0 3 N 0 0 0 0 0 0 0 0 0 0 0 0 0 6
Citizens Financial Group Inc. 8.6 0 0 0 0 0 0 0 1 0 3 N 0 1 0 1 0 0 0 0 0 0 0 0 0 6
FMC Technologies Inc. 8.6 0 0 0 0 0 0 0 1 0 3 N 0 0 0 2 0 0 0 0 0 0 0 0 0 6
Henry Schein Inc. 8.6 0 0 0 0 0 0 0 2 0 3 N 0 0 0 1 0 0 0 0 0 0 0 0 0 6
KLA-Tencor Corp. 8.6 0 0 0 0 0 0 0 1 0 3 N 0 1 0 1 0 0 0 0 0 0 0 0 0 6
LyondellBasell Industries NV 8.6 0 0 0 0 0 0 0 1 0 3 N 0 0 0 2 0 0 0 0 0 0 0 0 0 6
Mattel Inc. 8.6 0 0 0 0 0 0 0 1 0 3 N 0 0 0 1 0 0 0 0 0 0 0 1 0 6
Mosaic Co. (The) 8.6 0 0 0 0 0 0 0 1 0 3 N 0 1 0 1 0 0 0 0 0 0 0 0 0 6
Parker Hannifin Corp. 8.6 2 0 0 0 0 0 0 0 0 3 N 0 1 0 0 0 0 0 0 0 0 0 0 0 6
Public Storage 8.6 0 0 0 0 0 0 0 1 0 3 N 0 1 0 1 0 0 0 0 0 0 0 0 0 6
Rockwell Automation Inc. 8.6 2 0 0 0 0 0 0 0 0 3 N 0 1 0 0 0 0 0 0 0 0 0 0 0 6
SCANA Corp. 8.6 0 0 0 0 0 0 0 1 0 3 N 0 1 0 1 0 0 0 0 0 0 0 0 0 6
American Water Works Co. 7.1 0 0 0 0 0 0 0 0 0 3 N 0 0 2 0 0 0 0 0 0 0 0 0 0 5
Church & Dwight Co. Inc. 7.1 0 0 0 0 0 0 0 1 0 3 N 0 0 0 1 0 0 0 0 0 0 0 0 0 5
Dollar General Corp. 7.1 0 0 0 0 0 0 0 1 0 3 N 0 0 0 1 0 0 0 0 0 0 0 0 0 5
Franklin Resources Inc. 7.1 0 0 0 0 0 0 0 1 0 3 N 0 0 0 1 0 0 0 0 0 0 0 0 0 5
HanesBrands Inc. 7.1 0 0 0 0 0 0 0 1 0 3 N 0 0 0 1 0 0 0 0 0 0 0 0 0 5
Harris Corp. 7.1 0 0 0 0 0 0 0 1 0 3 N 0 0 0 1 0 0 0 0 0 0 0 0 0 5
Ingersoll-Rand PLC 7.1 0 0 0 0 0 0 0 1 0 3 N 0 0 0 1 0 0 0 0 0 0 0 0 0 5
Juniper Networks Inc. 7.1 0 0 0 0 0 0 0 0 0 3 N 0 1 0 1 0 0 0 0 0 0 0 0 0 5
Michael Kors Holdings Ltd. 7.1 0 0 0 0 0 0 0 0 0 3 N 0 0 0 2 0 0 0 0 0 0 0 0 0 5
Micron Technology Inc. 7.1 0 0 0 0 0 0 0 1 0 3 N 0 0 0 1 0 0 0 0 0 0 0 0 0 5
Moody's Corp. 7.1 0 0 0 0 0 0 0 1 0 3 P 0 0 0 1 0 0 0 0 0 0 0 0 0 5
Murphy Oil Corp. 7.1 0 0 0 0 0 0 0 1 0 3 N 0 0 0 1 0 0 0 0 0 0 0 0 0 5
Nucor Corp. 7.1 0 0 0 0 0 0 0 0 0 3 P 0 0 2 0 0 0 0 0 0 0 0 0 0 5
Robert Half International Inc. 7.1 0 0 0 0 0 0 0 2 0 3 N 0 0 0 0 0 0 0 0 0 0 0 0 0 5
UDR Inc. 7.1 0 0 0 0 0 0 0 1 0 3 N 0 0 0 1 0 0 0 0 0 0 0 0 0 5
Welltower Inc. 7.1 2 0 0 0 0 0 0 0 0 3 N 0 0 0 0 0 0 0 0 0 0 0 0 0 5
American Tower Corp. 5.7 0 0 0 0 0 0 0 0 0 3 N 0 1 0 0 0 0 0 0 0 0 0 0 0 4
BorgWarner Inc. 5.7 0 0 0 0 0 0 0 1 0 3 N 0 0 0 0 0 0 0 0 0 0 0 0 0 4
Constellation Brands Inc. 5.7 0 0 0 0 0 0 0 0 0 3 N 0 1 0 0 0 0 0 0 0 0 0 0 0 4
Fiserv Inc. 5.7 0 0 0 0 0 0 0 0 0 3 N 0 0 0 0 1 0 0 0 0 0 0 0 0 4
Level 3 Communications Inc. 5.7 0 0 0 0 0 0 0 1 0 3 N 0 0 0 0 0 0 0 0 0 0 0 0 0 4
Starwood Hotels & Resorts Worldwide Inc. 5.7 0 0 0 0 0 0 0 1 0 3 N 0 0 0 0 0 0 0 0 0 0 0 0 0 4

51
Company Name
Score (100%)
1 2 3 4 5 6 7 8 9 10 11 12 13 14 15 16 17 18 19 20 21 22 23 24 Raw Total
Bo
tto
m T
ier
Textron Inc. 5.7 0 0 0 0 0 0 0 1 0 3 N 0 0 0 0 0 0 0 0 0 0 0 0 0 4
Torchmark Corp. 5.7 0 0 0 0 0 0 0 1 0 3 N 0 0 0 0 0 0 0 0 0 0 0 0 0 4
Tyco International PLC 5.7 0 0 0 0 0 0 0 1 0 3 N 0 0 0 0 0 0 0 0 0 0 0 0 0 4
Varian Medical Systems Inc. 5.7 0 0 0 0 0 0 0 1 0 3 N 0 0 0 0 0 0 0 0 0 0 0 0 0 4
Vertex Pharmaceuticals Inc. 5.7 0 0 0 0 0 0 0 1 0 3 N 0 0 0 0 0 0 0 0 0 0 0 0 0 4
WestRock Co. 5.7 0 0 0 0 0 0 0 1 0 3 N 0 0 0 0 0 0 0 0 0 0 0 0 0 4
Activision Blizzard Inc. 4.3 0 0 0 0 0 0 0 0 0 3 P 0 0 0 0 0 0 0 0 0 0 0 0 0 3
Apartment Investment and Management Co. 4.3 0 0 0 0 0 0 0 0 0 3 P 0 0 0 0 0 0 0 0 0 0 0 0 0 3
Ball Corp. 4.3 0 0 0 0 0 0 0 0 0 3 P 0 0 0 0 0 0 0 0 0 0 0 0 0 3
CA Inc. 4.3 0 0 0 0 0 0 0 0 0 3 Y 0 0 0 0 0 0 0 0 0 0 0 0 0 3
CBRE Group Inc. 4.3 0 0 0 0 0 0 0 0 0 0 N 0 0 1 0 0 0 0 0 0 0 0 2 0 3
Centene Corp. 4.3 0 0 0 0 0 0 0 0 0 3 P 0 0 0 0 0 0 0 0 0 0 0 0 0 3
CSRA Inc. 4.3 0 0 0 0 0 0 0 0 0 3 P 0 0 0 0 0 0 0 0 0 0 0 0 0 3
Dollar Tree Inc. 4.3 0 0 0 0 0 0 0 0 0 3 N 0 0 0 0 0 0 0 0 0 0 0 0 0 3
Dover Corp. 4.3 0 0 0 0 0 0 0 0 0 3 N 0 0 0 0 0 0 0 0 0 0 0 0 0 3
Equifax Inc. 4.3 0 0 0 0 0 0 0 0 0 3 N 0 0 0 0 0 0 0 0 0 0 0 0 0 3
Equinix Inc. 4.3 0 0 0 0 0 0 0 0 0 3 N 0 0 0 0 0 0 0 0 0 0 0 0 0 3
Fidelity National Information Services Inc. 4.3 0 0 0 0 0 0 0 0 0 3 Y 0 0 0 0 0 0 0 0 0 0 0 0 0 3
GameStop Corp. 4.3 0 0 0 0 0 0 0 0 0 3 N 0 0 0 0 0 0 0 0 0 0 0 0 0 3
Genuine Parts Co. 4.3 0 0 0 0 0 0 0 0 0 3 P 0 0 0 0 0 0 0 0 0 0 0 0 0 3
Harman International Industries Inc. 4.3 0 0 0 0 0 0 0 0 0 3 N 0 0 0 0 0 0 0 0 0 0 0 0 0 3
Hasbro Inc. 4.3 0 0 0 0 0 0 0 0 0 3 N 0 0 0 0 0 0 0 0 0 0 0 0 0 3
J.B. Hunt Transport Services Inc. 4.3 0 0 0 0 0 0 0 0 0 3 N 0 0 0 0 0 0 0 0 0 0 0 0 0 3
Jacobs Engineering Group Inc. 4.3 0 0 0 3 0 0 0 0 0 0 N 0 0 0 0 0 0 0 0 0 0 0 0 0 3
Leucadia National Corp. 4.3 0 0 0 0 0 0 0 0 0 3 P 0 0 0 0 0 0 0 0 0 0 0 0 0 3
Mead Johnson Nutrition Co. 4.3 0 0 0 0 0 0 0 0 0 3 N 0 0 0 0 0 0 0 0 0 0 0 0 0 3
Nvidia Corp. 4.3 0 0 0 0 0 0 0 0 0 3 N 0 0 0 0 0 0 0 0 0 0 0 0 0 3
Regeneron Pharmaceuticals Inc. 4.3 0 0 0 0 0 0 0 0 0 3 N 0 0 0 0 0 0 0 0 0 0 0 0 0 3
Scripps Networks Interactive Inc. 4.3 0 0 0 0 0 0 0 0 0 3 N 0 0 0 0 0 0 0 0 0 0 0 0 0 3
Simon Property Group Inc. 4.3 0 0 0 0 0 0 0 0 0 3 N 0 0 0 0 0 0 0 0 0 0 0 0 0 3
Skyworks Solutions Inc. 4.3 0 0 0 3 0 0 0 0 0 0 N 0 0 0 0 0 0 0 0 0 0 0 0 0 3
Tegna Inc. 4.3 0 0 0 0 0 0 0 0 0 3 N 0 0 0 0 0 0 0 0 0 0 0 0 0 3
Tyson Foods Inc. 4.3 0 0 0 0 0 0 0 0 0 3 N 0 0 0 0 0 0 0 0 0 0 0 0 0 3
Verisk Analytics Inc. 4.3 0 0 0 0 0 0 0 0 0 3 N 0 0 0 0 0 0 0 0 0 0 0 0 0 3
VF Corp. 4.3 0 0 0 0 0 0 0 0 0 3 N 0 0 0 0 0 0 0 0 0 0 0 0 0 3
Willis Towers Watson PLC 4.3 0 0 0 0 0 0 0 0 0 3 N 0 0 0 0 0 0 0 0 0 0 0 0 0 3
Helmerich and Payne Inc. 2.9 0 0 0 0 0 0 0 2 0 0 N 0 0 0 0 0 0 0 0 0 0 0 0 0 2
Nasdaq Inc. 2.9 0 0 0 0 0 0 0 0 0 0 N 0 0 0 2 0 0 0 0 0 0 0 0 0 2
Garmin Ltd. 1.4 0 0 0 0 0 0 0 0 0 0 N 0 0 1 0 0 0 0 0 0 0 0 0 0 1
Advance Auto Parts Inc. 0.0 0 0 0 0 0 0 0 0 0 0 N 0 0 0 0 0 0 0 0 0 0 0 0 0 0
Affiliated Managers Group Inc. 0.0 0 0 0 0 0 0 0 0 0 0 P 0 0 0 0 0 0 0 0 0 0 0 0 0 0

52
Company Name
Score (100%)
1 2 3 4 5 6 7 8 9 10 11 12 13 14 15 16 17 18 19 20 21 22 23 24 Raw Total
Bo
tto
m T
ier
Airgas Inc. 0.0 0 0 0 0 0 0 0 0 0 0 N 0 0 0 0 0 0 0 0 0 0 0 0 0 0
Amphenol Corp. 0.0 0 0 0 0 0 0 0 0 0 0 N 0 0 0 0 0 0 0 0 0 0 0 0 0 0
Analog Devices Inc. 0.0 0 0 0 0 0 0 0 0 0 0 N 0 0 0 0 0 0 0 0 0 0 0 0 0 0
Avery Dennison Corp. 0.0 0 0 0 0 0 0 0 0 0 0 N 0 0 0 0 0 0 0 0 0 0 0 0 0 0
Berkshire Hathaway Inc. 0.0 0 0 0 0 0 0 0 0 0 0 N 0 0 0 0 0 0 0 0 0 0 0 0 0 0
Broadcom Ltd.19 0.0 0 0 0 0 0 0 0 0 0 0 N 0 0 0 0 0 0 0 0 0 0 0 0 0 0
Cincinnati Financial Corp. 0.0 0 0 0 0 0 0 0 0 0 0 N 0 0 0 0 0 0 0 0 0 0 0 0 0 0
Cintas Corp. 0.0 0 0 0 0 0 0 0 0 0 0 N 0 0 0 0 0 0 0 0 0 0 0 0 0 0
Citrix Systems Inc. 0.0 0 0 0 0 0 0 0 0 0 0 N 0 0 0 0 0 0 0 0 0 0 0 0 0 0
Diamond Offshore Drilling Inc. 0.0 0 0 0 0 0 0 0 0 0 0 N 0 0 0 0 0 0 0 0 0 0 0 0 0 0
Essex Property Trust Inc. 0.0 0 0 0 0 0 0 0 0 0 0 N 0 0 0 0 0 0 0 0 0 0 0 0 0 0
E-Trade Financial Corp. 0.0 0 0 0 0 0 0 0 0 0 0 N 0 0 0 0 0 0 0 0 0 0 0 0 0 0
Expedia Inc. 0.0 0 0 0 0 0 0 0 0 0 0 N 0 0 0 0 0 0 0 0 0 0 0 0 0 0
Expeditors International of Washington Inc. 0.0 0 0 0 0 0 0 0 0 0 0 N 0 0 0 0 0 0 0 0 0 0 0 0 0 0
Extra Space Storage Inc. 0.0 0 0 0 0 0 0 0 0 0 0 N 0 0 0 0 0 0 0 0 0 0 0 0 0 0
F5 Networks Inc. 0.0 0 0 0 0 0 0 0 0 0 0 N 0 0 0 0 0 0 0 0 0 0 0 0 0 0
Fastenal Co. 0.0 0 0 0 0 0 0 0 0 0 0 N 0 0 0 0 0 0 0 0 0 0 0 0 0 0
Federal Realty Investment Trust 0.0 0 0 0 0 0 0 0 0 0 0 Y 0 0 0 0 0 0 0 0 0 0 0 0 0 0
Hologic Inc. 0.0 0 0 0 0 0 0 0 0 0 0 N 0 0 0 0 0 0 0 0 0 0 0 0 0 0 Illumina Inc. 0.0 0 0 0 0 0 0 0 0 0 0 N 0 0 0 0 0 0 0 0 0 0 0 0 0 0
Kimco Realty Corp. 0.0 0 0 0 0 0 0 0 0 0 0 N 0 0 0 0 0 0 0 0 0 0 0 0 0 0
Lam Research Corp. 0.0 0 0 0 0 0 0 0 0 0 0 N 0 0 0 0 0 0 0 0 0 0 0 0 0 0
Legg Mason Inc. 0.0 0 0 0 0 0 0 0 0 0 0 N 0 0 0 0 0 0 0 0 0 0 0 0 0 0
Linear Technology Corp. 0.0 0 0 0 0 0 0 0 0 0 0 N 0 0 0 0 0 0 0 0 0 0 0 0 0 0
Loews Corp. 0.0 0 0 0 0 0 0 0 0 0 0 N 0 0 0 0 0 0 0 0 0 0 0 0 0 0
M & T Bank Corp. 0.0 0 0 0 0 0 0 0 0 0 0 N 0 0 0 0 0 0 0 0 0 0 0 0 0 0
Macerich Co. 0.0 0 0 0 0 0 0 0 0 0 0 N 0 0 0 0 0 0 0 0 0 0 0 0 0 0
Monster Beverage Corp. 0.0 0 0 0 0 0 0 0 0 0 0 N 0 0 0 0 0 0 0 0 0 0 0 0 0 0
Netflix Inc. 0.0 0 0 0 0 0 0 0 0 0 0 N 0 0 0 0 0 0 0 0 0 0 0 0 0 0
Omnicom Group Inc. 0.0 0 0 0 0 0 0 0 0 0 0 N 0 0 0 0 0 0 0 0 0 0 0 0 0 0
PACCAR Inc. 0.0 0 0 0 0 0 0 0 0 0 0 N 0 0 0 0 0 0 0 0 0 0 0 0 0 0
Patterson Companies Inc. 0.0 0 0 0 0 0 0 0 0 0 0 N 0 0 0 0 0 0 0 0 0 0 0 0 0 0
Paychex Inc. 0.0 0 0 0 0 0 0 0 0 0 0 N 0 0 0 0 0 0 0 0 0 0 0 0 0 0
People's United Financial Inc. 0.0 0 0 0 0 0 0 0 0 0 0 N 0 0 0 0 0 0 0 0 0 0 0 0 0 0
PVH Corp. 0.0 0 0 0 0 0 0 0 0 0 0 N 0 0 0 0 0 0 0 0 0 0 0 0 0 0
Realty Income Corp. 0.0 0 0 0 0 0 0 0 0 0 0 N 0 0 0 0 0 0 0 0 0 0 0 0 0 0
Red Hat Inc. 0.0 0 0 0 0 0 0 0 0 0 0 N 0 0 0 0 0 0 0 0 0 0 0 0 0 0
Ross Stores Inc. 0.0 0 0 0 0 0 0 0 0 0 0 N 0 0 0 0 0 0 0 0 0 0 0 0 0 0
Seagate Technology PLC 0.0 0 0 0 0 0 0 0 0 0 0 P 0 0 0 0 0 0 0 0 0 0 0 0 0 0
19 Avago Technologies changed its name to Broadcom Ltd. after acquiring Broadcom Corporation in January 2016.

53
Company Name
Score (100%)
1 2 3 4 5 6 7 8 9 10 11 12 13 14 15 16 17 18 19 20 21 22 23 24 Raw Total
Bo
tto
m T
ier
SL Green Realty Corp. 0.0 0 0 0 0 0 0 0 0 0 0 N 0 0 0 0 0 0 0 0 0 0 0 0 0 0
Synchrony Financial 0.0 0 0 0 0 0 0 0 0 0 0 N 0 0 0 0 0 0 0 0 0 0 0 0 0 0
Tripadvisor Inc. 0.0 0 0 0 0 0 0 0 0 0 0 N 0 0 0 0 0 0 0 0 0 0 0 0 0 0
United Rentals Inc. 0.0 0 0 0 0 0 0 0 0 0 0 N 0 0 0 0 0 0 0 0 0 0 0 0 0 0
Urban Outfitters Inc. 0.0 0 0 0 0 0 0 0 0 0 0 N 0 0 0 0 0 0 0 0 0 0 0 0 0 0
Vornado Realty Trust 0.0 0 0 0 0 0 0 0 0 0 0 Y 0 0 0 0 0 0 0 0 0 0 0 0 0 0
Zions BanCorp. 0.0 0 0 0 0 0 0 0 0 0 0 N 0 0 0 0 0 0 0 0 0 0 0 0 0 0
Zoetis Inc. 0.0 0 0 0 0 0 0 0 0 0 0 N 0 0 0 0 0 0 0 0 0 0 0 0 0 0

54
APPENDIX E: SCORES OF COMPANIES THAT DO NOT SPEND*
Company Name Score
(100%) 1 2 3 4 5 6 7 8 9 10 11 12 13 14 15 16 17 18 19 20 21 22 23 24
Raw Total
Accenture PLC 100.0 4 4 4 6 6 2 4 2 4 6 Y 2 2 2 2 2 2 2 2 2 2 4 2 2 70
Automatic Data Processing Inc. 100.0 4 4 4 6 6 2 4 2 4 6 NA 2 2 2 2 2 2 2 2 2 2 4 2 2 70
Goldman Sachs Group Inc. 100.0 4 4 4 6 6 2 4 2 4 6 Y 2 2 2 2 2 2 2 2 2 2 4 2 2 70
Praxair Inc. 100.0 4 4 4 6 6 2 4 2 4 6 Y 2 2 2 2 2 2 2 2 2 2 4 2 2 70
International Business Machines Corp. 98.6 4 4 4 6 6 2 4 2 4 6 NA 2 2 2 2 2 1 2 2 2 2 4 2 2 69
Nielsen Holdings NV 97.1 4 4 4 6 6 2 4 2 4 6 Y 2 2 2 2 2 0 2 2 2 2 4 2 2 68
Schlumberger Ltd. 97.1 4 4 4 6 6 2 4 2 4 6 NA 2 2 2 2 2 0 2 2 2 2 4 2 2 68
HP Inc. 85.7 4 4 4 6 6 2 4 2 4 6 NA 2 2 2 2 2 0 0 0 0 2 4 2 0 60
*These companies do not make any direct or indirect expenditure to intervene in elections and require their trade associations not to use their payments for such purposes.
Indicators with a maximum score of 2
Indicators with a maximum score of 4
Indicators with a maximum score of 6
Indicators with no point value