TH CONSECUTIVE YEAR - Retail Estates
23
ANNOUNCEMENT OF THE ANNUAL RESULTS OF THE 2020-2021 FINANCIAL YEAR RETAIL ESTATES WITHSTANDS “PERFECT CORONA STORM” OUT-OF-TOWN RETAIL REVIVED AFTER EACH COMPULSORY CLOSURE – LIMITED LOSS OF PROFIT INVESTMENT VALUE OF REAL ESTATE PORTFOLIO STABLE THROUGHOUT THE FINANCIAL YEAR € 111.25 MILLION ADDITIONAL INVESTMENTS IN EXPANSION OF RETAIL PARKS AND BIG BOX UNITS EPRA RESULT (EXCLUSIVE OF PORTFOLIO RESULT) IS € 62.91 MILLION - € 4.97 PER SHARE – DECLINE COMPARED TO LAST FINANCIAL YEAR LIMITED TO € 0.63 PER SHARE DIVIDEND INCREASED TO € 4.50 – INCREASE OF 2.27% DIVIDEND INCREASE FOR THE 16 TH CONSECUTIVE YEAR COMPLETION OF OWN PROJECTS IN JAMBES (NAMUR) AND HOGNOUL (LIEGE). € 28.16 MILLION INVESTMENT CREATES € 6.28 MILLION ADDED VALUE PRESS RELEASE Periodic statement - regulated information Ternat, 25 May 2021
Transcript of TH CONSECUTIVE YEAR - Retail Estates

ANNOUNCEMENT OF THE ANNUAL RESULTS OF THE 2020-2021 FINANCIAL YEAR
RETAIL ESTATES WITHSTANDS “PERFECT CORONA STORM”OUT-OF-TOWN RETAIL REVIVED AFTER EACH COMPULSORY CLOSURE – LIMITED LOSS OF PROFIT
INVESTMENT VALUE OF REAL ESTATE PORTFOLIO STABLE THROUGHOUT THE FINANCIAL YEAR
€ 111.25 MILLION ADDITIONAL INVESTMENTS IN EXPANSION OF RETAIL PARKS AND BIG BOX UNITS
EPRA RESULT (EXCLUSIVE OF PORTFOLIO RESULT) IS € 62.91 MILLION - € 4.97 PER SHARE – DECLINE COMPARED TO LAST FINANCIAL YEAR LIMITED TO € 0.63 PER SHARE
DIVIDEND INCREASED TO € 4.50 – INCREASE OF 2.27%
DIVIDEND INCREASE FOR THE 16TH CONSECUTIVE YEAR
COMPLETION OF OWN PROJECTS IN JAMBES (NAMUR) AND HOGNOUL (LIEGE). € 28.16 MILLION INVESTMENT CREATES € 6.28 MILLION ADDED VALUE
PRESS RELEASEPeriodic statement - regulated information
Ternat, 25 May 2021

ANNUAL RESULTS FOR THE PERIOD 01.04.2020 THROUGH 31.03.2021
1. FINANCIAL YEAR 2020-2021 IN A NUTSHELL
The past financial year was overshadowed by the COVID-19 pandemic. Shops in Belgium and the Netherlands were alternately closed during a period of three months in total. Only the Belgian food and DIY shops escaped these government measures. The impact of these measures was different for the different sectors represented in the real estate portfolio: the home decoration sector (57.11%) and the food and commodities sector (15.58%) experienced major sales increases because consumers invested more in their homes, as a result of the lockdown measures and the closure of the hospitality establishments boosted home consumption. The considerable restrictions on social life had a strong and long-lasting impact on the fashion retailers, even during the periods when the compulsory closure did not apply. Many consumers preferred shops at out-of-town locations to shops located in the city centre and shopping malls thanks to their easy accessibility, their spacious car parks and their large size. This was reflected in the swift recovery of the sales figures after the reopening and the full resumption of rent payments.
The rent for the periods of compulsory closure was divided between Retail Estates and the impacted tenants. This resulted in rent remissions for a total value of € 11.55 million, i.e. slightly more than 10% of the rent due (including the provision for the settlement of the current negotiations in the Netherlands). In Belgium, COVID-19 caused the premature bankruptcy of three major tenants who already were in a weakened financial position and had a weak management: nv Brantano, nv Ochestra België and nv Piocheur/Megaworld (formerly Blokker). For these three tenants, a provision for € 1.78 million of irrecoverable rent was created. Of the 43 retail properties concerned, 36 were rented out again at a similar rent within the financial year.
The acquisition of two retail parks in the Netherlands yielded additional rental income compared to the 2019-2020 financial year, so that the losses in the net rental result was limited to € 7.21 million. This loss was partially compensated by various savings in property expenses. The combination of both factors resulted in a decline of the EPRA result to € 62.91 million, i.e. -9.09% compared to the previous financial year 2019-2020. The EPRA result per share is € 4.97 compared to 5.60 on 31 March 2020.
The investment value of our real estate portfolio (at constant perimeter) has remained stable compared to the value on 31 March 2020. The same cannot be said of the fair value, as the real estate experts fully took into account the 2% increase of the rate of the Dutch real estate transfer tax on the Dutch portfolio. This stability is inextricably linked to the relative success of out-of-town retail properties during this past period.
The real estate investments were continued with the acquisition of two retail parks in the Netherlands (Den Bosch and Maastricht) in the first quarter of the financial year and the completion of a newly constructed retail park in Belgium (IKEA Liège-Hognoul site) and the approaching completion of a “big box” BricoPlanit in Jambes (Namur) in the last quarter. These investments represent a growth of the portfolio by € 111.25 million. The amortisation of the transfer tax on the purchase of the Dutch retail parks (consequence of the Dutch method for the calculation of the fair value of these investments) was compensated by the considerable added value of € 10.32 million resulting from owns developments. A total of € 20.71 million was invested in own developments.
Special efforts were also made with respect to the management of the real estate portfolio through the sale of real estate for a total value of € 43.79 million. Thanks to these investments, resources were released for not only the financing of the above-mentioned new construction projects in Belgium but also for the drastic reorganisation

of two retail parks in the Netherlands, more specifically in Roosendaal and in Apeldoorn. The sale of real estate created an added value of € 0.83 million. In a financial year in which capital increases were not possible due to the volatility of the financial markets, Retail Estates has managed avoid an increase in the debt ratio, which would have resulted from its investment projects, thanks to arbitration within the real estate portfolio.These past few years, the dividend policy has in fact been a pay-out policy that left an important part of the profit in the company as a buffer while still observing the legal obligation to pay out 80% of the profit. It is suggested to the general meeting to pay a gross dividend of € 4.50 from the EPRA profit per share of € 4.97 for the past financial year, an increase of 2.27% compared to the previous financial year, when a gross dividend of € 4.40 was paid. The dividend is protected against inflation even in difficult circumstances and the payout ratio of 87.17% is reasonable for the sector during this exceptional financial year. Retail Estates had the complete trust of its bankers and bond holders in the past financial year. All credits that reached their maturity date were renewed and two bond loans were issued with institutional investors for a total amount of € 46 million.
Retail Estates enjoyed the full confidence of its bankers and bondholders during the past financial year. Credits that came to maturity were all renewed and two bond loans were issued with institutional investors for a total amount of EUR 46 million.
The occupancy rate declined from 97.97% on 31 March 2020 to 97.07% on 31 March 2021. The management is of the opinion that this decrease, which is entirely attributable to the Belgian retail portfolio, is only temporary and expects that the target of 98%, which was reached in the past 22 financial years, will again be reached by the end of this financial year.

2. OPERATIONAL ACTIVITIES
2.1. Investments
Investments – retail parks
The Netherlands
Acquisition of retail park “De Bossche Boulevard” (the Netherlands, province of North Brabant)Retail Estates acquired the retail park “De Bossche Boulevard” on 7 April 2020. This retail park has a surface area of approximately 50,000 m². The customer zone is located in the centre of the Breda-Utrecht-Eindhoven triangle. The retail park comprises 29 retail units, all of which are let, mainly to retail chains like Praxis, Mediamarkt, Leen Bakker, Kwantum, Prenatal and X2O. The amount invested is € 68.70 million and the fair value1 calculated by the real estate expert Cushman & Wakefield amounts to € 65.42 million. This acquisition was entirely financed with the proceeds of the successful issue of a bond loan of € 75 million, which was completed by Retail Estates in late December 2019.
Acquisition of retail park Belvédère Maastricht (the Netherlands, province of Limburg)The retail park Belvédère was completed on 1 June 2020, and Retail Estates subsequently acquired the complex. It consists of 7,850 m² of retail area subdivided into five retail units, which will all be let to retail chains from the home decoration section (i.a. Jysk, Beter Bed, Leen Bakker, Carpetright). The investment amounts to € 10 million (exclusive of recoverable VAT) and generates a rental income of € 0.66 million. The real estate expert Cushman & Wakefield set the fair value at € 9.97 million.
Acquisition of retail property at Duiven (the Netherlands, province of Gelderland)On 22 December 2020, Retail Estates acquired a retail property situated at Duiven, a suburb of Arnhem. The ground floor of the property is approximately 3,000 m² and is entirely let to Leen Bakker, a retail chain specialised in home decoration articles. The annual rent amounts to € 0.27 million. The acquisition represents a € 4.5 million investment and is still subject to a price adjustment formula which, depending on the outcome of the current price adjustment procedure, may represent an additional investment for Retail Estates of maximally € 0.57 million. The real estate expert CBRE estimated the fair value of the acquired property at € 4.93 million on the basis of their estimate of the new rent that would be payable as from December 2021 depending of the expected outcome of the current price adjustment procedure.
1 In the Netherlands the fair valuecorresponds to the cost-to-buyer valuation (i.e. the total investment excluding 8% real estate transfer fax, notary fees and other costs of transfer). At the time of this acquisition the transfer tax in the Netherlands was still 6%.
Non-current assets under construction – development – overview of the main own developments
The company is in the final phase of the extension of its retail cluster at Jambes (Namur-South). It concerns a forward-financing operation, which will have the legal form of a real estate leasing. The extension concerns the construction of a new building on the one hand and the renovation of an existing building on the other hand, resulting in a total retail area of 15,905 m². The building is constructed especially for BricoPlanit but is designed as a multipurpose building. The total investment was contractually limited to € 17.95 million. The investment was made according to the “open book” principle, with a yield of 6.50% determined in advance. Construction started in September 2019. The building was put at the disposal of the tenant in March 2021. The project was valued on 31 March 2021; an added value of € 2.83 million was created compared to the cost. In Bruges an obsolete retail property is demolished and reconstructed to be let to X20. The total investment is estimated at € 1.1 million; on 31 March 2021. An amount of € 0.13 million has been invested.
Within the context of the CSR strategy, Retail Estates invests in the installation of photovoltaic panels on the roof of its new retail park in Hognoul. Solar panels with a total capacity of 368 kWp are installed. The panels are expected to generate over 340 Mwh of green electricity on an annual basis. This € 0.30 million investment will also have a positive impact on the tenants’ operational expenses. They will be able to cover their entire energy consumption with the green power generated from this installation. Retail Estates will receive an annual compensation in exchange for making the photovoltaic system available to the tenants. Completion of this installation is scheduled for the first quarter of the 2021-2022 financial year.
Finally, the company invests in the restyling of its retail park in Roosendaal. The permits for this renovation were obtained and the commercialisation has been started. The total investment is expected to amount to approximately € 4.44 million. The project consists of 3 phases. Phases 1 and 2 have been completed. On 31 March 2021, the total investment made amounts to € 3.87 million.
Non-current assets under construction – overview of the completed projects.
A completely new retail park was constructed next to the existing IKEA store of Liège-Hognoul. The park was completed in March 2021 and comprises four retail units, for a total retail area of 5,672 m². The total investment amounts to € 10.21 million. On 31 March 2021, a total of € 3.15 million must still be invoiced. An added value of € 3.14 million was created compared to the estimated fair value, which was € 13.35 million on 31 March 2021.
Optimisation of real estate portfolio
Retail Estates nv pays close attention to the changing needs of its tenants with respect to retail area. Several tenants systematically expand their product range and regularly request an extension of their retail area. This can be done by acquiring space from adjacent tenants who sometimes have too much space or by constructing a new addition to the retail unit. Sometimes a combination of both is opted for.
Renovations sometimes include more than just an expansion of the retail area. Retail Estates nv regularly seizes the opportunity to remove an existing shop façade and replace it with a contemporary version that better fits the tenant’s image.
Such investments allow us to build “win-win” relations with the tenants. Available lands are made profitable in this manner and revenue growth allows the tenant to pay the rent increase.

Divestments
Over the past financial year, 7 solitary retail properties (in Ninove, Aywaille, Stabroek, Fléron, Deinze, Mechelen and Drogenbos), 2 smaller clusters (Libramont and Chapelle-lez-Herlaimont), a plot of land in Mons and the retail park in Alphen aan den Rijn were sold. A distribution centre in Erembodegem (formerly Brantano) was sold as well (fair value € 10.37 million). The net sales revenue amounted to € 43.79 million. The fair value of these properties was € 42.96 million. The rental income of these properties amounted to € 2.10 million. These sales resulted in a net capital gain of € 0.83 million (a plus value of € 2.90 million was created, and losses in value by € 2.07 million were incurred).These divestments are part of an annual recurring sales programme of individual retail properties that are not part of the core portfolio of Retail Estates nv due to their location, size and/or commercial activity.
2.2. Management of the real estate portfolio
Occupancy rate
On 31 March 2021, the occupancy rate was 97.07% of the total retail area of the properties included in the real estate portfolio. This percentage is lower than the usual rate of the previous 22 financial years, when it was never less then 98%. The increased vacancy is mainly attributable to the bankruptcy of three major retail chains (Blokker, Brantano and Orchestra), the bankruptcy of three SMEs and the reorganisation of 4 retail chains within the context of a procedure within the scope of the Act on the Continuity of Enterprises (affecting 16 retail properties with a retail area of 13,268 m²).
A limited number of vacant retail units resulting from the three major bankruptcies are still available for letting: 5 retail units out of the original 9 for Blokker, 1 retail unit out of the original 27 for Brantano and 1 retail unit for Orchestra. The demand of tenants from the out-of-town retail sector remains high. Only the demand of fashion retailers, which was still stable after the first lock-down period in Belgium, has significantly declined. As a result of the disappearance of a number of players, many retail businesses now have a unique opportunity to open an outlet at locations where no retail areas were available. This demand boosts rent levels.
If abstraction is made of the vacancies created by bankruptcies and reorganisations, the occupancy rate would be 98.23%. In principle, the properties that have become vacant due to bankruptcies and reorganisations can be relet in 6 to 9 months’ time. However, the corona epidemic has disrupted the operations of various local public services, causing the period required to obtain the permit changes necessary for some properties to be relet to be considerably longer. Six retail properties are the subject of ongoing rental transactions that are expected to be completed before 30 June. In addition, 9 retain units that have become vacant as a result of bankruptcies/reorganisations are available for letting. Finally, three retail units, one of which is vacant as a result of a bankruptcy, are transformed in order to make them suitable for reletting under better conditions.

Rental income
On 31 March 2021, the gross rental income amounts to € 102.60 million, a decline by € 5.31 million compared to the same period of the last financial year. This decline is attributable to the impact of the corona crisis.
On 8 July 2020, the judicial reorganisation proceedings were started with regard to the retail activities of the FNG group. The Belgian retail companies of the FNG group were declared bankrupt on 3 August 2020. On the date on which bankruptcy was declared, Brantano and its affiliates were the tenants of 27 retail units, representing a total rental income of EUR 3.2 million. The majority of the retail outlets (18) was transferred to different players in the fashion segment. The others were relet to players in the home decoration segment. On 30 November 2020, the keys of the distribution centre were returned by the trustees in bankruptcy, severing all ties between Retail Estates and Brantano as from the same date. On 31 March 2021, a sales agreement relating to the distribution centre was signed and the sale was recorded in a notarial deed on 18 May of this year.
nv Orchestra-Prémaman Belgium was declared bankrupt on 8 July 2020 after a lengthy procedure within the scope of the Act on the Continuity of Enterprises, which enabled the relaunch of a small number of shops and the liquidation of the inventory. Only one retail unit from the portfolio of Retail Estates is involved in the relaunch. Seven retail units were put at the disposal of Retail Estates again by the trustee in bankruptcy. At present, one retail unit is still available for letting. New tenants were found for the other retail properties. The loss of income for the period of 1 April to 31 July 2020 amounts to € 0.20 million as a result of the depletion of the bank guarantees.
The intended relaunch of the Belgian Blokker affiliates under the new trade name Megaworld was not successful. The stocks of the retail units were sold until August 2020, but starting in September 2020, the operational companies Megaworld nv (i.e. the former Blokker Belgium nv) and Piocheur nv experienced serious problems and a procedure within the scope of the Act on the Continuity of Companies was started for these companies. This procedure was completed unsuccessfully and was followed by the bankruptcy of both companies on 22 December 2020 (nv Megaworld) and 25 January 2021 (nv Piocheur) respectively. The trustees in bankruptcy put the retail units at the disposal of the lessors in the period of January-February 2021 and have not been able to sell the businesses to prospective buyers. Retail Estates recovered 9 retail properties, representing a retail area of 6,422 m² and a rental income of € 0.75 million. Reletting these properties takes more time than reletting the properties previously rented by Brantano and Orchestra, due to the bad condition of the premises when they were returned. Expectations are that they can be relet in the course of this financial year. The loss of income with respect to these properties for the past financial year is € 0.17 million and the costs to restore them to their original state amount to € 0.13 million. The former dominant shareholder of the bankrupt companies, BV Mirage Retail Group, stands surety for the payment of a compensation for a large part of the damage within the context of existing group guarantees.
Outstanding trade receivables amount to € 5.74 million, of which € 2.92 million have not yet reached their maturity date and mainly relate to pre-invoiced rent in the Netherlands for the period April-June 2021. Taking into account the guarantees obtained – both rental guarantees and the requested bank guarantees – and the provisions created for potential financial agreements with Dutch tenants with respect to the remission of part of the rent for the periods of compulsory closure – there is no remaining credit risk concerning trade receivables outstanding amount on 31 March 2021 (after deducting doubtful debtors).

Damage claims
No properties were damaged by fire in the past financial year. There have been a few reports of damage due to wind or flooding. The damage is insured.
Capital increases in the context of the authorised capital.
At its meeting of 20 July 2020, the board of directors of Retail Estates decided to pay adividend for financial year 2019-2020 in the form of an optional dividend with a gross value of € 4.40 (€ 3,08 net). A total of only 5.60% of the coupons no 28 were incorporated in exchange for new shares. As a result 35,349 new shares were issued on 20 August, for a total amount of € 2.18 million. Following this capital increase, 35,349 shares were issued, increasing the total number of shares to 12,665,763 and the share capital to € 284,984,601.97 on 31 March 2021.
Implementation of the financing strategy
Retail Estates combines bilateral credits with different banking partners and private placements of bonds for institutional investors. The average maturity of the credit portfolio is 3.95 years. Within the context of the financing of its activities, Retail Estates has had a commercial paper programme of (up to) € 100 million since September 2017 (and extended in October 2018). The commercial paper is fully covered by back-up lines and unused credit lines that serve as a guarantee for refinancing should the placement or renewal of the commercial paper prove to be impossible or only partially possible. As of 31 March 2021, an amount of € 82 million of this commercial paper programme has been used.The average interest rate on 31 March 2021 is 2.08% compared to 2.13% on 31 March 2020.Retail Estates opts for a growth model with a direct contribution of earnings per share. This can be done both on the capital side and on the debt financing side. On the capital side, this can be done through a non-monetary contribution, a traditional rights issue or via the option for BE-REITs recently introduced in the BE-REIT Act to implement a capital increase through an accelerated bookbuilding (ABB). At the extraordinary general meeting of 23 December 2019, the authorised capital authorisation was extended and the articles of association were adjusted to make the application of the accelerated bookbuilding procedure possible for Retail Estates nv. On the debt financing side, this can be done through tradition bank financing on the one hand or a public and/or private bond loan on the other. Retail Estates regularly examines the possibility of a private and/or public bond loan. In the course of the past financial year, two private bond loans were issued: on 9 December 2020, a bond loan of € 30 million with a maturity of 5 years. This loan has a 1.991% interest rate. The proceeds are used for the repayment of a bond loan that was issued earlier and reached its maturity date in April 2021. On 26 March 2021, a bond loan of € 16 million with a maturity of 8 years and an interest rate of 2.897% was issued.
Merger by acquisition of subsidiaries
The board of directors proceeded on 30 December 2020 to the merger by acquisition of the real estate company NS Properties nv. Mergers of subsidiaries simplify administrative management and reduce the taxable income of the subsidiaries of Retail Estates nv.
2.3. Events after the balance sheet date
Incorporation of REGREEN
On 22 April 2021 Retail Estates incorporated the subsidiary “Regreen”, mainly to accommodate its investments in photovoltaic systems, charging stations and water infiltration basins.

3. FINANCIAL RESULTS
3.1. Notes to the income statement of 31 March 2021
The net rental income decreased by € 7.21 million, mainly due to the remission of rent following the compulsory closures of shops within the context of the COVID-19 pandemic. The remission of rent for a total amount of € 11.55 million in the 2020-2021 financial year could not be fully compensated by the acquisition of additional properties and the completion of projects in the 2020-2021 financial year (€ + 5.40 million), and the acquisition of the properties and the completion of the projects in the previous financial year that yielded a full year’s rent for the first time this year (€ +2.18 million). The sale of properties resulted in a decrease in net rental income of € -0.58 million. The sale of properties during the previous financial year resulted in a decrease in this year’s net rental income by € -0.30 million. The impact of contract renewals is € +0.28 million. Furthermore, there is an impact of discounts (€ +0.30 million), vacancy (€ - 2.12 million) and indexation (€ 1.30 million). Finally, € 2.15 million was provisioned as uncollectible. COVID-19 has pushed three large tenants in Belgium, already in a weakened financial position and with weak management, into accelerated bankruptcy, namely nv Brantano, nv Orchestra Belgium and nv Piocheur / Megaworld (ex Blokker).
The property expenses amount to € 6.88 million and have decreased by € 2.17 million, which can mainly be explained by the reduction of technical and marketing expenses. The company’s overhead expenses amount to € 6.12 million, an increase by € 0.53 million (9.49%) compared to the previous year, mainly due to an increase in personnel expenses following the expansion of staff and non-recurring fees within the context of the implementation of a new ERP package.
The result of the sale of investment properties is € 0.83 million. This profit is the result of the sale of € 42.96 million in properties (fair value). Please refer to the “Divestment» section for more details.
The variation in the fair value of investment properties amounts to € -5.96 million. The investment value of the property portfolio has remained stable. The main effects of this variation are a positive effect due to the inclusion in the portfolio of a number of large projects that were developed for own account (€ +10.32 million) and a negative effect from depreciation of the transaction costs for the determination of the fair value of the investment properties: this depreciation relates to the depreciation of the transaction costs on the occasion of the new Dutch acquisitions (€ -6.12 million) on the one hand and to the impact of the 2% increase of the transfer tax in the Netherlands (€ -9.04 million). The other portfolio result amounts to € 0.99 million and can be mainly explained by deferred taxes relating to the Dutch portfolio.
The financial result (excluding variations in the fair value of financial assets and liabilities) amounts to € -20.43 million compared to € -19.31 million last year. The decrease in the weighted average interest rate from 2.13% to 2.08% is offset by the increase of the interest charges due to on average higher loans taken to finance further expansion of the portfolio. The variation in the fair value of financial assets and liabilities amounts to € 2.67 million compared to € -6.22 million last year. The evolution in these costs is the result of the change in the fair values of the swaps that are not defined as a cash flow (variations in the fair value of financial assets and liabilities). However, this result is an unrealised and non-cash item.
The EPRA result (i.e. the net result without the result on portfolio) amounts to € 62.91 million compared to € 69.20 million last year.

3.2. Notes to the balance sheet of 31 March 2021
The investment properties (including non-current assets under construction) increased from € 1,661.75 million to € 1,717.25 million. This can mainly be explained by the expansion of the portfolio by € 111.25 million and the sale of investment properties for an amount of € 24.21 million. The fixed assets held for sale increased from € 1.79 million to € 7.93 million. At the end of each quarter, the assets for which the sales agreement has already been signed but the deed has not yet been executed are recorded in the assets held for sale. Assets worth € 25.58 million were added to the assets held for sale in the 2020-2021 financial year, and assets worth € 17.47 million were sold.
Current assets amount to € 34.33 million and consist of € 7.93 million from assets held for sale, € 6.84 million from trade receivables, € 13.33 million from tax receivables and other current assets, € 3.68 million from cash and cash equivalents and € 2.56 million from accrued charges and deferred income.
The shareholders’ equity of the public BE-REIT amounts to € 808.22 million. On 31 March 2021, the share capital amounts to € 284.98 million, an increase by € 0.80 million compared to last year, following the capital increase mentioned above. After deduction of the capital increase costs, the capital on the balance sheet amounts to € 276.53 million. During the 2020-2021 financial year, 35,649 new shares were created. Issue premiums also increased from € 315.41 million to € 316.79 million for the same reasons. Reserves amount to € 153.47 million and consist of the reserve for the variations in the fair value of real estate properties (€ 144.36 million), the result of previous financial years carried forward (€ 77.67 million), the available reserves (€ 16.90 million) and the legal reserves (€ 0.08 million). The reserves are decreased by the impact on the fair value of estimated transfer rights and costs resulting from the hypothetical disposal of investment properties (€ 57.19 million) and by the variations in the fair value of financial assets and liabilities (€ 28.35 million). The Group makes use of financial derivatives (interest rate swaps and caps) to hedge interest rate risks arising from certain operational, financial and investment activities. Financial derivatives are initially recognised at cost and revalued to their fair value on the next reporting date. The derivatives currently used by Retail Estates nv qualify as accounting cash flow hedges only to a limited extent. Changes in the fair value of the derivatives that do not qualify as cash flow hedges are recorded directly in the income statement. Changes in the fair value of the swaps qualifying as cash flow hedges are booked directly as shareholders’ equity and are not included in the income statement. The revaluation of the derivatives in the result amounts to € 3.74 million on 31 March 2021 and is positive as a result of an increase of the long-term interest rate. The net result of the financial year amounts to € 61.44 million and consists of € 62.91 million from EPRA earnings, € - 4.15 million from the result on portfolio and € 2.67 million from variations in the fair value of financial assets and liabilities.
The long-term liabilities amount to € 790.33 million and consist of € 765.12 million long-term financial liabilities with an average term of 3.95 years. The remaining long-term liabilities pertain to authorised cash flow hedges (interest rate swaps) and financial leasing under IFRS 16.The short-term liabilities amount to € 164.45 million and consist of € 24.35 million of trade debts and other short-term liabilities. These mainly comprise the trade debts amounting to € 0.66 million, tax debts estimated at € 6.02 million, invoices receivable for € 16.29 million and exit taxes amounting to € 0.40 million. The short-term financial liabilities amount to € 129.68 million, of which € 82.00 million in commercial papers.Other short-term liabilities have decreased from € 0.81 million to € 0.71 million.
On 21 March 2021, the weighted average interest rate is 2.08%.

4. AUDIT ACTIVITIES OF THE STATUTORY AUDITOR
The audit by the statutory auditor of the consolidated annual accounts and the additional statements was completed. The statutory auditor gave their opinion without reservations on 21 May 2021.
5. OUTLOOK
For the 2021-2022 financial year, on the basis of the planned composition of the real estate portfolio and barring unforeseen events, the company expects the net rental income to amount to EUR 113.99 million (to be compared with a net rental result of EUR 107.61 million as per 31/03/2020 (pre-corona)) . This figure only takes into account purchases and sales for which a sales contract was signed and investments that were tendered and for which the required permits were obtained. Retail Estates nv aims at a gross dividend of EUR 4.60 (EUR 3.22 net) for the 2021-2022 financial year. This would represent an increase by 2.22% compared to the dividend for the 2020-2021 financial year (€ 4.50 gross).
6. FINANCIAL CALENDAR
Shareholder agenda:
Publication of the annual report 2020-2021 11 June 2021
General assembly 19 July 2021
Ex-coupon date dividend 20 July 2021
Record date dividend 23 July 2021
Dividend made available for payment 26 July 2021
Announcement of half-yearly results 22 November 2021

KEY FIGURES
1. A. CONSOLIDATED INCOME STATEMENT
INCOME STATEMENT (in € 000) 31.03.2021 31.03.2020
Rental income 102,604 107,910
Rental-related expenses -2,202 -296
Net rental income 100,402 107,614
Recovery of property expenses
Recovery of rental charges and taxes normally payable by the tenants on let properties 10,599 12,124
Rental charges and taxes normally payable by the tenants on let properties -12,167 -13,505
Other rental related income and expenses -95 -29
Property result 98,738 106,204
Technical costs -2,280 -4,486
Commercial costs -509 -874
Charges and taxes on unlet properties -867 -748
Property management costs -3,217 -2,939
Other property costs -6 -3
Property charges -6,877 -9,052
Operating property result 91,861 97,152
Operating corporate costs -6,123 -5,593
Other current operating income and expenses
Operating result before result on portfolio 85,737 91,559
Result on disposals of investment properties 825 597
Result on sales of other non-financial assets
Changes in fair value of investment properties -5,963 -5,183
Other result on portfolio 992 -298
Operating result 81,592 86,675
Financial income 232 55
Net interest charges -20,592 -19,275
Variations in fair value of financial assets and liabilities 2,674 -6,216
Other financial charges -70 -96

INCOME STATEMENT (in € 000) 31.03.2021 31.03.2020
Financial result -17,757 -25,533
Result before taxes 63,835 61,142
Taxes -2,399 -3,044
Net result 61,436 58,098
Attributable to:
Shareholders of the Group 61,436 58,098
Minority interests
Note:
EPRA result (Group share) 1 62,908 69,199
Result on portfolio -4,146 -4,884
Variations in fair value of financial assets and liabilities 2,674 -6,216
RESULT PER SHARE 31.03.2021 31.03.2020
Number of ordinary shares in circulation 12,665,763 12,630,414
Weighted average number of shares 12,652,011 12,359,942
Net profit per ordinary share (in €)2 4.86 4.70
Diluted net profit per share (in €) 4.86 4.70
1 EPRA earnings are calculated as follows: net result excluding changes in the fair value of investment properties, excluding the result on the disposal of investment properties and excluding changes in the fair value of financial assets and liabilities.
2 The net profit per ordinary share is calculated as follows: net result divided by the weighted average number of shares.
1.B. STATEMENT OF OTHER COMPREHENSIVE INCOME Statement of other comprehensive income (in € 000) 31.03.2021 31.03.2020
Net result 61,436 58,098
Other components of other comprehensive income, recyclable in income statements:
Impact on the fair value of estimated transaction rights and costs resulting from the hypo-thetical disposal of investment properties 0 -154
Changes in the fair value of authorised hedging instruments qualifying for hedge accounting as defined by IFRS 1,233 511
COMPREHENSIVE INCOME 62,669 58,455

2. CONSOLIDATED BALANCE SHEETASSETS (in € 000) 31.03.2021 31.03.2020
Non-current assets 1,728,673 1,672,128
Goodwill
Intangible non-current assets 1,553 1,142Investment properties(3) 1,717,245 1,661,753
Other tangible non-current assets 6,426 6,545
Financial non-current assets
Financial lease receivables 1,030 1,030
Trade receivables and other non-current assets 2,418 1,658
Deferred taxes 2,413 1,653
Other 5 5
Current assets 34,335 113,008
Non-current assets or groups of non-current assets held for sale 7,931 1,791
Trade receivables 6,837 5,686
Tax receivables and other current assets 13,328 5,690
Cash and cash equivalents 3,681 98,082
Accrued charges and deferred income 2,558 1,759
TOTAL ASSETS 1,763,008 1,785,136
3 Including fixed assets under construction in accordance with the amended IAS 40 standard.

SHAREHOLDERS’ EQUITY AND LIABILITIES (in € 000) 31.03.21 31.03.20
Shareholders' equity 808,223, 798,987,
Shareholders’ equity attributable to the shareholders of the parent company 808,223, 798,987,
Capital 276,526, 275,768,
Issue premiums 316,792, 315,410,
Reserves 153,469, 149,711,
Net result of the financial year 61,436, 58,098,
Minority interests
Liabilities 954,785, 986,149,
Non-current liabilities 790,333, 833,751,
Provisions
Non-current financial debts 765,117, 804,793,
Credit institutions 587,324, 642,707,
Long-term financial lease 2,706, 2,870,
Bonds 175,087, 159,217,
Other non-current financial liabilities 25,216, 28,957,
Current liabilities 164,452 152,399
Current financial debts 129,680 126,993
Credit institutions 99,683 126,993
Bonds 29,997, 0,
Short-term financial lease 0 0
Trade debts and other current debts 24,352 15,385
Exit tax 399 959,
Other 23,953 14,426,
Other current liabilities 705 815
Accrued charges and deferred income 9,715 9,206
TOTAL SHAREHOLDERS’ EQUITY AND LIABILITIES 1,763,008 1,785,136
DEBT RATIO 31.03.21 31.03.20
Debt ratio 4 52,18% 53,10%
4 The debt ratio is calculated as follows: liabilities (exclusive of provisions, accrued charges and deferred income, interest hedging instruments and deferred taxes), shared by the total assets (exclusive of interest hedging instruments).
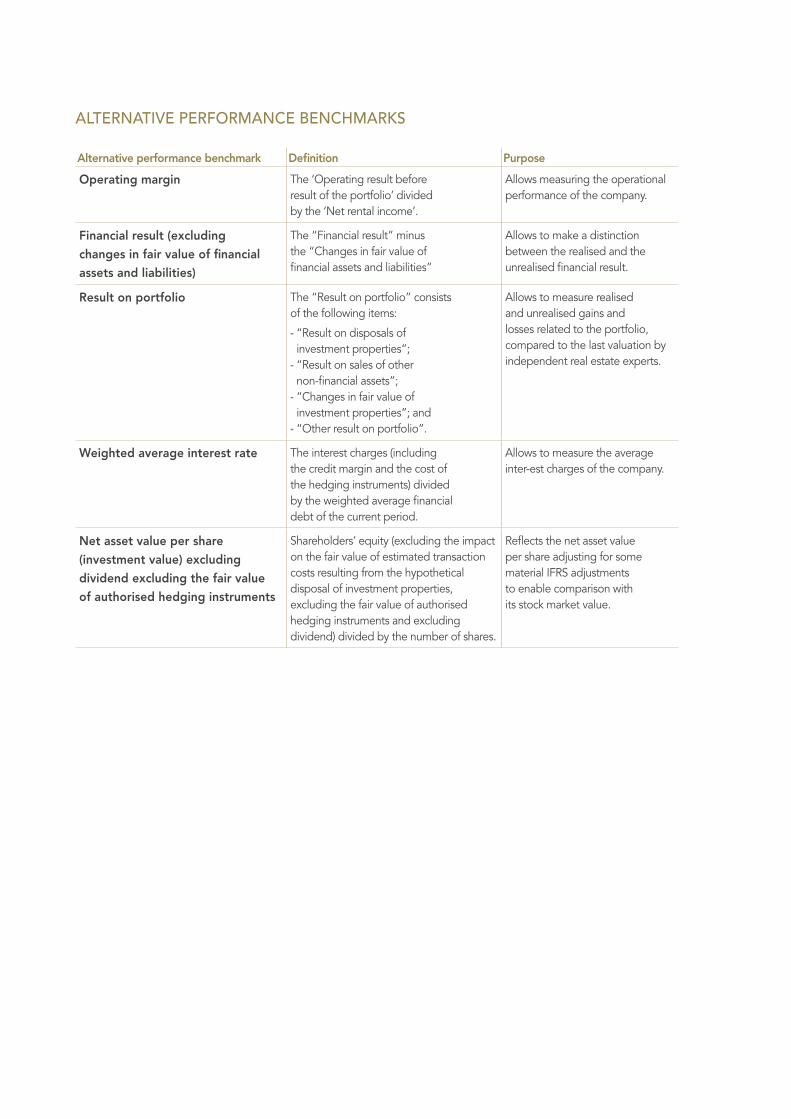
ALTERNATIVE PERFORMANCE BENCHMARKS
Alternative performance benchmark Definition Purpose
Operating margin The ‘Operating result before result of the portfolio’ divided by the ‘Net rental income’.
Allows measuring the operational performance of the company.
Financial result (excluding changes in fair value of financial assets and liabilities)
The “Financial result” minus the “Changes in fair value of financial assets and liabilities”
Allows to make a distinction between the realised and the unrealised financial result.
Result on portfolio The “Result on portfolio” consists of the following items:
- “Result on disposals of investment properties”;
- “Result on sales of other non-financial assets”;
- “Changes in fair value of investment properties”; and
- “Other result on portfolio”.
Allows to measure realised and unrealised gains and losses related to the portfolio, compared to the last valuation by independent real estate experts.
Weighted average interest rate The interest charges (including the credit margin and the cost of the hedging instruments) divided by the weighted average financial debt of the current period.
Allows to measure the average inter-est charges of the company.
Net asset value per share (investment value) excluding dividend excluding the fair value of authorised hedging instruments
Shareholders’ equity (excluding the impact on the fair value of estimated transaction costs resulting from the hypothetical disposal of investment properties, excluding the fair value of authorised hedging instruments and excluding dividend) divided by the number of shares.
Reflects the net asset value per share adjusting for some material IFRS adjustments to enable comparison with its stock market value.
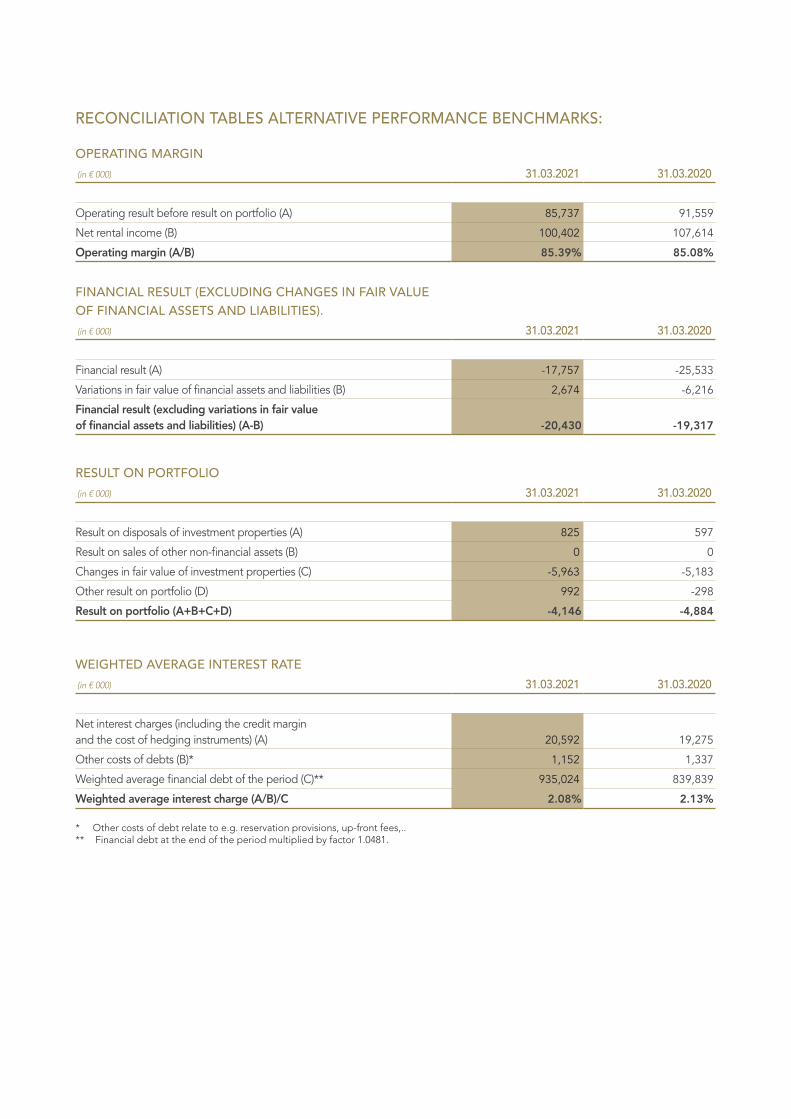
RECONCILIATION TABLES ALTERNATIVE PERFORMANCE BENCHMARKS:
OPERATING MARGIN
(in € 000) 31.03.2021 31.03.2020
Operating result before result on portfolio (A) 85,737 91,559
Net rental income (B) 100,402 107,614
Operating margin (A/B) 85.39% 85.08%
FINANCIAL RESULT (EXCLUDING CHANGES IN FAIR VALUE OF FINANCIAL ASSETS AND LIABILITIES).
(in € 000) 31.03.2021 31.03.2020
Financial result (A) -17,757 -25,533
Variations in fair value of financial assets and liabilities (B) 2,674 -6,216
Financial result (excluding variations in fair value of financial assets and liabilities) (A-B) -20,430 -19,317
RESULT ON PORTFOLIO
(in € 000) 31.03.2021 31.03.2020
Result on disposals of investment properties (A) 825 597
Result on sales of other non-financial assets (B) 0 0
Changes in fair value of investment properties (C) -5,963 -5,183
Other result on portfolio (D) 992 -298
Result on portfolio (A+B+C+D) -4,146 -4,884
WEIGHTED AVERAGE INTEREST RATE
(in € 000) 31.03.2021 31.03.2020
Net interest charges (including the credit margin and the cost of hedging instruments) (A) 20,592 19,275
Other costs of debts (B)* 1,152 1,337
Weighted average financial debt of the period (C)** 935,024 839,839
Weighted average interest charge (A/B)/C 2.08% 2.13% * Other costs of debt relate to e.g. reservation provisions, up-front fees,..** Financial debt at the end of the period multiplied by factor 1.0481.

NET ASSET VALUE PER SHARE (INVESTMENT VALUE) EXCLUDING DIVIDEND EXCLUDING THE FAIR VALUE OF AUTHORISED HEDGING INSTRUMENTS
(in € 000) 31.03.2021 31.03.2020
Shareholders’ equity attributable to the shareholders of the parent company (A) 808,223 798,987
Impact on the fair value of estimated transaction rights and costs resulting from the hypothetical disposal of investment properties (B) -63,203 -57,187
The fair value of authorised hedging instruments qualifying for hedge accounting (C) -25,678 -29,584
Proposed gross dividend (D) 55,729 55,574
Number of ordinary shares in circulation (E) 12,665,763 1,.665,763
Net asset value per share (investment value) exclusive of dividend exclusive of the fair value of authorised hedging instruments ((A-B-C-D)/E) 66.43 65.55

EPRA INDICATOR TABLES
These data are not required by the legislation on Belgian REITs and are not subject to verification by public authorities. The statutory auditor considered whether the ratios “EPRA Earnings”, “EPRA NAV” and “EPRA NNNAV” were calculated according to the definitions included in the “EPRA Best Practices Recommendations” and whether the financial data used in the calculation of these ratios correspond with the accounting data included in the activated consolidated financial statements.
31.03.2021 31.03.2020
EPRA Earnings EUR/1000 EUR/1000
IFRS Net Result (group share) 61,436 58,098
Adjustments to calculate EPRA earnings
Excluding:
Changes in fair value of investment properties -5,963 -5,183
Other result on portfolio 992 -298
Result on disposal of investment properties 825 597
Variations in fair value of financial assets and liabilities 2,674 -6,216
Adaptations to minority interests
EPRA earnings (group share) 62,908 69,199
Diluted EPRA earnings (in €)
EPRA earnings (EUR/share) (group share) 4.97 5.60
Diluted EPRA earnings per share (in €)
31.03.2021 31.03.2020
EPRA Net Asset Value (NAV) EUR/1000 EUR/1000
Net Asset Value (group share) according to the financial statements 808,223 798,987
Net Assets (EUR/share) (group share) 63,81 63,26
Diluted net asset value after effect of exercise of options, convertible debts and other equity interests 808,223 798,987
Excluding:
Fair value of the financial instruments -25,678 -28,957
Deferred taxes
Goodwill as per the IFRS balance sheet
Intangible non-current assets / /
Including:
Fair value of debts at a fixed interest rate / /
Revaluation of intangible non-current assets to fair value / /
Transfer tax / /
EPRA NAV (group share) 833,901 827,944
EPRA NAV (€/share) (group share) 65.84 65.55

31.03.2021 31.03.2020
EPRA Net Reinstatement Value (NRV) EUR/1000 EUR/1000
Net Asset Value (group share) according to the financial statements 808,223 798,987
Net Assets (€/share) (group share) 63.81 63.26
Diluted net asset value after effect of exercise of options, convertible debts and other equity interests
Excluding:
Fair value of the financial instruments -25,678 -28,957
Deferred taxes 2,413 1,653
Goodwill according to balance sheet 0 /
Intangible non-current assets / /
Including:
Fair value of debts at a fixed interest rate / /
Revaluation of intangible non-current assets to fair value 0 0
Transfer tax 72,349 57,383
EPRA NRV (group share) 903,837 883,674
EPRA NRV (€/share) (group share) 71.36 69.96
31.03.2021 31.03.2020
EPRA Net Tangible Assets (NTA) EUR/1000 EUR/1000
Net Asset Value (group share) according to the financial statements 808,223 798,987
Net Assets (€/share) (group share) 63.81 63.26
Diluted net asset value after effect of exercise of options, convertible debts and other equity interests
Excluding:
Fair value of the financial instruments -25,678 -28,957
Deferred taxes 2,413 2,413
Goodwill according to balance sheet 0
Intangible non-current assets 1,553 1,142
Including:
Fair value of debts at a fixed interest rate / /
Revaluation of intangible non-current assets to fair value 0
Transfer tax
EPRA NTA (group share) 829,935 824,389
EPRA NTA (€/share) (group share) 65.53 65.27

31.03.2021 31.03.2020
EPRA Net Disposal Value (NDV) EUR/1000 EUR/1000
Net Asset Value (group share) according to the financial statements 808,223 798,987
Net Assets (€/share) (group share) 63.81 63.26
Diluted net asset value after effect of exercise of options, convertible debts and other equity interests
Excluding:
Fair value of the financial instruments / /
Deferred taxes / /
Goodwill according to balance sheet 0
Intangible non-current assets / /
Including:
Fair value of debts at a fixed interest rate -35,553 -4,328
Revaluation of intangible non-current assets to fair value / /
Transfer tax / /
EPRA NDV (group share) 772,670 794,658
EPRA NDV (€/share) (group share) 61.00 62.92
31.03.2021 31.03.2020
EPRA Triple Net Asset Value (group share) EUR/1000 EUR/1000
EPRA NAV (group share) 833,901 827,944
Including:
Fair value of the financial instruments -25,678 -28,957
Difference between nominal value and fair value of financial debts -35,553 -4,328
Deferred taxes 2,413 1,653
EPRA Triple Net Asset Value (group share) 775,083 796,311
EPRA NNNAV (€/share) (group share) 61.20 63.05

EPRA Net Initial Yield EUR/1000 EUR/1000
Investment properties (excluding assets held for sale) fair value 1,717,245 1,661,753
Transaction costs 72,151 57,367
Investment value 1,789,397 1,719,120
Non-current assets under construction 28,348 13,804
Investment value of the properties available for rent B 1,761,049 1,705,316
Annualised gross rental income 116,149 114,372
Property expenses (EPRA) -2,642 -2,339
Rent payable on rented assets and lease costs -207 -210
Recovery of rental charges and taxes payable by the tenants on let properties 10,599 12,124
Rental charges normally payable by the tenants on let properties -12,167 -13,505
Charges and taxes on unlet properties -867 -748
Annualised net rental income A 113,507 112,033
Notional amount upon expiration of rent-free period or other lease incentives
Topped-up annualised net rental income C 113,507 112,033
EPRA Net Initial Yield (NIY) A/B 6.45% 6.57%
EPRA Topped-up Net Initial Yield (topped-up NIY) C/B 6.45% 6.57%
31.03.2021 31.03.2020
EPRA Vacancy Rate EUR/1000 EUR/1000
Estimated rental value of the vacant surfaces 3,157 2,054
Estimated rental value of total portfolio 117,126 114,372
EPRA Vacancy Rate 2.70% 1.80%
31.03.2021 31.03.2020
EPRA Cost Ratio EUR/1000 EUR/1000
Operating corporate costs 6,123 5,593
Impairments on trade receivables 2,149 247
Land rent costs 207 210
Property expenses 6,877 9,052
Less:
Land rent costs -207 -210
EPRA costs (incl. vacancy costs) A 15,149 14,891
Vacancy costs B -477 -564
EPRA costs (excl. vacancy costs) C 14,672 14,327
Rental income less land rent costs D 102,397 107,700
% %
EPRA Cost Ratio (incl. vacancy costs) A/D 14.79% 13.83%
EPRA Cost Ratio (excl. vacancy costs) C/D 14.33% 13.30%

ABOUT RETAIL ESTATES NV
The Belgian public real estate investment trust Retail Estates nv is a niche player specialised in making in out-of-town retail properties located on the periphery of residential areas or along main access roads to urban centres available to users. Real Estates nv acquires these real properties from third parties or builds and commercialises retail buildings for its own account. The buildings have useful areas ranging between 500m² and 3,000m². A typical retail building has an average area of 1,000 m².
As of 31 March 2021, Retail Estates nv has 992 premises in its portfolio with a total retail area of 1,153,448 m², spread over Belgium and the Netherlands. The occupancy rate of the portfolio was 97.07% on 31 March 2021, compared to97.92%% on 31 March 2020.The fair value of the consolidated real estate portfolio of Retail Estates nv as at 31 March 2021 is estimated at EUR 1,717.25 million by independent real estate experts.
Retail Estates nv is listed on Euronext Brussels and Euronext Amsterdam and is registered as a public regulated real estate company.
FORWARD-LOOKING STATEMENTS
This press release contains a number of forward-looking statements. Such statements are subject to risks and uncertainties which may lead to actual results being materially different from the results which might be assumed in this press release on the basis of such forward-looking statements. Major factors that may influence these results include changes in the economic situation, commercial, tax-related and environmental factors.
Ternat, 25 May 2021
Jan De Nys, CEO of Retail Estates nv
For more information, please contact:Retail Estates nv, Jan De Nys – CEO, tel. +32 2/568 10 20 – +32 475/27 84 12 Retail Estates nv, Kara De Smet – CFO, tel. +32 2/568 10 20
RETAIL ESTATES nv
Public BE-REIT under the laws of Belgium
Industrielaan 6 B-1740 Ternat • RLE Brussel
VAT BE 0434 797 847 • T: +32 2 568 10 20
[email protected] • www.retailestates.com
‘IN RETAIL WE TRUST’