Tez Report Son
69
Fatih University, Istanbul Industrial Engineering Department Continu ous Improvement by Process Developments and Praxis of a Simulation Model A Continuous Improvement Analyze in a Small – Medium Enterprise By Ahmet EREN Adil KARCILAR Hidayet Talha KUŞ Murat GÜLERYÜZ June, 2009
-
Upload
adilkarcilar -
Category
Documents
-
view
222 -
download
0
Transcript of Tez Report Son

8/2/2019 Tez Report Son
http://slidepdf.com/reader/full/tez-report-son 1/69
Fatih University, Istanbul Industrial Engineering Department
Continuous Improvement by Process Developments
and Praxis of a Simulation Model
A Continuous Improvement Analyze in a Small – Medium Enterprise
ByAhmet EREN
Adil KARCILAR Hidayet Talha KUŞMurat GÜLERYÜZ
June, 2009

8/2/2019 Tez Report Son
http://slidepdf.com/reader/full/tez-report-son 2/69
ABSTRACT
Under the circumstances of increasing market pressure, enterprises try to improve
their competitive position by improvement efforts or they struggle to stay in the field of the
marketplace. Even those improvement techniques might be analyzed in a very large scale,
this study focuses on the framework of the basic improvement techniques in manufacturing
industries. The central topic of the study to understand the main and sub-processes of the
case company, Kuş Etiket, and like to investigate the reasons and conditions why the case
company should head towards continuous improvement by considering productivity
improvement factors and techniques.
The first studies about the performance in SMEs have mainly focused on new
business ventures rather than on existing SMEs. The fact that the technology is changing in a
shorter time than before, it is so uneasy to build up new facilities in every simple change.
Besides, implementing the optimum decision making on the performing enterprise is one of
the first priorities for the companies which are dealing with the fact of everyday changing
market conditions.
The objective of the study is to gain a deep understanding on how continuous
improvement is necessary, and to identify the factors supporting this thesis. Data and
information about case and praxis of the simulation model will support our thesis and the
framework of the study will provide a systematic way for analyzing the necessity of
Continuous Improvement (KAIZEN) and its impacts on the performance on the case
company, Kuş Etiket. Together with, the processes will be mapped in order to determine theintegration of functions. In addition, the structure of the organization will be mentioned.
Quality concepts, improvement studies in the case company, and processes will be
questioned and so the answers we got will help us to report our thesis strongly.
ii

8/2/2019 Tez Report Son
http://slidepdf.com/reader/full/tez-report-son 3/69
ACKNOWLEDGEMENT
Assistant Prof. Dr. Özgür Uysal has guided and offered valuable feedback during our
research process. We gave our thanks to him not only for his interest to our thesis study, but
also his hospitality during our weekly meetings. We really appreciate him since he provided
us a map to follow during our researches for the thesis. We would like to express our
warmest gratitude to him.
We are indebted to the interviewees of the case company for their time, their ideas
and suggestions to enrich the interpretation. They urged us towards practical relevance and
scientific contribution of the study. Several people have helped us in the different stages of
the research process by fruitful discussions and insightful comments. We wish to thank the
owner and general manager of the company, Cemil Kuş, and all other workers who
welcomed and advised us during our visitations to the company.
We also thank to all group members (Adil Karcılar, Ahmet Eren, Murat Güleryüz,
and Hidayet Talha Kuş) for their dedication and hard work in making this project works a
reality.
Istanbul, June 2009
iii

8/2/2019 Tez Report Son
http://slidepdf.com/reader/full/tez-report-son 4/69
TABLE OF CONTENTS
1. INTRODUCTION ...................................................................................................................11.1. Background ....................................................................................................................11.2. Task Description ............................................................................................................31.3. Problem Formulation ....................................................................................................31.4. Relevance ......................................................................................................................31.5. Timeframe ........................................................................................................................41.6. Research Methodology ..................................................................................................5
2. THEORY ................................................................................................................................62.1.Small and Medium Enterprises (SMEs) ...........................................................................6
2.1.1. Definition of Small and Medium Enterprises ......................................................6
2.1.2. Characteristics of SMEs ..........................................................................................72.1.3. Business Success in SMEs .....................................................................................92.1.4. Problems Facing SMEs ..........................................................................................10
2.2.The Concept of Performance ..........................................................................................112.2.1. Performance, Productivity and Profitability .........................................................132.2.2. Performance Measurement ....................................................................................14
2.3.Quality Definitions ..........................................................................................................162.3.1. Total Quality Management (TQM) ......................................................................172.3.2. Leadership for Quality Improvement ...................................................................172.3.3. Total Productive Maintenance (TPM) ..................................................................182.3.4. Quality of Labor Force ...........................................................................................19
2.4.KAIZEN, Continuous Improvement ...............................................................................192.4.1. PDCA Cycle ..........................................................................................................202.4.2. Benchmarking .......................................................................................................20
2.5.The Seven Management Tools ........................................................................................212.5.1. Cause-and-Effect Diagram ....................................................................................222.5.2. Check Sheets .........................................................................................................22
2.6.Facilities Design ..............................................................................................................232.7.Product, Process and Schedule (PP&S) Design .............................................................23
2.7.1. Product Design .......................................................................................................242.7.2. Process Design .......................................................................................................24
2.7.3.Schedule Design .......................................................................................................242.8.Primary and Support Production Activities ....................................................................242.9. Demand Management ....................................................................................................25
2.9.1. Engineer-to-order ..................................................................................................252.9.2. Make-to-order .......................................................................................................252.9.3. Assemble-to-order .................................................................................................262.9.4. Make-to-stock .......................................................................................................26
3. EMPIRICAL FINDINGS .....................................................................................................263.1.Description of the Case Company ..................................................................................273.1.Kuş Etiket’s Organizational Structure ............................................................................283.3. The Facilities Plan ..........................................................................................................29
3.4. Primary Activities at the Production Process ................................................................313.5. Sub-Processes at the Production Process ....................................................................31
iv
8/2/2019 Tez Report Son
http://slidepdf.com/reader/full/tez-report-son 5/69
3.6. Quality Policy .................................................................................................................393.7.Process Management .......................................................................................................393.8. Designs for Quality ........................................................................................................40
3.9. Production for Quality ....................................................................................................403.10. Product, Process and Schedule Design ........................................................................41
3.10.1 . Product Design ...................................................................................................413.10.2 . Process Design ...................................................................................................413.10.3. Schedule Design ..................................................................................................42
3.11.Quality Control Tools ...................................................................................................423.12.Customer and Customer Satisfaction ............................................................................43
4. ANALYSIS ..........................................................................................................................444.1.Evaluating the Organizational Structure .........................................................................444.2.Evaluating the Processes .................................................................................................454.3. Evaluating the Improvements ........................................................................................46
4.3.1. A Case Study – Problem and Solution .................................................................474.4.Evaluating the Quality .....................................................................................................49
5. RESULTS & CONCLUSIONS ............................................................................................556. REFERENCES .....................................................................................................................59
v

8/2/2019 Tez Report Son
http://slidepdf.com/reader/full/tez-report-son 6/69
LIST OF FIGURES
Page
FIGURE 1.1. The timeframe for the project ..................................................................... 4
FIGURE 2.1. Model of small firm performance ............................................................. 10
FIGURE 2.2. The three domains of performance ........................................................... 12
FIGURE 2.3. Performance, productivity and profitability .............................................. 13
FIGURE 2.4. The linkage between performance objective and improvement
objectives ................................................................................................ 15
FIGURE 3.1. The organization structure of the company ...............................................29
FIGURE 3.2. Facilities plan of the Case Company ........................................................ 30
FIGURE 3.3.1. The printing for rotary dry offset printing machine ...................................32
FIGURE 3.3.2. The printing resource for rotary dry offset printing machine .....................32
FIGURE 3.4.1. The printing process for flesko printing machine ......................................33
FIGURE 3.4.2. The printing resource for flesko printing machine .................................... 33
FIGURE 3.5.1. The printing process for embossing machine ............................................ 34
FIGURE 3.5.2. The printing resource for embossing machine ..........................................34
FIGURE 3.6.1. The printing process for foil stamping machine ........................................35
FIGURE 3.6.2. The printing resource for foil stamping machine ...................................... 35
FIGURE 3.7.1. The printing process for silk screen printing machine ...............................36
FIGURE 3.7.2. The printing resources for silk screen printing machine ............................36
FIGURE 3.8.1. The printing process for fail transfer printed products ...............................37
vi
8/2/2019 Tez Report Son
http://slidepdf.com/reader/full/tez-report-son 7/69
FIGURE 3.8.2. The printing resource for fail transfer printed products .............................37
FIGURE 3.9.1. The printing process for transfer printed products .....................................38
FIGURE 3.9.2. The printing resources for transfer printed products ..................................38
FIGURE 4.1. Cause and Effect Diagram on the machine ............................................... 48
FIGURE 4.2. SolidWorks drawing of the panel heater on fail stamping machine ...........48
FIGURE 4.3. ProModel drawing of the Simulation of production place ........................51
vii

8/2/2019 Tez Report Son
http://slidepdf.com/reader/full/tez-report-son 8/69
1. INTRODUCTION
In this chapter the authors describe the background of this research with respect to
relevant aspects. A problem formulation is composed and the problem area is discussed.
Furthermore, the research methodology is stated and timeframe is illustrated.
1.1. Background
As technology rapidly changes the rules of competition, enterprises deploy new
strategies, tactics and operations to exploit new advantages. In the recent years, product life
cycles are getting shorter, the development times are getting tighter, and the customers are
expecting almost an instantaneous service. Besides, the business is done at the global level
more than ever before. It means that the competition is tightening also in the local markets.
Under the increasing market pressure, the enterprises are forced to improve their competitive
position e.g. by discovering the new potential arenas for the growth, by decreasing the costs,
and by improving the quality and the productivity (Pasanen, 2003). Basically there are two
modus operandi to be competitive, one is to offer superior customer value and the other is
operating with lower relative costs. To meet operational objectives, the activities within the
organization must be measured in regard to efficiency, productivity and subsequently
rigorously assessed. Lean Manufacturing, Kaizen, Six Sigma, Statistical Process Control and
Total Quality Management are examples of tools to deal with the issues of cost-effectiveness
and customer satisfaction (Clark, 1996).
The development efforts in the organizations have often been examined from the two
perspectives: the development work consists of the continuous, gradually progressive
improvements based on Kaizen-philosophy or the development work consists of a radical,
single-shot reform based on the reengineering (Masaaki, 1986). Successful operations
management requires that processes is documented, assessed and improved, or sometimes re-
engineered to fulfill the company’s mission objectives. Consequently, modeling a process in
order to determine process interdependencies, process improvement possibilities and systemdynamics i.e. the integration of functions, processes and organizations, is a sound technique
1

8/2/2019 Tez Report Son
http://slidepdf.com/reader/full/tez-report-son 9/69
(Chase et al, 2006). Thus, identification of improvement possibilities through process
analysis is the most significant means in achieving business excellence.
PDSA (Plan-Do- Study- Act) circle is one of the foundations for the concept of
continuous improvement also in Kaizen concept. The latter is an example which starts with
planning, evaluating and identifying the problems and its causes. A process is a repeated set
of activities. It is a bridge between the past and the future in the organizations and makes
future scenarios more predictable. According to the number of the people involved or
purpose of the process, it can be categorized in different ways. Purpose of the process is more
used and divided in three parts which are; main processes, supporting processes, andmanagement processes (Bergman & Klefsjö, 2001).
Understanding customer needs and expectation has been a focus of marketing
analysis strategy over the years. These marketing analyses examine customer’s needs and
how to respond to them in the area of productivity. Increased productivity can be achieved
through an effective process in production; this has directed companies focus on what a
production process or system entails. This include production method, machines, personnel,
working environment, maintenance policy measuring system, management, storage, raw
material, procedures and instructions (Coyle et al, 2003).
Simulation methodologies are most widely used and accepted tools in operations and
research and system analysis. It enables the internal interactions of a complex system. And
the knowledge gained as a run result of simulation can be a great value toward suggesting
improvement in the system under investigation. It can also be used to verify analytic
solutions. In addition, simulating different capabilities for a machine can help determine the
requirements on it (Banks et al, 2005).
2

8/2/2019 Tez Report Son
http://slidepdf.com/reader/full/tez-report-son 10/69
1.2. Task Description
This project describes and analyzes the production process and sub-processes of Kuş
Etiket. It also identifies continuous improvement possibilities in terms of quality, efficiency
and adaptability which are important aspect of process management in accordance to
production and quality management.
1.3. Problem Formulation
Kuş Etiket is like many other manufacturing companies that would also embrace
what will increase and continuously improve their productivity. In this thesis work we would
like to investigate the reasons and conditions why the case company should head towards
continuous improvement by considering productivity improvement factors and techniques.
At the same time, we would like to find out whether the production and management system
is efficient enough and what its disadvantages are, if any.
Moreover, we would like to search for the improvement possibilities of the current
situation of the case company, especially regarding the praxis of a simulation model that is
built by time measurement studies for the present state and exact data stored in the database
of the case company for the past state so that we could compare and analyze those two
models respectively.
1.4. Relevance
It’s a big advantage to practice and apply the knowledge from theories and
manufacturing company visitations during our school studies and relevant lots of case
studies. So as to know how to apply it in our working life, as this helps us to get a more clear
understanding about industrial engineering especially for the candidates who are specified in
manufacturing, quality, simulation, or production management areas. This is also an
3

8/2/2019 Tez Report Son
http://slidepdf.com/reader/full/tez-report-son 11/69
opportunity to get an insight of production job and gives more critical and analysis when
making decisions and suggestions later on in life.
1.5. Timeframe
The timeframe is illustrated with respect to the research schedule during our
university studies in the graduation year, 2009 Spring Semester.
MONTHS February March April May June
Overall Project
Discussion
Theory Studies
Collection of
Empirical Data
Analyzes
Discussions &
Results
Submission
Corrections
Seminar
FIGURE 1.1. The timeframe for the project
4
8/2/2019 Tez Report Son
http://slidepdf.com/reader/full/tez-report-son 12/69
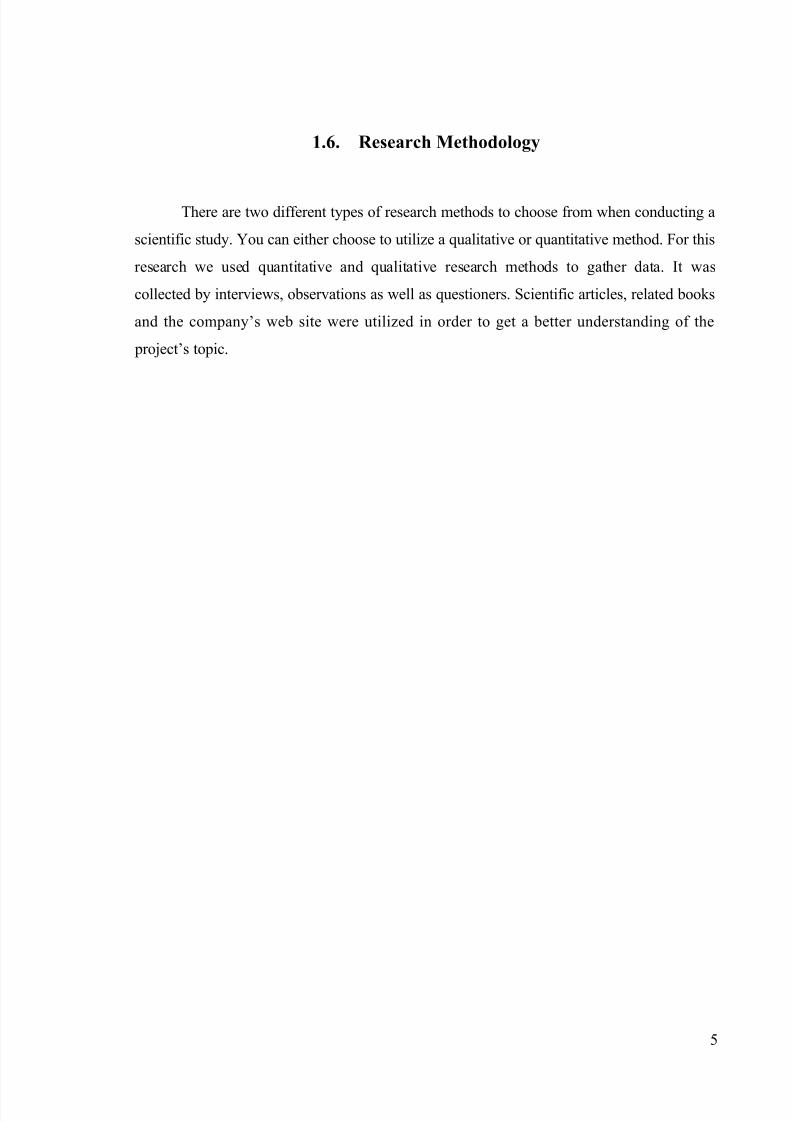
1.6. Research Methodology
There are two different types of research methods to choose from when conducting a
scientific study. You can either choose to utilize a qualitative or quantitative method. For this
research we used quantitative and qualitative research methods to gather data. It was
collected by interviews, observations as well as questioners. Scientific articles, related books
and the company’s web site were utilized in order to get a better understanding of the
project’s topic.
5

8/2/2019 Tez Report Son
http://slidepdf.com/reader/full/tez-report-son 13/69
2. THEORY
This chapter aims at highlighting the basis of rudimentary and technical knowledge,
in order to give a better view or understanding about the thesis. We present a number of
relevant topics, important definitions, and concepts.
2.1. Small and Medium Enterprises (SMEs)
The size of the businesses and the increasingly competitive markets force small and
medium enterprises to consider more cost-effective processes than large enterprises must
consider. As well, small businesses have to deal with unique operational and limited financial
and economic resources (Georgellis et al., 2000). Small and Medium enterprises (SMEs)
perform a strong influence on the economies of all countries, particularly in the fast changing
and increasingly competitive global market. They contribute significantly to job creation,
social stability, and economic welfare (Eunni at al., 2007).
2.1.1. Definition of Small and Medium Enterprises
The definition of small and medium sized enterprise (SME) has varied. Because of
the various types of small businesses, every simple definition is subject to criticism. The
ideal definition depends on the purpose of the research and the perspective of the researcher
(Nooteboom, 1994). The commonly used attributes to enlighten this concept confusion are
the number of the employees and financial turnover of the company. These attributes are also
useful to comprehend the differences between various job arenas. For instance, while a
consumer service is considered as big with 50 employees, in manufacturing it may not be
considered as a big firm.
According to the Resmi Gazete (2005) of Turkey, an enterprise with fewer than 50
employees has been defined as a small business. Its turnover is no more than 5 million YTL.A medium sized enterprise has fewer than 250 employees and its turnover is no more than 25
6

8/2/2019 Tez Report Son
http://slidepdf.com/reader/full/tez-report-son 14/69
million YTL. Further, bigger companies’ share of the ownership is limited. They can hold a
share of the ownership of the SME by no more than 25 %.
The European Commission also has divided the SME sector into three categories,
micro, small and medium sized enterprises as follows:
• The SME employs fewer than 250 persons, its annual turnover does not
exceed 50 million Euros and/or the annual balance sheet total does not exceed 43
million Euros;
• The small enterprise employs fewer than 50 persons, and its annual turnover
and/or annual balance sheet total do not exceed 10 million Euros; and• The micro enterprise employs fewer than 10 employees, and its annual
turnover and/or annual balance sheet total do not exceed 2 million Euros.
DİE (2002) Genel Sanayi İş Yerleri Sayımı (GSİS) officially reports that 1,881,433
enterprises in Turkey are activated. The sectors in favor are commerce, commission business,
repairs, transportation, warehousing, communication, manufacturing industries, hotel and
restaurants and other social services such as immovable property and renting. 94,6 % percentof the businesses includes all those sectors mentioned above. SMEs in Turkey have played a
critical role in the economic development of the country by promoting rapid growth during
the nation’s recent economic transition. These businesses are best known for their flexibility,
effectiveness, and high entrepreneurial spirit; they are the engine for Turkish industry and
contribute to the dynamic economy in Turkey.
2.1.2. Characteristics of SMEs
The typical characteristics of SMEs are connected to small scale, personality and
independence (Nooteboom, 1994). The basic key characters for SMEs:
• Personalized management, with a little devolution of authority;
• Severe resource limitations in terms of management, manpower, and finance;
• Operating in limited markets;
7

8/2/2019 Tez Report Son
http://slidepdf.com/reader/full/tez-report-son 15/69
• Flat, flexible structures;
• High innovatory potential;
• Reactive, fire-fighting mentality; and
• Informal, dynamic strategies.
According to Jones (2003), the owner managers have the prime role as a driving force
in SMEs. They follow simple strategic structures, researches local market, determine the
strategy and make planning and control. Their strategic options are comparatively narrow
and their resources are limited. As advantages of small scale, SMEs typically have a
motivated, committed management and labor. They are also flexible enough about products
and processes in general to respond varying customer requests (Ateş, 2007).
Nooteboom (1994) highlights that it is obvious to see the personal characteristics of
the owner-manager have been under increasing interest. Some attempts have been made to
explain business success or failure in terms of personality traits of the entrepreneur . Besides,
one of the most important characteristics of the small business is its diversity. The sources
that produce diversity lie in the variance of the backgrounds, motives and goals of theentrepreneurs.
Some researchers have defined the characteristics of SMEs by comparing them with
large companies. Storey (2000) indicates three central respects in which small enterprises are
different from large companies: uncertainty, innovation and evolution. Uncertainty might be
in industry level, firm level, or individual level. The industry level uncertainty refers to the
changes of economic environment. On the firm and individual level, it refers to resourceuncertainty and the issues connected to entrepreneurial capabilities
The second key area of difference between small and large enterprises is their role in
innovation. It is the ability of the smaller enterprises to provide something marginally
different, in terms of a product or a service (Storey, 2000). Georgellis et al. (2000) add that
the small businesses will be successful whether they possess the following three
competencies: a capacity to innovate, a capacity to plan a head and a willingness to take
risks.
8

8/2/2019 Tez Report Son
http://slidepdf.com/reader/full/tez-report-son 16/69
The third area of difference between large and small enterprises is the much greater
likelihood of evolution and change in the smaller enterprise (Storey, 2000). He additionally
emphasizes that the small enterprises that become larger undergo a number of stage changes,which influence the role and style of the management and the structure of the organization.
The structure and organization in the small enterprises are more likely to be in a state of
change as the firm moves from one stage to another.
2.1.3. Business Success in SMEs
Business success is related to the achievement of goals and objectives. The different
stakeholders may have different objectives and goals for the enterprise. Jennings and Beaver
(1997) suggest that it would be appropriate to regard an entrepreneur as the primary
stakeholder and to consider how she or he might define success or failure. In small firms,
expectations of the entrepreneur affect the main goals of the enterprise greatly.
Small business success has often been classified into three categories of antecedents:
The individual characteristics of the owner-manager, firm characteristics and environmental
characteristics (Rutherford & Oswald, 2000). The individual characteristics include attributes
like the age, education, managerial know-how, industry experience and social skills of the
owner/manager. The firm characteristics refer to the strategy, structure, location, firm-
specific policy, etc. The environmental characteristics are connected to the market
conditions.
The personal attributes of the entrepreneur determine the motivation and objectives,
which in turn determine the firm’s performance. The process is mediated through the markets
in which the entrepreneur operates and the managerial practices which he or she employs.
The dynamic element is incorporated by the possibility that the business performance may
reinforce or revise the entrepreneur’s motivation and objectives. The possibility of feedback
on the performance and learning from experience as an important form of entrepreneurial
human capital are encompassed in the model (Figure 2.1).
9

8/2/2019 Tez Report Son
http://slidepdf.com/reader/full/tez-report-son 17/69
FIGURE 2.1. Model of small firm performance (Glancey et al. 1998, 255)
2.1.4. Problems Facing SMEs
Small enterprises are critical to almost every national and local economy since they
have a great potential to grow larger. However, their problems are not similar to those of
larger organizations and have not been treated with the same importance as those of larger enterprises. The major problems facing SMEs are (Woodcock et al ., 2000):
• Lack of organizational and management skills;
• Lack of strategic planning and documentation;
• Compatibility to technological changes and innovation;
• Inconsistent record keeping for evaluation;
• Shortages of working capital and credits; and
• Inadequate knowledge of the competitors’ products.
Related to those topics above, Nooteboom (1994) mentions small business strengths
and weaknesses. An advantage of the smallness is the greater potential flexibility and
closeness to the customer. The disadvantage is a lack of economies of scale, scope and
experience. Based on the problems faced by small enterprises attempting to sustain their
market share and to increase profitability and growth, they need the following:
10

8/2/2019 Tez Report Son
http://slidepdf.com/reader/full/tez-report-son 18/69
• Strategic and operational planning;
• Management of human resources;
• Decision making related to technical, financial, and marketing issues; and
• Performance measurement
2.2. The Concept of Performance
The firm’s performance is often referred to as the success or the failure of the firm. It
is in general related to the achievement of the goals and objectives. The success may also
depend on the time frame. For instance, a profitable month of the company can be interpreted
as success, or a long term existence for a company can be a success that is targeting long-
term business survival. In business studies the concept of success is often used to refer to a
firm’s financial performance (Pasanen, 2003).
A revolution in business performance measurement is taking place; thousands of articles have been published about performance measurement during the last years, customer
satisfaction questionnaires are widespread, the data collection processes have been
automated, companies have real time access to customers’ views and the annual reports are
bubbling with information about financial and nonfinancial performance (Neely, 1999). Why
have so many companies become interested in the business performance? According to
Neely (1999) there are several reasons for the interest, e.g. the increasing competition, the
power of information technology and the changes in the nature of work, in the environmentand in the external demands.. Business performance is divided into three domains; financial
performance, business performance and organizational effectiveness (Figure 2.2).
11

8/2/2019 Tez Report Son
http://slidepdf.com/reader/full/tez-report-son 19/69
FIGURE 2.2. The three domains of performance (McAdam and Bailie, 2002)
The financial performance based on financial indicators reflects the fulfillment of the
economic goals of the firm. In addition to the financial performance, the business
performance includes emphasis on the indicators of the operational performance like the
market-share, new product introduction and product quality. The organizational effectiveness
is a highly subjective variable that depends on who is defining the effectiveness. The
organizational effectiveness represents the outcome of the organizational activities Most of
the studies have been restricted to business performance consisting of financial performance
and operational performance.
Pasanen (2003) has divided the company’s performance into two categories; internal
and external performance. Traditionally, analyzing the external performance means the
analysis of the financial statement. The key indicators for the external performance are the
profitability, the liquidity, the solvency ratio and the extent of the business. The analysis of
the internal performance is assessment of the company’s own functions. The required reliable
and accurate information is not available for outsiders. The internal performance indicators
measure for example productivity, adaptability, cost efficiency, quality, lead-time, the time of
delivery and capacity
12

8/2/2019 Tez Report Son
http://slidepdf.com/reader/full/tez-report-son 20/69
2.2.1. Performance, Productivity and Profitability
Performance, productivity and profitability are terms often confusingly used with the
same meaning. Grünberg (2004) has described them as a hierarchal view (Figure 2.3).
FIGURE 2.3. Performance, productivity and profitability (Grünberg 2004, 63)
Productivity and profitability are concepts and measures to describe the performance
and successfulness of an enterprise. Productivity is often defined as the output/input – ratio.The measures of productivity are a subset of performance measurements. Profitability is a
result that can be defined as the ratio of revenues and costs. In the long run, profitability is a
prerequisite for the continuation of a company’s functioning (Grünberg, 2004).
The common understood meaning of productivity is output divided by input. Some
definitions for concepts; in the technological concept; the relationship between ratios of
output to the inputs used in its production. In the engineering concept; the relationship
between the actual and the potential output of a process. In the economist concept; the
13

8/2/2019 Tez Report Son
http://slidepdf.com/reader/full/tez-report-son 21/69
efficiency of resource allocation (Bernolak, 1991). Productivity performance measurement
has been regarded as a pre-requisite for continuous improvement. All researchers are always
trying to improve productivity. In another words productivity is, above all, a state of mind. Itis an attitude that seeks the continuous improvement of what exists. It is a conviction that one
can do better today, yesterday, and tomorrow will be better than today.
2.2.2. Performance Measurement
“What you measure is what you get” or the other way around, “You can’t managewhat you can’t measure”, contains an important message. It is believed that the performance
measurement strongly affects the behavior of the managers and employees. People in the
organizations respond to these measures (Neely, 1999).
Performance measurement is the development of indicators and the collection of data
to describe, to report on and to analyze the performance. Neely (1999) defines performance
measurement as the process of quantifying the efficiency and the effectiveness of the action.
Effectiveness refers to the extent to which the customer requirements are met and efficiency
is the measure of how economically the organization’s resources are utilized, while providing
a given level of customer satisfaction. The performance measure is a metric used to quantify
the efficiency and/or the effectiveness of the action. The performance measurement system is
a set of metrics used to quantify both the efficiency and the effectiveness. Thus the
performance measurement system consists of a number of individual performance measures.
Performance measurement system is defined as a systematic way of evaluating the inputs,
outputs, transformation, and productivity. The system includes the performance criteria,
standards and measures. The criterion is a relative element to evaluate the performance. The
performance standard is an accepted satisfactory level of measurement and the performance
measure is an actual value of the performance criterion.
Grünberg (2004) emphasizes that measuring the performance has two main aims, first
to connect the company goals and objectives to the improvements, and secondly to set the
targets for the improvement activity. A linkage between the performance objectives and the
14

8/2/2019 Tez Report Son
http://slidepdf.com/reader/full/tez-report-son 22/69
improvement objectives can raise the impact of the improvement work, which in turn helps
fulfill the performance objectives (Figure 2.4). This also helps to clarify the development
work and to ensure that all the participants are working in the same direction. To support theimprovement work, it is vital to find the performance factors that support the performance
strategy set by the company.
FIGURE 2.4. The linkage between performance objectives and improvement objectives
(Grünberg 2004,57)
Neely (1999) emphasizes that to be effective, the performance measurement systems
must be managed to reflect the organization’s context and strategies. The main task of
performance measurement and analysis is to support the decision-making by producing
information of the desired estimation and measuring the targets. The measurement of the
performance may focus not only on verifying the past, but it has to direct the firm to better performance in the future.
The use of performance measurement systems usually occurs in one or several of the
following areas or subsystems (Grünberg, 2004):
• Planning and control of current operations / production;
15

8/2/2019 Tez Report Son
http://slidepdf.com/reader/full/tez-report-son 23/69
• Financial and management accounting;
• Business process benchmarking and improvement programs; and
• Establishment and maintenance of incentive schemes.
There are a large number of performance measurement systems and frameworks
available for companies - such as Balanced Scorecard, Business Excellence Model, Activity
Based Costing, Quick Response Manufacturing, etc. Maybe the best known is the Balanced
Scorecard -concept (BSC) presented by Kaplan and Norton (1996). The BSC is a set of
measures that gives a comprehensive view of the business and introduces the strategy of the
company. The BSC allows the managers to look at the business from four perspectives:
• Financial perspective;
• Customer perspective;
• Internal business perspective; and
• Innovation and learning perspective.
According to Kaplan and Norton (1996), the BSC emphasizes the idea that financial
and non-financial measures must be a part of the information system for the employees at all
levels of the organization. The objectives and measures are derived from a top - down
process driven by the mission and the strategy. The measures represent a balance between
external measures for the shareholders and customers, and internal measures of the critical
business processes, innovation, learning and growth. The measures are balanced between
outcome measures – results of the past effort – and measures that drive the future
performance. The scorecard is balanced between the objectives and easily quantifiedoutcome measures (Kaplan & Norton 1996).
2.3. Quality Definitions
There are many definitions of the term quality. Descriptions like “conformance torequirements” is too thin and only takes in regard a producer viewpoint. Other definitions
16

8/2/2019 Tez Report Son
http://slidepdf.com/reader/full/tez-report-son 24/69
such as “fitness for use” and “quality should be aimed at the needs of the customer, present
and future” are more customer orientated (Bergman & Klefsjö, 2001).
Bergman and Klefsjö chose a definition that derives from a common description that
describes product quality as the product’s ability to satisfy customer needs and expectations.
The company has to strive to exceed the expectation of customers to find loyal customers.
Deciding all this explanations we can say the quality of a product is its ability to satisfy and
preferably exceed the customers’ needs and expectations.
2.3.1. Total Quality Management (TQM)
Bergman & Klefjö (2001) explains Total Quality Management (TQM) as a constant
endeavor in fulfilling and preferably exceeding customer’s needs and expectation at the
lowest cost. This is thus achieved by continuous work to which all involved personnel are
committed and focusing on the organizational process. In present day’s competitive global
marketplace, most organization sees quality as an integral part of the business activities
according to the concept of TQM. The concept focuses that organization should actively
build, change and improve the business instead of repairing it.
Total quality management (TQM) further explains that in achieving the said goal, five
different cornerstones in business culture should be applied. These include putting customer
in the centre of business operation, decision based on facts, continuous work process with
improvement as well as creating conditions for participation.
2.3.2. Leadership for Quality Improvement
According to Bergman & Klefjö (2001), successful implementation of continuous
quality improvement in an organization requires total commitment from the top management.
17

8/2/2019 Tez Report Son
http://slidepdf.com/reader/full/tez-report-son 25/69
Visible and active commitment is required from every manager to create culture which puts
customers first. This means that it is important to be able to utilize and develop the
competency in organization and to inspire the employees in participating in different ways.
There are several reasons for this:
• Giving an organization direction by taking advantage of the potential in
individuals (employees) experience and difference, defining goals and following
up with dialogue which makes the employees feel committed and thus creating a
sense of direction in the organization• Having the employees and the organization as a whole move in this direction,
motivating, inspiring and thus hastening the said movement in the direction of the
organization vision.
An organization success depends on the leadership role given by the top management,
the management can provide a supportive role in the quality work that both increase internal
efficiency as well customer satisfaction through commitment and increased knowledge. Thusit is important to motivate everyone in the organization because of the daily involvement in
one way or the other with quality work (Sandholm, 2001).
Bergman & Klefjö (2001) also stated that organizational vision needs to be clarified,
communicated and firmly established with the employees in order for them to move in the
direction of the vision. It requires good ability presenting, communicating and arguing. Thus
the task of the leader is then to motivate and inspire by informing, communicating and
delegating responsibilities and power by making sure that the organizational development
plan is understood and performed by everyone.
2.3.3. Total Productive Maintenance (TPM)
Total Productive Maintenance (TPM) is referred to as maintenance program
involving a newly defined concept for the maintenance of plants and equipments. It is a
18

8/2/2019 Tez Report Son
http://slidepdf.com/reader/full/tez-report-son 26/69
management system for optimizing productivity of manufacturing equipment systematically
with involvement of employees at all levels.
TPM is a tool for improving organization processes, machine, employee or personnel,
which involve everyone keeping the equipment in a good working order to minimize losses
during production, assist set-ups etc. It is built upon three main factors, which are follow-ups
of the functional disturbances, maintenance by operator and team improvement. (Ljungberg,
2000).
2.3.4. Quality of Labor Force
Quality of labor force is one of the most important topic for Small and
Medium Enterprises . In an increasingly competitive global economy, the firm’s success is
dependent on its ability to attract, retain, and engage high-value employees; those who have
the skills, performance and motivation to fully realize the firm’s strategic objectives (Maurer
& Liu, 2007).
2.4. KAIZEN, Continuous Improvement
Kaizen is a system that involves every employee to makes improvement suggestions
on a regular basis. This is not a once a month or once a year activity. It is continuous.
Japanese companies, such as Toyota and Canon, gets a total of 60 to 70 suggestions per
employee per year and these are written down, shared and implemented in the company.
In most cases these are not ideas for major changes. Kaizen is based on making little
changes on a regular basis: Always improving productivity, safety and effectiveness while
reducing waste (Masaaki, 1986).
19
8/2/2019 Tez Report Son
http://slidepdf.com/reader/full/tez-report-son 27/69
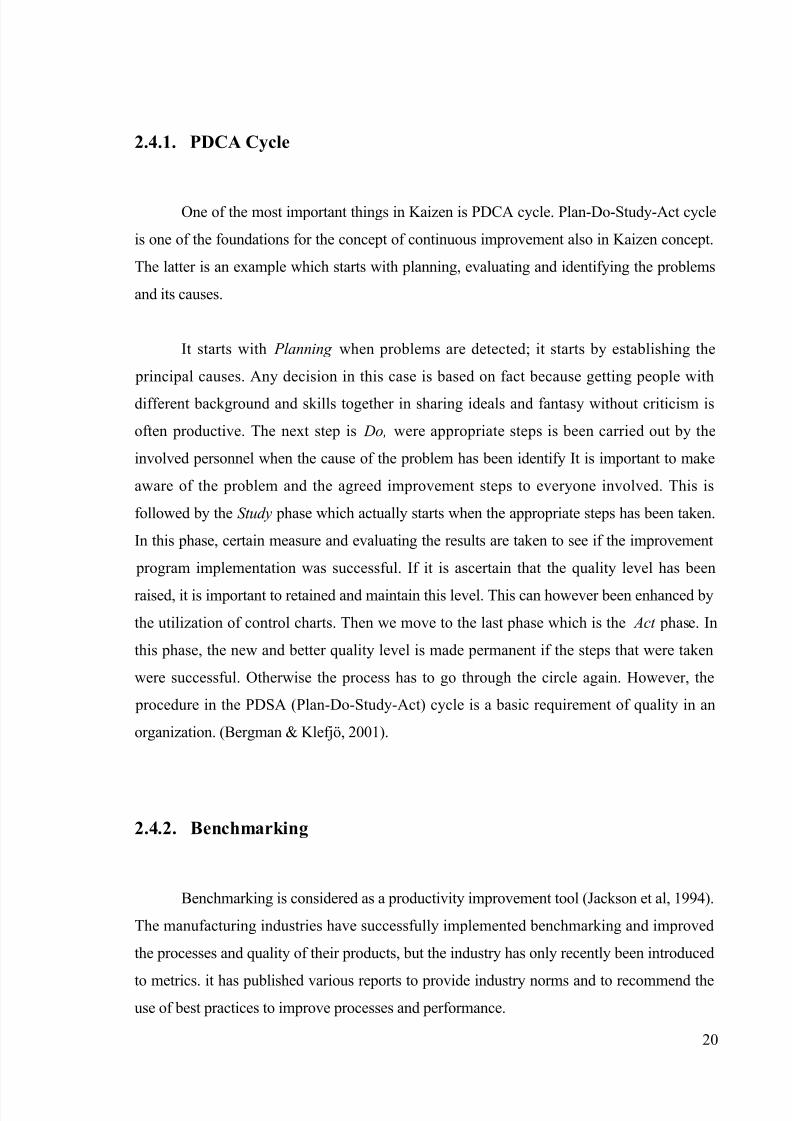
2.4.1. PDCA Cycle
One of the most important things in Kaizen is PDCA cycle. Plan-Do-Study-Act cycle
is one of the foundations for the concept of continuous improvement also in Kaizen concept.
The latter is an example which starts with planning, evaluating and identifying the problems
and its causes.
It starts with Planning when problems are detected; it starts by establishing the
principal causes. Any decision in this case is based on fact because getting people with
different background and skills together in sharing ideals and fantasy without criticism is
often productive. The next step is Do, were appropriate steps is been carried out by the
involved personnel when the cause of the problem has been identify It is important to make
aware of the problem and the agreed improvement steps to everyone involved. This is
followed by the Study phase which actually starts when the appropriate steps has been taken.
In this phase, certain measure and evaluating the results are taken to see if the improvement
program implementation was successful. If it is ascertain that the quality level has been
raised, it is important to retained and maintain this level. This can however been enhanced by
the utilization of control charts. Then we move to the last phase which is the Act phase. In
this phase, the new and better quality level is made permanent if the steps that were taken
were successful. Otherwise the process has to go through the circle again. However, the
procedure in the PDSA (Plan-Do-Study-Act) cycle is a basic requirement of quality in an
organization. (Bergman & Klefjö, 2001).
2.4.2. Benchmarking
Benchmarking is considered as a productivity improvement tool (Jackson et al, 1994).
The manufacturing industries have successfully implemented benchmarking and improved
the processes and quality of their products, but the industry has only recently been introduced
to metrics. it has published various reports to provide industry norms and to recommend theuse of best practices to improve processes and performance.
20

8/2/2019 Tez Report Son
http://slidepdf.com/reader/full/tez-report-son 28/69
Among the various definitions of benchmarking, the committee has adopted the
following definition for benchmarking: “Benchmarking is a systematic process of measuringone’s performance against results from recognized leaders for the purpose of determining
best practices that lead to superior performance when adapted and implemented.”
According to Camp (1989), the types of benchmarking are split into two categories:
What and who compared. Answers of what will be compared are: Performance
benchmarking; compare performance to evaluate and determine the gap with other
organizations. Process benchmarking; compare the practices and methods to learn from “bestin class”. And strategic benchmarking; compare different strategic plans to acquire
information.
Answer of who will be compared against is; Internal benchmarking; compare the
performance or processes among departments, groups, or units within one organization:
Competitive benchmarking; compare the processes or performance against competitors that
provide the same services or products. Functional benchmarking; compare a particular
business function against two or more companies in the same industry and generic
benchmarking; compare against the best organizations, regardless of industry.
2.5. The Seven Management Tools
“The seven management tools” (sometimes called “the seven new QC - tools”) are
primarily compiled to handle unstructured verbal information or verbal data. These tolls are
gathered from various sciences such as behavioral science, operational analysis, optimization
theory and statistics (Bergman & Klefsjö, 2007).
21

8/2/2019 Tez Report Son
http://slidepdf.com/reader/full/tez-report-son 29/69
The seven management tools include the following:
• Affinity diagram
• Tree diagram
• Matrix diagram
• Interrelationship diagram
• Matrix data analysis
• Process decision program chart
• Activity network diagram
2.5.1. Cause-and-Effect Diagram
Cause-and-effect diagram, which is also called a fishbone diagram, is one of “The
seven Improvement Tools”. It is used when root causes of some selected quality problem
have to be found. The causes can be also related to a seven M’s rule, namely: Management,
Man, Method, Measurement, Machine, Material, Milieu. Then we can call such structure a
7Mdiagram (Bergman & Klefsjö, 2007).
2.5.2. Check Sheets
A Check Sheet is used for the purpose of collecting data to compile in such a way as
to be easily used, understood and analyzed automatically. The Check Sheet, as it is being
completed, actually becomes a graphical representation of the data you are collecting,
thus there is no need to use any computer software, or spreadsheet to record the data. It can
be simply done with pencil and paper.
One of the side-effects of using Check Sheets is that the person using it becomes very
aware of the data they capture and can see the patterns of data building up in front of their
eyes (although there is, of course, a danger of seeing patterns where there are none or wherethere is too little data to be significant).
22

8/2/2019 Tez Report Son
http://slidepdf.com/reader/full/tez-report-son 30/69
Check Sheets are sometimes called Data Collection Sheets. They also get called Tally
Charts, although as “tally” means “to count”, these do not strictly include such as Checklistsand Location Plots (Gitlow et al, 2005).
2.6. Facilities Design
Facility design is an important component of business's overall operations, both in
terms of maximizing the effectiveness of production processes and meeting employee needsand desires. According to Weiss is facility layout defined as "the physical arrangement of
everything needed for the product or service, including machines, personnel, raw materials,
and finished goods. The criteria for a good layout necessarily relate to people (personnel and
customers), materials (raw, finished, and in process), machines, and their interactions.",
(Tompkins, 2003). The facilities design can be divided into:
Facilities systems design: Lightning, electricity, communication, life safety systems,
atmospheric systems (for example)
Layout design: Equipment, furnishings, machinery (for example)
Handling system design: Supports the facilities interactions, e.g. equipment-handling systems
(Tompkins, 2003).
2.7. Product, Process and Schedule (PP&S) Design
According to Tompkins (2003) product, process and scheduling design are linked to
facilities planning in a strong way. If all four parts are working together, it helps to
accomplish an efficient production system for a company and to fulfill its vision.
23

8/2/2019 Tez Report Son
http://slidepdf.com/reader/full/tez-report-son 31/69
2.7.1. Product Design
Product design includes determination, which products are to be produced and how
they should look like. The challenge is to create a design that meets a bunch of requirements,
e.g. satisfaction of the customer and adaptability to production needs. The product design is a
basic strategic choice which is normally decided on by the top management with help of
marketing, manufacturing and finance departments.
2.7.2. Process Design
The process design’s task is to determine how to produce the product. That also
includes decision about make-or-buy. After that decision the designer has to identify
important processes and select the required ones. Now they can be sequenced with the help
of different charts, e.g. assembly chart or process chart.
2.7.3. Schedule Design
The first two steps are followed by the schedule design which deals with the
questions of how much and when to produce, (Tompkins, 2003). In other word it means to
transfer the inputs (e.g. material, marketing information) of a manufacturing process into
outputs (products), (Nahmias, 2005). The schedule design decisions include the type and
number of machines, number of employees, space requirements and scrap estimates
(Tompkins, 2003).
2.8. Primary and Support Production Activities
Primary activities in a production are all activities that have a direct influence on the
appearance and shape or physical conditions of the product. These are, for example,machining operations (lathing, milling, drilling), chemical processes or assembling.
24

8/2/2019 Tez Report Son
http://slidepdf.com/reader/full/tez-report-son 32/69
Support activities support the primary processes. That means that they do not create
any new value to the product but still they are as well as the primary activities important for the production process. Examples are transportation or measurements (Buffa, 1975).
2.9. Demand Management
To classify the strategies for satisfying customers’ demand a term called ‘customer
order decoupling point’ is used. At this point an order changed from independent from thecustomer to dependent, which means that then the company is responsible for timing,
quantity of material, purchasing, production and finishing. According to the location of the
decoupling point four different demand strategies can be differentiated: Engineer-to-order,
make-to-order, assemble-to-order, make-to-stock (Vollmann, 2005).
2.9.1. Engineer-to-order
In this case the order decoupling point is moved to the suppliers/engineering, which
means that the whole order is made especially for a specific customer, even the engineering.
This is normally only the case for big individual projects, e.g. atomic power plants. The
product doesn’t exist before the order of the customer. In this case the order decoupling point
is at the suppliers (Vollmann, 2005).
2.9.2. Make-to-order
Using make-to-order approach means that the production for a certain products is
only being started, when the company has an order from a customer. That has the advantage
that only a stock of few finished goods is needed. By constructing the main parts as
25

8/2/2019 Tez Report Son
http://slidepdf.com/reader/full/tez-report-son 33/69
components it is possible to produce many different varieties by using different combinations
(Nicholas, 1998).
2.9.3. Assemble-to-order
Assemble-to-order companies already produce subassemblies according to demand
forecasts. If the company receives an order from a customer, they start to assemble the
subassembly to the customer’s wishes. Examples for this approach are cars or computers. In
this case the decoupling point is at the work-in-progress parts (Nicholas, 1998).
2.9.4. Make-to-stock
The make-to-stock philosophy is used for standardized products with a low
variability. The whole production process is made customer anonymous and all finished good
are made for stock. The production is made on base of forecasts, (Chase, 2006). Thedecoupling point is the finished goods (Vollmann, 2005).
3. EMPIRICAL FINDINGS
A description of the case company which is Kuş Etiket, is given in this chapter.
Relevant descriptions of the company are presented.
26

8/2/2019 Tez Report Son
http://slidepdf.com/reader/full/tez-report-son 34/69
3.1. Description of the Case Company
Kuş Etiket is a textile printing company which is focused on printing on narrow
fabrics, this includes ribbons and labels which is between 3,5 mm to 70 mm. Kuş Etiket’s
motto is “Quality is not surprise, it is experience”. That’s why Kuş Etiket always tries to
provide good quality products with best raw materials and machines in its sector. Kus Etiket
is very open to improvement and in order to achieve that they always search for the new
technologies and products in narrow fabric printing sector. For example, at 2004 Kuş Etiket
produces its silk screen printing machine with the experiences it gained and the flaws both
the manager and foremans observed. At 2005, Kus Etiket imported the first multi colored silk
screen printing machine in Turkey and at 2007, Kus Etiket started to use the transfer printing
on narrow fabrics first in Turkey and begin to develop new ways of using it. Kuş Etiket has
started its operations in 1996 with two printing machines in Eyüp. Three years later company
moved to the Merter. After moving to Merter, company renewed its machines and started to
grow its machine track with new kind of printing machines. The following information gives
us the innovations the company did about the machinery from 1996 to 2008.
1996 - ) One 6 Colored Offset Printing Machine – One Fasco Printing Machine
1997 - ) One Embossing Machine
1998 - ) Two Embossing Machines
1999 - ) One 4 Colored Offset Printing Machine
2000 - ) One Foil Stamping Machine
2001 - ) One 1 Colored Silk Screen Printing Machine – One 6 colored Flekso Machine
2004 - ) One 1 Colored Silk Screen Printing Machine
2005 - ) One 3 Colored Silk Screen Printing Machine
2006 - ) Two Foil Stamping Machines
2007 - ) One Transfer Printing Machine – One Epson Plotter
2008 - ) One Roland Plotter
2008 - ) One Mimaki Plotter – One Two Colored Silk Screen Printing Machine
Today Kuş Etiket continues to improve and increase its machine track. Kuş Etiket’s
current machine track includes; one 3 colored silk screen printing machine, one 2 colored silk screen printing machine, two 1 colored silk screen printing machine, one packing machine,
27

8/2/2019 Tez Report Son
http://slidepdf.com/reader/full/tez-report-son 35/69
one rolling machine, one transfer machine, one 6 colored flekso machine, one 6 colored
rotary offset machine, one 4 colored rotary offset machine, three embossing machines, three
foil stamping machines and three plotter machines.
3.1. Kuş Etiket’s Organizational Structure
Today the company has about 24 employees and is under the management of Cemil
Kuş still a growing company (50% average growth during the last five years). The grand load
is on the general manager as a characteristic of a small enterprise. Production chiefs,designers, and account chief are responsible to the general manager. And during the
production processes chiefs are responsible for the tasks and there is a maintenance expert
responsible from the machinery. The organizational structure due to the given information is
as it is illustrated in the following figure;
FIGURE 3.1. The organizational structure of the company
28

8/2/2019 Tez Report Son
http://slidepdf.com/reader/full/tez-report-son 36/69
3.3. The Facilities Plan
The facilities plan of Kuş Etiket is the result of a sum of smaller changes over the last
years. If new machines are added, they are facilitated to the empty places in the existing area.
So there is no general concept for the whole facility. Today, the company has an area of 550
m2 in total and almost 350 m2 of it is used as production area. Directly used for production
equipment are about 200 m2. The production areas are subdivided according to their function
(e.g. silk screen printing and the other printing types). The structural systems of the facility
are adjusted to the requirements, e.g. stronger air ventilation because of the diffusing smell of
paints. The facilities layout is a typical process layout that is arranged according to their
functions. The facilities plan in a rough estimate, Figure 3.2., illustrates the facilities plan of
the machinery and other layouts in the production area.
29

8/2/2019 Tez Report Son
http://slidepdf.com/reader/full/tez-report-son 37/69
FIGURE 3.2. Facilities Plan of the Case Company
30

8/2/2019 Tez Report Son
http://slidepdf.com/reader/full/tez-report-son 38/69
3.4. Primary Activities at the Production Process
In Kuş Etiket, primary activities of the production process include designing,
producing and packing. First of the most important part of the production process is the
designing the products. The customers either bring their designs or Kuş Etiket designs the
new products. The designs specifications vary with respect to the printing machine.
Second process is the production. The designs are confirmed by the customers in the
previous state, than the production process starts. Production process begins with the
supplying of the raw material. After that, the mold of the design is made for the specific
printing machine. When the mold is ready and the raw material is supplied, the printing
machine is ready to work. The detailed production processes of the products will be given at
the secondary activities in detail. Some products need another process after the printing
which transforms them into the desired product with handwork. These products are lanyards
and bow ties.
Third process is the packing process. The packing process is done with respect to
customer needs and desires. There are several options for several products. Ribbon type
products can be warped into rolls or the products can be sent directly with boxes without
warping. Lanyards can be packet into little bags one by one then put into big boxes or they
can be knotted to 50 to 100 skeins and put into big boxes. The bow can be put into bags or
boxes.
3.5. Sub-Processes at the Production Process
Kuş Etiket produces seven kinds of printed tapes. All of these printing tapes have its’
own printing types.
First one is rotary printed dry offset products. In this type of printed product, the
printing process is done at the rotary offset machine. This printing is not durable, can become off and in this kind of printing you can only print dark colors into light colored ribbons.
31

8/2/2019 Tez Report Son
http://slidepdf.com/reader/full/tez-report-son 39/69
Maximum number of colors used in this kind of printed products is 6. Below are the printing
process and the printing resources that can be used at this printing process.
FIGURE 3.3.1. The printing process for rotary dry offset printing machine
Rotary Dry Offset Printed Products
Fabric Mold Paint Machine
Satin RibbonRotary Dry Offset
MoldPaint
Rotary Dry Offset
Printing Machine
Polyester &
Cotton Ribbons
Viscous
Rubber Ribbon
Velvet
Organza(Tulle)
FIGURE 3.3.2. The printing resources for rotary dry offset printing machine
Second one is flekso printed products. In this type of printed product, the printing
process is done at flekso printing machine. This printing is durable unlike the rotary offset,
but like the rotary offset, printing limitations are same, only six colors and printing done on
the light colored ribbons with dark colored paints. Below are the printing process and the
printing resources that can be used at this printing process.
32

8/2/2019 Tez Report Son
http://slidepdf.com/reader/full/tez-report-son 40/69
FIGURE 3.4.1. The printing process for flesko printing machine
Flekso Printed Products
Fabric Mold Paint Machine
Satin RibbonFlekso Printing
MoldPaint
Flekso Printing
Machine
Polyester &
Cotton Ribbons
Viscous
Rubber Ribbon
Velvet
Organza(Tulle)
FIGURE 3.4.2. The printing resources for flesko printing machine
Third one is embossed products. In this kind of printed product embossing machine is
used. It doesn’t use paint, but it uses two molds. Embossing machine emboss the ribbon with
two molds and heat. The machine squeeze the ribbon inside two mold and heat gives shape.
The printing is very durable. The only color of the printing is the color of the ribbon. Below
are the printing process and the printing resources that can be used at this printing process.
33

8/2/2019 Tez Report Son
http://slidepdf.com/reader/full/tez-report-son 41/69
FIGURE 3.5.1. The printing process for embossing machine
Embossed Products
Fabric Mold Machine
Satin Ribbon Embossing MoldEmbossing
Machine
Polyester &
Cotton Ribbons
Rubber Ribbon
Velvet
FIGURE 3.5.2. The printing resources for embossing machine
Fourth one is the foil stamped products. In this kind of product, foil stamping
machine is used. It doesn’t print the design from the paint, it uses metallic colored foils. With
help of mold, the machine pressures the foil into ribbon with heat. 2 colored products can be
printed but the durability of the foil printing is very low. Below are the printing process and
the printing resources that can be used at this printing process.
34

8/2/2019 Tez Report Son
http://slidepdf.com/reader/full/tez-report-son 42/69
FIGURE 3.6.1. The printing process for foil stamping machine
Hot Foil Stamping P roducts
Fabric M old Paint M achine
Satin R ibbonHot Foil
Stamping M olFoil
Hot Foil Stampi
Machine
Polyester &
Cotton Ribbon
Viscous
Velvet
FIGURE 3.6.2. The printing resources for foil stamping machine
Fifth one is silk screen printed products. In this kind of product, silk screen printing
machine is used. The print of this machine is very durable. Also this machine has the ability
of printing the light colored paints into the dark colored ribbons. This printing type is very
slow, but it compensates this with its wide conveyor bands, which can produce multiple tapes
of ribbon at the same time. This machine can produce three colored products. Below are the
printing process and the printing resources that can be used at this printing process.
35

8/2/2019 Tez Report Son
http://slidepdf.com/reader/full/tez-report-son 43/69
FIGURE 3.7.1. The printing process for silk screen printing machine
Silk Screen Printing Products
Fabric Mold Paint Machine
Satin RibbonSilk Screen
Printing MoldPaint
Silk Screen
Printing Machine
Polyester &
Cotton Ribbons
Viscous
Rubber Ribbon
Velvet
Organza(Tulle)
FIGURE 3.7.2. The printing resources for silk screen printing machine
Sixth one is foil transfer printed products. In this kind of product, two machines are
used. First one is silk screen printing machine. Second one is foil stamping machine. First
step of producing of this product starts with the silk screen printing machine. At this machine
silk screen printing glue is printed into the ribbon. After that, this printed ribbon is taken to
the foil stamping machine. At there, the foil stamping machine heats the ribbon’s glue while
stamping the transfer foil into ribbon. At this machine, for this operation, two separate units
added to increase the efficiency, speed and the quality. This improvement on this machinewill be examined in a different topic. Because of the using of the silk screen printing as the
36

8/2/2019 Tez Report Son
http://slidepdf.com/reader/full/tez-report-son 44/69
main machine, the color limitation is 3. This kind of printed product has a very good
durability. Below are the printing process and the printing resources that can be used at this
printing process.
FIGURE 3.8.1. The printing process for foil transfer printed products
Foil Transfer Printed Products
Fabric Mold Paint - Foil Machine
Satin RibbonSilk Screen
Printing MoldSilk Screen
Printing GlueSilk Screen
Printing Machine
Polyester &
Cotton RibbonsTransfer Foil
Hot Foil
Stamping Machine
Viscous
Rubber Ribbon
Velvet
Organza(Tulle)
FIGURE 3.8.2. The printing resources for foil transfer printed products
Seventh one is transfer printed products. In this kind of product, two machines are
used. First, the plotter machines used to print the desired design into the transfer paper.
Because of the plotter machine which is a gigantic printer, there are no color limitations and
no need for mold at this printing. After that, the printed paper is sent to transfer machine
where the printed papers design is printed on the ribbon with heat. This kind of printing is
37

8/2/2019 Tez Report Son
http://slidepdf.com/reader/full/tez-report-son 45/69
also very durable. Below are the printing process and the printing resources that can be used
at this printing process.
FIGURE 3.9.1. The printing process for transfer printed products
Transfer Printed ProductsFabric Materials Paint Machine
Satin RibbonTransfer Printing
Paper Ink* Plotter Machine
Polyester &
Cotton RibbonsCarriage Paper Transfer Machine
Viscous
Rubber Ribbon
Velvet
Organza(Tulle)
FIGURE 3.9.2. The printing resources for transfer printed products
38

8/2/2019 Tez Report Son
http://slidepdf.com/reader/full/tez-report-son 46/69
3.6. Quality Policy
Quality policy of Kuş Etiket on their website is stated as “Quality is not surprise, it is
experience”. The company manufactures rotary dry offset printed products, flekso printed
products, embossed products, hot foil stamping products, silk screen printing products, foil
transfer printing products, transfer printing products, and bowties lanyard products, through
continuous improvements, achieve a quality level which surpasses the requirements of the
customers. This shall occur through;
• Understanding the requirements of the customers;
• Developing and continuously improving the company’s processes; and
• Effectively taking care of the customers.
3.7. Process Management
They do not have a quality department reserved in the facility. The foremen are in
charge about the processes. Since there are several process types and productions, the
company shelters four foremen even the facility is not big enough. In addition to the
authority of them, the owner of the company is the first person that can charge about the
management of processes.
The processes at the company can be defined as:
• Business Processes
• Production Processes
Each process category includes several cores but the workload generally center on the
owner of the company or the foremen in production processes. The market researches as a
part of business processes are generally done by the owner of the company again.
39

8/2/2019 Tez Report Son
http://slidepdf.com/reader/full/tez-report-son 47/69
3.8. Designs for Quality
The company produces several kinds of products, so that when the company meets a
new product, they adapt the machines for the products and use it for long cycles. The level of
the quality increases by time, since the adaptation of the machines has to be very accurate for
the product type. For this reason, the products and machine are categorized according to the
primary and secondary functions. The company focuses more on the products’ quality when
the machines are reliable enough within their functions. The company has to give importance
to this procedure since they have to consider the time to setup the machines and the defects
through the processes which can be so high and costly.
3.9. Production for Quality
The company has a quality assurance to secure the quality in production which
contains monitoring by foremen and customer assurances after the goods delivered. These
assurance instructions differ within the product types. For instance, when it is so crucial to
monitor for the silk screen printing machines, it is not so crucial to monitor for the rotary dry
offset machine or embossing machine. The Quality control for many products is done by
sight. Every finished product is judged if there are any mistakes or scratches during the
monitoring the processes. If there occurs any defects or bad products, the customers have
right to send it back to the company and change it with new ones or make the company
correct the defects.
40

8/2/2019 Tez Report Son
http://slidepdf.com/reader/full/tez-report-son 48/69
3.10. Product, Process and Schedule Design
In this chapter it is described how the product, process and schedule design at Kuş
Etiket is carried out and how they are integrated in the facilities.
3.10.1. Product Design
As Kuş Etiket is a company producing narrow fabrics for customers with a high
demand on quality and design, they have a high focus on product design. They employ three
designers within the company. For the product developing process that means that focus is
more on shape and material of the furniture, than on functionality and requirements for the
production. But because of the similarity of many products and outsourcing of basic
components the company is able to produce a large variety of products, so that new products
normally can be adapted easily. The product lifecycle at Kuş Etiket is too short, so at least
75-100 new products are launched every year. Some limitations for the designers come from
the customers, which often have to introduce restrictions and desire to be used their own
design which drawn by them.
To stay competitive and create the design customers’ wishes, the company uses an
easy to be used and understandable computer software which is called CorelDraw.
3.10.2. Process Design
If Kuş Etiket has decided to introduce a new product, they first make an analysis of
how they produce it. There is no documentation about the compounds of a product since the
bill of materials is so simple. But some parts used in the production such as paints and
chemicals have at least a product number.
41
8/2/2019 Tez Report Son
http://slidepdf.com/reader/full/tez-report-son 49/69
After designing the product sample the production management starts to think about
the sequences of production steps. As many products are similar they can base their thinking
on existing products. However, there is no operation chart showing for each operation howlong it takes (set-up time and operation time), which equipment and material is used and
what the number of the operation is.
3.10.3. Schedule Design
The products mostly sold to all businesses related to advertisement. There is not aconsistent demand. Almost the whole production is based on demand by the customers. That
means that it is not possible for the company to make exact forecasts for the next periods and
they always have to be aware of uncertainties. From historical data they know what they can
approximately expect for every month to produce but that are only statistical data. After
summer vacations or Christmas the demand is higher than normal. If an order receives it is
checked how long it will need to produce the desired product. The estimations are based on
the available capacity and the production time. The average delivery time is a short time
around 5-7 days since there is an economical crisis in the markets. To manage orders, a
special software is used which is developed by the company, so critical moments can be
checked automatically.
3.11. Quality Control Tools
The workers and especially the foremen in the company observe the processes during
the work time but they do not use well known quality control tools which is a critical
situation to criticize. For this reason, this title will be scrutinized in the analysis chapter in
details.
42
8/2/2019 Tez Report Son
http://slidepdf.com/reader/full/tez-report-son 50/69
3.12. Customer and Customer Satisfaction
Customers play a central role for an organizational success thus Kuş Etiket tries in its
effort to meet their need and expectation, if possible exceed it. Customers are central in Kuş
Etiket’s policy and management system, and customer satisfaction is been considered as
important quality measures, even more. Though some measures might be needed to keep
track of the level of customer satisfaction but the ultimate goal is customer satisfaction for
the company.
43

8/2/2019 Tez Report Son
http://slidepdf.com/reader/full/tez-report-son 51/69
4. ANALYSIS
This chapter aim at analyzing the data obtained from our case company: Kuş Etiket,
about the organizational structure, production process, quality, and continuous improvement
concept.
4.1. Evaluating the Organizational Structure
By looking at the current organizational structure, it is obvious to see the positive and
negative sides of the company. If we mention about the positive sides, the company uses the
advantages of being small and controllable with less struggles and resources. There are three
main bottom units responsible to the general manager, Cemil Kuş. In addition, there are eight
foremen gathered under the responsibility of production chef. Organizational system in the
company according as the simplicity is easy to control and manage.
The company seems flexible enough since they can solve the problems in a short time
by consulting the foremen or the owner of the company easily. However, it is critical to say
whether the company is centralized or decentralized. It seem like the company is
decentralized since the owner is continually working with production chiefs, designers, and
accounting etc. There occurs rarely problems and they can be solved and the necessary
decision makings can be done by the owner of the company immediately. On the other hand,
when the owner of the company is not inside the workshop, there is nobody who is
responsible as much as him, so that Kuş Etiket displays a centralized form. Even the urgent
situations in production hall can be solved by the production chiefs; it is not easy to say it for
the other channels including designing and accounting since they have no authority to make
decisions for the company.
Besides this superficial view, other features of a small and medium enterprise shelters
is also available for Kuş Etiket. For instance, operating is done in limited markets. The
customers are acquired in the vicinity of Istanbul, and a little percent of exporting is done inEurope. There are resource limitations in terms of management, manpower and finance.
44

8/2/2019 Tez Report Son
http://slidepdf.com/reader/full/tez-report-son 52/69
Conversely, the potential of being high innovatory, fire-fighting mentality and dynamic
strategies are the affirmative sides of the case company.
4.2. Evaluating the Processes
As already stated in chapter 3, Kuş Etiket is focusing on increasing customer value in
operations and applying the operations based on the entirety of the operations. The company
has its business divided into two different processes; production process and business
process; this is because of the number of personnel involved in the process or purpose of the process. The person gathering those two under one roof is the owner of the company himself.
The authors state in this report that process management involves certain procedures
which are; organize for improvement, understand the processes, observing the process and
continuously improve the process. This steps or procedures have not been adopted totally by
Kuş Etiket since workflow documentation is not done properly for the processes.
The company is lack of strategic planning and documentation. Especially, the basic
quality control charts are not followed and performed. The proceeds of implementing those
documents such as check sheets etc. are passed over by the company which causes some
weaknesses in business performance and managerial practices. For this reason, it is not
possible to say we observed the process improvements very effectively in terms of quality
and efficiency by regarding the recent years’ data. The continuous improvement seems like
depended on the abilities and personal efforts of the general manager himself, not by the
participation of the whole company.
According to the total quality management concept it is very important to behave like
a team and determine the goals all together. For this reasons, it is complicated to decide
whether the case company follows the general necessities or not, but here is two good study
sample of continuous improvement discovered in the previous years and during our
visitations to the case company which we are so familiar to it. In the next chapter, you will
see some improvements on silk screen printing machine, what advantages it provided, and
45

8/2/2019 Tez Report Son
http://slidepdf.com/reader/full/tez-report-son 53/69
what problems still occurs. After the chapter 4.3, you will see another case (4.3.1) that we are
so familiar (since it has been adapted during our studies at Kuş Etiket). You will additionally
see what problem they faced and how they found a solution to overcome it.
4.3. Evaluating the Improvements
There have been some positive improvements in the evolution of the company that
has been implemented by wise and experienced owner of the company. Here, we will
mention about the improvements that the company did for silk screen printing machine in the previous years.
Improvements on silk screen printing machine:
First silk screen printing machines working principle allows fabric which is moved by
a pulling motor printed under the mold. But because of this reason, fabric slippage is happing
and this affects printings quality and speed. After observing the problems in first machine,
Kuş Etiket decided to produce its on silk screen machine. While designing the machine, Kuş
Etiket used the information that is gathered from the machine operators. From there, a new
machine with new specifications is produced. In this machine, in order to avoid the slippage,
conveyor bands are used. The fabric is pasted into the band and so the fabrics position
became stable while printing. Also the printing principle is changed too. In old machine, the
mold is moving to upwards after every printing operation. New method increased the
production time gravely. In new machine stable mold is used and the production time is
decreased.
Another problem of these machines is multi color functions. In theory, machines can
produce it but in practice, it is impossible to get a healthy product after production is
finished. It is very hard to pair the different color design. That’s why company started its
investigations on the multi colored machines. Multi colored silk screen printing machines
working principle based on the printing stations. There must be separate printing stations on
46

8/2/2019 Tez Report Son
http://slidepdf.com/reader/full/tez-report-son 54/69
the same conveyor band to produce multi colored products. The trick is to print all the colors
before the ribbon exits the machine.
But there is still a problem in this machine. If there is a slippage occurs, the machine
cannot detect and faulty production occurs. To stop this, a machine which s equipped with
sensors is used and the machine automatically adjusted the place of the mold to print the
desired location. Also the new machine uses a motor system to give motion to the conveyor
band while multi colored machine uses gripers to the pull the band. The distance that the
gripper will pull is adjusted manually, on the other hand machine with sensors uses a
program and do this automatically.
4.3.1. A Case Study – Problem and Solution
Improvements on transfer part of the foil stamping machine:
In this machine, there several very important problems that affects the speed and the
quality of the product. The foil is stamped to the ribbons glue during the process. To do this,
machine heats the product’s glue and stamps the foil. But because of the heating problem two
problems occurred. First, because of the insufficient heating the machine speed is decreased
because when the machine speed is increased the ribbon’s glue cannot be heated to the
appropriate temperatures and the foil cannot stamp properly, which leaves on printed parts. If
the heat is increased to achieve this, high heat damages the foil and the fabric.
47

8/2/2019 Tez Report Son
http://slidepdf.com/reader/full/tez-report-son 55/69
FIGURE 4.1. Cause and Effect Diagram on the machine
To have a good product while leaving the heat level at normal points and to avoid
heating problems with the increase of speed, machine is equipped with a panel heater.
FIGURE 4.2. SolidWorks drawing of the panel heater on foil stamping machine
48

8/2/2019 Tez Report Son
http://slidepdf.com/reader/full/tez-report-son 56/69
This heater heats the product before going into the machine and the foil is stamped
without problems. But this time separating the foil and the ribbon after the stamping became
hard because the foil is too hot, so before separating a cooling panel at the end of themachine which cools the product is added before separating. This operations increase the
machine speed 40 % and the quality of the products very dramatically.
4.4. Evaluating the Quality
The quality conception of the company is mentioned in chapter 3 with detailsincluding the title of quality policy, design for quality and production for quality. The part we
will evaluate in this chapter is going to be the quality control tools that we recommend the
company for use.
Even the reliability of the machines used in the workshop is satisfied and well
performed with the sensitivity of electronic devices there should be used modern approaches
to acquire a better quality. The quality observations are carefully done during the processes
by the workers but there is documentation is kept during the operations. Those documents
which are filled correctly during the processes will help the company for the future. All the
product types are almost different in color and designs. However, there are common features
between the products that have been produced for different customers. Besides, it does not
mean that one customer will not demand the same product in the future. That is why we
strongly agree with keeping those check sheets properly by the company during the
production.
The information stored by the company will help them to make decisions orderly. It
will also provide them a good background when they start to gain quality control certificates
and become a well known company that is sheltering quality in their all units and functions.
Figure 4.1. represents a sample of fishbone diagram which is prepared during the analyze of
the problem in chapter 4.3.1 (A Case Study – Problem and solution).
49
8/2/2019 Tez Report Son
http://slidepdf.com/reader/full/tez-report-son 57/69
4.5. Analysis with ProModel Simulation
In order to have a better understanding and get well adjusted data to analyze from the
firm’s production plant, a ProModel simulation is prepared. In this simulation we simulated
the working cycle from the top, which is getting the order, and to the bottom which is
shipping. We simulated the production of a 2 cm width and 5000 m length lot production
order. We chose this data’s because they are the average production lot sizes. The simulation
is run for a month work hours which is 214 hours.
Simulation works like that:
1. Order comes to the sales clerk.
2. Sales clerk send this order to the designers. There are three designers. One of
the designers only works for transfer machine. The other two works for rest of
the machines. 20% of all the order came to transfer machine and the rest 80%
comes to the other machines.
3. The orders are designed at the designers and then they are sent to production
with production center and they begin waiting their resources which is raw
material fabric and mold.
4. After the resource comes, the order placed into the related printing machines’
queue and wait until the machine is available to production.
5. In machine, the product is prepared to printing and then the printing is done.After that the product is sent to packing and the mold is sent to the mold rack.
6. In last step the printed products are packed and sent to shipping.
50

8/2/2019 Tez Report Son
http://slidepdf.com/reader/full/tez-report-son 58/69
FIGURE 4.3. ProModel drawing of the Simulation of Production Place
51

8/2/2019 Tez Report Son
http://slidepdf.com/reader/full/tez-report-son 59/69
From this ProModel simulation we get the following results.
Location NameScheduled
HoursCapacity
Total
Entries
Average
Minutes
Per Entry
% Util
Customer 214,00 1,00 137,00 0.00 0.00
Sales Clerk 214,00 1,00 137,00 0.00 0.00
Designer 1 214,00 1,00 55,00 207.77 89.00
Designer 2 214,00 1,00 50,00 209.37 81.53
Transfer Machine
Designer214,00 1,00 30,00 250.00 58.41
Three Colored
Silk Screen214,00 1,00 14,00 576.99 62.91
Two Colored Silk
Screen214,00 1,00 23,00 280.32 50.21
One Colored Silk
Screen 1214,00 1,00 15,00 587.17 68.60
One Colored Silk
Screen 2214,00 1,00 12,00 672.39 62.84
Silk Screen Queue 214,00 999999,00 64,00 165.84 0.00
Designer Queue 214,00 999999,00 107,00 23.75 0.00
Transfer Designer
Queue214,00 999999,00 30,00 114.50 0.00
Embossing 1 214,00 1,00 3,00 1600.00 37.38
Embossing 2 214,00 1,00 3,00 1600.00 37.38
Embossing 3 214,00 1,00 2,00 1600.00 24.92
Embossing Queue 214,00 999999,00 8,00 0.07 0.00
Foil Stamping
Machine 1214,00 1,00 16,00 489.10 60.95
Foil StampingMachine 2
214,00 1,00 12,00 483.20 45.16
52

8/2/2019 Tez Report Son
http://slidepdf.com/reader/full/tez-report-son 60/69
Foil Stamping
Machine 3214,00 1,00 5,00 451.37 17.58
Foil Stamping
Machine Queue 214,00 999999,00 6,00 0.10 0.00
Plotter Queue 214,00 999999,00 30,00 392.63 0.00
Plotter Machine 1 214,00 1,00 25,00 400.00 77.88
Plotter Machine 2 214,00 1,00 5,00 2121.18 82.60
Transfer Machine 214,00 1,00 29,00 349.66 78.98
Transfer Resource 214,00 999999,00 29,00 0.00 0.00
Transfer Queue 214,00 999999,00 29,00 110.44 0.00
Transfer Foil
Stamping Queue214,00 999999,00 27,00 6,07 0.00
Offset 1 214,00 1,00 14,00 90.00 9,81
Offset 2 214,00 1,00 0,00 0.00 0.00
Flekso Machine 214,00 1,00 8,00 120.00 7,48
Offset Queue 214,00 999999,00 14,00 0.23 0.00
Flekso Queue 214,00 999999,00 8,00 0.24 0.00
Location states by percentage are:
Location NameScheduled
Hours
%
Operation% Idle
Designer 1 214,00 89.00 11.00
Designer 2 214,00 81.53 18.47
Transfer Machine
Designer214,00 58.41 41.59
Three ColoredSilk Screen 214,00 62.91 37.09
53
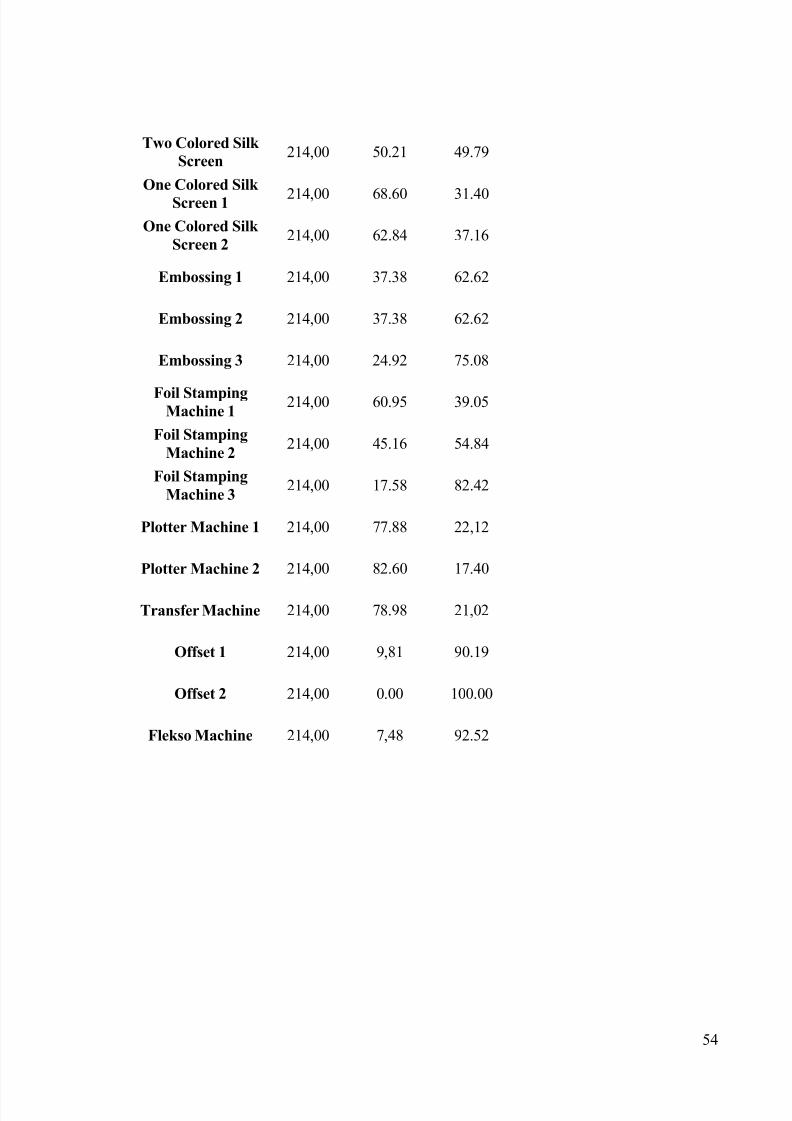
8/2/2019 Tez Report Son
http://slidepdf.com/reader/full/tez-report-son 61/69
Two Colored Silk
Screen214,00 50.21 49.79
One Colored Silk
Screen 1 214,00 68.60 31.40
One Colored Silk
Screen 2214,00 62.84 37.16
Embossing 1 214,00 37.38 62.62
Embossing 2 214,00 37.38 62.62
Embossing 3 214,00 24.92 75.08
Foil StampingMachine 1
214,00 60.95 39.05
Foil Stamping
Machine 2214,00 45.16 54.84
Foil Stamping
Machine 3214,00 17.58 82.42
Plotter Machine 1 214,00 77.88 22,12
Plotter Machine 2 214,00 82.60 17.40
Transfer Machine 214,00 78.98 21,02
Offset 1 214,00 9,81 90.19
Offset 2 214,00 0.00 100.00
Flekso Machine 214,00 7,48 92.52
54

8/2/2019 Tez Report Son
http://slidepdf.com/reader/full/tez-report-son 62/69
5. RESULTS & CONCLUSIONS
The results chapter which is brief and concise, the authors of this study answered the
project task. Describing and analyzing the production process and sub-processes of Kuş
Etiket and scrutinizing the evolution of the company with respect to continuous improvement
concept.
Kuş Etiket has simple processes in their production process and they use the
combination of process structure. There is a top hierarchy in the company which shows it
shelters the basic features of a small company. They integrate different departments in top
management and that is how the company works till now. As we know process is said to be a
set of activities. A bridge between past and the future situation of the organization, determine
the numbers of people that are involves in the process. This categorizes the different ways
that the process is to be carried out. Each employees has it own control instructions
responsibilities in his workshop that are been controlled by production manager.
Mainly the processes are sub-divided into two areas, such as business process and
production process. For a successful process to be done there is the need to synchronize these
processes as they are all important. Example is the role of the process manager which is
process owner, process manager, and being the competence provider.
They have an innovatory view since they have made a lot changes during the recent
years. Especially the owner of the company has decided to those changes and innovations.
They have renewed and modernized their machinery to stay competitive and serve the
customers with best quality. They not only changed the system or tools directly but also they
have done simple but very affective changes in the company. It is obvious to say the owner
of the company knows the importance of continuous improvement himself and makes the
necessary changes, but it is not true to say it for the whole company. It is known as the
destiny of the owner of a small enterprise is the destiny of the company. However, in the
competitive market place, those kind of small enterprises should behave more professional
and do the essential requirements. Thus, combining the theoretical knowledge with the real business cases, Kuş Etiket will become a well-rounded enterprise in advertising markets and
55

8/2/2019 Tez Report Son
http://slidepdf.com/reader/full/tez-report-son 63/69
increase the number of its customers with the popularity it has gained with respect to the
serious quality policies it has obeyed.
During our investigations in the case company we found out that Kuş Etiket is a
classic example of an old and traditional way of thinking and organizing. The company is
well working, has satisfied customers and has on the first sight no urgent problems. But if
you look more in detail you can of course find some trouble spots.
In operating matters it becomes quickly clear that they often use practical and
intuitive methods instead of that what you can learn at university. It is often done the way italways works. But many of the techniques have a reason and a right to exist so they should
probably think about implementing more modern methods in their production and a
contemporary management. Thus, the company can become a well rounded and more
competitive stage in a better position in the market place. Not only the manager himself but
also other members of the company who can bring new ideas and concepts should participate
more.
The customer service is well working according to the close relationship between
company and customers. Because they are working in designs, there is always a strong
communication with the customer and also after the design is finished they stay in contact in
order to get feedback. However, mostly the demanding companies offer their own designs to
Kuş Etiket. The problem in this field is not that the production is not effective in the moment,
but it could be even better by providing more up-dated and communicative ways between the
customers and the company (especially during the design process).
So even if there are no urgent problems at Kuş Etiket’ production and delivery in the
moment, the recommendations are not needed to implement at once. But in order to stay
competitive in the future the company should start invest and improve for the future. The
quality should be followed not only with experience but also the requirements of it should be
followed carefully. We recommend them to store some management tools we mentioned in
previous chapters so that they can achieve a better position as the company. We also
want to mention about a very important factor, employees’ motivation. By giving all
56

8/2/2019 Tez Report Son
http://slidepdf.com/reader/full/tez-report-son 64/69
concerned employees the possibility to participate in the work, the goals are more likely to be
reached.
One more thing which could be improved at the case company is the usage of quite
old machines. That is not a real problem in the moment because capacity utilization is not
extremely high in the moment and therefore doesn’t cause any problems, but if they don’t
invest for the future they could get problems.
5.1. Results of ProModel
Our first intention is to use the ProModel to evaluate the production facilities of Kuş
Etiket and to use the ProModel data to compare with the real time data for making
performance analysis. But because of the current economic depression, the machines are not
working at their optimum production capacities. That’s why we used the ProModel data to
evaluate the machines utilization %, queue length, operational % and idle %.
When we run the model we observed that at the model total number of order entries
to the system from the customers is 137 orders. When we evaluated the data about the
utilization % and operational % of the machines, we saw that for offset machines, for
embossing machines, for one foil stamping machine and for flekso machine the utilization %
and operational % is very low. These machines seems like a burden to the facilities but for
this business sector, the important thing is responsiveness to the customers’ demands which
is product variety and low response time. When we observed this machines burden to the
Kuş Etiket, we saw that for these rarely used machines, Kuş Etiket take some precautions.
All machines with high utilization % and operational % have an operator. These are
silk screen printing machines, plotter machines, transfer machines and foil stamping
machines. Machines with low utilization % and operational % have no personal operator. For
example, flekso machine and offset machines operator is same. Also, foil stamping machines
operator attends all foil stamping and embossing machines as well. This adjustment at Kuş
Etiket affects the performance of the production facilities.
57

8/2/2019 Tez Report Son
http://slidepdf.com/reader/full/tez-report-son 65/69
When we look the designers we saw that the performance of the designers is very
good at Kuş Etiket. When we look at queues of the machines, we observe that the queue of the plotter machine has the longest waiting time. When we look at this fact, we observed that
there is a bottleneck because of the one machines low production capacity. This printing type
is a new type and the demand rate are still uncertain so because of this inconsistency, Kuş
Etiket investment on this printing type is slow. But nowadays, the demand started to become
consistent and that’s why Kuş Etiket begins bigger investment on this printing type. The
latest plotter machine that Kuş Etiket purchased is faster than the old one. From ProModel
we find that new machine is nearly 5 times faster than the old machine.
58

8/2/2019 Tez Report Son
http://slidepdf.com/reader/full/tez-report-son 66/69
6. REFERENCES
Ateş, M.R. (2007), “Kobi Doktoru: 155 Kritik Soru”, Hayat Yayıncılık İletişim Yapım,
Eğitim Hizmetleri ve Tic. Ltd. Şti.
Bergman, B., Klefsjö, B. (2001), “Quality from Customer Needs to Customer Satisfaction” ,
2nd Edition, Studentlitteratur , Lund.
Bernolak, I. (1991), “Productivity Measurement and Analysis: New Issues and Solutions”,
Asian Productivity Organization, Tokyo.
Buffa, E.S. (1975), “Basic Production Management”, 2nd ed., New York: John Wiley &
Sons, Inc.
Camp, E., Clare, P. (1989), “System Analysis and Design”, New York: Prentice Hall
Chase, R.B., Jacobs, F.R., Aquilano, N.J. (2006), “Operations Management for Competitive
Advance”, 11th ed ., New York: McGraw-Hill/Irwin.
Clark, K.B., (1996), “Competing through Manufacturing and the New Manufacturing
Paradigm: Is Manufacturing Strategy Passé? Production and Operations Management ”,5(1),
p.42-58.
Coyle, J.J., Bardi, E.J., Langley, J. (2003), “The Management of Business Logistics” , NY,USA: Thomson South-Western.
Eunni, R.V., Brush, C.G., Kasuganti, R.R. (2007), “International Journal of Emerging
Markets: Small and Medium Enterprises in emerging Markets” Vol.2
Georgellis, Y., Joyce P., Woods A. (2000), “Entrepreneurial Action, Innovation and Business
Performance: The Small Independent Business”, Journal of Small Business and Enterprise Development, Vol. 7
59

8/2/2019 Tez Report Son
http://slidepdf.com/reader/full/tez-report-son 67/69
Gitlow, Howard S., Oppenhiem, Alan J., Oppenhiem, Rosa, Levim, David M., (2005),
“Quality Management”, 3rd Edition, Mcgraw-Hill.
Glancey, K., Greig, M., Pettigrew, M. (1998), “Entrepreneurial Dynamics in Small Business
Service Firms”, International Journal of Entrepreneurial Behavior & Research, Vol. 4
Grünberg, T. (2004), “Performance Improvement: Towards a Method for Finding and
Prioritising Potential Performance Improvement Areas in Manufacturing Operations”,
International Journal of Productivity and Performance Management , Vol. 53, No. 1: 52 – 71.
Jackson, T. J. (1994), “ESTAR: A Synthetic Aperture Microwave Radiometer for Remote
Sensing Applications”, Proc. IEEE, 82, 1787–1798
Jennings, P., Beaver, G. (1997), “The Performance and Competitive Advantage of Small
Firms: A Management Perspective”, International Small Business Journal, Vol. 15
Jones, O., Tilley, F. (2003), “Competitive Advantage in SMEs: Organizing for Innovation
and Change”, John Wiley & Sons Ltd, England
Kaplan, R. S., Norton D.P. (1996), “Translating Strategy into Action: The Balanced
Scorecard ”, ISBN 0-87584-651-3.
Kaydos, W. (1991), Measuring, Managing, and Maximizing Performance. Atlanta, GA:
Productivity Press.
Ljungberg, Ö. (2000), “Total productive maintenance: The road to continuous
improvement”, Studentlitteratur. Lund.
Masaaki, I. (1986), “Kaizen: the key to Japan’s Competitive Success” , NY, USA: McGraw-
Hill/Irwin.
60

8/2/2019 Tez Report Son
http://slidepdf.com/reader/full/tez-report-son 68/69
McAdam, R. & Bailie B. (2002), “Business Performance Measures and Alignment Impact on
Strategy: The Role of Business Improvement Models”, International Journal of Operationsand Production Management , Vol. 22, No. 9: 972 – 996.
Neely, A. (1999), “The Performance Measurement Revolution: Why Now and What Next?”
International Journal of Operations and Production Management , Vol. 19, No. 2: 205 – 228.
Nicholas, J. (1998), “Competitive Manufacturing Management-Continuous Improvement,
Lean Production, and Customer Focused Quality”. USA: The McGraw-Hill Companies.
Nooteboom, B. (1994), “Innovation and Diffusion in Small Firms, Theory and Evidence:
Small Business Economics”, Vol. 6
Pasanen, M. (2003), “In Search of Factors Affecting SME Performance: The Case of Eastern
Finland” University of Kuopio, ISBN 951-781-980-3.
Rutherford, M.W., Oswald, S.L. (2000), “Antecedents of Small Business Performance”, New
England Journal of Entrepreneurship, Vol.3, No.2
Sandholm, L. (2000), “Total Quality Management”, Studentlitteratur, Lund.
Storey, D.J., (2003), “Understanding the Small Business Sector”, Routledge, London.
Tompkins, J.A., White, J.A., Bozer, Y.A., Tanchoco, J.M.A. (2003), “Facilities Planning”,
3rd ed ., New York: John Wiley & Sons, Inc.
Vollmann, T.E., Berry, W.L., Whybark, D.C., Jacobs, F.R. (2005), “Manufacturing Planning
and Control for Supply Chain Management”, 5th ed ., New York: McGraw-.Hill/Irwin.
Woodcock, D.F., Mosey, S.P., Wood, T.B.W. (2000), “New product development in British
SMEs”, European Journal of Innovation Management , Vol.3 No.4
61

8/2/2019 Tez Report Son
http://slidepdf.com/reader/full/tez-report-son 69/69