Texas Transportation Institute - TTI Group Websites · Area Fleet Profile and Analysis ... 2...
51
TEXAS TRANSPORTATION INSTITUTE THE TEXAS A&M UNIVERSITY SYSTEM COLLEGE STATION, TEXAS Transportation Institute Texas Draft Report Emissions Implications and Control Strategies for Old Imported Light Duty Vehicles Assistance ID Number: X4-96657901-0 Conducted for the U.S. EPA- Region 6 August 31, 2009
Transcript of Texas Transportation Institute - TTI Group Websites · Area Fleet Profile and Analysis ... 2...

TEXAS TRANSPORTATION INSTITUTETHE TEXAS A&M UNIVERSITY SYSTEM
COLLEGE STATION, TEXAS
TransportationInstituteTexas
Draft Report Emissions Implications and Control Strategies for
Old Imported Light Duty Vehicles
Assistance ID Number: X4-96657901-0
Conducted for theU.S. EPA- Region 6
August 31, 2009

Emissions Implications and Control Strategies for Old Imported Light Duty Vehicles
by
Mohamadreza Farzaneh, Ph.D. Assistant Research Scientist
Center for Air Quality Studies, Texas Transportation Institute Tel.: (512) 467-0946 Email: [email protected]
Monica Beard-Raymond
Assistant Research Scientist Center for Air Quality Studies, Texas Transportation Institute
Tel.: (512) 467-0946 Email: [email protected]
Carlos Duran Graduate Research Assistant
Research and Implementation Division, Texas Transportation Institute Tel.: (915) 532-3759 Email: [email protected]
Josias Zietsman, Ph.D., P.E.*
Center Director Center for Air Quality Studies, Texas Transportation Institute
Tel.: (979) 458-3476 Email: [email protected]
* Principal Investigator and Corresponding Author

i
TABLE OF CONTENTS List of Figures ................................................................................................................................ ii List of Tables ................................................................................................................................. ii 1. Executive Summary ..................................................................................................................3 2. Background Information..........................................................................................................5
Old Imported Light Duty Vehicles ............................................................................................. 5 Vehicle Permits and Environmental Regulations in Mexico .................................................. 7
El Paso Border Area and Crossings ............................................................................................ 7 In-use Emissions Measurement .................................................................................................. 9 Data Analysis Using Methodology from EPA’s MOVES Model ............................................ 13
3. Area Fleet Profile and Analysis .............................................................................................15 Cuidad Juárez Fleet Characteristics .......................................................................................... 15 Imported Vehicles Crossing the Border .................................................................................... 18
4. In-Use Testing: Preparation and Procedures .......................................................................23 Preparation for In-use Testing .................................................................................................. 23
Testing Location and Traffic Management Plan .................................................................. 23 Recruitment of OILDVs ....................................................................................................... 25 Drive Cycle Development..................................................................................................... 26
In-Use Testing ........................................................................................................................... 28 Testing Equipment ................................................................................................................ 28
SEMTECH-DS ................................................................................................................. 28 OEM-2100 Axion System................................................................................................. 29
5. Results ......................................................................................................................................31 Modal Emissions ....................................................................................................................... 31 Comparison to U.S. Vehicles .................................................................................................... 34 Average Daily Impact ............................................................................................................... 37 Estimating the Total Emissions Impact of the OILDV Fleet .................................................... 40
6. Concluding Remarks ..............................................................................................................43 7. Recommendations ...................................................................................................................45 8. Acknowledgements .................................................................................................................47 Appendix A ...................................................................................................................................49

ii
LIST OF FIGURES Figure 1. Ports of Entry in El Paso-Cuidad Juárez. ....................................................................... 9 Figure 2. Imported versus Nationally Sold Vehicles in Cuidad Juárez. ...................................... 16 Figure 3. Model Year by Decade for Vehicles in Cuidad Juárez. ............................................... 16 Figure 4. Distribution of the Model Year of Vehicles in Cuidad Juárez. .................................... 17 Figure 5. Vehicles in Cuidad Juárez with Verification of Emissions Compliance. ..................... 18 Figure 6. Texas Vehicle Plates (U.S.) (a), Border Vehicle Plates (MX) (b), National Vehicle
Plates (MX) (c). ................................................................................................................ 19 Figure 7. Vehicles Surveyed at Border Crossings by Model Year . ............................................ 20 Figure 8. Top Ten Vehicle Makes of OILDVs Surveyed Crossing the Border. .......................... 21 Figure 9. Top 20 Models Surveyed Crossing the Border. ........................................................... 21 Figure 10. Site Location of Road Testing, US 54. ....................................................................... 24 Figure 11. Truck Mounted Attenuators with Warning Signs. ..................................................... 25 Figure 12. Speed Profiles of the Driving Events used in This Study. ......................................... 27 Figure 13. TTI’s SEMTECH-DS .................................................................................................. 28 Figure 14. TTI’s OEM-2100 ......................................................................................................... 29 Figure 15. Test Vehicles Post-Installation .................................................................................... 30 Figure 16. Observed Average Modal Emission Rates for 1993 Ford Explorer (Vehicle 1). ....... 32 Figure 17. Observed Average Modal Emission Rates for the 2000 Ford F-150 (Vehicle 5). ..... 33 Figure 18. CO2 and NOx Emissions Compared to Corresponding MOBILE6.2 Emissions
Factors. .............................................................................................................................. 35 Figure 19. CO and THC Emissions Compared to Corresponding MOBILE6.2 Emissions
Factors. .............................................................................................................................. 36 Figure 20. PM Emissions Compared to Corresponding MOBILE6.2 Emissions Factors. .......... 37 Figure 21. Sample Speed Profiles for a Complete Cross-Border Trip. ....................................... 38 Figure 22. Average Daily Emissions Impacts of OILDVs in El Paso. ........................................ 39
LIST OF TABLES Table 1. NAFTA Requirements on Importation of Used Vehicles into Mexico. .......................... 6 Table 2. PEMS Emissions Measurement Instruments. ................................................................ 11 Table 3. MOVES Operating Mode Bin Definitions for Running Emissions. ............................. 14 Table 4. Registered Vehicles in Cuidad Juárez by Vehicle Plate Type. ...................................... 15 Table 5. Vehicles Surveyed Crossing from Cuidad Juárez into El Paso. .................................... 19 Table 6. Test Vehicles’ Information. ........................................................................................... 26 Table 7. MOVES Vehicle Parameters Values. ............................................................................ 31 Table 8. Emissions Impact of OILDV Fleet ................................................................................ 40 Table 9. Contribution of OILDVs to Overall Emissions ............................................................. 41 Table A.1. Validation Results: Total Emissions Change from Observation. .............................. 49 Table A.2. Average Daily Emissions Impact of OILDVs in the El Paso-Juarez Area. ............... 49

3
1. EXECUTIVE SUMMARY The Texas Transportation Institute (TTI) conducted a study on the emissions impact of old imported light duty vehicles (OLIDVs) crossing the U.S.-Mexico border. More than 2.6 million used vehicles were imported from the United States to Mexico from January 2005 to February 2008. The maintenance levels of these vehicles are suspect and many of them have been stripped of catalytic converters or other emissions-reducing technologies, greatly increasing their emissions levels. It is estimated that a considerable number of these vehicles are still imported to Mexico and a large number of these vehicles cross the U.S. border on a daily basis driven by people living in Mexico who commute to U.S. border cities for employment, business, shopping, recreational, or other purposes. The study focuses on the El Paso-Ciudad Juárez border area. El Paso is currently categorized as nonattainment for particulate matter (PM) and border crossing activities directly impact El Paso’s air quality and attainment status. This study quantified the number and types of old imported Mexican vehicles crossing the U.S.-Mexico border on a daily basis, estimated their emissions, and quantified their emissions impact. Vehicle fleet information was derived from the state of Chihuahua’s database and several surveys collected by the research team at ports of entry (POEs) in El Paso. Five imported light-duty vehicles representing common makes and models were tested with portable emissions measurement systems (PEMS) units for emissions behavior. PEMS collected second-by-second emissions of oxides of nitrogen (NOx), hydrocarbons (HC), carbon monoxide (CO), PM and carbon dioxide (CO2). CO2 emissions served as a proxy for fuel consumption testing. The collected emissions data were analyzed according to the operating modal bin concept implemented in the Environmental Protection Agency’s (EPA) Motor Vehicle Emissions Simulator (MOVES) model. The second-by-second emissions rates were grouped into operating mode bins based on their corresponding vehicle specific power (VSP) and speed values. Modal average emissions rates were then estimated for each bin using all the observations that were in that modal bin. The research team developed and implemented a data collection and data analysis methodology based on the EPA’s MOVES model’s analysis framework. The methodology is based on the concept of second-by-second modal emissions rates based on VSP. Driving patterns were developed to cover broad range of drayage trucks operational modes. The methodology significantly reduces the duration of the data collection effort. The gaseous (CO2, CO, NOx, and total HC [THC]) and PM emissions rates were measured using two PEMS units. Using the previously mentioned VSP-based approach, the collected emissions data were grouped into operating mode bins according to criteria used in EPA’s MOVES model and average emissions rates for each bin were calculated from all the observations that were within that operating mode bin. The research team found that the operating mode bins provide satisfactory estimates for OILDV fleets operating at the U.S.-Mexico border. Two cycle-based analyses were performed using the MOBILE6.2 drive cycles and OILDV speed profiles that were collected using a

4
Global Positioning System (GPS) technology. The results show that high emitters are major contributors to THC, CO, and gasoline PM emissions in the border region. It is recommended to consider an inspection and maintenance (I/M) type program to identify these high emitter vehicles.

5
2. BACKGROUND INFORMATION This section provides the background information necessary to understand the significance of the project and the reasoning behind the project’s approach and methodology for evaluating the emissions of old imported vehicles. The section on OILDVs explains the policies affecting these vehicles, and the border area and crossing information illustrates where they operate and why this project focuses on the El Paso-Cuidad Juárez area. Vehicle emissions measurement is a highly technical endeavor. The remaining sections on in-use testing and EPA’s MOVES model methodology, serve to provide the background information necessary to understand the scientific approach underlying the project’s methodology.
OLD IMPORTED LIGHT DUTY VEHICLES Between 2005 and 2008, more than 2.6 million used light-duty vehicles and trucks were imported from the U.S. to Mexico.1 These OILDVs were at least 10-to-15 years old. A popular place to obtain these vehicles are auctions where most of them are sold as salvage with the specification that the vehicle only can be exported outside the U.S. The maintenance levels of these vehicles are suspect and many of them have been stripped of catalytic converters or other emissions-reducing technologies, greatly increasing their emissions levels.2 However, these used vehicles are significant lower in cost and are thus in demand in Mexico and other Latin American countries. It is estimated that a large number of OILDVs cross the U.S. border on a daily basis driven by people living in Mexico and commuting to U.S. border cities for employment, business, shopping, recreation, or other purposes. These vehicles could negatively impact the air quality in border areas such as El Paso-Ciudad Juárez. El Paso is currently categorized as nonattainment for PM and recently achieved attainment with CO.
Restrictions on Imported Vehicles
Mexico’s Automotive Decree of 1989 had set a 20 percent limit for vehicle imports into the Mexican market. The North American Free Trade Agreement (NAFTA), signed on December 17,1992, allowed Mexico to retain the vehicle import limits of the 1989 Automotive Decree until January 1, 2009, after which Mexico will be required to begin the incremental elimination of automobile import limits that are considered inconsistent with NAFTA provisions. NAFTA’s Appendix 300 A-2 established that in January 1, 2009 states that “Mexico may not adopt or maintain a prohibition or restriction on imports from the territories of Canada or the United States of originating used vehicles that are at least 10 years old.”3 The program continues with the scheduled elimination of import barriers for newer models every two years. Table 1 shows the NAFTA requirements for vehicles imported into Mexico. 1 Ministry of Finance and Public Credit of Mexico. Database of Imported Used Vehicles. Requests for public
information on September 29, 2008. 2 Dall'Asta, Roberto A, et al. An Assessment of Environmental Effects of the 2005 Mexican Automotive Decree.
EPA. s.l., University of Wisconsin-Madison, 2006. 3 North American Free Trade Agreement, Appendix 300-A2 – 24.

6
Table 1. NAFTA Requirements on Importation of Used Vehicles into Mexico. Transition Date Age of Vehicle Allowed
2009 10 years and older 2011 8 years and older 2013 6 years and older 2015 4 years and older 2017 2 years and older 2019 No restriction
Source: North American Free Trade Agreement Secretariat. In 2005, the former Mexican president issued an Automotive Decree opening Mexico’s borders to the import of used vehicles 10-to-15 years old. The decree’s objective is to allow the acquisition of used vehicles at lower prices to benefit low income families.4 According to an estimate from Los Angeles Times, there are approximately 100 million used vehicles in the U.S. that may now be legally imported into Mexico under this decree.5 There is also significant illicit trafficking of vehicles from the U.S. to Mexico. It is estimated that the majority of the approximately 200,000 vehicles that are stolen and exported from the U.S. are destined for Mexico.6 On April 26, 2006, a secondary Mexican decree was published to regulate the numerous used vehicles in the border region of Mexico illegally. This new decree allows the importation of light-duty vehicles assembled or made in the U.S., or Canada to Mexico with model year ranges from five-to-nine years old from the date of import. These imported vehicles are available only to the population living at the northern border region of Mexico.7 The border region is delineated as the 20 kilometers parallel to the country’s northern boundary. These imported five-to-nine year old vehicles can travel to the interior of Mexico with special temporarily permits when requested. The country’s latest automotive decree in 2008 allowed the import of vehicles 1998 or older. However, the cost of importation increased more than 200 percent as a way to restrict salvage vehicles from entering the country.
4 Diario Oficial de la Federación, Constitutional Government of the United Mexican States. Tomo DCXXIII, No.
16. Mexico, DF. August 22, 2005. 5 Dickerson, Marla and Enriquez, Sam. “Mexico Clears Road for Used Cars.” Los Angeles Times. August 23,
2005. 6 Clarke, R., and R. Brown. “International Trafficking in Stolen Vehicles.” Crime and Justice. 2003, Vol. 30, pp.
197-228. 7 Diario Oficial de la Federación, Constitutional Government of the United Mexican States. Tomo DCXXXI, No.
18. Mexico, DF. April 26, 2006.
7
Vehicle Permits and Environmental Regulations in Mexico Similar to the U.S., each state in Mexico has its own distinguishing plates. State registered vehicles, termed “Nacionales” in Spanish, are domestic or have been imported from the U.S. or Canada under the guidelines of Mexico’s 2005 Decree. Vehicles registered under the 2006 Decree can only circulate in the border region, and these vehicles are called border vehicles or “Fronterizos” in Spanish. These border vehicles can be five-to-nine years old at import versus state registered vehicles that are older. Vehicles imported to Mexico are subject to environmental permit regardless of the vehicle registration or its corresponding plates. However, the regulations are not strictly enforced and only a small portion of vehicles are tested for emissions. In 2007, the total number of vehicles inspected in Ciudad Juárez was 56,052 vehicles out of a pool of 440,223. Only 12.7 percent of the total fleet in the city complied with environmental regulation.8
EL PASO BORDER AREA AND CROSSINGS This study focuses on the El Paso-Ciudad Juárez border area. The area is home to a large population and has significant cross-border traffic. El Paso is currently categorized as nonattainment for PM and cross border traffic directly impacts El Paso’s air quality and attainment status. In 2008, El Paso had the most border crossings by personal vehicles of any U.S. POE, with more than 13.7 million vehicles crossing the border that year.9 A large population on both sides of the border contributes to the number of crossings. El Paso and Ciudad Juárez comprise the second largest bi-national metropolitan area on the border between the U.S. and Mexico with a combined population of about 1.9 million in the 2000 census. Ciudad Juárez is the largest city in the state of Chihuahua and the fifth largest city in Mexico. El Paso is currently the sixth largest city in Texas and the 21st largest city in the U.S. Most of the area’s population resides in Ciudad Juárez, with a 2005 population of 1.3 million.10 Ciudad Juárez has also experienced considerable growth, which further highlights the need to examine the impact of OILDVs. In 2007, El Paso County had approximately 568,357 vehicles
8 Programa de Verificacion Vehicular de Emisiones Vehiculares 2008-2010. General Directorate of Civil
Protection and Ecology, Ciudad Juarez, 2008. 9 U.S. Department of Transportation, Research and Innovative Technology Administration, Bureau of
Transportation Statistics, Border Crossing/Entry Data. Based on data from the U.S. Department of Homeland Security, Customs and Border Protection, OMR database.
10 Instituto Nacional de Estadistica Geografica e Informatica (INEGI) II Population and Housing count 2005. Mexico and its municipalities, February 2008.

8
operating from the northern side of the border.11 More than 440,000 vehicles are registered in Ciudad Juárez in 2008.12 There are four major POEs between El Paso and Ciudad Juárez. Each POE serves a different transportation sector and in some cases, the traffic is restricted to only one direction or to a certain type of traffic with restriction in the hours of operation. Figure 1 shows a map of the area’s border crossings. The Bridge of the Americas (BOTA) and the Ysleta-Zaragoza Bridge are considered the largest commercial POEs along the U.S.’s southern border. Both POEs serve non-commercial traffic 24 hours a day, 7 days a week. However, commercial traffic is allowed only during certain hours six days a week. BOTA is the only non-tolled POE in El Paso. The Paso Del Norte (PDN) Bridge and Good Neighbor Bridge (Stanton Street Port) are located in the downtown area, and are dedicated to non commercial vehicles and pedestrians. The Paso del Norte Bridge allows vehicle traffic to travel northbound while the Good Neighbor Bridge allows for southbound vehicle traffic. These bridges are open 24 hours a day, 7 days a week. Each month an average of more than 1 million crossings are made by personal vehicles at the border. A large portion of the traffic is Mexican vehicles from the state of Chihuahua and American vehicles from Texas and New Mexico.
11Data provided by theTexas Department of Transportation, Texas Motor Vehicle Registration 2007. 12 Data provided by the state of Chihuahua, Minsitry of Finance and Administration (Chihuahua Secretaria de
Finanzas y Adminstracion).

9
Figure 1. Ports of Entry in El Paso-Cuidad Juárez.
IN-USE EMISSIONS MEASUREMENT Direct vehicle emissions measurements are either performed in a laboratory with a chassis or engine dynamometer or occur during in-use operation with a PEMS unit. This project used PEMS units to test the emissions from five OILDVs. CO2 emissions are used as a proxy for fuel consumption. EPA and the Intergovernmental Panel on Climate Change (IPCC) estimate that 99 percent of carbon in the fuel is oxidized, which indicates that CO2 emissions are appropriate for estimating fuel consumption.13 PEMS has a secure foothold within transportation and air quality science. PEMS testing has been used since the late 1990’s for providing real-world emissions information. Several studies have confirmed the validity and reliability of PEMS testing, including EPA’s large scale study of light-duty vehicles in Kansas City which found that PEMS compared favorably to the chassis dynamometer testing of 480 vehicles.14 Both EPA and the California Air Resources Board (CARB) employ PEMS testing for in-use compliance of heavy-duty diesel vehicles for
13 U.S. EPA. “Emission Facts: Average Carbon Dioxide Emissions Resulting from Gasoline and Diesel Fuel.”
http://www.epa.gov/otaq/climate/420f05001.htm, accessed August 2009. 14 Younglove, T., G. Scora, and M. Barth. “Designing On-road Vehicle Test Programs for Effective Vehicle
Emission Model Development.” Transportation Research Record: Journal of the Transportation Research Board, No.1941, 2005, pp. 51-59.
Bridge of the Americas
Paso Del Norte Bridge
Good Neighbor Bridge
Ysleta-Zaragoza Bridge

10
all criteria pollutants except PM.15,16 PEMS has several advantages for emissions measurement, including the technology’s ability to:
• provide accurate data cost-effectively;
• capture real-world emissions;
• supply data on emissions, activity, and environmental data simultaneously;
• test vehicles at any location, including where the emissions normally occur; and
• test large vehicles more easily.
EPA’s In-Use Testing Program sets guidelines for PEMS testing, which are provided in 40 CFR Part 1065, Subpart J. The regulations provide exhaust flow measurement specifications, establish PEMS performance standards and outline the procedures for system calibration, verification, and conducting the actual PEMS test. The regulations also specify the instrumentation components that are acceptable for PEMS emissions measurement. Table 2 outlines the instrument system for each pollutant, along with a column for TTI’s SEMTECH-DS unit.
15 On-Road Heavy-Duty Diesel Engine In-Use Compliance Program Homepage. California Environmental
Protection Agency Air Resource Board. Updated July 18, 2007. http://www.arb.ca.gov/msprog/onroadhd/hdiut.htm, accessed August, 2009.
16 Heavy Trucks, Buses, and Engines Homepage. U. S. Environmental Protection Agency. http://www.epa.gov/otaq/hd-hwy.htm, accessed August 2009.

11
Table 2. PEMS Emissions Measurement Instruments. Pollutant EPA’s Acceptable
Instrument for Measurement
Description TTI’s SEMTECH-DS System17
NOx Chemiluminescence detector (CLD) or non-dispersive ultra-violet dectector (NDUV)
NOx is typically measured as the sum of NO and NO2. CLDs convert NO2 to NO and measure NO emissions. NDUV measures NO and NO2 directly.
NDUV
CO Non-dispersive infrared detector (NDIR)
Infra-red light is pulsed through a gas sample to alternately detect CO and CO2 concentrations.
NDIR
NMHC Flame ionization detector (FID)
FID is a gas chromatographic detector used for individual hydrocarbon speciation and detection.
FID*
* The SEMTECH-DS FID provides THC concentrations.
PM measurements have been more of a challenge for PEMS and thus have been delayed for use in the compliance program. The pilot program for PEMS PM measurement for compliance purposes and the determination of accuracy margins for PM are currently underway. Some PEMS units, such as the “Montana” and “Axion” systems manufactured by Clean Air Technologies, International do measure PM mass through light scattering techniques. While these systems are not yet approved for in-use compliance purposes for PM measurement, they are commonly used in academic research. One of the central advantages of PEMS testing is its ability to characterize in-use emissions. The systems captures second-by-second data on emissions, operational, and environmental data simulataneously, which allow for emissions studies to more closely link vehicle operations and road conditions to emissions behavior. Several PEMS studies have demonstrated the importance of vehicle operation as a crucial component of emissions behavior. TTI has conducted more than a dozen PEMS studies, some of which have challenged previous assumptions and provided interesting insights. For example, a study on Mexican trucks found that they do not typically have elevated emissions when compared to their U.S. counterparts.18 A separate study examining Mexican trucks emissions using various types of fuel also found that using Mexican fuel (PEMEX), which has higher sulfur levels than ultra-low sulfur diesel
17 Technical Support Document. In-Use Testing Program for Heavy-Duty Diesel Engines and Vehicles. U.S.
Environmental Protection Agency, EPA420-R-05-006, June 2005. 18 Zietsman, J., J. Villa, T. Forrest, and J. Storey. Mexican Truck Idling Emissions at the El Paso - Ciudad Juarez
Border Location. Southwest Region University Transportation Center, Report No. SWUTC/05/473700-00033-1. The Texas A&M University System, College Station, TX, November 2005.

12
(ULSD) fuel, did not translate into the expected higher PM emissions or increased air toxic levels.19 One important aspect of PEMS testing is the drive cycle of the vehicle. Drive patterns differ by vehicle type, which greatly affects emissions.20 While some tests have been conducted in traffic under real-world conditions, this method of testing can be particularly difficult due to the sensitive nature of the PEMS equipment.21 An alternative option is to conduct testing on a track or low-traffic area with a pre-determined drive cycle. Drive cycles are often created to mirror typical driving patterns by incorporating GPS data collected over a period of time. Using a track with a pre-determined drive cycle provides three primary advantages. Pre-determined drive cycles reflect averaged driving patterns instead of reflecting the conditions of a single testing period that may prove to be an atypical day. A developed drive cycle can also allow for the replication of tests easily. Under real-world conditions, the timing of lights and flow of traffic would be a few factors that would make comparisons between tests difficult. Perhaps the most important advantage of a developed drive cycle is the ability to test vehicles under a wide variety of driving behavior and conditions. High-powered events are particularly recommended for testing because there is a general lack of emissions data for these higher emitting events. One study recommends the use of air conditioning and a series of accelerations up to freeway speed at 50 percent throttle, 75 percent throttle, 90 percent throttle and wide open throttle to ensure that even atypical events are measured.22 Many TTI studies have employed the use of drive cycles to ensure data quality and account for the full range of vehicle operation.23, 24
19 Zietsman, J., M. Farzaneh, J. Storey, J. Villa, M. Ojah, D. Lee, and P. Bella. Emissions of Mexican-Domiciled
Heavy-Duty Diesel Trucks Using Alternative Fuels. Texas Transportation Institute, The Texas A&M University System, College Station, TX, October 2007.
20 Andre, M., R. Joumard, R. Vidon, P. Tassel, and P. Perret. “Real-World European Driving Cycles, for Measuring Pollutant Emissions from High- and Low-Powered Cars.” Atmospheric Environment, Vol.40, 2006, pp. 5944-5953.
21 Zietsman, J., J. Villa, T. Forrest, and J. Storey. Mexican Truck Idling Emissions at the El Paso - Ciudad Juarez Border Location. Southwest Region University Transportation Center, Report No. SWUTC/05/473700-00033-1. The Texas A&M University System, College Station, TX, November 2005.
22 Younglove, T., G. Scora, and M. Barth. “Designing On-road Vehicle Test Programs for Effective Vehicle Emission Model Development.” Transportation Research Record: Journal of the Transportation Research Board, No.1941, 2005, pp. 51-59.
23 Zietsman, J., J. Villa, T. Forrest, and J. Storey. Mexican Truck Idling Emissions at the El Paso - Ciudad Juarez Border Location. Southwest Region University Transportation Center, Report No. SWUTC/05/473700-00033-1. The Texas A&M University System, College Station, TX, November 2005.
24 Zietsman, J., M. Farzaneh, J. Storey, J. Villa, M. Ojah, D. Lee, and P. Bella. Emissions of Mexican-Domiciled Heavy-Duty Diesel Trucks Using Alternative Fuels. Texas Transportation Institute, The Texas A&M University System, College Station, TX, October 2007.

13
DATA ANALYSIS USING METHODOLOGY FROM EPA’S MOVES MODEL This project utilizes some of the concepts and methodologies used in the EPA’s MOVES model to analyze emissions data. The MOVES model will replace EPA’s MOBILE 6.2 model for air quality planning, emissions inventories and regulatory efforts. By using the MOVES methodology framework to analyze data, this project is better able to analyze the operational characteristics of emissions data according to an established analysis protocol. The local data needs for MOVES are also significant and the results from this study can be used to enhance localized inputs into the MOVES model for the El Paso border area. The MOVES model better characterizes in-use emissions by using second-by-second emissions rates that account for a vehicle’s operating modes. This enables the model to provide a finer scale of analysis for use at the local level. MOVES incorporates VSP to capture modal emissions. EPA defines the term as “power per unit mass of the source” and is characterized in Equation 1.25, 26 VSP accounts for the forces a vehicle must overcome when operating on the road, including acceleration, road grade, tire rolling resistance, and aerodynamic drag. For example, fast accelerations or driving up a steep hill would have a higher VSP bin, rather than coasting downhill.
2 3A u B u C u M u aVSPM
× + × + × + × ×= (1)
Where: U = is instantaneous speed of vehicle; A = is instantaneous acceleration of vehicle; A = is a rolling resistance term; B = is rotating resistance term; C = is a drag term; and M = is the vehicle’s mass. VSP is normalized by mass and placed into bins. There are 23 bins based on VSP and instantaneous speed. Table 3 shows the MOVES operating bins. A vehicle operating over a drive cycle would then spend different times in different bins depending on operation.
25 Draft Design and Implementation Plan for EPA’s Multi-Scale Motor Vehicle and Equipment Emission System
(MOVES). EPA420-P-02-006, U.S. Environmental Protection Agency, October 2002. 26 Draft Software Design and Reference Manual: Motor Vehicle Emission Simulator Highway Vehicle
Implementation (MOVES-HVI) Demonstration Version. MOVES Homepage. U.S. Environmental Protection Agency, February 2007. Available online at http://www.epa.gov/otaq/ngm.htm.

14
Table 3. MOVES Operating Mode Bin Definitions for Running Emissions. Braking (Bin 0)
Idle (Bin 1)
Instantaneous Speed
(mph) Instantaneous VSP (kW/tonne) 0-25 25-50 > 50
< 0 Bin 11 Bin 21 0 to 3 Bin 12 Bin 22 3 to 6 Bin 13 Bin 23 6 to 9 Bin 14 Bin 24 9 to 12 Bin 15 Bin 25 12 and greater Bin 16 12 to 18 Bin 27 Bin 37 18 to 24 Bin 28 Bin 38 24 to 30 Bin 29 Bin 39 30 and greater Bin 30 Bin 40 6 to 12 Bin 35 < 6 Bin 33
The VSP and bin approach is expected to be a clear indicator of emissions and provide the needed flexibility to provide analysis at meso and microscales of analysis.27 MOVES’ more disaggregated methodology is expected to more precisely estimate emissions based on the local activity data available. This approach is a better fit for incorporating operational data provided by in-use emissions testing.
27 Lindhjem, C., A. Pollack., R. Slott., and R. Sawyer. Analysis of EPA’s Draft Plan for Emissions Modeling in MOVES and MOVES GHG. CRC Project E-68. Report Prepared for the Coordinating Research Council, Inc. Environ, Novato, CA, May 2004.

15
3. AREA FLEET PROFILE AND ANALYSIS Quantifying the number, make and model of OILDVs crossing the U.S.-Mexico border is essential for estimating the emissions impact of these vehicles. The fleet makeup of these vehicles is also used to select vehicles for emissions testing that are representative of the overall fleet.
CUIDAD JUÁREZ FLEET CHARACTERISTICS The Mexican state of Chihuahua provided vehicle registration data for Cuidad Juárez. The state’s Minister of Finance and Administration (Secretaria de Finanzas y Adminstracion) provided vehicle plate data, vehicle model, make, and year information for all vehicles registered in Cuidad Juárez. There are more than 446,000 registered vehicles in Cuidad Juárez. Mexican vehicles operating within the border area can be registered with either border or national plates. Border plates are cheaper, but a permit is required to travel outside the boder area. Table 4 provides the number and percentage of registered vehicles in Cuidad Juárez by vehicle plate type.
Table 4. Registered Vehicles in Cuidad Juárez by Vehicle Plate Type.
Light-Duty Vehicles Total Percentage National Plates 111,021 25.2%
Border Plates 242,446 55.1% Light-Duty Trucks
National Plates 44,836 10.2% Border Plates 41,920 9.5%
Total 440,223 100.0% Approximately 65 percent of registered vehicles in Cuidad Juárez have border plates. Vehicles imported to the border region and receiving border registration can be five or more years old compared to the minimum ten years for national imports. The majority of Mexican vehicles in Cuidad Juárez are imported vehicles. As Figure 2 shows, approximately 87 percent of the City’s vehices are imported, totaling 386,775 vehicles.

16
Figure 2. Imported versus Nationally Sold Vehicles in Cuidad Juárez.
The vehicle fleet age in Cuidad Juárez correlates to the percentage of imported vehicles and the minimum age requirements. While vehicles imported to Mexico to date can have model years 2003 or older, nationally registered vehicles can have model years of 1999 or older. As Figure 3 shows, most vehicles are of an advanced age that fall within these permitted years. Approximately 82 percent of vehicles are older than model year 2000.
Figure 3. Model Year by Decade for Vehicles in Cuidad Juárez.

17
Figure 4 shows the distribution of vehicle model years. The mode for this distribution shows that model year 1995 is the most frequent vehicle age in the city with almost 31,569 registrations.
Figure 4. Distribution of the Model Year of Vehicles in Cuidad Juárez.
Cuidad Juárez has a mandatory vehicle emissions I/M program. Information collected from Chihuahua’s Department of Ecology and Civil Protection revealed that only 56,052 vehicles in 2007 had verified their vehicles for emissions compliance. As Figure 5 shows, only 11 percent of vehicles participated in the area’s I/M program. According to the state’s authorities, the program is not strictly enforced or uniformly implemented. It cannot be assumed that the large percentage of vehicles that have not had their vehicles verified for emissions compliance would not pass an emissions inspection. The large number of unverified vehicles in Cuidad Juárez indicates that little is known about the emissions performance of the fleet.

18
Figure 5. Vehicles in Cuidad Juárez with Verification of Emissions Compliance.
IMPORTED VEHICLES CROSSING THE BORDER While data regarding the overall fleet in Cuidad Juárez is important, this study is primarily interested with the subset of the fleet that crosses the border regularly. The research team visually surveyed vehicles at POEs to assess the vehicle, type make and models of OILDVs crossing the border. Data collection was conducted at the major POEs between El Paso and Ciudad Juárez. The data collected included the vehicles’ plate number, a general description of vehicles with distinction between of sport-utility vehicles (SUVs) and sedan models, and possible model year. The survey was conducted during morning peak hours (7:00 a.m. to 10:30 a.m.) and afternoon peak hours (1:30 p.m. to 3:00 p.m.) during one week per POE. These two ranges of peak hours were determined using 24-hour counts from the El Paso Metropolitan Planning Organization (MPO).28 The surveyors use different characteristics to identify the OILD vehicles. The majority of OILD vehicles can be identified by distinctive border plates that use different colors than national vehicles plates. Figure 6 shows the difference in plates between Texas, Mexico border and Mexico national plates. Other imported vehicles using Mexico national plates were identified by observation of older vehicles of certain brands and models that were not previously available in the Mexico vehicle market, such as GMC, Isuzu, and others. Vehicles were also identified by their importation sticker on the front windshield, which are issued by the Secretary of Customs (Aduanas) in Mexico after a vehicle is legally imported into the country.
28 Camino Real Corridor Border Improvement Plan. El Paso MPO, June 2006.

19
Figure 6. Texas Vehicle Plates (U.S.) (a), Border Vehicle Plates (MX) (b), National Vehicle Plates (MX) (c).
(a) (b) (c)
The research team surveyed each north bound lane of the POEs, counting all vehicles entering into the U.S. (vehicles with American plates, Mexico National and Border Plates) and recorded information for only OILD vehicles. It was assumed that every Mexico vehicle entering the U.S. during these peak hours would return into Mexico. With a total of three weeks of data collected, approximately 30,540 vehicles were counted crossing the border and 7,563 vehicles were identified as OILDV. Table 5 lists the number of vehicles for each POE. The survey reflected a majority of American vehicles (slightly more than 75 percent) crossing the border. Of the vehicles crossing the border, almost 25 percent were OILDVs. As reflected in previous studies, the data confirms high traffic volumes and preferential use of the BOTA, which is the only non-toll POE in El Paso.
Table 5. Vehicles Surveyed Crossing from Cuidad Juárez into El Paso. Port of Entry Total Vehicles OILD
Vehicles Percentage of OILD vehicles
Ysleta-Zaragoza Bridge
5,684 1,329 23.38%
Paso del Norte Bridge
6,671 2,217 33.23%
Bridge of the Americas
18,185 4,017 22.09%
Total 30,540 7,563 24.76% The information collected at the three POEs was correlated with the state of Chihuahua’s vehicle registration database using the plate number. The database was able to match survey data with each vehicle’s model year, make, model, serial number, and other information. The database also confirmed whether a vehicle was imported from the U.S. or Canada.

20
The survey found that most vehicles crossing the border were at least nine years old and older. Figure 7 shows the frequency of each model year crossing the border.
Figure 7. Vehicles Surveyed at Border Crossings by Model Year .
The survey and database also showed the most frequent makes and models of OILD vehicles. Figures 8 and 9 show the results for these two categories. As Figure 8 shows, most vehicles crossing the border were Ford and Chevrolet, which comprised 28 percent and 18 percent respectively of all the vehicle makes. Figure 9 shows that the most frequent vehicle models crossing the border were the Ford F-150 truck, Ford Explorer, Nissan Sentra, Chevrolet Astro, and Jeep Grand Cherokee. The vehicles recruited for this study include one from each of the top five makes and models crossing the border. Test vehicles were also recruited based on commonly occurring model years for each make and model.

21
Figure 8. Top Ten Vehicle Makes of OILDVs Surveyed Crossing the Border.
Figure 9. Top 20 Models Surveyed Crossing the Border.


23
4. IN-USE TESTING: PREPARATION AND PROCEDURES Successful in-use emissons testing is the result of good preparation and procedures. In this section, the procedures and approach taken to prepare and conduct the in-use testing are described.
PREPARATION FOR IN-USE TESTING There are several preparatory steps necessary for conducting in-use emissions testing. A testing location and approved traffic management plan must be secured, and vehicles for testing are recruited. Drive cycles used during testing are also developed.
Testing Location and Traffic Management Plan The research team selected a testing location that would allow for the safe operation of vehicles with minimal distruption to normal transportation operation. Since the study was replicating drive cycles that included idling at border POEs, the location had to allow for the idling and slow movement of vehicles as well as high speeds to simulate highway conditions. The road section on US 54 from McCombs Street to the state border with New Mexico was found to have conditions that allow a safe maneuvering of vehicles during the emissions testing and represented a low hazard to local drivers. The area around the road has a low population density and there is miminmal development in the surrounding area. The testing location consisted of 6.27 miles of two-lane road with right and left shoulders 6 feet wide and four major u-turns 100 feet wide each. The stretch has no major driveways or connections to residential or commercial zones, and very little traffic. Figure 10 shows a map of the roadway with the roadway appearing as the blue line.

24
Figure 10. Site Location of Road Testing, US 54.
The Texas Department of Transportation (TxDOT) requires an approved traffic management plan for use of the roadway. The study team worked with TxDOT to create a plan that followed the agency’s Traffic Control Plan Standards and the Texas Manual of Uniform Traffic Control Devices. This included ensuring that proper signs were posted and that the appropriate trail and shadow vehicles were present during use of the roadway. During testing, vehicles were followed by two truck-mounted attenuators to warn drivers of atypical conditions, as shown in Figure 11.

25
Figure 11. Truck Mounted Attenuators with Warning Signs.
In-use testing also requires space for equipment installation on vehicles and storage of testing equipment, supplies, and vehicles. TxDOT generously donated space for testing at one of their district offices located close to the roadway used for testing. The convenient location also included gate controlled access that provided the necessary security for storing test vehicles and testing equipment and supplies.
Recruitment of OILDVs Vehicles were recruited from various POEs in El Paso based on common make, model, and model year distributions data that was obtained from a survey performed by the research team of OILDVs crossing the border. Table 6 lists the information of test vehicles. The list of vehicles includes the most common makes and models as well as model years that are representative of the OILDV population.

26
Table 6. Test Vehicles’ Information.
Make and
Model Model Year
Engine Size (L)
GVWR (lbs)
MOVES Vehicle Type
Vehicle 1 Ford Explorer 1993 4.0 5120 Passenger Truck Vehicle 2 Jeep Cherokee 1995 4.0 4950 Passenger Truck Vehicle 3 Chevy Astro 1998 4.3 5950 Passenger Truck Vehicle 4 Nissan Sentra 1996 1.6 3413 Passenger Car Vehicle 5 Ford F-150 2000 4.2 6000 Passenger Truck
Drive Cycle Development This study used a driving cycle for collecting in-use data. All test runs for each OILDV followed the same established driving pattern. Using a drive cycle rather than just collecting data on a normal workday when the vehicle is in use has three main advantages. First, use of drive cycles enable tests to be repeated, which improves the quality of the data. For this project, each vehicle tested repeated the normal driving cycle a minimum of five times. Drive cycles can also incorporate all operation modes, even the high-emissions events that may occur on an atypical basis. If data was collected during a normal workday, then data reflecting high engine loads may not be adequately collected. For this study, a typical drive cycle was augmented with an uphill portion where the vehicle was forced to work at maximum load. TTI based the drive cycle for testing primarily on GPS data collected on the OILD vehicles during their normal operation and the EPA MOVES model methodology discussed in the background section of this report. As expressed by Equation 1, VSP of a specific vehicle is a function of instantaneous speed and acceleration. The impact of grade is modeled as the effective gravitational acceleration in parallel to a vehicle’s moving direction and therefore is added to vehicle acceleration. This means that bins corresponding to high-VSP values can be achieved by either driving at a high acceleration rate or accelerating on a high-grade road. To obtain enough number of observations in each modal bin, the driving events must contain different steady state (cruise speed) conditions as well as different levels of acceleration and deceleration rates. Uphill grades in excess of 3 percent provides an ideal condition for collecting data for higher VSP bins such as bins 28-30. Note that unlike laboratory testing, having pre-specified second-by-second driving tracks for on-road data collection is impractical; however, a series of specific driving events that follow pre-defined patterns can easily cover a broad-range of vehicle operating modes. Suggestions have been made to build such driving events for on-road emissions testing.29 After the careful examination of the EPA’s MOVES model modal bins according to Table 3 and the roadway at the testing area, the research team designed a set of driving events that consisted of the following elements:
29 Younglove, T., G. Scora, and M. Barth. “Designing On-Road Vehicle test Programs for the Development of Effective Vehicle Emission Models.” Transportation research Record. 2005, Vol. 1941, pp. 51-59.

27
• uphill - maximum acceleration to the speed limit driving uphill and remaining at that speed, normal driving while coming downhill;
• high accelerations (no grade);
• maximum acceleration to the speed limit and remaining at that speed for at least 20 seconds;
• maximum acceleration to 20, 40, and 60 mph in steps, driving for 20 seconds at each speed;
• low acceleration (no grade) - accelerate slowly to the speed limit and remain at that speed for 20 seconds;
• normal acceleration (no grade) - normal acceleration to 60 mph in 10 mph steps, driving for 20 seconds at each speed; and
• creep idle (no grade) - accelerate to 10 mph, drive for 10 seconds, brake normally, and stop for 10 seconds, repeat this six times.
Figure 12 shows the speed profile and driving events used for this project. The creep idle event was specifically included to reflect the emissions impacts of border crossings at the U.S.-Mexico POE. Tested vehicles repeated each event, except for the uphill portion, for a minimum of five repetitions. Depending on the running conditions of the test vehicle, one-to-three runs of uphill data was collected. A period of at least 20 seconds of stop time was included in between each run to allow the engine to stabilize to unloaded conditions and therefore minimize any possible effects of the previous run. A normal deceleration was considered for all events.
Figure 12. Speed Profiles of the Driving Events used in This Study.
0
20
40
60
80
0 100 200 300 400 500 600 700 800 900 1000
Spee
d (m
ph)
Time (s)
Uphill Downhill
Step High Acc.
HighAcc. Low
Acc.Step
Normal
Creep Idle

28
IN-USE TESTING In-use testing involves a series of steps including PEMS installation, equipment calibration, data collection and monitoring, and un-installation. This section describes the in-use testing process conducted for this project.
Testing Equipment This study used two PEMS units simultaneously to collect in-use emissions data. The SEMTECH-DS system was used to collect gaseous emissions NOx, HC, CO, and CO2, and TTI’s OEM-2100 “Axion” system manufactured by Clean Air Technologies, Inc. was used to measure PM. The following describes the two units in detail.
SEMTECH-DS The SEMTECH-DS unit is manufactured by Sensors Inc. and includes a set of gas analyzers, an engine diagnostic scanner, a GPS, an exhaust flow meter (EFM) and embedded software. The gas analyzers measure the concentrations of NOx (NO and NO2), HC, CO, CO2, and oxygen (O2) in the vehicle exhaust. The SEMTECH-DS uses the Garmin International, Inc. GPS receiver model GPS 16 HVS to track the route, elevation, and ground speed of the vehicle on a second-by-second basis. TTI’s SEMTECH-DS uses the SEMTECH EFM to measure the vehicle exhaust flow. Its post-processor application software uses this exhaust mass flow information to calculate exhaust mass emissions for all measured exhaust gases. The unit meets all of EPA’s in-use compliance equipment specifications. A picture of this unit is shown in Figure 13.
Figure 13. TTI’s SEMTECH-DS
29
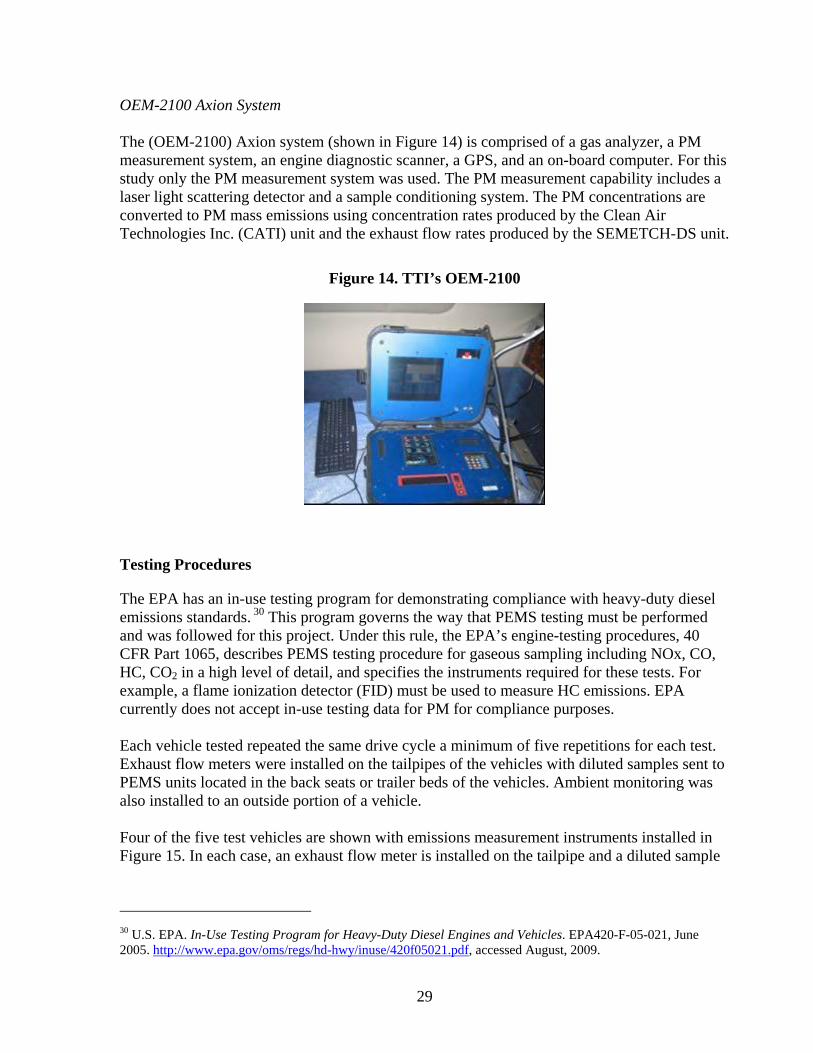
OEM-2100 Axion System The (OEM-2100) Axion system (shown in Figure 14) is comprised of a gas analyzer, a PM measurement system, an engine diagnostic scanner, a GPS, and an on-board computer. For this study only the PM measurement system was used. The PM measurement capability includes a laser light scattering detector and a sample conditioning system. The PM concentrations are converted to PM mass emissions using concentration rates produced by the Clean Air Technologies Inc. (CATI) unit and the exhaust flow rates produced by the SEMETCH-DS unit.
Figure 14. TTI’s OEM-2100
Testing Procedures
The EPA has an in-use testing program for demonstrating compliance with heavy-duty diesel emissions standards. 30 This program governs the way that PEMS testing must be performed and was followed for this project. Under this rule, the EPA’s engine-testing procedures, 40 CFR Part 1065, describes PEMS testing procedure for gaseous sampling including NOx, CO, HC, CO2 in a high level of detail, and specifies the instruments required for these tests. For example, a flame ionization detector (FID) must be used to measure HC emissions. EPA currently does not accept in-use testing data for PM for compliance purposes. Each vehicle tested repeated the same drive cycle a minimum of five repetitions for each test. Exhaust flow meters were installed on the tailpipes of the vehicles with diluted samples sent to PEMS units located in the back seats or trailer beds of the vehicles. Ambient monitoring was also installed to an outside portion of a vehicle. Four of the five test vehicles are shown with emissions measurement instruments installed in Figure 15. In each case, an exhaust flow meter is installed on the tailpipe and a diluted sample
30 U.S. EPA. In-Use Testing Program for Heavy-Duty Diesel Engines and Vehicles. EPA420-F-05-021, June 2005. http://www.epa.gov/oms/regs/hd-hwy/inuse/420f05021.pdf, accessed August, 2009.

30
of exhaust is sent to TTI’s PEMS equipment. PEMS equipment is either placed in the backseat, trunk or truck bed.
Figure 15. Test Vehicles Post-Installation

31
5. RESULTS The data recorded by the two PEMS units were in second-by-second format. From the entire array of information that was recorded (emissions, ambient conditions, and vehicle parameters) the following information was extracted and used in this study:
• engine parameters (if recorded) such as engine speed, throttle position, and engine load for data quality checking;
• second-by-second vehicle speed from the GPS in mph; and
• emissions mass rates in grams per second (g/s).
Second-by-second emissions data were carefully aligned with the instantaneous speed obtained from the GPS. A linear smoothing was applied to speed and grade data to cancel out noise and fine-scale changes due to GPS accuracy limitations and other factors. The VSP value corresponding to each instance was calculated based on Equation 1. Table 7 lists the values of parameters A, B, and C used for VSP calculation. These values were obtained from the MOVES model source database.
Table 7. MOVES Vehicle Parameters Values. Rolling Term A Rotating Term B Drag Term C Vehicle Mass (tonne)
Passenger Car 0.156461 0.00200193 0.000492646 1.4788 Passenger Truck 0.22112 0.00283757 0.000698282 1.86686
The second-by-second emissions rates were then grouped into operating mode bins according to the data in Table 3. Modal average emissions rates for all the pollutants were then estimated for each bin using all the observations that were in that modal bin. Chauvenet's criterion was applied to the emissions rates for each bin to identify and filter out the outliers.31
MODAL EMISSIONS Figures 16 and 17 show the average emissions rates for all operating modes for the oldest tested vehicle (Vehicle 1) and newest tested vehicle (Vehicle 5), respectively. Due to a technical difficulty, no PM data were collected for Vehicle 5 (2000 Ford F-150). As Figure 16 shows, there were no data for bins 30 and 40 for Vehicle 1. Vehicle 2 (for which results are not shown) also had no data corresponding to bins 16, 29, 30, 39, and 40. These bins correspond to the high engine load at speeds greater than 25 mph and 50 mph. As Vehicles 1 and 2 were in poor running condition and could not reach high-VSP operating conditions, i.e., high acceleration rates or speeds greater than 55 mph on an uphill roadway, no data were collected for these mode bins corresponding to the highest engine load conditions. The results for the other vehicles were qualitatively similar and therefore are not presented here. 31 Technical Support Document. In-Use Testing Program for Heavy-Duty Diesel Engines and Vehicles. U.S. Environmental Protection Agency, EPA420-R-05-006, June 2005.

32
The results indicate that if vehicles are in good running conditions (Vehicles 3, 4, and 5) emissions rates for all the pollutants increase as their VSP increases within a speed category. Emissions rates for high-VSP bins at speeds greater than 25 mph appear to be very close for both speed categories. For the vehicles with poor running conditions, Vehicles 1 and 2, the results show that the observed NOx emissions rates for high-VSP bins at speeds higher than 25 mph suddenly drop compared to lower-VSP bins in the same speed category.
Figure 16. Observed Average Modal Emission Rates for 1993 Ford Explorer (Vehicle 1).
0
2
4
6
8
10
12
14
16
0 1 11 12 13 14 15 16 21 22 23 24 25 27 28 29 30 33 35 37 38 39 40
CO
2(g
/s)
VSP Bin
0.00
0.01
0.02
0.03
0.04
0.05
0.06
0.07
0 1 11 12 13 14 15 16 21 22 23 24 25 27 28 29 30 33 35 37 38 39 40
NO
x (g
/s)
VSP Bin
0
1
2
3
4
5
6
7
8
0 1 11 12 13 14 15 16 21 22 23 24 25 27 28 29 30 33 35 37 38 39 40
CO
(g/s
)
VSP Bin
0.00
0.01
0.02
0.03
0.04
0.05
0.060 1 11 12 13 14 15 16 21 22 23 24 25 27 28 29 30 33 35 37 38 39 40
THC
(g/s
)
VSP Bin
0.0000
0.0002
0.0004
0.0006
0.0008
0.0010
0.0012
0 1 11 12 13 14 15 16 21 22 23 24 25 27 28 29 30 33 35 37 38 39 40
PM (g
/s)
VSP Bin
The increase of CO2 and NOx emissions rates follows a linear trend, whereas, for the remainder of the pollutants, this trend is exponential. CO2 formation is the direct result of combustion and therefore a higher engine load translates to a higher fuel consumption rate and therefore higher CO2 rates. Combustion temperature is the main factor determining the NOx formation rate. Higher engine load is equal to higher temperatures and therefore more NOx is formed. The exponential trend of CO, THC, and PM are most probably the result of vehicles’ emissions control devices such as the catalytic converter and electronic fuel injection systems.

33
These devices are most effective at normal load (low and medium) conditions. High load conditions results in the release of high amounts of emissions in a short period and therefore the effectiveness of emissions reduction devices is lower compared to normal engine load conditions. Note that high load conditions are a small fraction of average driving patterns and the vast majority of normal driving is under low and medium engine loads. Figure 17. Observed Average Modal Emission Rates for the 2000 Ford F-150 (Vehicle 5).
0
2
4
6
8
10
12
14
16
18
20
0 1 11 12 13 14 15 16 21 22 23 24 25 27 28 29 30 33 35 37 38 39 40
CO
2(g
/s)
VSP Bin
0.00
0.01
0.01
0.02
0.02
0.03
0.03
0.04
0 1 11 12 13 14 15 16 21 22 23 24 25 27 28 29 30 33 35 37 38 39 40
NO
x (g
/s)
VSP Bin
0
1
2
3
4
5
6
0 1 11 12 13 14 15 16 21 22 23 24 25 27 28 29 30 33 35 37 38 39 40
CO
(g/s
)
VSP Bin
0.00
0.02
0.04
0.06
0.08
0.10
0.12
0.14
0.16
0.18
0 1 11 12 13 14 15 16 21 22 23 24 25 27 28 29 30 33 35 37 38 39 40
THC
(g/s
)
VSP Bin
To validate the modal emissions rates, these average rates were applied to each corresponding instance of the observed data and the total emissions were calculated for different sections of testing. The test sections used in this validation effort include the following activities: uphill driving, downhill driving, driving on level road including creep idle, and creep idle. Appendix A presents the results of this validation effort. The values in this table are the percentage of difference between the estimated values and observed emissions. The results of this validation effort show that, in general, the average modal rates provide satisfactory results for no-grade and uphill driving for all pollutants. The PM creep idling emissions are generally overestimated while the estimates for other emissions are close to observed values. This is primarily because creep idle is a low-speed and low-power event and the mode bins describing this activity (bin 12 and 13) cover a wide speed range (0-25 mph) and therefore it tends to overestimate PM emissions. Downhill has the lowest overall accuracy. This is primarily because the engine is not working under constant load and load variability is higher than the other modes. CO2 rates provide the most accurate estimates for all modes while other pollutants show mixed results. Overall, it appears that the average modal emissions rates provide relatively accurate estimates for the majority of driving events; i.e., driving on zero-to-moderate grade roads.

34
COMPARISON TO U.S. VEHICLES One of the main objectives of this study to investigate whether OILDVs emit higher amounts of emissions compared to their U.S. counterparts. To address this objective, the modal emissions rates for each vehicle were applied to drive cycles in the MOBILE6.2 model and the resulting emissions rates were compared to outputs of the MOBILE6.2 model for the same model year and environmental conditions. The drive cycles are essentially the same as those developed by Sierra Research, Inc. for the EPA.32 MOBILE emissions rates were obtained for light-duty gasoline vehicles (LDGVs) and light-duty gasoline trucks (LDGT1s) with gross vehicle weight ratios less than or equal to 6,000 lbs. Figures 18 through 20 show the results of this analysis in graphical form. The CO2 results in Figure 18 show that the tested vehicles had the same rate of CO2 emissions, and consequently fuel consumption, as U.S. vehicles. This is expected since CO2 is the direct result of combustion and it change only if the fuel consumption of a specific vehicle dramatically changes. Note that the CO2 and fuel consumption rates from the MOBILE6.2 model are insensitive to speed. The estimated rates based on the observed average modal rates show that CO2 (fuel consumption) is highest at lower average speeds. The CO2 rate decreases as average speed increases to approximately 40 mph and thereafter remains almost flat.
32 Carlson, T.R., and T.C. Austin. Development of Speed Correction Cycles. U.S. Environmental Protection Agency, 1997, SR97-04-01.

35
Figure 18. CO2 and NOx Emissions Compared to Corresponding MOBILE6.2 Emissions Factors.
0
200
400
600
800
1000
1200
0 10 20 30 40 50 60 70
CO
2(g
/mi)
Speed (mph)
Vehicle 1
MOBILE6.2 - LDGT1 1993
0
0.5
1
1.5
2
2.5
3
3.5
4
4.5
0 10 20 30 40 50 60 70
NO
x (g
/mi)
Speed (mph)
Vehicle 1
MOBILE6.2 - LDGT1 1993
0
200
400
600
800
1000
1200
0 10 20 30 40 50 60 70
CO
2(g
/mi)
Speed (mph)
Vehicle 2
MOBILE6.2 - LDGT1 1995
0
0.5
1
1.5
2
2.5
3
3.5
4
4.5
0 10 20 30 40 50 60 70N
Ox
(g/m
i)Speed (mph)
Vehicle 2
MOBILE6.2 - LDGT1 1995
0
200
400
600
800
1000
1200
0 10 20 30 40 50 60 70
CO
2(g
/mi)
Speed (mph)
Vehicle 3
MOBILE6.2 - LDGT1 1998
0
0.5
1
1.5
2
2.5
3
3.5
0 10 20 30 40 50 60 70
NO
x (g
/mi)
Speed (mph)
Vehicle 3
MOBILE6.2 - LDGT1 1998
0
100
200
300
400
500
600
700
800
0 10 20 30 40 50 60 70
CO
2(g
/mi)
Speed (mph)
Vehicle 4
MOBILE6.2 - LDGV 1996
0
2
4
6
8
10
12
0 10 20 30 40 50 60 70
NO
x (g
/mi)
Speed (mph)
Vehicle 4
MOBILE6.2 - LDGV 1996
0
200
400
600
800
1000
1200
0 10 20 30 40 50 60 70
CO
2(g
/mi)
Speed (mph)
Vehicle 5
MOBILE6.2 - LDGT1 2000
0
0.5
1
1.5
2
2.5
3
0 10 20 30 40 50 60 70
NO
x (g
/mi)
Speed (mph)
Vehicle 5
MOBILE6.2 - LDGT1 2000

36
Figure 19. CO and THC Emissions Compared to Corresponding MOBILE6.2 Emissions Factors.
0
10
20
30
40
50
60
70
80
0 10 20 30 40 50 60 70
CO
(g/m
i)
Speed (mph)
Vehicle 1
MOBILE6.2 - LDGT1 1993
0
1
2
3
4
5
6
7
0 10 20 30 40 50 60 70
THC
(g/m
i)
Speed (mph)
Vehicle 1
MOBILE6.2 - LDGT1 1993
0
50
100
150
200
250
300
0 10 20 30 40 50 60 70
CO
(g/m
i)
Speed (mph)
Vehicle 2
MOBILE6.2 - LDGT1 1995
0.1
1
10
100
1000
0 10 20 30 40 50 60 70
THC
(g/m
i)Speed (mph)
Vehicle 2
MOBILE6.2 - LDGT1 1995
0
10
20
30
40
50
60
0 10 20 30 40 50 60 70
CO
(g/m
i)
Speed (mph)
Vehicle 3
MOBILE6.2 - LDGT1 1998
0
0.5
1
1.5
2
2.5
3
3.5
4
0 10 20 30 40 50 60 70
THC
(g/m
i)
Speed (mph)
Vehicle 3
MOBILE6.2 - LDGT1 1998
0
10
20
30
40
50
60
70
0 10 20 30 40 50 60 70
CO
(g/m
i)
Speed (mph)
Vehicle 4
MOBILE6.2 - LDGV 1996
0
2
4
6
8
10
12
0 10 20 30 40 50 60 70
THC
(g/m
i)
Speed (mph)
Vehicle 4
MOBILE6.2 - LDGV 1996
0
5
10
15
20
25
30
35
40
45
50
0 10 20 30 40 50 60 70
CO
(g/m
i)
Speed (mph)
Vehicle 5
MOBILE6.2 - LDGT1 2000
0
0.5
1
1.5
2
2.5
3
3.5
0 10 20 30 40 50 60 70
THC
(g/m
i)
Speed (mph)
Vehicle 5
MOBILE6.2 - LDGT1 2000

37
Figure 20. PM Emissions Compared to Corresponding MOBILE6.2 Emissions Factors.
The NOx emissions rates from the modal average rates for all vehicles follow the same exponential decay trend as the MOBILE outputs. Two of the vehicles (1995 Jeep and 1996 Nissan) emitted 1.5 to 4 times higher amounts of NOx emissions than predicted by MOBILE6.2. These vehicles also show higher amount of other emissions (CO, THC, PM) compared to MOBILE rates and other test vehicles. As previously discussed, Vehicle 2 (1995 Jeep) was in poor running condition and therefore all the emissions, as expected, were much higher than the other vehicles. Conversely, Vehicle 4 (1996 Nissan) did not have a clear sign of engine problem. CO, THC, and NOx emissions from the other three vehicles were at or below MOBILE6.2 estimates, indicating that there was no difference from the average U.S. vehicles of the same model year and type. Although PM emissions of three of the vehicles were higher than the MOBILE estimates, this does not automatically constitute higher emissions rates than U.S. vehicles. According to the MOVES training material posted on EPA website,(19) PM emissions from the MOVES model are substantially higher than MOBILE6.2. As previously discussed, Vehicles 2 and 4 showed significantly higher amounts of PM emissions as compared to the other test vehicles.
AVERAGE DAILY IMPACT The research team also attempted to quantify the total average daily impact of OILDVs in the El Paso-Juarez area. A series of GPS data collection efforts were performed to collect daily speed profiles of regular cross-border trips by OILDVs. GPS units were installed on five OILDVs that travelled regularly between Juarez and El Paso and second-by-second speed
0.001
0.01
0.1
1
0 10 20 30 40 50 60 70
PM (g
/mi)
Speed (mph)
Vehicle 1
MOBILE6.2 - LDGT1 1993
0.001
0.01
0.1
1
0 10 20 30 40 50 60 70
PM (g
/mi)
Speed (mph)
Vehicle 2
MOBILE6.2 - LDGT1 1995
0.001
0.01
0.1
1
0 10 20 30 40 50 60 70
PM (g
/mi)
Speed (mph)
Vehicle 3
MOBILE6.2 - LDGT1 1998
0.001
0.01
0.1
1
0 10 20 30 40 50 60 70
PM (g
/mi)
Speed (mph)
Vehicle 4
MOBILE6.2 - LDGV 1996

38
profiles of their movement were collected for approximately one week. From the set of five vehicles, the research team was only able to collect a complete data set from two vehicles for all the daily driving activities and, therefore, included the results in this investigation. Note that only weekday activities were included in this analysis and no data were collected for weekend border-crossing trips. Two days of second-by-second daily speed profiles of the selected vehicles were extracted. The GPS profile data were examined carefully and corrections were made to address the gaps in data. All the driving activities of the vehicles are included in this analysis because Juarez and El Paso are effectively one entity from an air quality point of view. Figure 21 shows a sample of these speed profiles. As shown in Figure 21, the morning northbound peak-period trips had long (usually more than an hour) stop-and-go sections reflecting the heavy peak-hour traffic at the border crossing. Contrary to the northbound trip, the southbound trip virtually does not involve any delays at the border crossing and it resembles normal urban driving.
Figure 21. Sample Speed Profiles for a Complete Cross-Border Trip.
01020304050607080
0
500
1000
1500
2000
2500
3000
3500
4000
4500
Spee
d (m
ph)
Time (s)
Morning North Bound Trip
01020304050607080
0
200
400
600
800
1000
1200
1400
Spee
d (m
ph)
Time (s)
Evening SouthBound Trip

39
The modal emissions rates for each vehicle were applied to these drive cycles. These emissions estimates were then used to quantify the average air quality impact of OILDVs in El Paso. The average total emissions for all vehicles were calculated for each cycle representing the average fleet emissions. These estimates were then averaged to calculate the daily average impact of OILDVs. Figure 22 shows the results of this analysis in graphical form. These results are also presented in tabular format in Appendix A. The results show that the 1995 Jeep was a high emitter. This vehicle emitted over 500 and 10 times more THC and CO, respectively, than a normal vehicle. The last columns in the charts represent the average daily air quality impact of OILDVs and it is clear that only a single high-emitting vehicle dramatically increases the average negative impact of the fleet. In addition to the 1995 Jeep, the 1996 Nissan was also found to be a marginal high NOx emitter — over three times more NOx than the normal vehicles. These two vehicles also emit three-to-six times more PM than the others.
Figure 22. Average Daily Emissions Impacts of OILDVs in El Paso.
* logarithmic scales on CO and THC charts
* no PM data for 2000 Ford F-150
1993 Ford Explorer
1995 Jeep Cherokee
1998 Chevrolet
Astro
1996 Nissan Sentra
2000 Ford F-150
Daily Average
CO2 (kg) 20.5 20.9 21.6 13.6 17.7 18.9
0
5
10
15
20
25
CO
2(k
g)
1993 Ford Explorer
1995 Jeep Cherokee
1998 Chevrolet
Astro
1996 Nissan Sentra
2000 Ford F-150
Daily Average
Nox (g) 49.6 111.3 30.5 165.4 8.3 73.0
0
50
100
150
200
NO
x (g
)
1993 Ford Explorer
1995 Jeep Cherokee
1998 Chevrolet
Astro
1996 Nissan Sentra
2000 Ford F-150
Daily Average
CO (g) 362.5 6205.5 320.9 488.1 168.0 1509.0
1
10
100
1000
10000
CO
(g)
1993 Ford Explorer
1995 Jeep Cherokee
1998 Chevrolet
Astro
1996 Nissan Sentra
2000 Ford F-150
Daily Average
THC (g) 21.0 4959.6 10.6 185.5 6.9 1036.7
1
10
100
1000
10000
TH
C (g
)
1993 Ford Explorer
1995 Jeep Cherokee
1998 Chevrolet
Astro
1996 Nissan Sentra
2000 Ford F-150
Daily Average
PM (g) 1.6 13.4 1.9 6.2 5.8
0
2
4
6
8
10
12
14
16
PM (g
)
*

40
As discussed previously, CO2 is the direct product of combustion and is the direct indicator of fuel consumption. The CO2 results show that each OILDV in the El Paso area is responsible for producing approximately 19 kilograms (kg) of GHG emissions during each working day. This is close to the high end of observed daily emissions from the tested vehicles. As Figure 9 showed, the majority of the OILDV vehicles in the El Paso-Juarez region fall into the light-duty passenger truck category that have engines larger than 4.0 liter.
ESTIMATING THE TOTAL EMISSIONS IMPACT OF THE OILDV FLEET The findings discussed previously and presented in Appendix A show the average emissions impact of an OILD vehicle operating in the El Paso – Ciudad Juarez area. These findings could be used along with the number of border crossing vehicles to estimate the emissions impact of OILDVs that cross the border on a regular basis. Information on border crossings at El Paso’s POEs showed an average of 15,010,018 annual crossings of personal vehicles (between 2000 and 2007)33 . Surveys conducted as a part of this research indicated that around 25 percent of vehicles crossing the border were OILDVs; thus, applying this percentage to the annual crossings, the number of OILDVs crossing the border was estimated to be 3,752,504. Table 8 shows the estimated emissions for this number of vehicles. The results range from approximately 78,000 tons of CO2 to 5,800 tons of CO, 3,800 tons of THC, nearly 300 tons of NOx and 2 tons of PM annually. It should be noted that this is a preliminary, simplistic estimation of the total impact. More detailed analyses of the complete fleet profile (make/model and model year profile), and knowledge of different emissions rates can refine this estimate.
Table 8. Emissions Impact of OILDV Fleet
CO2 CO NOx THC PM (kg) (g) (g) (g) (g)
Daily Average Emissions per Vehicle 18.9 1413.3 71.0 933.3 0.5 Average Annual Number of OILDVs 3752505 Annual Estimated Emissions from OILDVs (tons)
78,045.0
5,846.1
293.8
3,860.5
2.1
In order to examine the contribution of the emissions from OILDVs to the overall emissions in the El Paso region, the emissions estimated were compared against the total vehicular emissions (for all on-road mobile sources) for El Paso County. The information was obtained from emissions inventories conducted for the El Paso region by TTI, and are the official data for 2008 as per the Consolidated Emissions Reporting Rule (CERR). Due to the reporting of Volatile Organic Compounds (VOCs) rather than Total Hydrocarbons (THC) which were measured as a part of this research, the comparison was not made for THC/VOC. The total
33 U.S. Department of Transportation, Research and Innovative Technology Administration, Bureau of Transportation Statistics, Border Crossing/Entry Data; based on data from U.S. Department of Homeland Security, Customs and Border Protection, OMR database.
41
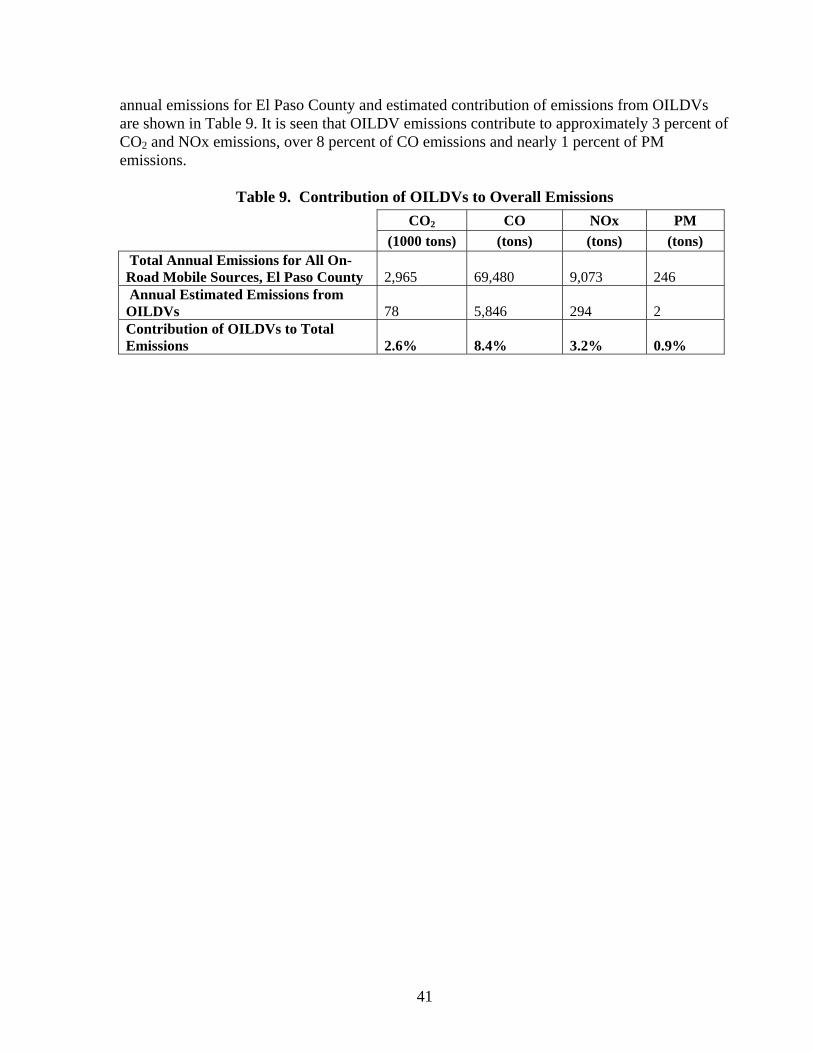
annual emissions for El Paso County and estimated contribution of emissions from OILDVs are shown in Table 9. It is seen that OILDV emissions contribute to approximately 3 percent of CO2 and NOx emissions, over 8 percent of CO emissions and nearly 1 percent of PM emissions.
Table 9. Contribution of OILDVs to Overall Emissions CO2 CO NOx PM
(1000 tons) (tons) (tons) (tons) Total Annual Emissions for All On-Road Mobile Sources, El Paso County
2,965
69,480
9,073
246
Annual Estimated Emissions from OILDVs
78
5,846
294
2
Contribution of OILDVs to Total Emissions 2.6% 8.4% 3.2% 0.9%


43
6. CONCLUDING REMARKS This research examined the air quality and GHG emissions impacts of a sample of OILDVs engaged in routine cross-border trips between Juarez, Mexico and El Paso, TX. These vehicles are an important source of emissions. The following highlights results from the study.
• Restrictions on imported used vehicles into Mexico are being phased out through NAFTA provisions, meaning that more imported light-duty vehicles from the U.S. and Canada will be allowed in the country. Mexico requires environmental permits for imported vehicles, but the regulations are not enforced and few vehicles are tested for emissions. El Paso is an important area for addressing emissions for old imported vehicles.
• The majority of vehicles in Cuidad Juárez are imported vehicles. Most of the vehicles in Cuidad Juárez are of an advanced age, with 82 percent being older than model year 2000. Only 11 percent of these vehicles were inspected in the area’s I/M program.
• Three ports of entry (the Yselta-Zaragoza Bridge, the Paso Del Norte Bridge and the Bridge of the Americas) were observed over a three week period to determine the proportion of OILDVs among the border crossing vehicles. Out of a total 30,540 observations, 7,563 vehicles (25 percent) were identified as OILD vehicles through license place observation and matching. The most frequent vehicles crossing the border were the Ford F-150, Ford Explorer, Nissan Sentra, Chevrolet Astro, and Jeep Grand Cherokee. The vehicles recruited for this study included one from each of these top five makes and models.
• Data collection and data analysis methodologies were developed to estimate the emissions impact of OILDVs. The methodology reduced the duration of data collection and enabled researchers to investigate broad operation modes.
• A sample of five OILDVs were selected and tested for emissions and fuel economy. Second-by-second emissions of these five vehicles were collected using a series of seven driving schedules. The data collection and analysis methodologies were based on VSP factors as defined for the EPA’s MOVES model.
• Data were analyzed based on MOVES’ VSP-based approach. Average modal emissions for each vehicle were estimated from the observed second-by-second data. The resulted emissions rates were used to compare the air quality of OILDVs to average U.S. vehicles and to estimate the average daily impact of OILDVs engaged in routine cross-border trips in El Paso-Juarez area.
• The emissions rates were applied to drive cycles from the MOBILE6.2 model and the results then were compared to the MOBILE6.2 model’s outputs for the same class and model year vehicles. This comparison revealed that most of the tested OILDVs had similar air quality impacts as the average U.S. vehicle; however, there are some high emitters in this fleet that emit notably higher amounts of THC, CO, and PM emissions.
• A series of GPS data collection efforts were performed to collect daily speed profiles of regular cross-border trips by OILDVs. The research team identified two days of second-by-second daily speed profiles from two vehicles for further study. Modal

44
emissions rates were applied to these speed profiles and the average daily air quality impact of the tested vehicles were estimated. The results show that the few high emitters notably increase the average negative emissions impacts of the OILDVs.
• It was observed that the northbound border crossing from Juarez to El Paso in the morning peak hours is the major activity of OILDVs’ daily operation and drivers experience delays well over one hour. In contrast, the southbound border crossing is very smooth and usually no excessive delays are experienced.
• Data on the average daily emissions impact of the tested OILDVs were used to estimate the total annual emissions impact of all OILDVs crossing the US-Mexico border; this impact was quantified at approximately 78,000 tons of CO2, 5,800 tons of CO, 3,800 tons of THC, nearly 300 tons of NOx and 2 tons of PM.
• When compared with the emissions from all on-road mobile sources for El Paso County, it was estimated the these OILDVs contributed to approximately 3 percent of CO2 and NOx emissions, over 8 percent of CO emissions and nearly 1 percent of PM emissions in the region.

45
7. RECOMMENDATIONS The research team recommends the following based on the results of the study.
• The results indicate that more than 50 percent of the tested OILDVs have normal emissions characteristics on par with their U.S. counterparts; however, the few imported vehicles that do not operate normally emit excessive amounts of THC, CO, and PM emissions and notably increase the average air quality impact of the OILDVs. The research team therefore recommends consideration of an I/M-type program targeting the high-emitting OILDVs at major POEs in the U.S.-Mexico border region.
• Additionally, the research team suggests that improvements to peak-hour northbound border crossings be studied and pursued. The GPS speed profiles of OILDVs engaged in northbound border crossings reveal that a significant portion of the driving time is spent creep idling at the border. Smoother border crossing and high-speed public transportation options serving the cross-border trip market are anticipated to reduce the emissions and fuel consumption of OILDVs in the border region.
The study revealed areas where further research is needed. The following highlights future projects that could effectively build off of the results of this study.
• GPS data collection is fairly a new technology in estimating the air quality impact of different fleets. New research is needed to identify the accuracy and reliability of GPS data, quality control and data refinement algorithms, and multi-level air quality estimation methods based on GPS information.
• High emitter vehicles engaged in routine border crossings emit notable amounts of emissions along the U.S.-Mexico border. To investigate the complete impact of these vehicles, in-depth emissions and activity characterization studies using GPS, Geographic Information System (GIS), and PEMS technologies are required.
• The overall vehicle sample size of five is relatively small compared to the diversity of the in-use OILDV fleet. A larger sample size would increase the statistical confidence and applicability of the results, and also help to better estimate the overall emissions impact of the OILDV fleet operating in the U.S.-Mexico border region.

47
8. ACKNOWLEDGEMENTS
This research effort was funded by the EPA, Region 6. The authors would like to thank the EPA Project Officer, Terrie Wright, for all her support during the project. The authors would also like to thank Eduardo Calvo, Rebecca Pinto, Jim Dobbins, Edgar Fino and Robert Saenz of TxDOT for their guidance and support during the project. The authors would like to thank TxDOT’s El Paso District for use of their facilities during emissions testing. The authors would also like to thank the following TTI researchers for their contributions without which this study would not have been possible – Juan Villa, Rafael Aldrete, Edward Brackin, Melisa Finley, Noel Chavez, Luis David Galicia, Osiris Vidana and Tara Ramani.


49
APPENDIX A
Table A.1. Validation Results: Total Emissions Change from Observation.
Table A.2. Average Daily Emissions Impact of OILDVs in the El Paso-Juarez Area. CO2 CO NOx THC PM(kg) (g) (g) (g) (g)
1993 Ford Explorer 20.5 362.5 49.6 21.0 0.21995 Jeep Cherokee 20.9 5715.3 102.4 4441.2 1.21998 Chevrolet Astro 21.6 332.8 29.4 11.8 0.31996 Nissan Sentra 13.6 488.1 165.4 185.5 0.62000 Ford F-150 17.7 168.0 8.3 6.9 N/ADaily Average 18.9 1413.3 71.0 933.3 0.6
veh. 1 veh. 2 veh. 3 veh. 4 veh. 5 veh. 1 veh. 2 veh. 3 veh. 4 veh. 5
Uphill 5.5% 4.4% 11.1% 0.7% 0.8% 18.2% -5.0% 251.1% 46.4% -1.5%
Downhill 6.0% 12.5% 23.0% 21.1% 1.5% -8.5% 22.0% 117.5% 14.9% 65.6%
No Grade -1.9% -1.2% -5.7% -0.8% -0.4% -4.8% 0.2% -25.7% -5.0% -0.4%
Creep Idle 1.7% -1.4% 0.6% 5.4% 2.9% 8.6% 0.3% 6.3% 7.1% 142.8%
veh. 1 veh. 2 veh. 3 veh. 4 veh. 5 veh. 1 veh. 2 veh. 3 veh. 4 veh. 5
Uphill -4.1% 110.8% 16.1% -5.0% -8.3% -5.1% 0.6% 176.6% -4.0% 24.0%
Downhill 421.0% 201.1% 33.1% 62.6% 43.4% -14.8% 13.6% 117.8% -21.8% 40.9%
No Grade 1.9% -7.6% -9.4% 1.1% 4.6% 3.4% -0.7% -26.6% 3.3% -7.1%
Creep Idle -2.6% 4.7% 22.9% 4.6% -24.4% -14.7% -0.3% -9.4% 5.3% 6.0%
veh. 1 veh. 2 veh. 3 veh. 4 veh. 5
Uphill 9.5% -10.0% 9.5% -25.3%
Downhill 31.5% 21.7% -26.2% -23.3%
No Grade -3.9% 0.3% -4.9% 13.7%
Creep Idle 68.2% -17.0% 395.5% 85.2%
Change CO (%)
Change THC (%)
Change CO2 (%)
Change NOx (%)
Change PM (%)