TEST HOLES FOR MONITORING SURFACE-WATER/GROUND …
32
TEST HOLES FOR MONITORING SURFACE-WATER/GROUND-WATER RELATIONS IN THE COTTONWOOD CREEK AREA, SHASTA AND TEHAMA COUNTIES, CALIFORNIA, 1984-85 By Michael J. Johnson, Ernest R. Houston, and John M. Neil U.S. GEOLOGICAL SURVEY Water-Resources Investigations Report 88-4090 Prepared in cooperation with the U.S. ARMY CORPS OF ENGINEERS IT) O I CO CN CN Sacramento, California 1989
Transcript of TEST HOLES FOR MONITORING SURFACE-WATER/GROUND …

TEST HOLES FOR MONITORING SURFACE-WATER/GROUND-WATER
RELATIONS IN THE COTTONWOOD CREEK AREA, SHASTA AND
TEHAMA COUNTIES, CALIFORNIA, 1984-85
By Michael J. Johnson, Ernest R. Houston, and John M. Neil
U.S. GEOLOGICAL SURVEY
Water-Resources Investigations Report 88-4090
Prepared in cooperation with the
U.S. ARMY CORPS OF ENGINEERS
IT) O
ICO CN CN
Sacramento, California 1989

DEPARTMENT OF THE INTERIOR
DONALD PAUL HODEL, Secretary
U.S. GEOLOGICAL SURVEY
Dallas L. Peck, Director
For additional information write to:
District Chief U.S. Geological Survey Federal Building, Room W-2234 2800 Cottage Way Sacramento, CA 95825
Copies of this report can be purchased from:
U.S. Geological SurveyBooks and Open-File Reports SectionBox 25425, Building 810Federal CenterDenver, CO 80225

CONTENTS
PageAbstract .................................................................. 1Introduction............................................................... 2
Purpose and scope ................................................... 3Well-numbering system .............................................. 6Geohydrologic setting ................................................ 6
Test drilling .............................................................. 8Well construction ..................................................... 8Results .............................................................. 9
Libera Ranch.................................................... 10Taylor Ranch ................................................... 14Sartori Ranch ................................................... 19Cottonwood Creek Ranch ........................................ 22
Results of preliminary tritium analyses of ground-water samples ........... 26Summary and conclusions .................................................. 27References cited .......................................................... 28
ILLUSTRATIONS
Page Figure 1. Map showing location and geology of study area .............. 4
2. Schematic geologic section of the Cottonwood Creek area ....... 73. Diagrammatic sketch of the Libera Ranch well sites ............ 104. Natural gamma, electric, lithologic, and well-construction logs
of the Libera Ranch test wells............................... 115. Diagrammatic sketch of the Taylor Ranch well site ............. 156. Natural gamma, electric, lithologic, and well-construction logs
of the Taylor Ranch test well ............................... 167. Graph showing grain-size distribution, test hole 29N/5W-32H1.. 178. Diagrammatic sketch of the Sartori Ranch well sites............ 209. Natural gamma, electric, lithologic, and well-construction logs
of the Sartori Ranch test wells .............................. 2110. Diagrammatic sketch of the Cottonwood Creek Ranch
well sites ................................................... 2311. Natural gamma, electric, lithologic, and well-construction logs
of the Cottonwood Creek Ranch test wells ................... 24
TABLES
Page Table 1. Description of test holes ........................................ 9
2. Results of sieve analyses of borehole materials................... 133. Water-level data for monitoring wells at Libera Ranch ............ 14
Contents III

Page Table 4. Vertical hydraulic conductivity within clay zones at the
Taylor Ranch site ............................................ 195. Water-level data for monitoring well at Taylor Ranch............. 196. Water-level data for monitoring wells at Sartori Ranch ........... 227. Water-level data for monitoring wells at Cotton wood Creek
Ranch......................................................... 258. Tritium composition of water samples from deep wells ............ 26
CONVERSION FACTORS
In this report some measurements are given in inch-pound units, and some laboratory data are reported in International System (SI) Units. Conversion factors from inch-pound units to International System Units are listed below. To convert from International System Units to inch-pound units, multiply by the reciprocal of the conversion shown.
Multiply By To obtainacre 4,047 m 2 (square meter)foot 0.3048 m (meter)ft/d (foot per day) 0.3048 m/d (meter per day)ft 2 (square foot) 0.09294 m 2 (square meter)ft 2 /yr (square foot 0.09294 m 2 /a (square meter
per year) per annum)ft 3 (cubic foot) 0.02832 m 3 (cubic meter)gal/min (gallon per minute) 0.06308 L/s (liter per second)inch 25.4 mm (millimeter)square inch (in 2 ) 0.0006452 m 2 (square meter)lb/in 2 (pound per 703.1 kg/m 2 (kilogram per
square inch) square meter)lb/ft 2 (pound per 4.881 kg/m 2 (kilogram per
square foot) square meter)lb/ft 3 (pound per 16.02 kg/m 3 (kilogram per
cubic foot) cubic meter)mile 1.609 km (kilometer)
Temperature is reported in degrees Celsius (°C). To convert to degrees Fahrenheit (°F), use:
Temperature °F = 1.8 (temperature °C) + 32.
The use of brand, firm, or trade names in this report is for identifica tion purposes only and does not imply endorsement by the U.S. Geological Survey.
Sea level: In this report, sea level refers to the National Geodetic Vertical Datum of 1929 (NGVD of 1929) a geodetic datum derived from a general adjustment of the first-order level nets of both the United States and Canada, formerly called Sea Level Datum of 1929.
IV Conversion Factors

TEST HOLES FOR MONITORING SURFACE-WATER/GROUND-WATER
RELATIONS IN THE COTTONWOOD CREEK AREA, SHASTA AND
TEHAMA COUNTIES, CALIFORNIA, 1984-85
By Michael J. Johnson, Ernest R. Houston, and John M. Neil
ABSTRACT
This report provides a summary of data collected at 10 test holes drilled to obtain hydrogeologic information for an investigation of stream-aquifer interaction in the area of proposed damsites on Cottonwood Creek and South Fork Cottonwood Creek. Test holes were drilled at three sites adjacent to Cottonwood Creek and one site adjacent to South Fork Cottonwood Creek. At each site, one deep well was completed below the first confining clay encountered in the upper Tehama Formation. These wells ranged from 100 to 185 feet deep, and were constructed of 6-inch diameter casing with 5- to 10-foot screened intervals set in a sand pack. At three sites along Cottonwood Creek, two shallow wells were drilled at each site on a line perpen dicular to the stream channel. These wells ranged from 43 to 85 feet deep and were of similar construction.
The deep wells were constructed to help determine the hydraulic gradients between the water-bearing deposits in the Tehama Formation and the overlying channel deposits. The shallow wells were constructed to determine if ground water in the channel deposits is moving toward or away from the stream channel and to monitor water levels.
A lithologic log of each well was compiled from analyses of drill cut tings. Geophysical logs (natural gamma, spontaneous potential, single-point resistance, and caliper) were correlated with lithologic logs to determine the depths for setting the well screens. Selected samples of drill cuttings were analyzed for grain-size distribution. In addition, selected core samples were analyzed for grain-size distribution and vertical permeabilities.
After preliminary pumping at each well site to confirm hydraulic connection between the well and the Tehama Formation, water levels were monitored monthly from June 1984 to June 1985. Water-level data indicate that at two of the four sites the water levels were above the altitude of the stream channel bottom during all streamflow conditions.
Results of tritium dating indicate that two wells have water more than 100 years old, and one well has either a mixture of old and new water or an intermediate-aged water.
Abstract 1

INTRODUCTION
During the early 1980 T s the U.S. Army Corps of Engineers planned to construct dams on Cottonwood Creek and South Fork Cottonwood Creek in Shasta and Tehama Counties, California (fig. 1). The proposed damsites are in an area underlain principally by the Tehama Formation, which contains significant water-bearing alluvial-fan deposits. These deposits comprise part of the larger regional aquifer in the Sacramento Valley. There was concern that dewatering of the construction sites and filling of the reservoirs after construction could produce regional ground-water-level changes of some magni tude. To quantify the magnitude of these changes, the U.S. Army Corps of Engineers conducted and sponsored investigations to describe the hydrologic characteristics of the area.
In 1982, the U.S. Army Corps of Engineers asked the U.S. Geological Survey to analyze the hydrology of the Cottonwood Creek area. As part of this analysis, monitoring of ground-water levels in 98 wells and water- quality sampling in 50 wells was started during autumn 1982 (Evenson and Kinsey, 1985; Fogelman and Evenson, 1985). In addition, measurement of streamflow and sampling of surface-water quality at five U.S. Geological Survey streamflow stations was funded, and the U.S. Geological Survey began investigations to document channel capacity, low flow, and geomorphic charac teristics of Cottonwood Creek, including definition of gaining and losing sections of the channel. The U.S. Army Corps of Engineers also completed extensive hydrogeologic and engineering geologic studies at the proposed damsite areas.
In 1984, the U.S. Army Corps of Engineers asked the U.S. Geological Survey to expand its hydrologic studies to include a determination of ground- water movement through the Tehama Formation to predict ground-water-level changes that might occur during dewatering of the damsites and during subsequent filling of the reservoirs.
2 Test-Hole Monitoring, Cottonwood Creek Area, California, 1984-85

Before a comprehensive hydrogeologic analysis, aquifer characteristics and hydrologic relations needed to be defined. In particular, the hydraulic connection between the streams and ground water within the upper Tehama Formation and their relations to the regional ground-water system needed to be determined.
As part of this initial effort, test sites were selected near stream channels at and downstream from the proposed damsites. At each site a deep well was constructed to monitor the hydraulic gradient between the water bearing deposits in the Tehama Formation and the overlying channel deposits, measured within a shallow well or directly from an adjacent streamflow-gaging station. At some sites shallow wells were constructed to determine if ground water in the channel deposits was moving toward or away from the stream channel.
Purpose and Scope
The purpose of this report is to describe construction of the test holes and to document the preliminary data as they relate to aquifer characteristics and to surf ace-water/ground-water relations. Limited interpretation of data is presented in this report because existing data (1985) do not explain the relations between the regional ground-water system, ground water in the upper part of the Tehama Formation, and streams at the study sites.
The scope of work consisted of drilling test holes adjacent to streams at four sites. Borehole-cutting samples were collected, and geophysical logs were run. From this information, the defined lithology was used as a basis for placing well screens to monitor potentiometric heads in permeable zones. Selected cutting samples and a few Shelby tube core samples were tested in the laboratory for grain-size distribution and determination of vertical-hydraulic conductivity of selected confining clays. Preliminary pumping confirmed hydraulic connection between the well and the aquifer and obtained water samples for tritium analyses. Water levels in the test holes were monitored monthly for comparison with the regional ground-water network and with five streamflow-gaging stations (fig. 1).
Introduction 3

R.6W. 122°30' R-5W _ R.4W. 122° 15' R. 3W .
T.31N.
40°30'
T.30N.
T.29N.
T. 28 N.
40° 15' -
T.27N.
£ Qal
Geology modified from R.G. Strand(1962)
0 5 MILES
0 5 KILOMETERS
FIGURE 1. Location and geology of study area.
4 Test-Hole Monitoring, Cottonwood Creek Area, California, 1984-85

CORRELATION OF MAP UNITS
Alluvium
Red Bluff Formation
Tehama Formation
Unconformity
Holocene
Pleistocene
Pliocene
Great Valley sequence
DESCRIPTION OF MAP UNITS
ALLUVIUM
NONMARINE SEDIMENTS
NONMARINE SEDIMENTS
CONSOLIDATED MARINE ROCKS
QUATERNARY
TERTIARY
CRETACEOUS
CONTACT
WELL LOCATION
GAGING STATION
PROPOSED DAMSITES
FIGURE 1.-Continued
Introduction 5

Well-Numbering System
The well-numbering system used in California by the U.S. Geological Survey indicates the location of wells according to the system for the subdi vision of public lands. For example, the part of the number 29N/6W-12E1, preceding the slash indicates the township (T. 29 N.), the part after the slash the range (R. 6 W.), the digits after the hyphen the section (sec. 12), and the letter after the section number the 40-acre subdivision of the section as indicated in the lettered diagram below. Within each 40-acre tract, the wells are numbered serially as indicated by the final digit of the well number. Thus, well 29N/6W-12E1 was the first well to be listed in SWiNWi of sec. 12. The entire study area is north and west of the Mount Diablo base line and meridian.
TOWNSHIP GRID
NORTH
WEST7
f29N R6W
6 5BASE
4 3LINE2
29
28
27
1
1 i
«<SoeS
i
j.
i;; :::1
SOUTH
TOWNSHIP 29 NORTH, RANGE 6 WEST
EAST
654321
7 8 9 10 ll^fp
18 17 16 15 , 14^1
19 20 21 22 23 »:
30 29 28 27 26 zl
31 32 33 34 35 36\
29N/6W-12E1
fe-x: : : : SI
V
D
Ef*N
ECTION12E1
C
F1
L
P
B
G2
K
Q
A
H
Jr;R;
Geohydrologic Setting
The study area (fig. 1) comprises the lower drainages of Cotton wood Creek and South Fork Cottonwood Creek west of the Sacramento River near the town of Cottonwood, about 16 miles south of Redding. The area is underlain by continental and marine rocks, which range in age from Holocene to Cretaceous (fig. 1). The marine Cretaceous sedimentary rocks of the Great Valley sequence underlie the Tehama Formation and generally define the base of fresh ground water. These thick Cretaceous deposits mostly consist of impervious sandstone and shale that contain brackish water. The rocks crop out in the low hills west of the study area along the eastern edge of the Coast Ranges (fig. 1). Unlike the overlying materials, these Cretaceous rocks dip steeply to the east (U.S. Bureau of Reclamation, 1968).
6 Test-Hole Monitoring, Cottonwood Creek Area, California, 1984-85

The fresh ground-water reservoir consists of the unconsolidated continen tal sediments of the Pliocene Tehama Formation and the Pleistocene Red Bluff Formation and the overlying Quaternary alluvium. The Tehama Formation is a clastic wedge of fluvial sediments deposited by coalescing alluvial fans that are thinnest on the west and thicken, due to subsidence during deposi tion, toward the center of the Sacramento Valley to the east (Russell, 1931). Near the valley trough the formation may be as thick as 2,500 feet. The Nomlaki Tuff Member, a unique marker bed in the Tehama Formation, defines an eastward dip for the Tehama Formation of about 2° (U.S. Bureau of Reclamation, 1968).
Helley and Jaworowski (1985) described the top of the Tehama Formation as a pediment, a planar erosional surface, gently sloping from the Coast Range foothills on the west to the local base level of the Sacramento River near the center of the Sacramento Valley. This erosional surface is mantled by as much as 40 feet of bright-red sandy and silty gravel of the Red Bluff Formation and was deformed by mild uplift and folding during Pleistocene time.
Steele (1980) differentiated five regional stream terraces in the north western Sacramento Valley that postdate the Red Bluff Formation and range in age from 4,000 to more than 250,000 years old. The oldest terraces are topo graphically highest. The youngest terraces are lower, and generally parallel the Holocene stream channel and fluvial deposits of Cottonwood Creek and its tributaries. Nonmarine terrace deposits and the Holocene stream channel and fluvial deposits are mapped as a single unit, Quaternary alluvium, in figure 1. Generally, the Quaternary alluvium is less than 50 feet thick in the Cottonwood Creek area. A generalized geologic section (fig. 2) schematically illustrates the relations between the sedimentary deposits in the study area.
The Tehama Formation contains the principal water-bearing sediments from which most ground water in the area is pumped. Most wells are cased through the Quaternary alluvium and are less than 600 feet deep. The eastward-flowing Cottonwood Creek drainages generally cut across the lines of strike of the gently eastward-dipping beds of the Tehama Formation, and are a source of recharge to the more permeable beds (U.S. Bureau of Reclamation, 1978).
WEST EAST
RED BLUFF FORMATION
QUATERNARY ALLUVIUM
GENTLY DIPPING
TEHAMA FORMATIONSTEEPLY DIPPING
CRETACEOUS ROCKS
(NOT TO SCALE)
FIGURE 2.-Schematic geologic section of the Cottonwood Creek area.
Introduction 7

TEST DRILLING
To help determine the relation between surface and ground water, four test sites were selected for drilling: Libera Ranch at the proposed Dutch Gulch damsite on Cotton wood Creek, Taylor Ranch at the proposed Tehama damsite on South Fork Cottonwood Creek, Sartori Ranch near the confluence of South Fork Cottonwood Creek with Cottonwood Creek, and Cottonwood Creek Ranch at U.S. Interstate 5 about 3 miles from the confluence of the two channels. These sites were selected to be near previously established streamflow gaging stations (fig. 1). However, test holes at the Libera Ranch site were located at the proposed damsite about 1 mile upstream from the gage. Selection of sites was influenced by accessibility of the streambank for the drilling rig and the protection afforded the monitoring wells from winter storm runoff.
Well Construction
Ten test holes, one at the Taylor Ranch site and three at each of the other sites (table 1), were drilled for this study. At each site one deep test hole was screened below the highest confining clay in the upper Tehama Formation. At three of the four sites, two shallow test holes at each site were screened in either Quaternary alluvium or upper Tehama deposits con taining unconfined water. The deep test holes were constructed to help determine the vertical hydraulic gradient between the confined water-bearing deposits in the Tehama Formation and the overlying stream-channel deposits. The shallow test holes at each site were aligned perpendicular to the stream channel to determine if ground water in the shallow unconfined deposits is moving toward or away from the stream channel.
All wells were drilled by the U.S. Geological Survey's western drilling crew from Santa Barbara, California, using the direct mud rotary method. Holes were drilled using 12 1/4-inch and 9 7/8-inch tri-cone rotary bits. The rotary drilling rig and shaker tank circulated bentonitic drilling mud, and in some cases synthetic polymers, to prevent circulation losses. The wells were cased with 6-inch diameter plastic well casing and screen of SDR 21 PVC strength. The screen was constructed with 0.04-inch factory slots and designed with an open area of 22 square inches per linear foot. The bottom of the casing was capped in each well. The annular space adjacent to the well screen was filled with commercial sand with a uniform grain diam eter that ranged from about 0.13 to 0.06 inch. The upper part of the annular space was sealed with grout containing seven bags of concrete per cubic yard. To protect the plastic casing, 10-foot lengths of 10-gauge steel pipe 10 inches in diameter were set into the cement seals of each well with 4 to 6 feet of the pipe extending above the ground surface.
The test holes were developed by the air-surge method, test pumped to determine yield, and completed as monitoring wells. A lithologic log of each well was compiled from analysis of drill cuttings. Geophysical logs (natural gamma, spontaneous potential, single-point resistance, and caliper) were correlated with lithologic logs to determine the depths for setting the well screens.
8 Test-Hole Monitoring, Cottonwood Creek Area, California, 1984-85

TABLE 1. Description of test holes
Test hole No.
Date drilled Location
Depth (feet) Owner
Libera Ranch:
29N/6W-12E1 12E2 12E3
06-21-84 SWiNWi sec. 12 15206-22-84 SWiNWi sec. 12 4306-22-84 SWiNWi sec. 12 45
Guy Libera Guy Libera Guy Libera
Taylor Ranch;
29N/5W-32H1 06-20-84 SEiNEi sec. 32 120 Cody W. Taylor
Sartori Ranch;
29N/4W-17B1 17B2 17B3
06-22-84 NWiNEi sec. 17 18506-23-84 NWiNEi sec. 17 8506-23-84 NWiNEi sec. 17 85
W.H. SartoriW.H. SartoriW.H. Sartori
Cottonwood Creek Ranch:
29N/4W-11Q1 06-18-84
11Q2 06-18-84
14B1 06-19-84
SWiSEi sec. 11 100
SWiSEi sec. 11 50
NWiNEi sec. 14 52
Anderson-Cottonwood Concrete Products
Anderson-Cottonwood Concrete Products
Cottonwood Creek Ranch
Selected drill-cuttings samples were analyzed for grain-size distribution by the U.S. Geological Survey's Sediment Laboratory in Salinas, California. Core samples collected during well construction were analyzed for grain size and vertical permeability by J.H. Kleinfelder & Associates Materials Testing Laboratory in Walnut Creek, California. Water samples obtained during test pumping were analyzed for tritium at the Mount Soledad Tritium Laboratory, at the University of California at San Diego. After well completion, water levels were monitored monthly by U.S. Geological Survey personnel.
Results
The lithologic logs, geophysical logs, test-pumping results, and initial water-level data collected at each site are described in downstream order.
Test Drilling 9

Libera Ranch
The Libera Ranch site is at the proposed Dutch Gulch damsite on the main fork of Cottonwood Creek, about 11 miles upstream from the town of Cotton wood (figs. 1 and 3). The U.S. Geological Survey gaging station Cottonwood Creek near Olinda is about li miles downstream from the site. Three test holes were drilled at this site. One deep hole (12E1) was screened 65 to 75 feet below land surface; two shallow holes (12E2 and 12E3) were screened 25 to 35 feet below land surface.
The lithologic and geophysical logs from the test holes at Libera Ranch are shown in figure 4. For the saturated unconsolidated deposits in the study area, a high resistance (deflections to the right on the single point resist ance log) and a negative spontaneous potential (deflections to the left on the spontaneous potential log) indicates coarse-grained water-bearing deposits that yield water freely to wells; a low resistance and positive spontaneous poten tial indicates fine-grained deposits that do not yield water freely to wells. Higher counts per second on the natural gamma log indicate principally clay beds, whereas lower values indicate clean sands or gravels. Comparison of the logs indicates that alluvial materials are predominantly coarse sand and gravel
N
BLUFFS COMPOSED OF TEHAMA FORMATION
FIGURE 3.-Diagrammatic sketch of the Libera Ranch well sites.
10 Test-Hole Monitoring, Cottonwood Creek Area, California, 1984-85

H
o> CO
NA
TU
RA
L G
AM
MA
(C
OU
NT
PE
R S
EC
ON
D)
SIN
GL
E P
OIN
T
RE
SIS
TA
NC
E(O
HM
S)
20
SP
ON
TA
NE
OU
S P
OT
EN
TIA
L
(MIL
LIV
OLT
S)
LIT
HO
LO
GY
WE
LL C
ON
ST
RU
CT
ION
12E
1 12
E2
12E
3
till
'. #:
:<* .
:' :
'. ±
^:'<
A. '-
.-
'&S
-:
. : .
. ':;
; '.. .
'.!.'. ''.' .
' .
' .'
". "
: : ̂
"". ' * t^
.''-1
: :: .
:'-.
-^-^
f-
IjM
^
':'.'
-~^-
::'-.-'.
^'^
l^:
:S®
:
y /
/
LXXXVVSVt-vVV-.:.-::
:; : ] J
AX\\\VI:-YA:::::j
MM I
Illll
W\\\\V
:.V... T
XC
EM
EN
T
"^C
LA
Y F
ILL
^-S
AN
D P
AC
K
S
CR
EE
N
C
AP
X C
LO
SE
OF
F H
OLE
y E
XP
AN
SIV
E S
ILT
-CL
AY
EX
PL
AN
AT
ION
GRA
VEL
FIGU
RE 4
. Nat
ural
gam
ma,
elec
tric,
litho
logi
c, an
d w
ell-c
onstr
uctio
n lo
gs o
f the
Lib
era
Ranc
h te
st w
ells.
SAN
D
SIL
T A
ND
CLA
Y

down to 38 feet below land surface, tight clayey silt with gravel from 38 to 57 feet below land surface, and varying sand and gravel lenses in a predomi nantly clay matrix from 57 to 154 feet below land surface. The upper 38 feet of deposits are probably recent fluvial sands and gravels, and the lower depos its are probably of the upper Tehama Formation. Caliper logs, though not shown in figure 4, defined zones of expansive silt-clays in the lower part of the deep test hole.
During drilling of well 12E1, samples were collected at depths of 30, 50, 70, and 110 feet for sand analysis in the more permeable zones. The percent ages of silt and clay were determined in a tight clay zone at 50 feet. The results of these analyses are shown in table 2.
After completion and development, the monitoring wells were pumped to estimate their yield and to collect water samples. In the deep well (29N/6W-12E1), pumping rates in excess of 0.4 gal/min dewatered the casing. In the shallow well adjacent to the stream (29N/6W-12E2), low pumping rates dewatered the casing with no short-term recovery. In the shallow well farther from the stream (29N/6W-12E3), pumping rates in excess of 1.5 gal/min dewatered the casing. The low yields in the two shallow wells were unexpected. Possibly the screens in these wells were partly clogged.
Water levels from June 1984 through June 1985 for the three monitoring wells are given in table 3. Well 12E1 is a flowing artesian well. During the period of record, water levels in wells 12E2 and 12E3 were at a higher altitude than the bottom of the stream channel but were about 13 feet lower than the water level in well 12E1; thus, ground water would tend to move upward from the Tehama Formation to the overlying fluvial deposits. The water in well 12E3 was on the order of 0.4 to 0.9 foot higher than in well 12E2, indicating a water-table gradient toward the stream channel in the shallow fluvial deposits. Because the water levels were above the altitude of the stream channel during both high- and low-flow seasons, the stream probably gained water from the ground-water system.
12 Test-Hole Monitoring, Cottonwood Creek Area, California, 1984-85

TA
BL
E 2
. R
esu
lts
of
siev
e an
alys
es
of
bore
hole
m
ater
ials
Depth
(feet
belo
w Well
land
No.
surface)
Libera R
anch
29N/6W-12E1
30 50 70
110
Tayl
or Ra
nch
29N/5W-32H1
40 100
Sartori
Ranc
h
29N/4W-17B1
70 80 160
180
Cottonwood Cr
eek
Ranch
g
29N/4W-11Q1
80
^
11Q2
40
G
Percentage
16.0 100
100
100
100
100
100
100
100
100
100
100
100
8.0 95 88 99 100
100
100 92 97 98 96 94
85
4.0 68 88 95 100 98 98 90 96 91 72 89
73
2.0 43 87 85 95 95 83 85 86 75 50 81
55
of p
arti
cles
fi
ner
than indicated
size
, in
millimeters
1.0 28 83 71 75 90 46 77 61 56 30 57
38
0.5 21 77 63 58 84 32 70 46 43 20 44
28
0.25
0
16 71 59 48 77 27 66 40 29 18 37
21
0.12
5
14 65 57 42 72 24 59 30 21 16 32
17
0.06
2 0.
031
0.01
6 0.
008
0.004
12 57
47
38
29
25
52 37 66
59
50
39
31
22 50
43
36
30
27
23 15 14 27
23
20
16
13
15
0.00
2
20 25 22 ~ ~ 11

TABLE 3. Water-level data for monitoring wells at Libera Ranch
[Location of monitoring wells shown in figure 3. Measuring point is top of casing. Isd, land-surface datum is given in feet above stream channel bottom. All water-level measurements are reported in feet]
Date
06-23-8407-24-8408-28-84
10-24-8411-21-8412-19-84
01-23-8502-26-8503-19-85
04-23-8505-22-8506-24-85
WellIsd, 12
WaterlevelbelowIsd
-1.15-2.75-2.53
4 464 464 46
1 -4.46! -4.461 -4.46
1 -4.461-4.46! -4.46
12E1.25 feetWaterlevel
relativeto streamchannelbottom
13.4015.0014.78
I l6.7l1 I6.71ll6 - 71
lo / 1
1 o / 1
lo * /I
1 D * / 1
1 0 /I
16 VI
WellIsd, 12
WaterlevelbelowIsd
9.5410.2710.45
10.368.718.96
9.9610.0310.24
10.0710.6010.95
12E2.39 feetWaterlevel
relativeto streamchannelbottom
2.852.121.14
2.033.683.43
2.432.362.15
2.321.791.44
WellIsd, 14
WaterlevelbelowIsd
11.5311.1811.46
11.5710.1310.72
11.6511.5611.67
11.5212.0112.37
12E3.27 feet
Waterlevel
relativeto streamchannelbottom
2.743.092.81
2.704.143.35
2.622.712.60
2.752.261.90
Well flowing from hole in casing (maximum elevation).
T ay lor Ranch
The Taylor Ranch site is at the proposed damsite on South Fork Cottonwood Creek 10 miles upstream from the town of Cottonwood. The U.S. Geological Survey gaging station South Fork Cottonwood Creek near Olinda (figs. 1 and 5) is adjacent to the site. Only one test hole (29N/5W-32H1) was drilled at this site to a depth of 120 feet, and it was cased to monitor the hydraulic head in the uppermost water-bearing unit of the Tehama Formation in a sandy interval from 91 to 101 feet, overlain by dry, tight clay. Difficulties in gaining permission and permits precluded the drilling of shallow offset wells at this site.
14 Test-Hole Monitoring, Cottonwood Creek Area, California, 1984-85

ASTAFF GAGE
N
COTTONWOOD
X X X X
FENCE
FIGl'RE 5.-Diagrammatic sketch of the Taylor Ranch well site.
The lithology at this site, shown in figure 6, is characterized by elevated fluvial sands and gravels to a depth of about 18 feet, underlain by silty, sandy clay of the Tehama Formation. Gamma and electric logs in figure 6 show that the Tehama Formation is predominantly fine grained, except for occasional sandy zones, such as that found at 91 to 101 feet.
Samples were collected from this hole in a tight clay zone at 40 feet and at 100 feet for full particle-size analysis; results of these analyses are shown in table 2. Samples also were retrieved at 41, 61, 81, and 121 feet for grain-size distribution and permeability determination. Full particle-size distribution curves at these depths are plotted in figure 7, and the associated vertical hydraulic conductivity is given in table 4.
After completion and development, the well was pumped for about 20 min utes until the yield stabilized at 1.2 gal/min with a drawdown of 13 feet. Generally, the water level at this well was 1.55 to 6.67 feet below the bottom of the adjacent stream channel (table 5). Even though the head gradient would indicate a downward movement of water, little water was vertically exchanged at this site due to tight clays of low vertical permeability. Water found in this part of the Tehama Formation was probably from farther upstream and updip where permeable Tehama beds contact stream-channel deposits.
Test Drilling 15

NA
TU
RA
L G
AM
MA
(CO
UN
T P
ER
SE
CO
ND
)
i_
5 ,
II 10 20 30 40 50 60 70 80 90 100
110
120
-
SP
ON
TA
NE
OU
SP
OT
EN
TIA
L(M
ILL
IVO
LT
S)
200
SIN
GL
E P
OIN
T R
ES
IST
AN
CE
(OH
MS
)
20
i
LIT
HO
LO
GY
W
EL
L C
ON
ST
RU
CT
ION
CE
ME
NT
SA
ND
PA
CK
SC
RE
EN
CA
P
EX
PL
AN
AT
ION
GRA
VEL
FIGU
RE 6
. Nat
ural
gam
ma,
elec
tric,
litho
logi
c, an
d w
ell-c
onstr
uctio
n lo
gs o
f the
Tay
lor R
anch
tes
t well
.
SA
ND
SIL
T A
ND
CL
AY

TO
TA
L P
ER
CE
NT
PA
SS
ING
z CO 0) -3-
o.
0) a
a> T3
TO
TA
L P
ER
CE
NT
PA
SS
ING
oCO
O > >
Z 3
O
CO m
1- s
11 & s
^ p
m
IP
o
m c
o co
P
>
o
^
o
o
w
tsS
CO
r+ D
8 8
o 1° O
3
O m m
3_.
z

u.o o i MiNUMnu oicvc oiz-co ' « ivHor-u_»ivic i en
32 1 4 810 16 2030 50 80 200 50 20 10 5 1100
90
80
0 70z w< 60Q.h- Z UJ 500 ccUJ5*K oi- 30
20
10
0
100
90
80
070Zw 2 60QLh- ZUJ 500CCUJ
oI- 30
20
10
0
-
_
-
-
-
-
X
\\\\\
\\
S
X
Sar
^
iple dept
^^
i 81 fee
"^^
t below
^^
land surface~
-
-
-
-
"~~ -
_
_
-
_
" "
-
-
" * .^v.
XX\
\S
1 1 i
\
1 1 1 1 1 1 ' 1 1 1 1 1 1 1
Sample depth 121 feet below land surface
\\\X
_
-
x. _
-
I I n i i i .1 . i . . ,...!.,50,000 10,000 5,000 1,000 500 100 50 20 10 5 1
MICROMETER
II I II II32 1 0.5 0.1 0.05 0.01 0.005 0.001 0.0005 0.0001 0.0000
INCHESGRAVEL COARSE MEDIUM FINE SAND FINES
SAND SANDEQUIVALENT GRAIN DIAMETER
FIGURE 7.-Continued.
18 Test-Hole Monitoring, Cottonwood Creek Area, California, 1984-85

TABLE 4. Vertical hydraulic conductivity within clay zones at the Taylor Ranch site
[cm/s, centimeters per second]
Sampledepth (feet)
41
61
81
121
Vertical permeabilityof clay zones
(cm/s)
1.44x10*?
1.84x10*5
3.32x10*5
7.03x10*7
Sartori Ranch
The Sartori Ranch site is on the south bank of the main fork of Cottonwood Creek about 9 miles down stream from the Libera Ranch site. The U.S. Geological Survey's stream- flow gaging station Cottonwood Creek above South Fork, near Cottonwood (figs. 1 and 8) is adjacent to the site. Three test holes were drilled at this site. One deep test hole (well 17B1) was screened 150 to 160 feet below land surface, and two shallow test holes (wells 17B2 and 17B3) were screened 70 to 80 feet below land surface.
TABLE 5. Water-level data for monitoring well at Taylor Ranch
[Location of well shown in figure 5. Measuring point is top of casing. Isd, land-surface datum is given in feet above stream channel bottom. All water-level measurements are reported in feet]
Well 29N/5W-32H1, Isd, 13.06 feet
Date
06-20-8407-25-8408-31-84 10-23-84 12-18-8401-24-8502-27-8503-20-8504-25-8505-23-8506-25-85
Water level below Isd
Water levelrelative to stream
channel bottom
19.7318.6219.0617.1314.7815.0314.8714.8814.6114.8216.96
-6.67-5.56-6.00-4.07-1.72-1.97-1.-1.
8182
-1.55-1.76-3.90
The lithologic log for this site shows that the upper 24 feet are flu vial deposits consisting of sand and gravel (fig. 9). The Tehama Forma tion underlies these deposits and was determined by inspection of well cut tings to generally consist of fine sandy silt and clay down to 150 feet, and sand and gravel with some clay to 180 feet. Sand and gravel lenses are seen on the electric logs at 155, 165, and 170 to 180 feet. At this site the Tehama Formation is permeable and is in some degree of hydraulic connection with the overburden.
Samples were collected for particle- size analysis from the deep test hole in the more permeable zones at 80, 160, and 180 feet below land surface, and in a tight zone of high clay con tent at 70 feet below land surface. The results of these analyses are given in table 2.
Test Drilling 19

N
FIGURE 8.-Diagrammatic sketch of the Sartori Ranch well sites.
After the wells were completed and developed, they were test pumped to determine yield and to obtain water samples. Results of the test pumping follow:
YieldWell No. Pumping time (gallons per minute) Drawdown (feet)
29N/4W-17B129N/4W-17B229N/4W-17B3
2 hours1 hour
30 minutes
131017
81614
Water levels measured at the three monitoring wells from June 1984 to June 1985 are given in table 6. During this period, altitudes of water levels in all three wells were below the altitude of the bottom of the stream channel. The water levels in the deeper well, 29N/4W-17B1, were more than 10 feet lower than in the shallower wells, indicating that water can move down ward from the fluvial deposits to the underlying Tehama Formation. The water levels in the shallow wells were 4.32 to 10.26 feet below the altitude of the bottom of the stream channel, indicating that streamflow can recharge the
20 Test-Hole Monitoring, Cottonwood Creek Area, California, 1984-85

NA
TU
RA
L G
AM
MA
(C
OU
NT
PE
R S
EC
ON
D)
H (D 03 o
3.
20 40 60 80 100
120
140
160
180
SP
ON
TA
NE
OU
SP
OT
EN
TIA
L
(MIL
LIV
OLT
S)
.200
+
SIN
GL
E P
OIN
TR
ES
IST
AN
CE
(OH
MS
)
20
,L
ITH
OL
OG
YW
ELL C
ON
ST
RU
CT
ION
17
B1
17B
2 17
B3
/CE
ME
NT
x-O
PE
N O
R F
OR
MA
TIO
N F
ILLE
D
-SA
ND
PA
CK
-SC
RE
EN
CA
P
EX
PLA
NA
TIO
N
GRA
VEL
SA
ND
SI
LT A
ND
CLA
Y
FIGU
RE 9
.-Nat
ural
gam
ma,
elec
tric,
lith
olog
ic, a
nd w
ell-c
onstr
uctio
n lo
gs o
f the
Sar
tori
Ranc
h te
st w
ells.
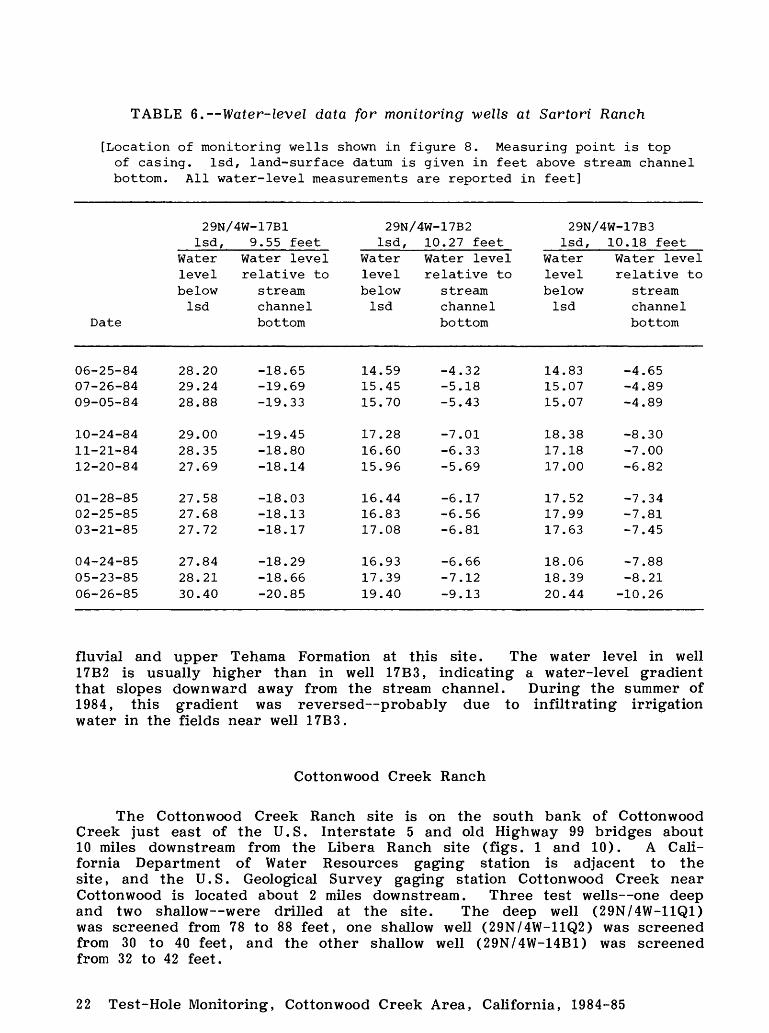
TABLE 6. Water-level data for monitoring wells at Sartori Ranch
[Location of monitoring wells shown in figure 8. Measuring point is top of casing. Isd, land-surface datum is given in feet above stream channel bottom. All water-level measurements are reported in feet]
Date
29N/4W-17B1 Isd, 9.55 feet
Water Water level level relative to below stream
Isd channel bottom
29N/4W-17B2 Isd, 10.27 feet
Water Water level level relative to below stream
Isd channel bottom
29N/4W-17B3 Isd, 10.18 feet
Water Water level level relative to below stream
Isd channel bottom
06-25-8407-26-8409-05-84
10-24-8411-21-8412-20-84
01-28-8502-25-8503-21-85
04-24-8505-23-8506-26-85
28.2029.2428.88
29.0028.3527.69
27.5827.6827.72
27.8428.2130.40
-18.65-19.69-19.33
-19.45-18.80-18.14
-18.03-18.13-18.17
-18.29-18.66-20.85
14.5915.4515.70
17.2816.6015.96
16.4416.8317.08
16.9317.3919.40
-4.32-5.18-5.43
-7.01-6.33-5.69
-6.17-6.56-6.81
-6.66-7.12-9.13
14.8315.0715.07
18.3817.1817.00
17.5217.9917.63
18.0618.3920.44
-4.65-4.89-4.89
-8.30-7.00-6.82
-7.34-7.81-7.45
-7.88-8.21
-10.26
fluvial and upper Tehama Formation at this site. The water level in well 17B2 is usually higher than in well 17B3, indicating a water-level gradient that slopes downward away from the stream channel. During the summer of 1984, this gradient was reversed probably due to infiltrating irrigation water in the fields near well 17B3.
Cottonwood Creek Ranch
The Cottonwood Creek Ranch site is on the south bank of Cottonwood Creek just east of the U.S. Interstate 5 and old Highway 99 bridges about 10 miles downstream from the Libera Ranch site (figs. 1 and 10). A Cali fornia Department of Water Resources gaging station is adjacent to the site, and the U.S. Geological Survey gaging station Cottonwood Creek near Cottonwood is located about 2 miles downstream. Three test wells one deep and two shallow were drilled at the site. The deep well (29N/4W-11Q1) was screened from 78 to 88 feet, one shallow well (29N/4W-11Q2) was screened from 30 to 40 feet, and the other shallow well (29N/4W-14B1) was screened from 32 to 42 feet.
22 Test-Hole Monitoring, Cottonwood Creek Area, California, 1984-85

N
WELLS 11Q2 11Q1 O O
11.5 FEET
-OWELL 14B1
400 FEET
FIGURE 10.-Diagrammatic sketch of the Cottonwood Creek Ranch well sites.
The lithology of this site (fig. 11) is characterized by fluvial sand and gravel to a depth of about 66 feet below land surface. From below 66 feet to the bottom of the hole, very fine sand, silt, and clay predominate, with some interbedded, gravelly, medium-grained sand lenses. These fine-grained deposits probably are part of the Tehama Formation. The electric logs in figure 11 show a high resistance and a negative spontaneous potential from 20 to 66 feet, which correlates with a gravelly, sandy zone containing low conductivity water in the fluvial deposits. From 66 to 70 feet, decreasing resistance and increasing spontaneous potential correlates to the increasing clay content of the Tehama Formation. Fluctuations in the electric logs showing higher resistance and negative spontaneous potential indicate the presence of cleaner sand and gravel within the Tehama Formation. The gamma log (fig. 11) indicates a uniformly low clay content down to 66 feet, that increases from 66 to 76 feet.
Samples for particle-size analysis were collected from well 11Q1 in a confining clay zone at 80 feet and from well 11Q2 at about 40 feet in the water-bearing fluvial material. Results of the analyses are shown in table 2.
After completion and development, all three monitoring wells were pumped for approximately 20 minutes at 10 to 15 gal/min to determine well yield and to obtain water samples. Drawdowns were about 36 feet in all the wells with recoveries to within a foot of prepumping levels occurring in well 11Q1 after 35 minutes and in wells 11Q2 and 14B1 after 10 minutes.
Test Drilling 23

NA
TU
RA
L G
AM
MA
(C
OU
NT
PE
R S
EC
ON
D)
5
SP
ON
TA
NE
OU
S P
OT
EN
TIA
L
(MIL
LIV
OLT
S)
200
SIN
GL
E P
OIN
T R
ES
IST
AN
CE
(O
HM
S)
20LIT
HO
LO
GY
'.&??
$% mi
WE
LL
CO
NS
TR
UC
TIO
N
11Q
1 11
Q2
14B
1
\ 2 2 ! / ^ ; ) =
=
:;V W
W
/ £ 'y '. / / '. ' ' '. ' , / ' ' Sj
' ', / / / ^ 4
/ / f. f / ^
_ _
^ ~
~~
^;
= =
^^^^
/ I / /
'
'
'. '
'. ;
^ / / / / 4
/ '', / f / 4. :' ,
= =
.' ''
.=E
-
'.' ',
=
:':=
= : '
.
^^^^ ;'
' ^^^W
. '
^C
EM
EN
T
>S
AN
D P
AC
K
S
CR
EE
N
CA
P
\CO
AR
SE
SA
ND
PA
CK
EX
PLA
NA
TIO
N
GR
AV
EL
SAN
DSI
LT
AN
D C
LA
Y
FIGUR
E 11
.-Nat
ural
gam
ma, e
lectri
c, lit
holog
ic, a
nd w
ell-c
onstr
uctio
n log
s of
the
Cotto
nwoo
d Cr
eek
Ranc
h te
st we
lls.

Water-level data collected from June 1984 through June 1985 for the three wells are given in table 7. Generally, water levels in wells 11Q2 and 14B1, which were screened opposite the fluvial deposits, were slightly higher than the water level in well 11Q1, which was screened in the upper Tehama Forma tion sediments; they were also higher than the stream surface. The water level in well 14B1 was about 0.1 foot higher than well 11Q2, suggesting a slight water-table gradient toward the stream channel. All three wells main tained water levels above the altitude of the stream bottom during normal and low-flow conditions. This head gradient and the fact that confining beds encountered during drilling contained coarser material than similar beds at the upstream sites suggest a freer exchange of water between the stream and the Tehama Formation at this site.
TABLE 7. Water-level data for monitoring wells at Cottonwood Creek Ranch
[Location of monitoring wells shown in figure 10. Measuring point is top of casing. Isd, land-surface datum is given in feet above stream channel bottom. All water-level measurements are reported in feet]
29N/4W-11Q1
Date
06-23-8407-23-8408-31-84
10-23-8411-19-8412-18-84
01-24-8502-27-8503-20-85
04-23-8505-22-8506-25-85
Isd,WaterlevelbelowIsd
7.127.547.39
6.896.005.92
7.127.547.73
7.207.307.34
11.47 feetWater levelrelative to
streamchannelbottom
4.353.934.08
4.585.475.55
4.353.933.74
4.274.174.13
29N/4W-11Q2Isd,
WaterlevelbelowIsd
7.027.197.09
6.905.925.89
7.367.757.89
7.207.057.42
11.88 feetWater levelrelative to
streamchannelbottom
4.864.694.79
4.985.965.99
4.524.133.99
4.684.834.46
29N/4W-14B1Isd,
WaterlevelbelowIsd
6.756.946.86
6.705.705.57
7.087.487.64
7.086.907.18
11.71 feetWater levelrelative to
streamchannelbottom
4.964.774.85
5.016.016.14
4.634.234.07
4.634.814.53
Test Drilling 25

RESULTS OF PRELIMINARY TRITIUM ANALYSES OF GROUND-WATER SAMPLES
On September 10-11, 1984, water samples for tritium dating were collected from the deep wells. Subsequent planned sampling and analyses were not com pleted because the study was terminated as described earlier. Results of stable-isotope analyses (deuterium and oxygen-18) of water from wells and streams were inconclusive and are not presented. However, they did indicate isotopic differences between streamwater and the water in the Anderson- Cottonwood Irrigation District Canal, which is supplied by Keswick Reservoir on the Sacramento River farther to the north and outside the study area.
To assure representative sampling of formation waters uncontaminated by drilling mud, the wells were pumped until specific conductance and turbidity seemed to stabilize before collecting the samples. This could not be done in all wells. At the Libera Ranch site, a sample for tritium was not collected from the deep well because well recovery was slow and less than a casing volume was evacuated before the sampling. The deep well at the Taylor Ranch site was pumped only briefly before sampling.
The tritium samples were collected into 125-mL glass bottles with Poly seal caps. The bottles were rinsed several times with the water to be sampled before filling. The tritium-sample bottles were flushed with N 2 gas and com pletely filled before sealing. The tritium was analyzed by Dr. Robert Michel of Mount Soledad Tritium Laboratory, at the University of California, San Diego.
The tritium results are reported as a concentration (TU=1 tritium atom/10 18 hydrogen atoms) rather than as a ratio. A tritium concentration of zero tritium units (TU) indicates water that entered the ground-water system over 100 years ago. Concentrations greater than 25 TU indicate that the water is of post-1954 origin, the year fusion bomb testing began. Tritium concentrations between 0 and 25 TU indicate either a mixture of old and new water or an intermediate-agedwater that has lost part of its TABLE 8. Tritium composition of tritium by radioactive decay (Tritium water samples from deep wells half-life=12.35 years). Thus, thetritium analyses shown in table 8 [TU=tritium unit; one tritium suggest that the Taylor Ranch and unit=7.l dpm per liter of Cottonwood Creek Ranch monitoring water. 1 dpm=l tritium atom wells contain water that may be older disintegration per minute] than 100 years, and the Sartori ___________________________ Ranch well contains either a mix- ~ ture of old and new water or Wel1 3H an intermediate-aged water, poss- ibly influenced by streams or by the Anderson-Cottonwood Irrigation Taylor Ranch District Canal. 29N/5W-32H1.............. 2.2 ±2.3 TU
Tritium concentrations show dif- Sartori Ranch ferences in the isotopic composition 29N/4W-17B1.............. 11. o ±2.3 TUof water within the study area.Additional samples would be required Cottonwood Creek Ranchto describe the cause-and-effect 29N/4W-11Q1.............. 0.2 ±2.3 TUrelation of these different waters.
26 Test-Hole Monitoring, Cottonwood Creek Area, California, 1984-85

SUMMARY AND CONCLUSIONS
Field investigations made in conjunction with the U.S. Army Corps of Engineers' deep test wells at the damsites and the drilling of the shallower U.S. Geological Survey test holes along the stream channels confirm that the Pliocene Tehama Formation sediments consist of a thick succession of inter- bedded, sandy clay, clayey sand with permeable beds of poorly sorted sand and gravel, and occasional cemented gravel. Beds with high clay content confine the formation water. Where exposed, the more permeable lenses of sand and gravel indicate a braided channel deposit on a broad alluvial fan. Pumping tests by the U.S. Army Corps of Engineers as part of their studies indicated that channel deposits of the Tehama Formation have lateral hydraulic continuity. As a geologic unit, the Tehama Formation dips to the northeast at less than 2° with generally less than 50 feet of overburden consisting of Quaternary nonmarine terrace deposits, Quaternary alluvium, and fluvial deposits adjacent to stream channels.
The purpose of the U.S. Geological Survey's test holes was to determine the vertical hydraulic connection between the upper Tehama Formation and the overburden at selected sites along Cottonwood Creek and South Fork Cotton- wood Creek. At both the Libera Ranch and the Taylor Ranch test holes, adja cent to the proposed damsites, confining clays in the Tehama Formation were found, which would retard vertical movement of water between the stream chan nel and sand layers in the Tehama Formation. The head gradient was upward at the Libera Ranch site and downward at the Taylor Ranch site. Water in the Tehama Formation directly below both sites may come from a distance updip from the sites. Water samples from the Taylor Ranch monitoring well indi cate a long residence time, which could be due to slow ground-water velocity in low permeability material or to a more distant recharging source.
At the Sartori Ranch and Cottonwood Creek Ranch sites, the higher per meability of the Tehama Formation could allow a greater hydraulic interaction with the stream channel. Movement of water between the stream and the Tehama Formation probably occurs principally along the nearly horizontal sand and gravel interbeds. At the Sartori Ranch site, head gradients are downward, indicating the potential for stream-channel recharge into the over burden deposits and the Tehama Formation. At the Cottonwood Creek Ranch site, head gradients indicate the potential for flow from both the overburden and the Tehama Formation to the stream. Water from the deep monitoring well at this site is older and probably has a more distant recharge source than the water from the deep monitoring well at the Sartori Ranch site.
The relation of stream-channel recharge to the Tehama Formation can be summarized as follows: Ground-water movement is presumed to be principally along the most permeable of the gently dipping beds in the Tehama Formation. The gradient of Cottonwood Creek is less than the dip of the Tehama Formation and allows the stream to cut a number of the Tehama beds. Where the stream crosses coarser strata, recharge can occur if the head gradient between the stream and the Tehama Formation is downward, such as at the Sartori Ranch site. Where the stream channel crosses silt and clay or where water-level gradients are upward, no recharge from the stream channel is indicated.
Summary and Conclusions 27

Although this study provided hydrologic information at four specific sites, additional work is needed to: (1) Quantify stream recharge to or dis charge from the ground-water system in the Cottonwood Creek basin, (2) determine aquifer characteristics, (3) relate local ground-water flow to the regional flow system, and (4) characterize the deeper lithology and head distribution in the Tehama Formation.
REFERENCES CITED
Evenson, K.D., and Kinsey, W.B., 1985, Map showing ground-water conditions in the Cottonwood Creek area, Shasta and Tehama Counties, California, 1983-84: U.S. Geological Survey Water-Resources Investigations Report 85-4184, 1 sheet.
Fogelman, R.P., and Evenson, K.D., 1985, Water-resources monitoring in the Cottonwood Creek area, Shasta and Tehama Counties, California, 1982-83: U.S. Geological Survey Water-Resources Investigations Report 84-4187, 70 p.
Helley, E.J., and Jaworowski, Cheryl, 1985, The Red Bluff Pediment A datum plane for locating Quaternary structures in the Sacramento Valley, California: U.S. Geological Survey Bulletin 1628, 13 p.
Russell, R.D., 1931, The Tehama Formation of northern California: Berkeley, California, University of California, unpublished Ph.D dissertation, 133 p.
Steele, W.C., 1980, Quaternary stream terraces in the northwestern Sacramento Valley, Glenn, Tehama, and Shasta Counties, California: U.S. Geological Survey Open-File Report 80-512, 167 p.
Strand, R.G., 1962, Geologic map of California Redding sheet: California Division of Mines and Geology, scale 1:250,000.
U.S. Bureau of Reclamation, 1968, Ground-water geology and resources appendix, in Reconnaissance study of Cottonwood Creek Service Area, Cottonwood unit, lower Trinity River division, North Coast Project, California: 27 p.
___1978, Cottonwood Creek Project, California, ground-water geology and resources appendix: 29 p.
28 Test-Hole Monitoring, Cottonwood Creek Area, California, 1984-85