Tim Dawson Managing Director Synergetic Tim Dawson Managing Director.

11
19 February 2013
2012 Full Year Result
Terry Davis Group Managing DirectorWarwick White Managing Director Australasia
Nessa O’Sullivan Group Chief Financial Officer
2
Highlights of 2012 Full Year Result
Double-digit volume and earnings growth from Indonesia & PNG
Driven by increased demand for commercial ready-to-drink beverages, brand and
package innovation and continued strong growth of Minute Maid Pulpy juice and
sparkling beverages
Significant investments in production capacity to support ongoing growth
Solid volume and earnings growth and market share gains from the
Australian business
Delivered against the backdrop of a weak consumer spending environment and very
poor weather in Q1
EBIT margins maintained above 20% and market share increased despite sustained
aggressive competitor discounting in H2
For
per
sona
l use
onl
y

3
Highlights of 2012 Full Year Result
Material progress made in positioning the alcoholic beverages platform
for growth
Agreement to form beer manufacturing JV with Casella from Dec13
Long-term exclusive agreement to distribute Rekorderlig cider in Australia from
Jan14
Acquisition of the Foster’s Fiji brewery and distillery
Commencement of distribution of premium beer for Grupo Modelo, Carlsberg and
Molson Coors in Fiji, PNG and the Pacific Islands
Commencement of major operational efficiency programme
Targeting $30-40 million of annual efficiency gains and cost out initiatives to be
delivered progressively over the next three years
13.3% increase in full year dividends
Ordinary dividends up 6.7% – ahead of earnings growth
Total full year dividends (including special dividend ) up 13.3%
4
11 year track record of strong EPS and DPS growth
Earn
ings
per
sha
re (c
ents
per
sha
re)
Div
iden
ds p
er s
hare
(cen
ts p
er s
hare
)
1. before significant items
For
per
sona
l use
onl
y

5
CCA shareholder value creation since 2001
CCA 373%
S&P/ASX100
145%
Jan01-Dec12
6
Australia
Solid result delivered against the backdrop of weak consumer spending, poor weather in Q1 and aggressive competitor discounting throughout H2
$Am FY12 FY11 Change
Trading revenue 3,027.9 2,880.7 5.1%
Revenue per unit case $8.67 $8.52 1.8%
Volume (million unit cases) 349.3 338.3 3.3%
EBIT 627.4 607.2 3.3%
EBIT margin 20.7% 21.1% (0.4) pts
For
per
sona
l use
onl
y
7
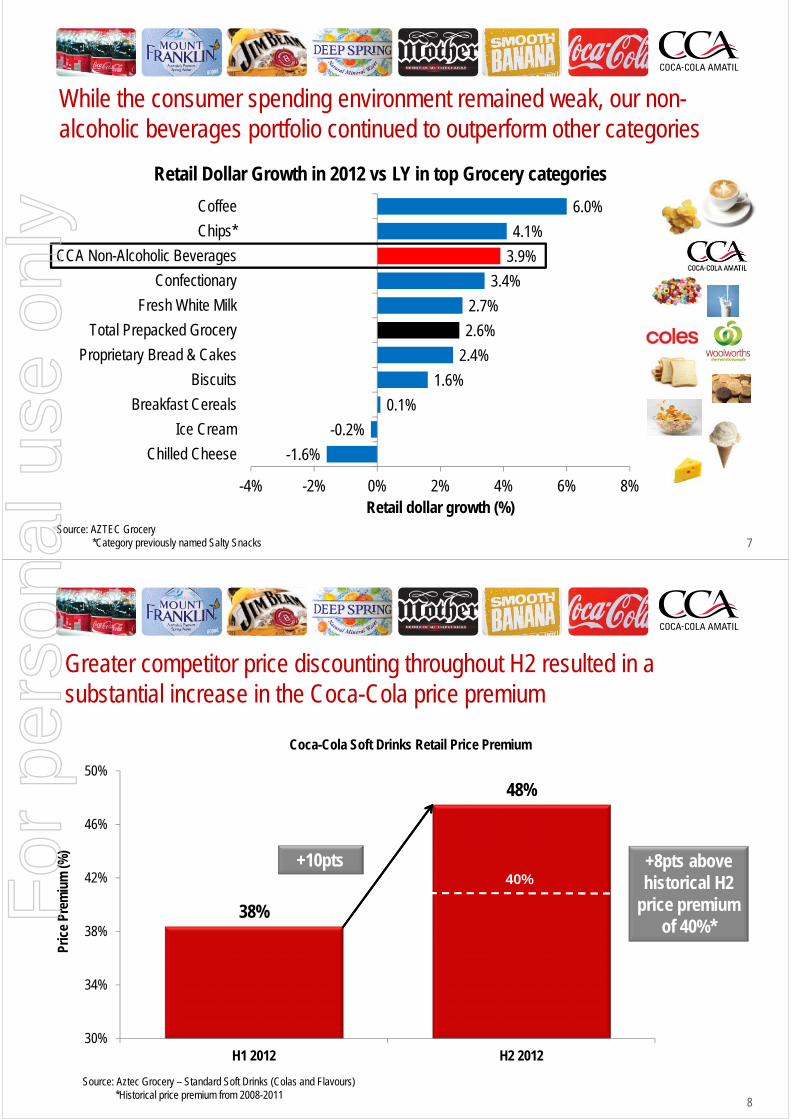
While the consumer spending environment remained weak, our non-alcoholic beverages portfolio continued to outperform other categories
Source: AZTEC Grocery*Category previously named Salty Snacks
-1.6%
-0.2%
0.1%
1.6%
2.4%
2.6%
2.7%
3.4%
3.9%
4.1%
6.0%
-4% -2% 0% 2% 4% 6% 8%
Chilled Cheese
Ice Cream
Breakfast Cereals
Biscuits
Proprietary Bread & Cakes
Total Prepacked Grocery
Fresh White Milk
Confectionary
CCA Non-Alcoholic Beverages
Chips*
Coffee
Retail dollar growth (%)
Retail Dollar Growth in 2012 vs LY in top Grocery categories
8
38%
48%
30%
34%
38%
42%
46%
50%
H1 2012 H2 2012
Pric
e Pr
emiu
m (%
)
Coca-Cola Soft Drinks Retail Price Premium
Greater competitor price discounting throughout H2 resulted in a substantial increase in the Coca-Cola price premium
Source: Aztec Grocery – Standard Soft Drinks (Colas and Flavours)*Historical price premium from 2008-2011
+8pts above historical H2
price premium of 40%*
40%+10pts
For
per
sona
l use
onl
y

9
Despite the widening retail price gap, our sparkling beverage market share increased in H2 demonstrating the strength and resilience of brand Coca-Cola
Source: Aztec Grocery – Standard Soft Drinks (Colas and Flavours)
+0.6pts
+0.2pts
+0.4pts
0.0
0.1
0.2
0.3
0.4
0.5
0.6
0.7
H1 2012 H2 2012 FY 2012
Gro
cery
vol
ume
shar
e vs
LY (p
ts)
Coca-Cola Soft Drinks Volume Share vs LY
10
Product & pack innovation continues to underpin market leadership
For
per
sona
l use
onl
y

11
Our low and non-sugar and portion control portfolio growing strongly
Portion Control Mount Franklin Powerade ZeroCoke Zero
12
Consistent investment in product, package and equipment innovation is driving increases in cold drink shelf space in Australia
61%
65%
59%
60%
61%
62%
63%
64%
65%
66%
2008 2012
Shel
f Sha
re (%
)
CCA Cold Drink Shelf Share
+4pts
For
per
sona
l use
onl
y

13
~30m
~85m
~120m
0
20
40
60
80
100
120
140
2004 2008 2012
Froz
en B
ever
age
Serv
es (m
illio
ns)
Frozen Beverages Serves
Product extension into new categories – rapid growth of frozen beverages
~4x increase from 2004 to
2012
14
Exploiting technology to deliver value added service to our customers and connect directly to consumers
Digital Cooler
For
per
sona
l use
onl
y

15
New Zealand & Fiji
Volumes and earnings impacted by the weak economy, low consumer confidence, cool and wet Q1 and reduction in stock held by customers in H2
$Am FY12 FY11 Change
Trading revenue 402.8 415.8 (3.1%)
Revenue per unit case $6.72 $6.46 4.0%
Volume (million unit cases) 59.9 64.4 (7.0%)
EBIT 70.1 79.5 (11.8%)
EBIT margin 17.4% 19.1% (1.7) pts
16
New Zealand & Fiji
New Zealand Cold drink sales during the peak summer trading season were particularly affected
during Q1
Volume materially impacted by a significant reduction in stock held by major
customers as they focused on more efficient working capital management
Christchurch blowfill line commissioned in January and Auckland’s second blowfill
line commenced operation in May
New Zealand now 100% self-sufficient in the self-manufacture of carbonated PET
bottles
Fiji Improvement in volumes and earnings, a solid outcome given the impact of major
floods and cyclones and the impact on the local economy from lower tourist numbers
Successful launch of Minute Maid Pulpy
For
per
sona
l use
onl
y

17
Alcohol, Food & Services
Alcohol, Food & Services earnings increased by 2.0% due to a solid result from the growth in spirits and alcoholic ready-to-drink beverages, partly offset by a decline in SPC Ardmona earnings
$Am FY12 FY11 Change
Trading revenue 718.5 659.2 9.0%
EBIT1 95.1 93.2 2.0%
1. before significant items
18
Alcohol, Food & Services
Alcohol Comparable earnings improved materially as a result of strong revenue
management combined with successful new product launches
Beam earnings driven by the success of Canadian Club, the introduction of new
flavour extensions in the Beam range (Jim Beam Honey, Black Cherry and Devil’s
Cut) with Beam’s value share of the Spirits category increasing by ~1%
SPC Ardmona Strong Australian dollar continues to impact SPCA’s competitiveness against cheap
imported brands and retailer private label categories in Australia, while a 20%
deflation in fresh fruit prices also resulted in a shift from packaged to fresh fruit
Services Improved earnings from refrigeration and equipment management services, higher
demand for refrigeration servicing contracts and lower operating costs as a result of
efficiency gains
For
per
sona
l use
onl
y

19
Indonesia & PNGDouble-digit volume and earnings growth driven by increased demand for commercial ready-to-drink beverages, brand and package innovation and the continued strong growth of Minute Maid Pulpy juice and sparkling beverages
$Am FY12 FY11 Change
Trading revenue 948.2 845.5 12.1%
Revenue per unit case $5.66 $5.57 1.6%
Volume (million unit cases) 167.4 151.7 10.3%
EBIT 102.9 88.1 16.8%
EBIT margin 10.9% 10.4% 0.5 pts
20
Indonesia & PNGIndonesia One-way-packs grew 19% supported by the acceleration of cold drink cooler
placements, improved in-market execution, new products and packs and strong trade
and consumer promotional programmes
Traditional channel delivered strong growth in one-way-packs driven by single serve
sparkling soft drinks which more than offset the decline in lower value returnable
glass bottles.
Strong performances from core brands driven by trademark Coca-Cola brands (Coke,
Sprite and Fanta) and Frestea in one-way-pack
Successful completion of a number of large investments in manufacturing and
distribution has materially increased production capacity and will support ongoing
growth and the strong pipeline of new products and packs that will be launched in
2013
PNG Solid earnings growth with the new Port Moresby line doubling PET bottle production
capacity
For
per
sona
l use
onl
y

21
Material progress in positioning the alcoholic beverages platform for growth
Australia – CCA is the leading non-alcoholic beverages and spirits partner for the
licenced trade in Australia. Significant progress was made in strengthening the
brand portfolio:
– Agreement to form a beer manufacturing JV with Casella in Dec13
– Long-term exclusive agreement established to distribute Rekorderlig cider in
Australia from Jan14
Pacific
– CCA completed the acquisition of the Foster’s Fiji brewery and distillery
– Commenced distribution of premium beer for Grupo Modelo, Carlsberg and
Molson Coors in Fiji, PNG and the Pacific Islands
22
Re-entry into Premium Beer in Dec13 remains an attractive growth opportunity with Australia one of 6 markets globally with a beer profit pool > $1bn
Private Label Beer‐Estimated to be ~5% of
Australian Beer market by 2015
~$20m
~$115m
~$500m
~$800m
<$2m
~$5m(Fiji Brewery)
Total EBIT Pool of ~$1.4bn across the Pacific region with International
Premium worth over $200m
Total EBIT Pool of ~$1.4bn across the Pacific region with International
Premium worth over $200m
For
per
sona
l use
onl
y

23
2012 Financial Scorecard
Key Objectives FY12 v FY11
1. Mid to high single-digit growth in earnings 5.0% NPAT growth (before significant items) 22.3% NPAT decline (after significant items) -
lapping $59.8m significant item gain in 2011
2. Maintain strong return on capital employed ROIC1 of 17.1% – well above WACC
4. Strong balance sheet & cash flow Operating cash flow1 $128m to $794m Net debt $110.4m to $1.63bn EBIT interest cover 1.2 pts to 8.0x1
5. Dividend payout ratio over 70%
FY payout ratio increased from 74.9%1 to 76.4%1
Special dividend 3.5 cents unfranked to compensate for less than 100% franking on ordinary dividend
1. before significant items
Sustainable shareholder value creation
24
Profit & Loss NPAT1 growth of 5.0% at the top end of guided range of 4-5% growth
Net interest decline due to lower effective interest rates with ~$8m benefit from interest received
on proceeds from sale of 50% interest in PacBev JV with re-deployment of funds occurring
progressively throughout the year
A$m FY12 FY11 % chg
EBIT (before significant items) 895.5 868.9 3.1%
Net finance costs (111.9) (127.8) (12.4%)
Profit before tax1 783.6 741.1 5.7%
Taxation expense1 (225.0) (209.1) (7.6%)
Outside equity interests (Paradise Beverages) (0.2)
NPAT (before significant items) 558.4 532.0 5.0%
Significant items – after tax (98.5) 59.8
NPAT (reported) 459.9 591.8 (22.3%)
1. before significant items
For
per
sona
l use
onl
y
25
Significant items
Net after tax significant item charge of $98.5 million comprising:
Significant item after tax income $47.5 million:
$34.2 million after tax income from SABMiller for not proceeding with the acquisition of the Foster’s Australian spirits business; and
$13.3 million after tax income from an agreement reached with The Coca-Cola Company to replace the Kirks brand in the licensed channel with the Cascade brand.
Significant item after tax expense $146.0 million:
The ongoing impact of the high Australian dollar on the competitiveness of the SPCA business, as well as the significant deflation of fresh fruit prices and the growth of imported grocery private label packaged fruit and vegetables has necessitated a non-cash write-down of goodwill in the business of $48.0 million; and
$98.0 million in largely non-cash restructuring, inventory and other asset write-downs primarily associated with the ongoing transformation of SPCA.
26
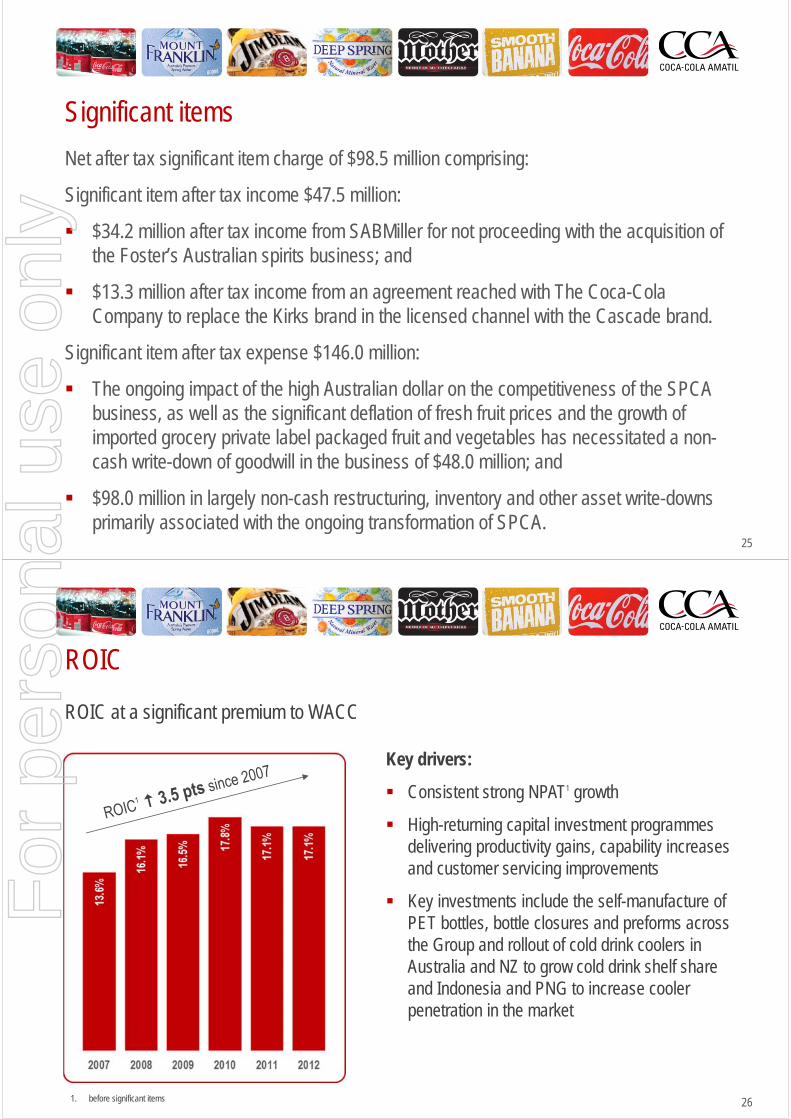
ROIC
ROIC at a significant premium to WACC
1. before significant items
Key drivers:
Consistent strong NPAT1 growth
High-returning capital investment programmes delivering productivity gains, capability increases and customer servicing improvements
Key investments include the self-manufacture of PET bottles, bottle closures and preforms across the Group and rollout of cold drink coolers in Australia and NZ to grow cold drink shelf share and Indonesia and PNG to increase cooler penetration in the market
For
per
sona
l use
onl
y

27
Capital Expenditure2012 geographic spend – continuing to invest in efficiency projects in Australia while investing for growth in Indonesia & PNG
Key projects in 2012
Australia (61% of FY capex):
5 PET bottle self-manufacture lines
Preform and closure plant
Cold drink coolers
Indonesia & PNG (30% of FY capex):
Indonesia:
Beverage production capacity and capability
Cold drink coolers
Infrastructure
PNG: PET production capacity
NZ & Fiji (9% of FY capex):
NZ: 2 PET bottle self-manufacture lines
28
Cash FlowStrong operating cash flow generation driven by improvements in earnings, working capital and lower interest and tax payments
A$m FY12 FY11 $ chg
EBIT (before significant items) 895.5 868.9 26.6
Depreciation & amortisation 233.4 205.2 28.2
Change in working capital 33.2 (36.7) 69.9
Net interest paid (104.0) (118.4) 14.4
Taxation paid (167.0) (206.2) 39.2
Other (96.8) (46.6) (50.2)
Operating cash flow (before significant items) 794.3 666.2 128.1
Capital expenditure (464.8) (361.2) (103.6)
Cash impact of significant items 6.0 (24.4) 30.4
Other 5.5 3.6 1.9
Free cash flow 341.0 284.2 56.8
Net proceeds from sale of JV interest 288.6 - 288.6
Cash flow 629.6 284.2 345.4
For
per
sona
l use
onl
y
29
Capital EmployedCapital employed reduced by $66.1m with capex driven increases in PPE offset by sale of 50% joint venture interest in Pacific Beverages
A$m FY12 FY11 $ chg
Working capital * 842.7 856.7 (14.0)
Property, plant & equipment 1,993.8 1,772.1 221.7
IBAs & intangible assets 1,533.9 1,507.2 26.7
Deferred tax liabilities (157.7) (153.8) (3.9)
Derivatives – non-debt (63.9) (45.3) (18.6)
Other net assets / (liabilities) (437.7) (159.7) (278.0)
Capital employed 3,711.1 3,777.2 (66.1)* 2011 working capital excludes $24.5 million loan to Pacific Beverages
30
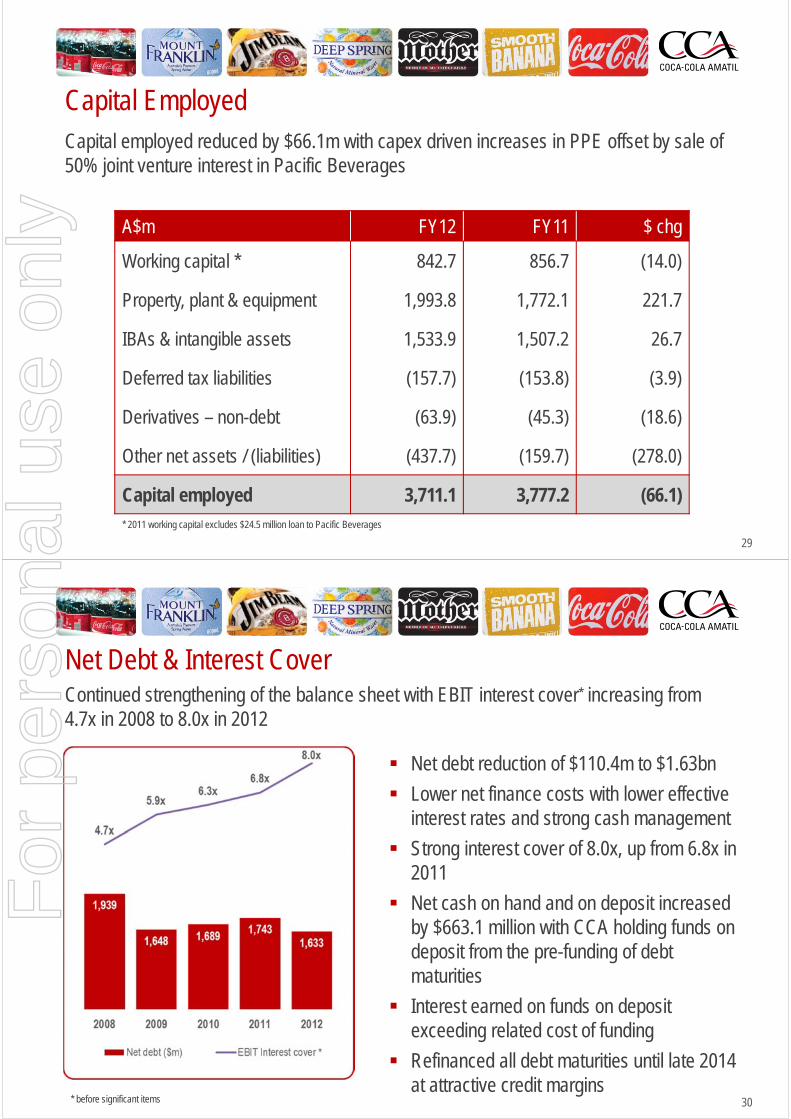
Net Debt & Interest CoverContinued strengthening of the balance sheet with EBIT interest cover* increasing from 4.7x in 2008 to 8.0x in 2012
* before significant items
Net debt reduction of $110.4m to $1.63bn
Lower net finance costs with lower effective interest rates and strong cash management
Strong interest cover of 8.0x, up from 6.8x in 2011
Net cash on hand and on deposit increased by $663.1 million with CCA holding funds on deposit from the pre-funding of debt maturities
Interest earned on funds on deposit exceeding related cost of funding
Refinanced all debt maturities until late 2014 at attractive credit margins
For
per
sona
l use
onl
y

31
2013 – COGS, capex and dividend outlookNon-Alcoholic Beverage COGS
Expect 2013 beverage COGS per unit case increase of 2.5-3.0% (on a constant
currency basis)
Capital Expenditure
Expect 2013 capex of ~$420m with a shift in weight to Indonesia & PNG to support
strong growth outlook
Dividends
Given the continued strength of the balance sheet and financial ratios, expect to
target the dividend payout ratio to the middle of the 70-80% target payout level for
2013
While dividend payments are subject to board approval, the level of franking will be
dependent on both the amount of the dividend declared and the franking credits
available as a result of Australian income tax payments. Based on current forecasts,
and assuming a payout in the middle of the guidance range of 70-80%, expect the
2013 interim dividend to be franked to between 70-75% with the final dividend
expected to be franked to at least 75%
32
Priorities & outlook for 2013
Australia – expects to deliver revenue and earnings growth in 2013
– Price realisation has improved since December
– Remain concerned by the generally weak consumer spending environment
– Productivity and efficiency gains from the Project Zero investment programme
will continue to make a good contribution to earnings growth
Indonesia & PNG – up-weighted investment to support continued strong
growth outlook
– Increase regional capex to ~$200m, or close to 50% of Group capex
– ~45% increase in one-way-pack production capacity and ~20% increase in
cold drink cooler doors by Dec13 in Indonesia with increased infrastructure
spending in both Indonesia and PNG to support the long term growth of these
markets
For
per
sona
l use
onl
y

33
Priorities & outlook for 2013
New Zealand – improved start to the year
– Experienced an improved start to the year
– Some positive signs emerging in economic data, and the Christchurch rebuild
will provide some much needed stimulus later in 2013
Project Zero – next phase targeting $30-40 million pa of cost savings
– Major operational efficiency programme aimed at fully leveraging the
functionality of the new manufacturing and technology platforms which have
been installed across the business over the past three years
– Targeting $30-40 million of annual efficiency gains and cost out initiatives to be
delivered progressively over the next three years
3434
Q&A
2012 Full Year Result
For
per
sona
l use
onl
y

35
Disclaimer
Coca-Cola Amatil Limited (“CCA”) advises that these presentation slides contain forward looking statements which may be subject to significant uncertainties outside of CCA’s and its related entities’ control.
No representation is made as to the accuracy or reliability of forward looking statements or the assumptions on which they are based.
Actual future events may vary from these forward looking statements and you are cautioned not to place undue reliance on any forward looking statement. CCA does not accept any liability to any person or entity for any loss or damage suffered as a result of reliance on this presentation.
Unless otherwise indicated, all references to estimates, targets and forecasts and derivations of the same in this material are references to estimates, targets and forecasts by CCA. Management estimates, targets and forecasts are based on views held only at the date of this material, and actual events and results may be materially different from them. CCA does not undertake to review the material to reflect any future events or circumstances.
For
per
sona
l use
onl
y