terra australis 21 - ANU Press · terra australis 21 7 Foreword One of the most common problems in...
410
terra australis 21
Transcript of terra australis 21 - ANU Press · terra australis 21 7 Foreword One of the most common problems in...

terra australis 21

Terra Australis reports the results of archaeological and related research within the south and east of Asia, thoughmainly Australia, New Guinea and island Melanesia — lands that remained terra australis incognita to generationsof prehistorians. Its subject is the settlement of the diverse environments in this isolated quarter of the globe bypeoples who have maintained their discrete and traditional ways of life into the recent recorded or rememberedpast and at times into the observable present.
Since the beginning of the series, the basic colour on the spine and cover has distinguished the regionaldistribution of topics as follows: ochre for Australia, green for New Guinea, red for South-East Asia and blue for thePacific Islands. From 2001, issues with a gold spine will include conference proceedings, edited papers andmonographs which in topic or desired format do not fit easily within the original arrangements. All volumes arenumbered within the same series.
List of volumes in Terra AustralisVolume 1: Burrill Lake and Currarong: coastal sites in southern New South Wales. R.J. Lampert (1971)Volume 2: Ol Tumbuna: archaeological excavations in the eastern central Highlands, Papua New Guinea. J.P. White (1972)Volume 3: New Guinea Stone Age Trade: the geography and ecology of traffic in the interior. I. Hughes (1977)Volume 4: Recent Prehistory in Southeast Papua. B. Egloff (1979)Volume 5: The Great Kartan Mystery. R. Lampert (1981)Volume 6: Early Man in North Queensland: art and archaeology in the Laura area. A. Rosenfeld, D. Horton and
J. Winter (1981)Volume 7: The Alligator Rivers: prehistory and ecology in western Arnhem Land. C. Schrire (1982)Volume 8: Hunter Hill, Hunter Island: archaeological investigations of a prehistoric Tasmanian site. S. Bowdler (1984)Volume 9: Coastal South-west Tasmania: the prehistory of Louisa Bay and Maatsuyker Island. R. Vanderwal and D.
Horton (1984)Volume 10: The Emergence of Mailu. G. Irwin (1985)Volume 11: Archaeology in Eastern Timor, 1966–67. I. Glover (1986)Volume 12: Early Tongan Prehistory: the Lapita period on Tongatapu and its relationships. J. Poulsen (1987)Volume 13: Coobool Creek. P. Brown (1989)Volume 14: 30,000 Years of Aboriginal Occupation: Kimberley, North-west Australia. S. O’Connor (1999)Volume 15: Lapita Interaction. G. Summerhayes (2000)Volume 16: The Prehistory of Buka: a stepping stone island in the northern Solomons. S. Wickler (2001)Volume 17: The Archaeology of Lapita Dispersal in Oceania. G.R. Clark, A.J. Anderson and T. Vunidilo (2001)Volume 18: An Archaeology of West Polynesian prehistory. A. Smith (2002)Volume 19: Phytolith and starch research in the Australian-Pacific-Asian regions: the state of the art.
D. Hart and L. Wallis (2003)Volume 20: The Sea People: late-Holocene maritime specialisation in the Whitsunday Islands, central Queensland.
B. Barker (2004)Volume 21: What’s changing: population size or land-use patterns? The archaeology of Upper Mangrove Creek,
Sydney Basin. V. Attenbrow (2004)

What’s Changing: Population Size or Land-Use Patterns?The archaeology of Upper Mangrove Creek, Sydney Basin
Val Attenbrow
terra australis 21

This edition © 2006 ANU E Press
The Australian National UniversityCanberra ACT 0200 AustraliaEmail: [email protected]: http://epress.anu.edu.au
National Library of Australia Cataloguing-in-Publication entry
Attenbrow, Valerie, 1942–.
What’s changing: population size or land-use patterns? The archaeology of Upper Mangrove Creek, Sydney Basin.
Bibliography.
ISBN 1 74076 116 2 (pbk).ISBN 978 1 921313 05 9 (web).
1. Aboriginal Australians — New South Wales — Mangrove Creek — Antiquities. 2. Excavations (Archaeology) — New South Wales — Mangrove Creek. 3. Mangrove Creek (N.S.W.) — Antiquities. I. Title. II. Title : Archaeology of Upper Mangrove Creek, Sydney Basin. (Series : Terra Australis ; 21).
994.4201
Cover: Upper Mangrove Creek between Loggers and Black Hands Shelters, August 1979. (Photographer Val Attenbrow).Back cover map: Hollandia Nova. Thevenot 1663 by courtesy of the National Library of Australia. Reprinted with permission of the National Library of Australia.
Copyright of the text remains with the contributors/authors, 2006. This book is copyright in all countries subscribing to the Berne convention. Apartfrom any fair dealing for the purpose of private study, research, criticism or review, as permitted under the Copyright Act, no part may be reproducedby any process without written permission. Inquiries should be made to the publisher.
Series Editor: Sue O’Connor
Typesetting and design: Emily Brissenden

To Patricia Vinnicombe


terra australis 21
7
Foreword
One of the most common problems in archaeology is the publication of excavations —a problem because it is done cursorily, or by someone else decades later, or not at all. The thrillof fieldwork past dulls as the enormity of necessary analytical tasks become apparent and theromance of further fieldwork calls. Those who do produce the results in a timely fashionshould thus be honoured in the profession. Even more praiseworthy is when these resultsmove beyond a dry catalogue to be presented in the frameworks not only of the originalinvestigations but also of those which have arisen and developed during the years of analysis.This monograph is one such publication.
Val Attenbrow’s archaeology in Upper Mangrove Creek was among the first pieces ofresearch aimed at the scientifically rigorous understanding of an environmentally definedarea. It attempted to sample the area and the sites in a theoretically justifiable way. These data,the original block of which was from a salvage program carried out by a public utility, werethen enlarged and transformed by Val’s perspicacity and persistence into a larger-scale,research-oriented PhD thesis. The core problem of the thesis in 1987 was whether a proposed‘intensification’ of Aboriginal occupation during the later Holocene could be substantiated ina close-grained analysis of excavated data. The 17 years between thesis and publication haveseen continuing research by consultants and academics. The original proposals concerning‘intensification’ have been modified and new views and approaches raised. The question is nolonger as simple as it first seemed. Environmental changes, better dating, more sophisticatedtechnological understanding and a wider range of possible subsistence and land-use patternscan all now be seen as parts of a larger, more complex prehistory. This monograph not onlydiscusses all of these aspects, but remains, in my view, Australia’s best data-driven analysis ofthis proposal. Val’s results demonstrate how complicated the archaeological record is and howapparently simple propositions wilt under careful scrutiny.
Val Attenbrow’s archaeological career has been marked, in particular, by a commitmentto regional archaeology. Her Honours and PhD theses were both concerned with areas of NewSouth Wales. Her earlier employment, as a consultant and then with the National Parks andWildlife Service (NSW), continued this focus. Her research since 1989, based at the AustralianMuseum, has seen the completion of the large-scale and successful Port Jackson (aka SydneyHarbour) Project and the beautiful and comprehensive publication, Sydney’s Aboriginal Past(UNSW Press 2002). These, along with this monograph on Upper Mangrove Creek, establishher as a profound interpreter of the Sydney region’s archaeological past and as someone whocan contribute substantially to the wider understanding of Australia’s Aboriginal past.
J. Peter White


terra australis 21
9
Foreword ixAcknowledgements xxix
1 Introduction 1Research aims and context — past and present 2Research methods — an outline 5Research area 6Previous fieldwork in the Upper Mangrove Creek catchment 8
2 Increases and decreases in numbers of sites and artefacts: a review of interpretations and explanations of the 1970s and 1980s 11‘Increases’ in the archaeological record 14
Population change 14General population increase 14Redistribution of populations at regional and local level 17Increased ‘intensity of site use’ 20Intensification and increasing social complexity 22Further comments on explanations involving population increase 26
Behavioural change 27Increases in site numbers 27Increases in the number of stone artefacts accumulated 28
Natural processes 29Geomorphological processes 29The rise in sea-level, climatic change and associated environmental changes 29Decomposition and degradation of materials 30The formation of palimpsests 30
‘Decreases’ in the archaeological record 30Population change 31
Redistribution of populations 31Decreased ‘intensity of site use’ 31
Behavioural change 32Qualitative changes in artefact assemblages 33Changes in subsistence strategies/technology 33Changes in intra-site discard behaviour 34
Discussion 34
Contents

terra australis 21
10
3 Upper Mangrove Creek catchment: fieldwork and analysis: aims and methods 37Terminology and definitions 37
Location 38Rockshelters 39Open rocks 39Open deposits 39
Archaeological traits 39Archaeological deposit 41Images 41Grinding areas 43Burials 43Scarred trees 43
The contents 43Sites 46Isolated finds 46
Defining sites 46Potential habitation shelters and potential archaeological deposits 49Fieldwork aims 50Field survey 51
Sampling design 51Survey fieldwork undertaken 55Field survey methods 60
Excavation 61Excavation strategy and methods 61Excavations undertaken 65Classification of contents of archaeological deposits 66
Stone artefacts 67Bone artefacts 69Wooden objects 69Faunal remains 70Plant remains 71Charcoal 71
Temporal sequence 72Phase 1 73Phase 2 74Phase 3 74Phase 4 74
Dating the archaeological deposits and periods of habitation 75Radiocarbon dates: conventional versus calibrated 75
4 Upper Mangrove Creek catchment: random sampling units.Fieldwork results and evidence from the archaeological deposits 77Summary of fieldwork results 77Archaeological deposits 78
The rockshelters 83The open deposits 83Area of archaeological deposits 83Depth of archaeological deposits 86

Contents of archaeological deposits 86Stone artefacts 92Faunal remains 92
Categorisation of archaeological deposits 94Isolated finds 96Potential habitation shelters and potential archaeological deposits 96
5 Upper Mangrove Creek catchment: random sampling units. Possible biases in the archaeological record and data sets 99Methodological factors — fieldwork 99
Definitions 99Survey design 100Sample size 101Excavation stopped prematurely 101Observer bias 101
Survey results 102Excavation results 102
Methodological factors — analyses 103Calculating artefact accumulation rates 103
Natural processes 103Visibility 104
Archaeological deposits in rockshelters 104Open archaeological deposits 104Grinding areas and engraved images 105
Destruction 105Archaeological deposits in rockshelters 106Open archaeological deposits 108
Further comments on visibility 109Incorporation of older charcoal 110
Focus on rockshelters 111Discussion 112
Comparison between results from random sampling units, storage area and the total catchment 112
Archaeological traits 112Locations 114
6 Temporal distribution: quantitative changes in the Upper Mangrove Creek catchment 115The data sets 118The indices 118
The habitation indices 119The artefact indices 120
Calculating artefact accumulation rates 120Growth rates 121
Calculating growth rates 121Changes in the rates of habitation establishment 122
Phased sequence 122Growth rates 122
terra australis 21
11

Millennial sequence 123Growth rates 124
Comments on rates of habitation establishment 124Changes in the numbers of habitations used 128
Phased sequence 128Millennial sequence 128
Growth rates 128Changes in the habitation indices in each topographic zone by the end of each successive time period 128
Phased sequence 128Millennial sequence 131
Changes in the rate of artefact accumulation — individual habitations 132Phased sequence 138Millennial sequence 139
Changes in the local rate of artefact accumulation — the catchment 139Phased sequence 141
Growth rates 141Millennial sequence 141
Growth rates 141Comments on local artefact accumulation rates 141Changes in the rate of artefact accumulation in each topographic zone in successive time periods 142
Phased sequence 142Millennial sequence 142
Discussion 144Typological phases versus millennial divisions 144Artefact accumulation rates in individual habitations 146Inter-zonal variability within the catchment 146Variations over time in the millennial growth rates 147Relationship between the timing of the quantitative changes and the appearance of qualitative changes in the stone artefact assemblages 147
Concluding comments 148
7 Quantitative changes in other regions of eastern Australia: a review 151Changes in the habitation indices 156
Changes in the rate of habitation establishment 158Changes in the number of habitations used 158Changes in the rate of known-habitation use 164Changes in the growth rates for habitation indices 164
Habitation establishment rates 165Number of habitations used 166Rate of known-habitation use 168
Changes in the artefact accumulation rates 168Dramatic decreases in artefact accumulation rates 173Dramatic increases in artefact accumulation rates 173Average annual growth rates for the artefact accumulation rates 176
Relationships between the habitation indices and the artefact accumulation rates: directions and timing 177
Direction of trends 180
terra australis 21
12

Timing 181Discussion and conclusions 182
Other Australian regions and sites, and later studies 185
8 A re-examination of interpretations and explanations for changes in habitation and artefact indices in eastern Australia 187Population-change explanations 187
Assumptions underlying the population-change explanations 187Implications of population-change premises 189Growth rates 191Population-change conclusions 193
Behavioural change: qualitative changes in stone artefact assemblages 194Increases in the artefact accumulation rates in the last 5000 or 4000 years BP 195
Introduction of Bondaian assemblages/’Small Tool Tradition’ 195Transition from Middle to Late Bondaian (Bondaian to Post-Bondaian) 197Conclusion relating to increases in the artefact accumulation rate 198
Decreases in the artefact accumulation rates in the last 1000 years 198Typological change 198Technological change 198Raw material change 199
Conclusions concerning qualitative changes in the stone artefact assemblages 198Conclusions and post-1980s studies 200
9 Climatic and environmental change in eastern Australia during the late Pleistocene and Holocene 203Climate change 204
Late Pleistocene 206The Holocene 207Palaeoenvironmental evidence from the Upper Mangrove Creek catchment 208
Changes in sea-level 210Changes to country 210Coastal productivity and resource availability 211The effect of sea-level change on occupation of the Upper Mangrove Creek catchment 212
The land 212Availability of resources 213
Conclusions: correlations between climate and environmental changes and catchmenttrends in habitation and artefact indices 214
10 From numbers of sites and artefacts to habitation, subsistence and land-use patterns 217Habitation patterns and subsistence organisation 219
Base camps, transit camps and activity locations 219Identifying base camps, activity locations/transit camps 221Mobility — residential or logistical? 226Other measures of mobility patterns 228
Bipolar technology 229Subsistence methods and equipment 234
Risk minimisation strategies 236
terra australis 21
13

Technological options 237Backed artefacts 238
Sources of risk and risk minimisation in the Upper Mangrove Creek catchment 238Archaeological faunal evidence 239Backed artefacts 239Ground-edged implements 241Unanswered questions and further research 241Social and territorial organisation 242
Conclusions and future research 243
References 247
Appendices
Appendix 1 277Upper Mangrove Creek catchment — random sampling units. Distribution of Artefact Types and Raw Materials in each Archaeological Deposit
Appendix 2 299Upper Mangrove Creek catchment — random sampling units. Number of Artefacts in Each Millennium and Estimated Total Number of Artefacts Accumulated in each Archaeological Deposit
Appendix 3 309Upper Mangrove Creek catchment — random sampling units.Part 1. Upper Mangrove Creek catchment. Native animal taxa identified in 310
faunal assemblages from the archaeological deposits.Part 2. Faunal remains from archaeological sites in the Mangrove Creek 312
Catchment: report no. 3 — The Random Sampling Units. Ken Aplin, 1985.Part 3. Extracts from Faunal remains from archaeological sites in the Mangrove 324
Creek catchment. A report to National Parks and Wildlife Service of NSW. Ken Aplin, 1981.
Part 4. Report on analysis of hair samples from four deposits in the Upper 332Mangrove Creek catchment. Barbara Triggs, 2002.
Appendix 4 333Review of quantitative changes in other regions of eastern Australia: case studies. 333A. Habitation indices:
NSW south coast and Sydney 333South-western Victoria 338Central Queensland highlands 340South-eastern Queensland 342NSW–ACT–Victoria: southern uplands-tablelands 344The Mallee, north-western Victoria 347NSW Hunter Valley 350
B. Artefact accumulation rates in individual habitations 354NSW south coast and Sydney 354NSW Hunter Valley and adjacent regions 356
terra australis 21
14

NSW Blue Mountains and adjacent areas 359South-western Victoria 365Lower Murray Valley, South Australia 367Central Queensland highlands 369South-eastern Queensland 377
List of Figures
1.1 Location of Upper Mangrove Creek catchment, NSW central coast. 31.2 Forested land in valley bottom, looking north along Wattle Creek. Easter 1980. 71.3 Lower slopes of forested ridgeside with Black Hands Shelter in large boulder 7
in middle distance. Easter 1978. 1.4 Periphery ridgetop on eastern side of catchment with Sunny Shelter. 7
August 1982. 3.1 Loggers: shelter with archaeological deposit dating back to ca 11,000 BP. 39
June 1980. 3.2 Emu Tracks 2: shelter with archaeological deposit. February 1980. 393.3 Grinding grooves in headwater tributary of Bucketty Gully. Grooves are 40
at bottom left extending beside deepest part of channel in the sandstone bedrock where water generally flows. June 1981.
3.4 Black Hands open archaeological deposit. Cleared river flat and colluvial 40slope adjacent to Mangrove Creek, which is marked by the line of wattle trees behind the tents. January 1978.
3.5 Loggers Shelter during excavation of Squares E and F. Squares A, B and 42C at right. August 1978.
3.6 Charcoal images, including emu and other birds, macropod, people 42(male and female) and snakes (including death adders?) in Boat Cave. 1978.
3.7 Hand stencils, including one with forearm, and black infilled kangaroo 44head in Black Hands Shelter. August 1978.
3.8 Engraved images in Emu Tracks 2: emu tracks. August 1979. 443.9 Grinding grooves at Sharp Gully: note narrow groove on left. Easter 1980. 453.10 Ground area adjacent to grinding groove in White Figure Shelter. August 1982. 453.11 Scarred tree: one of a series of footsteps made with a metal axe up the 46
tree trunk. The tree was dead when found by loggers adjacent to Mangrove Creek below its junction with Boomerang Creek. October 1979.
3.12 Distance criteria applied in defining sites. 483.13 Upper Mangrove Creek catchment: schematic cross-section of catchment 56
showing topographic zones.3.14 Upper Mangrove Creek catchment: topographic zones. 573.15 Upper Mangrove Creek catchment: location of random sampling units. 593.16 Ground-edged artefacts from Kangaroo and Echidna (test pit 2, spit 3): 68
two hatchet heads (top and bottom) and Bulga knife (centre). 3.17 Hafted retouched flake from Loggers Shelter found in lower ceilinged 69
area at rear of shelter (square Lb, spit 1). 3.18 Fragment of red ochred sandstone palette from Sunny Shelter (test pit, spit 6). 693.19 Bone artefacts from Loggers Shelters (top: Square Lb, spit 1; and three 69
at right: surface at rear of shelter, square A, spit 3-brown, and square Bk, spit 1) and Bird Tracks (three at left: from test pit, spit 3).
3.20 Fragment of a possible firestick (base) found on raised section of 70sandstone floor in Button Shelter.
terra australis 21
15

3.21 Early Holocene backed artefacts from Mussel (a: square B, spit 20; b: 73square A, spit 23) and Loggers Shelters (c: square F, spit 7; d: square F, spit 9).
4.1 Upper Mangrove Creek catchment: archaeological sites recorded in the 79random sampling units.
4.2 Upper Mangrove Creek catchment: random sampling units. Percentage 82frequency and density of archaeological traits in each topographic zone.
4.3 Upper Mangrove Creek catchment: random sampling units. (A) Estimated total 93number and (B) density of artefacts accumulated in each topographic zone.
5.1 Upper Mangrove Creek catchment: percentage frequency of each type of (A) 113archaeological trait and (B) location in the random sampling units (RSUs) compared with the storage area (SA) and the total catchment (UMCC).
6.1 Upper Mangrove Creek catchment: random sampling units. Rate of habitation 125establishment in each (A) phase and (B) millennium.
6.2 Upper Mangrove Creek catchment: random sampling units. Number of 129habitations used in each (A) phase and (B) millennium.
6.3 Upper Mangrove Creek catchment: random sampling units. Distribution of 130habitations used in each phase.
6.4 Upper Mangrove Creek catchment: random sampling units. Distribution of 133habitations used in each millennium.
6.5 Upper Mangrove Creek catchment: random sampling units. Rate of artefact 136accumulation in each phase in individual archaeological deposits. Time isrepresented to scale, but frequency is schematic only.
6.6 Upper Mangrove Creek catchment: random sampling units. Rate of artefact 137accumulation in each millennium in individual archaeological deposits. Time is represented to scale, but frequency is schematic only.
6.7 Upper Mangrove Creek catchment: random sampling units. Local rate of 140artefact accumulation in each (A) phase and (B) each millennium.
7.1 Regions reviewed in eastern Australia. 1537.2 Sites reviewed in eastern Australia. 1547.3 NSW south coast and Sydney: (A) Rate of habitation establishment in each 159
millennium. (B) Number of habitations used in each millennium. 7.4 South-western Victoria: number of habitations established in each millennium. 160
(A) Redrawn from Lourandos 1983: 86, Fig. 3: basal radiocarbon dates from a sample of 19 archaeological sites. (B) Redrawn from Williams 1988: Fig. 10.1: basal radiocarbon dates from a sample of 25 archaeological sites.
7.5 Central Queensland highlands: (A) Rate of habitation establishment in each 161millennium. (B) Number of habitations used in each millennium.
7.6 South-eastern Queensland: (A) Rate of habitation establishment in each 162millennium. (B) Number of habitations used in each millennium.
7.7 NSW–ACT–Victorian southern uplands-tablelands: (A) Rate of habitation 163establishment in each millennium. (B) Number of habitations used in eachmillennium.
7.8 The Mallee, north-western Victoria: rate of known-habitation use in each 164millennium based on radiometrically dated sites, which were assigned to amillennium on the basis of calibrated radiocarbon dates and TL dates.
7.9 NSW Hunter Valley: number of habitations known to be used. (A) Mount 165Arthur North and South, Muswellbrook. (B) central lowlands (Singleton area).
7.10 NSW south coast: (A) Burrill Lake, (B) Currarong 1, (C) Currarong 2, (D) 169Sassafras and (E) Bass Point. Redrawn from Hughes and Lampert 1982, Figs 1 to 5.
terra australis 21
16

7.11 Sandy Hollow, NSW Hunter Valley: rates of artefact accumulation (number 170per millennium).
7.12 Milbrodale, NSW Hunter Valley: rates of artefact accumulation 170(number per millennium).
7.13 Bobadeen, Ulan, upper Goulburn River, NSW: rates of artefact accumulation 171(number per millennium).
7.14 Big L, NSW Hunter Valley (southern rim): rates of artefact accumulation 171(number per millennium).
7.15 Yango Creek, NSW Hunter Valley (southern rim): rates of artefact accumulation 171(number per millennium).
7.16 Macdonald River, NSW: rates of artefact accumulation (number per 172millennium).
7.17 Springwood Creek, NSW Blue Mountains: rates of artefact accumulation 172(number per millennium).
7.18 Kings Tableland, NSW Blue Mountains: rates of artefact accumulation 173(number per millennium).
7.19 Walls Cave, NSW Blue Mountains: rates of artefact accumulation 174(number per millennium).
7.20 Capertee 3 (Square Q13), Capertee Valley, NSW: density of artefacts in 175each level (number per kilo of deposit). Redrawn from Johnson 1979: Fig. 35.
7.21 Shaws Creek K1, NSW: density of artefacts in each level (number per 175cubic metre).
7.22 Shaws Creek K2 (Square A), NSW: density of artefacts in each level 176(number per cubic metre).
7.23 Devon Downs, lower Murray Valley, South Australia: rates of artefact 177accumulation (number per millennium).
7.24 Native Well 1, central Queensland highlands: rates of artefact accumulation 178(number per millennium).
7.25 Native Well 2, central Queensland highlands: rates of artefact accumulation 179(number per millennium).
7.26 Kenniff Cave, central Queensland highlands: rates of artefact accumulation 180(number per millennium).
7.27 The Tombs, central Queensland highlands: rates of artefact accumulation 180(number per millennium).
7.28 Maidenwell, south-eastern Queensland: rates of artefact accumulation 181(number per millennium).
7.29 Gatton, south-eastern Queensland: rates of artefact accumulation 182(number per millennium).
7.30 Habitations in eastern Australia: summary of changes in the rates of artefact 183accumulation and changes in growth rates in the artefact accumulation rates.
9.1 Upper Mangrove Creek catchment: comparison between timing of changes in 205habitation and artefact indices and general climatic shifts and sea-level rise in south-eastern Australia.
10.1 Upper Mangrove Creek catchment: number of base camps and activity 224locations/transit camps used in each millennium.
10.2 Upper Mangrove Creek catchment: number and percentage frequency of 225ground implements and ground fragments in each millennium.
10.3 Upper Mangrove Creek catchment: number and percentage frequency of 226igneous artefacts in each millennium.
terra australis 21
17

10.4 Upper Mangrove Creek catchment: number and percentage frequency of 232bipolar artefacts in each millennium.
10.5 Upper Mangrove Creek catchment: number and percentage frequency of 233quartz artefacts in each millennium.
10.6 Upper Mangrove Creek catchment: number and percentage frequency of 235backed artefacts in each millennium.
Figure: Appendix 2A3–3/1 Loggers Shelter: distribution of bone and shell according to square and 325
depth. Bone weights are adjusted to a standard volume (10cm spit) and are,therefore, relative density values.
Figure: Appendix 4A4/1 Native Well 1, central Queensland highlands: rates of implement accumulation. 371
Redrawn from Morwood 1981: Fig. 23.
List of Tables
3.1 Upper Mangrove Creek catchment: terminology and abbreviations used 38for archaeological evidence.
3.2 Upper Mangrove Creek catchment: description of topographic zones into 55which catchment was stratified for sampling purposes.
3.3 Upper Mangrove Creek catchment: details of stratified random sample. 583.4 Upper Mangrove Creek catchment: details of excavations in sites with 64
archaeological deposit and potential archaeological deposit, and potential habitation shelters with potential archaeological deposit. Figures rounded to nearest 0.5cm.
3.5 Upper Mangrove Creek catchment: locations and types of deposit excavated. 663.6 Upper Mangrove Creek catchment: cultural phases and duration based on 72
typological and raw-material changes in stone artefact assemblages.3.7 Upper Mangrove Creek catchment: sequence of typological phases and 72
dating, and correlation with terminology of other researchers.3.8 Upper Mangrove Creek catchment: diagnostic criteria used as basis for 73
dating typological phases. 4.1 Upper Mangrove Creek catchment: archaeological sites in random 80
sampling units. 4.2 Upper Mangrove Creek catchment: (A) site locations, (B) archaeological 81
deposits and (C) potential habitation shelters in random sampling units. Number, percentage frequency and density in each topographic zone (density is number/sq km).
4.3 Upper Mangrove Creek catchment: dimensions and aspects of rockshelters 84with archaeological deposit.
4.4 Upper Mangrove Creek catchment: random sampling units. Archaeological 85deposits in rockshelters: area (m2 ), status and depth of archaeological deposits.
4.5 Upper Mangrove Creek catchment: random sampling units. Open 87archaeological deposits: area (m2) over which artefacts were exposed and depth of archaeological deposits.
terra australis 21
18

4.6 Upper Mangrove Creek catchment: random sampling units. Contents 87recorded in/retrieved from the archaeological deposits.
4.7 Upper Mangrove Creek catchment: random sampling units. Artefact 88types retrieved from archaeological deposits, including artefacts excavated and collected from surface of deposit outside test pits.
4.8 Upper Mangrove Creek catchment: random sampling units. Mammal remains 89retrieved from archaeological deposits: number of fragments.
4.9 Upper Mangrove Creek catchment: random sampling units. Non-mammal 90vertebrate remains retrieved from archaeological deposits: number of fragments.
4.10 Upper Mangrove Creek catchment: random sampling units. Invertebrate 91faunal remains retrieved from archaeological deposits: number of fragments.
4.11 Upper Mangrove Creek catchment: random sampling units. Summary of 91total numbers and weights (g) of all faunal remains retrieved from archaeological deposits.
4.12 Upper Mangrove Creek catchment: random sampling units. Archaeological 95deposits: number of artefacts retrieved, number of artefacts/square metre, and estimated total number of artefacts present.
4.13 Upper Mangrove Creek catchment: assemblages grouped according to 95K-means analysis.
5.1 Upper Mangrove Creek catchment: random sampling units. Archaeological 107deposits in rockshelters and geomorphological processes.
6.1 Upper Mangrove Creek catchment: random sampling units. Radiocarbon dates, 116all from full-sized charcoal samples, calibrated using Radiocarbon CalibrationProgram Rev 4.3 (Stuiver and Reimer 1993b; Stuiver et al. 1998) and rounded tonearest five years.
6.2 Upper Mangrove Creek catchment: random sampling units. Archaeological 123deposits: estimated period of habitation establishment.
6.3 Upper Mangrove Creek catchment: random sampling units. Number of 124habitations established, rate of habitation establishment and number of habitations used (A) in each phase and (B) millennium.
6.4 Upper Mangrove Creek catchment: random sampling units. 126Radiocarbon-dated archaeological deposits only: number of habitations established, rate of habitation establishment, and number of habitations used (A) in each phase and (B) each millennium.
6.5 Upper Mangrove Creek catchment: random sampling units. Phased sequence: 126growth rates for rates of habitation establishment, numbers of habitations used and local rates of artefact accumulation, based on Table 6.3A.
6.6 Upper Mangrove Creek catchment: random sampling units. Millennial sequence: 127growth rates for rates of habitation establishment, numbers of habitations used and local rates of artefact accumulation, plus average annual growth rates for local rates of artefact accumulation, based on Table 6.3B.
6.7 Upper Mangrove Creek catchment: random sampling units. Number of 131habitations established in each topographic zone in each phase.
6.8 Upper Mangrove Creek catchment: random sampling units. Number of 131habitations established, also equals rate of habitation establishment in eachtopographic zone in each millennium.
6.9 Upper Mangrove Creek catchment: random sampling units. Number of 132habitations used in each topographic zone in each phase.
terra australis 21
19

6.10 Upper Mangrove Creek catchment: random sampling units. Number of 132habitations used in each topographic zone in each millennium.
6.11 Upper Mangrove Creek catchment: random sampling units. Archaeological 134deposits: estimated total number of artefacts accumulated in each phase, rounded to nearest 50.
6.12 Upper Mangrove Creek catchment: random sampling units. Archaeological 135deposits: rate of artefact accumulation in each phase (number per millennium),rounded to nearest 50.
6.13 Upper Mangrove Creek catchment: random sampling units. Archaeological 138deposits: estimated total number of artefacts accumulated in each millennium and rate of artefact accumulation for millennial sequence, rounded to nearest 50.
6.14 Upper Mangrove Creek catchment: random sampling units. Estimated total 143number of artefacts accumulated in each phase in each topographic zone, rounded to nearest 50.
6.15 Upper Mangrove Creek catchment: random sampling units. Rate of artefact 143accumulation in each phase in each topographic zone, rounded to nearest 50.
6.16 Upper Mangrove Creek catchment: random sampling units. Estimated total 143number of artefacts accumulated in each millennium in each topographic zone and rate of artefact accumulation for millennial sequence, rounded to nearest 50.
7.1 Eastern Australian regions used as comparative case studies for habitation 152indices.
7.2 Eastern Australian regions and sites used in comparative case studies for 152rates of artefact accumulation.
7.3 Regions in eastern Australia: summary of habitation indices. 1577.4 Regions in eastern Australia. Millennial growth rates for rates of habitation 166
establishment.7.5 Regions in eastern Australia. Millennial growth rates for number of 167
habitations used, and for NSW Hunter Valley known-habitation use. 7.6 Regions in eastern Australia. Average annual growth rates (excluding 0% p.a. 167
growth rates) for habitation establishment rates. 7.7 Regions in eastern Australia. Average annual growth rates (excluding 0% p.a. 168
growth rates) for number of habitations used, and for NSW Hunter Valley known-habitation use.
7.8 Regions in eastern Australia. No of habitations and direction of change in 174artefact accumulation rates in the most recent/upper levels of habitations in each region.
10.1 Upper Mangrove Creek catchment: millennial assemblages grouped 222according to K-means analysis.
10.2 Upper Mangrove Creek catchment: distribution of base camps (BC) and activity 224locations/transit camps (AL/TC) in each topographic zone in each millennium.
10.3 Upper Mangrove Creek catchment: number and percentage frequency of 225backed, ground, igneous, bipolar and quartz artefacts in each millennium.
10.4 A habitation, subsistence and land-use model for the Upper Mangrove Creek 230catchment.
10.5 Upper Mangrove Creek catchment: size of common macropod species in 239each period.
terra australis 21
20

Tables: Appendix 1A1/1 Artefact types in surface collections from rockshelters and open locations. 279A1/2 Raw materials in surface collections from rockshelters and open locations. 280A1/3 Anadara Shelter: distribution of artefact types. 280A1/4 Anadara Shelter: distribution of raw materials. 280A1/5 Black Hands Open Deposit: distribution of artefact types. 281A1/6 Black Hands Open Deposit: distribution of raw materials. 281A1/7 Black Hands Shelter (Square F): distribution of artefact types. 281A1/8 Black Hands Shelter (Square F): distribution of raw materials. 282A1/9 Boat Cave: distribution of artefact types. 282A1/10 Boat Cave: distribution of raw materials. 282A1/11 Boronia Shelter: distribution of artefact types. 283A1/12 Boronia Shelter: distribution of raw materials. 283A1/13 Caramel Wave Shelter: distribution of artefact types. 283A1/14 Caramel Wave Shelter: distribution of raw materials. 284A1/15 Delight Open Deposit: distribution of artefact types. 284A1/16 Delight Open Deposit: distribution of raw materials. 284A1/17 Delight Shelter: distribution of artefact types. 285A1/18 Delight Shelter: distribution of raw materials. 285A1/19 Dingo Shelter (Squares Ta and Tb): distribution of artefact types. 285A1/20 Dingo Shelter (Squares Ta and Tb): distribution of raw materials. 286A1/21 Elngarrah Shelter: distribution of artefact types. 286A1/22 Elngarrah Shelter: distribution of raw materials. 286A1/23 Elongated Figure Shelter: distribution of artefact types. 286A1/24 Elongated Figure Shelter: distribution of raw materials. 287A1/25 Emu Tracks 2 Shelter: distribution of artefact types. 287A1/26 Emu Tracks 2 Shelter: distribution of raw materials. 288A1/27 Geebung Shelter: distribution of artefact types. 288A1/28 Geebung Shelter: distribution of raw materials. 289A1/29 Harris Gully Shelter: distribution of artefact types. 289A1/30 Harris Gully Shelter: distribution of raw materials. 289A1/31 Kangaroo and Echidna Shelter: distribution of artefact types. 290A1/32 Kangaroo and Echidna Shelter: distribution of raw materials. 290A1/33 Loggers Shelter (Squares E/F): distribution of artefact types. 291A1/34 Loggers Shelter (Squares E/F): distribution of raw materials. 291A1/35 Low Frontage Shelter: distribution of artefact types. 292A1/36 Low Frontage Shelter: distribution of raw materials. 292A1/37 McPherson Shelter: distribution of artefact types. 292A1/38 McPherson Shelter: distribution of raw materials. 293A1/39 Mangrove Mansions Shelter (East and West): distribution of artefact types. 293A1/40 Mangrove Mansions Shelter (East and West): distribution of raw materials. 293A1/41 One Tooth Shelter: distribution of artefact types. 294A1/42 One Tooth Shelter: distribution of raw materials. 294A1/43 Sunny Shelter: distribution of artefact types. 294A1/44 Sunny Shelter: distribution of raw materials. 295A1/45 Ti-tree Shelter: distribution of artefact types. 295A1/46 Ti-tree Shelter: distribution of raw materials. 295A1/47 Uprooted Tree Shelter: distribution of artefact types. 296A1/48 Uprooted Tree Shelter: distribution of raw materials. 296
terra australis 21
21

A1/49 Venus Shelter: distribution of artefact types. 297A1/50 Venus Shelter: distribution of raw materials. 297A1/51 White Figure Shelter: distribution of artefact types. 297A1/52 White Figure Shelter: distribution of raw materials. 298A1/53 Wolloby Gully Shelter: distribution of artefact types. 298A1/54 Wolloby Gully Shelter: distribution of raw materials. 298
Tables: Appendix 2A2/1 Black Hands Shelter (Square F): number of artefacts accumulated in each 300
millennium and estimated total number of artefacts accumulated in thearchaeological deposit.
A2/2 Boat Cave: number of artefacts accumulated in each millennium and estimated 300total number of artefacts accumulated in the archaeological deposit.
A2/3 Boronia Shelter: number of artefacts accumulated in each millennium and 301estimated total number of artefacts accumulated in the archaeological deposit.
A2/4 Caramel Wave Shelter (Squares T1 and T2): number of artefacts accumulated 301in each millennium and estimated total number of artefacts accumulated in thearchaeological deposit.
A2/5 Delight Shelter: number of artefacts accumulated in each millennium and 301estimated total number of artefacts accumulated in the archaeological deposit.
A2/6 Dingo Shelter (Square Tb only): number of artefacts accumulated in each 302millennium and estimated total number of artefacts accumulated in thearchaeological deposit.
A2/7 Elngarrah Shelter: number of artefacts accumulated in each millennium and 302estimated total number of artefacts accumulated in the archaeological deposit.
A2/8 Elongated Figure Shelter: number of artefacts accumulated in each millennium 302and estimated total number of artefacts accumulated in the archaeological deposit.
A2/9 Emu Tracks 2 Shelter (Squares T2a and T2b): number of artefacts accumulated 303in each millennium and estimated total number of artefacts accumulated in thearchaeological deposit.
A2/10 Emu Tracks 2 Shelter (Square T1): number of artefacts accumulated in each 303millennium and estimated total number of artefacts accumulated in thearchaeological deposit.
A2/11 Harris Gully Shelter: number of artefacts accumulated in each millennium and 304estimated total number of artefacts accumulated in the archaeological deposit.
A2/12 Kangaroo and Echidna Shelter (Squares T1 and T2): number of artefacts 304accumulated in each millennium and estimated total number of artefactsaccumulated in the archaeological deposit.
A2/13 Loggers Shelter (Squares E/F): number of artefacts accumulated in each 305millennium and estimated total number of artefacts accumulated in thearchaeological deposit.
A2/14 Sunny Shelter: number of artefacts accumulated in each millennium and 306estimated total number of artefacts accumulated in the archaeological deposit.
A2/15 Uprooted Tree Shelter: number of artefacts accumulated in each millennium and 306estimated total number of artefacts accumulated in the archaeological deposit.
A2/16 White Figure Shelter: number of artefacts accumulated in each millennium and 307estimated total number of artefacts accumulated in the archaeological deposit.
A2/17 Excavated archaeological deposits where estimated duration is less than 3071000 years: number of artefacts accumulated in each millennium/square andestimated total number accumulated in the archaeological deposits
terra australis 21
22

Tables: Appendix 3A3–2/1 Summary of faunal assemblage by excavation unit for small assemblages. 314
See separate tables for Dingo, Two Moths and White Figure. Weights and counts exclude hairs and feathers listed in Table A3-2/2.
A3–2/2 Taxonomically diagnostic faunal remains listed by site and excavation unit 315for small assemblages.
A3–2/3 Dingo Shelter: summary of faunal assemblage by excavation unit. 317A3–2/4 Dingo Shelter: taxonomically diagnostic faunal remains listed by excavation unit. 318A3–2/5 Two Moths: summary of faunal assemblage by excavation unit (totals exclude 320
feathers and hairs).A3–2/6 Two Moths: taxonomically diagnostic faunal remains listed by excavation unit. 320A3–2/7 White Figure: summary of faunal assemblage by excavation unit (FS = field sort; 322
LS = laboratory sort; Total = FS + LS; see Chapter 5 this monograph).A3–2/8 White Figure: taxonomically diagnostic faunal remains listed by excavation unit. 323A3–3/1 Loggers, Black Hands and Geebung: total number and weight of faunal 324
remains (from Aplin 1981: Table 1).A3–3/2 Loggers Shelter: bone from all squares (from Aplin 1981: Table 2). 324A3–3/3 Loggers Shelter: shell from all squares (from Aplin 1981: Table 3). 325A3–3/4 Loggers Shelter: number of identified taxon for each analytical unit in all 328
squares and a site total (from Aplin 1981: Table 4).A3–3/5 Loggers Shelter: percentage composition of selected fauna (from Aplin 1981: 329
Table 21).A3–3/6 Black Hands and Geebung Shelters: bone and shell (from Aplin 1981: Table 8). 330A3–3/7 Black Hands Shelter, Square F: faunal composition (from Aplin 1981: Table 10). 331
Tables: Appendix 4A4/1 NSW south coast and Sydney: rate of habitation establishment and number of 335
habitations used in each millennium. N = 58, see Table A4/2 for sites included. A4/2 NSW south coast and Sydney: sites included in Table A4/1 and Figure 7.3, 335
with millennium in which establishment is estimated to have occurred, radiometric age, geographic location and reference.
A4/3 South-western Victoria: number of habitations established in each millennium 339based on Lourandos 1983a: Table 2 and Williams 1988: Table 10.1, excludingToolondo drainage system and Werribee burial site.
A4/4 South-western Victoria: sites included in Table A4/3 and Figure 7.4, with basal 339radiocarbon ages from Lourandos 1983a: Table 2, N = 19; Williams 1988: Table 10.1, N = 25.
A4/5 Central Queensland highlands: rate of habitation establishment and number 341of habitations used in each millennium. N = 11, see Table A4/6 for sites included.
A4/6 Central Queensland highlands: sites included in Table 45 and Figure 7.5, with 342radiocarbon ages from Morwood 1984: Table 6.2.
A4/7 South-eastern Queensland: rate of habitation establishment and number of 343habitations used in each millennium from Morwood 1987: Fig 4. N = 23, see Table A4/8 for sites included.
A4/8 South-eastern Queensland: sites included in Table A4/7 and Figure 7.6, with 343radiocarbon and estimated ages from Morwood 1987: Fig. 4. Except where noted,dated samples were charcoal.
A4/9 NSW–ACT–Victorian southern uplands-tablelands: rate of habitation 345establishment and number of habitations used in each millennium. Rockshelterdeposits N = 14, open deposits N = 11; see Table A4/10 for sites included.
terra australis 21
23

A4/10 NSW–ACT–Victorian southern uplands-tablelands: sites included in Table A4/9 345and Figure 7.7, with radiocarbon and estimated ages for rockshelters and time ofknown use for open archaeological deposits, and references.
A4/11 The Mallee, north-western Victoria: sites included in Figure 7.8 with 347radiometric ages from Ross 1984: 178–80.
A4/12 The Mallee, north-western Victoria: rates of known-habitation use. N = 141. 348A4/13 The southern Mallee, north-western Victoria: hypothetical distribution of 349
number of known-habitations used in each millennium. N = 121.A4/14 NSW Hunter Valley (central lowlands — Mt Arthur North and South): 351
number of habitations known to be used and rates of known-habitation use in each phase. Hiscock’s 1986 open archaeological deposits, N = 15.
A4/15 NSW Hunter Valley (central lowlands — Singleton area): sites included in 352Table A4/16 and Figure 7.9B with radiometric ages and references. All radiocarbon ages are from charcoal samples, except where TL noted after laboratory number.
A4/16 NSW Hunter Valley (central lowlands — Singleton area): rates of known- 353habitation use in each century/millennium. N = 12, see Table A4/15 for sites included.
A4/17 Burrill Lake, NSW south coast: rates of implement accumulation and 355average annual growth rates based on data from Hughes 1977: Table 2.13.
A4/18 Currarong 1, NSW south coast: rates of implement accumulation and average 355annual growth rates based on data from Hughes 1977: Table 3.10.
A4/19 Currarong 2, NSW south coast: rates of implement accumulation and average 355annual growth rates based on data from Hughes 1977: Table 3.11.
A4/20 Bass Point, NSW south coast: rates of implement accumulation and average 355annual growth rates based on data from Hughes 1977: Table 5.6.
A4/21 Sassafras 1, NSW south coast hinterland: rates of implement accumulation and 355average annual growth rates based on data from Hughes 1977: Table 4.3.
A4/22 Sandy Hollow, NSW Hunter Valley (Goulburn River): rates of artefact 356accumulation and average annual growth rates based on data from Moore 1970: 35–7, Table 2.
A4/23 Milbrodale, NSW Hunter Valley (central lowlands): rates of artefact 356accumulation and average annual growth rates based on data from Moore 1970: 41–5, Table 4.
A4/24 Bobadeen, Ulan, NSW Hunter Valley (upper Goulburn River): rates of artefact 357accumulation and average annual growth rates based on data from Moore 1970:45–9, Table 6.
A4/25 Big L, NSW Hunter Valley (southern rim): rates of artefact accumulation and 357average annual growth rates based on data from Moore 1981: 398, Table 2.
A4/26 Yango Creek, NSW Hunter Valley (southern rim): rates of artefact 358accumulation and average annual growth rates based on data from Moore 1981: 398–401, Table 4.
A4/27 Macdonald River (Squares A–AA–BB–CC), NSW: rates of artefact 358accumulation and average annual growth rates based on data from Moore 1981: 401–15, Table 5 and Fig. 4.
A4/28 Springwood Creek, NSW Blue Mountains: rates of artefact accumulation 360and average annual growth rates based on data taken from Stockton and Holland 1974: Table 3 and Appendix, and revised radiocarbon ages from Stockton 1993: 38–9.
terra australis 21
24

A4/29 Kings Tableland, NSW Blue Mountains: rates of artefact accumulation and 360average annual growth rates based on data from Stockton and Holland 1974: Table 3 and Appendix; Stockton n.d.; revised radiocarbon ages from Stockton 1977b: 49; 1993: 33. [1] SUA-157 and SUA-229 averaged for depth/age curve.
A4/30 Walls Cave (Site B), NSW Blue Mountains: rates of artefact accumulation 361and average annual growth rates based on depth/age curve for Levels 1 to 3assuming constant rate of sediment accumulation using data from Stockton andHolland 1974: Table 3 and Appendix.
A4/31 Shaws Creek K1, NSW: Number and density of artefacts in each level based 364on data from Stockton 1973 and Johnson 1979: Tables 2 and 4. B indicates levels with backed artefacts.
A4/32 Shaws Creek K2, NSW: density of artefacts in each unit based on data 364from Kohen et al. 1984: 67, Table 7.
A4/33 Bridgewater, south-western Victoria: distribution of stone artefacts and 366faunal remains in Phase (Unit) A and Phase (Unit) C in Pits B, C, F and F. Rates of artefact accumulation and average annual growth rates, based on data from Lourandos 1980b: Tables 13.2, 13.3, 13.4 and 13.5.
A4/34 Devon Downs (Trench C), lower Murray Valley, South Australia: rates of artefact 367accumulation and average annual growth rates based on data from Smith 1982.
A4/35 Fromms Landing 2, lower Murray Valley, South Australia: number of 368artefacts in each level, radiocarbon dates and approximate length of pit, based on data from Mulvaney 1960: 65, 70, Table 1, Fig. 3; Mulvaney et al. 1964: Table 3; Roberts and Pate 1999: Table 1.
A4/36 Fromms Landing 6, lower Murray Valley, South Australia: rates of artefact 369accumulation and average annual growth rates based on data from Mulvaney et al. 1964: 490, Table 1.
A4/37 Native Well 1, central Queensland highlands: rates of implement accumulation, 371rates of artefact accumulation and average annual growth rates based on data from Morwood 1979 and Morwood 1981: Figure 23 and Table 11.
A4/38 Native Well 2, central Queensland highlands: rates of artefact accumulation and 373average annual growth rates based on data from Morwood 1979, 1981: Table 15.
A4/39 Kenniff Cave, central Queensland highlands: rates of artefact accumulation 373and average annual growth rates based on data from Mulvaney and Joyce 1965: Tables 2 and 3; Mulvaney 1975: 155, 288.
A4/40 The Tombs (shelter), central Queensland highlands: rates of artefact 376accumulation and average annual growth rates, based on data from Mulvaney and Joyce 1965: Table 5, shelter excavation.
A4/41 Maidenwell, south-eastern Queensland: rates of artefact accumulation and 379average annual growth rates based on data from Morwood 1986: 92–3, Table 1.
A4/42 Gatton, south-eastern Queensland: rates of artefact accumulation and average 379annual growth rates based on data from Morwood 1986: 104–7, Table 5.
terra australis 21
25


Since the beginning of my research into the archaeology and prehistory of the UpperMangrove Creek catchment in 1979, many people have helped in a variety of ways and atdifferent times — during the initial salvage program for the Mangrove Creek Dam, during myPhD research project and, finally, during the transformation of the thesis into a publishedmonograph. Fieldwork and analyses were carried out during the salvage program as aconsultant to the NSW National Parks and Wildlife Service and as a PhD student in theDepartment of Anthropology, University of Sydney. Revision of the text and production of themonograph have been completed during my employment with the Australian Museum.
At the NSW National Parks and Wildlife Service (NPWS), I wish to thank the staff ofthe (then) Cultural Resources Division — in particular, Helen Clemens, Kate Sullivan andSharon Sullivan. I also wish to thank staff in the NPWS Hawkesbury District Office: Brian Vile,Dave Lambert, Tony Williams and Ian Webb for their interest, help and advice on localmatters.
The NSW Department of Public Works gave permission for me to have access to theMangrove Creek Dam catchment so I could continue with my research work once the salvageproject was completed. I wish to thank Alan Griffiths, John Palmer, Kevin Carter, PaulGilbertson, Barry Hunt and John Madden for their assistance.
At the University of Sydney, I wish to acknowledge the support, help and assistance ofthe members of staff and students of the (then) Department of Anthropology throughout thecourse of my research — in particular, I wish to thank J. Peter White for acting as mysupervisor, providing advice on all aspects of my thesis as well as looking after theadministrative side of things; Richard Wright for providing advice on statistical matters;Roland Fletcher for discussions on theoretical issues and acting as supervisor when PeterWhite was away; Roland Fletcher, in association with Helen Clemens of NSW NPWS, forproviding advice on sampling strategies for the catchment site survey; John Clegg fordiscussions on matters pertaining to all manner of things, and Ed Roper for equipping mewith knowledge and skills about computers and computer programs.
At the Australian Museum, I particularly wish to thank Betty Meehan, Jim Specht andother members of the Anthropology Division for their encouragement and assistance in bringingthis monograph to publication stage. In addition, I wish to thank the Museum’s PhotographyDepartment, in particular Carl Bento and James King, for their expert and invaluable assistancein producing photographs and digitised versions of photographic figures.
terra australis 21
27
Acknowledgements

The Australian National University’s Department of Archaeology and Natural Historyprovided a place for me to work in peace during 1996 and 1997 when I was updating the textat that time. Particular thanks to Ann Andrews, then of the Publications Department, whoorganised these facilities as well as providing an encouraging and positive welcome duringmy visits to the department.
During the many site survey and excavation fieldwork periods, many people helped.I wish to thank them not only for their hard labour, working long hours under sometimesdifficult conditions, but also for the many useful and lively discussions which took place. Inparticular, I wish to thank Tessa Corkill, Kathy Perrin and Edna Turvey, who were constantmembers of the fieldwork teams. At the time of fieldwork between 1979 and 1982, there wereno Aboriginal organisations or land councils established in the Gosford–Wyong region.However, several Aboriginal people assisted in the fieldwork at various times; they includedlocal residents and NPWS site officers: Lindsay Bostock, Wayne Cook, Dallas Donnelly, JennyFraser, Peter Ivanoff, Glen Morris and Aden Ridgeway, as well as Phil Gordon from theAustralian Museum.
Local residents provided advice on the existence of archaeological sites in thecatchment and the general locality, and on many aspects of the local environment — in thisregard I wish to thank Robert Thompson and family, Mark Swinton and Lionel Young.
Reference materials were provided by many people and advice was received duringdiscussions held with numerous others. I wish to thank these people for the time they spentand the assistance provided: Peter Hiscock, Eugene Stockton and Dan Witter on stoneartefacts; Robin Torrence and Todd Whitelaw on risk; Harry Lourandos on intensification; TimMurray on theoretical issues; Philip Hughes and Marjorie Sullivan on geomorphology; MikeBarbetti on radiocarbon dating; Dan Lunney and Peter Smith of the NSW NPWS on animalbehaviour; Pat Vinnicombe on potential habitation shelters and information deriving from theNorth Hawkesbury study; Mike Williams, then of NSW NPWS, on identification of stonematerials; Ken Aplin and Su Solomon on the origin of faunal remains in archaeologicaldeposits; Mrs J. Thompson and Doug Benson of the NSW Herbarium on the identification ofplant remains; Brian O’Toole of the University of Sydney Sample Survey Centre on samplingmethods; Anthony and Christopher George (my nephews) on calculating the average annualgrowth rates and writing a small computer program for this purpose; and Frank Sinn formathematical advice. John Edgar more recently calculated the revised K-means employed inthe final chapter. I wish to thank Roger Luebbers, Richard Robins and Mike Morwood for theirtimely responses to my requests for copies of unpublished documents. Peter Roy of theCoastal Studies Unit, Department of Geography, at the University of Sydney for advice onchanging sea-levels and coastal morphology. Scott Mooney of the School of Biological, Earthand Environmental Sciences, University of New South Wales for advice on climatic change.For Chapter 7, data from some excavated sites were reanalysed to produce depth/age curvesso that I could calculate artefact accumulation rates. In doing this, I did not consult withindividual researchers to obtain information beyond that which was available in publicationsor public documents because of the number of sites involved. Lack of certain data about thedeposit and stratigraphy in sites may well have led to some incorrect artefact accumulationrates, and I apologise to researchers who may feel I have misrepresented their data.
Fiona Roberts reproduced line drawings from my revised originals, and I thank her forher thoroughness and patience in providing the digitised versions.
I would like to give special thanks the late Patricia Vinnicombe, Kate Sullivan, PhilipHughes and Marjorie Sullivan, who provided much encouragement, stimulation and goodadvice, particularly during the formative stages of the project, but also through to the end.My thanks also to Phillip Hughes and Marjorie Sullivan for providing accommodation and
terra australis 21
28

terra australis 21
29
a stimulating environment in which to retire during visits to Canberra when revising thismonograph.
During the production of the monograph, several people read drafts of the chaptersand provided useful comments and discussions. For their helpful comments and advice,which helped change my thesis into the present monograph, I wish to thank Sarah Colley,Richard Fullagar, Phillip Hughes, Margrit Koettig, Ian McNiven, Scott Mooney, Peter Roy, JimSpecht, Marjorie Sullivan and Robin Torrence.
Funds were provided by several organisations: NSW NPWS for fieldwork andphotographic expenses and for radiocarbon dates; Carlyle Greenwell Bequest (AnthropologyDepartment, University of Sydney) for radiocarbon dates and fieldwork expenses; theAustralian Museum awarded me grant-in-aid funds for Ken Aplin to undertake the faunalanalysis and, more recently, has paid for additional radiocarbon dates, as well as photographsand illustrations for the monograph. The last two years of the PhD research in the Departmentof Anthropology at the University of Sydney were carried out under a Commonwealthpostgraduate award. NSW NPWS also gave permission for me to use their camping andexcavation equipment as well as a 4WD vehicle during fieldwork periods, and use of theirlaboratory for the analysis of materials.
In acknowledging the help of the above people, I hold none responsible for any faultsor omissions in the final product — these are my responsibility alone.
Finally, I wish to thank my husband, Barry Higgins, as well as my family and friendsfor their continued support and encouragement in my research endeavours.


Often-used indicators of cultural and demographic change include changes over time innumbers of sites and stone artefacts. They have often been interpreted as indicators ofpopulation increase in continent-wide and regional prehistories in Australia. At a regional orlocal scale, variations in numbers of sites and artefacts over space and time have been used asthe basis for proposing changes in land and resource-use patterns which include theredistribution of populations. In addition, changes in artefact numbers in individual sites havebeen used as evidence for the extent to which the use of specific locations varied over time —often referred to as changes in ‘the intensity of site use’. Unprecedented large-scale increasesin numbers of sites and artefacts were said by some researchers to have occurred about 4000BP and to have been associated with the introduction of the ‘Small Tool Tradition’.Furthermore, these quantitative changes have been part of the archaeological evidence usedsince 1980 in theories for late Holocene intensification and/or increased sociopoliticalcomplexity in south-eastern Australia — a theme which became a major focus in Australianarchaeological research.
In this context, the study of quantitative changes in the archaeological record of theUpper Mangrove Creek catchment has much to contribute. Of particular interest in thecatchment data is the lack of correlation in the timing and direction of dramatic late Holocenechanges in numbers of sites and artefacts. Most conspicuous are the differences in timing inthe dramatic increases in sites and artefacts which occurred in the second and third millenniaBP respectively, and a decrease in artefact accumulation rates in the last 1000 years, whichcontrasts strongly with the continuing increase in site numbers. Such trends and patterningthrow doubt on claims that chronological changes in numbers of sites and artefacts reflectpopulation changes. This study of the catchment data also clearly demonstrates that dramaticchanges in numbers of sites and artefacts do not necessarily coincide in time with theintroduction of the ‘Small Tool Tradition’, or other changes in the stone artefact assemblages,such as the appearance of backed artefacts, the increasing use of bipolar technology for corereduction, and variations in the abundance of certain raw materials. Other behaviouralexplanations may account for these dramatic changes in sites and artefacts and the ways in
terra australis 21
1
Introduction
1

which they can be interpreted and explained depend on the assumptions that are made. Forexample, they could be the result of the reorganisation of habitation patterns and subsistencestrategies, which included the adoption of different mobility patterns and other riskminimization strategies in the face of environmental change. If so, it is likely that suchprocesses involved the restructuring of social relationships as well as technological systems.
Research aims and context — past and present
The aim of this study is to investigate ways in which chronological and spatial changes innumbers of archaeological sites and stone artefacts can be interpreted and explained in termsof demography and human behaviour, using the Upper Mangrove Creek catchment as a casestudy. The original research aim of my doctoral thesis, however, was to investigate pre-colonial land-use and subsistence strategies in the coastal regions of south-eastern New SouthWales, that is, the land between the Great Dividing Range and its associated ranges and theocean shoreline. This strip of land can be divided into two geographical/environmental zones:the coastal plain associated with the shoreline or maritime zone, and the coastal hinterland.The central NSW coastal hinterland, except for areas such as the Cumberland Plain andHunter Valley lowlands (respectively, to the south and north of the Upper Mangrove Creekcatchment), is predominantly forested hills, ranges and dissected sandstone plateaux, which isoften very rugged country. The Upper Mangrove Creek catchment lies within the coastalhinterland (Fig. 1.1).
Field-based coastal studies in south-eastern NSW of the 1960s and 1970s focusedprincipally on the excavation of shell middens in close proximity to the shoreline (e.g., Megaw1968a, 1968b, 1974; Lampert 1966, 1971a, 1971b; Bowdler 1970, 1971, 1976). The coastal bias inthis excavation work in conjunction with the interpretation of local historical sources ledresearchers to the viewpoint that the hinterland (usually referred to as ‘inland’) was used to amuch lesser extent than the ocean and estuarine shoreline zones (Lawrence 1968, 1971; Poiner1971, 1976; Lampert and Hughes 1974). Poiner and Lawrence proposed that most of thepopulation was concentrated along the coastal shoreline and subsisted predominantly onmarine resources. They claimed the hinterland regions were used only in times of hardship;that is, in winter and/or stormy weather when fish and shellfish were difficult to obtain.Lampert (1971a: 63–4) concluded that the upper deposits at Burrill Lake and Currarongrepresented the activities of people with wide-ranging economic interests (land, estuary andseashore), but with a strong orientation towards seashore resources. Later regional studies forthe NSW far south coast and central coast by Attenbrow (1976) and Ross (1976) respectivelyled to models for site distribution and subsistence patterns in which the coastal hinterlandswere occupied to a greater degree than proposed by some of the earlier researchers. These twoliterature reviews showed that inhabitants of the coastal hinterlands of these regions belongedto different clans who spoke different dialects (or, for the Sydney region, Ross claimeda different language — see also Ross 1988) from the people who lived along the adjacent oceancoastline. The Upper Mangrove Creek catchment was most likely part of the country ofa hinterland group — a clan of the Darginung (Capell 1970: Map 1; Attenbrow 1981: 16–22).
In 1979, initial results from the Mangrove Creek Dam salvage project indicated thatthe catchment was an ideal locality in which to undertake a field investigation into Aboriginaluse of the coastal hinterland. There were numerous sites with various types of archaeologicalevidence (e.g., archaeological deposits, pigment and engraved images, grinding grooves andscarred trees); there were stratified sites with chronological depth to the archaeological recordgoing back ca 11,000 years; and the length of habitation recorded at individual sites with
What’s changing: population size or land-use patterns? The archaeology of Upper Mangrove Creek, Sydney Basin
terra australis 21
2

archaeological deposits varied (Furey 1978; Attenbrow 1980; Vinnicombe 1980 IX C: 6–11). Itwas also known that within the observed time depth, temporal changes occurred in variousaspects of the archaeological record — in the stone artefact types and assemblages, in thetechnology, and in the raw materials from which stone artefacts were produced. It was thuswith some knowledge of the catchment’s archaeological record from the salvage excavationsand within the above research context that I began my research project in the Upper MangroveCreek catchment.
However, I considered the data obtained from the salvage project, which wasrestricted principally to the storage area (i.e., the valley bottom), were a biased sample andunlikely to be representative of the evidence for Aboriginal use of the total catchment.Additional fieldwork was therefore undertaken in that part of the catchment which lies abovethe storage area. An intensive survey of the upper part of the catchment in a manner similar to
Introduction
terra australis 21
3
Figure 1.1 Location of Upper Mangrove Creek catchment, NSW central coast.
0 20
km
Upper MangroveCreek catchment
BOTANY BAY
PORT JACKSON
BROKEN BAY
TUGGERAH LAKE
LAKE MACQUARIE
Newcastle
Singleton
Ulan
Wyong
Gosford
SydneyNEPEAN R
HAWKESBURY R
COLO R
MACDONALD R
WOLLOMBIBROOK
MANGROVECREEK
HUNTER R
GOULBURN R
CAPERTEE R
N
BRISBANE WATERS
Cumberland Plain
GROSE R

that undertaken for the storage area was not practicable in terms of the finances available andtime constraints, so I designed a survey program to sample the catchment.
During the course of the research project it became clear to me that the nature of thearchaeological evidence available from the catchment would be far more detailed thananything that was yet recorded for the coastal/maritime zone in the NSW central or southcoasts. Thus comparisons between the two zones (coast and hinterland) could not be made atthe same level. Such comparative work will have to wait until a study comparable to thatundertaken in the Upper Mangrove Creek catchment is carried out in the coastal zone.
It also became apparent during analyses of the data that certain quantitative changesin the catchment’s archaeological record were relevant to and had consequential implicationsfor then current research issues relating to the interpretation and explanation of the mid- tolate Holocene archaeological record in Australia (Attenbrow 1982b). These issues involved aperceived continuing increase in the numbers of sites and artefacts through time in manyregions in eastern Australia, and the belief that dramatic increases in sites and artefacts werethe product of dramatic population increases (e.g., Lampert and Hughes 1974; Hughes andLampert 1982; Ross 1981, 1984; Beaton 1983, 1985). These changes also were argued to beassociated with the introduction of the Small Tool Tradition, and were a principal line ofevidence for advocates of intensification and/or increased sociopolitical complexity in the lateHolocene (Lourandos 1983a, 1985a; Ross 1984; Williams 1985, 1987, 1988).
I considered that the chronological changes in the number of habitations established,the number of habitations used and the numbers of artefacts accumulated which I haddocumented in the Upper Mangrove Creek catchment were relevant to the then currentmodels and hypotheses which incorporated population increase. Of particular relevance wasthe late Holocene decrease in the artefact accumulation rates which occurred in the firstmillennium BP in the catchment as a whole and in some individual sites. These decreasesoccurred during the same period as the numbers of sites inhabited and the numbers of sitesestablished continued to increase. Changes in numbers of artefacts and sites could thus notboth be indicators of population change. Also of significance was the fact that the documentedquantitative changes did not necessarily all occur at the same time — dramatic increases inartefact numbers occurred in the third millennium BP, whereas they occurred in site numbersin the second and first millennia BP. In addition, the timing of these quantitative changes didnot correlate with the timing of qualitative changes in the stone artefact assemblages.
Early in 1985, I altered the focus of my research. Rather than focusing on theinterpretation of site/artefact distribution patterns across the catchment in a regional context,I began investigating temporal changes in quantitative aspects of the catchment’s archaeologicalrecord and the factors that may have produced such changes. Broader issues which I began toinvestigate at this time included how quantitative changes, particularly those pertaining tonumbers of sites and artefacts, had been identified in the past in other regions of easternAustralia, as well as problems involved in interpreting and explaining the changes. Theseinvestigations highlighted the limited nature of both the data that were then available and ourunderstanding of the ways in which changes in population numbers and different aspects ofhuman behaviour are manifested in the archaeological record.
This monograph is based on my doctoral thesis submitted in 1987, however, somechanges have been made. In addition to restructuring the presentation of some information anddiscussions, certain sections of the thesis as well as some tables and figures are excluded as theyare not directly relevant to the monograph’s main theme. Thesis Chapter 2, in which I reviewedprevious site and/or artefact distribution studies, is excluded. This chapter illustrated the type ofstudies that were based on spatial patterning of sites and artefacts across the land, the type ofinvestigations that had included or had been based on site and artefact distribution studies in
What’s changing: population size or land-use patterns? The archaeology of Upper Mangrove Creek, Sydney Basin
terra australis 21
4

Australia, and the way in which my study was similar to and/or differed from other Australiandistribution studies. A review of sampling theory and the use of sampling in archaeologicalsurveys in Australia is also excluded (in thesis Chapter 4), as well as discussions on spatialdistribution patterns within the Upper Mangrove Creek catchment (in thesis Chapter 5).
Additional information has been included in the monograph to acknowledge thenumerous studies that have taken place since 1987. In addition, a further four radiocarbondates for sites in the catchment are included in the analyses (Chapter 6), and more recent datesfrom studies carried out in regions adjacent to the catchment are referred to (Chapter 7). Theseadditional studies and radiocarbon dates support the findings of the thesis. The last four thesischapters (8 to 11) have been reordered so that the chapter about climatic and environmentalchanges, which has been revised to incorporate the findings of current palaeo-ecologicalstudies, is now Chapter 9. Thesis Chapters 9, 10 and 11 have been rewritten as Chapters 8 and10. The final chapter (10) now presents behavioural interpretations of the catchment habitationand artefact indices in terms of changes over time in subsistence and mobility patterns andrisk minimisation strategies — themes that were introduced but not explored in the thesis.
Research methods — an outline
The following lines of investigation were undertaken as part of the research project and havebeen presented in subsequent chapters in the following order.• A review of interpretations and explanations proposed by other researchers during the
1970s and 1980s for quantitative changes in the archaeological record (Chapter 2).• Archaeological site survey and excavation in the Upper Mangrove Creek catchment. The
aim of the fieldwork program was to retrieve evidence of the length, nature, extent andintensity of Aboriginal use of the catchment. The fieldwork was designed to obtain anunbiased (and hopefully representative) set of quantified data relating to spatial andtemporal changes in the archaeological record. The survey was carried out under aprobability sampling scheme — a stratified random sample. All excavatable sites witharchaeological deposits and a purposefully selected sample of potential archaeologicaldeposits in rockshelters in the random sampling units were excavated (Chapters 3 and 4).
• An examination of factors likely to have affected the archaeological record and the datasets which form the basis of the analyses. This examination was undertaken to establishwhether the documented spatial and temporal changes were likely to have been biasedby natural (e.g., geomorphological), methodological and/or analytical processes. It wasincluded so that I would be aware of, and perhaps could control for, at least some of thebiases which may have skewed the results and subsequent conclusions (Chapter 5).
• Analyses of field data from the Upper Mangrove Creek catchment. The analyses weredesigned to obtain information on the spatial distribution of archaeological sites andpotential habitation sites in the catchment, as well as the timing of initial habitation andtemporal changes in the contents of each excavated habitation site. To quantify temporalchanges in the numbers of sites inhabited and the numbers of artefacts accumulated,I calculated three indices: the rate of habitation establishment, the number of habitationsused and the rate of artefact accumulation. The latter was calculated not only for each ofthe habitations, but also for the catchment as a whole and for each topographic zone.When applied to the combined data for the whole catchment, this index is called thelocal rate of artefact accumulation (Chapter 6).
Introduction
terra australis 21
5

• Examination of the data from several regions in eastern Australia on which explanationsfor quantitative changes have been and/or can be based. The reason for this examinationwas twofold: firstly, to examine the data on which researchers of the 1970s and 1980s hadbased their conclusions and, secondly, to establish whether the temporal trendsdocumented for the Upper Mangrove Creek catchment were anomalous (Chapter 7).
• A re-examination of population-change and behavioural explanations of the 1970s and1980s against the archaeological evidence on which they were based. This comparisonindicates that simplistic relationships between numbers of sites/artefacts and numbersof people, or between artefact numbers and introduction of the ‘Small Tool Tradition’or Bondaian assemblages, are unlikely to describe the full complexity of a region’sprehistory (Chapter 8).
• A review of the evidence for climatic and environmental change during the Holocene andlate Pleistocene in eastern Australia. Climatic and environmental change may haveinfluenced human behaviour and thus may have been an indirect factor in producing theobserved changes in the archaeological record. These discussions concentrate on the periodduring which the Upper Mangrove Creek catchment is known, from the archaeologicalevidence, to have been inhabited; that is, the last 11,000 years (Chapter 9).
• Interpretation of the Upper Mangrove Creek habitation and artefact indices based onprior models and theories relating to habitation, subsistence and mobility patterns andrisk minimisation strategies (Chapter 10).
Research area
Mangrove Creek is a southerly flowing creek draining into the Hawkesbury River on the NSWcentral coast. The research area is the catchment of Mangrove Creek Dam, which wasconstructed between 1978 and 1982 to supply water for the Gosford–Wyong area. Thecatchment, which is 101 sq km in area, is about 80km north of Sydney Harbour (Fig. 1.1). It isnorth-west of Wyong, approximately 33km from the ocean shoreline and 28km north of theHawkesbury River. Geologically, the area is part of the Hornsby Plateau of the Sydney Basin.It is heavily dissected sandstone country with a maximum elevation of about 200m. The valleyfloor at the dam wall has an elevation of about 25m above sea-level. Valleys are steep-sidedwith clifflines and small outcrops of sandstone on the ridgesides and along most of the creeks.Cliffs range up to 8m high.
The catchment was part of McPherson State Forest, except for small cleared areas offreehold along the wider parts of the valley bottoms and on the northern and easternridgetops adjacent to George Downes Drive. It was thus principally undeveloped landcovered with eucalypt forest and woodland with rainforest species growing along the banksof less open and steep-sided gullies (Figs 1.2 to 1.4). Except for the area inundated by the damwaters, the area remains the same today.
Mangrove Creek is estuarine in its lower reaches, but within the dam catchment it isall fresh water. Estuarine conditions extend almost 10km (as the crow flies) up MangroveCreek, i.e., about 18km from the southern end of the catchment. Tributaries in the upper partsof the catchment have been known to dry up in extremely hot weather, but even in these raretimes water is available from small springs scattered throughout the catchment (pers. comm.,Robert Thompson, Kulnura 1980). (For a fuller description of the catchment environment andgeneral region see NSW Department of Public Works 1977; Benson 1978; Vinnicombe 1980;Attenbrow 1981, 1982a).
What’s changing: population size or land-use patterns? The archaeology of Upper Mangrove Creek, Sydney Basin
terra australis 21
6

Introduction
terra australis 21
7
Figure 1.3 Lower slopes of forested ridgeside with BlackHands Shelter in large boulder in middle distance. Easter1978. Photographer Val Attenbrow.
Figure 1.4 Periphery ridgetop on eastern side of catchment with Sunny Shelter. August 1982.
Photographer Val Attenbrow.
Figure 1.2 Forested land in valley bottom, looking north
along Wattle Creek. Easter 1980. Photographer Val Attenbrow.
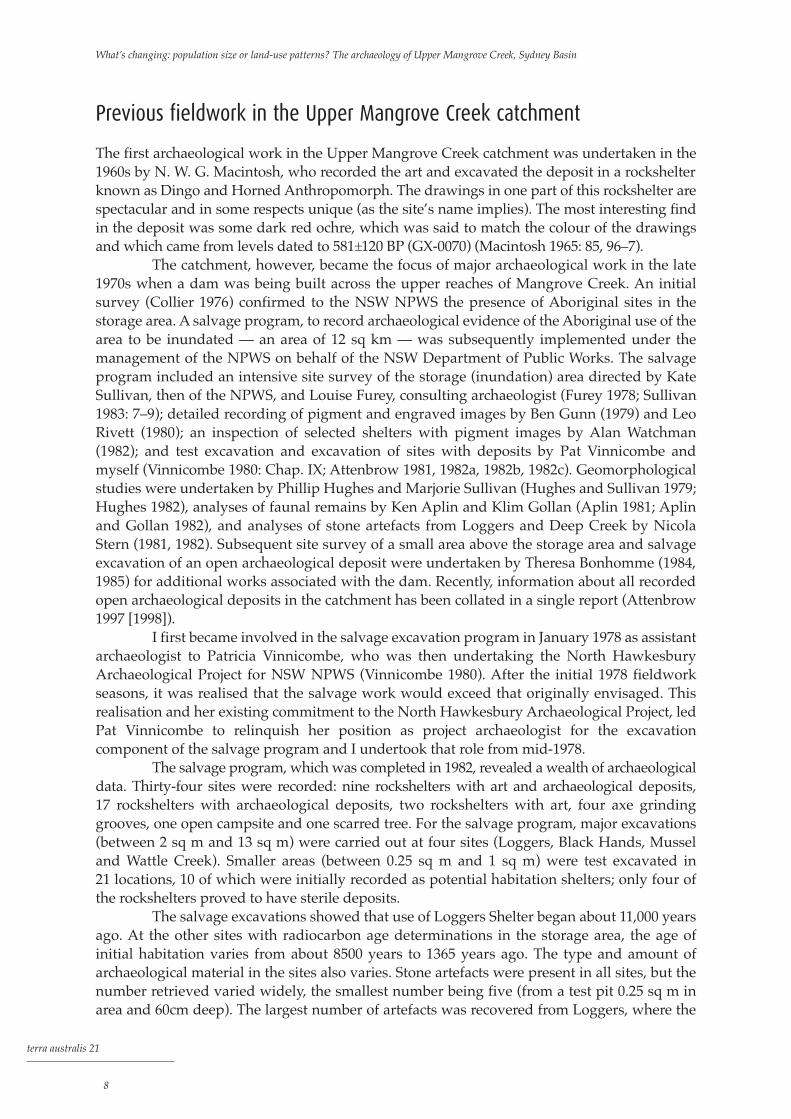
Previous fieldwork in the Upper Mangrove Creek catchment
The first archaeological work in the Upper Mangrove Creek catchment was undertaken in the1960s by N. W. G. Macintosh, who recorded the art and excavated the deposit in a rockshelterknown as Dingo and Horned Anthropomorph. The drawings in one part of this rockshelter arespectacular and in some respects unique (as the site’s name implies). The most interesting findin the deposit was some dark red ochre, which was said to match the colour of the drawingsand which came from levels dated to 581±120 BP (GX-0070) (Macintosh 1965: 85, 96–7).
The catchment, however, became the focus of major archaeological work in the late1970s when a dam was being built across the upper reaches of Mangrove Creek. An initialsurvey (Collier 1976) confirmed to the NSW NPWS the presence of Aboriginal sites in thestorage area. A salvage program, to record archaeological evidence of the Aboriginal use of thearea to be inundated — an area of 12 sq km — was subsequently implemented under themanagement of the NPWS on behalf of the NSW Department of Public Works. The salvageprogram included an intensive site survey of the storage (inundation) area directed by KateSullivan, then of the NPWS, and Louise Furey, consulting archaeologist (Furey 1978; Sullivan1983: 7–9); detailed recording of pigment and engraved images by Ben Gunn (1979) and LeoRivett (1980); an inspection of selected shelters with pigment images by Alan Watchman(1982); and test excavation and excavation of sites with deposits by Pat Vinnicombe andmyself (Vinnicombe 1980: Chap. IX; Attenbrow 1981, 1982a, 1982b, 1982c). Geomorphologicalstudies were undertaken by Phillip Hughes and Marjorie Sullivan (Hughes and Sullivan 1979;Hughes 1982), analyses of faunal remains by Ken Aplin and Klim Gollan (Aplin 1981; Aplinand Gollan 1982), and analyses of stone artefacts from Loggers and Deep Creek by NicolaStern (1981, 1982). Subsequent site survey of a small area above the storage area and salvageexcavation of an open archaeological deposit were undertaken by Theresa Bonhomme (1984,1985) for additional works associated with the dam. Recently, information about all recordedopen archaeological deposits in the catchment has been collated in a single report (Attenbrow1997 [1998]).
I first became involved in the salvage excavation program in January 1978 as assistantarchaeologist to Patricia Vinnicombe, who was then undertaking the North HawkesburyArchaeological Project for NSW NPWS (Vinnicombe 1980). After the initial 1978 fieldworkseasons, it was realised that the salvage work would exceed that originally envisaged. Thisrealisation and her existing commitment to the North Hawkesbury Archaeological Project, ledPat Vinnicombe to relinquish her position as project archaeologist for the excavationcomponent of the salvage program and I undertook that role from mid-1978.
The salvage program, which was completed in 1982, revealed a wealth of archaeologicaldata. Thirty-four sites were recorded: nine rockshelters with art and archaeological deposits,17 rockshelters with archaeological deposits, two rockshelters with art, four axe grindinggrooves, one open campsite and one scarred tree. For the salvage program, major excavations(between 2 sq m and 13 sq m) were carried out at four sites (Loggers, Black Hands, Musseland Wattle Creek). Smaller areas (between 0.25 sq m and 1 sq m) were test excavated in21 locations, 10 of which were initially recorded as potential habitation shelters; only four ofthe rockshelters proved to have sterile deposits.
The salvage excavations showed that use of Loggers Shelter began about 11,000 yearsago. At the other sites with radiocarbon age determinations in the storage area, the age ofinitial habitation varies from about 8500 years to 1365 years ago. The type and amount ofarchaeological material in the sites also varies. Stone artefacts were present in all sites, but thenumber retrieved varied widely, the smallest number being five (from a test pit 0.25 sq m inarea and 60cm deep). The largest number of artefacts was recovered from Loggers, where the
What’s changing: population size or land-use patterns? The archaeology of Upper Mangrove Creek, Sydney Basin
terra australis 21
8

greatest area and volume was excavated. The highest density of artefacts (number/kilo ornumber/cu m of deposit), however, came from Mussel, where an area of 1 sq m with a depthof 140cm produced 14,191 artefacts (Attenbrow 1981: Tables 6.6 and 6.8). Further excavation atMussel after submission of the 1981 salvage report showed that the cultural deposit has a totaldepth of 180cm and provided an earlier radiocarbon age of 8730±70 BP (SUA-2410).
The research potential of the catchment was realised not long after the salvageprogram began and I registered as a part-time postgraduate student at the University ofSydney in 1979. This was well before the salvage program was finished and, for the next fouryears, both the salvage program and the research project were carried out simultaneouslywithin similar research frameworks. The study area for my postgraduate work, however,consisted of the total catchment — that is, the land above the storage area as well as thestorage area. To differentiate between the two studies in this monograph, I refer to them as the‘salvage program’ and the ‘research project’. The study area for the research project is referredto as ‘the Upper Mangrove Creek catchment’ or ‘the catchment’, and the area inundated by theMangrove Creek Dam as the ‘storage area’.
For the salvage excavation reports (Attenbrow 1981, 1982b), data from the storagearea only were presented and conclusions relating to use of the area were drawn on the basisof those data. In my doctoral thesis (Attenbrow 1987) and this monograph, I concentrate andbase conclusions on the results of a sampling program of the total catchment, which includesland within as well as above the storage area. Some sites in the storage area also occur in thecatchment sampling units and thus the ‘storage area’ and ‘catchment’ data sets are notmutually exclusive.
Introduction
terra australis 21
9


The archaeological record indicates that many aspects of Aboriginal life and culture — toolkits, technology, use of raw materials, and modes of subsistence — changed throughout theperiod of Australian prehistory. In addition, although finding them archaeologically isdifficult, it is acknowledged that changes occurred in the demographic, social, ideological andpolitical aspects of life throughout this period. Stanner (1965: 4) believed Aboriginal societyand culture were ‘the end-products of millennia of non-linear development’ and ‘were madeup of forms and values far removed and transformed from an adaptive plane’. White andO’Connell (1982: 133) stated that the many varied life-ways recorded during the 18th and 19thcenturies were ‘the end-result of a long history, but their final form was developed particularlyduring the last few thousand years’; and Lampert (1971a: 70) said that the archaeologicalrecord for the past 5000 years in south-eastern Australia shows the formation of ‘culture-areas’within which similar changes seemed to have occurred.
It is thus accepted that changes in the archaeological record indicate significant socialand cultural changes within hunter-gatherer societies (e.g., Mulvaney 1975: 120–2; McBryde1977: 225; Bailey 1983a: 185–6; Lourandos 1985a: 385; David and Chant 1995: 513–6). However,the direct or indirect causal relationships between social and cultural changes anddocumented changes in the archaeological record are far from clear, and the nature of thecultural changes that may have occurred and the reason/s for them have been much debated.Are economic, technological or demographic shifts being reflected in the archaeologicalrecord, or social, political or ideological changes (e.g., Fletcher 1977a, 1977b: 49, 146–7; Conkey1978, 1984; Gamble 1982, 1983; Bailey 1983d; Beaton 1983, 1985); or is it a combination of thesevarious aspects of life which together represent a late Holocene intensification associated withincreasing complexity in sociopolitical organisation, which was accompanied by populationincrease (Lourandos 1983a, 1984, 1985a, 1985b, 1987, 1988, 1993, 1997)? The ‘intensificationdebate’ (as it is often referred to) has become one of the most contentious debates in recentAustralian archaeology, and has its proponents (e.g., Morwood 1984; Ross 1984; Williams
terra australis 21
11
Increases and decreases in numbers of sitesand artefacts: a review of interpretationsand explanations of the 1970s and 1980s
2

1985, 1988; Flood et al. 1987; Barker 1991; David and Chant 1995: 361–3, 437–8; David 1990:90–1; Ross et al. 1992: 109; Lourandos and Ross 1994) as well as opponents and critics,especially in terms of the forms of evidence and sources used (e.g., Rowland 1983: 72–4, 1989:40; Yoffee 1985: 177–80; Hall and Hiscock 1988b: 16–19; Davidson 1990; Bird and Frankel 1991a;Sutton 1990; Williamson 1998: 144–6; Mulvaney and Kamminga 1999: 270–2; Lilley 2000).
Changing numbers of sites and artefacts are often involved in the proposedexplanatory and interpretive models at a continental, regional or site level. Climatic and/orenvironmental changes are often involved in explanations as well, and, in this regard,regionalisation, risk minimisation and changes in mobility patterns are now used increasinglyas contexts in which alternative models and hypotheses are proposed for changing numbersof sites and artefacts in association with other archaeological evidence. This chapter focuses onstudies of the 1970s and 1980s in which changing numbers of sites and artefacts were theprincipal lines of evidence for claims of dramatic increases in population size (at a continental,regional or site-specific level), as well as part of the archaeological evidence on which theconcept of late Holocene intensification was formulated.
In analysing archaeological evidence from the Upper Mangrove Creek catchment,I calculated several indices that document temporal changes in numbers of sites and artefacts.These indices are referred to as: 1. the rate of habitation establishment;2. the number of habitations used; and,3. the rate of artefact accumulation. I refer to changes in these indices collectively as ‘the quantitative changes in’ or ‘the quantitativeaspects of’ the archaeological record (for methods of calculation, see Chapter 6). These termshave not been employed by all researchers, and other terms used include changes in the numberof sites occupied, increases through time in numbers of sites and artefacts, changes in theconcentrations of artefacts, changes in discard rates, changes in the intensity of site use, andchanges in intensity of occupation (with more sites, artefacts and people).
Many researchers proposed or accepted that in Australia there was a continuingincrease over time in the number of archaeological sites (especially habitation sites)established and/or used in various regions, and/or in the number of artefacts accumulated inindividual sites, particularly in the last 5000 years (Johnson 1979: 39; Bowdler 1981; Morwood1984: 371, 1986, 1987; Ross 1984, 1985: 87; Beaton 1985: 16–18; Fletcher-Jones 1985: 282, 286;Lourandos 1985a: 393–411, 1985b: 38; White and Habgood 1985; see also discussion in Hiscock1986). These late-Holocene increases were often relatively dramatic compared with earlierincreases.
Many 1970s and 1980s explanations for these late-Holocene increases were based onthe acceptance or assumption that, after an initial dramatic increase, the indices continued toincrease until British colonisation. However, several researchers documented decreases in therates of artefact accumulation at individual sites (e.g., Schrire 1972; Stockton and Holland1974; Johnson 1979: 94, 111; Kohen et al. 1981; Moore 1981; Smith 1982; Ferguson 1985;Morwood 1986, 1987; Hiscock 1984, 1988b), while Hiscock (1986) claimed a decline in sitenumbers as well as in artefact discard rates. Hughes and Lampert (1982) acknowledgeddecreased implement accumulation rates in the last 1000 to 2000 years at some sites on theNSW south coast, but their conclusions suggest they assumed the general regional orcontinent-wide pattern was for implement accumulation rates, and thus population size, tocontinue increasing. Most researchers who identified a decrease in the indices put forwardvarious interpretations and explanations, but general population decrease, as opposed toredistribution of populations at a local or regional level, was not advocated.
What’s changing: population size or land-use patterns? The archaeology of Upper Mangrove Creek, Sydney Basin
terra australis 21
12

In studies of other parts of the world where examination of temporal changes in thequantitative aspects of the archaeological record were included, population increase,climatic/environmental change, intensification and increasing cultural and social complexityalso featured in explanatory and interpretive models. Many overseas studies used quantitativedata to describe processes involved in the change from a hunter-gatherer subsistence mode to afarming (agriculture/animal domestication) and usually more sedentary lifestyle, or changewithin post-hunter-gatherer periods (e.g., Willey 1953, 1956; Schwartz 1956; MacNeish 1964, 1973;Binford 1968; Barker 1975). Other studies investigated temporal change within the period ofhunter-gatherer subsistence mode in Africa (Mazel 1989a, 1989b), Europe (Mellars 1973: 268–73;Conkey 1978: 75–80; Gamble 1982, 1983, 1984; Bahn 1983; Bailey 1983b, 1983c, 1983d; Bailey et al.1983; Clark and Straus 1983; Davidson 1983; Straus and Clark 1983) and America (Streuver 1968;Bettinger 1977, 1981; M. Hall 1981), but the periods under study in Europe and Africa were at amuch earlier time than in the Americas and Australia. In Europe, they concerned the transitionfrom the Middle to the Upper Palaeolithic, and in Africa the periods from the time of ‘early tool-using hominids’ (ca two million years ago) to the late-Holocene.
The following review of Australian studies divides the interpretations andexplanations of quantitative changes in the archaeological record into two main groups: 1. those that are based on the acceptance and/or assumption that the number of sites
and/or artefacts continued to increase until contact;2. those that are based on the acceptance that there was a decrease in the number of sites
and/or artefacts in the late-Holocene.Within each of these two groups, the interpretations and explanations proposed by
previous researchers are discussed under three headings: 1. Population change: this refers to changes in the number of people or size of the
population;2. Behavioural change: changes in behaviour relating, for example, to tool manufacturing
and subsistence practices, and use of space within a site (this excludes explanationsthat relate directly to demographic changes involving birth and death rates);
3. Natural processes: including geomorphological and biological processes which mayhave affected the archaeological record. These processes have been proposed asexplanations only for the increases in the habitation indices (or to explain the lack ofor low numbers of early sites).
The evidence used by Lourandos for population increase in his model of late-Holoceneintensification is discussed under ‘Increases — population change’.
In the following review and discussions, I take a broad view of the term ‘populationchange’ and include not only explanations which proposed general or continent-widepopulation change, but also redistribution of regional and local populations, and changes inthe number of people- or person-days spent in a site or region. The population-changeexplanations and most of those that come under behavioural change could be said to be basedon two opposing assumptions.1. The population-change explanations are based on an assumption that the ratio
between the number of people (or number of person-days) and the number ofhabitations and/or artefacts remained relatively constant over time, and therefore themagnitude of the quantitative changes in the archaeological record is indicative of themagnitude of the changes in population size (national, regional, or site specific).
2. The assumption underlying many of the behavioural-change explanations is that thequantitative changes are the product of changes in behaviour associated withhabitations and stone artefacts, while the population size remained relatively stable.That is, the ratio between the number of habitations and/or artefacts and the numberof people changed.
Increases and decreases in number of sites and artefacts: a review of interpretations and explanations of the 1970s and 1980s
terra australis 21
13

Smith (1982: 114), in discussing temporal changes in the quantity of occupationaldebris within a site, referred to changes in the number of people per unit time (Assumption 1above) as ‘simple functional change’, and to Assumption 2 as ‘a change in the rate of discard’,which he called ‘complex functional change’.
The dichotomy is not as extreme as these two assumptions imply. Some of thepopulation-change advocates said that the magnitude of the changes in the archaeologicalrecord is not necessarily equivalent to the magnitude of the change in the population size;that is, the ratio between numbers of people and numbers of habitations/artefacts did notnecessarily remain constant over time (e.g., Ross 1984: 235, 1985: 83). If this is the case,changes in behaviour associated with the use of habitations and/or artefacts must haveoccurred at the same time as the number of people increased or decreased. Changes inbehaviour were probably associated with many of the population-change explanations(particularly those relating to redistribution of populations and ‘intensity of site use’), sothe headings ‘Population change’ and ‘Behavioural change’ should not be taken tooliterally.
In some of the studies reviewed, data presented by the researcher do not necessarilysupport the trends perceived by the researcher and/or the conclusions they reached.However, in this chapter I am interested in how perceived trends were interpreted andexplained, and the data used are examined later in Chapters 7 and 8.
‘Increases’ in the archaeological record
Most of the researchers who proposed interpretations and explanations for dramatic orsubstantial increases in the quantitative aspects of the archaeological record drew theirconclusions from a specific set of regional data they had studied, although they often drew ondata from other regions for support (e.g., Hughes and Lampert 1982; Lourandos 1983a, 1985a;1987; Morwood 1984, 1986, 1987). The discussions under each of the following headings aretherefore presented in terms of regions as much as being the conclusions of individualresearchers.
Population changeExplanations involving changes in numbers of people at a continental or regional scale havebeen divided into General Population Increase, Redistribution of Populations, IncreasedIntensity of Site Use, and Intensification and Increasing Social Complexity.
General population increaseSome of the earliest explanations involving population increase were put forward to accountfor greater numbers of excavated sites with Bondaian assemblages than sites with pre-Bondaian assemblages in south-eastern NSW (Wade 1967; Megaw and Roberts 1974; Tracey1974). (For terminology and dating of stone artefact assemblages in south-eastern NSW, seeTable 3.6, and Chapter 3, Temporal sequences.) Other researchers postulated increasingpopulation as the explanation, or part of the explanation, for increases in quantitative aspectsof the archaeological record; the appearance of sites in less favourable and/or marginal areasin the latter half of the Holocene; and/or an increasing use of offshore islands (e.g., Hallam1972: 15, 1979: 10–12, 34; Lampert and Hughes 1974; Flood 1976: 32, 1980: 281–2, 1999: 248–9;Lourandos 1980a, 1980b, 1983a, 1984, 1985a, 1985b, 1987; Ross 1981, 1982, 1984: 267, 1985;Blackwell 1982; Hall 1982; Hughes and Lampert 1982; Sullivan 1982b: 16; Beaton 1983, 1985;Morwood 1984: 369, 1987; Ferguson 1985: 453, 498; Williams 1985, 1988).
What’s changing: population size or land-use patterns? The archaeology of Upper Mangrove Creek, Sydney Basin
terra australis 21
14

Wade (1967: 39) was one of the earliest to comment on an increase over time in thenumber of inhabited sites in the NSW south coast and Sydney region (I use the term ‘Sydneyregion’ to refer to land south of the Hawkesbury River, east of the Blue Mountains and northof Wollongong). Wade said that in the majority of sites excavated near Sydney, no evidence ofhabitation was found earlier than the Bondaian or ‘microlithic phase’. He considered theincrease in site numbers to be ‘indicative of changes in settlement pattern probably due to anincrease in population’. He discounted the argument that the patterning may be due to non-random selection of sites for excavation, and concluded that:
… the increased number of inhabited sites near Sydney indicates the exploitation of foodresources near these new sites, due to the pressure of population increase. (Wade 1967: 39)
Megaw and Roberts (1974: 9) stated that the evidence tended to suggest that the Bondaianphase (which they called Phase II) was a key period for maximum population expansion.
Increasing implement and sediment accumulation rates at three sites on the NSWsouth and central coasts (Bass Point, Burrill Lake and Curracurrang 1CU5/-) were used byLampert and Hughes (1974: 231–4) as a measure of ‘the intensity of site occupation’. Increasesin these two indices were used to support their view that the sites were used more intensivelyover time which, in turn, they said, supported their hypothesis of population increase duringthe last 7000 to 5000 years along coastal NSW. They argued that the increase in stone-workingcoincided with the arrival of the Small Tool Tradition, but at the same time there was anincrease in the rate of human-induced sedimentation. The concurrence of the increase insedimentation and stone-working was seen as evidence supporting their hypothesis that thesites were being used more frequently, rather than the view that the increase in stone-workingwas simply due to the introduction of the Small Tool Tradition, that is, to qualitative changesin the artefact assemblages.
Lampert and Hughes (1974: 231) considered that within the past 7000 to 5000 years,two factors led to increased availability of marine food resources, which in turn would haveled to the increase in population: 1. changes in coastal morphology resulting from the sea remaining at more or less its
present level throughout the past 7000–5000 years, which extended the inter-tidal andtidal zone; and,
2. the introduction of new fishing methods.Lampert and Hughes (1974: 231) hypothesised that if, along the NSW coast, it was generallytrue that hunter-gatherer population size was adjusted to the available subsistence resources,then there was a significant increase in the population of this area within the past 7000–5000years. They (1974: 233) acknowledged that the archaeological evidence is equivocal withregard to demographic change, but believed it was outweighed by their ecological evidence.They concluded, however, that it may have been a purely local rather than a large-scaledemographic episode, or it may simply reflect the arrival of coastal people at the presentshoreline.
In a later paper, Hughes and Lampert (1982: 19, 24–6) used accumulation rates forimplements and sedimentation as measures of the intensity of site occupation for five NSWsouth coast sites: Burrill Lake, Bass Point, Currarong 1 and 2 and Sassafras 1. They noted thatit was after the sea reached its present position that the most dramatic increase took place —a six- to tenfold increase on average in the last 5000 years. At the same time, they noted thatthere is variation in the archaeological record at individual sites after 2000 BP:
… all of these sites show a marked intensification of site occupation during Holocene times thatcontinued at least up until 2000 BP. After that time the trends diverged in that at some sites the
Increases and decreases in number of sites and artefacts: a review of interpretations and explanations of the 1970s and 1980s
terra australis 21
15

increase in intensity of site occupation continued but at others the intensity levelled off or therewas a slight decline. (Hughes and Lampert 1982: 19)
In support of their argument for population increase, Hughes and Lampert argued, on thebasis of 20 sites excavated in the Sydney area and on the NSW south coast, that there was anincrease in the number of new shelters occupied over time. They stated that the increase insites between 8000 BP and 6000 BP reflected ‘the arrival of the sea at its present level’ (1982:20), and that the two- to threefold increase in the numbers of sites occupied in the last 5000years does not simply reflect the destruction of earlier sites, or the establishment of sites onnewly formed sandy landforms.
The two sets of evidence, they added, must represent population increase sinceincreased accumulation rates also occur at sites away from the coast (e.g., Sassafras 1, which is35km from the coast), and increasing site numbers are seen as far inland as Willandra Lakes inwestern NSW. After looking briefly at a series of alternative hypotheses to explain the numericalincreases, they concluded that ‘only a rise in population provides an acceptable explanation’ andthat the ‘postulated’ population increase ‘after 3000 BP’ cannot be explained in terms ofenvironmental change as the coastline had essentially taken its present configuration by then(Hughes and Lampert 1982: 26). The decreases in artefact accumulation rates that occurred atsome sites after 2000 BP does not appear to be taken into account in Hughes and Lampert’spopulation-increase models. The quote above is the only point in the paper where they referredto population increase ‘after 3000 BP’, as opposed to ‘in the last 5000 years’.
One of the explanations put forward by Flood (1976: 32–3, 1980: 281–2) for thearchaeological evidence from the NSW southern uplands-tablelands built on Lampert and Hughes’conclusions. Flood stated that the present evidence (i.e., the basal dates from habitation sitesand the type of artefacts found) suggests the main period of occupation in the NSW southernuplands was within the last 5000 years. She hypothesised that the late occupation of thesouthern uplands was the result of population pressure on resources on the NSW south coast.This pressure followed the considerable population increase on the south coast, which occurredafter the resources increased about 7000 BP to 5000 BP, when the sea-level stabilised.Consequently, there was a move to the less-favourable environment of the uplands. She (1976:33) proposed that occupation of the south-eastern ‘highlands’ of Australia began with seasonaloccupation of rockshelters on top of the coastal ranges (e.g., Sassafras I, which has a basal dateof 3770±150 BP, ANU-743). Seasonal hunting was then extended into the southern tablelands,the Canberra region and the Monaro; later still, the region was occupied all year round.
Subsequently, after the analysis of the materials from Birrigai, with its basal date of21,000±220 BP (Beta-16886; Flood et al. 1987: 16, 22) and a fourfold increase in the rate ofartefact accumulation ca 3000 BP, which was maintained until the present (1987: 18), Flood et al.concluded that in the NSW south-eastern highlands there is evidence for ‘an increased usage ofindividual sites (Birrigai), increased usage of marginal environments (highlands), and theincreased establishment of new sites after 3000 BP’ (Flood et al. 1987: 23). They saw no evidencefor a late-Holocene de-intensification period at Birrigai, but that ‘the evidence strongly suggestsa redistribution of people through the landscape during the late Holocene’. They added:
For these predictions to hold true, two consequences should be visible after about 3000 years:(a) a decrease in site use and a decrease in the establishment of sites in favourable zones, and (b)an increase in site use and an increase in the establishment of sites in marginal environments.
If these conditions are met, then it is possible that the ‘intensification’ events initially identifiedby Lourandos entailed a re-organisation of human groups, and consequently a re-organisationof economic networks, through the landscape. Such a phenomenon may also have involvedchanges in population numbers, an issue which will have to be examined independently.(Flood et al. 1987: 23)
What’s changing: population size or land-use patterns? The archaeology of Upper Mangrove Creek, Sydney Basin
terra australis 21
16

Redistribution of populations at regional and local levelsHughes and Lampert’s arguments for general population increase on the NSW south coast(outlined in the previous section) relate more specifically to the changes after ca 5000 BP.However, they (Lampert and Hughes 1974: 233; Hughes and Lampert 1982: 20) say increases inimplement and sediment accumulation rates that occur in sites before 5000 BP could be due to apurely local rather than a large-scale demographic event, or may simply reflect the inlandmovement of coastal people as the shoreline retreated to its present position. Ross’ and Flood’smodels, which are outlined in the previous section, also include local shifts in populations.
Models proposed by two other researchers, Luebbers (1978, 1981, 1984) and Beaton(1985), differ from those above in that they explain temporal changes in the number ofhabitation sites in different environmental zones in terms of local shifts in population. Generalpopulation increase was included by Beaton in his interpretations, whereas Luebbers (1984:91–2) said population increases are inferred by the developments he proposed for theCoorong, but were not substantiated by available data.
Using changes in site distribution patterns and site numbers, Beaton (1985: 2)identified, described and dated changes in the local environment and associated changes in theoccupation history of Princess Charlotte Bay in northern Queensland. Beaton (1985: 5, 9) consideredthe region was unoccupied until about 4700 BP, and that initial occupation of the area was inrockshelters near the coastal foreshore and was of a minor nature. Chenier-building associatedwith coastal progradation began about 4000 BP, but it was not until about 2000 years ago thatoccupation shifted to the chenier plain; the earliest evidence for occupation of the nearby islandsdates to about the same time, 2500 BP. As consecutive cheniers formed, they too were campedon, but use of the older cheniers did not cease. Between 1200 BP and 800 BP, the shell moundswere more numerous and larger than in other periods. During the last 600 or 500 years, use ofthe mainland foreshore and islands continued; however, chenier formation virtually ceased and,though foraging continued in the mangroves, shell-mound deposition ceased on the chenierplain and it appears to have been abandoned as a significant camping location. He (1985: 5–11)considered abandonment of the camps on the cheniers to be due to the loss of Anadara granosabeds, which changed the human focus away from the chenier plains.
The changes in site distribution patterns in the last 2500 or 2000 years, which involvean initial increase and subsequent decrease in site numbers on the chenier ridges, are relatedby Beaton to changing coastal morphology and resource availability. Beaton placed the initialoccupation of Princess Charlotte Bay in the context of a wider trend which saw increasinglydense coastal populations in the late-Holocene. He postulated that the coastal economy wasa recent adaptation, similar to the widespread incursions into previously marginal zoneswhich Lourandos (1980a: 259) saw as a geographical and ecological expansion of the hunter-gatherer niche. Thus Beaton viewed the increase in coastal populations as ‘an expression of theincorporation of yet another class of resource community into the total foraging economy ofAustralia’, which he suggested happens in the late Holocene rather than late Pleistocene and‘is due primarily to increasingly dense populations’ (Beaton 1985: 18).
Three projects were undertaken by Luebbers (1978, 1981, 1984) in the coastal areas ofsouth-eastern South Australia. One project involved an area referred to as the ‘lower south-east’South Australia (1978) and the other two projects were on the Younghusband Peninsula(northern and southern Coorong) (1981, 1984).
In lower south-east South Australia (between Robe and Cape Banks), Luebbers (1978)documented change in the character of sites which is associated with a change in sitedistribution patterns. He (1978: 108) identified an Early and Late Cultural Horizon on the basisof site content, morphology and stratigraphy. The Early Horizon lasts from ca 10,000 BP to ca6000 BP; the Late Horizon is divided into an Early and Late Phase. He (1978: 307–9) claimed
Increases and decreases in number of sites and artefacts: a review of interpretations and explanations of the 1970s and 1980s
terra australis 21
17

that significant changes in population and economic organisation occurred during the LateHorizon, that is, the last 6000 years, and that the formation of the coastal economy was arelatively recent event. The population changes postulated by Luebbers did not necessarilyinvolve a general population increase, but rather there was a local shift in population withincreases in some geographic and/or environmental areas, and decreases in others.
The early-Holocene occupation was widespread across eastern South Australia —along the coast, the lower Murray River, and associated with swamps, such as Wyrie(Luebbers 1978: 108). Luebbers (1978: 209–11) maintained that the site distribution patternchanged during the Early Phase (ca 5800 BP to ca 1300 BP) and again during the Late Phase (ca1300 BP to contact). During the Early Phase, there was a low level of occupation, which waspredominantly in the coastal hind-dunes with small numbers of sites in the sandhills 2kminland. Occupation appears to have been transitory and to have consisted of short-durationvisits by shellfish gatherers. In the Late Phase, the character of the coastal economy shiftedtowards more intensive occupation, which was concentrated on the cliff tops and sandhills,with a few visits as far as 12km inland, and near the lagoon. More intensive use of marineresources and a more diversified economic focus on the coastal margin itself were seen alongwith a recurrent use of sites, more sedentary settlement and establishment of a network ofcommunications and trade. Whereas microliths are associated with the Early Phase sites, theyare rare or absent from the Late Phase sites.
According to Luebbers (1978: 302–3, 307), the increased occupation of the coastal stripoccurred at a time of severe disequilibrium — some lagoons and environments weredeteriorating and becoming less productive, while in other areas swamps and lakes wereforming and/or increasing. However, Luebbers (1978: 215–16) said the differences in thearchaeological record of the two phases indicate that the change was not related entirely toenvironmental factors, but that the differences suggest that reorganisation of subsistencestrategies occurred on a large scale, which may have involved an increase in population,a higher frequency of visitation, or both. He added that this may have been accomplishedby seasonal visits of longer duration, or by intensifying exploitation by more effectiveorganisation and procurement skills, which then allowed more resources to be included inthe menu.
Luebbers (1978: 303) related the postulated changes in the coastal strip to the widergeographic area and to general environmental changes. He referred to inland swamp areassuch as Wyrie Swamp, which have been documented as being important to early-Holoceneeconomies. He postulated that when conditions became drier after 3000 BP, andparticularly between 2000 BP and 500 BP when swamps were completely dry and biomasswas drastically reduced, the traditional way of life around the swamps could no longer bemaintained and people were forced to find an alternative food supply. He (1978: 306) addedthat the environmental change would have affected the total southern drainage — duringwetter conditions and in the mid-Holocene, Aboriginal people could have inhabited a widerange of well-watered habitats and presumably occupation densities increased accordingly.With the emergence of the dry phase, populations would have been forced towards moreproductive areas along the rivers and the coast. For the lower south-east, this meantconcentrating on the swamps along the Woakwine Range and in the coastal margin itself.Solutions also involved construction of eel traps and the large habitation mounds ofwestern Victoria, and the extensive fish weirs in South Australia. He (1978: 308) concludedthat marine economies emerged in south-eastern South Australia 2000 to 1300 years ago asa result of substantial changes in the regional demographic structure after a majorreduction in inland swamp-side resources.
What’s changing: population size or land-use patterns? The archaeology of Upper Mangrove Creek, Sydney Basin
terra australis 21
18

Head (1983: 78–9) was critical of Luebbers’ interpretation on the grounds that thelesser number of Early Phase sites in the coastal zone may be due to their destruction by coastalerosion. Luebbers (1978: 215) accepted that some Early Phase shell middens had been lost, butsaid the patterns of campsite distribution characterising each phase were still detectable.
For the Younghusband Peninsula/southern and northern Coorong (which is north-west ofthe lower south-east), Luebbers (1981, 1984) proposed a different explanation for temporalvariations in site distribution patterns, site characteristics (e.g., their morphology, size andcontents) and the age of different site types. However, he still associated archaeologicalchanges in different geographic zones with environmental changes. The latter are associatedwith the formation of the Coorong, a shallow relict estuary bounded by the mainland on oneside and the Younghusband Peninsula on the other. Luebbers studied the area in terms ofthree zones: the mainland, the peninsula’s estuarine shore and the peninsula’s ocean shore.
Luebbers (1981: 3, 32–3) related changes in the archaeological evidence to the biologicalproductivity of the Coorong, which he said decreased in the past 6000 years. During this period,geomorphological processes closed the estuarine exits to the sea and changed the YounghusbandPeninsula from an island (or island chain) to an area of continuous land joined to the mainland.While this gave people greater access to ocean marine resources, closure of the tidal gaps causedthe Coorong to gradually silt up and estuarine resources to decline in abundance.
By the end of his 1984 study, Luebbers (pp. 3–4, 91–3) identified four phases ofAboriginal settlement. The earliest phases of coastal occupation focused on the mainlandshores of the estuary and inland swamps (Luebbers 1981: 32). The peninsula (islands, at thattime) was initially occupied about 6000-5000 BP by groups based on the mainland who madeshort visits. Visitors swam or canoed across the Coorong. As the barrier formed and dunesdeveloped, occupation of the peninsula increased and a more diverse range of resources wasexploited, including marine shellfish (Plebidonax syn. Donax sp.), which were transported fromthe ocean shore to camps on the estuarine shore (Luebbers 1981: 3–4, 32–3, 43–5, 1984: 91–3).The use of Plebidonax continued to increase and, from about 2000 BP, very large middens(mounds) representing recurrent occupation of preferred locations were formed, whichLuebbers interpreted as signs of increased sedentism. Camps were occupied along both theocean front and the Coorong shore.
Luebbers thus interpreted temporal changes in the character and distribution ofhabitation sites on the Younghusband Peninsula as local shifts in population between themainland and the peninsula in response to environmental changes which affected thereliability and availability of food supplies in the Coorong. At the same time, theenvironmental changes enabled greater access to ocean resources and ultimately increasedsedentism and more permanent occupation of the Younghusband Peninsula. Luebbers (1984:91) believed the change in land-use patterns and the magnitude of the increase in the size ofsome sites (mounds) can not be explained by increased sedentism alone. He argued for a netincrease in the resident population at the coast, due possibly to migration. The role ofpopulation increase, he said, is a matter for conjecture.
In a different explanatory context, Bowdler (1981: 108–10, 1993: 130) interpreted theincreasing amounts of archaeological materials at individual sites in the NSW Blue Mountains,the New England tablelands (NSW) and the Queensland uplands, and the late date for theinitial establishment of sites in the NSW southern uplands, all of which occurred after 5000 BPor 4000 BP, as the ‘first successful highlands occupation’. She explained that the reason for thisincreased occupation was the result of an increase in ceremonial activities which were focusedin the highland regions of eastern Australia. The ‘highlands or higher regions’ were the venuefor the ‘rituals of exclusion’ to which the women and children were not allowed to go. These
Increases and decreases in number of sites and artefacts: a review of interpretations and explanations of the 1970s and 1980s
terra australis 21
19

activities were associated with the adoption of what Beaton (1982: 57) called ‘communionfood’ — in particular, Macrozamia sp., Microseris scapigera (daisy yam) and Agrotis infusa(bogong moths) — which enabled large rituals/ceremonial gatherings to be held.
Bowdler, along with Jones (1977: 201–2) and Beaton (1982: 57–8), linked increases inquantitative aspects of the archaeological record to the introduction of the Small Tool Traditionand to increased ritual and ceremonial activities. Bowdler (1981: 108–10) concluded that thefirst successful exploitation of the highland regions of eastern Australia was part of thetransformation of Aboriginal society some 4000 years ago, for which the Small Tool Traditioncould be used as an indicator.
Increased ‘intensity of site use’Many researchers interpreted increased rates of artefact (or implement) accumulation atindividual sites as ‘increased occupation’, ‘an increase in the intensity of occupation’, ‘an increasein the intensity of site use’ or ‘increased human activity on the site’ (Lampert and Hughes 1974;Stockton and Holland 1974; Moore 1981; Hughes and Lampert 1982; Smith 1982; Flood et al.1987). The increases in the artefact accumulation rates were seen to reflect changes in: 1. the number of people using the site, that is, variation in group size; and/or,2. frequency of visits to the site; and/or,3. the length of time spent at the site during each visit (e.g., Smith 1982: 114; Ross 1985: 83).The net effect of any one of these circumstances is that more person-days were spent at an individual site. Smith (1982: 114) referred to this as Simple Functional Change.
As outlined above, some researchers have used changes in artefact (or implement)accumulation rates at individual sites as evidence for general population increase (e.g.,Hughes and Lampert 1982; Lampert and Hughes 1974 — see above), or redistribution ofpopulations at a local or regional level (e.g., Jones 1985: 296; Lampert and Hughes 1974 for theperiod before ca 5000 BP). Lourandos (1985b: 38) suggested that ‘greater usage of individualsites in a restricted area may merely represent more intensive usage of the region by broadlysimilar numbers of people’ or that local group sizes were larger. Lourandos’ phrase ‘moreintensive usage’ could mean the same number of people visited more often or stayed forlonger periods on each visit, or that more activities were carried out or a greater effort wasspent on the same activities by the same number of people in the same period of time. Hisexplanation could be seen as ‘redistribution of local populations’ or some smaller-scaleevent/s, but one of the outcomes is that there was a change in the number of person-daysspent in an area over a particular period of time.
Small-scale movements of people and social reasons were proposed as explanations forchanges in artefact accumulation rates as well, rather than widespread general populationincrease or movement of the local population from one environmental zone to another. By ‘small-scale movement of people’, I mean people using one site in preference to another within the samelocality or environmental zone. This includes changes either from one habitation site type toanother type (say, from rockshelters to bark shelters in open settings) or from one habitation siteto another of the same type because of either preference or local environmental changes.
At sites in the Hunter River and the Macdonald River valleys, Moore (1981: 414–15)noted that at three sites the ‘maximum occurrence’ of stone artefacts was in levels dating fromca 2300 to ca 1700 BP. He interpreted this as a ‘period of maximum activity’ or as ‘apparentintensification of occupation in sites at both ends of the Boree Track about 2000 BP’ (Moore1981: 414–15, 423). He associated the ‘intensification’ to an apparent late occupation of theHunter Valley and subsequent establishment of contact between the different tribes at bothends of the track.
What’s changing: population size or land-use patterns? The archaeology of Upper Mangrove Creek, Sydney Basin
terra australis 21
20

In the NSW Blue Mountains, Stockton (1970a: 297) noted that the sites without Bondipoints (an artefact he considered to be diagnostic of the Bondaian phase) were not as deep andlarge as the ‘caves’ with Bondi points. He initially considered that this indicated either that theBondi point was a domestic rather than a hunting tool, or that the Bondaian flourished in aperiod when the climate was comparatively cold and wet and shelter was in greater demand.After more extensive excavations, Stockton and Holland (1974: 56, 60) described ‘peakconcentrations’ in stone artefacts in the Middle Bondaian levels of several sites: ‘increasingabundance of flaked material in rock shelters reaching a peak of concentration at about 1000BP’. They proposed that:
In the absence of factors likely to disrupt steady deposition at a site … such concentrationseems to indicate increased human activity on the site. Where this is verified at a number ofneighbouring sites at the same time, one is led to consider a peak population and/or a peak ofpreference for cave dwelling. (Stockton and Holland 1974: 56)
They concluded that the growing importance of the Bondaian industry and its subsequentregression in the last 1000 years may well be a response to climatic factors:
The concentration at the middle Bondaian levels may denote weather conditions which eitherdemand permanent shelter or render mountain dwelling more attractive; subsequentregression again may signify either worsening mountain climates or decreased dependence onpermanent shelter. (1974: 60; see also Stockton 1977c: 343)
Bark shelters may have come into more general use in the Late Bondaian corresponding withlessened dependence on rockshelters (hence greater mobility). (Stockton and Holland 1974: 58)
In his reanalysis of the Devon Downs stone artefact assemblage, Smith initially queriedwhether quantitative changes in stone artefact assemblages at Devon Downs were principallydue to:
… variation in the amount of stone working carried out on site. This affects the total amount ofstone in a deposit and is related to the availability of suitable stone and the intensity ofoccupation. (Smith 1982: 110)
However, after analysis of all materials from the site (i.e., faunal remains and ochre, as well asstone artefacts), and looking at alternative explanations, he concluded:
The increased quantities of a wide range of archaeological remains — stone, retouchedartefacts, emu egg-shell, ochre and animal bone — as primary or de-facto refuse [Schiffer 1976:30–4] at Devon Downs shelter, suggests an increase in the intensity of occupation between 2000and 4000 years ago. (Smith 1982: 114)
The types of changes likely to be associated with changes in the rate of discard (availability ofstone, amount of on-site knapping, changes in reduction processes, changes in seasonality,economic changes) do not account for the observed changes in quantity of occupational debrisat this site. We are justified therefore, in interpreting this as simple functional change. Theshelter was used more intensively between 2000 and 4000 years ago. (Smith 1982: 114)
Smith considered that there was an increase in the number of person-days spent at the site. He(1982: 115) stated that changes in both group size and the frequency of visits may have beenresponsible for the observed variations, but ‘the link between increased use of a site … andpopulation increase is unclear’. (The decrease in archaeological materials in the last 2000 yearsat Devon Downs is discussed below under Decreases in the Archaeological Record,Behavioural Change.)
Increases and decreases in number of sites and artefacts: a review of interpretations and explanations of the 1970s and 1980s
terra australis 21
21

Intensification and increasing social complexityLourandos (1980a, 1980b, 1983a, 1984, 1985a, 1985b) included quantifiable temporal changesin the archaeological record as support for his hypothesis for intensification during the last 5000to 4000 years. He included general population increase, redistribution of populations andincreases in ‘intensity of site use’ as part of his arguments.
In his use of the term, Lourandos saw intensification as a broad concept that referredgenerally to increases in both productivity and production, but he followed Bender (1978) inallowing the concept to refer to social as well as economic factors (Lourandos 1983a: 81; 1985a:389–90). Thus the definition of intensification used by Lourandos was broader than thataccepted by some researchers (e.g., Beaton 1983: 95). In addition, while intensification isusually viewed as a relatively short-term process, Lourandos (1985a: 391) considered itjustifiable to extend its usage to include any perceivable long-term increases in the frequencyof selected variables in the archaeological record.
Lourandos (1984: 30) argued that social forces were the primary element or influencewhich brought about late-Holocene changes in economic and habitation behaviour — it was arestructuring of social relations at the inter-group level, specifically associated with ceremonyand exchange, which placed continually increasing demands on economy and production(Lourandos 1983a: 81, 1985a: 386). He suggested these dynamic processes may have resultedin increases in the complexity of social relations and economic growth, semi-sedentism and,by inference, population sizes. In emphasising a ‘social’ mechanism to explain late-Holocenechange in Australian prehistory, Lourandos’ approach contrasts with those studies whichemphasise environmental and demographic factors as agents of change. However, althoughLourandos (1985a: 403, 412) argued that the development of increasingly more complex socialnetworks and alliance systems lies closely behind these processes of intensification, he alsosaw them stimulated in some ways by environmental and climatic changes and perhapsinfluencing, as well as being influenced by, ‘the more elusive factor of demography’. Even so,he said neither environmental nor demographic changes provide adequate explanations forthe late-Holocene archaeological changes in Australia (1984: 32, 1985a: 403), and he believeddemographic change was just as much a consequence of other factors as a causal agent itself,and could not be regarded as a prime mover or considered separately from cultural orenvironmental influences.
Lourandos (1985a: 411) proposed that during the last 5000 or 4000 years, mainlandAustralia experienced a period of cultural expansion which was characterised by: 1. rearrangements in settlement and economic patterns (towards more sedentary
and intensive economies); 2. an expansion in exchange networks; and, 3. significant changes in other variables such as art and stone artefacts.In some regions in south-eastern Australia, he considered that the changes in ‘the intensity ofoccupation’ appeared to have become progressively more marked throughout the late-Holocene (1985a: 411).
The main archaeological variables which Lourandos (1983a: 82, 92, 1985a: 391, 400)claimed to be general indicators (direct or indirect) of intensification during the last 5000 or4000 years — and to suggest expanding economies (in terms of land and resources), increasingsedentism as sites and locales became more intensively used (i.e., a trend towards theestablishment of longer-term base camps) and more intensive inter-group relations (exchange,ceremonies) — are: 1. intensity of site usage (measured by sediments and cultural remains);2. rate of establishment of new sites;3. usage of marginal environments (arid, montane, rainforest and swampland);
What’s changing: population size or land-use patterns? The archaeology of Upper Mangrove Creek, Sydney Basin
terra australis 21
22

4. complexity of site economy (resource management strategy and wide range ofresources and activities represented);
5. complexity of exchange systems and ceremonial events.He pointed out that the above characteristics appeared not only on the coastal strip but inlandas well, and, as support, quoted the evidence from the NSW south coast, the Mangrove CreekDam storage area, the NSW southern highlands, central Queensland highlands, NSW BlueMountains, the lower Murray Valley, south-eastern South Australia and the Victorian Mallee,as well as western NSW, Koonalda Cave, the Strzelecki Desert, south-western WesternAustralia, Arnhem Land and Tasmania (Lourandos 1985a: 392–401). At this time, he (1985a:403) said his interpretation suggested a general (but not necessarily uniform) populationincrease over time in most environments.
Although his investigations began in order to explain the presence and developmentof Aboriginal drainage systems and the cultural complexity documented in the 19th-centuryhistorical records of south-western Victoria (1976, 1977, 1980a), Lourandos built up ahypothesis which he considered was applicable Australia-wide. He saw the strength of theintensification model lying ‘in the general consistency of the independent results obtained bya large number of researchers from a wide set of archaeological variables and ranges ofAustralian environment’ (1985a: 403). Given the breadth of the evidence, he found it difficultto explain these archaeological patterns in terms other than a general amplification ofsocioeconomic behaviour. In his later writings, Lourandos acknowledged more recentarchaeological studies and developed his model, placing the broad series of cultural changeswithin the last 4000 years or so and especially the last 2000 years (Lourandos 1987: 157, 1988:149, 158) or the last 3000 to 2000 years (Lourandos 1993: 79, 80). He admitted that ‘while themore recent processes of socio-economic intensification are becoming increasingly evident,their genesis, presumably in the mid-Holocene and earlier, is less clear’ (1988: 160). Morerecently, in Continent of Hunter-Gatherers, he proposes what he calls a ‘socio-demographicmodel’ of cultural change (1997: 243, 318–21, 327–30).
As a package along with other evidence, Lourandos (1983a: 92, 1984: 31–2, 1985a: 391)thus saw quantitative changes in the archaeological record as indicators of intensification, andsuggested (1985a: 402) that it would not be implausible for there to be an association betweenthe archaeological data and demographic patterns (though he said all interpretations must beinferential [1983a: 92]). In this sense, one can say he believed population increase wasinstrumental in bringing about the quantitative changes in the archaeological record, thoughsocial change was the prime mover for intensification.
Ross (1984: 199–201, 238) proposed population increase as the most probableexplanation for a tenfold increase in sites in the southern Mallee (western Victoria) during the late-Holocene period. A decrease in, or less substantial use of, the northern Mallee (Raak Plains andLake Tyrrell) is proposed in the late-Holocene (Ross 1984: 180–2). Changes in site numbers arethe principal evidence Ross used for her interpretation of the archaeological record in theMallee, where she (1984: 15–16, 177, 182–4, 238, 265–6) saw two phases of occupation: 1. the first phase, dating from ca 12,000–10,000 to ca 6000 BP: occupation concentrated
in the northern part of the Mallee, around Raak Plains and Lake Tyrrell; the southernMallee was rarely visited prior to 4500 BP;
2. the second phase, after 4500 BP: more widespread occupation occurred throughoutthe study area and a tenfold increase in sites occurred in the south; the evidencesuggests only short-term, small-scale use of Raak Plains in the northern Mallee at thistime.
Ross (1981: 153; 1984: 15–16, 198, 266) linked the first phase of occupation in the northernMallee to the early-Holocene when, she stated, lake levels were high and freshwater
Increases and decreases in number of sites and artefacts: a review of interpretations and explanations of the 1970s and 1980s
terra australis 21
23

availability was greater than at present, and people based on the Murray River expanded theirrange. The second phase of occupation, she said, occurred during a period of environmentaldecline — after ca 6000 BP, the northern Mallee became more arid and the water sourcesbecame saline. At this time, the population retreated back to the Murray River and occupationwas less frequent (Ross 1984: 198, 265). The south also became drier and thus, according to Ross(1984: 227), the increase in sites in the southern Mallee must lie away from general ecological orenvironmental explanations. She stated (1984: 238, 267) that the most likely explanation for thelate-Holocene increase in sites in the southern Mallee is general population increase associatedwith intensification and social change in south-western Victoria.
Ross (1984: 236) proposed that the evidence from the Mallee may be an initial test ofLourandos’ model of alliance network growth in south-western Victoria since:
Any increase in population density in the wetlands is likely to have provided a trigger forexpansion into more northerly districts. It may therefore be suggested that population growthin south western Victoria led to population expansion into the southern Mallee. (Ross 1984:236–7)
… archaeological evidence from elsewhere in south eastern Australia is certainly suggestive of ageneral increase in numbers of people in the late Holocene, it is most likely that the principalfactor involved in population increase in north western Victoria was population expansionfrom the better watered areas outside the region. (Ross 1984: 236; see also Ross 1981: 152–3)
Ross (1984: 234) did not consider population change ‘as an independent variable or a primemover causing change’, rather it was ‘one element of the wider subject of social change,possibly associated with the development of complex alliance networks’. In this respect, Rossas well as Williams and Morwood (see below) were influenced by Lourandos.
Population increase was seen by Williams (1985, 1988) to be associated with theformation of mound sites in the late-Holocene in western Victoria. Mounds first appear after2500 BP, that is, in the late rather than the mid-Holocene (Williams 1985: 5, 311; 1987: 318–19;1988: 2, 216). All but one mound site are dated to later than 2000 BP (Williams 1985: iii, 316;1988: Fig. 10.1). Williams (1985: 310, 316; 1988: 218–21) concluded that the appearance ofmounds about 2500 BP suggests their appearance was in part related to climatic changes,being an adaptation to a more waterlogged environment, and was not related to technologicalchange (i.e., to the Small Tool Tradition).
In 1985 (iii, 5), Williams proposed that population increase, shifts in alliance networksleading to intensification, as well as an environmental shift to a wetter climate about 2000years ago, contributed to the changes; that is, the changes involved complex interactionbetween climatic shifts, demographic pressure and social variables. Williams (1985: 325) alsostated that, because the formation of mounds may have been related in part to a shift inclimatic conditions, it is difficult to separate the relative contributions of environmental factorsfrom social and economic ones. However, in subsequent publications, Williams (1987: 319;1988: 221) argued that the formation of mounds was associated primarily with changes insocial networks, that climatic and environmental shifts played only a minor role in triggeringchange, and population increase occurred only after other major changes had taken place. Itwas changes in alliance networks in the region after 3000 BP (associated with expandingredistribution and alterations in social relations) that triggered increases in production(intensification), which was achieved by shifts in organisation of labour and settlements, and amore sedentary occupation of sites. The archaeological evidence Williams associated withthese changes was the appearance of mounds and an increase in the number of sites in thelate-Holocene (Williams 1988: 220–1). Evidence for the increase in population was an ‘increasein sites at this time’ (Williams 1988: 221).
What’s changing: population size or land-use patterns? The archaeology of Upper Mangrove Creek, Sydney Basin
terra australis 21
24

For his study of the central Queensland highlands, Morwood (1984) synthesised thearchaeological work undertaken by himself and several other researchers (Clegg 1965, 1977;Mulvaney and Joyce 1965; Beaton 1977, 1982; Morwood 1979, 1981). The archaeologicalevidence for the central Queensland highlands spans a minimum of 22,000 years, andMorwood (1984: 371) considered substantial changes occurred ca 4300 BP in the technologyand range of stone artefacts as well as the rock art of the region. At the same time, he (1984:358, 369, 371) said there was an increase in the intensity of occupation in sites with longsequences, this being measured by rates of artefact, ochre and sediment deposition. Theevidence suggested to him (1984: 371) that all the changes were sudden. Because changeoccurred in these several types of evidence, Morwood (1984: 369) said the ‘more intensiveoccupation’ cannot be explained just in terms of changes in knapping behaviour.
He (1984: 369–71) believed the evidence from the central Queensland highlandssupports Lourandos’ interpretations, and required fundamental changes in Aboriginal socialrelations and mechanisms for exchange of resources, knowledge and genes, as well as anassociated increase in the scope of ceremonial gatherings. Morwood (1984: 358) said that ifthe increased number of sites containing artefacts belonging to the Small Tool Tradition is aguideline, then Aboriginal use of the central Queensland highlands appears to have becomemore extensive. After reviewing some of the evidence from other regions, he (1984: 369)argued that ‘the evidence from all mainland areas indicates that the earliest occupation of anyintensity only occurred with the elaboration of stone artefact assemblages circa 4500 to 3000BP’. He saw an ‘abrupt increase’ in site numbers applying to both rockshelters and open sitesin diverse environments (NSW coastal and sub-coastal areas, Blue Mountains and DarlingRiver). Morwood (1984: 369) concluded that ‘In some (perhaps all) regions the sudden increasein site numbers and occupation intensity is best explained in terms of population increase’.
Morwood (1987) considered that some aspects of the archaeological record in south-eastern Queensland are explicable in terms of a model for increases in population and socialcomplexity, and saw environmental change leading to greater resource availability as part of themodel. Morwood (1987: 343) proposed that in the past 6000 years changes in climate and sea-level ‘allowed extensive estuarine and mangrove areas of concentrated biological productivityto develop’, which ‘provided scope for an accelerating increase in population in the region,especially after 4000 bp’. He suggested that population increases were triggered initially by theexpanded resource base, but later increases resulted from the development of social anddemographic mechanisms which increased the effective carrying capacity of regional resources.The archaeological criteria for identifying population increases, he said, could include: (i) increases in the rate of site formation;(ii) increases in occupational intensity at sites; and,(iii) more intensive economic exploitation as indicated by the use of new habitats,
resource types, extractive technologies and management strategies, etc. (Morwood1987: 343)
The archaeological criteria for development of social and demographic complexity which heincluded were: (i) increases in the number of sites concerned with symbolic activities (e.g., art sites, bora
rings);(ii) changes in site content (e.g., the appearance of exotic materials and technologies); and,(iii) increased status differences and restrictions on access to knowledge and specific
localities, as reflected in a reduction in occupational intensity at some sites, ordevelopments in technological and organisational complexity. (Morwood 1987: 343)
Morwood (1987: 343–7, Fig. 4) considered that the results of his own fieldwork andarchaeological data gained by other researchers (e.g., Hall 1982; Lilley 1984; Nolan 1986)
Increases and decreases in number of sites and artefacts: a review of interpretations and explanations of the 1970s and 1980s
terra australis 21
25
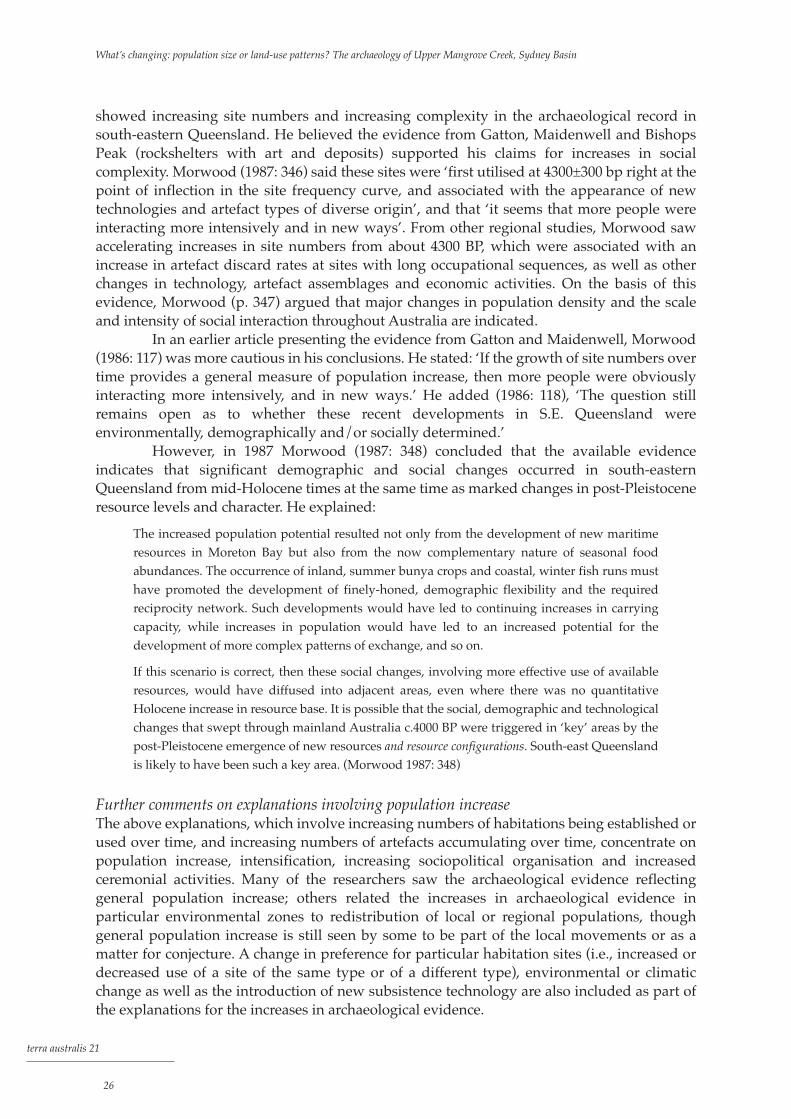
showed increasing site numbers and increasing complexity in the archaeological record insouth-eastern Queensland. He believed the evidence from Gatton, Maidenwell and BishopsPeak (rockshelters with art and deposits) supported his claims for increases in socialcomplexity. Morwood (1987: 346) said these sites were ‘first utilised at 4300±300 bp right at thepoint of inflection in the site frequency curve, and associated with the appearance of newtechnologies and artefact types of diverse origin’, and that ‘it seems that more people wereinteracting more intensively and in new ways’. From other regional studies, Morwood sawaccelerating increases in site numbers from about 4300 BP, which were associated with anincrease in artefact discard rates at sites with long occupational sequences, as well as otherchanges in technology, artefact assemblages and economic activities. On the basis of thisevidence, Morwood (p. 347) argued that major changes in population density and the scaleand intensity of social interaction throughout Australia are indicated.
In an earlier article presenting the evidence from Gatton and Maidenwell, Morwood(1986: 117) was more cautious in his conclusions. He stated: ‘If the growth of site numbers overtime provides a general measure of population increase, then more people were obviouslyinteracting more intensively, and in new ways.’ He added (1986: 118), ‘The question stillremains open as to whether these recent developments in S.E. Queensland wereenvironmentally, demographically and/or socially determined.’
However, in 1987 Morwood (1987: 348) concluded that the available evidenceindicates that significant demographic and social changes occurred in south-easternQueensland from mid-Holocene times at the same time as marked changes in post-Pleistoceneresource levels and character. He explained:
The increased population potential resulted not only from the development of new maritimeresources in Moreton Bay but also from the now complementary nature of seasonal foodabundances. The occurrence of inland, summer bunya crops and coastal, winter fish runs musthave promoted the development of finely-honed, demographic flexibility and the requiredreciprocity network. Such developments would have led to continuing increases in carryingcapacity, while increases in population would have led to an increased potential for thedevelopment of more complex patterns of exchange, and so on.
If this scenario is correct, then these social changes, involving more effective use of availableresources, would have diffused into adjacent areas, even where there was no quantitativeHolocene increase in resource base. It is possible that the social, demographic and technologicalchanges that swept through mainland Australia c.4000 BP were triggered in ‘key’ areas by thepost-Pleistocene emergence of new resources and resource configurations. South-east Queenslandis likely to have been such a key area. (Morwood 1987: 348)
Further comments on explanations involving population increaseThe above explanations, which involve increasing numbers of habitations being established orused over time, and increasing numbers of artefacts accumulating over time, concentrate onpopulation increase, intensification, increasing sociopolitical organisation and increasedceremonial activities. Many of the researchers saw the archaeological evidence reflectinggeneral population increase; others related the increases in archaeological evidence inparticular environmental zones to redistribution of local or regional populations, thoughgeneral population increase is still seen by some to be part of the local movements or as amatter for conjecture. A change in preference for particular habitation sites (i.e., increased ordecreased use of a site of the same type or of a different type), environmental or climaticchange as well as the introduction of new subsistence technology are also included as part ofthe explanations for the increases in archaeological evidence.
What’s changing: population size or land-use patterns? The archaeology of Upper Mangrove Creek, Sydney Basin
terra australis 21
26

All the ‘population-change’ explanations were based on the assumption that anincrease in the numbers of sites and/or artefacts reflects an increase in the numbers of peoplewho were using a region, or an increase in the number of person-days spent in a site or region.Of the studies reviewed, only Lampert and Hughes (1974) and Hughes and Lampert (1982)used implements as the units of measurement rather than all artefacts in the total assemblage,and used the sites as well as the implements as evidence.
Another assumption made in many archaeological studies, and one which stillrequires investigation, is that there was a direct relationship between the location of artefactuse and artefact discard (Binford 1973: 242–3; Foley 1981b: 165). Hiscock (1981: 31–2) queriedwhether the ‘number of stone implements per unit time’ adequately measures the ‘intensity ofsite usage’, saying it is unclear whether using implement counts is any better than using theentire assemblage. He also questioned what these indices measure:
What is being measured in this intensity index (of the number of implements per unit time) ismainly a reflection of technology; it will not necessarily indicate the numbers of people who areknapping, eating, sleeping, or walking in the site, nor the duration of those activities. If werequire a general measure of ‘intensity’, that is one which involves more than one type ofbehaviour, we will have to measure more than one type of archaeological debris … Ultimately,however, the usefulness of the exercise will not be measured in the cleverness or skill withwhich we produce a measurement, but in the strength of arguments defining the concepts of usage, intensity and their causal relationships to chipped stone accumulation rates. (Hiscock1981: 32)
The use of more than ‘one measure of intensity’ was increasingly adopted by researchers (e.g.,Morwood 1984, 1986, 1987; Smith 1982; Hall and Hiscock 1988a; Hiscock 1984, 1988b). Smith(1982: 114), however, cautioned against accepting quantitative changes in archaeologicaldeposits as changes in the ‘intensity of site use’ and then stating in turn that they reflectbroader changes in population size or settlement patterns.
Behavioural change
Explanations which do not involve an increase in population size (general, regional/local orsite specific) were proposed for the increasing rates of stone artefact accumulation andhabitation establishment over time. Many of these interpretations and explanations were putforward simply as suggestions without much discussion. Most alternative explanations wereproposed in opposition to the idea that the increases in the archaeological record wereproduced by increases in the size of the population. Many explanations, however, were of ageneral nature and can be used to explain decreases in archaeological evidence as well asincreases; for example, Hiscock’s (1986: 48) ‘underlying changes in the structure of discardbehaviour, settlement patterns and economy’.
Increases in site numbersExplanations involving behavioural change that were proposed for dramatic increases in sitenumbers, that is, for the lack of early sites, included: 1. in the latter half of the Holocene, sites were located in different situations to those of
earlier periods and in these new situations the sites are more likely to have survivedand/or to be visible today (Hughes and Lampert 1982: 24);
2. increased mobility (Attenbrow 1982a: 76; Rowland 1983: 73); people inhabited moresites within the same area, spending less time at each site, and perhaps travelling
Increases and decreases in number of sites and artefacts: a review of interpretations and explanations of the 1970s and 1980s
terra australis 21
27

shorter distances between sites than in the previous period; that is, the number ofmovements within the locality increased. This may or may not have been associatedwith movements between other resource zones or over longer distances;
3. changes in hunting and gathering techniques (Attenbrow 1982a: 76–7);4. greater site visibility due to an increase in the number of stone artefacts
manufactured by each person, which meant more artefacts were discarded and thusevidence for Aboriginal occupation (in the form of stone artefacts) for some periodsis more abundant (Attenbrow 1982a: 77). (This would have involved a change in theratio of people to artefacts);
5. ‘more sites … may merely represent more intensive use of the region by broadlysimilar numbers of people’ (Lourandos 1985b: 38).
Increases in the number of stone artefacts accumulatedAlternative explanations for increases in the number of stone artefacts accumulated involvequalitative changes in the stone artefact assemblages, changes in discard behaviour andchanges in as yet undefined behavioural processes. The explanations involving qualitativechanges in the stone artefact assemblages relate to changes in the number and range ofartefacts and/or implement types manufactured, changes in the stone technology andchanges in the stone materials used (i.e., typological, technological and raw material changes).Except for changes in discard behaviour and post-depositional breakage patterns, thesechanges are assumed to increase the number of stone artefacts or implements (tools) perperson, thereby producing a change in the ratio of numbers of artefacts to numbers of people.1. Technological changes which produced more manufacturing debris (Hiscock 1981;
Ross 1984: 200); 2. different technologies may produce different numbers of implements (Hiscock 1981:
32; Ross 1985: 83); 3. changes in stone tool technology, that is, ‘when the maintenance tools of the core tool
and scraper tradition were joined by a mixture of maintenance and extractive tools ofthe small tool tradition’ (Hughes and Lampert 1982: 24–5; see also Ross 1984: 200);
4. the adoption of new stone-working processes or reduction processes (e.g., bladetechnology) (Smith 1982: 114);
5. a change in the stone material available or preferred, which affected discard rates(Smith 1982: 110–11; Hiscock 1982b: 43; Ross 1985: 83);
6. increased range of activities for which stone tools were used, for example, thebarbing of spears (Ross 1984: 200);
7. shifts in technology which occurred about 2000 years ago when backed artefactstended to drop out of assemblages and were replaced by quartz artefacts which aremostly unretouched. Williams (1985: 327–8) proposed this as a reason for acontinuing increase in artefact numbers and not for the postulated increase at thebeginning of the Small Tool Tradition.
The above explanations assume that the typological, technological and raw material changesresulted in more implements and/or more manufacturing debris being left in habitations, andthat the number of people visiting or the number of person-days spent in the habitationsremained the same. That is, it was the amount or type of activity that changed (see discussions inLampert and Hughes 1974; Hiscock 1981, 1986; Hughes and Lampert 1982: 24–5; Kefous 1982;Smith 1982; Ross 1984, 1985). The raw material changes include changes in the percentagefrequency of certain raw materials as well as the introduction of different raw materials.
Lourandos’ (1985b: 38) statement that there was ‘greater usage of individual sites in arestricted area’ (presumably referring to sites where a greater number of artefacts accumulated
What’s changing: population size or land-use patterns? The archaeology of Upper Mangrove Creek, Sydney Basin
terra australis 21
28

over time) may simply mean a region was being used more often by broadly similar numbersof people and not that the general population increased. In this context, it may mean that agreater range of activities was carried out, or a greater effort (greater amount of time) wasspent on the same activities by the same number of people, but the period of time (i.e., thenumber of person-days) spent at the site/s was the same as in the previous period/s.
Documented changes in the artefact accumulation rates in individual sites may alsorepresent changes in the ‘location of discard’ (Smith 1982: 114; Hall and Hiscock 1988a: 54),changes in site use which increased post-depositional breakage through trampling (Hall andHiscock 1988a: 58), or in the ‘location and use of hearths’ which thermally fractured artefacts andthus affects artefact counts (Hall and Hiscock 1988a: 59; Hiscock and Hall 1988: 101). Smithincluded changes in discard location under Complex Functional Change, which he saidoccurred when the rate of discard or amount of debris per person varied (though I wouldregard changes in the location of discard as Simple Functional Change). To invoke a change inthe location of discard suggests that one assumes there was little or no change over time in (1)the ratio of artefacts to people, (2) the number of person-days spent at the location, and (3) therange of activities undertaken at the site. That is, people were simply discarding their debris indifferent parts of the site in different periods because they altered the locations within the siteat which particular activities were carried out.
Natural processesSeveral natural processes were proposed as explanations for the increases in the number ofsites over time. These include geomorphological processes, the decomposition anddegradation of materials, and the formation of palimpsests, as well as environmental changesand the rise in sea-level associated with climatic changes.
Geomorphological processesGeomorphological processes were proposed as an explanation for the lack of early sites. Theseprocesses are said to have operated in several ways, all of which directly affected thearchaeological materials, in contrast with other explanations which involve indirect agents ofchange.1. Some early sites or early habitation levels in sites (in all situations, including the coast
and inland, and rockshelter and open sites) were destroyed by erosional processes,and there will always be fewer sites the earlier ones goes back in time.
2. The rate of site destruction decreased in recent times due to less erosion associatedwith climatic or other environmental change.
3. Early sites have been buried by alluvial deposits or obscured by vegetation growthand are not visible today unless some form of disturbance occurs to the groundand/or vegetation.
(See Worrall 1980: 81–3; Attenbrow 1982a: 77; Blackwell 1982: 50; Hughes and Lampert 1982:24–6; Head 1983: 78-9; Bonhomme 1985: 33).
The rise in sea-level, climatic changes and associated environmental changesThe low numbers of pre-8000-year-old coastal sites, shell middens in particular, wereacknowledged by many as being due to the post-glacial rise in sea-level, which would haveinundated many sites associated with the earlier shorelines (e.g., Hughes and Lampert 1982:19; White and O’Connell 1982: 52, 99; Godfrey 1989). Rowland (1989: 38–9) considered thateven after the sea-level stabilised ca 6000 BP, minor changes in sea-level and coastal erosion bystorms and cyclones could have destroyed many shell middens and could account for thelarge difference in the number of sites pre- and post-2000 BP along parts of the Queensland
Increases and decreases in number of sites and artefacts: a review of interpretations and explanations of the 1970s and 1980s
terra australis 21
29
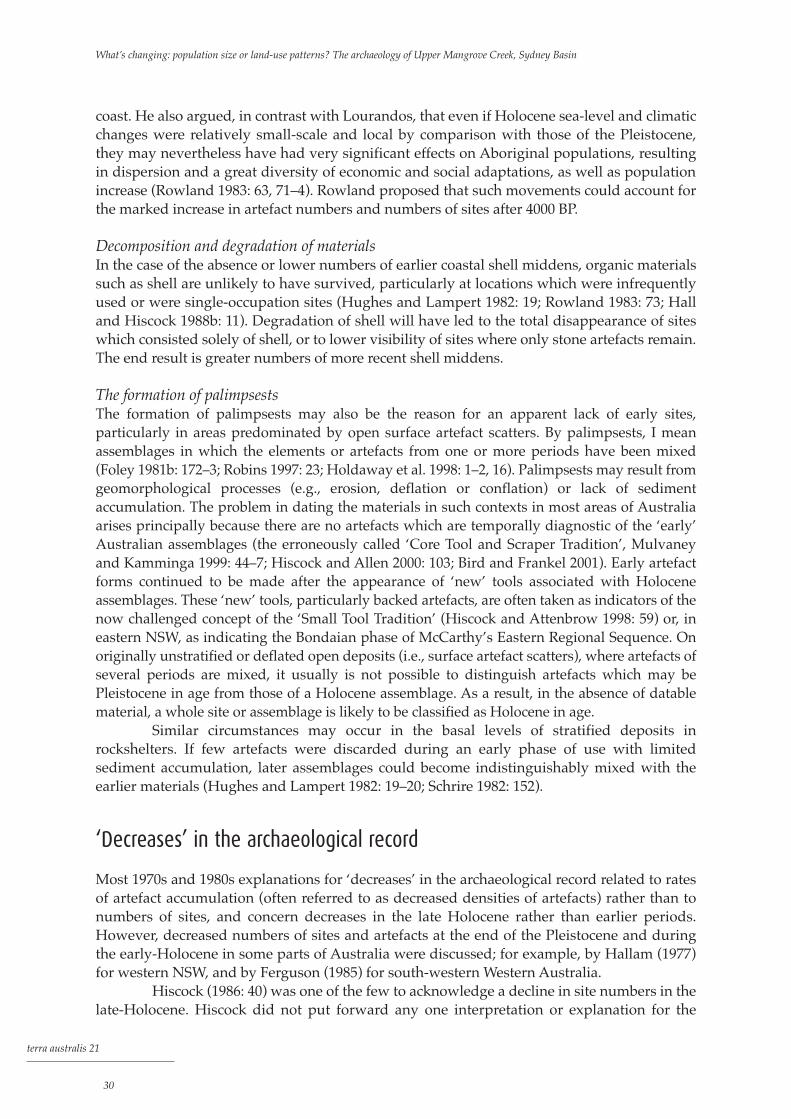
coast. He also argued, in contrast with Lourandos, that even if Holocene sea-level and climaticchanges were relatively small-scale and local by comparison with those of the Pleistocene,they may nevertheless have had very significant effects on Aboriginal populations, resultingin dispersion and a great diversity of economic and social adaptations, as well as populationincrease (Rowland 1983: 63, 71–4). Rowland proposed that such movements could account forthe marked increase in artefact numbers and numbers of sites after 4000 BP.
Decomposition and degradation of materialsIn the case of the absence or lower numbers of earlier coastal shell middens, organic materialssuch as shell are unlikely to have survived, particularly at locations which were infrequentlyused or were single-occupation sites (Hughes and Lampert 1982: 19; Rowland 1983: 73; Halland Hiscock 1988b: 11). Degradation of shell will have led to the total disappearance of siteswhich consisted solely of shell, or to lower visibility of sites where only stone artefacts remain.The end result is greater numbers of more recent shell middens.
The formation of palimpsestsThe formation of palimpsests may also be the reason for an apparent lack of early sites,particularly in areas predominated by open surface artefact scatters. By palimpsests, I meanassemblages in which the elements or artefacts from one or more periods have been mixed(Foley 1981b: 172–3; Robins 1997: 23; Holdaway et al. 1998: 1–2, 16). Palimpsests may result fromgeomorphological processes (e.g., erosion, deflation or conflation) or lack of sedimentaccumulation. The problem in dating the materials in such contexts in most areas of Australiaarises principally because there are no artefacts which are temporally diagnostic of the ‘early’Australian assemblages (the erroneously called ‘Core Tool and Scraper Tradition’, Mulvaneyand Kamminga 1999: 44–7; Hiscock and Allen 2000: 103; Bird and Frankel 2001). Early artefactforms continued to be made after the appearance of ‘new’ tools associated with Holoceneassemblages. These ‘new’ tools, particularly backed artefacts, are often taken as indicators of thenow challenged concept of the ‘Small Tool Tradition’ (Hiscock and Attenbrow 1998: 59) or, ineastern NSW, as indicating the Bondaian phase of McCarthy’s Eastern Regional Sequence. Onoriginally unstratified or deflated open deposits (i.e., surface artefact scatters), where artefacts ofseveral periods are mixed, it usually is not possible to distinguish artefacts which may bePleistocene in age from those of a Holocene assemblage. As a result, in the absence of datablematerial, a whole site or assemblage is likely to be classified as Holocene in age.
Similar circumstances may occur in the basal levels of stratified deposits inrockshelters. If few artefacts were discarded during an early phase of use with limitedsediment accumulation, later assemblages could become indistinguishably mixed with theearlier materials (Hughes and Lampert 1982: 19–20; Schrire 1982: 152).
‘Decreases’ in the archaeological record
Most 1970s and 1980s explanations for ‘decreases’ in the archaeological record related to ratesof artefact accumulation (often referred to as decreased densities of artefacts) rather than tonumbers of sites, and concern decreases in the late Holocene rather than earlier periods.However, decreased numbers of sites and artefacts at the end of the Pleistocene and duringthe early-Holocene in some parts of Australia were discussed; for example, by Hallam (1977)for western NSW, and by Ferguson (1985) for south-western Western Australia.
Hiscock (1986: 40) was one of the few to acknowledge a decline in site numbers in thelate-Holocene. Hiscock did not put forward any one interpretation or explanation for the
What’s changing: population size or land-use patterns? The archaeology of Upper Mangrove Creek, Sydney Basin
terra australis 21
30

decreases he documented in both site numbers and the artefact accumulation rate in the last800 years BP in the NSW Hunter Valley. He believed that late-Holocene Australian prehistorycannot be explained by population change, and that changes in the structure of settlementsand technology may be better descriptions of what happened.
Several other researchers put forward explanations for decreases in artefactaccumulation rates in individual sites, which are outlined below. No natural processes wereproposed as explanations for the decreases in the late-Holocene, or the early-Holocenedecreases in the arid zones, and the examples below are discussed under the headings‘population change’ and ‘behavioural change’.
Population changeThe population-change explanations for decreases in the archaeological record of easternAustralia related to redistribution of populations and changes in the ‘intensity of site use’.
Redistribution of populationsIn the NSW Blue Mountains, Stockton and Holland (1974: 55) pointed out that there is a sterilegap between the Capertian and Bondaian assemblages in all stratified sites, somewherebetween 6050 BP and 3360 BP, though the dates for these sterile layers are not the same at allsites. In support of their views, they referred to disconformities at Kenniff Cave, Noola andCapertee, all of which are highland sites. They interpreted the ‘hiatus’ as a gap in occupationat those sites (1974: 55) and a ‘vacation of the mountains’ (1974: 60). They suggested this maysignify a response to or a worsening of the climate or might merely reflect social factors as yetunknown (1974: 46). Epidemic and cultural upheaval are mentioned (1974: 55).
Stockton and Holland concluded that population decline may have occurred in theBlue Mountains during two periods — between ca 6000 BP and ca 3500 BP and within the last1000 years. The earlier decline, they indicated, may have been more widespread in otherhighland areas of eastern Australia, but it is presented in terms of redistribution of the localpopulation (movement out of the Blue Mountains) rather than general changes in populationsize. The hiatus in Blue Mountains sites was refuted by Johnson (1979: 10, 23, 111), who saidsuch sterile or relatively sterile zones may relate purely to use of the specific site and not to thegeneral area.
Hallam (1977: 10) proposed that the large number of Pleistocene sites and the few latesites in the Willandra Creek system (NSW) are evidence that increasingly arid regions couldnot maintain their high Pleistocene population levels. Ferguson (1985: 1, 3) argued that theearly to mid-Holocene archaeological record in south-western Western Australia is evidence ofa progressive abandonment by a formerly large population, and, that from about 6000 BP toabout 4000 BP, the entire region was virtually depopulated; a process which he said beganabout 10,000 BP. Ferguson (1985: 490–1) based his argument on a ‘drop in artefact numbers’during the mid-Holocene at some seven, possibly nine, sites across south-western WesternAustralia (an area of about 220,000 sq km). Ferguson (1985: 493–7) acknowledged that risingsea-levels must have enforced a pattern of relocation to the east and the north. However, sincethe pattern appears to have been maintained in areas not directly affected by the rising sea, he(1985: 4) postulated that an increase in the distribution of thick sclerophyll forest due toclimatic change moved the focus of human exploitation into adjacent desert areas, whichwould have been made more productive by the increased rainfall of the period.
Decreased ‘intensity of site use’One of Morwood’s (1987, see above) criteria for ‘development of social and demographiccomplexity’ was ‘a reduction in occupational intensity at some sites reflecting increased status
Increases and decreases in number of sites and artefacts: a review of interpretations and explanations of the 1970s and 1980s
terra australis 21
31

differences and restrictions on access to knowledge and specific localities’. Morwood (1986,1987) documented a decrease in stone artefact deposition rates about 1000 BP at two sites insouth-eastern Queensland: Maidenwell and Gatton. At Maidenwell, since there was very littlebone, and the charcoal as well as stone decreased in the uppermost deposits, Morwood (1986:96, 98) suggested there was ‘a significant reduction in the intensity of site use’ after 1000 BP,though he considered that artistic activities continued. For the decreases at Gatton, Morwood(1986: 117) proposed a different interpretation — see below under Behavioural Change,Qualitative Changes to Artefact Assemblages.
Stockton and Holland (1974: 56) (as stated previously) interpreted trends in the NSWBlue Mountains sites as either a ‘peak population and/or a peak of preference for cavedwelling’. If one accepts the former, this implies that they saw a population decrease in the last1000 years; if the latter, then there was a change in the type of location that people preferred toinhabit; for example, a change from rockshelters to bark huts in open locations (1974: 48, 58;Stockton 1981: 13). Stockton and Holland (1974: 48) suggested, in addition, that increasedmobility must also be considered as an alternative to the foregoing proposal. Johnson (1979:111) suggested the marked fall-off in artefact concentrations in the last 500 to 1000 years atCapertee 3 may reflect not so much ‘a shift in Aboriginal exploitation of the area but simply inthe sporadic occupation of the site’ [my emphasis]. He added that such sterile or relativelysterile levels in sites may be the norm rather than the exception and that they need not beregarded ‘as hiatuses of occupation … dense concentrations of artefacts may reflect length ofstay and group size/composition rather than intensity of occupation of the area as a whole’(see comments above as well).
At Devon Downs (on the lower Murray River, South Australia), Smith (1982: 114–15)argued for a decrease ‘in intensity of site use’ or a ‘decline in use of the shelter’, as well as for a‘change in site function’ after 2000 BP. He (1982: 114) based this on the ‘marked decline inquantity of occupational debris and the utilisation of proportionately more shellfish in units 1and 2’. Smith suggested:
The absence of a marked decrease in the amounts of stone and bone in the upper levels ofFromms Landing No. 2 suggests that the decrease noted at Devon Downs shelter is the result oflocal factors. (Smith 1982: 115)
This interpretation contrasts with Mulvaney’s (1960) earlier more general explanation (seebelow). The local factors suggested by Smith were migrations of the main river channel, whichchanged the suitability of the shelter as a campsite. He suggested the function of the sitetherefore changed:
… the consumption of more shellfish and the use of less stone on-site are consistent with moreephemeral use of the shelter as a ‘dinner-time’ camp by people exploiting the resourcesavailable in the nearby river. (Smith 1982: 115)
In this interpretation of the decreased artefact accumulation rates, Smith provided a morecomplex set of reasons, in which decreased intensity of site use was associated with changes inthe local environment as well as subsistence patterns (i.e., behavioural change).
Behavioural changeExplanations for decreases in the archaeological record involving behavioural changes relateto changes in: 1. qualitative aspects of the artefact assemblages — artefact types and raw materials;2. subsistence strategies, methods and/or technologies; and,3. intra-site discard patterns.
What’s changing: population size or land-use patterns? The archaeology of Upper Mangrove Creek, Sydney Basin
terra australis 21
32

Qualitative changes in artefact assemblagesQualitative aspects of the artefact assemblages include the types of implements made as wellas the types of raw materials used in making items of material culture, and the explanationsincorporate changes in both raw materials and subsistence methods/technology.
Several researchers proposed that decreased artefact accumulation rates in the upperlevels of sites were due to a change in the raw materials being used, but the change was notsimply from one type of stone material to another, it was a change from stone to another typeof raw material. Mulvaney (1960: 74) and Ross (1985: 83) proposed that a change from stone (adurable material) to organic materials (e.g., bone, shell or wood, which have not survived)would leave a record which suggests that there was a decrease in the implements/artefactsmanufactured. In his explanation for the sequences at Devon Downs and Fromms Landing 2,Mulvaney (1960: 74–5) suggested that organic materials replaced stone. He suggested that aswitch to a greater use of wood, reeds and fibre in manufacturing artefacts (as described in theobjects used at contact) was part of adapting to a riverine environment and may have beenthe reason for the decline in stone- and bone-working and deterioration of stone-working inthe upper levels at these sites. He (1975: 243, 1969: 91–2) later adopted a more universalexplanation which related to south-eastern Australia generally: ‘a move towards the use oflocal organic raw materials and a decline in both the quality and quantity of stone utilisation’.
Schrire (1972: 664–6) pointed out that in the upper level at Borngolo (Arnhem Land)there was an abrupt drop in the density of stone and bone tools, but that it was not associatedwith a decline in the overall density of faunal debris. She (1972: 665–6) interpreted this asforaging continuing, and explained that the decline in stone tools ‘may have resulted from theintroduction of iron, for use as spear tips and knives’, which was introduced by Macassantraders. No iron was discovered in the upper levels of Borngolo, but Schrire explained itsabsence by saying it was probably a rare and valuable commodity that was seldom discardedor mislaid.
Changes in subsistence strategies/technologyIn Morwood’s (1986) explanation for decreased artefact accumulation rates at Gatton,qualitative changes in the artefact assemblages (i.e., disappearance of backed artefacts) wereseen to be associated with changes in subsistence behaviour. At Gatton, faunal remains,charcoal and sediment deposition did not decrease at the same time as the number of stoneartefacts decreased about 1000 BP (Morwood 1986: 117). Morwood said the decreases in stoneartefact deposition rates and the disappearance of backed artefacts and barbs, if taken inisolation, suggest a late decrease in the activity range and occupational intensity. However, heargued that the increased rates of faunal, charcoal and sediment deposition in the upper levelsindicate the site was being used more intensively, while late increases in faunal diversity showa broadening of the resource base. He (1986: 117) concluded that ‘If changes in the artefactualand faunal sequences are functionally related, then general changes in the technology ofpredation are indicated’. Morwood suggested there was a change in emphasis from‘individual pursuit strategies … in which both spears and macropods featured prominently touse of both individual pursuit and co-operative hunting strategies using nets’.
Morwood’s explanation contrasts with that of Smith (1982: 114), who also associatedthe ‘decline in occupational debris in the upper levels’ at Devon Downs with a change insubsistence. Smith believed that change in ‘the type of food consumed’ on site after 2000 BP(from mammals to shellfish, i.e., food in smaller packages), appears to reflect a significantlydifferent use of the shelter after 2000 BP. For Devon Downs, Smith (1982: 114) concluded that,although the decrease in occupational debris in the upper levels was associated with a change
Increases and decreases in number of sites and artefacts: a review of interpretations and explanations of the 1970s and 1980s
terra australis 21
33

in the type of food consumed, there was also a change in the occupational intensity of the site(see previous discussion under Decreased Intensity of Site Use).
Changes in intra-site discard behaviourIt has been proposed that changes in the location of discard within a site may have producedapparent decreases in artefact accumulation rates (Johnson 1979; Smith 1982: 114; Hiscock1984: 134). For Capertee 3, Johnson (1979: 94–5) said, ‘The presence of a relatively sterile zonebetween the last major Capertian horizon and the succeeding Bondaian occupation does notnecessarily imply any out-of-the-ordinary abandonment of the area’ (see above sections), butit may ‘reflect shifting patterns of site usage, so that any one part of the shelter was only usedsporadically as a dumping or knapping zone’; that is, the locations of discard changed at theintra-site level (i.e., Bailey’s [1983d: 127] functional change).
Discussion
Many interpretations and explanations proposed in the 1970s and 1980s for changes over timein the number of sites inhabited and the number of artefacts accumulated in individual sitescentred on population increase, or population increase associated with intensification andincreasing social and political complexity. There was, however, an increasing awareness thatfactors other than demography accounted for or were involved in these quantitative changesin the archaeological record.
In the studies reviewed above, increases in populations were often seen as part of ageneral continent-wide event, but the redistribution of people from one environmental zone toanother (without necessarily involving general population increase) was also given as anexplanation for an increase in either the number of sites or the amount of material atindividual sites in a particular zone. Changes in the amount of material in individual sites(often referred to as changes in the ‘intensity of site use’) were also interpreted as reflectingsmaller-scale changes within the same environmental zone; for example, a change from theuse of one habitation type to another (rockshelter to open), or from one site to another of thesame type, although it was often not explicitly stated. More ‘intensive’ use of a region bysimilar numbers of people was proposed also as an explanation for increased numbers of sitesand greater amounts of material in individual sites, as well as an expansion into the ‘easternhighlands’ associated with increased ceremonial activities.
Other interpretations and/or explanations for increasing archaeological evidenceincluded changes in the typology, technology or raw materials in the stone artefact assemblages(which I refer to as qualitative changes), changes in hunting and gathering techniques/methods/strategies (including mobility), as well as environmental, geomorphological andother site formation processes. Climatic or environmental changes were frequently seen ascontributing factors for a significant or dramatic increase in the number of sites at a particulartime, though some researchers gave these changes a determining role. Climatic and/orenvironmental changes were seen as agents in arguments for general population increase(where they were seen as influential or contributing factors), redistribution of populations fromone zone to another (where they played a more ‘determining’ role) and changes in thepreference for one habitation type over another. Many researchers proposed that a combinationof factors may have led to the present archaeological record. The population-change advocatesusually include environmental and behavioural factors in their models, with variationsbetween their models occurring because of the prominence given to different factors.
What’s changing: population size or land-use patterns? The archaeology of Upper Mangrove Creek, Sydney Basin
terra australis 21
34

Decreases in site numbers and artefacts were less often acknowledged. Part of thereason for this may be the scale at which people viewed the archaeological record; that is, theywere looking for differences between the pre-5000 and post-5000-year period or the pre-4000and post-4000-year period (e.g., Bowdler 1981; Ross 1985). Such broad divisions are unable toreveal a decrease that occurred in the last 1000 or 2000 years BP. Most interpretations andexplanations for ‘decreases’ were similar to those given for ‘increases’, although Stockton andHolland (1974: 46, 48, 55, 60) also suggested a changing preference for open campsites (barkhuts) rather than rockshelters, ‘social factors as yet unknown’ and ‘epidemic and culturalupheaval’. Morwood (1987: 343) proposed ‘increased status differences and restrictions onaccess to knowledge and specific localities’ and Mulvaney (1960, 1969, 1975) and Schrire (1972)suggested changes from one raw material (stone) to another which has not been preserved(organic) or one which was not left behind (iron). The presence of organic materials (shell orbone artefacts and food refuse) which survive in the upper levels of many sites has allowedmore complex and/or plausible behavioural explanations to be proposed for decreases instone artefacts in the late-Holocene (e.g., Mulvaney 1960, 1975; Smith 1982; Schrire 1972;Morwood 1986, 1987), than for low artefact numbers and accumulation rates in early-Holocene and late-Pleistocene levels. Most of the alternative explanations for populationincrease or ‘increasing intensity of site use’ were given as brief, relatively general statementswhich were not investigated in any detail.
Although the idea of population increase appears to have acquired prominence in theliterature in the 1980s, the concept of population decrease, albeit usually regional, was notmissing in earlier work; for example, Stockton and Holland (1974) in eastern Australia, andHallam (1977) and Ferguson (1985) for other parts of Australia. The explanations put forwardby Stockton and Holland (1974: 55, 60) for the excavated sequences in the NSW BlueMountains included suggestions that there was an early-Holocene hiatus or populationdecline between ca 6000 BP and ca 3500 BP, a middle Bondaian peak in occupation between ca3500 BP and ca 1000 BP, and that, after ca 1000 BP, there was a decline in the population of theBlue Mountains. Stockton and Holland interpreted their evidence as shifts in population fromone area to another. Hiscock (1986: 47) said that while the decline in artefact accumulationrates could be interpreted as either a reversal of intensification or a decrease in population, itneed not imply any devolution — it may simply reflect changes in nature and structure ofsettlement, technology or resource use. In most studies advocating population increase, theevidence was an increasing number of habitations established and/or used. In contrast, apartfrom Hiscock (1986), studies including population decrease based their interpretations on adecrease in the number of artefacts or in the artefact accumulation rates at sites.
In studies where continuing population increase was claimed, a long-term increasewas usually implied — slow at first but with a more dramatic rate of increase in the mid- orlate-Holocene; the population size at contact was assumed to be the maximum reachedthroughout the history of Aboriginal occupation of Australia (Lourandos 1980a: 245, 1985b;Morwood 1984; Ross 1984: 202–6; Beaton 1985: 16). Some (e.g., Birdsell 1977: 149; Ross 1985:81) accepted that short-term fluctuations occurred, although they did not indicate the lengthof the period over which they assumed a short-term decrease would have extended. Beaton(1985: 17) acknowledged that population changes in Australia may have been different atdifferent times in different places, but he (1983: 96) argued that something on a continentalscale happened in the mid-Holocene. He claimed a simple population increase model wouldadequately account for all the archaeological expressions (increase in number of sites,increased use of some sites, increased use of marginal environments, and an apparent increasein communication) without reference to social transformations or restructured economies.He stated:
Increases and decreases in number of sites and artefacts: a review of interpretations and explanations of the 1970s and 1980s
terra australis 21
35

If the gross volume and overall distribution of archaeological remains even roughly reflects thenumbers and distribution of people then what we already know about the abundance of mid-to late-Holocene archaeological sites should be sufficient justification for us to hypothesise thatthe Australian population had its significant growth period beginning about 4000 or 5000 yearsago. (Beaton 1983: 96)
Beaton’s model for population increase contrasts with some of the models, such asBirdsell’s (1957, 1977), which had the ‘ceiling’ being reached early in prehistory (ca 2000 years[1957] or ca 5000 years [1977] after colonisation) and then population size remaining stable forthe greater part of Aboriginal occupation (see discussions in Lourandos 1980a: 256; Beaton1983, 1985; Ross 1984: 202–7). Beaton’s (1983: 96) conclusion that ‘the Australian populationhad its significant growth period beginning about 4000 or 5000 years ago’ could be right, but istoo simplistic.
The 1970s and 1980s studies document both decreases and increases in artefactaccumulation rates, habitation establishment rates, and the numbers of habitations used in thelate-Pleistocene, early-Holocene and late-Holocene archaeological records of many regions,although they were documented more often for the latter half of the Holocene. If one assumesthese quantitative changes in the archaeological record by themselves indicate variations inpopulation size, then the evidence suggests that population levels in some regions may havealtered quite significantly before 5000 BP as well as after 5000 BP, and that changes in bothperiods included population decreases as well as increases. The assertions of continuouslyincreasing population sizes in some regions in the late-Holocene are not sustainable, andwhether postulated redistributions in local and regional populations had any relationship tooverall continental trends cannot be determined. Equally, if one assumes that the quantitativechanges are indicative of changes in different behaviours, then the demographic trends of pre-colonial Australia are still open to debate, and the reasons for the increases and decreases innumbers of sites and artefacts require further investigation.
The foregoing studies were the context in which the archeological material from theUpper Mangrove Creek catchment was analysed. In the past decade or so, many regionalstudies have built on concepts introduced in the 1970s and 1980s — particularly those relatingto technological systems, the reorganisation of subsistence strategies including mobilitypatterns, and the restructuring of social relations. These recent studies are incorporated intodiscussions in the final chapters.
What’s changing: population size or land-use patterns? The archaeology of Upper Mangrove Creek, Sydney Basin
terra australis 21
36

The fieldwork program was designed and implemented within the focus of the originalresearch project, which was to study site and artefact distribution patterns across thecatchment to investigate past land-use and subsistence strategies in the coastal regions ofsouth-eastern NSW. Although these specific aims — to investigate relationships between coastand hinterland — were not pursued, the fieldwork framework and the data it producedproved ideal for the research directions ultimately taken: the interpretation and explanation ofchronological changes in numbers of sites and artefacts.
Terminology and definitionsTerms commonly used by archaeologists to describe Aboriginal sites that occur in the UpperMangrove Creek catchment are rockshelters with archaeological deposit; rockshelters witharchaeological deposit and art; rockshelters with archaeological deposit, art and grindinggrooves; rockshelters with archaeological deposit, art and burial; rockshelters witharchaeological deposit and grinding grooves; rockshelters with art; open artefact scatters; rockengravings (on open rock platforms); axe grinding grooves (on open rock platforms).
Since many sites contain more than one set of archaeological evidence (particularlyrockshelters), these terms were not only cumbersome but inappropriate for the analysesI undertook. It was also considered inappropriate to use the term ‘site type’ for the evidence atsites, since these categories (archaeological deposit, art and grinding grooves) are themselvesnot types of sites, but types of archaeological evidence at sites (or at different types oflocations, e.g., in rockshelters or on rock platforms). I therefore use the words location,archaeological trait and contents (assemblages or elements) to describe and refer to places wherearchaeological fieldwork was carried out and in discussing and analysing the archaeologicalevidence recorded. Reasons for using these terms are outlined below, and abbreviations forvarious terms used in tables and figures are set out in Table 3.1.
The term ‘site’ is used and defined by researchers in different ways for recording andanalytical purposes depending on the aims of their project. I use the term site (or
terra australis 21
37
Upper Mangrove Creek catchment: fieldworkand analysis: aims and methods
3

archaeological site) only for places where there is archaeological evidence for Aboriginal useof the location. Definitions used during the field recording and analyses undertaken for thisproject are given below.
LocationThe word ‘location’ was introduced since excavation was carried out not only atarchaeological sites but also at places which proved not to be archaeological sites (i.e., potentialhabitation shelters — see below). Since the term ‘site’ by itself is usually used in archaeologicalliterature to refer to archaeological sites, it became confusing to call places where there wereno archaeological remains (or no proven archaeological remains) sites. I use the term ‘location’when referring to all places at which excavation was undertaken. The term ‘excavatedlocation’ covers rockshelters or open areas with or without archaeological evidence.
A location is a place in or on which an archaeological trait (defined below) exists ormay exist. In this sense, locations are micro-topographic features, as distinct from macro-topographic ones such as ridgetops, ridgesides and valley bottoms. Locations in whicharchaeological traits occur are divided into sheltered and open. Sheltered locations arerockshelters; open locations are areas of open ground (deposit, sediment) and expanses ofopen sandstone (e.g., rock platforms). Trees are also included as a type of location. These fourlocations, referred to as rockshelters (SH), open rock (OR), open deposit (OD) and trees (T), aredescribed below.
What’s changing: population size or land-use patterns? The archaeology of Upper Mangrove Creek, Sydney Basin
terra australis 21
38
TTaabbllee 33..11 Upper Mangrove Creek catchment: terminology and abbreviations used for archaeological evidence.
LOCATIONS: MICRO-TOPOGRAPHIC FEATURES ON/IN WHICH ARCHAEOLOGICAL TRAITS OCCUR
Location Abbreviation
Rockshelter SH
Open deposit OD
Open rock OR
Tree T
ARCHAEOLOGICAL TRAITS: TYPES OF PHYSICAL EVIDENCE PRODUCED BY HUMAN BEHAVIOUR
Archaeological trait Abbreviation
Archaeological deposit AD
Image IM
Grinding area GA
Burial BR
Scarred tree ST
CONTENTS: ARCHAEOLOGICAL ASSEMBLAGES AND ELEMENTS CONTAINED WITHIN EACH TRAIT
Archaeological trait Assemblage/element
Archaeological deposit Stone artefacts
Bone artefacts
Faunal remains
Plant remains
Ochre
Charcoal
Image Figures (pigment [drawings, paintings, stencils] and engraved)
Grinding area Grooves (of different shapes)
TYPES OF DEPOSIT:
Type of deposit Abbreviation
Archaeological deposit AD
Sterile deposit SD
Potential archaeological deposit PAD
No deposit ND

Rockshelters form in both the Narrabeen Group and Hawkesbury sandstone and occurin any size cliff face as well as in large isolated outliers and fallen boulders (Figs 1.3, 1.4, 3.1 and3.2). They have formed by cavernous weathering and/or block-fall. The floor area and height ofthe shelters in the catchment vary greatly. Floors can be rock or sediment, flat or sloping, dry orwet. The non-cultural components of deposits forming shelter floors may derive from outsidethe shelters — for example, slopewash (depending on the configuration of the shelters and theirposition on the land) — or can be restricted to roof-fall and/or windblown sources.
Open rocks are expanses or exposures of sandstone (e.g., rock platforms), which varyin shape, size and slope. They occur in all topographic zones, and include creek bottomswhere water runs over bedrock (Fig. 3.3).
Open deposit is sediment of any depth which can occur on alluvial or colluvial flatsforming creek banks (Fig. 3.4), on structural benches on ridgesides, and on ridgetops. Theseareas vary in size and defining the boundaries in most cases was almost impossible, orrelatively arbitrary. Structural benches are flat to low-gradient areas along ridgesides formedduring the weathering of the underlying sandstone bedrock.
Archaeological traitsDuring the analyses, the different types of archaeological evidence at each site were consideredas discrete units and I needed a general term which I could use to refer to these units. As statedabove, the term ‘site type’ was considered inappropriate for these units and the term ‘type ofarchaeological evidence’ was cumbersome. The term ‘archaeological component’ already hasan accepted use in archaeology, particularly in America (Willey and Phillips 1962: 21; Chang1972: 7, 9–10; Thomas 1979: 231–4, 458). I initially used the word ‘feature’ (Attenbrow 1987:93–5), but now use the term ‘trait’ as the term ‘feature’ is often used to refer to particular
Upper Mangrove Creek catchment: fieldwork and analysis: aims and methods
terra australis 21
39
Figure 3.1 Loggers: shelter with archaeological deposit
dating back to ca 11,000 BP. June 1980. Photographer Val
Attenbrow.
Figure 3.2 Emu Tracks 2: shelter with archaeological
deposit. February 1980. Photographer Val Attenbrow.
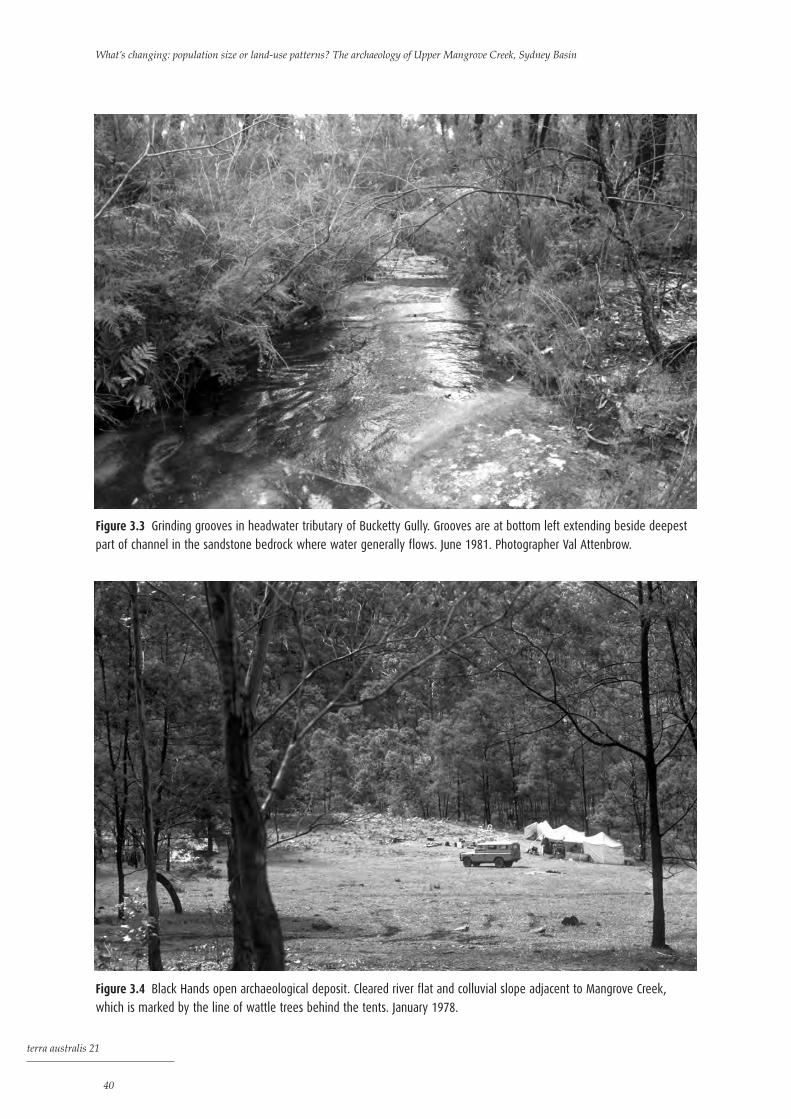
What’s changing: population size or land-use patterns? The archaeology of Upper Mangrove Creek, Sydney Basin
terra australis 21
40
Figure 3.3 Grinding grooves in headwater tributary of Bucketty Gully. Grooves are at bottom left extending beside deepest
part of channel in the sandstone bedrock where water generally flows. June 1981. Photographer Val Attenbrow.
Figure 3.4 Black Hands open archaeological deposit. Cleared river flat and colluvial slope adjacent to Mangrove Creek,
which is marked by the line of wattle trees behind the tents. January 1978.

phenomena, such as hearths or flaking floors, within sites (e.g., McManamon 1984: 229). I usethe term archaeological trait to refer to the type/s of archaeological evidence at a site, each traitbeing the physical evidence of a distinct part of a past behavioural system, which took place invarious parts of the countryside. One or more traits may exist at a site; for example,archaeological deposit, art and grinding grooves can all occur in one rockshelter. Because somesites have more than one trait (multi-trait sites), the total number of traits recorded in thecatchment is greater than the total number of recorded sites.
Rather than the term ‘art’ or ‘pictures’ (Clegg 1984: 10–11; 1985: 44) or ‘rock-art’(Chippindale 2001), I have used the term ‘image/s’. I use the term ‘open archaeologicaldeposit’ instead of ‘open artefact scatter’, ‘open site’ or ‘open campsite’, which are the termsoften used by archaeologists to refer to surface concentrations of stone artefacts in the open. Inusing the term open archaeological deposit, I include locations where artefacts have beenrecorded on the ground surface only as well as locations where artefacts are known to occur atdepth throughout sediment. I use the term ‘open site’ to distinguish sites which are in openlocations from those which are in rockshelters; for example, grinding grooves and engravingsare usually ‘open sites’, though they also occur in rockshelters.
The archaeological evidence in the catchment has been classified into fivearchaeological traits: Archaeological Deposit (AD), Image (IM), Grinding Area (GA), Burial(BR) and Scarred Tree (ST) (Table 3.1; Figs 3.5 to 3.11). These terms, as used in this monograph,are defined below.
Archaeological deposit is sediment which contains one or more of the following:stone artefacts, bone artefacts, faunal remains, plant remains, ochre and charcoal. In the case ofplant and faunal remains, deposits were classified as archaeological only where the remainscould be identified as being humanly derived and were not from natural deaths or animalpredation. The status of charcoal is less clear and is discussed in a later section of this chapter.Archaeological deposits are assumed to be the remains of campsites or habitations (inhabitedsites); no quarries were identified. Sites with deep deposit and large, rich stone and faunalassemblages — for example, Loggers Shelter (Fig. 3.5) — were places where people stayedovernight for one or more days, and in and from which they carried out a range of activities.Some archaeological deposits, especially those with small assemblages, may be places wherepeople stopped during the day to rest or carry out a variety of tasks, such as tool andequipment maintenance by both men and women during hunting and gathering trips, as wellas the eating and/or processing of food. Other deposits could represent transit camps wherepeople stayed en route, for example, to ceremonies or to trade with other groups.
Archaeological deposits occur in open locations as well as rockshelters. In a fewrockshelters (e.g., Axehead Shelter, Firestick Shelter), archaeological materials were foundwhere there is virtually no deposit; that is, the deposit is a thin lens of unconsolidatedsediment which was less than 3cm deep, with occasional pockets up to 10cm deep in smalldepressions or crevices in the rock floor. The archaeological materials were, in effect, lying onthe rock floor. In these circumstances, the rockshelters were still classified as having ‘anarchaeological deposit’.
Images consist of drawings, paintings, stencils, engravings and/or scratched outlines(Figs 3.6 to 3.8). The first three are referred to as pigment images and the latter two asengraved images. All figures, whether their motif type was recognisable or indeterminate, areincluded in counts. The context in which images were made is not directly identifiable.Religious belief pervades most aspects of Aboriginal life and, while many images may havebeen made in a religious, spiritual or ceremonial context (Mathews 1896a, 1897; Morphy 1999),others would have been for secular purposes. By using the term ‘image’ to refer to all figures thatoccur at a single location, I am not implying that all figures were made at the same time, or thattheir makers saw them all as a single entity or necessarily as being associated with each other.
Upper Mangrove Creek catchment: fieldwork and analysis: aims and methods
terra australis 21
41

What’s changing: population size or land-use patterns? The archaeology of Upper Mangrove Creek, Sydney Basin
terra australis 21
42
Figure 3.5 Loggers Shelter during excavation of Squares E and F. Squares A, B and C at right. August 1978.
Photographer Val Attenbrow.
Figure 3.6 Charcoal images, including emu and other birds, macropod, people (male and female) and snakes (including
death adders?) in Boat Cave. 1978. Photographer Val Attenbrow.

Most of the images are pigment figures. Engraved figures occur in only two openlocations (rock platforms), each with a small number of figures (all macropods), and in tworockshelters where the only images recorded are emu tracks — Emu Tracks 1 has oneengraved and possibly five red pigment tracks; Emu Tracks 2 has 15 engraved tracks (Fig. 3.8).Although Clegg (1984: 16) and McDonald (1994: 141, 150, 192–6, 334–6) refer to the engravedimages in Emu Tracks 2 as ‘Panaramitee’, there is nothing to indicate their age or that they areof great antiquity. Emu Tracks 1 is a shallow cavernously weathered concavity with no floordeposits. The deposits in Emu Tracks 2 have not been radiocarbon-dated, but the nature of theexcavated sediments and stone artefact assemblages suggest the shelter was inhabited nomore than ca 4000 years ago.
Grinding areas are locations where grooves have been ground into the surface ofsandstone bedrock or broad ground surfaces have been created by human activities. In thecatchment, most grooves are of the size and shape that are interpreted as being locations whereground-edged implements (e.g., axes/hatchets) were shaped or sharpened (Figs 3.3 and 3.9;Attenbrow 1987: 139–40). Some grooves, however, may have been for other purposes(Vinnicombe 1980: XI: 6), for example, large deep ones and broad shallow areas may have beenassociated with plant processing, whereas narrow, deep grooves (Fig. 3.9) were probably forshaping wooden spears or bone tools (NSW NPWS 1979). A broad ground area (ca 25cm x 25cm)adjacent to a grinding groove was recorded on a low, floor-level sandstone shelf at the rear ofWhite Figure (Fig. 3.10). Similar ground areas have been reported infrequently in the region — forexample, locally in rockshelters in Hungry Creek (Koettig and Hughes 1983: 10, 22, Table 1, Fig.5), slightly further away on Mt Yengo (McDonald 1994, Appendix 1, Fig. A1.5), and on an openrock platform with engravings and grinding grooves at Daleys Point overlooking BrisbaneWaters (pers. obs.). Sub-incised grooves (i.e., a ‘normal’ groove with a narrower groove centredalong its base) were found at two sites, Sharp Gully and Geebung Grooves. Some grindinggrooves in the catchment were recorded in rockshelters (e.g., under driplines), but most were onopen rock platforms. No portable grooves were found in association with archaeological deposits,and they are rarely found in the Sydney/Hawkesbury region except in coastal sand dunes (pers.obs. Australian Museum archaeological collection). No engraved/incised channels associatedwith rock pools were found in the catchment, although they occur at other sites in the region(Mathews 1896b, 1901; Vinnicombe 1980: XI: 6).
Burials are buried human skeletal remains.Scarred trees usually have areas where sections of bark and often a piece of the
underlying wood have been removed from the trunk and large branches of trees. Bark wasoften removed for shields, containers, canoes and shelters. The only scarred tree in thecatchment which was accepted as being the result of Aboriginal activities has several footstepscut up its trunk (Fig. 3.11). The steps, which appear to have been cut with a metal axe/hatchetand thus date to early colonial times, were probably cut in order to gain access to possums orhoney. In deciding that other scarred trees were not of Aboriginal origin, the dimensions,shape and location of the scar/s on the tree as well as the age of the tree, and extent ofregrowth around the scar, were considered. The occurrence of current and recent historicalforestry activities in the catchment was also taken into account.
The contentsThe materials or artefacts in an archaeological trait are referred to as its contents. They consistof various assemblages, e.g., assemblages of stone artefacts, faunal remains, figures andgrinding grooves. Archaeological deposits may contain more than one type of assemblage ormaterial, which is often a major analytical component (e.g., stone artefact assemblages andfaunal assemblages); the images and grinding areas contain only one type of assemblage —that is, figures and grooves respectively (Table 3.1). Classification of the contents is discussedin more detail later in this chapter.
Upper Mangrove Creek catchment: fieldwork and analysis: aims and methods
terra australis 21
43

What’s changing: population size or land-use patterns? The archaeology of Upper Mangrove Creek, Sydney Basin
terra australis 21
44
Figure 3.7 Hand stencils, including one with forearm, and black infilled kangaroo head in Black Hands Shelter. August 1978.
Scale has 10cm divisions. Photographer Val Attenbrow.
Figure 3.8 Engraved images in Emu Tracks 2: emu tracks. August 1979. Scale has 10cm divisions. Photographer Val Attenbrow.

Upper Mangrove Creek catchment: fieldwork and analysis: aims and methods
terra australis 21
45
Figure 3.9 Grinding grooves at Sharp Gully: note narrow groove on left. Easter 1980. Scale has 1/5/10cm divisions.
Photographer Val Attenbrow.
Figure 3.10 Ground area adjacent to grinding groove in White Figure Shelter. August 1982. Scale has 1/5/10cm divisions.
Photographer Val Attenbrow.
SitesThe term ‘site’ is used only when referring to a location with one (or more) archaeological trait/s. Asite is any location where physical evidence of Aboriginal activity or activities is found, exceptfor an ‘isolated find’ (see below). No locations are known that would be classified as ‘naturalmythological sites’, that is, locations at which there is no archaeological evidence but whichare or were of spiritual significance to Aboriginal people.
Isolated findsWhen recording and classifying stone artefacts found in the open, a distinction was madebetween an ‘isolated find’ and a site. A single artefact found in the open by itself may havebeen an accidental loss or a chance discard when, for example, people were out hunting or enroute from one habitation site to another. In contrast, since the same element of accident orchance cannot be applied to the presence of a single grinding groove or drawing, single itemsin these categories are considered traits and, if by themselves, sites. However, isolated stoneartefacts in open contexts were recorded since even a single stone artefact indicates thepresence of people in an area. The possibility that buried artefacts may be present at the samelocation as an isolated artefact, and that an isolated find is simply the only visible item of anopen archaeological deposit, is discussed in the following chapter.
Defining SitesThe following criteria were taken into account when determining whether particulararchaeological traits were at the same or different sites.
Open archaeological deposits are distinguished from isolated finds on the basis of thenumber of artefacts and the distance between artefacts and/or artefact clusters (Fig. 3.12). Two(or more) artefacts less than 50m from each other constitute a site. An individual artefact
What’s changing: population size or land-use patterns? The archaeology of Upper Mangrove Creek, Sydney Basin
terra australis 21
46
Figure 3.11 Scarred tree: one of a series of footsteps made with a metal axe up the tree trunk. The tree was dead when
found by loggers adjacent to Mangrove Creek below its junction with Boomerang Creek. October 1979. Scale has 10cm
divisions. Photographer Val Attenbrow.

found more than 50m from any other artefact (single or clustered) is classified as an isolatedfind. Two or more clusters of artefacts with less than 50m between them are classified as onesite, while if the distance between them is greater than 50m they are regarded as separate sites.In instances where a creek or gully exists between two clusters of artefacts, even if less than50m apart, they are classified as two sites, as a conscious decision may have been made to siton one side of the watercourse or the other; each side of the watercourse may have a differentaspect and receive sunlight at different times of the day, or for varying lengths of time indifferent seasons. In these situations, the gully must have existed for a much longer period oftime than the artefacts presently exposed on the ground surface — at a minimum, a gully thatone could argue is not the result of European land-use and is not cutting through what wasoriginally a large open archaeological deposit.
Artefacts which are in the open in front of a rockshelter with archaeological deposit andwhich could derive from activities within or immediately in front of the rockshelter areclassified as part of the shelter deposit and thus part of that site. At none of the rockshelters inthe random sampling units were visible artefacts found extending continuously for any greatdistance in front of the shelter (i.e., >20m), and thus the problem of having to decide whetherthe site should be classified as both a sheltered and an open location was not encountered.However, stone artefacts found in the open above a rockshelter are classified as a separate site,as a decision may have been made to undertake activities away from the rockshelter, that is, ata different type of location.
Traits in adjacent locations. Although single artefacts and/or artefact clusters have to bemore than 50m apart before they are classified as separate sites, where each archaeologicaltrait is in a different type of location or a separate physical location, the distance criterion is notused. For example, grinding grooves which occur in a creekbed below a rockshelter witharchaeological deposit are classified as being at a separate site even if the distance between thecreek and the rockshelter is less than 50m. Similarly, if two rockshelters with archaeologicaldeposit and/or images are less than 50m apart, they are classified as separate sites (unless thearchaeological deposit appears to be continuous between the two rockshelters — a situationwhich was not recorded in the catchment).
Open images (rock engravings, engraved images). A criterion similar to that used byMcDonald (1986a) to define open images in the Maroota project was adopted:
… all those artefacts occurring on/in a discrete platform … physically separated from otherarchaeological entities by either a distance of 100 metres or by the presence of vegetationseparating sandstone platforms … each and every platform is potentially an individual site.(McDonald 1986a: 18; the term ‘artefact’ in this quote refers to engraved figures.)
Engraved figures on separate rock platforms are classified as separate sites, but I use adistance of 50m and not 100m as used by McDonald. For the open images recorded in the UpperMangrove Creek catchment, this criterion did not conflict with the 50m distance criterion.However, according to both criteria (distance and separate rock platforms), some figures, whichwere originally recorded by Ian Sim as one site (Kyola Road/Nevertyre, NPWS Site card45–3–528), are classified in my analyses as two sites (and thus two archaeological traits).
In practice, the above definitions and criteria mean that: 1. Archaeological evidence/materials are classified as separate traits if they are of a
different type (e.g., archaeological deposit, image or grinding groove) or if a distance>50m separates each assemblage of like elements (e.g., stone artefacts, figures andgrooves). That is, two clusters of stone artefacts along the same creek bank (or twosets of grooves along the same creek) which are >50m apart are classified as twoseparate traits (and also separate sites). Exceptions to the distance criteria are:
Upper Mangrove Creek catchment: fieldwork and analysis: aims and methods
terra australis 21
47

What’s changing: population size or land-use patterns? The archaeology of Upper Mangrove Creek, Sydney Basin
terra australis 21
48
OPEN ARCHAEOLOGICAL DEPOSITS
ARCHAEOLOGICAL DEPOSITS IN ROCKSHELTERS
ENGRAVED IMAGES ON OPEN ROCK
SITE 8
SITE 10
SITE 9
SITE 7SITE 6
SITE 4SITE 3
SITE 1
SITE 2
SITE 11
SITE 5
<50mdistances all <50m
>50m>50m
>50m
<50m
>50m
Artefacts / FiguresNot to scale
>50m
<50m
artefacts <50m from dripline
<50m
>50m
IF IF
watercourse
gully
Figure 3.12 Distance criteria applied in defining sites.

(a) where a rockshelter >50m in length has surface archaeological evidence at both endsbut the deposit in between is unexcavated and could potentially containarchaeological materials; in these cases, the total deposit is classified as a single traitand the rockshelter and all the deposit within it is classified as one site; and,
(b) where two (or more) locations can be classified as separate physical locations, forexample, two rockshelters, two rock platforms or the opposite sides of a creek whichare <50m apart. In these instances, the locations are classified as separate sites andthus the contents of each location are considered as a separate trait or traits.
2. Traits of different types are classified as being at the same site if they are <50m apart as longas they are in or on the same type of location, for example, in the same rockshelter, on thesame rock platform or on the same creek bank. This means that traits in the followingsituations are not classified as being at the same site, but as being at separate sites:
(a) two open archaeological deposits which are <50m apart but each is on opposite sidesof a small creek or gully (i.e., they are not on the same creek bank);
(b) where traits are in separate rockshelters or on separate rock platforms which are<50m apart.The implications of using these site definitions are discussed where relevant in future
chapters. The distance of 50m adopted in defining sites is arbitrary, but did have a practicalbenefit. At a distance of 50m, two locations are sufficiently far apart that they can be mappedand given separate grid references on 1: 25K topographic maps.
Potential habitation shelters and potential archaeological depositsRockshelters without archaeological evidence, but with particular dimensions andcharacteristics, were also recorded during the survey. These rockshelters are called potentialhabitation shelters (PH shelters). A rockshelter was deemed to be a PH shelter if it had space forat least two people to gain ‘adequate shelter’. The following criteria were used in the field: 1. floor space: suitable for two people to sleep in a curled-up position, that is, flat and
horizontal with a minimum area of 2m × 1m;2. height: sufficient for two people to stand or stoop in a comfortable working position,
that is, at least 1.2m high;3. protection: the overhang is deep enough (from dripline to back wall) to protect the
floor area from weather, that is, 1m minimum;4. dryness: the floor (or part of it), and inside the rockshelter generally, must be dry;5. accessibility: the rockshelter must be easily accessible. (Furey 1978: 10; Vinnicombe 1980: VIII: 2–3, 1984: 109; Attenbrow 1981: 12, 1982b: 72.)
During the North Hawkesbury project, Vinnicombe (1980: VIII: 2–3) sought morereliable data on the reasons why particular rockshelters and particular locations were selectedas habitation sites. She wished to assess rockshelters that were available for use against thoseshelters which were actually used by comparing the location, distribution and characteristicsof the occupied rockshelters with those that were not occupied. For this, Vinnicombe requireddata on all rockshelters that were available for habitation, and rockshelters whose floors wereeither deposit or rock were recorded as potential habitation shelters. During the course of theMangrove Creek Dam fieldwork, it was noted that many of these rockshelters had floordeposits but there was no visible evidence in the form of stone artefacts to indicate that theywere ‘archaeological deposits’. It was decided that such deposits should be considered aspotential archaeological deposits, that is, a deposit which has no surface evidence such asstone artefacts to indicate it may contain buried archaeological materials (Attenbrow 2003–4).In addition, it was perceived that a potential archaeological deposit could also occur in a
Upper Mangrove Creek catchment: fieldwork and analysis: aims and methods
terra australis 21
49

rockshelter that was already classified as an archaeological site on the basis of having imageson the walls.
More recently, in environmental impact projects and many cultural heritagemanagement projects, rockshelters without deposit or any other evidence for occupation arenot necessarily recorded and the term Potential Habitation Shelter is seldom, if ever, used. Theterm potential archaeological deposit (PAD) has, however, been adopted to refer to a deposit thatmay contain archaeological materials and they are usually test excavated if threatened byproposed developments. Initially, it was used only in connection with deposits in rockshelters(e.g., Attenbrow 1981: 131–2; Attenbrow and Conyers 1983; Haglund and Stockton 1983; Greer1985; Corkill 1995; Corkill and Edgar 1996; Haglund 1995), however, as in America (e.g., Wobst1983; McManamon 1984; Shott 1989), use of the concept has been extended to include therecording and testing of PADs in open contexts. These include flat areas which would havebeen suitable for camping on; for example, alluvial river banks or terraces, structural bencheson ridgesides, ridgetops and dunes. Investigation of these deposits has been incorporated intoAustralian cultural resource management projects with positive results (e.g., Koettig 1986: 5,28, 1989: 2–3, Appendix I site POK6, 1991 Appendix 2, site B58; McDonald and Rich 1993;McDonald, Rich and Barton 1994; Jo McDonald CHM 1999; Baker and Martin 2001).
Use of the potential habitation concept and the test excavation of PADs in thecatchment thus enabled the detection of otherwise ‘invisible’ sites and archaeological deposits.Recording and testing of potential open archaeological deposits was not, however, included inthe Upper Mangrove Creek projects.
Fieldwork aims The fieldwork was designed to retrieve the following sets of data in order to address questionsrelating to the nature of Aboriginal occupation in the catchment, and whether such occupationvaried in different parts of the catchment and/or changed over time: 1. the type and nature of the traits at archaeological sites in the catchment; that is, the
archaeological deposits, grinding areas, images, burials and scarred trees;2. the contents or types of archaeological materials in the traits; for example, the type of
stone artefacts and faunal remains in the archaeological deposits, the type of figures inimages, and the type of grooves at grinding areas;
3. the frequency, distribution and location of sites, archaeological traits and selectedassemblages/elements in relation to terrain variables such as topography, vegetationand geology; that is, the location and setting of the traits/sites on the land;
4. the on-site characteristics (attributes) of the site’s location (e.g., of the rockshelter or rockplatform): morphology, dimensions, aspect, slope, geology, nature of ground (rock orsediment);
5. temporal changes in the frequency, density and distribution of sites, archaeological traitsand selected elements during the documented period of prehistoric/Aboriginaloccupation (in particular, sites with archaeological deposit);
6. the date of initial use of individual sites (in particular sites with archaeological deposit);7. the date at which quantitative and qualitative changes in the stone artefact assemblages
at individual sites occurred.In addition, it was necessary to have data about the contents of each archaeological trait inquantifiable terms — for example, the number of different types of artefacts, bones, groovesand figures. This was required to investigate whether there was variation in the assemblagesat sites in different parts of the catchment, and to assess the rate of temporal changes thatoccurred within individual sites and in the number of sites in the catchment.
What’s changing: population size or land-use patterns? The archaeology of Upper Mangrove Creek, Sydney Basin
terra australis 21
50

After the original research project was modified in mid-1985 (once the implications ofthe documented quantitative changes to ‘the population increase/intensification debate’ wereapparent — see Chapter 2), analyses of the survey data within a spatial framework were takento a preliminary stage only, and only part of the data outlined above was utilised. However,adopting probability sampling methods for the site survey to ensure that data retrieved werefrom an unbiased sample of sites, and the level of recording undertaken, proved mostadvantageous to the line of research ultimately undertaken. The procedures adopted duringthe research project for the survey, recording, excavation and classification of thearchaeological evidence in the catchment are outlined in the remainder of this chapter.
Field SurveySampling designThe storage area of the proposed dam (12 sq km) was totally surveyed for sites (Furey 1978;Attenbrow 1981). The aim of the storage area survey was to record all Aboriginal sites thatwould be lost due to inundation or other works associated with the dam construction.However, to address my original research questions relating to site distribution patternswithin the catchment (Attenbrow 1987: 63–6), information about the population parametersfor the archaeological evidence in the total catchment was needed. This included data on therange of archaeological evidence in the catchment as well as the frequency and density inwhich sites and traits occurred in different areas of the catchment. The storage area, consistingonly of the valley bottoms, was thus a biased sample of the catchment for my purposes, and itwas necessary to gain data about the archaeological evidence from the area of the catchmentabove the storage area.
Neither time nor funding permitted an intensive survey of that part of the catchmentabove the storage area (about 89 sq km). Total survey was not necessary for my researchpurposes if I could gain an unbiased, and hopefully a representative, sample of thearchaeological evidence in the catchment. Binford (1975: 253) considered:
Sampling is a procedure which is concerned with providing a representative and unbiasedview of the archaeological record as it exists at the time the archaeologists begin makingobservations. One of the basic purposes of probability sampling is to reduce bias (Read 1975: 53).
However, probability sampling can reduce bias only in the ‘human’ selection of the sample; itcannot assist in removing biases introduced by past and present environmental factors, forexample, destruction due to erosion of sediments, and decreased visibility due to sedimentaccumulation or dense vegetation. In addition, Chenhall (1975: 20) points out that sampling isbased on the premise that the sample adequately represents the total population, though hegoes on to demonstrate that it may not be an adequate representation even where probabilitysampling is adopted. If selecting a ‘representative’ sample is taken to mean picking examplesthat exhibit the extremes in the ranges of variation, or picking at least some examples of alltypes, or all diagnostic types, then such samples are possible, but the result is most unlikely tobe ‘representative’ in any other sense (Cowgill 1975: 261). If ‘representativeness’ is taken tomean that the sample statistics are virtually identical to the corresponding values for thepopulation, then there is no way we can be positive that this is so without already knowingthe population values. In archaeological field projects, this is usually not possible.
Probability sampling methods were adopted for the site survey in the UpperMangrove Creek catchment in an attempt to obtain an unbiased and representative sample ofthe archaeological evidence in the catchment. The sample selected in the catchment can beconsidered unbiased only in terms of my site selection processes. Environmental factors whichmay have biased the record are discussed in Chapter 5. However, since the total population of
Upper Mangrove Creek catchment: fieldwork and analysis: aims and methods
terra australis 21
51

archaeological evidence in the Upper Mangrove Creek catchment is not known, whether thesample gained is representative of the total catchment is not known.
The sampling design has been outlined previously (Attenbrow 1982b: 68–72), butsome details were not included and some parts were not described in conventional samplinglanguage. Details of the sampling design are therefore presented below.
The sample fraction or percentage of the catchment selected for site survey was 10%.There is no formula that can be used to calculate the optimal percentage that should becovered — the size of the appropriate sample fraction depends on many things. The figure of10% was chosen somewhat arbitrarily but, on the basis of the previous surveys, I consideredthat a sample of this size (which included 10.1 sq km of the catchment) would provide asufficient number of sites for statistical analyses.
When selecting the sample to be intensively surveyed for sites, the fact that thestorage area had been surveyed previously was disregarded, and the total catchment wastaken as the area to be sampled. Several ways of obtaining the 10% sample were considered: 1. a 10.1 sq km block: a single 10.1 sq km block which encompassed total small creek
systems as used by Vinnicombe (1980: IX; 1984: 107–9) for her surveys of coastal andestuarine ecosystems;
2. a simple random sample: sampling units chosen under a simple random sampling scheme using: • quadrats (or grids) of 0.25, 0.5, 1 or 2 sq km in area,• transects across the catchment of varying widths;
3. a stratified random sample: sampling units chosen under a stratified randomsampling scheme with the catchment stratified according to topographic zones, andwith 10% of the units in each stratum selected randomly; sampling units to be 0.25 sqkm in five of the zones and 1 sq km in the sixth. The scheme used by Vinnicombe was included for consideration since the results of
archaeological work for the Mangrove Creek Dam were to be integrated with her findings forthe North Hawkesbury project (Vinnicombe 1980: IXC: 7). However, it was not possible toselect a 10 sq km block equivalent to the survey areas in Vinnicombe’s other ecosystems asnone of the larger tributaries were short enough to be included as such a block. In addition,the possible areas that might have equated to Vinnicombe’s survey areas did not provide thedata required for my research purposes.
The use of transects within a simple random sample was considered impracticablegiven the dissected and rugged nature of the terrain. In initially considering a random sampleby quadrat method, 1:25K topographic maps of the catchment were gridded and a series ofsamples, each using sampling units of a different size, were selected on the basis of randomnumber tables. However, from the maps it became clear that these schemes would not fulfilmy research aims. None of the schemes produced a sample which included units in all of thethree topographic zones in which previous work indicated specific types of archaeologicalevidence may be associated — that is, ridgetops, valley bottoms and ridgesides. Schemesusing the larger sized units (1 and 2 sq km) provided an even less adequate sampling of allparts of the catchment than did the 0.25 and 0.5 sq km units.
I finally decided that before selecting the sampling units, the catchment should bestratified according to the three topographic zones — ridgetops, valley bottoms and ridgesides— and scheme 3 (a stratified random sample — without replacement) was adopted.Stratification into these topographic zones was considered necessary to investigate questionsabout the relationship of particular Aboriginal activities to various topographic zoneswithin the catchment. For example, are sites with the largest assemblages and/or richestarchaeological deposits only in the ‘main’ valley bottoms; what is the distribution of grindinggrooves; and are engravings sites more commonly found on the ridgetops?
What’s changing: population size or land-use patterns? The archaeology of Upper Mangrove Creek, Sydney Basin
terra australis 21
52

Consideration of how the catchment may have been used in pre-contact times alsoinfluenced this choice — that is, if people had been visiting the catchment as part of theirsubsistence round to hunt and gather, the base camps (major habitations) may have beenalong the main section of Mangrove Creek and its larger tributaries creeks where water wasmore plentiful (i.e., the valley bottoms). The main section of the creek system is thusdistinguished from the more minor tributary (subsidiary) creeks. If people had been onlypassing through the area, say en route between the Hunter Valley and Brisbane Waters(Gosford), then major habitations may have been on the ridgetops — in particular, theperiphery ridgetops, since historical accounts indicate that some of the major ridge systemswere used as travelling routes through the region. A report by Francis Barrallier (1801) refersto contact between people of the lower Hunter Valley and the Hawkesbury, crossing themountains near Mt York, as well as Broken Bay. McCarthy (1936, 1939b: 407, 1939c: 100)reported contact between people of the Singleton area in the Hunter Valley andGosford/Brisbane Waters. In a field report, McCarthy reported that Peter Howe, a resident ofSomersby Falls, had informed him that there was a ‘trade and travelling route from Gosfordalong the Mangrove Mountain which formed a great highway along the ridge as far north asSingleton, via Wollombi’ (1936: 2–3; see also McCarthy 1939a: 1, where he refers to the BulgaPlains area). His published version (1939b: 407) states, ‘they followed a track which traversedCockfighter Creek [present-day Wollombi Brook] and the Macdonald River to MangroveMountain.’ Such a route includes the ridges forming the northern and eastern, and possiblywestern, watersheds of the Mangrove Creek catchment. Groups from Lake Macquarie on theadjacent coast also went ‘to the mountains with upwards of 60 spears to exchange foroppossum cord made of the fur’ and also to participate in a ceremony (Threlkeld 1826 inGunson 1974, Vol. 2: 206). Whether ‘the mountains’ included the catchment is not clear, but itis possible; the word ‘mountains’ is more likely to refer to the sandstone plateau of the coastalhinterland than the Blue Mountains/Great Dividing Range. Further to the west, the BoreeTrack is reported to have been used for travel between the territories of the Wonarua of theupper Hunter Valley and the Darginung of the Macdonald Valley (Moore 1981: 423). Thepossibility of periphery ridgetops being trade routes is one of the reasons why they aredistinguished from peninsula ridgetops in the sampling strategy.
Another reason why periphery and peninsula ridgetops were distinguished is thatthe peninsula ridgetops are long narrow areas, usually without water, except for rock pools. Incontrast, the periphery of the catchment has much broader, flattish areas with low relief wherethe upper reaches of the tributaries often contain springs which flow all year round, even indry seasons (Robert Thompson, Kulnura, 1980, pers. comm.).
The geology of the catchment is predominantly sandstone with two small areas ofhighly weathered volcanic breccia. The valley bottoms and lower ridgesides are within asequence of sandstones, siltstone, claystones and shales of the Gosford Formation of theNarrabeen Group, while the upper ridgesides and ridgetops are Hawkesbury sandstone (NSWDepartment of Public Works 1977, Vol. 2: 8). Any significant relationship between particulararchaeological features and geology can still be detected within the topographic stratification ofthe catchment, and thus geological variation did not warrant special consideration in thesampling design. However, the existence of Hawkesbury sandstone in only the upper elevationsof the catchment is a consideration when interpreting its site distribution and land-use patterns.
Vegetation was not used as the basis for stratification, since the whole catchment wascovered with Eucalypt forest or woodland. Although there are some differences in the plantcommunities, depending on slope and aspect, none were known to be meaningful in terms ofAboriginal subsistence strategies which might be reflected in site locations (though this stillrequires testing). In addition, the distances within the catchment and between different plantcommunities are so small that it did not seem likely (at the time of survey design) that
Upper Mangrove Creek catchment: fieldwork and analysis: aims and methods
terra australis 21
53

habitations would have been located within a specific vegetation zone in order to exploitresources which were available only therein. However, as discussed in Chapter 9, Aplin’ssubsequent (Aplin 1981: 33–4; Aplin and Gollan 1982: 20–6) interpretation of faunal changes inMussel and Deep Creek Shelters suggests otherwise.
Each of the three topographic zones (valley bottoms, ridgetops and ridgesides) wasfurther subdivided into two as outlined in Table 3.2 and shown in Figures 3.13 and 3.14.I considered 0.25 sq km to be the optimum area for sampling units in five of the topographiczones given the irregular shapes of the zones and the number of units (sample size) thatwould result: peninsula ridgetops, main valley bottoms, subsidiary valley bottoms, mainridgesides, subsidiary ridgesides. Periphery ridgetops are relatively larger and relativelyflatter than the other zones and were divided into units of 1 sq km. Once these sampling unitswere marked on the map, several small areas <0.25 sq km remained at the upper ends ofsubsidiary creeks and several small peninsula ridgetops. These were treated as separate‘zones’ when selecting the sampling units to be included in the survey, but in the analyses thesmall peninsulas were included with peninsula ridgetops and subsidiary creek ends withsubsidiary creeks. The eight zones from which samples were selected were thus:
Ridgetop Periphery (RT-PERI) periphery ridgetopsPeninsula (RT-PEN) peninsula ridgetopsSmall Peninsulas (RT-SPEN) small peninsulas
Valley Bottom Main Creek (VB-MC) main valley bottomsSubsidiary Creek (VB-SC) subsidiary valley bottomsSubsidiary Creek Ends (VB-SCE) subsidiary creek ends
Ridgeside Main Creek (RS-MC) main ridgesidesSubsidiary Creek (RS-SC) subsidiary ridgesides
For ease of reference during future discussions, the topographic zones are referred to by the terms listed in the third column. Abbreviations noted in brackets are used in tablesand figures.
Each sampling unit was numbered and random number tables were used to select(without replacement) a 10% sample of the units in each of the eight zones. The total area ofeach of the topographic zones ranged between 0.7 and 31.1 sq km, so that the total number ofunits in each zone varied and ranged between nine and 110 (Table 3.3). Where the totalnumber of sampling units in a topographic zone was not an even ‘ten’ (i.e., 10, 20, 30), thenumber of units selected was based on the figure being rounded up or down to the nearest‘ten’ (e.g., 12 to 10, 28 to 30; thus 10% of 12 was taken as one unit and 10% of 28 as three units).The main ridgesides (RS-MC) are an exception to this rule due to a mathematical error and thenumber was incorrectly rounded up and not down. The units selected for surveying are calledRandom Sampling Units (RSUs). Selecting 10% of the units from each of the eight zonesresulted in a total of 31 sampling units (Fig. 3.15), which represents a sampling fraction of10.7% (Table 3.3). RSU.117 is in two sections because of the way the 0.25 sq km units were‘counted’ out on the map. It is in the low relief upper reaches of a tributary where theperiphery ridgetop adjoins the subsidiary valley bottom, and the land between the twosections of RSU.117 are parts of these zones (compare Figs 3.14 and 3.15).
Although the sampling design for the survey is stratified random sampling (withoutreplacement), it would be classed as stratified random cluster sampling (without replacement)for analyses investigating the comparison of artefact assemblages at individual sites (seediscussions in Mueller 1975 and Judge et al. 1975). Since the analyses undertaken to date forthis project deal only with the frequency and density of sites and artefacts in particular zones,it has not been necessary to take these factors into account.
What’s changing: population size or land-use patterns? The archaeology of Upper Mangrove Creek, Sydney Basin
terra australis 21
54

The sampling units selected under this stratified random sampling scheme areirregular in shape since they follow the morphology of the creeks and ridges. The shape andarea of the units selected proved ideal in practical terms during the field survey. Samplingunits consisting of square grids and straight line transects placed over dissected sandstonecountryside would have been more awkward and would have taken longer to survey in thefield than the irregularly shaped units of the adopted scheme.
Survey fieldwork undertaken Two large-scale site survey programs have been undertaken in the Upper Mangrove Creekcatchment: the intensive survey of the storage area which was carried out by the NSW NPWS(Furey 1978), and the stratified random sample of the total catchment undertaken by myself,which is described here. In future discussions, these surveys are referred to respectively as the‘storage area survey’ and the ‘random sample survey’. Because the random sampling unitswere selected disregarding the fact that the storage area had previously been surveyed forsites, some or part of some of the random sampling units fall within the storage area. There isthus some overlap of the areas covered by the two surveys and some sites fall into both
Upper Mangrove Creek catchment: fieldwork and analysis: aims and methods
terra australis 21
55
Table 3.2 Upper Mangrove Creek catchment: description of topographic zones into which catchment was stratified for
sampling purposes. Figure 3.14 shows distribution and Figures 1.2 to 1.4 and cover show views.
1. RIDGETOPS
Flat to flattish land on the tops of ridges, plus 10m below the break of slope which distinguishes ridgetop from ridgeside. Where the ridgetopsloped down gradually from the top for a considerable distance, the boundary between ridgeside and ridgetop was not always easy to determine,and an arbitrary, but what seemed appropriate, line was drawn.
Ridgetops are divided into:
(a) Ridgetops — periphery (RT-PERI)
Flat to gently sloping land at the periphery/perimeter of the catchment, which contains the headwaters of the creeks before they become steep-sided gullies. In some places, this coincides with the boundary between the Hawkesbury sandstone and the underlying Narrabeen Group.
(b) Ridgetops — peninsula (RT-PEN)
Ridgetops that extend into the catchment from the periphery ridgetops and inter-finger between the major creeks and gullies. For samplingpurposes, several small ridgetops running off the periphery ridgetops were treated as separate zones and were called small peninsularidgetops (RT-SPEN).
2. VALLEY BOTTOMS
Land up to 40m above the creek bottom on either side of the creek (except in the upper reaches of the catchment where this stipulation wouldmean the areas defined as periphery ridgetops were included). This zone is divided into:
(a) Valley bottoms — main creeks (VB-MC)
Mangrove Creek up to Ramas Arm, part of Bucketty Gully and Deep Creek, and Boomerang Creek up to its junction with Sharp Gully,are classified as ‘main creek’, based principally on the width of the valley bottom.
(b) Valley bottoms — subsidiary creeks (VB-SC)
Sections of the creeks and gullies between the upper limit of 2(a) and the boundary of 1(a).
The main creek zones are generally in the wide valleys with alluvial flats, while the subsidiary creeks are in narrow steep-sided valleys and,if alluvial flats are present, they are very small and usually at creek or gully junctions. For sampling purposes, several small areas at theheadwaters of creeks were treated as separate zones and were called subsidiary creek ends (VB-SCE).
3. RIDGESIDES
The land remaining between the ridgetops and the valley bottoms (i.e., the area of sloping ground 10m below the ridgetop and 40m abovethe valley bottom). It is divided into:
(a) Ridgesides — main creeks (RS-MC)
(b) Ridgesides — subsidiary creeks (RS-SC)
depending on whether the land is above a section of a main creek or a subsidiary creek as defined above. In the upper reaches of some creeks,where the elevation between valley floor and ridgetop is 40m or less (e.g., the headwaters of Bucketty Gully), there are no units classifiedas ridgesides and the boundary of ‘valley bottoms’ adjoins ‘ridgetops’.

What’s changing: population size or land-use patterns? The archaeology of Upper Mangrove Creek, Sydney Basin
terra australis 21
56
WAT
ERSH
ED
RIDG
ETOP
—PE
RIPH
ERY
NO R
IDGE
SIDE
ZON
E
VALL
EY B
TM
SUBS
IDIA
RY C
REEK
IN U
PPER
REA
CHES
OF
CAT
CHM
ENT
eg R
SU.1
01
VALL
EY B
OTTO
M
MAI
N CR
EEK
RIDG
ESID
E
RIDG
ETOP
—PE
NINS
ULA
WAT
ERSH
ED
RIDG
ETOP
—PE
RIPH
ERY
RIDG
ESID
E
SUBS
IDIA
RY C
REEK
VALL
EY B
TM 4
0m
10m
10m
40m
40m
=<
10m
Figure 3.13 Upper Mangrove Creek catchment: schematic cross-section of catchment showing topographic zones.

Upper Mangrove Creek catchment: fieldwork and analysis: aims and methods
terra australis 21
57
Figure 3.14 Upper Mangrove Creek catchment: topographic zones. Table 3.2 has descriptions.
RIDGETOPS — solid line marks boundary between periphery (RT-PERI) and peninsula (RT-PEN)
RIDGESIDES — broken line marks boundary between main creek (RS-MC) and subsidiary creek (RS-SC)
VALLEY BOTTOMS — main creek (VB-MC) VALLEY BOTTOMS — subsidiary creek (VB-SC)
1 km
N
Mangrov
e CkDeep Ck
Boomerang Ck

sampling schemes. Vegetation conditions had changed by the time the random sampling unitswere being surveyed for my research project and so units which fell within the storage areawere surveyed again. The period between the two surveys was extremely dry, the understoreyand ground cover was less dense and visibility was greater in many parts of the catchment forthe later survey.
During the random sample survey, 28 of the 31 selected sampling units weresurveyed (Table 3.3). The three sampling units not surveyed were RSU.92 (VB-SC), RSU.110a(VB-SCE) and RSU.210 (RS-SC). Of the 28 sampling units surveyed, a small area of four wasnot finished (RSU.57, RSU.156, RSU.177 and RSU.263). On several occasions, extra ground wascovered in the field and so the areas surveyed were slightly larger than the original samplingunit. However, the additional areas and the locations recorded outside the sampling units arenot included in the research project analyses. With regard to the strata into which the studyarea was divided, the sample size and sampling fraction achieved are slightly lower thanproposed in three zones: subsidiary valley bottoms (VB-SC), subsidiary creek ends (VB-SCE)and subsidiary ridgesides (RS-SC) (Table 3.3).
What’s changing: population size or land-use patterns? The archaeology of Upper Mangrove Creek, Sydney Basin
terra australis 21
58
Table 3.3 Upper Mangrove Creek catchment: details of stratified random sample. [1] prop/ach indicates proposed/achieved
Area of catchment 101 sq km
Area of land sampled 10.1 sq km (10%)
Sample type stratified random sample (without replacement) (of land)
stratified random cluster sample (of sites)
Stratification 8 zones based on 6 main topographic zones (Table 2)
Sampling unit quadrat (irregular in shape)
Sampling unit sizes Size A: approx. 0.25 sq km RT-PEN, VB-MC, VB-SC, RS-MC, RS-SC
Size B: approx. 1 sq km RT-PERI
Size C: <0.25 sq km RT-SP and VB-SCE
Sampling frame 291 units
Sample size proposed: 31 achieved: 28
Sampling fraction proposed: 10% achieved: 9.6%
selected: 10.7%
Survey intensity distance between team members 10m to 30m
area/person-day ca 6ha
STRATIFICATION (figures taken to nearest 0.1)
Topozone Total area Total no. of units Sample size prop/ach [1] Sample fraction prop/ach Area surveyed
sq km % % % % sq km %
Catchment 101.0 291 31 28 10.0 9.6 10.1 10.0
RT-PERI 29.3 27 3 3 11.1 11.1 3.2 10.9
RT-PEN 8.5 30 3 3 10.0 10.0 1.0 11.8
RT-SPEN 0.7 9 1 1 11.1 11.1 0.1 14.3
RT-PEN +SPEN 9.2 39 4 4 10.3 10.3 1.1 12.0
VB-MC 4.8 17 2 2 11.8 11.8 0.6 12.5
VB-SC 16.9 59 6 5 10.2 8.5 1.5 8.9
VB-SCE 2.5 15 2 1 13.3 6.7 0.2 8.0
VB-SC +SCE 19.4 74 8 6 10.8 8.1 1.7 8.8
RS-MC 7.2 24 3 3 12.5 12.5 0.8 11.1
RS-SC 31.1 110 11 10 10.0 9.1 2.7 8.7

Upper Mangrove Creek catchment: fieldwork and analysis: aims and methods
terra australis 21
59
RANDOM SAMPLING UNITS RT-PERI VB-MC RS-MC
UNITS NOT SURVEYED RT-PEN VB-SC RS-SC
CATCHMENT BOUNDARY/WATERSHED
STORAGE AREA
23
235
191(part)
114
115A
112
152210
156
75
163
138
271
263
127
2
274
63
37
170
80
177
92
101
191 (part)
190
188
56
57
110A
209
1 km
N
10
Figure 3.15 Upper Mangrove Creek catchment: location of random sampling units.

In terms of the total catchment, the unfinished and unsurveyed units resulted in asampling fraction and sample size that are slightly lower than that proposed — 9.6% and not10%, and 28 instead of 31, respectively (Table 3.3). However, because a mathematical errorcaused a slightly larger sampling fraction (10.7%) to be selected than that originallyproposed (10%), the total area actually surveyed in the sampling units represents 9.96% of thetotal catchment. When the figures are rounded off, this represents 10.1 sq km, which is 10% ofthe catchment area.
Because the number of unsurveyed units represents a low percentage of the totalunits and land area, I was advised that their exclusion does not invalidate the results underprobability sampling theory (Brian O’Toole, Sample Survey Centre, University of Sydney,pers. comm, 8 July, 1985).
Field survey methods Field methods used during the survey of the storage area (Furey 1978) were adopted, but weremodified slightly to suit my specific aims. Fieldwork for the random sample survey wasundertaken in three main periods: May 1979 (seven days), August 1979 (12 days) and May 1981(six days) — a total of 25 days. This is actual survey time excluding establishment time, restdays and a day spent at the beginning of each survey period familiarising new survey teamswith sites likely to be found. The survey team consisted of archaeology/prehistory studentsfrom Sydney and New England Universities, as well as NSW NPWS personnel, graduatearchaeologists, consultants and interested people — a total of 19 different people participatedin the surveys at various times. A total of 172 person-days was spent surveying the randomsampling units; that is, one person-day for about six hectares. It was usually possible to coverone 0.25 sq km random sampling unit per day, except where many locations had to be recordedand/or it took a long time to travel to the sampling unit. Heavy undergrowth in some areasand the rugged nature of the terrain also made progress slow. In some cases, it took one or twohours to travel by vehicle and/or on foot to a random sampling unit.
At the time the survey was carried out, it was considered to be ‘high intensity’(Attenbrow 1987: 72). Teams of between two and six, but normally four to five, people surveyedeach sampling unit. Each person walked along a ‘contour’ of the ridgeside in a zigzag mannerinspecting the zone on either side of the midpoint of the contour. The distance between teammembers varied from about 10m to 30m depending on the terrain. Each sampling unit wasusually a long narrow area which was covered in one sweep, but in some cases two sweepswere necessary to cover the sampling unit. Team members kept together in a line down theslope so that each adjacent member knew where the other was and what ground had beencovered. Team members inspected: • all rockshelters for archaeological deposit, images and grinding grooves, and if no
such evidence was found, their potential for habitation was assessed (see below);• all flat to flattish open ground for open archaeological deposits — particularly those
areas where ground sediments (soil) were exposed due to disturbance or lack ofvegetation by natural or human processes;
• all exposed sandstone areas for engravings, and sandstone areas near water sources(i.e., creeks and gullies, or rock pools and seepage zones on ridgetops and ridgesides)for grinding grooves;
• trees, of suitable size and type, for scars.Potential habitation shelters (PH shelters), in addition to archaeological sites, were
recorded during the survey; this added to the time required for the survey. On average, 10 to15 minutes were spent recording a PH shelter by one or two members, while the rest of theteam stood by or inspected nearby likely locations. When a site was found, all team membershelped in the recording and, on average, this took about an hour for each site.
What’s changing: population size or land-use patterns? The archaeology of Upper Mangrove Creek, Sydney Basin
terra australis 21
60
In addition to the above, five days were spent relocating several sites which were notfully recorded during the survey. Approximately two days were spent looking specifically foropen archaeological deposits along the alluvial flats and banks of Upper Mangrove Creekfrom the dam wall to the junction of Wattle Creek. The initial storage area survey wasundertaken while vegetation was quite lush and the valley bottoms relatively undisturbed.As the drought progressed and as works associated with the dam took place (tree-felling andbulldozing of the 70m contour road), the ground visibility and sub-surface exposure becamegreater. The section of Mangrove Creek between Wattle Creek junction and Bucketty Creekjunction (in which RSU.80 occurs) was re-surveyed intensively, and the banks of theremainder of the creek were re-inspected intermittently and opportunistically wheneverpossible. These ‘re-surveys’ under the changed conditions located several additional openarchaeological deposits (Attenbrow 1997 [1998]). Unfortunately, detailed investigation of mostof the open archaeological deposits was not possible before the storage area was inundated.
Many sites were recorded outside the two survey ‘areas’. Sites were found duringwalks in the catchment, from information given by local residents, and while trying to findalready recorded sites. Local residents also took me to sites they knew in the catchment.Information about sites outside the random sampling units and those recorded within thestorage area has been used as a check on the results of the analysis of the evidence recorded inthe random sampling units (Chapter 5, Discussion).
ExcavationExcavation strategy and methodsI originally intended that all sites in the random sampling units recorded as havingarchaeological deposit or potential archaeological deposit would be included in the excavationprogram. In addition, the deposits in a random sample of PH shelters were to be testexcavated to assess the incidence of PADs in PH shelters being archaeological deposits.However, not all of the sites recorded as having archaeological deposit (17 in rockshelters, fivein open locations) or potential archaeological deposit (nine rockshelters with images) in therandom sampling units were included in the excavation program. The sites excluded were: • three rockshelters which technically have archaeological deposit (i.e., stone artefacts
and/or a hearth and/or some sand present on their sandstone floors), but which inreality have no deposit or no depth to the deposit (Axehead, Button and Firestick);
• one open archaeological deposit at which there is no depth of deposit, that is, a ridgetopsituation with skeletal soils (Kyola Road);
• two open archaeological deposits in totally disturbed locations (Palmers Crossing,Willow Tree Gully);
• a rockshelter initially recorded as a PH shelter but identified late in the researchproject as having archaeological deposit (Token Male).Four PH shelters with deposit were purposefully selected for excavation. It was not
possible to include a larger randomly selected sample within the available fieldwork time.I thus considered it was better to choose PH shelters to answer specific questions, rather thanto randomly select a small number out of the 164 with potential archaeological deposit.PH.166, PH.204, PH.233 and PH.425 were selected: • PH.166 was chosen as no archaeological deposits had been recorded in RSU.191 and,
of the PH shelters that had been recorded in this sampling unit, PH.166 appeared themost likely to contain archaeological materials;
• PH.204 was chosen as a possible artefact had been noted on the surface during thesurvey, and no archaeological deposits had been recorded in RSU.112;
• PH.233 in RSU.63 was chosen to test the proposal that all available rockshelters in theperiphery ridgetops were inhabited;
Upper Mangrove Creek catchment: fieldwork and analysis: aims and methods
terra australis 21
61

• PH.425 was chosen as many PH shelters had been recorded in RSU.209, butarchaeological evidence had been recorded in very few of the rockshelters in thissampling unit.The deposit in 29 locations was excavated. Excavation methods used during the
research project were essentially the same as those used in the salvage program (Attenbrow1981: 37–8).
In the salvage program, excavation was undertaken at two levels: 1. test pits between 0.25m2 and 0.5m2 were excavated, the latter as contiguous 0.25m2
pits;2. larger scale excavations, where between 2m2 and 13m2 was excavated.
The larger scale excavations were carried out in the archaeological deposits whichcontained a relatively greater amount of cultural material than other sites: Black Hands, DeepCreek, Loggers, Mussel and Wattle Creek. Four of the excavated archaeological deposits in thestorage area are within the random sampling units: Loggers, Black Hands Shelter, BlackHands Open Deposit and Geebung.
Initial excavations at Loggers and Black Hands were based on 1m squares(Attenbrow 1981: 38, 98, Fig. 6.4). However, during later work at Loggers (September 1981)and at Mussel and Deep Creek, the 1m squares were divided and dug as contiguous 0.25m2
pits (Attenbrow 1981: 89, 1982b: 8–9, 1982a: 2). The smaller squares provide greater horizontalresolution in provenancing excavated archaeological materials than the 1m squares.
For the research project, the only larger scale excavations were those inarchaeological deposits which lay within both the storage area and a random sampling unit,that is, Loggers and Black Hands. In the remaining archaeological deposits in the randomsampling units, usually one or two separate 0.25m2 pits or an area 100cm × 50cm wereexcavated (Table 3.4). In three archaeological deposits, a 1m2 pit was started initially, butexcavation was restricted to 0.25m2 in the lower half of the deposit.
During the research project, sequential sampling was adopted during the excavationof some archaeological deposits (cf. Read 1975: 60). Based on the salvage excavations,I considered it was necessary to retrieve at least 200 artefacts if I wanted to make statementsabout the presence or absence of artefact types (particularly backed artefacts, which comprised0.5 to 2% of assemblages at already excavated catchment sites) or about the predominance ofcertain raw material types in a particular spit, level or site (Attenbrow 1981: 124, Table 8.3; seealso discussions in Hiscock 2001: 59). Therefore, if the first 0.25m2 pit produced less than 200artefacts and it was calculated that a 1m2 pit would not produce at least that number, no furthersquares were excavated (principally due to fieldwork time limitations). However, if it wasconsidered that excavation of a pit up to 1m2 would provide = />200 artefacts, then furthersquares were excavated. At two of the shelters (Emu Tracks 2 and Uprooted Tree), even thoughan initial 0.25m2 pit produced in excess of 200 artefacts, it was necessary to excavate anadditional adjacent pit in order to reach the bottom of the deposit.
Where a single 0.25m2 pit was dug in an archaeological deposit it was designated T(for test pit, e.g., BC/T). If two separate 0.25m2 pits were dug, they were called T1 and T2 (e.g.,CW/T1 and CW/T2), but if the two 0.25m2 pits formed a 100cm × 50cm trench, the squareswere called Ta and Tb. Where the test pit was 1m2, the four 50cm squares were called Ta, Tb, Tcand Td. At Loggers and Black Hands, where the larger excavations took place before thissystem was instigated, the 1m×1m pits were called A, B, C, etc.
In Loggers and Black Hands, the deposit in each square was excavated in spits takento a depth of ca 10cm unless a stratigraphic change (i.e., a change in colour, texture or contentof the deposit) was observed before that depth. In all other sites, spits were dug to a depth ofca 5cm except where a stratigraphic change was observed before that depth, though in somecases, where deposits appeared to be sterile, spits up to 10cm deep were dug.
What’s changing: population size or land-use patterns? The archaeology of Upper Mangrove Creek, Sydney Basin
terra australis 21
62

The excavations and subsequent analyses of material recovered from the archaeologicaldeposits were directed towards obtaining stone artefact sequences, the date of earliest habitationat each site, inter-site variability in stone artefacts and faunal collections, and temporal changes inthe rate of artefact accumulation. No attempt was made during the analyses to identify variationsin the horizontal distribution of artefacts within individual archaeological deposits.
Excavation was also technically a sampling exercise — at no site was the total depositexcavated (Table 3.4). The square/s excavated in each archaeological deposit were selectedpurposively. Since probability sampling was not employed in selecting the square/s to beexcavated, the assumptions of probability sampling cannot be upheld for the excavated datain the same manner as for the site survey results. Nonetheless, the results can still be used toevaluate hypotheses on a valid statistical basis as long as appropriate statistical methods areapplied; that is, those which allow the assumption of random sampling to be retained (M. Hall1981: 651–4). Despite this predicament, given the ways in which the data from eacharchaeological deposit were to be used, I considered it preferable to adopt the idea of‘constancy’ in selecting the area of deposit to be excavated.
In Loggers and Black Hands, the excavated squares were laid out so that the back andthe front of the rockshelter floors were included, as well as areas outside the dripline. At BlackHands, the upper deposit inside the rockshelter (in squares A and B) had previously beenremoved (by unknown people) and only the lowermost 45cm was in situ. Square F, thecontents of which were analysed for this research, is immediately outside the dripline and itsdeposit was in situ throughout its depth.
At other rockshelters, the area to be excavated was selected because: 1. primarily, it was the area where I assumed human activity would most likely have
been focused in the rockshelter (a subjective assumption); that is, an attempt wasmade to select similar ‘activity zones’ in each shelter (cf. Morwood 1981: 41);
2. the deposit in that area appeared to be undisturbed;3. it appeared to be the area which would have the greatest depth of deposit;4. it was inside the dripline — unless the floor inside the rockshelter was rock (e.g., in
the case of McPherson and Delight).Locating the excavation pit inside the rockshelter also meant that the chance of
slopewashed charcoal dominating the dated samples was less than if the area straddled orwas outside the dripline. The dripline was avoided, since in terms of point two above, thedripline zone is usually a ‘disturbed’ zone, often subjected to some degree of scouring.Driplines have been described as areas where the highest densities of artefacts occur(Morwood 1981: 34, 41; Kohen et al. 1984: 68) and thus in some ways it is the best area toobtain a sample of a deposit that would contain the highest numbers of artefacts per volumeexcavated. However, since the areas being excavated in some archaeological deposits weresmall — 100cm × 50cm and 50cm × 50cm — I considered it best to avoid areas in whichproblems with stratigraphic integrity were likely to occur.
The principal motive in selecting the area to be excavated, however, was that itshould be the same in each rockshelter. This was considered necessary to keep at least onevariable (i.e., the ‘activity zone’ sampled in each rockshelter) constant when investigatinginter-site variability in cultural remains (cf. Johnson 1979: 106; Morwood 1981: 41) and site usewithin the catchment, and variations in the timing of changes in the artefact accumulationrates in individual archaeological deposits.
The deposit from all excavations was sifted through nested 9mm or 8mm and 3mmsieves, or a single 3mm sieve. Nested sieves were used in the larger scale excavations tofacilitate sorting of the materials retained in the sieves. The weight of sandstone rubbleretained in each of the sieves was recorded for use in characterising the deposits.
Upper Mangrove Creek catchment: fieldwork and analysis: aims and methods
terra australis 21
63

What’s changing: population size or land-use patterns? The archaeology of Upper Mangrove Creek, Sydney Basin
terra australis 21
64
Table 3.4 Upper Mangrove Creek catchment: details of excavations in sites with archaeological deposit and potential
archaeological deposit, and potential habitation shelters with potential archaeological deposit. Figures rounded
to nearest 0.5cm. [1] First figure listed against Black Hands and Loggers represents percentage for the excavated
square for which artefacts have been analysed; the second figure is total proportion of deposit excavated.
[2] Depth is the measurement between the ground surface and the often-sloping base of the excavated pit.
SITE NAME/ Area excavated Proportion of arch. Depth excavated[2]
LOCATION Square Size deposit excavated[1] Max. Min. Base of excavation
(cm) % (cm) (cm)
Andara T1 50 x 50 ] 1.0 12.5 8.5 Bedrock (weathered)
T2 50 x 50 ] 24.0 7.0 Discontinued — sand
Axehead ------
Bird Tracks T 50 x 50 1.0 43.0 39.5 Sterile sand
Black Hands SH F 100 x 100 4.0 [12] 101.0 56.0 Sterile colluvial
Black Hands OD T1 100 x 50 ? 104.0 65.0 Discontinued — water
T2 100 x 50 ? 33.0 30.0 Sterile colluvial
Boat Cave T 50 x 50 1.0 39.0 30.5 Bedrock
Boronia Ta-c] 100 x100 4.0 [14.0 6.0 Sterile sand
Td ] [37.5 37.5 Sterile sand
Button -------
Caramel Wave T1 50 x 50 ] 3.0 25.5 9.0 Bedrock
T2 50 x 50 ] 17.5 6.5 Bedrock
Delight SH Ta 30 x 20 ] 7.0 31.5 20.0 Bedrock/sterile sand/rubble
Tb 50 x 40 ] 20.5 11.0 Bedrock/sterile sand/rubble
Delight OD A 60 x 35 ] 25.0 23.0 Sterile colluvial
B 75 x 50 ? 18.0 18.0 Sterile colluvial
C 100 x 50 ] 9.0 9.0 Sterile colluvial
Dingo Ta 50 x 50 ] 3.0 22.5 20.0 Discontinued — burial
Tb 50 x 50 ] 39.0 15.0 Bedrock/sterile sand
Elngarrah Ta-d 100 x100 3.0 33.0 0.0 Bedrock, stepped
Elongated Figure T 50 x 50 1.5 40.0 19.0 Bedrock, sloping
Emu Tracks 2 T1 50 x 50 ] 3.5 44.5 19.0 Bedrock/sterile sand
T2a 50 x 50 ] 79.5 28.0 Rock/bedrock/rubble
T2b 50 x 50 ] 35.0 25.5 Rock
Firestick ------
Geebung T1 50 x 50 ] 2.0 5.0 5.0 Sterile colluvial
T2 50 x 50 ] 5.0 5.0 Sterile colluvial
Harris Gully/PH.204 T 50 x 50 2.0 49.0 23.0 Bedrock, sloping/sterile sand
Kangaroo and Echidna T1 50 x 50 ] 0.5 43.0 36.0 Sterile sand
T2a 50 x 50 ] 29.2 26.2 Rock/sterile sand
T2b 50 x 50 ] 71.0 66.0 Sterile sand
T2c 50 x 50 ] 14.5 9.3 Rock
T2d 50 x 50 ] 29.0 28.0 Sterile sand
Kyola Road OD ------
Loggers E-F 200 x100 4.0 [24.5] 206.0 160.0 Sterile colluvial
Low Frontage Ta 50 x 50 ] 2.0 23.5 16.5 Sterile sand
Tb 50 x 50 ] 47.8 30.0 Bedrock
McPherson T 50 x 50 1.0 19.5 10.0 Rubble
Mangrove Mansions T1 50 x 50 ] 0.5 27.0 13.0 Rubble
T2 50 x 50 ] 28.0 22.0 Discontinued — sterile sand
One Tooth T 50 x 50 1.0 37.5 25.0 Bedrock (weathered)
Palmers Crossing N OD ------
Sunny/PH.233 Ta-b 100 x 50 1.5 71.0 32.5 Rubble

Excavations undertakenExcavating the archaeological deposits in the random sampling units (i.e., excluding thosewhich lay inside the storage area) took place in three periods totalling 40 days between June andAugust 1982. Recording of the rockshelters (i.e., the locations) and images was carried outduring the same field seasons. Fifteen different people (all volunteers) were involved — studentsfrom Sydney, New England and the Australian National Universities and archaeologicalconsultants — providing a total of 170 person-days. Excavation of archaeological deposits in thethree rockshelters which lay in both the storage area and the random sampling units (Loggers,Black Hands and Geebung) was undertaken within the salvage program.
Details of the fieldwork undertaken at each of the 29 excavated locations are set outin Table 3.4. The locations were 27 rockshelters and two open deposits; 23 of the rockshelterswere sites and four were potential habitation shelters with deposit (PAD) (Table 3.5).Archaeological materials were retrieved from all but one of the excavated locations.
The area of deposit excavated at each of the rockshelter sites (excluding Black Handsand Loggers) was between 0.2% and 7% (Table 3.4). Three archaeological deposits had <1% ofthe deposit excavated, 20 had between 1% and 4% (inclusive), and one had 7%. The areaexcavated at Black Hands and Loggers was 12% and 24.5% respectively, though the artefactsfrom all excavated squares were not analysed for this study. The first percentage given incolumn three of Table 3.4 represents the area of the pit from which the analysed artefacts wereretrieved. The figures represent the percentage of the total area of the archaeological deposit;the latter not always being the same as the area within the shelter (see next chapter). It was notfeasible to calculate the percentage of deposit dug at the two open archaeological deposits.
Of the 23 excavated deposits in rockshelter sites, 14 had surface evidence to indicatethat they were archaeological deposits (stone artefacts and/or shell) and nine were rockshelterswith images which had potential archaeological deposit. A total of 13 rockshelters withpotential archaeological deposit were therefore excavated — four PH shelters and ninerockshelters with images; the latter being classified as sites on the basis of the images.
Artefacts were found on the surface of the deposit outside the excavated areas inmany shelters (see next chapter and Appendix 1). In some cases, these artefacts had not been
Upper Mangrove Creek catchment: fieldwork and analysis: aims and methods
terra australis 21
65
Table 3.4 (continued)
SITE NAME/ Area excavated Proportion of arch. Depth excavated[2]
LOCATION Square Size deposit excavated[1]
Max. Min. Base of excavation
(cm) % (cm) (cm)
Ti-tree T1 50 x 50 ] 2.0 11.5 5.5 Rock
T2 50 x 50 ] 38.0 0.5 Rubble
Token Male/PH.235 ------
Two Moths/PH.425 T 50 x 50 1.0 52.5 34.0 Rubble
Uprooted Tree Ta 50 x 50 ] 3.0 72.0 67.0 Discontinued — Tb continued
Tb 50 x 50 ] 114.0 77.5 Bedrock, sloping/sterile sand
Tc 50 x 50 ] 12.0 8.0 Discontinued –– Ta-b continued
Venus Ta 50 x 50 ] 3.0 25.0 22.0 Rock/sterile sand
Tc 50 x 50 ] 32.0 22.0 Rock
White Figure Ta-b 100 x 50 3.0 55.0 15.0 Bedrock
Willow Tree Gully OD -------
Wolloby Gully T 50 x 50 <0.5 33.0 17.0 Bedrock/rubble
PH.166 T 50 x 50 1.0 62.0 49.5 Bedrock (weathered)

noticed during the site survey, but were found during the excavation phase. They becameexposed through treadage and scuffage during excavation activities, which moved leaf-litterabout and led to loss of some vegetation ground cover. The number of archaeological depositsnoted as having surface artefacts in the final lists therefore does not coincide with the numberpresented above, which is the number of archaeological deposits where surface artefacts werefound during the site survey.
The area and depth excavated at each of the locations is also given in Table 3.4. Thebase of most excavated pits was not a horizontal area — it was often sloping bedrock orpartially sloping rock or rubble — and thus maximum and minimum depths (or thickness) ofthe excavated deposits are provided. At some sites, although the excavation started as a 1msquare, the final deposit excavated was restricted to 50cm × 50cm. When sterile deposits wereencountered, if no cultural materials were found after at least 20cm of sterile deposit had beenexcavated, digging ceased and bedrock was not always reached. The nature of the base of eachexcavated pit — for example, whether bedrock, rock (possible bedrock or very largeboulder/slab), rubble, sterile sand or colluvial — is given in Table 3.4 as well. Where morethan one category is given, a greater part of the base consists of the first-mentioned category.
Excavation at Black Hands Open Deposit stopped when the then-rising water from theadjacent storage area was encountered in the excavation pit. Excavation was discontinuedbefore bedrock or sterile deposit was reached in two other archaeological deposits (Anadara andMangrove Mansions) as, once excavation progressed, it was apparent that the deposit was verydisturbed. Probing with a skewer suggested that there was only another 20cm or so depth ofdeposit at Mangrove Mansions and about 12cm at Anadara before bedrock, and at both sheltersthis lower deposit appeared disturbed. At both rockshelters, there were very few artefacts in thedeposit excavated, and it seemed that additional information would not be gained if thedisturbed basal deposits were excavated or another square was excavated in a different part ofthe shelter. This decision was reinforced by the fieldwork time available and the additional timewhich would have been required to return to the sites to dig additional pits.
Classification of contents of archaeological depositsExcept for a few pieces of historical (European) material found in surface spits, the culturalelements recovered from the archaeological deposits were of Aboriginal origin. They consist of: • stone and bone artefacts• faunal remains: (bone, shell and exoskeleton) considered to be the remains of animals
eaten by the Aboriginal inhabitants of the sites, as well as some faunal remains fromnon-human predators (see Appendix 3);
What’s changing: population size or land-use patterns? The archaeology of Upper Mangrove Creek, Sydney Basin
terra australis 21
66
TTaabbllee 33..55 Upper Mangrove Creek catchment: locations and types of deposit excavated.
LOCATION TOTAL
Type of deposit Rockshelter Open deposit
Archaeological deposit 9 2 11
Archaeological deposit
associated with images 5 – 5
Potential archaeological deposit
associated with images 9 – 9
Potential archaeological deposit 4 – 4
Total sites excavated 23 2 25
Total archaeological deposits excavated 14 2 16
Total PADs excavated 13 – 13
Total locations excavated 27 2 29

• plant remains: parts of plants known to be eaten by Aboriginal people and which thusmay be humanly derived, and modified wood;
• ochreous materials: haematite-rich fine-grained stone, or a series of rock types rangingfrom shale to muddy sandstone, ranging in colour from red-brown (containingunhydrated iron oxides such as haematite) to yellow (containing hydrated iron oxidessuch as limonite) (Attenbrow 1982a: 19–20). Only a small amount of this material showsany evidence of use;
• charcoal: assumed to be primarily from fires used for cooking, warmth or artefactmanufacture.The manner in which these materials were classified for the salvage program has
been outlined previously (Attenbrow 1981: 39–44, 1982b; Stern 1981, 1982; Aplin 1981; Aplinand Gollan 1982); however, some changes were made for the research project and so detailsare provided below. Details of the recording procedures for images and grinding areas havebeen excluded from this monograph (see Attenbrow 1987: 116–18 for details).
Stone artefactsFor the salvage program, the stone artefacts were classified into the following types: backedartefacts (Bondi points, geometrics, miscellaneous backed pieces, elouera), other flakedimplements, bipolar pieces, ground-edged implements and ground pieces (i.e., fragments),cores (with and without pebble cortex), waste and hammerstones (Attenbrow 1981: 39–43,1982a: Appendix 2). The category ‘other flaked implements’, which included amorphouspieces with retouch and/or use wear (i.e., non-backed artefacts), was divided into edge-trimmed flakes, thick flake tools, steep-edged scrapers (definitions in Attenbrow 1981: 41–2).Subdivision of the ‘other flaked implements’ in this manner was made to investigate whetherchanges identified by Stockton (1977a: 215–217, 1977c) also occurred in the Upper MangroveCreek catchment. By dividing the non-backed implements at various late-Pleistocene to mid-Holocene aged sites in eastern Australia into pebble and core tools, thick flake tools and edge-trimmed flake tools, Stockton (1977a: 216) documented a gradual shift through time froma predominance of core, pebble and thick flake tools to a predominance of edge-trimmedflake tools.
For the research project, stone artefacts from the archaeological deposits in therandom sampling units have been classified into the following artefact types: backed artefacts(Bondi points, geometrics, elouera, backed miscellaneous), other flaked artefacts withretouch/use wear (R/UW), bipolar cores, bipolar flakes, cores (hand-held percussion), wasteartefacts (which includes redirecting flakes as well as flakes [hand-held percussion] and flakedpieces), ground-edged artefacts and ground fragments, an ochre palette, hammerstones andmanuports (see key and notes to Appendix 1). Bipolar artefacts from Loggers and Black Handswere not reclassified into flakes and cores, and the artefact distribution tables for these twosites retain the salvage program classification system. Since inter-site comparisons of artefactassemblages were not carried out for the research project, this has not affected resultspresented in this volume. A Bulga knife (McCarthy 1976: 53, Fig. 39 [4, 5]) was among theground-edged artefacts retrieved from Kangaroo and Echidna (Fig. 3.16).
Heat-shattered and other fractured pieces, as well as broken flakes, were includedwith flaked pieces during the analyses (see definitions in Appendix 1). Current technologicalapproaches to stone artefact analyses (e.g., Hiscock 1985) advocate the categorisation of heat-shattered and ‘fractured pieces’ separate from flaked pieces. Fractured pieces and heat-shattered pieces were not numerous, and it is unlikely that combining these categoriestogether will have affected the artefact accumulation rates to the extent that the documentedtrends would radically alter. However, this remains to be tested.
Upper Mangrove Creek catchment: fieldwork and analysis: aims and methods
terra australis 21
67

The stone artefacts have beenclassified according to raw material and sizecategories as well. The raw materialcategories are: quartz, quartzite, igneous,silcrete, chert/indurated mudstone/tuff, and‘unidentified fine-grained siliceous’ (FGS)(see definitions in Appendix 1). Quartz, inpebble form, is present and erodes out of theHawkesbury sandstone. Quartz, quartzite,some cherts and the FGS stone materials areall available in pebble/cobble form after theyhave eroded out of the Narrabeen Group(sandstone) conglomerate layers within thecatchment and can be collected from lowerridgesides and particularly creek bedswithin that geological stratum (pers. obs.).Tuffaceous materials, which have beenincluded under chert/indurated mudstone/tuff, and silcrete do not come from thecatchment and possibly come from theHunter Valley or the Hawkesbury–NepeanRiver–Cumberland Plain. Constant accessibilityto and availability of tuff-type chert andsilcrete cannot be assumed to have existedthroughout time. The majority of the bipolarartefacts are quartz, but many silcrete andchert specimens were also recovered.
The size categories into which theartefacts are grouped are 0–1cm, 1–2cm,2–4cm, +4cm; very few artefacts are morethan 4cm long. Size is recorded as the lengthalong the percussion axis of a flake, or thelongest measurement on other artefacts. Forthe salvage program, size was recorded asthe longest dimension, irrespective of thedirection of the percussion axis (Attenbrow1981: 43). A check was made during the recentanalysis and the number of occurrenceswhere the length classes of wider-than-longflakes differed from the width class wasmonitored. The small number of times the percussion length fell into a different size class tothe maximum dimension did not alter the overall percentage figures for the size distributionof artefacts. I therefore consider that data on the size distribution of artefacts from bothprojects are comparable.
Unusual stone implements include a resin-hafted flake from Loggers (Fig. 3.17),which was found in deposit between rocks against the back wall of the lower ceilinged alcovein the shelter (LS/Lb/1), and a broken sandstone ochre palette from Sunny (Sus/T/6) (Fig.3.18). Based on a depth/age curve (Table A2/14), the ochre palette could be between 1400 and1600 years old.
What’s changing: population size or land-use patterns? The archaeology of Upper Mangrove Creek, Sydney Basin
terra australis 21
68
Figure 3.16 Ground-edged artefacts from Kangaroo and
Echidna (test pit 2, spit 3): two hatchet heads (top and
bottom) and Bulga knife (centre). Photographer Carl Bento,
Australian Museum.

Bone artefactsVery few bone artefacts have been identified (Fig. 3.19). Four bone artefacts were found in theupper levels of Loggers: two with pointed ends (one in LS/Lb/1 and another in LS/Bk/1) andtwo with a spatulate-like end (one found on the surface in the small alcove and the other inLS/A/3). Three worked small slivers/fragments of bone, each less than 2.5cm long, werefound in Bird Tracks Shelter (BT/T/3).
Wooden objectsWooden objects which may derive from Aboriginal activities were found in three rockshelters,though each of the three items requires further investigation to verify its origin. In Firestick,part of a thick branch with several cut marks was found in association with the remains of asmall fireplace. The branch was partially burnt and was possibly taken into this small,relatively inaccessible shelter as firewood. The cut marks are on a section of its unburntsurface. The rockshelter is in a part of the catchment and in a location that suggest it wasunlikely that the wood was taken in there recently by non-Aboriginal people, and thus it hasbeen identified tentatively as an Aboriginal artefact. A hand stencil is on the shelter wall.
In Wolloby Gully, a small section of wood with a cut end was excavated in spit 2 ofthe test pit, and in Button Shelter what may be part of a ‘firestick’ base was found on bedrockforming the shelter floor (Fig. 3.20).
Upper Mangrove Creek catchment: fieldwork and analysis: aims and methods
terra australis 21
69
Figure 3.17 Hafted retouched flake from Loggers Shelter
found in lower ceilinged area at rear of shelter (square Lb,
spit 1). Photographer Carl Bento, Australian Museum.
Figure 3.18 Fragment of red ochred sandstone palette
from Sunny Shelter (test pit, spit 6). Photographer Carl
Bento, Australian Museum.
Figure 3.19 Bone artefacts from Loggers Shelter (top:
Square Lb, spit 1; and three at right: surface at rear of
shelter, square A, spit 3-brown, and square Bk, spit 1)
and Bird Tracks (three at left: from test pit, spit 3).
Photographer Carl Bento, Australian Museum.

Faunal remainsFaunal remains from the archaeologicaldeposits in the random sampling units wereanalysed by Aplin (1985, reproduced inAppendix 3) in a similar manner to that usedfor the salvage excavations. Although themajority of fragments are unidentifiable, a largenumber of animals was identified (see nextchapter). Fragments of shellfish were alsopresent — estuarine cockle (Anadara trapezia),freshwater mussel (probably Hyridella sp.and/or Velesunio ambiguus; Ian Lock, MalacologyDepartment, Australian Museum, pers. comm.),as well as unidentified landsnail and yabbies/crayfish (Euastacus australiensis, E. nobilis and/orE. spinifer; Merrick 1993: 61, 72, 76; Jones andMorgan 1994: 93).
The landsnails probably have a non-human origin, and the cockles can only havereached the catchment by human means, given the distance between the estuarineenvironment and the catchment. However, the medium by which freshwater mussels enteredthe archaeological deposits needs some clarification since they inhabit Upper Mangrove Creekand its tributaries. Several species of birds and the water rat eat freshwater mussel, and theyare likely to take shells into rockshelters (Haglund 1981a: 6; Ken Aplin, pers. comm.). Dingoesmay also be responsible for the addition of some shell, since they are known to eat shellfishand eat the species of birds which eat shellfish. Shell from primary and secondary ingestionmay be defecated by dingoes in rockshelters, though the chance of this is minimal (SuSolomon, pers. comm,, 25 November, 1986).
It is most likely that shell fragments in the archaeological deposits in the catchmentare all humanly derived, since: 1. birds are unlikely to deposit shell in the catchment rockshelters, as the species of
birds eating freshwater mussel in the catchment are not the species that take theirfood into rockshelters (P. Smith, NPWS, pers. comm., 1986) and the chance of themdropping inside from above (i.e., while the bird is flying or sitting on the shelteroverhang) would be so negligible as to be archaeologically invisible. The chance ofnon-humanly derived shell being mixed with humanly derived archaeologicalmaterial is more likely to occur along the coast (Horton 1978: 31; Jones and Allen1978) and along major inland rivers and lagoons where some species of birds create‘shell middens’ (shell dumps) by returning successively to the same location to eatshellfish (Vestjens 1973; Van Tetz, pers. comm., 1985). These latter situations, however,are usually in the open.
2. the distance between the rockshelters containing shell fragments and the creeks issufficient that water rats would not have carried shellfish into them. For the samereason, it is unlikely that water birds would have carried shellfish into some of therockshelters.
3. dingoes have not been noted to defecate in their dens and tend to use their faecesas territorial markers on paths and bushes in the open (Su Solomon, pers. comm., 25November, 1986).
What’s changing: population size or land-use patterns? The archaeology of Upper Mangrove Creek, Sydney Basin
terra australis 21
70
Figure 3.20 Fragment of a possible firestick (base) found
on raised section of sandstone floor in Button Shelter.
Photographer Carl Bento, Australian Museum.

Plant remainsUnmodified plant remains include leaves, twigs, bark, grass, seeds, seed pods, eucalypt fruits,casuarina cones, flowers, bracken fronds and small fragments of paperbark. Most plantremains have been classified as ‘leaf-litter’ which has blown into the rockshelters as theremains usually come from plant species which grow in or in close proximity to the particularlocation in which they were found: for example, Eucalyptus sp., Angophora sp., Acacia sp.,Persoonia sp., Macrozamia sp., Melaleuca sp., Syncarpia sp. Paperbark fragments are the only asyet recognised exception to this statement, but many of the seeds are still unidentified. Leaf-litter was present in the upper few centimetres of most archaeological deposits, although itvaried in quantity depending on the morphology of the rockshelter mouth (i.e., whether itallowed access to windblown materials) and the dryness of the deposit. Very few organicremains were found below a depth of 30cm.
None of the excavated plant remains can be definitely attributed to human activities,though in some excavated archaeological deposits there is material which could be humanlyderived. The identified seeds are from Acacia filicifolia (fernleaf wattle) and Persoonia sp.(geebung). Seeds of other species of acacia (but not A. filicifolia) have been recorded as beingeaten by Aboriginal people. It has not been possible to determine whether the seeds and seedpods in the catchment archaeological deposits were taken into the shelters by humans ratherthan being blown in by the wind. The fruit of Persoonia sp. is known to have been eaten byAboriginal people and these seeds may be food remains. It is also possible that Persoonia seedswere deposited in the shelter in the faeces of birds (magpies, currawongs, crows, parrots,bower birds) or, more likely, small rodents (bush rats, possums), which are known to eat suchfruits (D. Lunney, NSW NPWS, pers. comm., 1986).
Paperbark is known to have been used by Aboriginal people in the Sydney regionand elsewhere for a variety of purposes, for example, as ‘blankets’ for newborn babies,bedding and wrapping (Collins 1798 [1975]: 465, 612, n14; Phillip in Hunter 1793 [1968]: 544;Macarthur 1791 [1893]: 504; Zola and Gott 1992: 63). The paperbark fragments may thus havebeen brought into the shelter by humans. The fragments retrieved may be from Melaleuca sp.or, less likely, from Leptospermum attenuatum (J. Thompsom, NSW Herbarium, pers. comm., 1986).
Analysis of the unmodified plant remains has not been undertaken, and they are notdiscussed further in this monograph.
CharcoalThe status of charcoal when it is the only material recovered is not always clear. It can occur ina rockshelter as the residue from Aboriginal campfires, but it can also occur in somerockshelters where slopewashed sediments can gain entry. Charcoal could also enter duringfierce bushfires, depending on the dimensions and configuration of the mouth of the shelterand the location of the rockshelter on the land — small particles may be windblown orburning branches may fall into the shelter. Where artefacts are present in a shelter, the status ofthe charcoal is not important in determining whether the shelter is a site or whether thedeposit is called ‘archaeological deposit’ or sterile sediment (although its origin has to beconsidered when selecting samples for radiocarbon dating and when interpreting radiocarbondates). However, in shelters where no stone artefacts or humanly derived faunal remains areretrieved, the origin of the charcoal has to be more definitely determined before the site can besaid to contain an ‘archaeological deposit’.
In determining whether rockshelter deposits which contain large amounts ofcharcoal, but which do not contain stone artefacts or humanly derived faunal remains, shouldbe classified as ‘archaeological deposits’, the following were considered:
Upper Mangrove Creek catchment: fieldwork and analysis: aims and methods
terra australis 21
71

1. did the rockshelter have an entry point for slopewashed sediments, and/or was thesection of the deposit excavated likely to have been contaminated by slopewashedsediments? And,
2. did the morphology of the rockshelter mouth suggest that burning branches wouldbe able to fall into the rockshelter?
These criteria had to be considered at only one rockshelter — PH.166. At this rockshelter,I consider that point 2. could have applied and possibly point 1. Since no stone artefacts orother humanly derived materials were found in the deposit, and there are no other traits inPH.166, the rockshelter is not classified as having archaeological deposit or as being a site.
Temporal SequenceFour cultural phases were identified in the catchment (Table 3.6). These phases were identifiedand dated on the basis of typological and raw-material changes in the stone artefact assemblagesin four radiocarbon-dated sites which were excavated during the salvage program (Attenbrow1981, 1982a). These four sites have large stratified assemblages and habitation extending back atleast 3000 radiocarbon years: Loggers (ca 11,300 BP), Mussel (ca 8700 BP), Deep Creek (ca 6200BP) and Black Hands (ca 3000 BP). These four phases can be correlated with sequences found inother south-eastern Australian sites and with McCarthy’s (1962, 1964a, 1964b, 1976: 96–8) EasternRegional Sequence (Table 3.7), though minor variations occur in the implements found indifferent regions as well as in the timing of the transition from one phase to another. The resultsof other studies in south-eastern NSW (e.g., Megaw 1965, 1968a, 1974; Bowdler 1970, 1976;Lampert 1971a; Stockton and Holland 1974; Kohen et al. 1984) were also considered whendefining the phases and in assigning dates for the beginning and/or end of each phase.
In future discussions, I refer to the four phases as the typological phases or thephased sequence. The following attributes and diagnostic artefacts characterise theassemblages belonging to each of the phases as set out in Table 3.8: — presence, absence or relative abundance of Bondi points;— presence or absence of ground implements/fragments;— relative percentage frequency of bipolar artefacts;— predominance of either quartz or FGS material; and/or,— presence or absence of igneous material.
What’s changing: population size or land-use patterns? The archaeology of Upper Mangrove Creek, Sydney Basin
terra australis 21
72
TTaabbllee 33..66 Upper Mangrove Creek catchment: cultural phases and duration based on typological and raw-material changes
in stone artefact assemblages.
PHASE DATES DURATION
1 from ca 11,300 BP to ca 5000 BP ca 6300 years
2 between ca 5000 BP and ca 2800 BP ca 2200 years
3 between ca 2800 BP and ca 1600 BP ca 1200 years
4 between ca 1600 BP and 110 BP [1840 AD] ca 1500 years
TTaabbllee 33..77 Upper Mangrove Creek catchment: sequence of typological phases and dating, and correlation with terminology
of other researchers.
STOCKTON AND McCARTHY JONES, ALLEN AND
UMCC HOLLAND 1974: 53; LAMPERT LAMPERT 1964b: 202, 234–9 GOULD IN MULVANEY
PHASE ATTENBROW 1981 1971a: 68 1971b: 120 1976: 96–7 1975: 174, 212
1 Capertian Phase I Pre-Bondaian Capertian Core Tool and Scraper Tradition
2 Early Bondaian Phase II Bondaian Bondaian ]
3 Middle Bondaian Phase II Bondaian Bondaian ] Small Tool Tradition
4 Late Bondaian Phase III Post-Bondaian Eloueran ]

Phase 1Catchment assemblages of this phase consist principally of flakes, cores and flaked pieces.Implements include amorphous flakes with retouch/use wear (‘scrapers’) and dentated saws.A small number of backed artefacts was retrieved from pre-5000 BP contexts in two sites —Loggers Shelter and Mussel Shelter (Fig. 3.21). These artefacts are unlikely to be intrusive fromhigher levels and are taken as an indication that the manufacture of backed artefacts in Australiabegan much earlier than 4000 BP, albeit not very frequently (Attenbrow 1982a: 30; Hiscock andAttenbrow 1998, 2004; McNiven 2000; Hiscock 2001). No ground-edged implements occur.Bipolar artefacts are relatively uncommon. The average size of flaked artefacts in this phase islarger than those of later phases (Attenbrow 1981: Fig. 6.13), though the majority are still lessthan 3cm maximum dimension.
Upper Mangrove Creek catchment: fieldwork and analysis: aims and methods
terra australis 21
73
TTaabbllee 33..88 Upper Mangrove Creek catchment: diagnostic criteria used as basis for dating typological phases.
Number of •• indicates relative frequency within assemblages; Y, N indicates yes, no.
PHASE DIAGNOSTIC CRITERIA DURATION (YEARS BP)
Bondi Other Ground/ Bipolar Quartz FGS
points backed igneous artefacts predom. predom.
1 • – • N Y ca 11,200–ca 5000
2 •• • • • N Y ca 5000–ca 2800
3 ••• •• •• •• Y N ca 2800–ca 1600
4 – • ••• ••• Y N ca 1600–ca 110
Figure 3.21 Early Holocene backed artefacts from Mussel (a: square B, spit 20; b: square A, spit 23) and Loggers Shelters
(c: square F, spit 7; d: square F, spit 9). Scale has 1mm divisions. Photographer Carl Bento, Australian Museum.

The presence of ‘saws’ suggests affinities with other pre-Bondaian assemblages atBurrill Lake, Blue Mountains sites and Capertee (cf. Lampert 1971a: 65). The catchmentassemblages differ from those described as the ‘Core Tool and Scraper Tradition’ (Bowler et al.1970) in that no horsehoof cores have been identified and uniface pebble tools are rare orabsent in most sites. In this respect, they are similar to the Blue Mountain’s Capertianassemblages (McCarthy 1964: 222–5, 1976: 96; Stockton and Holland 1974: 54–5).
Quartz and FGS dominate the assemblages though quartz is less abundant than FGS.Chert, quartzite and silcrete are present in low proportions, and igneous artefacts are a veryinfrequent occurrence.
Phase 2For Phase 2 (Early Bondaian), a date of ca 5000 BP has been adopted rather than the date of theearliest backed artefact in Loggers (ca 8500 BP). Backed artefacts occur more frequently after 5000BP, and it is assumed that by this time they were being manufactured in sufficient numbers to bemore frequently visible in archaeological contexts, though they become even more common after3000 BP. Phase 2 is thus not defined as the period when backed artefacts first appear, but whenthey are more likely to be archaeologically visible. On this basis, I have assumed that the presenceof backed artefacts in the small catchment assemblages is statistically more likely to indicate anage of post-5000 BP, and thus a Phase 2 or 3 (Early or Middle Bondaian) assemblage. Ground-edged implements first appear in this phase, ca 4000 years ago.
FGS stone dominates the assemblages. Quartz is the second-most abundant material.Silcrete, chert (including tuff-type materials) and quartzite are present in increasing numbers,though percentages are still small. Igneous materials increase in abundance compared withPhase 1.
Phase 3In Phase 3, backed artefacts proliferate and ground-edged implements continue to be present,but quartz is the dominant stone material (by number). At Loggers, Mussel and Deep Creek,there was a gradual change in the relative abundance of FGS and quartz over time (forLoggers, see Appendix 1, Table A1/34). At all three sites, the level in which quartzpredominates over FGS (while still continuing to increase in abundance, i.e., in number) isdated to 2700–2800 BP. In sites where initial habitation began earlier than 3000 BP, a changefrom the predominance of FGS artefacts to the predominance of quartz artefacts is used toindicate the beginning of Phase 3, and the temporal boundary between Phases 2 and 3 isplaced at ca 2800 BP.
Phase 4Backed artefacts are rare. Bondi points are absent from all assemblages dating to this phase,though some geometric microliths and elouera occur in Loggers and Black Hands, which havelarge assemblages. Bipolar artefacts increase further as do ground-edged implements andfragments from them. Quartz is the dominant raw material (by number) in large assemblages.Compared with Phase 3, igneous waste increases in abundance, and silcrete, chert and FGSdecrease in abundance.
The date of ca 1600 BP for the transition from Phase 3 to Phase 4 given above differsfrom that used in the salvage report (i.e., 1000–1200 BP, Attenbrow 1981: 127). For the salvageprogram, the phases were identified and dated initially on the basis of the typologicalsequence and radiocarbon dates at only one site, Loggers. Further excavations and artefactanalyses (particularly from Mussel and Deep Creek) since the salvage report was written, aswell as further consideration of the data from sites along the coast and hinterland of south-eastern NSW (e.g., Lampert 1971a; Hughes and Djohadze 1980), led to revision of the original
What’s changing: population size or land-use patterns? The archaeology of Upper Mangrove Creek, Sydney Basin
terra australis 21
74

decision. The absence of Bondi points and/or rarity of other backed artefacts, or a radiocarbonage of ca 1600 BP, are taken as the beginning of Phase 4 in the catchment.
The date of 110 BP (1840 AD) adopted for the end of Phase 4 is the date thatThrelkeld’s mission at Lake Macquarie was abandoned as he believed there were noAboriginal people left in the district to evangelise (Gunson 1974, Vol. 1: 168–9; Ferry 1979: 27,34). However, Aboriginal people continued living in the Hawkesbury region beyond this date(V. Ross 1981: 204). The pigment sailing ships in two rockshelters and a glass bipolar core inanother shelter attest to continuing use of the catchment after British colonisation. In the late1880s, R. H. Mathews (1897: 1) identified some of his informants, who lived on a reserve nearWindsor, as being Darginung. Even so, they were unlikely to have been following the pre-colonial subsistence, habitation or land-use patterns to the extent that they were stillinhabiting the rockshelters and manufacturing stone implements in the Upper MangroveCreek catchment after the mid-1800s.
Dating the archaeological deposits and periods of habitationRadiocarbon determinations were received for 15 of the archaeological deposits (see Chapter6). Where radiocarbon dates were not available, I identified the typological phase or phasesrepresented in a site by using the assemblage attributes listed above as diagnostic ‘time-markers’ (cf. fossile directeur of Johnson 1979: 114; temporal types of Thomas 1979: 222–5).The radiocarbon determinations and diagnostic time-markers provide the basis for estimatingthe period in which the deposit began to accumulate and the length of time over which thedeposit accumulated (in later chapters these periods are referred to as the ‘date or period atwhich habitation was established’, and the ‘length of time over which a habitation was used’).McDonald (1994: 75) stated that using the absence of backed artefacts to assign a recentphase/millennium to particular habitations is a problem, given the small sample size in somesites and the low probability of their retrieval. This is a valid comment, but, as outlined below,other evidence and criteria were taken into account in assigning an age to habitations anddeposits which were not dated by radiocarbon means.
The depth to which archaeological deposit had accumulated was also consideredwhen assessing ‘the length of time over which a habitation was used’ (see Chapter 6). This wascalculated for sites individually by extrapolating from the deposition rates in radiocarbon-dated deposits in rockshelters with similar morphology and location and similar access tosources of sediment; for example, whether cavernously weathered with no opportunity forslopewashed sediments to enter, or open at one side allowing entry of sediments from theadjacent slope.
Support for this method of assigning a ‘recent’ (late-Holocene) age to these depositsis given by the additional radiocarbon determinations obtained for four habitations since 1987— Boat Cave, One Tooth, Ti-tree and Venus Shelters. For three of these four sites, theradiocarbon ages were all less than 1000 years BP and for Boat Cave it was earlier, that is, ca2370 BP (third millennium BP). Ages of these habitations were originally estimated as <1000BP (Boat Cave, Ti-tree and Venus) and ca 2000–1000 BP (One Tooth) (Attenbrow 1987: Table7.2). Possible reasons for the greater difference between the estimated and radiocarbon agesfor Boat Cave are discussed in Chapter 5.
Radiocarbon dates: conventional versus calibratedConventional radiocarbon dates have been used in this study for two principal reasons.Firstly, after calibrating the radiocarbon ages and recalculating each of the indices (the numberof habitations used, rate of site establishment, artefact accumulation rate for individual sites,and local artefact accumulate rate) for the Upper Mangrove Creek catchment sites and several
Upper Mangrove Creek catchment: fieldwork and analysis: aims and methods
terra australis 21
75

of the regions investigated in Chapter 7, it was seen that calibrating the dates would not alterthe conclusions. Secondly, calibrating all radiocarbon ages for all sites included in theexamination of other regions was too time-costly for what appeared would be very little if anygain. (This can be seen partially by comparing the conventional and calibrated radiocarbondates in Table 6.1.)
Calibrations were calculated using Calib Rev 4.3(2000) (Stuiver and Reimer 1993b;Stuiver et al. 1998). Stuiver and Reimer (1993a: 1.3.8) recommended that conventionalradiocarbon ages for Southern Hemisphere samples be reduced by 40 years. However,dendrochronological studies by Barbetti et al. (1992) on Tasmanian samples indicate thisreduction may not be necessary. Conventional dates for the catchment sites were thereforecalibrated twice, the first after reduction by 40 years and the second without reduction. Thisexercise showed no major differences in the temporal trends produced by each method for thethree indices, and calibrations presented in Table 6.1 do not have the 40-year reduction.
The effect of calibration is to stretch out the time scale for periods before 2000 BP, andto shorten the periods after 2000 BP. The main differences to the results of the UpperMangrove Creek data after calibration are: 1. Rates of artefact accumulation. For periods before 2000 BP, the artefact accumulation
rates are lower, and after 2000 BP they are higher. However, these variations do notsubstantially alter the trends. For sites with small numbers of artefacts there is anegligible effect, even when extrapolated to the estimated total numbers of artefactsin them. For sites with larger numbers of artefacts, the changes are more substantial,but the effect on the overall trends is not significant for my arguments. The decreasein the local artefact accumulation rate in the past 1000 years is just as substantial (i.e.,the decrease is in the same order of magnitude) as it was before calibration. Inaddition, the significant or dramatic increases occur in the same millennium as theydid before calibration.
2. Habitation indices. The calibrated intercepts for the catchment radiocarbon dates lessthan 5000 BP fall within the same millennium BP as did the intercepts for theconventional dates. For dates above 5000 BP, the intercept falls within the previousmillennium except for Loggers. The intercept for the oldest date for Loggers (12,963CAL BP), while within the previous millennium to that of the conventional date (i.e.,13th rather than 12th millennium BP), is in fact almost 2000 years older than theradiocarbon date (11,050±135 BP [SUA-931]) (Table 6.1). Within the Upper MangroveCreek catchment, calibration of the radiocarbon dates had no significant impact onthe trends in the habitation establishment rates or the number of habitations used forthe purposes for which they are used in this study. Although the chronology isextended, the dramatic changes still occur at the same time. The results of this exercise suggest that calibration of other radiocarbon dates used in
this study and reanalysis of the data were unlikely to affect the conclusions reached at thescale of the analyses employed.
What’s changing: population size or land-use patterns? The archaeology of Upper Mangrove Creek, Sydney Basin
terra australis 21
76

terra australis 21
77
During the fieldwork, several different types of archaeological evidence relating to Aboriginaloccupation of the catchment were located and recorded in the random sampling units:archaeological deposits, images, grinding areas, a burial and isolated finds. Only thosearchaeological traits that are used to estimate the temporal trends in the quantitative changesin the catchment’s archaeological record are described below; that is, the archaeologicaldeposits and isolated finds. Data presented in this chapter provide the bases for calculations infuture chapters, for example, for producing depth/age curves and estimated total numbers ofartefacts in archaeological deposits. In addition, data are presented about the recordedpotential habitation shelters and potential archaeological deposits. To provide a context forthese locations, a summary of the fieldwork results is first outlined below (Attenbrow 1987,Chapters 5 and 6, has a full account of fieldwork results relevant to other traits).
Summary of fieldwork results
The fieldwork results as at the end of the excavations — that is, once all fieldwork wascomplete — are presented below. It is more practical to present the final results in this wayrather than discussing the survey, recording and excavation results separately since the statusof several locations and sites changed during the course of the excavation and recording work: • eight potential archaeological deposits in rockshelters with images became archaeological
deposits once excavation showed they contained archaeological materials; • three potential archaeological deposits in PH shelters became archaeological deposits
once excavation showed they contained archaeological materials;• one PH shelter was reclassified as a rockshelter with archaeological deposit when stone
artefacts were found on the surface of the deposit (the archaeological deposit was notexcavated due to lack of time);
• one PH shelter was reclassified as a rockshelter with images when drawings were foundduring an impromptu visit subsequent to the site survey.
Upper Mangrove Creek catchment: randomsampling units. Fieldwork results andevidence from the archaeological deposits
4

In future discussions, the term fieldwork thus refers collectively to survey, recordingand excavation unless otherwise stated.
By the end of the fieldwork, 80 archaeological traits at 59 archaeological sites, 10isolated finds and 167 potential habitation shelters had been recorded in the random samplingunits (Fig. 4.1, Tables 4.1 and 4.2; see also Attenbrow 1987: Tables 5.2: 4RSU and 5.3, andAppendix 3, Table A3/3). The archaeological traits were 35 archaeological deposits, 22 images,22 grinding areas, and one burial. Thirty-two traits were in rockshelters, five in open depositsand 22 on open rock (sandstone exposures or rock platforms) (Table 4.2A). The ten isolatedfinds were all stone artefacts on open deposits (Attenbrow 1987: Appendix 3, Table A3/2). Theaverage density of sites and traits in the random sampling units, and therefore the inferreddensity of sites and traits in the total catchment, is ca 6/sq km and ca 8/sq km respectively(Tables 4.2A and 4.2B). In following discussions the numbers and densities quoted as being ‘ineach topographic zone’ relate to the sites, traits and artefacts recorded in the random samplingunits; extrapolations have not been made to the total catchment.
Sites/archaeological traits were recorded in all topographic zones. However, the numberand density of sites in each topographic zone varies, as does the number and density of each typeof trait and the contents of each of the traits (Fig. 4.2; Attenbrow 1987: Chapter 6). Two of the threemain traits — archaeological deposits and images — are found in all topographic zones. Grindingareas have a more restricted distribution in the random sampling units being recorded in only theperiphery ridgetops, subsidiary valley bottoms and subsidiary ridgesides. However, they havebeen found in other zones in the catchment outside the random sampling units — albeit in smallnumbers (two on peninsula ridgetops and two in the main valley bottom).
The number of sites in each zone varies between two and 24, and the site densitybetween 2/sq km and 12/sq km (Table 4.2A). The total number of traits in each zone variesfrom three to 26, while their density varies from 3/sq km to 15/sq km (Table 4.2B and Fig. 4.2).The highest frequencies of sites and traits are found on periphery ridgetops, thoughsubsidiary ridgesides also have a high frequency of traits. The high frequencies of sites andtraits in these two zones are a function of the larger area of land within these categories. Thehighest density of sites and traits is in the main valley bottoms. The lowest frequency anddensity of sites and traits were recorded on the peninsula ridgetops and the main ridgesides.
Archaeological deposits
The 35 archaeological deposits occur in all topographic zones in the catchment (Fig. 4.2). Theywere recorded more frequently on subsidiary ridgesides; 31% (11 of the 35) archaeologicaldeposits occur in this zone. The peninsula ridgetops and the main ridgesides, with twoarchaeological deposits each (6%), have the lowest number of archaeological deposits. Theremaining three topographic zones had similar numbers — six, seven and seven archaeologicaldeposits (17%, 20% and 20%).
The density values show a different perspective. The highest density of archaeologicaldeposits occurs in the main valley bottoms — at 10/sq km, it is more than twice that of anyother zone (Fig. 4.2 and Table 4.2B). Peninsula ridgetops, the periphery ridgetops and mainridgesides can be grouped together as having the lowest density values (2–3/sq km). Theother two topographic zones (subsidiary valley bottoms and subsidiary ridgesides) both have4/sq km. The average density for archaeological deposits is 3.5/sq km.
What’s changing: population size or land-use patterns? The archaeology of Upper Mangrove Creek, Sydney Basin
terra australis 21
78

Upper Mangrove Creek catchment: random sampling units. Fieldwork results and evidence from the archaeological deposits
terra australis 21
79
archaeological deposit in rockshelter
archaeological deposit in open location
images in rockshelter
images on rock platform
grinding area
See Table 4.1 for full site names
catchment boundary
Deep
Ck
Man
grov
e Ck
Boomerang Ck
Mangrov
e Ck
Bu
cket
ty G
ully
WF
ASMM
BC
LF EFET2
SuSTM
FSDiS
DeS
TMS
TTAH
CW
BoS
ES VS
KE
GSBHS
LSBuS
WoG
1 km
N
OT
BT
HG
McP
ShGPG SIG
TG
IG
KRE2 KRE1KRO
VGOOGuG
SG
RGFE
SpGSF
DG
UTG
LG
UTSSiG
DeO
FOD
MC
BB
BHOGG
ET1
WTG
PX
Wat
tle C
k
Figure 4.1 Upper Mangrove Creek catchment: archaeological sites recorded in the random sampling units.

What’s changing: population size or land-use patterns? The archaeology of Upper Mangrove Creek, Sydney Basin
terra australis 21
80
TTaabbllee 44..11 Upper Mangrove Creek catchment: archaeological sites in random sampling units. Tables 3.1 and 3.2 have full
names of abbreviated locations, archaeological traits and topographic zones; ENG indicates engraving; SA indicates storage
area.
SITE NAME ABBREVIATED ARCHAEOLOGICAL RANDOM SAMPLING TOPO-
SITE NAME LOCATION TRAIT UNIT ZONE
Anadara AS SH AD RSU.138 VB-SC
Axehead AH SH AD RSU.101 VB-SC
Bird Tracks BT SH AD/IM RSU.177 RS-SC
Black Hands Open Deposit BHO OD AD RSU.80/SA VB-MC
Black Hands Shelter BHS SH AD/IM RSU.80/SA VB-MC
Boat Cave BC SH AD/IM RSU.263 RS-SC
Boring Boring BB OR GA RSU.188 RS-SC
Boronia BoS SH AD RSU.10 RT-PEN
Button BuS SH AD RSU.75/SA VB-MC
Caramel Wave CW SH AD RSU.101 VB-SC
Delight Open Deposit DeO OD AD RSU.56 RT-PERI
Delight Shelter DeS SH AD/GA RSU.56 RT-PERI
Dingo DiS SH AD/IM/BR RSU.209 RS-SC
Double Grooves DG OR GA RSU.56 RT-PERI
Elngarrah ES SH AD/IM? RSU.10 RT-PEN
Elongated Figure EF SH AD/IM RSU.263 RS-SC
Emu Tracks 1 ET1 SH ND/IM+ENG RSU.80/SA VB-MC
Emu Tracks 2 ET2 SH AD/IM = ENG RSU.63 RT-PERI
Firestick FS SH AD/IM RSU.209 RS-SC
First of Day FOD OR GA RSU.101 VB-SC
Frogs Eggs FE OR GA RSU.56 RT-PERI
Geebung Grooves GG OR GA RSU.114/SA VB-SC
Geebung Shelter GS SH AD RSU.114/SA VB-SC
Gurgling Gully GuG OR GA RSU.63 RT-PERI
Harris Gully HG PH/SH AD RSU.112 VB-SC
Isolated Groove IG OR GA RSU.63 RT-PERI
Kangaroo and Echidna KE SH AD/IM RSU.188 RS-SC
Kyola Road Open Deposit KRO OD AD RSU.63 RT-PERI
Kyola Road Engravings 1 KRE1 OR IM = ENG RSU.63 RT-PERI
Kyola Road Engravings 2 KRE2 OR IM = ENG RSU.63 RT-PERI
Loggers LS SH AD/IM RSU.75/SA VB-MC
Lonesome LG OR GA RSU.57 RT-PERI
Low Frontage LF SH AD/IM RSU.263 RS-SC
Mangrove Mansions MM SH AD/IM RSU.138 VB-SC
Manning Creek MC PH/SH PAD/IM RSU.177 RS-SC
McPherson McP SH AD/IM RSU.235 RS-SC
One Tooth OT SH AD/IM RSU.163 RS-MC
Optimus Octavus OO OR GA RSU.63 RT-PERI
Palmers Crossing North PX OD AD RSU.75/SA VB-MC
Petra PG OR GA RSU.63 RT-PERI
Rusty RG OR GA RSU.56 RT-PERI
Sharp Gully ShG OR GA RSU.127 VB-SC
Single Groove SiG OR GA RSU.56 RT-PERI
Slime Gully SlG OR GA RSU.63 RT-PERI
Slip Gully SpG OR GA RSU.57 RT-PERI
Solitary SG OR GA RSU.209 RS-SC
Star Fern SF OR GA RSU.56 RT-PERI
Sunny SuS PH/SH AD RSU.63 RT-PERI
Ti-tree TT SH AD/IM RSU.101 VB-SC
Token Male TM PH/SH AD RSU.63 RT-PERI
Two Grooves TG OR GA RSU.63 RT-PERI

TTaabbllee 44..22 Upper Mangrove Creek catchment: (A) site locations, (B) archaeological deposits and (C) potential habitationshelters in random sampling units. Number, percentage frequency and density in each topographic zone (density isnumber/sq km). See also Figure 4.1. Tables 3.1 and 3.2 have full names of abbreviated topographic zones; Sh indicatesnumber with shallow deposit <10cm; F indicates number with flood-affected deposit.
A. SITE LOCATIONSTopozone Area Shelters Open deposit Open rock Trees All locations
(sq km) No. % Dens. No. % Dens. No. % Dens. No. % Dens. No. % Dens.
RT-PERI 3.2 5 15.6 1.6 2 40 0.6 17 77.3 5.3 24 40.7 7.5
RT-PEN 1.1 2 6.3 1.8 2 3.4 1.8
VB-MC 0.6 4 12.5 6.7 3 60 5 7 11.9 11.7
VB-SC 1.7 7 21.9 4.1 3 13.6 1.8 10 16.9 5.9
RS-MC 0.8 2 6.3 2.5 2 3.4 2.5
RS-SC 2.7 12 37.5 4.4 2 9.1 0.7 14 23.7 5.2
Total 10.1 32 100 3.2 5 100 0.5 22 100 2.2 0 0 0 59 100 5.8
B. ARCHAEOLOGICAL TRAITSTopozone Arch. deposits Images Grinding areas Burials Scarred trees All traits
No. % Dens. No. % Dens. No. % Dens. No. % Dens. No. % Dens. No. % Dens.
RT-PERI 7 20.0 2.2 3 13.6 0.9 16 72.7 5.0 26 32.5 8.1
RT-PEN 2 5.7 1.8 1? 4.5 0.9 3 3.7 2.7
VB-MC 6 17.1 10.0 3 13.6 5.0 9 11.3 15.0
VB-SC 7 20.0 4.1 2 9.1 1.2 3 13.6 1.8 12 15.0 7.1
RS-MC 2 5.7 2.5 2 9.1 2.5 4 5.0 5.0
RS-SC 11 31.4 4.1 11 50.0 4.1 3 13.6 1.1 1 100 0.4 26 32.5 9.6
Total 35 100 3.5 22 100 2.2 22 100 2.2 1 100 0.1 0 0 0 80 100 7.9
C. POTENTIAL HABITATION SHELTERSTopozone Sh/PAD Sh/ND or SD All PH shelters
No. Dens. No. Dens. No. Dens.
RT-PERI 8 (1Sh) 2.5 8 (1Sh) 2.5RT-PEN 7 (4Sh) 6.4 2 1.8 9 (4Sh) 8.2VB-MC 1 (1F) 1.7 1 (1F) 1.7VB-SC 21 (4Sh) 12.4 1 0.6 22 (4Sh) 13.0RS-MC 35 (6Sh) 43.8 2 2.5 37 (6Sh) 46.3RS-SC 87 (17Sh) 32.2 3 1.1 90 (17Sh) 33.3
Total 159 (32Sh) 15.8 8 0.8 167 (32Sh) 16.5(1F) (1F)
Upper Mangrove Creek catchment: random sampling units. Fieldwork results and evidence from the archaeological deposits
terra australis 21
81
TTaabbllee 44..11 (Continued)
SITE NAME ABBREVIATED ARCHAEOLOGICAL RANDOM SAMPLING TOPO-
SITE NAME LOCATION TRAIT UNIT ZONE
Two Moths TMS PH SH/AD RSU.209 RS-SC
Uprooted Tree Grooves UTG OR GA RSU.56 RT-PERI
Uprooted Tree Shelter UTS SH AD RSU.56 RT-PERI
Variety VG OR GA RSU.63 RT-PERI
Venus VS SH AD/IM RSU.188 RS-SC
White Figure WF SH AD/IM/GA RSU.274 RS-SC
Willow Tree Gully WTG OD AD RSU.80/SA VB-MC
Wolloby Gully WoG SH AD/IM RSU.156 RS-MC

What’s changing: population size or land-use patterns? The archaeology of Upper Mangrove Creek, Sydney Basin
terra australis 21
82
100
75
50
25
%
100
75
50
25
%
100
75
50
25
%
RT RT VB VB RS RSPERI PEN MC SC MC SC
RT RT VB VB RS RSPERI PEN MC SC MC SC
RT RT VB VB RS RSPERI PEN MC SC MC SC
RT RT VB VB RS RSPERI PEN MC SC MC SC
RT RT VB VB RS RSPERI PEN MC SC MC SC
RT RT VB VB RS RSPERI PEN MC SC MC SC
10
7.5
5
2.5
NO. /
SQ.
KM
10
7.5
5
2.5
NO. /
SQ.
KM
10
7.5
5
2.5
NO. /
SQ.
KM
% FREQUENCY DENSITY (No. / sq. km)
ARCHAEOLOGICAL DEPOSITS (N=35)
IMAGES (N=22)
GRINDING AREAS (N=22)
N=7 N=7 N=7
N=7
N=2 N=2
N=2N=2
N=11N=11
N=6
N=6
N=16
N=16
N=3
N=3
N=3
N=3
N=3
N=3
N=3 N=3N=2 N=2 N=2
N=2
N=11
N=11
N=1?N=1?
Figure 4.2 Upper Mangrove Creek catchment: random sampling units. Percentage frequency and density of archaeological
traits in each topographic zone.

Upper Mangrove Creek catchment: random sampling units. Fieldwork results and evidence from the archaeological deposits
terra australis 21
83
Variations in the frequency of archaeological deposits in different topographic zonesare not significant, but variations in the numbers of stone artefacts within the archaeologicaldeposits in each topographic zone are much greater (see below under Stone artefacts).
Other information about the archaeological deposits, which was gained from thefieldwork data and is presented below, includes: 1. the number and type of locations in which archaeological deposits occur in the
catchment; 2. the area and depth of the archaeological deposit at each location;3. the contents of each archaeological deposit — that is, the number and type of stone
artefacts, as well as the number of bone fragments and animal species identified inthe faunal remains.Thirty of the archaeological deposits were in rockshelters and five in the open. The
size and aspect of the rockshelters varied as did the area and depth of the archaeologicaldeposit at each of the excavated locations and the contents (that is, the size of the stone artefactand faunal assemblages). The archaeological deposits were classified into size categoriesaccording to the estimated total number of stone artefacts in each in order to assess thedistribution of this class of evidence across the catchment (see Stone artefacts below).
The rocksheltersThe rockshelters in which archaeological deposit was recorded range in size from 3m long by2.8m deep to 46m long by 9.8m deep (Table 4.3). These measurements represent the maximumlengths and widths of the rockshelters taken from scaled floor plans. Maximum dimensionsalso include concavities or ledges in the walls which are above floor height.
The habitable area is the area in which it is assumed that use of the shelter wouldhave occurred. It is the area in which a person can sit up (i.e., a ceiling height greater than80cm) and which has a relatively flat, dry floor. The habitable floor area is usually much lessthan the area included within the maximum rockshelter length and width, as it excludes areasof low ceiling, shallow overhang, permanently damp deposit or steeply sloping deposit. Thehabitable area within the rockshelter was noted on floor plans in the field, and then calculatedon a digitiser from scaled plans.
Sixty-one per cent of the rockshelters with archaeological deposit face west (11) andnorth-west (8). Others face north (5, 16%), north-east (2, 6.5%), south (3, 10%) and south-west(2, 6.5%) (Table 4.3).
Nineteen rockshelters contain other archaeological traits: 18 images, one burial andtwo grinding areas. At the remaining 11 rockshelters and five open deposits, no otherarchaeological trait was recorded (Table 4.1).
The open depositsOpen archaeological deposits occur on alluvial flats and valley-fill forming creek banks in themain valley bottoms (3) and on ridgetops (2) (Table 4.2A). Outside the random sampling units,they were also found on structural benches on ridgesides, but still within the main valleybottom zones. The locations on which the open archaeological deposits were recorded eachhad different aspects: north, north-west, north-north-east, west, and south-west.
Area of archaeological depositsThe largest area of deposit in a rockshelter is 273m2, though not all of the deposit in this particularrockshelter (Kangaroo and Echidna) is expected to contain abundant archaeological material. Thesmallest area is 1m2 (Firestick) (Table 4.4). The area of deposit at the majority of rockshelters is

between 13.5m2 and 65.7m2. The area of deposit in each rockshelter (which often differed from thehabitable area) was digitised from scaled floor plans.
The deposit at some rockshelters extends beyond the overhang. In these instances,the area of archaeological deposit (or potential archaeological deposit) may be greater than thearea of the rockshelter itself. In others, part of the rockshelter floor is rock or very shallowdeposit, and thus the area of deposit is smaller than the rockshelter floor.
It was not feasible to estimate the potential areas for the open archaeological depositsbecause of the ‘unbounded’ nature of the alluvial flats and ridgetops. Time was also notavailable to undertake a testing program to determine the limits of the archaeological depositin open sites. The area over which exposed artefacts were recorded is thus provided; thegreatest extent of exposed artefacts was at Black Hands Open Deposit — 1200m2 (Table 4.5).However, in all open locations, it is probable that buried artefacts extend over a much greaterarea than the dimensions provided in Table 4.5.
Open archaeological deposits with larger dimensions have been recorded outside the random sampling units (but still within the catchment). At Stockyards Open Deposit,
What’s changing: population size or land-use patterns? The archaeology of Upper Mangrove Creek, Sydney Basin
terra australis 21
84
TTaabbllee 44..33 Upper Mangrove Creek catchment: dimensions and aspects of rockshelters with archaeological deposit.
[1] Dimensions are from scaled plans, except for rockshelters noted [2]. [2] ‘e’ indicates maximum height is at the extent
of overhang; ‘i’ indicates maximum height is inside rockshelter. [3] Dimensions are field estimates; n/c indicates not
calculated. [4] Wolloby Gully has two areas under one overhang, each area facing a slightly different direction.
SITE NAME AREA OF ROCKSHELTER [1] HEIGHT [2] ASPECT
Length Width Total area Habitable Maximum (degrees)
(m) (m) (m2) (m2) (m)
Anadara 33.0 7.0 231.0 58.3 10.6 e 307 NW
Axe Head 10.3 3.3 34.0 11.8 3.3 e 240 SW
Bird Tracks 13.0 4.5 58.5 20.8 2.7 i 270 W
Black Hands 6.3 3.5 22.0 8.5 2.3 i 270 W
Boat Cave 9.0 4.7 42.3 19.7 3.0 e 258 W
Boronia [3] 15.0 2.7 40.5 n/c 1.6 e n/r W
Button 7.8 4.4 34.3 26.0 2.6 e 295 NW
Caramel Wave 7.0 3.3 23.1 14.3 3.2 e 40 NE
Delight 8.5 2.8 23.4 7.8 2.8 e 266 W
Dingo 6.8 4.8 32.6 7.4 1.6 e 330 NW
Elngarrah [3] 8.5 2.5 21.3 n/c 1.2 e 300 NW
Elongated Figure 9.3 33.8 34.9 9.9 2.4 e 346 N
Emu Tracks 2 8.3 2.2 18.3 12.0 2.0 e 170 S
Firestick 3.0 2.8 8.3 n/c 2.5 i 30 NE
Geebung 12.0 4.0 48.0 28.5 2.6 e 360 N
Harris Gully 7.8 5.0 39.0 11.5 2.2 i 331 NW
Kangaroo and Echidna 46.0 9.8 450.8 49.9 13.5 e 265 W
Loggers 10.0 3.5 35.0 13.5 5.8 e 315 NW
Low Frontage 10.3 3.8 38.6 15.6 1.5 i 5 N
McPherson 10.0 3.8 38.0 23.6 1.3 e 282 W
Mangrove Mansions 23.0 6.5 149.5 91.9 2.4 e 200 S
One Tooth 6.5 6.2 40.3 24.8 2.5 e 5 N
Sunny 12.8 3.0 38.3 21.7 2.2 e 275 W
Ti-tree 11.5 1.7 20.0 10.3 1.7 e 240 SW
Token Male [3] 9.0 3.0 27.0 n/c 1.8 e n/r W
Two Moths 10.0 7.9 79.0 24.1 1.7 i 343 N
Uprooted Tree 14.0 2.2 30.8 9.9 2.2 e 172 S
Venus 12.0 4.6 55.2 10.4 2.6 i 280 W.
White Figure 25.0 7.0 175.0 85.3 9.3 e 330 NW
Wolloby Gully [4] 16.3 10.8 [176.0 119.0 10.8 e 290 W
Wolloby Gully [4] 29.0 4.7 [136.3 9.2 e 320 NW

T Ta ab bl l
e e 4 4. .
4 4Up
per M
angr
ove
Cree
k ca
tchm
ent:
rand
om s
ampl
ing
units
. Arc
haeo
logi
cal d
epos
its in
rock
shel
ters
: are
a (m
2 ), st
atus
and
dep
th o
f arc
haeo
logi
cal d
epos
its.
SITE
NAM
EST
ATUS
OF
DEPO
SIT
DEPT
H OF
ARC
H.CO
MM
ENTS
Area
of
Insid
e as
Shal
low
Erod
edOu
tsid
eDE
POSI
T (M
AX.)
depo
sit (m
2 )ex
cav.
(m2 )
(m2 )
(m2 )
shel
ter (
m2 )
Squa
recm
Anad
ara
46.3
46.3
T17
-T2
24
Axeh
ead
5.5
<10
Unex
cava
ted
Bird
track
s24
.124
.1[6
.9]
15Gu
llied
(er
oded
) ar
ea n
ot in
clud
ed a
s pa
rt of
dep
osit
for c
alcu
latio
ns
Blac
k Ha
nds
24.3
11.5
4.3
AB11
0
8.5
F10
1
Boat
Cav
e22
.73.
319
.438
/ <5
Dept
h as
exc
avat
ed/d
epth
of s
hallo
w d
epos
it
Boro
nia
24.5
24.5
19
Butto
n3.
0-
<10
Unex
cava
ted
Cara
mel
Wav
e17
.017
.0T1
22
T211
Delig
ht3.
7Ni
l3.
732
Ding
o15
.913
.72.
239
Elng
arra
h34
.034
.033
Elon
gate
d Fi
gure
19.8
12.3
7.5
38
Emu
Trac
ks 2
21.1
12.8
8.3
80
Fire
stic
k1.
0-
<3Un
exca
vate
d
Geeb
ung
25.0
25.0
5
Harri
s Gu
lly>1
3.5
13.5
?42
Depo
sit o
utsid
e sh
elte
r is
an e
xten
sive
area
of f
lat l
and,
the
area
of w
hich
is in
defin
able
Kang
aroo
and
Ech
idna
273.
149
.9/2
23.2
43/4
3De
posit
as
exca
vate
d [d
ry d
epos
it/da
mp
depo
sit]
Logg
ers
53.3
13.5
A70
39.8
EF20
6
Low
Fro
ntag
e23
.323
.318
Man
grov
e M
ansio
ns65
.751
.014
.713
/<10
Exca
vate
d de
posit
/sha
llow
dep
osit
McP
hers
on32
.2-
15.0
17.2
<5/
15Ex
cava
ted
pit w
as o
n fla
t are
a im
med
iate
ly o
utsid
e dr
iplin
e
One
Toot
h28
.48.
29.
111
.124
Sunn
y34
.919
.7[2
.5]
15.2
71Gu
llied
(er
oded
) ar
ea n
ot in
clud
ed a
s pa
rt of
dep
osit
for c
alcu
latio
ns
Ti-tr
ee22
.411
.0T1
Nil
11.4
T238
Toke
n M
ale
20.0
-?
Dept
h un
know
n —
une
xcav
ated
and
no
surfa
ce in
dica
tions
Two
Mot
hs34
.932
.42.
5T/
55
T/5
is th
e sp
it in
whi
ch th
e fre
shw
ater
mus
sel w
as fo
und
Upro
oted
Tre
e17
.910
.87.
181
Venu
s16
.616
.618
Whi
te F
igur
e16
.016
.055
Depo
sit c
onsis
ts o
f thr
ee s
epar
ate
area
s of
sed
imen
t in
shel
ter
Wol
loby
Gul
ly15
0.3
52.7
97.6
5Ar
tefa
ct d
ensit
y fo
r sha
llow
are
a as
sum
ed to
be
10%
of e
xcav
ated
are
a
terra australis 21
85
Upper Mangrove Creek catchment: random sampling units. Fieldwork results and evidence from the archaeological deposits

artefacts were recorded over an area of about 7200m2. Their discontinuous exposure indisturbed patches of ground within this area suggests artefacts are present over the wholearea, but are simply buried.
Depth of archaeological deposits The depth, or thickness, of sediment throughout which archaeological materials were found(Tables 4.4 and 4.5) is not always the same as the total depth of the deposit excavated (Table3.4). Sterile deposits were encountered at the bottom of some excavation pits. In addition, thetop spit of pits dug in eight of the rockshelters, which were initially recorded as havingpotential archaeological deposit, contained no archaeological materials (i.e., no stone artefactsor faunal remains): Elongated Figure, Harris Gully, Low Frontage, McPherson, MangroveMansions, Two Moths, Venus Shelter, Wolloby Gully. Other excavated potential archaeologicaldeposits did have archaeological materials in their top spit.
The ‘depth of archaeological deposit’ is thus the deposit or sediment from whicharchaeological materials were retrieved. The measurement is based on the combined depth ofthose spits which contained archaeological materials. Where sterile spits occur either at the topor bottom of the excavated area, their depth is excluded, but in situations where a sterile spit issandwiched between spits with archaeological materials, it has been included in the depthmeasurement.
The greatest depth of archaeological deposit was recorded at Loggers (ca 206cm); theshallowest deposit is ca 3cm at Firestick (Table 4.4). The majority of archaeological deposits arebetween 10cm and 60cm deep.
Contents of archaeological depositsThe relative size and richness of the assemblages in each of the archaeological deposits variesgreatly in: 1. the type and range of contents present; for example, stone artefacts, faunal remains,
plant remains, ochreous material and charcoal (Table 4.6). Open archaeological depositshave only stone artefacts, with some having charcoal, whereas the range of contents inarchaeological deposits in rockshelters is often greater, particularly those with areas ofdry deposit where better conditions prevail for the preservation of organic materialssuch as faunal and plant remains;
2. the range of stone artefact types and animal species represented in the faunal remains(Tables 4.7 to 4.11). The fact that there is an increase in the range of identified stone artefacttypes and animal species as the size of the assemblages increases, indicates that inter-siteand intra-site variations may be related as much to sample size (i.e., to the number of stoneartefacts or bone fragments retrieved) as to past human behaviour and specific sitefunctions (Attenbrow 1981: 170, Table 6.2; Grayson 1984: 116–30; Hiscock 2001).
The location and nature of the archaeological deposit, as well as the number ofartefacts and bone fragments from each archaeological deposit and each level within adeposit, thus has to be taken into account when analysing and interpreting these data sets (seealso Smith 1982: 110; Owen 1984: 69; Owen and Merrick 1994: 3).
There is no correlation between the size of the stone artefact assemblage retrievedfrom an archaeological deposit and the size of its faunal assemblage.(a) Only two of the six archaeological deposits with the greatest estimated number of
artefacts (Loggers and White Figure) have large faunal assemblages; one has none(Sunny) and two have almost no faunal remains (Uprooted Tree and Emu Tracks 2). Thelimited amount or lack of bone in most archaeological deposits can be attributed to poorconditions for the preservation of organic materials.
What’s changing: population size or land-use patterns? The archaeology of Upper Mangrove Creek, Sydney Basin
terra australis 21
86

TTaabbllee 44..66 Upper Mangrove Creek catchment: random sampling units. Contents recorded in/retrieved from the archaeologicaldeposits. Weights rounded to nearest 0.1g. [1] Exc. indicates artefacts from excavated deposit (– indicates deposit notexcavated); Surfgen — artefacts on surface of deposit outside excavated squares. [2] HD — humanly derived faunal remains;NHD — non-humanly derived remains. [3] P — present; N/c — not collected or not counted.
SITE NAME STONE ARTEFACTS [1] FAUNAL REMAINS [2] PLANT CHARCOAL OTHER
EXC. SURFGEN TOTAL BONE AND SHELL HD NHD REMAINS [3] [3] MATERIALS
No. No. No. Wght (g) No. No.
Anadara 20 3 8 20.5 3 5 P
Axe Head – 1
Bird Tracks 0 0 15 2.0 2 13 P P 3 bone artefacts
Black Hands OD 12 14 P 1 button
Black Hands SH (Sq F) 3302 n/c 377 44.4 377 P
Boat Cave 21 3 P
Boronia 4 1 1 4.3 1 P
Button – 4 P 1 button; firestick?
Caramel Wave 14 0 45 9.6 44 1? P P
Delight OD 0 9 n/c 52.8 Hist n/c Tinfoil
Delight SH 353 14 1 0.1 1 P P
Dingo (Sq Ta+Tb) 12+40 2 647 48.8 638 9 P P
Elngarrah 3 4 3 0.3 1 2 P
Elongated Figure 12 0 5 0.3 5 P P
ET-2 (Sq T1+T2) 7397 39 7 0.9 7 P P
Firestick – 0 P n/c
Geebung 8 0 2 0.2 2 P
Harris Gully 34 2 5 0.5 3 2 P P
Kangaroo and Echidna 63 1 3 1.3 3 P P Resin/gum?
Kyola Road OD – 4
Loggers (Sq E+F) 4803 n/c 9704 1309.3 9704 P P 3 bone artefacts
Low Frontage 6 0 P P
McPherson 23 1 1 1.1 1 P P
Mangrove Mansions 13 0 53 6.0 53 P P Resin/gum
One Tooth 8 4 42 >16.5 39 3 P P
Palmers Crossing Nth OD – 2
Sunny 1260 7 P P Ochre palette
Ti-tree 11 0 P P
Token Male – 3
Two Moths 0 0 86 11.6 1 85 P P
Uprooted Tree 875 3 1 0.3 1 P P
Venus 21 1 P P
White Figure 1087 0 1205 69.1 1202 3 P P
Willow Tree Gully – 7
Wolloby Gully 9 0 27 4.8 27 P P 1 piece cut wood?
Totals 19,411 129
Upper Mangrove Creek catchment: random sampling units. Fieldwork results and evidence from the archaeological deposits
terra australis 21
87
TTaabbllee 44..55 Upper Mangrove Creek catchment: random sampling units. Open archaeological deposits: area (m2) over which
artefacts were exposed and depth of archaeological deposits.
SITE NAME AREA OVER WHICH EXPOSED ESTIMATED DEPTH OF COMMENTS
ARTEFACTS RECORDED ARCHAEOLOGICAL DEPOSIT
(approx. dimensions – m)
Black Hands 40 x 30 T1 5cm Alluvial flats
T2 24cm Colluvial foot-slopes
Delight 15 x 1 Surface only — <20cm ? Ridgetop/structural bench — skeletal soil
Kyola Road 5 x 5 Surface only — <20cm ? Ridgetop — skeletal soil
Palmers Crossing 10 x 1 Unknown — unexcavated Valley fill (highly disturbed)
Willow Tree Gully 10 x 5 Unknown — unexcavated Valley fill (highly disturbed)
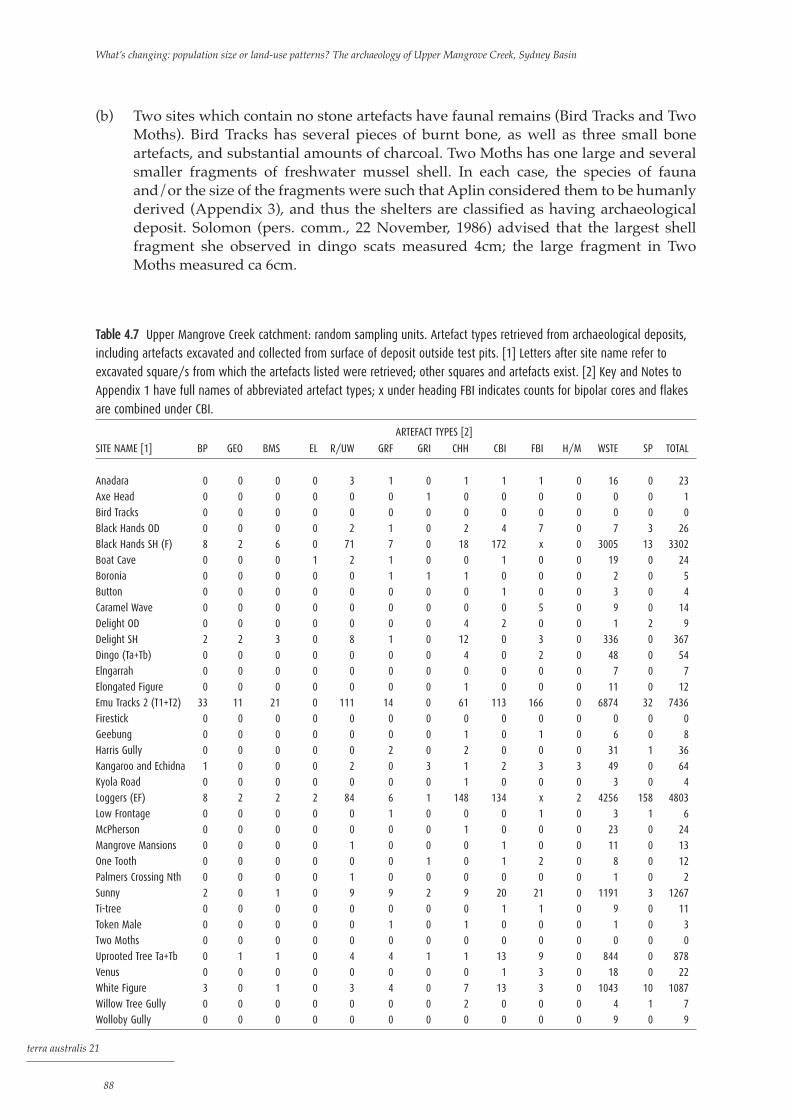
(b) Two sites which contain no stone artefacts have faunal remains (Bird Tracks and TwoMoths). Bird Tracks has several pieces of burnt bone, as well as three small boneartefacts, and substantial amounts of charcoal. Two Moths has one large and severalsmaller fragments of freshwater mussel shell. In each case, the species of faunaand/or the size of the fragments were such that Aplin considered them to be humanlyderived (Appendix 3), and thus the shelters are classified as having archaeologicaldeposit. Solomon (pers. comm., 22 November, 1986) advised that the largest shellfragment she observed in dingo scats measured 4cm; the large fragment in TwoMoths measured ca 6cm.
What’s changing: population size or land-use patterns? The archaeology of Upper Mangrove Creek, Sydney Basin
terra australis 21
88
TTaabbllee 44..77 Upper Mangrove Creek catchment: random sampling units. Artefact types retrieved from archaeological deposits,
including artefacts excavated and collected from surface of deposit outside test pits. [1] Letters after site name refer to
excavated square/s from which the artefacts listed were retrieved; other squares and artefacts exist. [2] Key and Notes to
Appendix 1 have full names of abbreviated artefact types; x under heading FBI indicates counts for bipolar cores and flakes
are combined under CBI.
ARTEFACT TYPES [2]
SITE NAME [1] BP GEO BMS EL R/UW GRF GRI CHH CBI FBI H/M WSTE SP TOTAL
Anadara 0 0 0 0 3 1 0 1 1 1 0 16 0 23
Axe Head 0 0 0 0 0 0 1 0 0 0 0 0 0 1
Bird Tracks 0 0 0 0 0 0 0 0 0 0 0 0 0 0
Black Hands OD 0 0 0 0 2 1 0 2 4 7 0 7 3 26
Black Hands SH (F) 8 2 6 0 71 7 0 18 172 x 0 3005 13 3302
Boat Cave 0 0 0 1 2 1 0 0 1 0 0 19 0 24
Boronia 0 0 0 0 0 1 1 1 0 0 0 2 0 5
Button 0 0 0 0 0 0 0 0 1 0 0 3 0 4
Caramel Wave 0 0 0 0 0 0 0 0 0 5 0 9 0 14
Delight OD 0 0 0 0 0 0 0 4 2 0 0 1 2 9
Delight SH 2 2 3 0 8 1 0 12 0 3 0 336 0 367
Dingo (Ta+Tb) 0 0 0 0 0 0 0 4 0 2 0 48 0 54
Elngarrah 0 0 0 0 0 0 0 0 0 0 0 7 0 7
Elongated Figure 0 0 0 0 0 0 0 1 0 0 0 11 0 12
Emu Tracks 2 (T1+T2) 33 11 21 0 111 14 0 61 113 166 0 6874 32 7436
Firestick 0 0 0 0 0 0 0 0 0 0 0 0 0 0
Geebung 0 0 0 0 0 0 0 1 0 1 0 6 0 8
Harris Gully 0 0 0 0 0 2 0 2 0 0 0 31 1 36
Kangaroo and Echidna 1 0 0 0 2 0 3 1 2 3 3 49 0 64
Kyola Road 0 0 0 0 0 0 0 1 0 0 0 3 0 4
Loggers (EF) 8 2 2 2 84 6 1 148 134 x 2 4256 158 4803
Low Frontage 0 0 0 0 0 1 0 0 0 1 0 3 1 6
McPherson 0 0 0 0 0 0 0 1 0 0 0 23 0 24
Mangrove Mansions 0 0 0 0 1 0 0 0 1 0 0 11 0 13
One Tooth 0 0 0 0 0 0 1 0 1 2 0 8 0 12
Palmers Crossing Nth 0 0 0 0 1 0 0 0 0 0 0 1 0 2
Sunny 2 0 1 0 9 9 2 9 20 21 0 1191 3 1267
Ti-tree 0 0 0 0 0 0 0 0 1 1 0 9 0 11
Token Male 0 0 0 0 0 1 0 1 0 0 0 1 0 3
Two Moths 0 0 0 0 0 0 0 0 0 0 0 0 0 0
Uprooted Tree Ta+Tb 0 1 1 0 4 4 1 1 13 9 0 844 0 878
Venus 0 0 0 0 0 0 0 0 1 3 0 18 0 22
White Figure 3 0 1 0 3 4 0 7 13 3 0 1043 10 1087
Willow Tree Gully 0 0 0 0 0 0 0 2 0 0 0 4 1 7
Wolloby Gully 0 0 0 0 0 0 0 0 0 0 0 9 0 9

Upper Mangrove Creek catchment: random sampling units. Fieldwork results and evidence from the archaeological deposits
terra australis 21
89
T Ta ab bl l
e e 4 4. .
8 8Up
per M
angr
ove
Cree
k ca
tchm
ent:
rand
om s
ampl
ing
units
. Mam
mal
rem
ains
retri
eved
from
arc
haeo
logi
cal d
epos
its: n
umbe
r of f
ragm
ents
. App
endi
x 3
has
full
scie
ntifi
c na
me
and
com
mon
nam
es o
f ani
mal
spe
cies
; Tab
le 4
.1 h
as fu
ll sit
e na
mes
. Q in
dica
tes
echi
dna
quill
/s; F
T —
furre
d ta
il; H
— h
airs
.
SITE
NAM
ES
ANIM
AL S
PECI
ESAS
BHS
BTBo
SCW
DeO
DeS
DiS
ESEF
ET2
GSHG
KELS
McP
MM
OTTM
SUT
SW
FW
oG
Acro
batid
aeAc
roba
tes
pygm
aeus
1
Burra
myi
dae
Cerc
arte
tus
nanu
s1
1
Dasy
urid
aeSm
all d
asyu
rid10
1
Mac
ropo
dida
eM
acro
pus
robu
stus
3
Larg
e M
acro
podi
d1
136
Mac
ropu
s ru
fogr
iseus
3
Wal
labi
a bi
colo
r1
8
Med
ium
Mac
ropo
did
51
16
108
12
Petro
gale
pen
icilla
ta3
4
Thyl
ogal
esp
.3
Smal
l Mac
ropo
did
14
11
41
146
34
14
Mac
ropo
did
(uns
ized)
2
Mur
idae
Pseu
dom
ys o
ralis
3
Rattu
ssp
. cf.
fusc
ipes
2
Mur
id u
nide
ntifi
ed4
52
11
12
Pera
mel
idae
Isoo
don
sp.
32
1
Pera
mel
es n
asut
a2
Pera
mel
id u
nide
ntifi
ed2
102
13
1
Peta
urid
ae
Peta
urus
cf.
brev
iceps
FT
Peta
urus
sp.
1
Phal
ange
ridae
Trich
osur
us v
ulpe
cula
12
Poto
roid
aePo
toro
ussp
.3
5
Poto
roid
uni
dent
ified
17
Pseu
doch
eirid
aePs
eudo
chei
rus
pere
grin
us1
Pseu
doch
eirin
e/pe
taur
id1
210
1
Larg
e an
d un
sized
pos
sum
41?
1
Pter
opod
idae
Pter
opus
sca
pula
tus
1
Tach
yglo
ssid
aeTa
chyg
loss
us a
cule
atus
Q
Vom
batid
aeVo
mba
tus
ursin
us1
H+2
Mic
roch
iropt
era
4

What’s changing: population size or land-use patterns? The archaeology of Upper Mangrove Creek, Sydney Basin
terra australis 21
90
T Ta ab bl l
e e 4 4. .
9 9Up
per M
angr
ove
Cree
k ca
tchm
ent:
rand
om s
ampl
ing
units
. Non
-mam
mal
ver
tebr
ate
rem
ains
retri
eved
from
arc
haeo
logi
cal d
epos
its: n
umbe
r of f
ragm
ents
. App
endi
x 3
has
scie
ntifi
c na
me
and
com
mon
nam
es o
f ani
mal
spe
cies
; Tab
le 4
.1 h
as fu
ll sit
e na
mes
; F in
dica
tes
bird
feat
her/
s.
SITE
NAM
ES
ANIM
AL S
PECI
ESAS
BHS
BTBo
SCW
DeO
DeS
DiS
ESEF
ET2
GSHG
KELS
McP
MM
OTTM
SUT
SW
FW
oG
REPT
ILES
Lace
rtilia
Agam
idae
2
Scin
icid
ae, e
.g.,
Eger
nia
sp.
1
Smal
l aga
mid
1
Med
ium
liza
rd1
Unsiz
ed li
zard
11
Ophi
dia
7
Boid
ae5
Elap
idae
2
Med
ium
sna
ke1
4
Smal
l sna
ke1
Unsiz
ed s
nake
1
BIRD
S
cf. D
rom
aius
nov
aeho
lland
iae
1
Med
ium
bird
41
Unid
entif
ied
bird
FF
F
FROG
S
Anur
a2
1
Unid
entif
ied
frog
1
FISH Tele
ost f
ish8
UNID
ENTI
FIED
FRA
GMEN
TS2
366
20
180
038
02
00
14
090
981
3525
461?
1013
14

Upper Mangrove Creek catchment: random sampling units. Fieldwork results and evidence from the archaeological deposits
terra australis 21
91
T Ta ab bl l
e e 4 4. .
1 10 0 U
pper
Man
grov
e Cr
eek
catc
hmen
t: ra
ndom
sam
plin
g un
its. I
nver
tebr
ate
faun
al re
mai
ns re
triev
ed fr
om a
rcha
eolo
gica
l dep
osits
: num
ber o
f fra
gmen
ts. A
ppen
dix
3 ha
s fu
rther
deta
ils; T
able
4.1
has
full
site
nam
es; n
/c in
dica
tes
not c
ount
ed.
SITE
NAM
ES
ANIM
AL S
PECI
ESAS
BHS
BTBo
SCW
DeO
DeS
DiS
ESEF
ET2
GSHG
KELS
McP
MM
OTTM
SUT
SW
FW
oG
SHEL
LFIS
H AN
D LA
NDSN
AILS
Hyrii
dae
11
384
16
12
194
101
927
Anad
ara
trape
zian/
c5
19
21
8
Sacc
ostre
a gl
omer
ata
n/c
Terre
stria
l lan
dsna
il (u
nide
ntifi
ed)
71
81
3
CRUS
TACE
A
Para
stac
idae
(ya
bby)
2215
261
2
T Ta ab bl l
e e 4 4. .
1 11 1Up
per M
angr
ove
Cree
k ca
tchm
ent:
rand
om s
ampl
ing
units
. Sum
mar
y of
tota
l num
bers
and
wei
ghts
(g)
of a
ll fa
unal
rem
ains
retri
eved
from
arc
haeo
logi
cal d
epos
its. T
able
4.1
has
full
site
nam
es.
SITE
NAM
ES
CATE
GORI
ES O
F FA
UNAL
REM
AINS
ASBH
SBT
BoS
CWDe
ODe
SDi
SES
EFET
2GS
HGKE
LSM
cPM
MOT
TMS
UTS
WF
WoG
Tota
l num
ber o
f bon
es
837
615
020
01
405
25
01
41
9493
149
3282
010
4618
(who
le a
nd fr
agm
ents
)
Tota
l wei
ght o
f bon
e (g
)19
.555
20
4.8
00.
139
.60.
20.
30
0.1
0.4
0.3
1289
.21.
15.
914
.14.
40
62.8
4
Tota
l num
ber o
f qui
lls,
13
12
feat
hers
and
hai
r/fu
r sam
ples
Tota
l num
ber o
f she
ll fra
gmen
ts0
10
13
n/c
096
10
72
12
211
01
122
110
37
Tota
l wei
ght o
f she
ll fra
gmen
ts (g
)0
0.1
04.
34.
352
.80
5.5
0.1
00.
90.
10.
11
20.1
00.
12.
47.
20.
25.
10.
6
Tota
l num
ber o
f yab
by fr
agm
ents
00
00
220
015
20
00
00
00
00
00
061
2
Tota
l wei
ght o
f yab
by fr
agm
ents
(g)
00
00
0.5
00
3.7
00
00
00
00
00
00
1.2
0.2

Stone artefactsStone artefacts were recorded at 32 of the 35 sites with archaeological deposit. The number ofartefacts retrieved ranged from one (in Axe Head) to 7436 (in Emu Tracks 2) (Tables 4.6 and 4.7).The three sites without stone artefacts are Bird Tracks and Two Moths (see b. above) and Firestickin which a piece of modified wood was found (see Chapter 3, Wooden objects).
The stone artefact types are typical of those which occur in stone artefact assemblagesin archaeological sites in the Sydney Basin, and include backed artefacts (Bondi points,geometric microliths, eloueras and backed miscellaneous), bipolar artefacts and ground-edgedaxes/hatchets (see Chapter 3, Temporal sequences). Not all artefact types are found in eacharchaeological deposit, and sample size probably plays a large part in this variation (seecomments under 2. above). The type and number of stone artefacts retrieved from eacharchaeological deposit is presented in Table 4.7. The distribution of artefact types and rawmaterials according to spits within each archaeological deposit is presented in Appendix 1.
The estimated total numbers of artefacts in each archaeological deposit in eachtopographic zone were combined to provide an estimated total number for each zone (Fig.4.3). The estimated number of artefacts in each zone ranges from 250 to 374,050. The density ofartefacts in each zone ranges from 250 to 341,850/sq km. Periphery ridgetops and the mainvalley bottoms stand out as having the highest estimated number and density of accumulatedartefacts. Periphery ridgetops have the highest estimated number of accumulated artefacts,but the main valley bottoms have the highest density. This pattern parallels the distribution ofAD-3 category archaeological deposits (see below), which were slightly more frequent in theperiphery ridgetops than in the main valley bottoms.
The topographic zones with the highest number and density of artefacts (theperiphery ridgetops and main valley bottoms), however, are not the same zones that have the highest number of archaeological deposits (subsidiary ridgesides). That is, thehigher number of archaeological deposits in some zones (e.g., the subsidiary ridgesides)does not necessarily compensate for the large size of the assemblages in archaeologicaldeposits in others.
Faunal remainsFaunal remains were retrieved from 22 archaeological deposits and consist of fragments ofanimal bone, shell and crustacean exoskeleton (Tables 4.6, 4.8 to 4.11; Appendix 3); allcategories were not present at each site. As mentioned previously, preservation conditions atindividual sites varied considerably and this is likely to account for the variations in numberand weight of fragments as much as reasons attributable to human behaviour. The majority ofsites had poor conditions for the preservation of organic materials such as bone (Hughes andSullivan 1979: 22; Aplin 1981: 1). The greatest depth below ground surface at which faunalremains were found in any of the archaeological deposits was 80cm to 90cm at Loggers, wherethe deposit had a total depth of ca 2m.
The remains from a wide range of animals were found: mammals, birds, fish, reptiles,freshwater and marine shellfish and yabbies. The number of bone fragments retrieved fromeach site varies from one to 9493; the weight varies from <1g to 1289g. Most fragments are<1cm long. A summary list of the species and/or genus identified at each site is provided inTables 4.8 to 4.11. Data in Tables 4.6 and 4.8 to 4.11 for Black Hands relate only to Square F, andfor Loggers only to Squares E–F. Further details are provided in Aplin’s 1981 and 1985 faunalreports reproduced in Appendix 3.
Fragmented shell was retrieved from 15 archaeological deposits and smallfragments of freshwater crayfish/yabby carapace from only four. Shell weights range from0.1g to 20.1g, whereas the maximum weight of yabby carapace is only 3.7g. The shell
What’s changing: population size or land-use patterns? The archaeology of Upper Mangrove Creek, Sydney Basin
terra australis 21
92

Upper Mangrove Creek catchment: random sampling units. Fieldwork results and evidence from the archaeological deposits
terra australis 21
93
Figure 4.3 Upper Mangrove Creek catchment: random sampling units. (A) Estimated total number and (B) density of
artefacts accumulated in each topographic zone.
380
360
320
280
240
200
160
120
80
40
20
N=374,050
N=250N=8350
N=3550
N=49,200
N=205,100
NUM
BER
(x1
000)
RT RT VB VB RS RS PERI PEN MC SC MC SC
RT RT VB VB RS RS PERI PEN MC SC MC SC
380
360
320
280
240
200
160
120
80
40
20
N=116,900
N=250N=4900 N=4450
N=18,200
N=341,850
NUM
BER
/ SQ
. KM
(x1
000)
A. B.

included estuarine as well as freshwater species. The shell found at Delight Open Deposit isof recent and non-Aboriginal origin. A furred possum tail found on the surface in OneTooth was not weighed.
Categorisation of archaeological depositsSince stone artefacts were the only category of evidence retrieved in the majority of thearchaeological deposits, the number of stone artefacts is used to categorise thearchaeological deposits into ‘size’ classes. The classification is based on the estimated totalnumber of artefacts present in each archaeological deposit (Table 4.12). This was calculatedby multiplying the number of artefacts per square metre of excavated deposit by thenumber of square metres of deposit at the site. The number of artefacts per square metrewas calculated by dividing the number of artefacts retrieved by the number of squaremetres excavated.
In calculating the estimated number of artefacts in each deposit, recorded variationsin artefact density throughout the depth of the excavated deposit were taken into account. Inaddition, where it could be seen that the unexcavated deposits would not contain a similardensity of artefacts as the excavated deposit, or that they would not be of similardepth/thickness to the excavated deposits, these observations were taken into account. Aswell, factors which indicated that there were likely to be spatial variations in the numberand/or density of artefacts across the area of the deposit were considered; for example, 1. whether there were very shallow areas, or eroded/gullied areas with gravel lag; or,2. whether there was an area of deposit outside the shelter that was also likely to contain
archaeological materials (Table 4.4). The estimated total number of artefacts in each archaeological deposit is used in
the analyses to overcome problems which may result from the wide variation in the area excavated in each archaeological deposit and in the area of archaeological deposit ateach site.
Based on the estimated number of artefacts present, a K-means cluster analysis(undertaken by Richard Wright; Orton 1980: 52–4) suggested the archaeological depositscould be divided into three clusters, which I called AD-1, AD-2 and AD-3 (Table 4.13).
In general, the archaeological deposits fall into similar categories if classified on thebasis of the actual number of artefacts retrieved or the number of artefacts per square metre,although the ordering within the categories changes slightly in some cases (Table 4.12).
The six sites in category AD-3 have a restricted distribution occurring in only threeof the topographic zones: periphery ridgetops (3), the main valley bottoms (2), and thesubsidiary ridgesides (1) (Attenbrow 1987: Table 6.3). Most of the archaeological deposits inthe periphery ridgetops and main valley bottoms are category AD-3 (i.e., three of five, andtwo of three respectively). On the subsidiary ridgesides, only one of the 11 sites is categoryAD-3 and this archaeological deposit lies just within the lower boundary of the samplingunit; that is, just above the boundary of the valley bottom zone. The two archaeologicaldeposits with the highest estimated number of artefacts in category AD-2 (Delight andWhite Figure, both with ca 5000 artefacts) are also in two of these three topographic zones(periphery ridgetops and subsidiary ridgesides).
The numbers of stone artefacts recorded at open archaeological deposits are quitesmall (<26), but, in most cases, the area over which buried artefacts could be present isrelatively large with ill-defined and/or undefinable boundaries. It was thus not feasible toestimate either the extent of the area over which the open archaeological deposits may existor the total number of artefacts in them. The five open archaeological deposits are thereforenot included in this categorisation, nor in analyses where this breakdown is used. The
What’s changing: population size or land-use patterns? The archaeology of Upper Mangrove Creek, Sydney Basin
terra australis 21
94

Upper Mangrove Creek catchment: random sampling units. Fieldwork results and evidence from the archaeological deposits
terra australis 21
95
TTaabbllee 44..1122 Upper Mangrove Creek catchment: random sampling units. Archaeological deposits: number of artefacts
retrieved, number of artefacts/square metre, and estimated total number of artefacts present. [1] Excludes surface artefacts
outside excavated squares.
SITE NAME No. OF ARTEFACTS No. OF ARTEFACTS ESTIMATED TOTAL No.
RETRIEVED [1] PER SQUARE OF ARTEFACTS IN
METRE ARCHAEOLOGICAL DEPOSIT
(TAKEN TO NEAREST 50)
OPEN AND/OR UNEXCAVATED DEPOSITS
Firestick 0 0 (or very low)
Axe Head 1 – (very low)
Palmers Crossing Nth OD 2 n/c
Token Male 3 n/c
Kyola Road OD 4 n/c
Button 4 n/c (very low)
Willow Tree Gully OD 7 n/c
Delight OD 7 n/c
Black Hands OD 12 Exc + 14 Surf 12 –
Total 42
EXCAVATED DEPOSITS
Bird Tracks 0 0 0 (or very low)
Two Moths 0 0 0 (or very low)
Elngarrah 3 3 100
Boronia 4 4 150
Low Frontage 6 12 300
Geebung 8 16 400
Wolloby Gully 9 36 2250
One Tooth 8 32 750
Ti-tree 11 22 500
Elongated Figure 12 48 950
Mangrove Mansions (East, T1) 13 52 3250
Caramel Wave 14 28 500
Anadara 20 40 1850
Boat Cave 21 84 500
Venus 21 42 700
McPherson 23 92 1600
Harris Gully 34 136 1850
Dingo (Sq Tb only) 40 160 2600
Kangaroo and Echidna (T1+T2) 2+61 8+66 5500
Delight SH 353 1358 5000
Uprooted Tree (Ta+Tb) 875 1754 31,250
White Figure 1087 2174 37,050
Sunny 1260 2520 88,150
Black Hands SH (Sq F) 3302 3843 77,050
Loggers (Sq E+F) 4803 2402 128,050
Emu Tracks 2 (T1+T2) 119+7278 11,830 249,650
Total 19,399 639,950
TTaabbllee 44..1133 Upper Mangrove Creek catchment: assemblages grouped according to K-means analysis.
CATEGORY ESTIMATED TOTAL No. OF ARCHAEOLOGICAL
NUMBER OF ARTEFACTS DEPOSITS
AD-1 0 to 100 7
AD-2 101 to 5500 18
AD-3 >31,000 6

information recorded to date, however, suggests that the largest open archaeologicaldeposits (in terms of both area and potential depth of deposit) occur along the main valley bottoms.
Isolated finds
Ten isolated finds (IFs) were recorded in the random sampling units (Attenbrow 1987: Tables5.2 and A3/2; 1997 [1998]: Appendix 2). They were all stone artefacts — one ground-edgedimplement (IF.20), one chert flake (IF.3), three flaked pieces (IF.6; IF.17 with possible R/UW;IF.13 a possible ‘axe preform’), two hand-held cores (IFs. 12, 26), a bipolar core (IF.70), oneprobable manuport (IF.8, a broken basalt pebble), a rejuvenation flake with possible R/UW oredge damage (IF.35).
The isolated finds were all recorded in random sampling units which occur withinthe storage area. The lack of isolated finds in other random sampling units and the lowerfrequency recorded in areas outside the storage area is probably due to three main factors: 1. the greater amounts of ground disturbance in the storage area;2. the greater length of time spent undertaking archaeological work in the storage area;3. the greater amount of ground/vegetation cover in areas above the storage area.
Although I suggested earlier (Chapter 3, Isolated finds) that isolated finds couldprovide clues to locations of open archaeological deposits, sub-surface investigations were notundertaken at these locations. It is too late to undertake such a program in the catchment sincethe isolated finds recorded are in the now-flooded valley bottoms. Sub-surface testing in suchlocations (as well as locations identified as open archaeological deposits) could, however, andperhaps should, be incorporated into future projects in this region (e.g., in the lowerMangrove Creek or Macdonald River Valley), particularly since open archaeological depositsin Sydney/Hawkesbury sandstone environments are so elusive (Attenbrow 1997 [1998]).
Potential habitation shelters and potential archaeological deposits(PH shelters and PADs)
One hundred and seventy-two potential habitation (PH) shelters were recorded within therandom sampling units during the survey period (Attenbrow 1987: Appendix 3, Table A3/3).They are typical sandstone rockshelters, which meet the criteria described in Chapter 3.
The deposit in four of the PH shelters was test excavated — archaeological materialswere found in three deposits and one test pit was sterile. On reinspection of other PH shelters,one was found to contain an archaeological deposit and another to have images. Thus, 167rockshelters in the random sampling units remain classified as ‘potential habitation shelters’— a density of 16.5/sq km (Table 4.2C).
Of the 167 PH shelters, 159 have potential archaeological deposit (PAD). Thirty-tworockshelters with PAD have only a shallow depth of sediment (<10cm) and one has a flood-affected deposit (Table 4.2C). Although rockshelters with PAD were recorded in all topographiczones, they are not evenly distributed across the catchment. Their density ranges from 2/sq kmin the main valley bottoms to 46/sq km on the main ridgesides.
From the excavations carried out, it is anticipated that rockshelters with shallowdeposit are unlikely to have abundant archaeological materials. Of the 30 rockshelters in therandom sampling units which are classified as having archaeological deposit, three have onlyvery shallow unconsolidated sediment — Axehead, Button, Firestick). At another three, the
What’s changing: population size or land-use patterns? The archaeology of Upper Mangrove Creek, Sydney Basin
terra australis 21
96

deposit with some depth is either outside the rockshelter (McPherson) or restricted to withinthe dripline zone (Boat Cave, Delight). It was possible to excavate within the dripline zone atBoat Cave, Delight and outside the rockshelter at McPherson, but, apart from Delight, veryfew stone artefacts or faunal remains were retrieved from the test pits in these archaeologicaldeposits.
Twenty-five locations with PAD were test excavated during the salvage program andthe research project (14 PH shelters and 11 rockshelters with images). Eighteen of these (72%)contain definite archaeological material (stone artefacts and/or faunal remains; the deposit inone rockshelter with images [Casper] was classified as doubtful as the test excavationretrieved only one doubtful stone artefact). Extrapolation from these figures suggests theremay be a further 91 to 115 rockshelters with archaeological deposit in the random samplingunits (i.e., between 9/sq km and 11.5/sq km). However, the PH shelters included in theexcavation program were a purposeful sample, and test excavation of a random sample of allPH shelters is necessary before more accurate inferences can be made. Szpak’s comparativeanalysis of the attributes of recorded PH shelters against those of shelters known to have beenused concluded that:
…it must be assumed that all these rockshelters have been used until it is known otherwise,always bearing in mind that in some rockshelters, ie those with bare rock floors and noarchaeological evidence, it will be impossible to prove or disprove this contention. (Szpak 1997:112)
Some rockshelters with PAD may fall outside the PH criteria outlined in the lastchapter. For example, rockshelters or overhanging cliffs where the ‘sheltered’ floor area issmaller than stipulated but a large flattish area of deposit suitable for habitation exists, and thecliff/overhang would provide shelter from, say, strong winds and intense heat, if not fromrain. Such locations were not recorded during the survey. There is no way of assessing howmany exist, without repeating the survey, and recording and/or test excavating rockshelterswith these and/or other characteristics.
Upper Mangrove Creek catchment: random sampling units. Fieldwork results and evidence from the archaeological deposits
terra australis 21
97

terra australis 21
99
Biases that may have been introduced into the archaeological record and data sets by bothnatural events and human behaviour were examined to help establish the degree of reliabilitythat can be placed on the results of the analyses. Incidents — taphonomic processes —affecting the deposits may have occurred during the course of each habitation’s use and itsabandonment. In addition, methodological procedures adopted for the research project mayhave affected the results, e.g., during the fieldwork (outside procedures relating to sampleselection) and analysis of data.
Methodological factors — fieldwork
Methodological factors which may have affected the fieldwork results concern the way in whichsites and archaeological traits were defined, the survey design, sample size, observer bias andwhether excavation stopped before the base of an archaeological deposit was reached.
DefinitionsIt was thought that density figures (i.e., the number of sites per square kilometre) may havebecome biased due to the way sites and archaeological traits were defined (Chapter 3,Defining sites), in particular, criteria relating to the distance between sites. The followingassessment, however, indicates that the site definitions have not significantly affected theresults of the analyses relating to site densities.
There are three situations where two archaeological traits less than 50m apart weredefined as separate sites: • Delight Shelter and Delight Open Site;• Kyola Road Images 1 and Kyola Road Open Site; and,• Uprooted Tree Shelter and Uprooted Tree Grinding Area.
Upper Mangrove Creek catchment:random sampling units.
Possible biases in the archaeological recordand data sets
5
Each situation involves different types of archaeological traits and/or different typesof locations (SH/AD and OD/AD; OR/IM and OD/AD; SH/AD and OR/GA respectively). Ifthese traits are classified as three sites instead of six, the total number of sites in the randomsampling units becomes 56 instead of 59, and the average site density becomes 5.5/sq kmrather than 5.8/sq km. If, in addition, the original classification of Kyola Road Images as onesite (as on the NPWS site card) is retained rather than classifying them as two, the number ofsites is reduced to 55, but the site density remains 5.5/sq km; the density of images on openrock drops from 0.2 to 0.1/sq km (Attenbrow 1987: Table 5.11). All of the abovementioned sitesare on periphery ridgetops. If the total number of sites on the periphery ridgetops is reducedby four (from 24 to 20), this zone still has the highest number of sites and the second-highestdensity of sites (Table 4.2A).
Survey designProblems arose with two of the sampling units: RSU.101 in the northern part of the catchmentand RSU.75 at the junction of Mangrove and Boomerang Creeks (Fig. 3.15).
RSU.101 A section of periphery ridgetop was inadvertently included in the subsidiary valley bottomzone when marking the map into topographic zones in the sampling design stage; thesubsidiary valley bottom zone was extended too far upstream in this particular creek. This wasrealised only once in the field. This section of the periphery ridgetop is in the northern half ofthe RSU.101, a subsidiary valley bottom sampling unit. A grinding area, First of Day, recordedin RSU.101 is therefore just within the periphery ridgetop zone rather than subsidiary valleybottom. In this instance, that part of the sampling unit and the site were not deleted from theanalyses. This boundary error does not affect the data and trends presented in this monograph.
RSU.75This unit is in the main valley bottom at the junction of Mangrove and Boomerang Creeks — itextends along Mangrove Creek both above and below the junction. When surveying commencedin RSU.75, it was found that logging had begun in this section of the storage area, and fallen logsrendered the southern half of the unit below the junction with Boomerang Creek inaccessible.An on-the-spot decision was made to survey an equivalent section along Boomerang Creekwhich was part of RSU.74. The area actually surveyed has been called RSU.75/74.
The ‘abandoned’ southern section of RSU.75, which was surveyed during the salvageprogram, had four recorded sites. A comparison between the evidence recorded in RSU.75 andin RSU.75/74 was made to check whether the results would have been very different(Attenbrow 1987: Table 5.13). Some differences occur: a scarred tree and two openarchaeological deposits were found in RSU.75-south, whereas no scarred trees and only oneopen archaeological deposit occur in the part of RSU.74 surveyed. One of the openarchaeological deposits in RSU.75-south, Stockyards Open Deposit, has a much larger numberof recorded artefacts (152) and a much larger area (7200m2) than Palmers Crossing in RSU.74and all other open archaeological deposits in the random sampling units (Tables 4.5 and 4.6).As well as a surface collection, test excavations were undertaken at Stockyards, but there wereno materials appropriate to date. The presence of a single Bondi point indicates occupationoccurred most likely in Phase 2 or possibly Phase 3 — that is, sometime between ca 5000 andca 1600 years BP, but it could have occurred up to ca 8000 years ago (Table 3.8; Hiscock andAttenbrow 1998). The limited and disturbed evidence at Palmers Crossing did not allow it tobe included in the analyses. If Stockyards had been included, the numbers of sites establishedand/or used, and the artefact accumulation rates would have increased in the late-Holocene
What’s changing: population size or land-use patterns? The archaeology of Upper Mangrove Creek, Sydney Basin
terra australis 21
100

periods. However, the magnitude of the increase would not have been sufficient to substantiallyalter the trends presented in future chapters.
Sample sizeThe affect of sample size (Grayson 1984: 116–30; Hiscock and Allen 2000: 100; Hiscock 2001) inrelation to the site survey was discussed in Attenbrow 1987 (Chapter 4). With regard toexcavation, trends in the habitation and artefact indices may have become biased because ofthe small area excavated in some of the archaeological deposits (i.e., 0.25m2). For example,small sample sizes may mean that the evidence retrieved from the pit as a whole, or fromparticular levels, is not representative of the whole deposit. If so, then the number and type ofartefacts and raw material retrieved, as well as the estimated total numbers of artefacts whichwere extrapolated from that sample may be inaccurate, or assignment to a particular phase ormillennium may be incorrect. In addition, in shelters with sloping sandstone floors (see nextsection), it is possible that the earliest time periods are not represented by the excavated basaldeposits. These questions can be tested only by further excavation in those archaeologicaldeposits.
Explanations for inter-site variability as well as intra-site temporal variability in therange of stone artefact types and animal species present in each archaeological deposit mayalso be prejudiced if sample size is not taken into account. In this regard, intra-site comparisonof the stone artefact assemblage composition and density figures from individual 0.25m2 pitsin Mussel, Deep Creek and Confluence, three sites in the storage area, are relevant. In thedeposit in each of these rockshelters, more than two adjoining pits were excavated. Temporaltrends in the direction and magnitude of changes in density figures were similar in each pit,suggesting trends in artefact accumulation rates in deposits in small to medium shelters areunlikely to be biased. It is assumed, on the basis of this exercise, that numbers and densities ofartefacts in a test pit reflect numbers and densities in the deposit as a whole and that thecalculations of the estimated total numbers of artefacts (Tables 4.12, 6.11–6.16) based onextrapolations from the test pits are not widely divergent from reality.
In contrast with the density figures, the presence/absence of specific artefact types inparticular levels does sometimes vary, and this was kept in mind where the ages of depositsare based on diagnostic artefact types in single 0.25m2 pits.
Excavation stopped prematurelyIn six sites, excavation stopped before reaching bedrock, or rock/rubble or colluvial sedimentwhich could be assumed to be the original ground surface (Chapter 3, Table 3.4). At BlackHands Open Deposit, digging ceased when water from rising stored water in adjacentMangrove Creek filled the pit. At two sites, Anadara (T2) and Mangrove Mansions (T2),excavation was not continued due to the clearly shallow and disturbed nature of theirdeposits. At three of the sites (Bird Tracks, Boronia, and Kangaroo and Echidna), excavationwas stopped after about 20cm of sterile deposit was dug.
At a further three sites (Elongated Figure, Harris Gully, Uprooted Tree), the base ofthe excavation was sloping bedrock which suggests the adjacent deposit may be deeper. Ateach of these sites it is possible that earlier levels with stone artefacts are present.
The implications of these situations are discussed in the following chapter whenchanges in the habitation establishment rates are analysed.
Observer bias This term covers non-detection of archaeological traits due to the inexperience of fieldworkersand/or ‘end-of-day’ tiredness. Both can affect survey and excavation results.
Upper Mangrove Creek catchment: random sampling units. Possible biases in the archaeological record and data sets
terra australis 21
101

What’s changing: population size or land-use patterns? The archaeology of Upper Mangrove Creek, Sydney Basin
terra australis 21
102
Survey resultsBoth inexperience and tiredness can cause evidence to go unnoticed during site survey. Forexample, one or two stone artefacts in a rockshelter dripline, or particularly faint remnantdrawings or scratched outlines on a rockshelter wall/ceiling, could be missed.
During the excavation stage and/or during visits to rockshelters for other reasons,some pigment images were noticed in shelters that had been missed during the site survey(Chapter 4, Summary of fieldwork results). This suggests that some PH shelters which were notrevisited may have images. An estimation of how many may have been missed can be gainedfrom the following observations. At the end of the random sample survey, of the 27 rocksheltersites recorded, 11 were without images. After revisiting these 11 sites for test excavations, twowere found to have pigment images (Dingo and One Tooth) and a third to have a possibleimage (Elngarrah); these represent 18% or possibly 27% of the rockshelter sites. Byextrapolation, between one-fifth and one-quarter of the recorded PH shelters may containimages, which suggests there are another 30 to 45 rockshelters with images in the randomsampling units. However, the 11 sites which were reinspected are a probably biased sample asthey all had some other evidence of Aboriginal use (i.e., archaeological deposit). Thus, thenumber of images in rockshelters that are likely to have been missed is probably <27%.
Excavation resultsThree factors may have affected the excavation results of some archaeological deposits.1. The varying levels of experience and diligence of individual field assistants.
Volunteers who assisted in the field varied in their experience, expertise anddedication. Care was taken to ensure people achieved the same level of retrieval,however, the same people were not present throughout each excavation period andsome variation in the amounts recovered from the sieves at different sites may haveresulted.
2. Field sorting versus laboratory sorting. The sieved residues from some archaeologicaldeposits were sorted in the field and others were taken back to the laboratory forsorting. The level of recovery for sites where excavated materials were sorted in thelaboratory may be higher than for those where sorting took place on site.
3. The presence of abundant organic matter and small rubble. The upper spits of somedeposits contain a lot of leaf-litter and/or charcoal. Because of their bulk, thesematerials can hinder the visibility of other archaeological materials. In addition,charcoal tends to colour everything grey, making all the materials appear similar (e.g.,this was the case in the upper levels of Loggers and White Figure). Archaeologicalmaterials are also less visible in deposits with large amounts of small rubble.The above statements are based on the observations at two sites where it was possible
to check results: White Figure and Deep Creek (the latter is in the storage area [Attenbrow1982b]). Both have rich archaeological deposits with relatively large assemblages. A sample ofthe sieved residues from these two sites were returned to the laboratory — a check revealedthat the 0–1cm stone artefact category and small bone fragments in some spits may be under-represented because of the factors listed above.
In the case of Deep Creek, the analysis indicated the ‘shortfall’ would have made nodifference to the overall percentage of the artefact types and raw materials within individualexcavation units or within analytical levels (combined spits) (horizontally and vertically). Thissuggests that where large numbers of stone artefacts are recovered, observer bias may nothave substantially affected the results.
At White Figure, all three of the above factors were involved. Large amounts oforganic matter (leaf-litter and charcoal) in the upper spits made thorough checking of the

sieved materials a difficult and lengthy process. When work started on site, the person initiallysieving the excavated deposit did not realise that residues should be bagged for later sorting ifit was not possible to check the sieved residues thoroughly without holding up the excavationprocess. The field-sorted residues from the surface and upper two spits were thrown outbefore I realised they had not been thoroughly checked. From spit 3 onwards, sieve residueswere kept and a final sort undertaken in the laboratory. Results gained from excavation unitssorted in both the field and laboratory suggest that about 50% of the stone artefacts in theupper two spits may have been missed. The figures used in the analyses were adjusted wherenecessary to compensate for this (e.g., when estimating the total numbers of artefacts in thearchaeological deposits in White Figure — Tables 4.12, 6.11 to 6.13, and A2/16).
Methodological factors — analyses
Calculating artefact accumulation ratesArtefact accumulation rates were calculated for each of the excavated deposits in thecatchment (Chapter 6) as well as for sites in the comparative regions in eastern Australia(Chapter 7). The method adopted, using depth/age curves, is described in Chapter 6. Ratesderived by this method are very much dependent on (a) the position of dated levels, and (b)the assumptions that deposition rates for sediments remained relatively constant between thedated levels or dated materials, and that gross sediment deposition and erosion patterns arewell approximated by the net rate (Morwood 1981: 32; Davidson 1997: 217). Since we often donot know whether these assumptions are true, there are, as Morwood states, limits to theprecision of the method. In addition, the small number or lack of radiocarbon ages for some ofthe catchment deposits may have led to inaccuracies in the trends in the artefact accumulationrates. Various alternatives, involving the way spits were combined into phases of millennialunits, were examined for some sites before accepting those presented (Chapter 6). Theexistence of uneven stratigraphy, sterile layers, disconformities and the integrity of thedeposits were taken into account (cf. Rosenfeld et al. 1981: 11–13).
Any biases in the artefact accumulation rates of individual deposits would have beenextrapolated across to the local artefact accumulation rates. Again, however, variousalternatives were examined before adopting those presented. In calculating the artefactaccumulation rates for the eastern Australian sites (Chapter 7), if any of my assumptions aboutthe published information are in error, there may be inaccuracies in the trends presented forthese regions.
Natural processes
Natural processes which can affect archaeological evidence include chemical, geomorphologicaland biological (animal and vegetation) processes. The effect of weather conditions at the timeof site survey and recording has also been included under this section, although it could beseen as ‘methodological’. These processes can cause the archaeological record to becomebiased in several ways.1. Materials in an archaeological deposit can be disturbed or redistributed by faunal
activity and vegetation growth. Fauna which can affect archaeological traits includebeetles, ants, termites, wasps, cicadas, as well as larger animals such as wallabies,small rodents, rabbits, wombats, bower birds, lyrebirds and emus. People also dugholes in archaeological deposits for various purposes (including burials), clearedareas and caused general treadage and scuffage during habitation of a site.
Upper Mangrove Creek catchment: random sampling units. Possible biases in the archaeological record and data sets
terra australis 21
103

2. Organic materials decay; groundwater causes decomposition of materials.3. Deposits and sandstone in or on which archaeological materials were present can
become totally or partially removed or destroyed by erosion and/or weathering.4. Subsequent sediment deposition or vegetation growth can restrict visibility
and thus hinder visual observation of materials and sites in open as well as shelter contexts.
5. Poor lighting conditions during overcast weather or at the end of the day can affectvisibility of archaeological traits during fieldwork.
6. Charcoal from past bushfires (either natural or humanly-initiated) which has existedin/on the ground for long periods of time (environmental charcoal) can becomeincorporated into more recent archaeological deposits through fluvial and slopeprocesses (cf. Blong and Gillespie 1978).Ironically, the erosion and/or disturbance of sediments (1 and 3 above) probably does
as much ‘good’ as ‘harm’, in that it is these processes which are instrumental in exposingmaterials which are obscured by deposition of sediment and vegetation (4).
Points 3 and 4 have been put forward as explanations for the lower numbers ofarchaeological sites dating to the late-Pleistocene and early-Holocene periods (refer to Chapter2; Worrall 1980: 81–3; Bonhomme 1985: 33; cf. Mellars 1973: 269–70 for similar discussion forPalaeolithic Europe). These points bear on the questions: 1. were all sites that existed at the time of fieldwork found in the random sampling
units during the site surveys and excavations?2. of the sites that were formed in the past, what type and number are no longer likely
to exist?Question 1 relates to questions of visibility and question 2 to processes of destruction.
Each of these circumstances is discussed below, as well as the problem of older ‘environmental’charcoal being incorporated into more recent archaeological deposits.
VisibilityThe visibility of archaeological traits that occur in the catchment can be impaired partially orrestricted totally by vegetation growth and sediment cover (Sullivan 1983: 6). In addition, badlight at the end of the day or in overcast weather can also affect visibility. These in turn can beaccentuated by the factors discussed above under observer bias (inexperience and end-of-daytiredness).
Archaeological deposits in rocksheltersIn rockshelters, archaeological materials can be totally covered by sediment and the mouths ofsmall rockshelters can be obscured by dense vegetation. Recording and test excavatingpotential archaeological deposits in PH shelters has overcome (to a certain extent) some of thedifficulties which result from archaeological materials in rockshelters being totally buried. Asdiscussed in the previous chapter, the results of test excavations of potential archaeologicaldeposits provide an estimate of the number of archaeological deposits in rockshelters whichmay have been missed.
Open archaeological depositsFive open archaeological deposits were found during the random sample survey. Two are onperiphery ridgetops (Delight and Kyola Road) and three in the main valley bottom (Black HandsOD, Palmers Crossing and Willow Tree Gully). The two on the ridgetops were found in areaswith sparse leaf-litter and skeletal soils. Those on the valley bottom were all found in disturbedlocations on deep deposits forming the creek banks (Attenbrow 1997 [1998]). Other open
What’s changing: population size or land-use patterns? The archaeology of Upper Mangrove Creek, Sydney Basin
terra australis 21
104

archaeological deposits probably exist within the random sampling units but are buried underfill in the valley bottoms, and under slopewashed sediments and leaf-litter on the ridgetops andstructural benches on ridgesides (see also Vinnicombe 1984: 110). A recording and testingprogram similar to that for the PH shelters would be required to investigate locations withpotential open archaeological deposit in order to assess how many open archaeological depositsare unrecorded. Unfortunately, as previously stated, this is not possible now in the main valleybottom zones of the catchment, but such a program could be carried out above the storage area.
Isolated finds may provide clues to the occurrence of open archaeological deposits inplaces other than those at which they have been recorded. In addition, site records in manyother regions (e.g., the Hunter Valley and Cumberland Plain to the north and south of thecatchment) indicate that open archaeological deposits are commonly found on river banks andterraces. However, for both ridgetops and structural benches on ridgesides there are nodefinite clues as yet to the specific places where open archaeological deposits may occur in thecatchment. Although studies such as those by Byrne (1983, 1984), Egloff (1984), Packard (1992)and Hall and Lomax (1996) describe site distribution patterns with open artefact scatterspredominantly along ridgetops for many of the NSW east coast forests, a similar pattern hasnot been documented in the Upper Mangrove Creek catchment or other parts of the sandstonecountry of the greater Sydney region (e.g., Vinnicombe 1980; Sefton 1988; Illawarra PrehistoryGroup 1990, 1995, 1996; McDonald 1994; Kinhill Engineers 1995). The reasons for this variancecan be seen in the differences in the geology and terrain whereby different types of potentialsite locations are available in the catchment than in the other NSW east coast forests. The mostsignificant difference is the lack of rockshelters (or the much smaller number of rockshelters)in forests in non-sandstone environments.
Grinding areas and engraved imagesDense understorey shrubs along the creek banks and around rock platforms may obscure theexistence of exposed sandstone surfaces where grinding grooves and engraved imagestypically occur. Grooves and engraved images can also be covered by silt and soil mobilisedby slopewash processes.
DestructionDestruction refers to the removal of archaeological materials, engraved or pigment images, orgrinding areas from their original place of deposition or creation. It can be total or partial.
Worrall, in discussing geoarchaeological issues relevant to the catchment, stated: … that the likelihood of survival of an occupational deposit of a given age decreaseswith time. The relatively small number of early sites located in the catchment may thusbe explained solely in terms of contemporary geomorphic process without recourse tospeculation concerning prehistoric population size. (Worrall 1980: 82–3)
It is suggested that the operation of a process of discontinuous aggradation anddenudation of deposits in the majority of archaeological sites in the catchment may besufficient in itself to explain the trend towards fewer sites from progressively earlierperiods (Worrall 1980: 89).In contrast, other researchers state that it is unlikely that archaeological deposits
within rockshelters, once formed, would have suffered severely from erosion (Hughes andLampert 1982: 19). In the random sampling units, the majority of the archaeological deposits(30 out of 35) were located in rockshelters. Processes affecting archaeological deposits in theopen differ to some extent from those affecting rockshelter deposits.
Upper Mangrove Creek catchment: random sampling units. Possible biases in the archaeological record and data sets
terra australis 21
105

What’s changing: population size or land-use patterns? The archaeology of Upper Mangrove Creek, Sydney Basin
terra australis 21
106
Archaeological deposits in rocksheltersWorrall (1980: 81–2) made three points about archaeological deposits in rockshelters: 1. Rockshelters in valley floor situations that were filled during deposition of Unit A
(late-Pleistocene in age) may have been repeatedly filled or flushed or the depositcliffed during events of Unit B deposition (Holocene events). Worrall refers toBracken and Deep Creek as examples where this could have occurred; both sites arein the storage area and outside the random sampling units.
2. Archaeological deposits in rockshelters which are on slopes may be subject tointermittent episodes of scour and fill of varying intensity. Worrall places Black HandsShelter in this category. Worrall adds that the probability of a major scour event severelytruncating or flushing the deposit from a rockshelter is obviously a function of time.
3. The activation or cessation of deposition in rockshelters which are located in taluszones or cliff faces (on slopes) may be closely related to the operation of structuralcontrols and thus may be relatively stable.The situation, however, is more complex than Worrall’s tripartite breakdown
suggests. The stratigraphy at Deep Creek does not indicate that its deposits have been affectedby filling, flushing or cliffing. The base of the deposits is 3m above present creek level andabove flood level. In addition, it is a relatively large shelter (12.4m × 5m) and inside thedripline the shelter is dry and not open to slopewash processes. The deposits at Brackencomprise alluvium derived principally from slopewash (Hughes and Sullivan 1979: 10).Though subject to inundation and deposition of sediments by low-energy floodwaters, therewas no evidence of cliffing in the stratigraphy (contrary to Worrall’s statement, 1980: 64),scours or erosional lags of gravel and artefacts.
The degree to which the catchment rockshelters are exposed to slope processes alsodepends on the direction in which their mouth faces (i.e., downslope or across slope) andwhether the rockshelter has closed or open sides. Rockshelters facing downslope and thosewhich have closed sides are less prone to slopewash processes than those facing otherdirections and with open sides.
To assess the processes operating in the rockshelters in the random sampling units, itwas recorded whether or not each rockshelter was: 1. on the valley floor and liable to inundation during floods; or,2. on a ridgeside and its morphology was such that it was vulnerable to slope processes
which could scour its deposits.In many rockshelters, the deposit is partially affected by erosional/slope processes,
for example, along the dripline from water coming over the overhang, or by water comingdownslope and entering the rockshelter from an ‘open’ side (Table 5.1). In these instances,only a small part of the deposit is affected, not the entire shelter floor.
Worrall (1980: 40, 73) said, on the basis of a stratigraphic section in a road cuttingdownslope of Black Hands, that the ‘shelter deposits … comprise the infill sediments of aprior scour channel directed along the back wall of the shelter’. Worrall’s interpretationsuggests the archaeological deposits built up (i.e., habitation took place) in a scour channelwithin the rockshelter. The stratigraphic sections of the deposit excavated within Black HandsShelter (squares A and B) and just outside the dripline (square F) do not support aninterpretation that earlier materials were scoured out and the later archaeological deposit builtup within a scour channel. Unless the hypothesised torrent swept through the rockshelterwith such force that it removed all artefacts and small rubble which was deposited within theshelter before the scouring event, a layer of lagged rubble with an artefact density higher thanother levels would be expected. No lag of artefacts or rubble was found within or at the baseof the excavations to suggest large amounts of sediment had been removed. Worrall may have

misinterpreted the sides of the unknown excavator’s trench in Black Hands Shelter (seeChapter 3, Excavation strategy and methods) as a scour channel.
Stone artefacts occur outside the rockshelter for a distance of at least 2m across theslope and 2m downslope (i.e., in square F outside the shelter and in the 70m contour roadcutting below the shelter). These artefacts are just as or more likely to be from activities carriedout within and in close proximity to the rockshelter as from geomorphological movement ofartefacts downslope. Several artefacts were recovered from the slightly steeper slopes further
Upper Mangrove Creek catchment: random sampling units. Possible biases in the archaeological record and data sets
terra australis 21
107
TTaabbllee 55..11 Upper Mangrove Creek catchment: random sampling units. Archaeological deposits in rockshelters and
geomorphological processes. [1] Other details about radiocarbon ages are provided in Table 6.1.
SITE NAME RADIOCARBON DEPOSIT LIABLE SHELTER OPEN TO SLOPE SHELTER MOUTH FACES
AGE (BP) [1] TO INUNDATION PROCESSES — DEPOSITS DOWNSLOPE — FLOOR
EXPOSED TO SCOURING DEPOSITS NOT SUSCEPTIBLE
SUBSTANTIAL LIMITED TO SCOURING
VALLEY BOTTOM
Anadara x
Axehead x
Black Hands 3040±85 x
Button x
Geebung x
Harris Gully x
Loggers 11,050±135 x x
Mangrove Mansions x
Ti-tree 490±50 x
RIDGESIDE
Bird Tracks x
Boat Cave 2370±60 x
Caramel Wave 1430±60 x
Dingo 1840±60 x
Elongated Figure 1810±80 x
Firestick x
Kangaroo and Echidna 6700±150 x
Low Frontage x
McPherson x
One Tooth 350±40 x
Two Moths x
Venus 560±50 x
White Figure 5230±70 x
Wolloby Gully 400±60 x
RIDGETOP
Boronia 1880±60 x
Delight x
Elngarrah x
Emu Tracks 2 x
Sunny 3500±80 x
Token Male x
Uprooted Tree 8430±130 x
Totals — No. 1 2 11 16
% 3 7 37 53
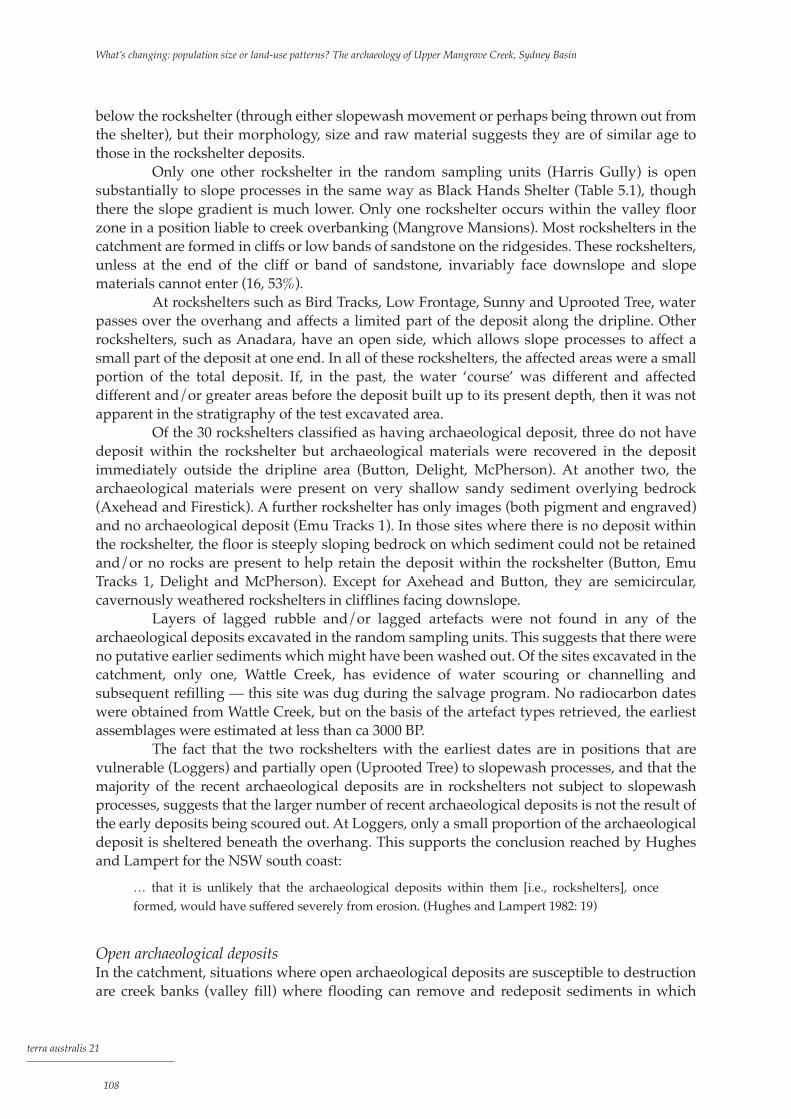
below the rockshelter (through either slopewash movement or perhaps being thrown out fromthe shelter), but their morphology, size and raw material suggests they are of similar age tothose in the rockshelter deposits.
Only one other rockshelter in the random sampling units (Harris Gully) is opensubstantially to slope processes in the same way as Black Hands Shelter (Table 5.1), thoughthere the slope gradient is much lower. Only one rockshelter occurs within the valley floorzone in a position liable to creek overbanking (Mangrove Mansions). Most rockshelters in thecatchment are formed in cliffs or low bands of sandstone on the ridgesides. These rockshelters,unless at the end of the cliff or band of sandstone, invariably face downslope and slopematerials cannot enter (16, 53%).
At rockshelters such as Bird Tracks, Low Frontage, Sunny and Uprooted Tree, waterpasses over the overhang and affects a limited part of the deposit along the dripline. Otherrockshelters, such as Anadara, have an open side, which allows slope processes to affect asmall part of the deposit at one end. In all of these rockshelters, the affected areas were a smallportion of the total deposit. If, in the past, the water ‘course’ was different and affecteddifferent and/or greater areas before the deposit built up to its present depth, then it was notapparent in the stratigraphy of the test excavated area.
Of the 30 rockshelters classified as having archaeological deposit, three do not havedeposit within the rockshelter but archaeological materials were recovered in the depositimmediately outside the dripline area (Button, Delight, McPherson). At another two, thearchaeological materials were present on very shallow sandy sediment overlying bedrock(Axehead and Firestick). A further rockshelter has only images (both pigment and engraved)and no archaeological deposit (Emu Tracks 1). In those sites where there is no deposit withinthe rockshelter, the floor is steeply sloping bedrock on which sediment could not be retainedand/or no rocks are present to help retain the deposit within the rockshelter (Button, EmuTracks 1, Delight and McPherson). Except for Axehead and Button, they are semicircular,cavernously weathered rockshelters in clifflines facing downslope.
Layers of lagged rubble and/or lagged artefacts were not found in any of thearchaeological deposits excavated in the random sampling units. This suggests that there wereno putative earlier sediments which might have been washed out. Of the sites excavated in thecatchment, only one, Wattle Creek, has evidence of water scouring or channelling andsubsequent refilling — this site was dug during the salvage program. No radiocarbon dateswere obtained from Wattle Creek, but on the basis of the artefact types retrieved, the earliestassemblages were estimated at less than ca 3000 BP.
The fact that the two rockshelters with the earliest dates are in positions that arevulnerable (Loggers) and partially open (Uprooted Tree) to slopewash processes, and that themajority of the recent archaeological deposits are in rockshelters not subject to slopewashprocesses, suggests that the larger number of recent archaeological deposits is not the result ofthe early deposits being scoured out. At Loggers, only a small proportion of the archaeologicaldeposit is sheltered beneath the overhang. This supports the conclusion reached by Hughesand Lampert for the NSW south coast:
… that it is unlikely that the archaeological deposits within them [i.e., rockshelters], onceformed, would have suffered severely from erosion. (Hughes and Lampert 1982: 19)
Open archaeological depositsIn the catchment, situations where open archaeological deposits are susceptible to destructionare creek banks (valley fill) where flooding can remove and redeposit sediments in which
What’s changing: population size or land-use patterns? The archaeology of Upper Mangrove Creek, Sydney Basin
terra australis 21
108

archaeological materials may have accumulated, and ridgesides where slope processes operate.Relatively flat ridgetops are less prone to these processes.
Valley fill. Worrall (1980: 56) divided the valley fill in the catchment into two majorunits, A and B. The oldest, Unit A, she said (1980: 58) is of late-Pleistocene age, and Unit B isHolocene in age (1980: 74). Worrall (1980: 81) suggested that prehistoric vegetation cover onthe Holocene Unit B deposits was probably shrub thickets and thus the likelihood of sitesbeing formed on these deposits was small.
After completion of the salvage program, bulldozing operations took place on thevalley floor. Inspections at disturbed locations resulted in the detection of several openarchaeological deposits (see previous chapter and Attenbrow 1997 [1998]). They did notappear to be as rich in artefacts as sites such as Loggers and Black Hands, but insufficientwork was undertaken on these sites prior to inundation to place any credence on suchobservations. The majority, if not all, of the more recently recorded open archaeologicaldeposits on the valley bottom are on what I believe Worrall calls Unit B deposits. (No map ofthe areal extent of Unit A and Unit B deposits was presented by Worrall.)
The geomorphological processes involved in the accumulation and scouring of valleyfills was probably of sufficient magnitude to have caused the loss of many sites of all ages.Radiocarbon dates for valley fill in the catchment indicate that fill dating back to at least7000 BP is present (Sullivan and Hughes 1983: 123, Table 2). It is possible that in situ areas offill of an older age have survived and that such deposits contain archaeological materials.
Ridgesides. Open archaeological deposits on the slopes of ridgesides would be subjectto natural geomorphological processes and occasionally to periods of accelerated erosion(Bonhomme 1985). Bonhomme (1985: 14) reasoned that ‘as a result, the material evidence ofopen sites is continually being reworked and probably lost from the slopes altogether’.Although Bonhomme’s first observation may be true, the present archaeological recordindicates that all materials have not been lost.
It is clear that the surviving open archaeological deposits in the catchment are unlikelyto comprise a comprehensive record of such sites that have existed over time — much less sothan the rockshelter deposits, which have greater protection from destruction. The question as towhether the rockshelter deposits by themselves can be accepted as representing the changingtrends in catchment habitation patterns over time is raised again when interpretations andexplanations for the documented archaeological trends in the catchment are discussed.
Further comments on visibilityThe foregoing discussion highlights the fact that, irrespective of whether some sites have beendestroyed in the past, all of the archaeological sites that presently exist in the randomsampling units are unlikely to have been recorded during the fieldwork undertaken. This is asituation which no doubt exists for all archaeological programs. For some sets of data — inparticular, the archaeological deposits and images in rockshelters — estimates of the numbersunrecorded can be made. It can be assumed that the images which were overlooked do notcontain numerous figures, but it cannot be assumed that unexcavated potential archaeologicaldeposits do not have abundant archaeological materials (e.g., as found in Bracken and Sunny).For traits on open deposit and open rock, there is, as yet, no data on which to estimate thenumber of unrecorded sites.
With respect to rockshelters, it would be fruitful to undertake an intensive testingprogram of the PH shelters to assess more accurately the numbers of unrecorded archaeologicaldeposits and images in rockshelters, and to test Szpak’s conclusion ‘that it must be assumedthat all these rockshelters have been used’ (1997: 112). A random sample of PH shelters could beselected, their deposits test excavated and the walls re-inspected for images.
Upper Mangrove Creek catchment: random sampling units. Possible biases in the archaeological record and data sets
terra australis 21
109

To investigate more rigorously the lack of recorded open archaeological depositsdue to visibility problems, a program of site survey followed by shovel and/or backhoetesting in open locations with potential archaeological deposits could be undertaken.Fieldwork could perhaps specifically target flat areas along creek banks, structural bencheson ridgesides, and ridgetops. Since most of the alluvial flats in the catchment valley bottomzones have been inundated, a testing program in such locations would have to beundertaken above the storage area in the catchment, downstream of the dam wall, or perhapsin an adjacent river valley.
Incorporation of older charcoalThe mouth of Black Hands Shelter faces across-slope, which means the shelter deposit mayhave been prone to slopewash processes at some stages of their accumulation, and toincorporation of ‘environmental charcoal’ from the surrounding slopes. If charcoal in theshelter deposit includes material that had been accumulating on the surrounding slopes forcenturies, radiocarbon determinations received for the submitted charcoal samples mayindicate an age that is older than the real age of the excavated level from which they werecollected (cf. Blong and Gillespie 1978). Consequently, any cultural materials associated withthat dated sample may be placed incorrectly into a period earlier than that to which theybelong. However, it is possible that the submitted sample from near the base of Black Handswas not contaminated by environmental charcoal because, for example, the surface of theshelter deposit at that time was higher than the surrounding land surface. Alternatively, if itwas, any charcoal washed in from the surrounding slopes may have been very much less thanthat from Aboriginal fires built within the rockshelter, and its influence on the age of the‘combined’ sample was not critical. What can be said is that the age obtained for the charcoalsample submitted from near the base of Black Hands (3040±85 BP [SUA–932] from a depth of90–100cm) is consistent with the type of artefacts present at that depth and the sequence ofassemblages above it.
It is unlikely that slopewashed charcoal has contaminated many of the otherrockshelter deposits except areas around and outside the dripline areas. Excavated pits wereplaced well inside the rockshelters except at Loggers and in the three cases where no deposit,or no substantial depth of deposit, existed inside the rockshelter. At Delight and Boat Cave,the only feasible place to excavate was in the dripline zone, and at McPherson the test pit hadto be placed in front of the shelter. Of these sites, charcoal from only Boat Cave was used fordating purposes. The charcoal submitted for dating other archaeological deposits came frompits well inside the rockshelters and most probably derives from fires built within therockshelters. In addition, in all samples, the largest pieces of charcoal available weresubmitted for dating.
A radiocarbon age of 2370±60 BP (Beta-81625) was obtained for a charcoal samplefrom near the base of the excavated pit at Boat Cave. This is earlier than my estimate of<1000 BP, based on the artefact types present and the nature and depth of deposit(Attenbrow 1987: Table 7.2). It may be that the earlier than estimated age is due to theinclusion of older charcoal from the ridgeside above (cf. Blong and Gillespie 1978) orsimply that the deposits accumulated more slowly than my extrapolations and calculationspredicted.
Ages were not obtained from either of the excavated open archaeological deposits onthe valley bottom (Black Hands and Stockyards Open Archaeological Deposits). At StockyardsOAD, which was outside the random sampling units, a Bondi point was found whichsuggests the valley fill and habitation in that location pre-dates ca 1600 BP (see above).Charcoal in these two locations was scattered throughout the deposit — no hearths or hearth-
What’s changing: population size or land-use patterns? The archaeology of Upper Mangrove Creek, Sydney Basin
terra australis 21
110

like features were recorded. Using charcoal from these open archaeological deposits to estimatetheir age was not considered warranted.
Focus on rockshelters
Because of the few open archaeological deposits initially found, and the little if any datablematerial in those recorded, the analyses of changes over time in habitations has focused on thearchaeological deposits in rockshelters. However, many aspects about the use of thecatchment rockshelters are not known: for example, the extent to which rockshelters ratherthan open locations were used for habitation purposes; what other functions besides beinghabitations/campsites did the rockshelters serve; what size groups visited the catchment andused the rockshelters; and was the use of rockshelters related to seasonal or climaticconditions, or other events. Even for the early colonial period, there are no direct observationsabout life and activities undertaken in the catchment that can be used as a ‘benchmark’ fromwhich to work backwards to assess changes over time.
Historical observations indicate that Aboriginal people in many parts of Australiapreferred living in the open rather than in enclosed structures (Koettig 1976: 142–60). Even so,where they were available, rockshelters were commonly used, in particular, as refuges fromrain, sun or wind, though not specifically from cold (e.g., Mulvaney 1960: 53; White andPeterson 1969: 59; Koettig 1976: 142–60; Jones and Johnson 1985a: 167; Flood 1997: 194–5). Innorthern Australia, rockshelters were used particularly in the wet season when travel wasdifficult and relatively permanent camps were established (Tresize 1971: 7, and Haviland andHaviland 1979 in Morwood and Hobbs 1995a: 179; Veth 1993: 77; Flood 1997: 194).
In the Sydney region, McDonald (1994: 348–9) suggested that open locations wouldhave been preferred campsites at the time of British colonisation as the historical records forthis region indicate there were large territorial groupings. However, the early historicalsources for the coastal zone between Broken Bay and Botany Bay indicate that in terrain whererockshelters are prolific, they were frequently used as campsites (e.g., Bradley 1786–92 [1969:74,140]; Extract … 1788 in HR.NSW 1892 [1978: 222]; Worgan 1788 [1978: 15–17]; Tench 1789:80 [1961: 47–8]; White 1790 [1962: 157]; Hunter 1793 [1968: 59–60, 80]; Collins 1798 [1975: 460]).In addition, although large groups were occasionally observed in this area — up to 300 peoplewere seen on some occasions (Collins 1798 [1975: 25]; Tench 1789: 90–1 [1979: 52]) — they were‘seldom seen more than 20 or 30 & frequently two & three together’ (Bradley 1786–92 [1969]:141–2). Resource abundance in the catchment would have been much less than in the coastalzone, where marine/estuarine resources are available in addition to terrestrial plants andanimals. The size of groups visiting the catchment would have been at the smaller end ofthe scale.
In the catchment, it is likely that opportunities would have been taken to use anearby rockshelter rather than constructing a hut of bark or other materials, especially inperiods of bad weather (e.g., extremely wet, rainy, cold, windy or very hot weather). Alongthe NSW central coast and its hinterland, such conditions are not restricted to anyparticular season. Frosts and fog can be relatively thick on the catchment’s river flats inwinter (pers. obs.) and so those areas would most probably have been avoided at that timeof the year. Catchment rockshelters were probably used in all seasons, by groups of varyingbut relatively small size.
Climatic changes that occurred throughout the Holocene (Chapter 9) may haveaffected the degree to which each type of location was inhabited in different periods of time(cf. Stockton and Holland 1974: 56, 60; cf. Hiscock 1988b: 228). McDonald (1994: 75) said that
Upper Mangrove Creek catchment: random sampling units. Possible biases in the archaeological record and data sets
terra australis 21
111

the decreased artefact accumulation rates in the catchment in the first millennium BP is‘suggestive of a change in preference to outdoor camping, or more specifically outdoorknapping’ and ‘could be interpreted as indicating that there was a shift in settlement patterns,from shelter locations to open locations during the last millennium’.
However, it is not possible to say from the historical and (as will be seen later) thearchaeological evidence whether rockshelters were used more frequently than open locations,and/or whether the use of rockshelters versus open locations remained constant throughoutthe Holocene. It is thus not possible to say whether rockshelters by themselves provide anaccurate or biased record of the changing use of the catchment over time. In general, however,rockshelter deposits are less prone to destruction than open deposits. The catchmentrockshelter deposits therefore provide reliable evidence on which to make statements aboutchanges in the rate at which habitations were established in rockshelters, the number ofhabitations in rockshelters in each time period, and the rate at which artefacts accumulatedin rockshelters. Moreover, as will be seen in the final chapters, other behaviours, besidespreference for either open or rockshelter camping locations depending on climatic conditions,can be shown to account for increases and decreases in the habitation and artefact indices.
Discussion
This study of factors that are likely to have influenced the results of analyses suggests that it ishighly likely there are unrecorded sites in the random sampling units due to observer bias andvisibility problems and that some sites (particularly open archaeological deposits) will havebeen destroyed in the past or remain buried. The exact way in which this knowledge effectsthe results presented in later chapters is not entirely clear. However, the number and densityof locations and/or archaeological traits from all time periods is likely to have been higher inthe past than presently exists, and to be higher than currently documented.
The incorporation of older ‘environmental’ charcoal into archaeological deposits mayhave occurred at some rockshelters, but excavated pits were usually placed away from thedripline zone and outside scoured and other zones where such contamination could occur.Radiocarbon determinations from such charcoal samples would give an age older than the‘real’ age of the associated stone artefact assemblage. Thus, if such situations do occur, the biasintroduced by the incorporation of older ‘environmental’ charcoal will not produce a trendtowards a greater number of more recent habitations.
Comparison between results from random sampling units, storage area andthe total catchmentComparing the results from the random sampling units, the storage area and the totalcatchment enables a number of comments to be made about the results of the random samplesurvey (Fig. 5.1). The ‘total catchment’ consists of all sites in the catchment; that is, those in therandom sampling units, in the storage area, as well as all other recorded sites outside thoseintensively surveyed areas.
Archaeological traits In all three data sets (random sampling units, storage area and the total catchment),archaeological deposits are the most common trait. However, they represent a greaterpercentage of the traits in the storage area (73%) than in the other two data sets (44% and 48%respectively — Fig. 5.1A).
What’s changing: population size or land-use patterns? The archaeology of Upper Mangrove Creek, Sydney Basin
terra australis 21
112
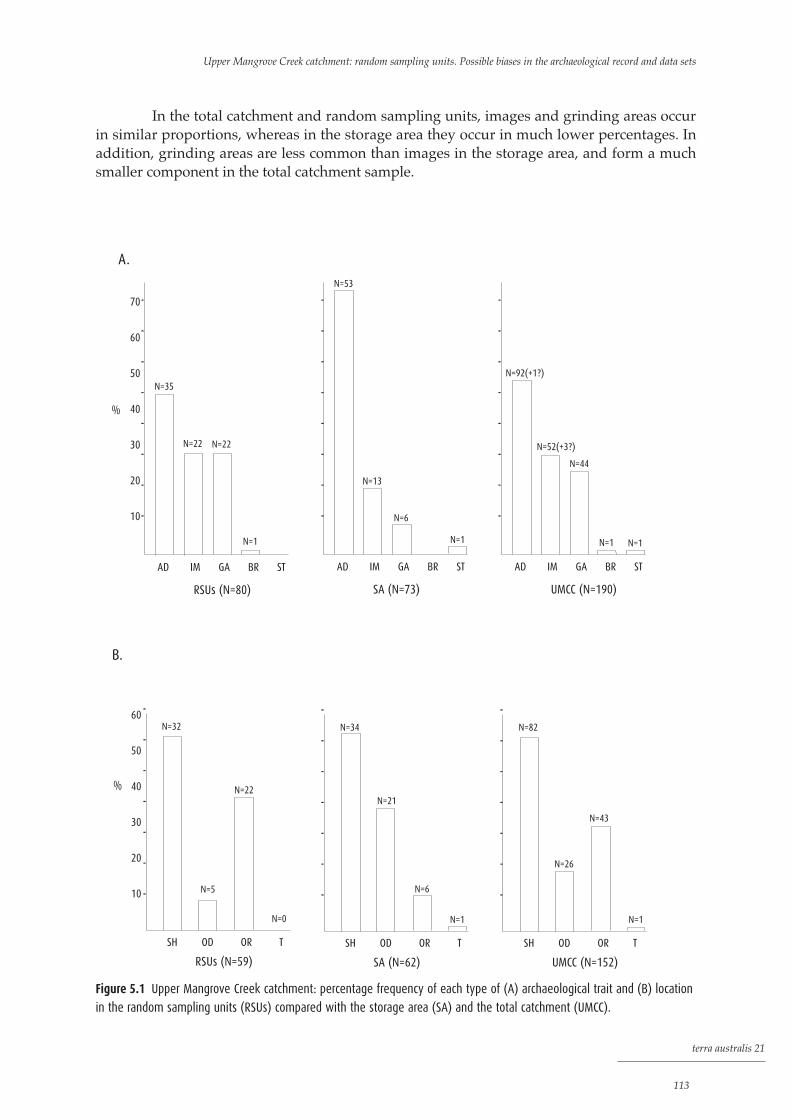
In the total catchment and random sampling units, images and grinding areas occurin similar proportions, whereas in the storage area they occur in much lower percentages. Inaddition, grinding areas are less common than images in the storage area, and form a muchsmaller component in the total catchment sample.
Upper Mangrove Creek catchment: random sampling units. Possible biases in the archaeological record and data sets
terra australis 21
113
70
60
50
40
30
20
10
%
AD IM GA BR ST
RSUs (N=80)
N=35
N=22 N=22
N=1
AD IM GA BR ST
SA (N=73)
N=53
N=13
N=6
N=1
AD IM GA BR ST
UMCC (N=190)
N=92(+1?)
N=52(+3?)
N=44
N=1N=1
60
50
40
30
20
10
%
RSUs (N=59)
N=32
N=5
N=22
N=0
SH OD OR T
SA (N=62)
N=34
N=21
N=6
N=1
SH OD OR T
UMCC (N=152)
N=82
N=26
N=43
N=1
SH OD OR T
B.
A.
Figure 5.1 Upper Mangrove Creek catchment: percentage frequency of each type of (A) archaeological trait and (B) location
in the random sampling units (RSUs) compared with the storage area (SA) and the total catchment (UMCC).

LocationsIn all three data sets, rockshelters are the most commonly recorded location (random samplingunits 54%, storage area 55%, total catchment 54%). The percentage of open deposit and openrock in each sample varies; for example, the storage area has a higher percentage of opendeposit sites and a lower percentage of open rock sites than the random sampling units (Fig.5.1B). This is probably due to the fact that the storage area: 1. has many large alluvial flats (where open archaeological deposits are more likely to
occur); 2. has a greater degree of ground disturbance (and hence greater visibility of open
archaeological deposits) than ridgesides and the periphery ridgetops; and, 3. is principally within the Narrabeen Group of sandstones and has less area of
Hawkesbury sandstone than the random sampling units. Hawkesbury sandstoneoverlies the Narrabeen Group and occurs only on the ridgetops and upper ridgesides inthe catchment. In the Sydney/Hawkesbury region, most grinding areas and openimages (engravings) are recorded on Hawkesbury sandstone (Vinnicombe 1980 XI: 5–6;pers. obs.).The selected sampling strategy was adopted so that an unbiased, and hopefully
representative, sample of not only the valley bottoms (the alluvial flats and lower ridgesides)but also the middle and upper ridgesides and ridgetops was included in the survey program.The above comparison between the data sets from the storage area, the random samplingunits and the total catchment indicates that the valley bottoms by themselves are unlikely tocontain an unbiased or representative sample of the archaeological evidence within the totalcatchment.
Problems brought about by restricted visibility and destruction of archaeologicaltraits are common to all three data sets. Thus, the comparison does not help in determining theeffect of these factors on the ability to detect sites in the random sampling units. However, thecomparison does validate the need for the fieldwork to have been undertaken outside thestorage area and for the catchment to be the area of study for this project.
What’s changing: population size or land-use patterns? The archaeology of Upper Mangrove Creek, Sydney Basin
terra australis 21
114

terra australis 21
115
Radiocarbon ages were obtained for 15 of the 35 archaeological deposits in the randomsampling units (Table 6.1). Eleven of these ages were reported in Attenbrow 1987 (Table 7.1)and an additional four were obtained in 1995. All dated samples were charcoal. The depthfrom which each sample came is shown in the tables in Appendix 2. Radiocarbon ages forSUA-1124, SUA-1125 and SUA-1206 from Loggers Shelter were revised after completion of thesalvage excavation report and the ages given for these samples in Table 6.1 differ from those inAttenbrow 1981 (p. 70).
The earliest date, 11,050±135 BP (SUA-931), which comes from the base of LoggersShelter, provides a terminal Pleistocene date for Aboriginal use of the Upper Mangrove Creekcatchment. Though SUA-931 provides the earliest evidence for occupation of the catchment,earlier dates from other sites in Australia, and particularly from the NSW central and southcoasts, indicate that people were inhabiting coastal south-eastern Australia well before thistime (Appendix 4, Table A4/2).
For this study, the 11,000-year period of occupation in the catchment has beendivided into four phases based on typological and raw material changes in the artefactassemblages (Table 3.8). In addition, to document changes at different times of thearchaeological record at a finer scale, a millennial sequence was calculated for each of thearchaeological deposits using depth/age curves (Appendix 2 has calculations).
The stone artefact assemblages in 27 of the archaeological deposits (all in rockshelters)were assigned to a particular phase or phases on the basis of radiocarbon ages and/ordiagnostic artefacts and assemblage attributes (Table 6.2, Chapter 3). Three other archaeologicaldeposits in rockshelters without stone artefacts were assigned to a particular phase or phasesusing other criteria: for Bird Tracks and Two Moths, the phase in which habitation occurredwas estimated on the depth of deposit (see Chapter 3); for Firestick, the state of preservation ofthe modified wood suggests a recent date and it was assigned to Phase 4.
None of the open archaeological deposits were radiocarbon-dated; nor was itpossible to assign any of them to specific phases or millennia. Delight OD, Kyola Road,Palmers Crossing North and Willow Tree Gully each had small numbers of undiagnosticartefacts in unstratified or disturbed deposits (Tables 4.5 and 4.7). At Black Hands OD, theground fragment suggests only that this location was used at least within the last 4000 years.These five archaeological deposits are excluded from the temporal analyses, and the data setanalysed in this chapter consists of 30 archaeological deposits in rockshelters.
Temporal distribution: quantitative changesin the Upper Mangrove Creek catchment
6

For the salvage program, I presented two sets of data which illustrated changes in thenumber of archaeological deposits over time (Attenbrow 1981: Tables 7.1 to 7.4; see alsoAttenbrow 1982b: 76, Tables 2 to 4, but note in Table 2, the boundary between Early andMiddle Bondaian is missing and the heading for the first half of MB/IIB is incorrectly placed).The first data set included 15 archaeological deposits, eight of which had radiocarbon agesand seven of which had their time of establishment estimated on the basis of artefact typesand/or stone materials. The second data set had 26 archaeological deposits, which includedthe first data set, plus another 11 which had much smaller artefact assemblages. Assigning thetime of establishment of the additional 11 sites to specific periods was thus more speculativethan those in the first data set.
What’s changing: population size or land-use patterns? The archaeology of Upper Mangrove Creek, Sydney Basin
terra australis 21
116
TTaabbllee 66..11 Upper Mangrove Creek catchment: random sampling units. Radiocarbon dates, all from full-sized charcoal
samples, calibrated using Radiocarbon Calibration Program Rev 4.3 (Stuiver and Reimer 1993b; Stuiver et al. 1998) and
rounded to nearest five years.
SITE NAME PROVENANCE LAB. NO. CONVENTIONAL CALIBRATED AGE (BP)
AGE (BP) INTERCEPT/S TWO SIGMA
Black Hands SH BH/B/10 SUA-932 3040± 85 3315, 3310, 3255 3445–2960
Boat Cave BC/Ta/6 Beta-81625 2370± 60 2350 2710–2210
Boronia BoS/Td/4 SUA-2169 1880± 60 1820 1965–1630
Caramel Wave CW/T1/6 SUA-2173 1430± 60 1310 1415–1260
Dingo DiS/Tb/8 SUA-2166 1840± 60 1815, 1790, 1780, 1755, 1740 1920–1610
Elongated Figure EF/Ta/7 SUA-2170 1810± 80 1715 1920–1535
Kangaroo and Echidna KE/T2a/4 SUA-2172 6700±150 7570 7820–7315
Loggers LS/F/2 SUA-1124 530± 90 540 665–335
LS/F/4 SUA-2165 2480± 60 2705, 2635, 2610, 2595, 2535, 2492 2750–2350
LS/F/7 SUA-2412 7950± 80 8930, 8920, 8895, 8885, 8850,
8830, 8775 9025–8545
LS/F/9 SUA-1125 8380±120 9465, 9450, 9430, 9335 9550–9030
LS/F/13 SUA-1206 9450±120 10,690, 10,645 11,165–10,290
LS/F/20-21 SUA-931 11,050±135 13,015 13,385–12,660
One Tooth OT/T/3 Beta-81626 350± 40 435, 350, 335 505–305
Sunny SuS/Ta-b/13
+Tb/12 SUA-2171 3560± 80 3835 4085–3640
Ti-tree TTS/T2/3 Beta-81627 490± 50 520 620–470
Uprooted Tree UTS/T1b/15 SUA-2174 8430±130 9470 9675–9035
Venus VS/Tc/3 Beta-81628 560± 50 545 650–510
White Figure WF/Tb/8 SUA-2167 5230± 70 5985, 5970, 5945 6185–5775
Wolloby Gully WGS/Ta/4 SUA-2168 400± 60 480 535–310

Changes over time for these two storage area data sets were presented using a four-phased sequence based on typological changes in the stone artefact assemblages. On the basisof the first data set, I stated that ‘there was an increase in the number of shelters which wereused over time’, but that ‘more new shelters were occupied during the latter half of the MiddleBondaian phase than in other phases’ (Attenbrow 1981: 127; see also Attenbrow 1982b: 76).Inclusion of ‘the more speculative data’ to form data set 2 suggested ‘there was a gradualincrease in the number of new shelters being occupied throughout the Bondaian periodalthough during the Late Bondaian period there was a marked increase’; that is:
… very few shelters were occupied before 5000 years ago. About 5000 years ago the number ofnew shelters being occupied began to increase. Between 2750 and 1200 BP there may have beena greater number of [new] shelters occupied than during the other phases of the Bondaianperiod, or if the more speculative data is accepted, during the Late Bondaian phase there was adramatic increase in the number of new shelters being occupied. (Attenbrow 1981: 127–8)
For the salvage program, artefact accumulation rates were calculated only forLoggers Shelter (Attenbrow 1981: 73–4, Tables 6.4 and 6.5). In this rockshelter, there was either‘a gradual increase in the number of artefacts discarded, then a decrease prior to a final increase’or ‘a continuing increase in the amount of stone artefacts discarded over time, particularly in thelatter phase of occupation’ (Attenbrow 1981: 129; 1982b: 77). I noted that the trend towardsincreasing artefact discard probably would not be seen in the most recent phase at Mussel orDeep Creek, where artefact densities in the upper units were significantly lower than in themiddle units. In the salvage report, I concluded:
… before any suggestions can be made as to how the evidence from UMC should beinterpreted, the combined evidence from individual sites, as well as the seeming increase in thenumber of sites occupied over time, will have to be considered … to see if the evidence suggestsan increase in the intensity of occupation of the area as a whole. (Attenbrow 1981: 131)
I later suggested that if the low artefact densities in the upper levels of sites such asDeep Creek and Mussel did reflect a low rate of artefact discard, then they may ‘cancel out’ thehigher numbers in the upper levels in Loggers when calculating the trends in the catchment asa whole (Attenbrow 1982b: 77).
These statements are reviewed below in the light of archaeological evidence fromthe random sampling units. The terminology used differs from that in the salvage report.The terms ‘archaeological deposit’ and ‘habitation’ are used rather than ‘site’ or ‘shelter’.‘Archaeological deposits’ were initially assumed to be the debris from activities or processesassociated with habitation and thus, in this and the following chapters, sites witharchaeological deposit are referred to as ‘habitations’. Sites with archaeological deposit arealso referred to as ‘inhabited sites’. Whether some of these ‘habitations’ were base camps andothers transit camps or locations where other daytime activities were undertaken is exploredin the final chapter, when explanations and interpretations for dramatic changes in thecatchment’s habitation and artefact indices are proposed.
In the salvage report, I specifically used the term ‘shelter/s’ to indicate that thedocumented trends related only to habitation in rockshelters, and that the trends in the use ofopen locations for habitation purposes may have been quite different. I still assume this maybe the case, though the term ‘habitation’ has been used in the title to data sets and indices toindicate that the quantitative changes relate only to archaeological deposit (cf. Ross 1985: 84)and not to the other types of archaeological trait recorded in the catchment. On occasionswhere the term ‘site’ is used, it refers only to those sites with archaeological deposit (i.e.,habitations or inhabited sites). Unless otherwise stated, the term ‘artefact’ refers to stone artefacts(flaked and ground) and does not include implements of organic materials.
Temporal distribution: quantitative changes in the Upper Mangrove Creek catchment
terra australis 21
117

Data from the random sampling units are presented in two different ways: 1. according to typological phases (as used in the salvage report); and, 2. according to successive millennia.
These are referred to as the phased sequence and the millennial sequencerespectively. Using these two different methods of presentation illustrates how the trendsdocumented in each of the habitation and artefact indices can vary in a manner which maylead to different interpretations, particularly in respect to the timing and coincidence ofvarious changes in the archaeological record (cf. Frankel 1988; Ulm and Hall 1996).
The data sets
The data sets include all deposits for which it was possible to assign an age of establishmentand abandonment, whether through radiocarbon determinations or other methods (Chapter3, Table 6.2). To use only the archaeological deposits with radiocarbon ages was consideredinappropriate as they are a biased selection of the habitations. For my PhD thesis, thepercentage of habitations with small assemblages in shallow deposits that was selected forradiocarbon dating was lower (i.e., 37%) than the percentage of multi-phase (multi-millennium) habitations with abundant artefacts.
McDonald (1994: 76–8) was critical of the inclusion of the undated habitations withsmall numbers of artefacts in the habitation indices and, for her study, she recalculated theindices using only seven sites with >100 excavated artefacts. On this basis, she concluded that nonew shelters were established and there was no increase in the number of habitations used in thesecond and first millennia BP — thus showing ‘a consistent or stable use of the same sheltersover the last three thousand years’ (McDonald 1994: 77). However, in her recalculations,McDonald ignored the existence of four habitations which have radiocarbon ages, two of whichare in the second millennium BP and one in the first millennium BP. There is no reason whyhabitations with radiocarbon ages should not be included in any reanalysis of the data. Inclusionof these sites into her data set would show an increase in habitation establishment and numberof habitations used in the last 2000 years, albeit still not as substantial as the increase seen inFigure 6.2B — but still an increase. Inclusion of the undated habitations with shallow depositsand small numbers of artefacts in my 1987 data sets, and interpretation of the land and resource-use patterns in the catchment based on ‘all datable deposits’, is supported by the four additionalradiocarbon ages obtained in 1995 (see Chapter 3).
The following analyses are based therefore on data sets which include all ‘possible’archaeological deposits; that is, all deposits for which it was possible to assign an age ofestablishment and abandonment. Trends in both of the habitation indices have also beenpresented for data sets including only the habitations with radiocarbon ages. Use of these datasets is not considered appropriate for interpreting the catchment’s archaeological record, butthey have been included to show the trends if such data sets are used.
The indices
To measure change over time in the numbers of habitations (archaeological deposits) andstone artefacts, the following data sets and indices were calculated for both the phasedsequence and the millennial sequence: Archaeological deposits (habitations): 1. the number of habitations established in successive time periods;2. the rate of habitation establishment in successive time periods; 3. the number of habitations used in successive time periods;
What’s changing: population size or land-use patterns? The archaeology of Upper Mangrove Creek, Sydney Basin
terra australis 21
118

4. the rate of habitation establishment in each topographic zone in successive timeperiods;
5. the number of habitations used in each topographic zone in successive time periods;6. millennial growth rates for habitation establishment and number of habitations used
in each period;7. average annual growth rates for habitation establishment and number of habitations
used in each period.
Stone artefacts: 8. the estimated number of artefacts accumulated in individual habitations in successive
time periods;9. the rate of artefact accumulation in individual habitations in successive time periods;10. the estimated number of artefacts accumulated in the catchment in successive time periods;11. the rate of artefact accumulation in the catchment as a whole (referred to as the local
artefact accumulation rate) in successive time periods; 12. the number of artefacts accumulated in each topographic zone of the catchment in
successive time periods;13. the rate of artefact accumulation in the catchment in each topographic zone in successive
time periods;14. millennial growth rates; and,15. average annual growth rates.
The number of habitations established and the number of artefacts accumulated ineach time period (i.e., each phase or millennium) were converted into rates (the rate ofhabitation establishment and the rate of artefact accumulation) which take account ofvariation in the lengths of time in each typological phase. Rate is calculated as the number ofhabitations established or the number of artefacts accumulated per millennium. I amprincipally concerned with four indices: • the rate of habitation establishment;• the number of habitations used;• the rate of artefact accumulation; and,• the local rate of artefact accumulation.
They are referred to collectively as the habitation and artefact indices. The term‘habitation indices’ has been used when referring collectively to more than one of the indicesrelating to habitations. Where I refer simply to ‘the indices’, I mean the indices relating toartefacts as well as habitations. The magnitude of increases or decreases in the indices hasbeen referred to as: marked, substantial or dramatic, with dramatic being the greatest inmagnitude. In general discussions, to avoid unwieldy sentences, the term ‘dramatic’ is usedsometimes in a ‘generic’ sense to refer collectively to changes in several sites or regions, someof which may be marked or substantial.
The habitation indicesThe time or period in which an archaeological deposit began to accumulate is taken as the dateat which habitation began; it is referred to as the date of habitation establishment. Someimages or grooves in some rockshelters may have been created before habitation was‘established’ in them, but this cannot be identified.
The term ‘number of habitations used in successive time periods’ refers to thenumber of habitations in use by the end of each period (phase or millennium). It does notimply that the number of habitations stated as being used in each particular period were all
Temporal distribution: quantitative changes in the Upper Mangrove Creek catchment
terra australis 21
119

What’s changing: population size or land-use patterns? The archaeology of Upper Mangrove Creek, Sydney Basin
terra australis 21
120
inhabited at the same time — simply that they were all inhabited at some time during or bythe end of that particular period. Although habitations are described as being used insuccessive time periods, it is assumed they were inhabited discontinuously or intermittently.
In the salvage report, the concepts ‘number of habitations used’ and ‘rate ofhabitation establishment’ are not clearly differentiated. The rate at which habitations wereestablished and the number of habitations used per unit time are treated separately in thismonograph and provide different sets of information about habitation and land-use patterns.If all habitations continued to be used once they were established (albeit discontinuously,intermittently or cyclically), the establishment of further habitations would mean anincreasing number of habitations were used in successive periods of time. The number ofhabitations used can increase no matter whether the habitation establishment rates remainstable, increase or decrease. However, if all habitations were used for a short time in only oneperiod, the habitation establishment rate has to have increased in order for the number ofhabitations used to increase. To calculate the number of habitations used within a particularperiod of time, it was therefore necessary to know the date at which the habitations wereestablished, the total length of time over which they were inhabited, and whether there wereany sustained periods of abandonment.
The artefact indicesThe rates of artefact accumulation are based on the estimated total number of artefactsaccumulated in each period in each archaeological deposit. The artefact accumulation rateswere calculated at three levels: for individual habitations, for the catchment as a whole and foreach topographic zone. For the catchment as a whole, this is referred to as the local rate ofartefact accumulation.
Calculating artefact accumulation ratesArtefact accumulation rates were calculated by a commonly adopted method in which the‘rate’ for each spit or level is expressed as the number of artefacts accumulated (or discarded)per millennium or century (e.g., Hughes and Djohadze 1980: Figs 11–13; Morwood 1981: 32;Kelly 1982: 31–49; David and Chant 1995; papers in Morwood and Hobbs 1995b). The followinginformation was used: 1. the number of artefacts (or implements) in each spit or level;2. the estimated length of time over which each spit or level accumulated; and,3. the area of each spit or level excavated.
To gain 2., a depth/age curve was drawn based on: 4. the depth of each spit or level; 5. the age of one (preferably basal or near basal) but ideally more levels throughout the
depth of deposit, and an estimate of the time when the site was last used; and,6. the depth to which the age estimations relate.
Where the area excavated was not constant in each spit or level, rates werestandardised as the number of artefacts/square metre/unit time (e.g., Hughes 1977: Table 5.6,Fig. 5.12; Johnson 1979: Fig. 5, Table 3).
The artefact accumulation rate for the total catchment in each phase and eachmillennium was estimated by combining the estimated total number of artefacts accumulatedin all archaeological deposits for each phase and each millennium. Catchment trends arereferred to as the local rate of artefact accumulation to differentiate them from the artefactaccumulation rates in individual deposits. Combining the total number of artefacts in levels ofcomparable age in all archaeological deposits is considered valid for several reasons:

• in the same way that it is valid to combine the total number of artefacts in levels ofthe same age from all excavated squares in a single archaeological deposit to producea unitary trend for that site. The catchment is viewed as a single unit in the same waythat an archaeological deposit or site is;
• at a regional level in 1788, the catchment was within the territory of a single languagegroup (Darginung) and probably only part of the territory of a single clan (thoughtheir social, subsistence, economic and trading networks would have extended over amuch wider area than the lands associated with both of these groups);
• subsistence activities are assumed to have been dispersed across the land and notrestricted to a single specific location during periods of occupation. During each visitto the catchment, except when transiting through the country via the major ridgelines forming the catchment watershed, people are likely to have visited more thanone topographic zone and may have ‘used’ more than one site/archaeological trait ofthe same or different nature.Where relevant data are available, calculating artefact accumulation rates is a fairly
straightforward exercise. It is often more difficult to decide what constitutes a dramaticincrease, when the ‘most dramatic increase’ occurred, and/or when it began and ended. Insome cases, this uncertainty means varying interpretations can be made as to when significantquantitative change occurred and with what other events or processes it was correlated. Theshortcomings and limits in using artefact accumulation rates are discussed in Chapter 5.
Growth ratesGrowth rates have also been calculated for the rates of habitation establishment, the numbersof habitations used and the local rates of artefact accumulation. Growth rates for these indicesassist in illustrating the nature and magnitude of changes and are pertinent to laterdiscussions about the use of archaeological evidence as measures of population change(Chapter 8). They were calculated to determine whether there were variations in the ‘rate’ atwhich changes took place in the indices over time; that is, variations in the growth ratesindicate whether the rate of change slowed down or accelerated. The rate of change can slowdown even though ‘increases’ still occur; for example, increases from 2 to 3 to 4 to 5 to7/millennium represent growth rates of +50%, +33%, +25% and +40%.
The growth rates thus help to describe the nature of the quantitative changes whichoccurred and can assist in determining whether the dramatic increases in the more recentperiods were produced simply by exponential population increase; that is, if there was aconstant growth rate. Changes in the growth rates for the indices may be as important as theactual size of the increases and decreases and need explaining in investigating dramaticquantitative changes in the archaeological record.
Calculating growth ratesMillennial growth rates are calculated for the habitation and artefact indices, but averageannual growth rates were the most expedient growth rates to calculate for local artefactaccumulation rates. Growth rates can be expressed in two ways: as a percentage figure (+50%)or a multiplier (×1.5). Both have been presented as each are used in the literature cited;archaeologists often use multipliers (e.g., Hughes and Lampert 1982; Ross 1984), whiledemographers usually quote average annual growth rates for population increase aspercentages (e.g., Ammerman et al. 1976; Hassan 1981; Gray 1985). Percentage figures werecalculated using the following equation: the habitation establishment rate for the later periodminus the rate for the earlier period divided by the rate for the earlier period multiplied by100. The multiplier can be derived by dividing the rate for the later period by the rate for the
Temporal distribution: quantitative changes in the Upper Mangrove Creek catchment
terra australis 21
121

What’s changing: population size or land-use patterns? The archaeology of Upper Mangrove Creek, Sydney Basin
terra australis 21
122
earlier period; for example, a change from 3 habitations/millennium to 6 habitations/millennium, a twofold (×2) increase, represents a growth rate of 100%.
Average annual growth rates were calculated using a small computer programwritten for this purpose. For the habitation indices, they are based on the number in eachphase/millennium and the length of the period (i.e., phase or millennium). Growth rates forthe local artefact accumulation rates are based on the duration of the period (i.e., phase ormillennium) and estimated total number of artefacts accumulated during that period. Averageannual growth rates were not calculated for individual archaeological deposits.
Changes in the rates of habitation establishment
Changes in the rates of habitation establishment are based on the period in which habitationswere established according to both the phased and millennial sequence (i.e., the period inwhich they were first inhabited) (Table 6.2). The estimated period of establishment ofhabitation is based on: 1. radiocarbon dates: (a) if the charcoal sample dated was obtained from the basal spit, this was taken as the
approximate date at which the archaeological deposit began to accumulate (but notediscussion in Hughes and Lampert 1982: 19–20);
(b) if the charcoal sample was not from the basal spit, extrapolation back to the basal spitwas made on the basis of a depth/age curve;
2. the phase or millennium into which the stone artefact assemblage in the basal spitswas assigned; and,
3. where necessary, the depth of accumulated deposit.
Phased sequenceEleven of the 30 habitations have more than one phase represented (multi-phase habitations).The remaining 19 have only one phase and are referred to as single-phase habitations. In eachof the multi-phase habitations, the phases are successive and the most recent phase is alwaysrepresented. The dates, artefacts and nature of the deposits indicate that the single-phasehabitations all belong to the most recent phase.
The number of habitations established varied in each successive typological phase —it was relatively low in the first three phases (four, three and four respectively), but jumpeddramatically in the final phase to 19 (Tables 6.2 and 6.3).
The rate of habitation establishment increased in each successive phase, with the mostrecent phase (4) having the highest. The rate increased from 0.6/millennium during Phase 1,to 1.4 in Phase 2, 3.3 in Phase 3 and 12.7 in Phase 4 (Table 6.3 and Fig. 6.1A).
These rates according to the typological phases suggest that substantial change tookplace in each of the phases, that is, after three points in time — ca 5000 BP, ca 2800 BP and ca1600 BP — and that the most dramatic increase occurred after 1600 BP.
If only the 15 radiocarbon-dated archaeological deposits are used, the habitationestablishment rates are, of course, much lower (0.6, 0.9, 2.5 and 4.0/millennium for Phases 1 to4 respectively) (Table 6.4, marked as * in Fig. 6.1A). Increases still occur, but the increase forPhase 4 is not as dramatic as that based on all habitations.
Growth rates. The growth rate for the habitation establishment rate in Phase 4 issubstantially greater than in Phases 3 and 2. In Phase 4, it is almost four times that of theprevious phase, whereas in Phases 2 and 3 the establishment rate is more than double that ofthe previous phase (Table 6.5).

Millennial sequenceThe millennial sequence indicates that there was a marked increase in the habitationestablishment rate in the fourth millennium BP, a particularly dramatic rise in the secondmillennium BP and a further substantial increase in the first millennium BP (Fig. 6.1B). Theperiod of habitation can be divided into three: 12,000 BP to 7000 BP, 7000 BP to 2000 BP and2000 BP to contact. The seventh millennium BP is taken as the period in which change beginsas it is from that time onwards that habitations were established in each successivemillennium.
Temporal distribution: quantitative changes in the Upper Mangrove Creek catchment
terra australis 21
123
TTaabbllee 66..22 Upper Mangrove Creek catchment: random sampling units. Archaeological deposits: estimated period of habitation
establishment.
SITE NAME PHASE MILLENNIUM (BP) BASIS FOR ESTIMATION
Loggers 1 12,000 – 11,000 Radiocarbon date.
Uprooted Tree 1 9000 – 8000 Radiocarbon date.
Kangaroo and Echidna 1 7000 – 6000 Radiocarbon date + extrapolation to base, poss. 10,000–9000 BP.
White Figure 1 6000 – 5000 Radiocarbon date + extrapolation to base.
Sunny 2 5000 – 4000 Radiocarbon date + extrapolation to base.
Emu Tracks 2 2 4000 – 3000 Diagnostic artefact types/raw materials.
Black Hands SH 2 4000 – 3000 Radiocarbon date + extrapolation to base.
Boat Cave 3 3000 – 2000 Radiocarbon date + extrapolation to base.
Delight SH 3 3000 – 2000 Diagnostic artefact types/raw materials.
Dingo 3 2000 – 1000 Radiocarbon date.
Elongated Figure 3 2000 – 1000 Radiocarbon date.
Caramel Wave 4 2000 – 1000 Radiocarbon date.
Boronia 4 2000 – 1000 Radiocarbon date.
Harris Gully 4 2000 – 1000 Diagnostic artefact types/raw materials/Depth of arch. deposit and estimated accumulation rate.
Elngarrah 4 2000 – 1000 Depth of arch. deposit and estimated accumulation rate.
Two Moths 4 2000 – 1000 Depth of arch. deposit and estimated accumulation rate.
McPherson 4 <1000 Diagnostic artefact types/raw materials/Depth of arch. deposit and estimated accumulation rate.
Bird Tracks 4 <1000 Depth of arch. deposit and estimated accumulation rate.
Low Frontage 4 <1000 Diagnostic artefact types/raw materials/Depth of arch. deposit and estimated accumulation rate.
One Tooth 4 <1000 Radiocarbon date + extrapolation to base.
Venus 4 <1000 Radiocarbon date + extrapolation to base.
Ti-tree 4 <1000 Radiocarbon date + extrapolation to base.
Anadara 4 <1000 Diagnostic artefact types/raw materials/Depth of arch. deposit and estimated accumulation rate.
Wolloby Gully 4 <1000 Radiocarbon date.
Geebung 4 <1000 Diagnostic artefact types/raw materials/Depth of arch. deposit and estimated accumulation rate.
Mangrove Mansions 4 <1000 Diagnostic artefact types/raw materials/Depth of arch. deposit and estimated accumulation rate.
Token Male 4 <1000 Diagnostic artefact types/raw materials/Surface evidence only.
Axehead 4 <1000 Diagnostic artefact types/raw materials/Surface evidence only.
Button 4 <1000 Diagnostic artefact types/raw materials/Surface evidence only.
Firestick 4 <1000 Surface evidence only/state of preservation of modified wood.

Except for the last 1000 years, trends based on only the 15 archaeological deposits withradiocarbon dates are similar to those based on all habitations (marked as * in Fig. 6.1B). Themost recent millennium shows stability in the habitation establishment rate rather than theincrease which is indicated when all habitations are included.
Growth rates. Because habitation establishment was infrequent and the numberinvolved was very low in the period 12,000 BP to 7000 BP, it was not considered meaningful tocalculate the millennial growth rates for this period (Table 6.6). In the fourth and firstmillennia BP the growth rate doubles, whereas in the second millennium BP the increase isthree- to fourfold. The second millennium BP thus had the highest growth rate throughout thecatchment’s period of recorded use.
Comments on rates of habitation establishmentAt one habitation (Kangaroo and Echidna), the period of establishment could fall within one of two different millennia. The extrapolated date does not alter the phase in which habitationbegan, but places the date of establishment some three millennia earlier (i.e., from the seventhto the 10th millennium BP). I use the more recent date in discussions and the conclusions since
What’s changing: population size or land-use patterns? The archaeology of Upper Mangrove Creek, Sydney Basin
terra australis 21
124
TTaabbllee 66..33 Upper Mangrove Creek catchment: random sampling units. Number of habitations established, rate of habitation
establishment and number of habitations used (A) in each phase and (B) millennium (N = 30). See also Figures 6.1 and 6.2.
Numbers in square brackets represent totals if habitation in Kangaroo and Echidna extended back to 10th millennium BP. [1]
This total for first millennium BP excludes Two Moths, inhabited only in the second millennium BP.
A. PHASED SEQUENCE
Phase Length of phase No. of habitations Rate of habitation No. of habitations
(years) established establishment used
1 ca 6300 4 0.6 42 ca 2200 3 1.4 73 ca 1200 4 3.3 114 ca 1500 19 12.7 30
Total 11,200 30
B. MILLENNIAL SEQUENCE
Millennium BP No. of habitations Rate of habitation No. of habitations
established establishment used
12,000–11,000 1 1 111,000–10,000 0 0 110,000–9000 0 (1) 0 (1) 1 (2)
9000–8000 1 1 2 (3)8000–7000 0 0 2 (3)7000–6000 1 (0) 1 (0) 36000–5000 1 1 45000–4000 1 1 54000–3000 2 2 73000–2000 2 2 92000–1000 7 7 16
<1000 14 14 [1] 29
Total 30

Temporal distribution: quantitative changes in the Upper Mangrove Creek catchment
terra australis 21
125
12 11 10 9 8 7 6 5 4 3 2 1 0
12 11 10 9 8 7 6 5 4 3 2 1 0
NO.
OF H
ABITA
TION
S /
MIL
LENN
IUM
YEARS BP (x1000)
NO.
OF H
ABITA
TION
S /
MIL
LENN
IUM
YEARS BP (x1000)
14
12
10
8
6
4
2
PHASE 1 2 3 4
16
14
12
10
8
6
4
2
A.
B.
N=4N=3
N=4
N=19
Figure 6.1 Upper Mangrove Creek catchment: random sampling units. Rate of habitation establishment in each (A) phase
and (B) millennium. N = 30, stars indicate numbers of radiocarbon-dated archaeological deposits in each period. Dashed
outline in millennial sequence indicates extrapolated dating for Kangaroo and Echidna. Tables 6.1 to 6.4 have details.

What’s changing: population size or land-use patterns? The archaeology of Upper Mangrove Creek, Sydney Basin
terra australis 21
126
TTaabbllee 66..44 Upper Mangrove Creek catchment: random sampling units. Radiocarbon-dated archaeological deposits only:
number of habitations established, rate of habitation establishment, and number of habitations used (A) in each phase and
(B) each millennium (N = 15). See also Figures 6.1 and 6.2.
A. PHASED SEQUENCE
Phase Length of phase No. of habitations Rate of habitation No. of habitations
(years) established establishment used
1 ca 6300 4 0.6 42 ca 2200 2 0.9 63 ca 1200 3 2.5 94 ca 1500 6 4.0 15
Total ca 11,200 15
B. MILLENNIAL SEQUENCE
Millennium BP No. of habitations Rate of habitation No. of habitations
established establishment used
12,000–11,000 1 1 111,000–10,000 0 0 110,000–9000 0 0 1
9000–8000 1 1 28000–7000 0 0 27000–6000 1 1 36000–5000 1 1 45000–4000 1 1 54000–3000 1 2 63000–2000 1 2 72000–1000 4 4 11
<1000 4 4 15
Total 15
TTaabbllee 66..55 Upper Mangrove Creek catchment: random sampling units. Phased sequence: growth rates for rates of habitation
establishment, numbers of habitations used and local rates of artefact accumulation, based on Table 6.3A. # indicates
habitations were first established and artefacts first accumulated in this phase.
Phase Growth rates for:
Rate of Number of Local rate of
habitation establishment habitations used artefact accumulation
x % x % x %
1 # # #
2 2.33 +133 1.75 +75 1.35 +35
3 2.36 +136 1.57 +57 19.17 +1817
4 3.85 +285 2.72 +172 0.50 -49

Temporal distribution: quantitative changes in the Upper Mangrove Creek catchment
terra australis 21
127
the date based on the depth/age curve is very much earlier than the radiocarbon date, but the depth between the dated level and the base of the archaeological deposit is notvery great.
Excavation ceased at Kangaroo and Echidna and four other archaeological depositsbefore bedrock was reached (Anadara, Bird Tracks, Boronia and Mangrove Mansions) (seeChapter 5, Table 3.4). In addition, in three other rockshelters (Elongated Figure, Harris Gullyand Uprooted Tree), the base of the excavations is sloping bedrock. It is possible therefore thatthere may be earlier evidence of habitations in other parts of the deposits at these eight sites.However, the area of deposit in the rockshelters is small and the slope gradients are low, so theextra depth of deposit and/or time may not be great. The period of establishment for theseeight archaeological deposits was assigned on the basis of the archaeological materialsrecovered and the radiocarbon dates at three of the sites: five to Phase 4, one to Phase 3(Elongated Figure) and two (Kangaroo and Echidna and Uprooted Tree) to Phase 1. If theperiod of habitation establishment for the archaeological deposits assigned to Phases 3 and 4was earlier than assumed, this would only add support to the argument that early depositswere not necessarily scoured out of rockshelters. Habitation in ALL these shelters would havehad to have begun earlier and to have begun in the SAME phase, for trends in the habitationestablishment rates to be affected. Because of the nature and estimated remaining depth of thedeposit, and the stone artefact assemblages in the basal spits at these archaeological deposits,this situation is considered unlikely (see Chapter 3, Excavations undertaken). Similararguments can be made about trends according to the millennial sequence.
TTaabbllee 66..66 Upper Mangrove Creek catchment: random sampling units. Millennial sequence: growth rates for rates of
habitation establishment, numbers of habitations used and local rates of artefact accumulation, plus average annual growth
rates for local rates of artefact accumulation, based on Table 6.3B. # indicates habitations were first established and artefacts
first accumulated in this millennium.
Millennium BP Growth rates for:
Rate of Number of Local rate of artefact accumulation
habitation establishment habitations used Millennial Av. annual
x % x % x % %
12th # # #
11th 1.00 0 25.70 +2470 +0.33
10th 1.00 0 6.40 +540 +0.19
9th 2.00 +100 0.97 -3 0.00
8th 1.00 0 0.23 -77 -0.15
7th 1.50 +50 0.73 -27 -0.03
6th 1.0 0 1.33 +33 1.18 +18 +0.02
5th 1.0 0 1.25 +25 1.43 +43 +0.04
4th 2.0 +100 1.40 +40 2.28 +128 +0.08
3rd 1.0 0 1.29 +29 14.39 +1339 +0.27
2nd 3.5 +250 1.78 +78 0.93 -7 -0.01
1st 2.0 +100 1.81 +81 0.57 -43 -0.06

What’s changing: population size or land-use patterns? The archaeology of Upper Mangrove Creek, Sydney Basin
128
Changes in the numbers of habitations used
The stratigraphy of each of the archaeological deposits suggests that, except in one case, once ahabitation was established, it continued to be used into the most recent phase — notnecessarily continuously, but without any major long-term breaks in habitation. That is, therewere no breaks which were of sufficient length to allow sterile layers to form or one of theassemblages in the stone artefact sequence to be missing. The exception is Two Moths, wherethe only evidence for habitation is freshwater mussel shell (Appendix 3). The shell occurs in asingle level mid-depth within the excavated deposit. The age of this level has been estimatedas some time within the second millennium BP. Two Moths is thus excluded as a habitation inuse in the first millennium BP (e.g., in Table 6.10).
Phased sequenceThe number of habitations used by the end of each successive phase increased markedly so thatthe number of habitations used during the most recent phase was greater than in any previousphase. Four habitations were used in Phase 1, seven in Phase 2, 11 in Phase 3, and 30 in thefinal phase (4) (Fig. 6.2A). The growth rate between the two final phases (×2.72) was greaterthan at other times (×1.75 and ×1.57) (Table 6.5).
Millennial sequenceAccording to the millennial sequence, the increase in the number of habitations used was veryslow until the ninth millennium BP, after which there was a gradual increase until the thirdmillennium BP. There were then substantial increases in both the second and first millennia BP(Fig. 6.2B). The increase in the first millennium BP was slightly greater than that in the secondmillennium BP.
When only the 15 radiocarbon-dated archaeological deposits are used (marked as * in Fig.6.2B), the trend in the number of habitations used is similar to that shown when all habitationsare included, though the increases in the second and first millennia BP are not as substantial.
Growth rates. The highest growth rates occurred in the second and first millennia BP(×1.78 and ×1.81 respectively), as well as the ninth millennium BP (×2) — though the lattersituation represents an increase from one to two sites (Table 6.6).
Changes in the habitation indices in each topographic zone by the endof each successive time period
Phased sequenceThe distribution of habitations in each of the topographic zones in each phase varied overtime (Fig. 6.3 and Tables 6.7 and 6.9): Phase 1 — four habitations were established in three of the topographic zones (the main
valley bottoms [VB-MC], subsidiary ridgesides [RS-SC], and periphery ridgetops[RT-PERI]). The four habitations were spread widely over the catchment;
Phase 2 — seven habitations used; the additional three habitations were established in onlytwo of the three topographic zones in which the Phase 1 habitations were recorded(the main valley bottoms [VB-MC] and periphery ridgetops [RT-PERI]);
Phase 3 — 11 habitations used; the additional four habitations were established in only two ofthe three topographic zones in which the Phase 1 habitations were established(subsidiary ridgesides [RS-SC] and periphery ridgetops [RT-PERI]).
terra australis 21

Temporal distribution: quantitative changes in the Upper Mangrove Creek catchment
terra australis 21
129
12 11 10 9 8 7 6 5 4 3 2 1 0
12 11 10 9 8 7 6 5 4 3 2 1 0
NO.
OF H
ABITA
TION
S /
PHAS
E
YEARS BP (x1000)
35
30
25
20
15
10
5
NO.
OF H
ABITA
TION
S /
MIL
LENN
IUM
YEARS BP (x1000)
35
30
25
20
15
10
5
PHASE 1 2 3 4
B.
A.
Figure 6.2 Upper Mangrove Creek catchment: random sampling units. Number of habitations used in each (A) phase and
(B) millennium. N = 30, stars indicate numbers of radiocarbon-dated habitations. In millennial sequence, first millennium BP
excludes Two Moths, which was not inhabited in that period. Tables 6.1 to 6.4 have details.

What’s changing: population size or land-use patterns? The archaeology of Upper Mangrove Creek, Sydney Basin
terra australis 21
130
PHASE 1 PHASE 2
PHASE 3 PHASE 4
Archaeological deposits0 2 4
kms
N
Figure 6.3 Upper Mangrove Creek catchment: random sampling units. Distribution of habitations used in each phase.
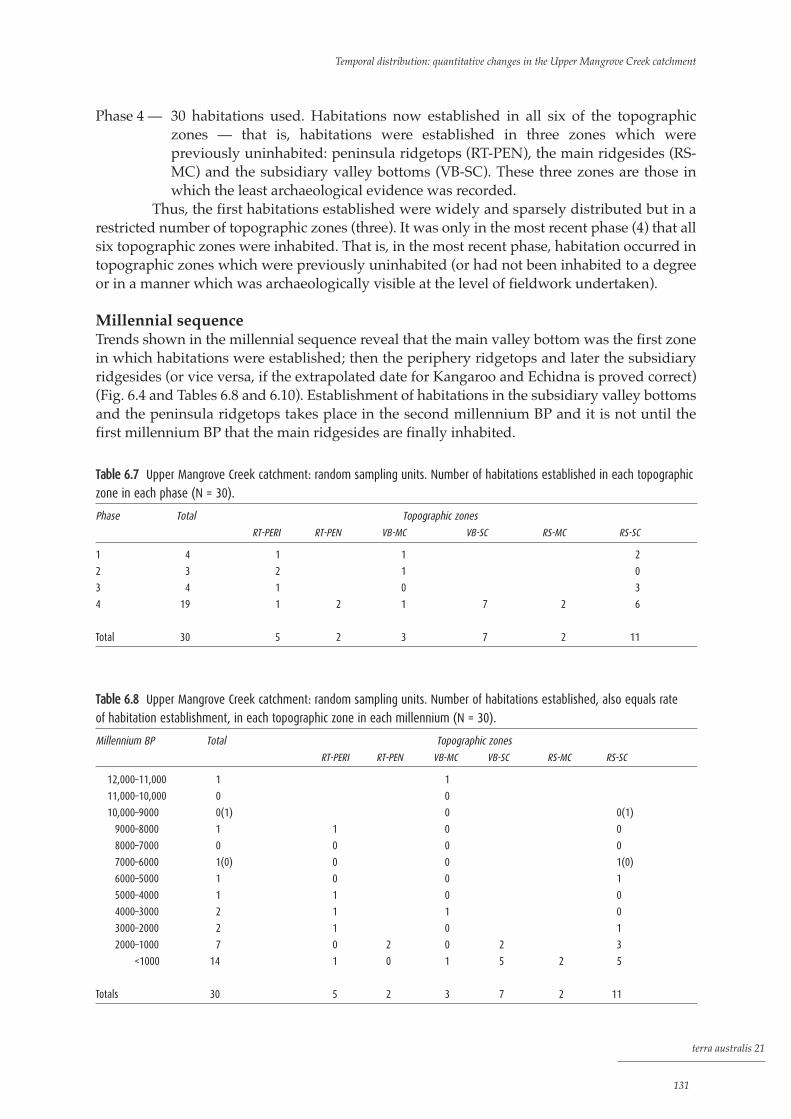
Temporal distribution: quantitative changes in the Upper Mangrove Creek catchment
terra australis 21
131
Phase 4 — 30 habitations used. Habitations now established in all six of the topographiczones — that is, habitations were established in three zones which werepreviously uninhabited: peninsula ridgetops (RT-PEN), the main ridgesides (RS-MC) and the subsidiary valley bottoms (VB-SC). These three zones are those inwhich the least archaeological evidence was recorded.
Thus, the first habitations established were widely and sparsely distributed but in arestricted number of topographic zones (three). It was only in the most recent phase (4) that allsix topographic zones were inhabited. That is, in the most recent phase, habitation occurred intopographic zones which were previously uninhabited (or had not been inhabited to a degreeor in a manner which was archaeologically visible at the level of fieldwork undertaken).
Millennial sequenceTrends shown in the millennial sequence reveal that the main valley bottom was the first zonein which habitations were established; then the periphery ridgetops and later the subsidiaryridgesides (or vice versa, if the extrapolated date for Kangaroo and Echidna is proved correct)(Fig. 6.4 and Tables 6.8 and 6.10). Establishment of habitations in the subsidiary valley bottomsand the peninsula ridgetops takes place in the second millennium BP and it is not until thefirst millennium BP that the main ridgesides are finally inhabited.
TTaabbllee 66..77 Upper Mangrove Creek catchment: random sampling units. Number of habitations established in each topographic
zone in each phase (N = 30).
Phase Total Topographic zones
RT-PERI RT-PEN VB-MC VB-SC RS-MC RS-SC
1 4 1 1 2
2 3 2 1 0
3 4 1 0 3
4 19 1 2 1 7 2 6
Total 30 5 2 3 7 2 11
TTaabbllee 66..88 Upper Mangrove Creek catchment: random sampling units. Number of habitations established, also equals rate
of habitation establishment, in each topographic zone in each millennium (N = 30).
Millennium BP Total Topographic zones
RT-PERI RT-PEN VB-MC VB-SC RS-MC RS-SC
12,000–11,000 1 1
11,000–10,000 0 0
10,000–9000 0(1) 0 0(1)
9000–8000 1 1 0 0
8000–7000 0 0 0 0
7000–6000 1(0) 0 0 1(0)
6000–5000 1 0 0 1
5000–4000 1 1 0 0
4000–3000 2 1 1 0
3000–2000 2 1 0 1
2000–1000 7 0 2 0 2 3
<1000 14 1 0 1 5 2 5
Totals 30 5 2 3 7 2 11

What’s changing: population size or land-use patterns? The archaeology of Upper Mangrove Creek, Sydney Basin
terra australis 21
132
Changes in the rates of artefact accumulation — individual habitations
At some habitations, very few artefacts were retrieved in the excavations while in others severalthousand were recovered (between one and 7436) (Table 4.6). Estimated total numbers ofartefacts accumulated in individual habitations varied equally widely (from <100 to almost250,000) (Table 4.12).
Artefact accumulation rates for individual habitations have been calculated for eachof the phases and millennia in which the habitations were used (Figs 6.5 and 6.6; Tables 6.12and 6.13 respectively). Artefact accumulation rates are based on the estimated total number ofartefacts in an archaeological deposit and on the estimated total number within eachspit/phase/millennium (Tables 6.11 and 6.13). The estimated total number of artefacts wasused to avoid problems associated with inter-site variability in both the amount excavated ineach site and the area of each archaeological deposit (i.e., in the number of square metres likelyto contain cultural materials) at each site.
The artefact accumulation rates did not always continue to increase in each of thehabitations (i.e., a similar trend to that seen in the salvage program [Attenbrow 1981, 1982b]).Each habitation had its own ‘history of accumulation’ or ‘habitation history’. Variationsoccurred not only in the date at which each habitation was established and the estimated totalnumber of artefacts accumulated, but also in: 1. the rates at which artefacts accumulated in particular periods; and, 2. the direction and timing of the dramatic or substantial changes in the artefact
accumulation rates.At habitations used for more than one phase or more than two millennia, long-term
changes in the artefact accumulation rates are evident.
TTaabbllee 66..1100 Upper Mangrove Creek catchment: random sampling units. Number of habitations used in each topographic zone in
each millennium (N = 30). [1] These figures exclude Two Moths, which was inhabited in only the second millennium BP.
Millennium BP Total Topographic zones
habitations RT-PERI RT-PEN VB-MC VB-SC RS-MC RS-SC
12,000–11,000 1 1
11,000–10,000 1 1
10,000–9000 1(2) 1 0(1)
9000–8000 2(3) 1 1 0(1)
8000–7000 2(3) 1 1 0(1)
7000–6000 3 1 1 1
6000–5000 4 1 1 2
5000–4000 5 2 1 2
4000–3000 7 3 2 2
3000–2000 9 4 2 3
2000–1000 16 4 2 2 2 6
<1000 29[1] 5 2 3 7 2 10[1]
TTaabbllee 66..99 Upper Mangrove Creek catchment: random sampling units. Number of habitations used in each topographic zone
in each phase (N = 30).
Phase Total Topographic zones
habitations RT-PERI RT-PEN VB-MC VB-SC RS-MC RS-SC
1 4 1 1 2
2 7 3 2 2
3 11 4 2 5
4 30 5 2 3 7 2 11

Temporal distribution: quantitative changes in the Upper Mangrove Creek catchment
terra australis 21
133
3
3
3 32
2
12TH MILL BP 11TH MILL BP 10TH MILL BP
9TH MILL BP 8TH MILL BP 7TH MILL BP
6TH MILL BP 5TH MILL BP 4TH MILL BP
3RD MILL BP 2ND MILL BP 1ST MILL BP
Archaeological deposits possibly used
0 4 8
km
N
Figure 6.4 Upper Mangrove Creek catchment: random sampling units. Distribution of habitations used in each millennium.
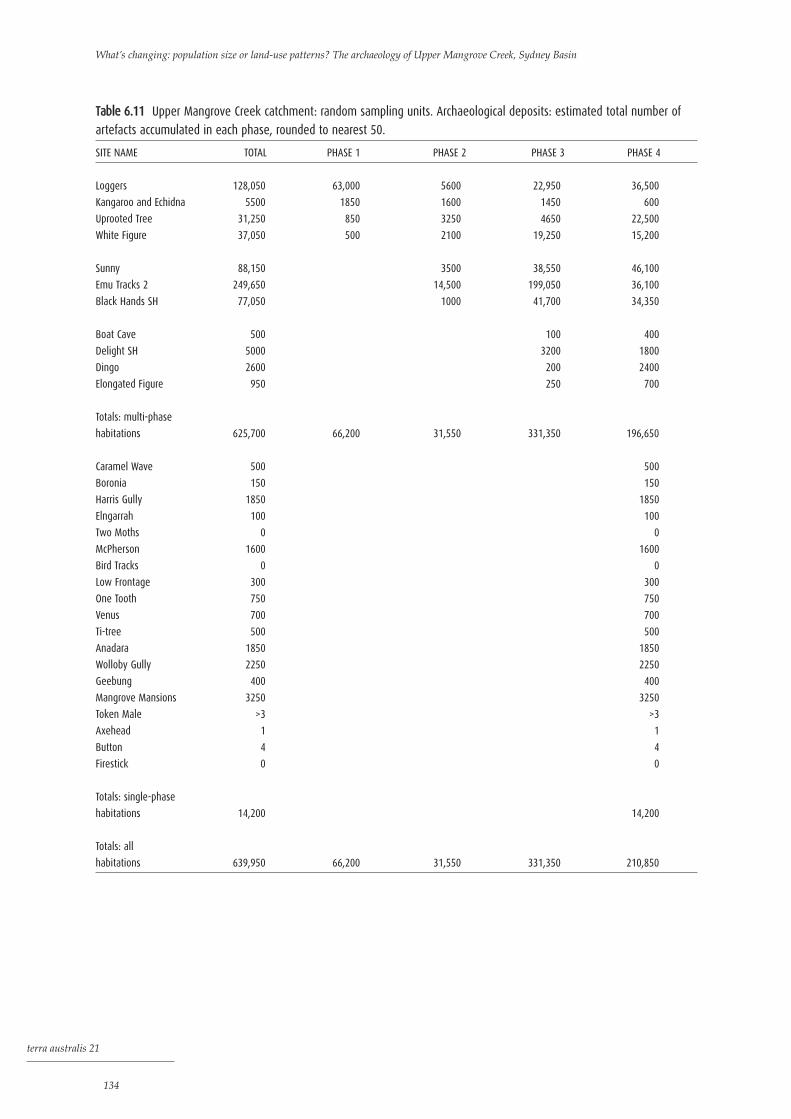
What’s changing: population size or land-use patterns? The archaeology of Upper Mangrove Creek, Sydney Basin
terra australis 21
134
TTaabbllee 66..1111 Upper Mangrove Creek catchment: random sampling units. Archaeological deposits: estimated total number of
artefacts accumulated in each phase, rounded to nearest 50.
SITE NAME TOTAL PHASE 1 PHASE 2 PHASE 3 PHASE 4
Loggers 128,050 63,000 5600 22,950 36,500
Kangaroo and Echidna 5500 1850 1600 1450 600
Uprooted Tree 31,250 850 3250 4650 22,500
White Figure 37,050 500 2100 19,250 15,200
Sunny 88,150 3500 38,550 46,100
Emu Tracks 2 249,650 14,500 199,050 36,100
Black Hands SH 77,050 1000 41,700 34,350
Boat Cave 500 100 400
Delight SH 5000 3200 1800
Dingo 2600 200 2400
Elongated Figure 950 250 700
Totals: multi-phase
habitations 625,700 66,200 31,550 331,350 196,650
Caramel Wave 500 500
Boronia 150 150
Harris Gully 1850 1850
Elngarrah 100 100
Two Moths 0 0
McPherson 1600 1600
Bird Tracks 0 0
Low Frontage 300 300
One Tooth 750 750
Venus 700 700
Ti-tree 500 500
Anadara 1850 1850
Wolloby Gully 2250 2250
Geebung 400 400
Mangrove Mansions 3250 3250
Token Male >3 >3
Axehead 1 1
Button 4 4
Firestick 0 0
Totals: single-phase
habitations 14,200 14,200
Totals: all
habitations 639,950 66,200 31,550 331,350 210,850

Temporal distribution: quantitative changes in the Upper Mangrove Creek catchment
terra australis 21
135
TTaabbllee 66..1122 Upper Mangrove Creek catchment: random sampling units. Archaeological deposits: rate of artefact accumulation
in each phase (number per millennium), rounded to nearest 50. See also Figure 6.5.
SITE NAME PHASE 1 PHASE 2 PHASE 3 PHASE 4
Loggers 10,150 2550 19,150 24,350
Kangaroo and Echidna 300 750 1200 400
Uprooted Tree 150 1500 3900 15,000
White Figure 100 950 16,050 10,150
Sunny 1600 32,150 30,750
Emu Tracks 2 6600 165,850 24,050
Black Hands SH 450 34,750 22,900
Boat Cave 100 250
Delight SH 2650 1200
Dingo 150 1600
Elongated Figure 200 450
Caramel Wave 350
Boronia 100
Harris Gully 1250
Elngarrah 50
Two Moths 0
McPherson 1050
Bird Tracks 0
Low Frontage 150
One Tooth 500
Venus 450
Ti-tree 350
Anadara 1250
Wolloby Gully 1500
Geebung 250
Mangrove Mansions 2150
Token Male >2
Axehead 1
Button 3
Firestick 0
Totals: all habitations 10,700 14,350 276,150 140,550

What’s changing: population size or land-use patterns? The archaeology of Upper Mangrove Creek, Sydney Basin
terra australis 21
136
YEARS BP (x1000)
12 11 10 9 8 7 6 5 4 3 2 1 0
LS
KE
UT
WF
SuS
ET2
BHS
BC
DeS
DiS
EF
CW
BoS
HG
ES
TMS
MCP
BT
LF
OT
VS
TT
AS
WoG
GS
MM
TM
AH
BuS
FS
?
PHASE 1 2 3 4
Figure 6.5 Upper Mangrove Creek catchment: random sampling units. Rate of artefact accumulation in each phase in
individual archaeological deposits. Time is represented to scale, but frequency is schematic only. Table 6.12 has details.

Temporal distribution: quantitative changes in the Upper Mangrove Creek catchment
terra australis 21
137
YEARS BP (x1000)
LS
KE
UT
WF
SuS
ET2
BHS
BC
DeS
DiS
EF
CW
BoS
HG
ES
TMS
MCP
BT
LF
OT
VS
TT
AS
WoG
GS
MM
TM
AH
BuS
FS
?
12 11 10 9 8 7 6 5 4 3 2 1 0
Figure 6.6 Upper Mangrove Creek catchment: random sampling units. Rate of artefact accumulation in each millennium in
individual archaeological deposits. Time is represented to scale, but frequency is schematic only. Table 6.13 has details.

What’s changing: population size or land-use patterns? The archaeology of Upper Mangrove Creek, Sydney Basin
terra australis 21
138
Phased sequenceEleven habitations were used in more than one phase. The estimated total number of artefactsaccumulated at each habitation in each phase is set out in Table 6.11 and the rates of artefactaccumulation in Figure 6.5 and Table 6.12. At all but two of the seven habitations used formore than two phases, there were substantial or dramatic increases in the rate at whichartefacts accumulated in Phase 3. The exceptions were Kangaroo and Echidna and UprootedTree, where the rates increased, but on a smaller scale than elsewhere.
At five of the 11 multi-phase habitations, the artefact accumulation rates continued toincrease in successive periods. At the other six habitations, there was a decrease, sometimesrelatively dramatic, in the accumulation rates in the upper levels.
TTaabbllee 66..1133 Upper Mangrove Creek catchment: random sampling units. Archaeological deposits: estimated total number of
artefacts accumulated in each millennium and rate of artefact accumulation for millennial sequence, rounded to nearest 50;
based on calculations in Appendix 2. See also Figure 6.6.
ESTIMATED
TOTAL NO. ESTIMATED TOTAL NUMBER OF ARTEFACTS IN EACH MILLENNIUM (BP)
SITE NAME OF ARTEFACTS 12TH 11TH 10TH 9TH 8TH 7TH 6TH 5TH 4TH 3RD 2ND 1ST
Loggers (EF) 128,050 150 3850 24,100 23,200 4300 3650 3550 4150 5850 7000 11,800 36,450
Kangaroo and Echidna (T1+T2) 5,500 [400] [400] [950] 50 50 750 700 450 1400 350
Uprooted Tree (Ta+Tb) 31,250 50 200 300 800 1150 1300 2350 13,050 12,050
White Figure 37,050 300 450 1550 11,550 17,200 6000
Sunny 88,150 150 2150 25,250 44,450 16,150
Emu Tracks 2 (T1+T2) 249,650 3650 165,200 66,350 14,450
Black Hands SH (F) 77,050 100 16,050 46,300 14,600
Boat Cave 500 100 50 350
Delight SH 5000 1250 2650 1100
Dingo 2600 600 2000
Elongated Figure 950 550 400
Caramel Wave 500 50 450
Boronia 150 50 100
Harris Gully 1850 700 1150
Elngarrah 100 50 50
Two Moths 0 0 n/u
McPherson 1600 1600
Bird Tracks 0 0
Low Frontage 300 300
One Tooth 750 750
Venus 700 700
Ti-tree 500 500
Anadara 1850 1850
Wolloby Gully 2250 2250
Geebung 400 400
Mangrove Mansions 3250 3250
Token Male >3 >3
Axehead 1 1
Button >4 >4
Firestick 0 0
Totals: all habitations 639,950 150 3850 24,500 23,650 5450 4000 4700 6650 15,300 229,200 205,250 117,250

Millennial sequenceFifteen habitations were used for more than two millennia, and seven for more than 3000years (Fig. 6.6 and Table 6.13). At the seven habitations used for more than 3000 years: 1. a dramatic or substantial increase in the artefact accumulation rates can be seen; this
occurred within the last 3000 years and usually in the third or second millennium BP.At only one habitation (Loggers, where the rate of artefact accumulation continued toincrease until contact) did a substantial increase occur in the first millennium BP;
2. there was also a dramatic or substantial decrease in the artefact accumulation rate in allhabitations except Loggers and Uprooted Tree; at the other five habitations, thisdecrease occurred after the dramatic increase mentioned in 1. above. At one habitation(Emu Tracks 2) it began in the second millennium BP and at the other four it was in thefirst millennium BP. At Uprooted Tree a decrease occurred in the first millennium BP,but it was not marked.In the two sites where habitation is estimated to have begun in the third millennium
BP, Delight and Boat Cave, the former had a decrease while the latter had an increase in thefirst millennium BP.
The millennial sequence also indicates that: 1. decreased artefact accumulation rates occurred at a greater number of habitations in
the most recent period (i.e., all but Loggers and Boat Cave), although the decrease atUprooted Tree was not very great;
2. the substantial increases and decreases in the accumulation rates did not necessarilyoccur at the same time in all habitations — at some the increase began in the thirdmillennium BP and in others the second millennium BP. The substantial decreaseoccurred in most habitations in the last 1000 years, but at Emu Tracks 2 it began in thesecond millennium BP — at the same time as increases were beginning at others;
3. at Loggers, there was a period with relatively high artefact accumulation rates in the10th and ninth millennia BP, that is, within Phase 1. At Kangaroo and Echidna, theremay have been a period of relatively high artefact accumulation in the eighthmillennium BP, but the presence of artefacts dating back to 10,000 BP at thishabitation is equivocal at present; and,
4. the growth rates at individual habitations varied widely. The millennial sequence reveals that the relationships between the use of the various
habitations within the catchment were more complex than those indicated by the phasedsequence. Variability in the timing, direction and magnitude of the changes in the artefactaccumulation rates in individual habitations, as documented for the catchment, have not beendocumented in the same detail anywhere else in Australia. The variability documented for thecatchment suggests that local habitation and land-use patterns in other regions are likely to bemore complex than models based on less detailed site and artefact distribution studies.
Changes in the local rate of artefact accumulation — the catchment
While trends at individual habitations reflect the manner in which people inhabited specificlocations within the catchment and how they occupied the catchment once they were there,the catchment trends are pertinent to discussions about long-term use of the catchment in aregional context (cf. Foley 1981b: 175–6). So, in assessing changes in the catchment as a whole,and at a topographic level, I used a non-site approach (Foley 1981a, 1981b, 1981c; Thomas1975) — an approach now more commonly used in eastern Australia, especially with openarchaeological deposits (Robins 1997; MacDonald et al. 1998: 37; MacDonald and Davidsonn.d: 153–5; Holdaway et al. 1998; Doelman et al. 2001).
Temporal distribution: quantitative changes in the Upper Mangrove Creek catchment
terra australis 21
139

What’s changing: population size or land-use patterns? The archaeology of Upper Mangrove Creek, Sydney Basin
terra australis 21
140
12 11 10 9 8 7 6 5 4 3 2 1 0
12 11 10 9 8 7 6 5 4 3 2 1 0
280
240
200
160
120
80
40
NO.
OF A
RTEF
ACTS
/ M
ILLE
NNIU
M (
x100
0)
YEARS BP (x1000)
280
240
200
160
120
80
40
NO.
OF A
RTEF
ACTS
/ M
ILLE
NNIU
M (
x100
0)
YEARS BP (x1000)
PHASE 1 2 3 4
A.
B.
Figure 6.7 Upper Mangrove Creek catchment: random sampling units. Local rate of artefact accumulation in each (A) phase
and (B) each millennium. Tables 6.12 and 6.13 have details.

Phased sequenceAccording to the phased sequence, the local artefact accumulation rate was higher in Phase 3than in any other phase; that is, there was a peak accumulation period between ca 2800 BP andca 1600 BP, and in the most recent phase the artefact accumulation rates decreased (Fig. 6.7A).
Growth rates. The growth rates for the local artefact accumulation rates varieddramatically over time (Table 6.5). Between Phases 1 and 2 the growth rate was low (x1.35),but in Phase 3 it was almost 20 times higher than in Phase 2. In Phase 4, the local artefactaccumulation rate was half that of Phase 3 (x0.5).
Millennial sequenceThe millennial sequence shows that there was an initial slow but steady increase in the localartefact accumulation rate, but then it increased dramatically in the third millennium BP (Fig.6.7B). A similarly high rate was maintained in the second millennium BP, after which itdecreased substantially in the first millennium BP. In the 10th and ninth millennia BP, therewas also a minor peak in the local artefact accumulation rates, which is masked in the phasedsequence.
Growth rates. The local artefact accumulation rate in the third millennium BP wasmore than 14 times higher than that of the fourth millennium BP (Table 6.6). The growth ratein the 10th millennium was also very high (x6.4), though the actual numbers of artefactsinvolved were lower than in the more recent periods. The exceptionally high growth rate inthe 11th millennium BP (x25.7) does not warrant undue emphasis since it is presently based onsmall numbers of artefacts from a single habitation, i.e., Loggers.
The decline in the growth rate in the eighth millennium BP (x0.23) was also greaterthan the decline that occurred in the first millennium BP (x0.57). These figures suggest thatdramatic changes also occurred in the early-Holocene and were not restricted to the late-Holocene.
Comments on local artefact accumulation ratesVariations in the direction of trends in individual archaeological deposits in the most recentperiod were noted in the storage area data set (Attenbrow 1981: 131; 1982b: 77). AlthoughI speculated that the decreases in the upper levels of some archaeological deposits may ‘cancelout’ the increases in others, at that time I did not envisage that the overall trend would betowards such a substantial decrease in the local artefact accumulation rate in the last 1000years. The substantial decrease in the local artefact accumulation rate during the most recentphase and millennium is in strong contrast with the continuing increases which aredocumented for the habitation establishment rates and numbers of habitations used in thesuccessive periods of time. It is possible that the documented trends are biased because of thesmall area excavated in some archaeological deposits (discussed in Chapter 3, Excavationstrategy and methods, and Chapter 5, Sample size), but it appears unlikely and can be testedonly by further excavation in each archaeological deposit.
Much of the variation between Phase 3 and 4 is due to the large difference betweenthese phases at Emu Tracks 2. If this habitation was excluded from the data set, Phase 4 wouldhave had a higher rate of artefact accumulation than Phase 3. In the millennial sequence, ifEmu Tracks 2 was excluded from the figures, the rate for the third millennium BP would dropdramatically, but the second millennium BP still has a higher rate than the first. However,there is no reason why Emu Tracks 2 — as opposed to any other archaeological deposit —should be excluded from the sample, given the nature of the selection procedures.
To check whether the observed pattern in the local artefact accumulation rates (inparticular, the lower number of artefacts in the most recent period) was due to mis-allocation of
Temporal distribution: quantitative changes in the Upper Mangrove Creek catchment
terra australis 21
141

spits to a wrong phase, various ways of combining the totals were calculated. Mis-allocationcould occur where diagnostic artefacts were not present; it could also occur if the verticaldistribution of such artefacts had been altered by subsequent disturbance, such as treadage andscuffage. The most drastic situation that could have occurred is that all top spits in Phase 3belong to Phase 4 and all bottom spits in Phase 3 belong to Phase 2. In this situation, Phase 4 doeshave a greater artefact accumulation rate than Phase 3. However, there is no reason to believe thishappened in ALL archaeological deposits. In addition, many archaeological deposits have onlytwo spits in Phase 3, and, if diagnostic artefacts representing Phase 3 are present, then at least oneof the spits must fall into Phase 3. If the Phase 4 habitations without diagnostic features belongedelsewhere, this would only accentuate the decrease in Phase 4.
Although mis-allocating spits and/or assemblages to specific millennia may haveoccurred for the reasons outlined above, the fact that both sequences produced similar trendsindicates that the status of the postulated trends are secure enough to use as a basis forinterpretative and explanatory models for the temporal changes in the habitation and land-usepatterns in the catchment.
Changes in the rate of artefact accumulation in each topographic zonein successive time periods
The number of artefacts accumulated in each topographic zone varied widely, with thehighest number being on the periphery ridgetops (Tables 6.14 to 6.16). The number of artefactsand the rate at which they accumulated in each zone also varied considerably over time.
Phased sequenceThe periphery ridgetops had the highest number of artefacts accumulated and the highestartefact accumulation rates in all phases except Phase 1 (Tables 6.14 and 6.15). In Phase 1, thehighest number and highest rate were in the main valley bottoms.
In Phase 2, although there was a slight increase in the local accumulation rate, the ratedecreased in the main valley bottoms while increasing in the other two inhabited zones(subsidiary ridgesides and periphery ridgetops). In Phase 3, the increase in artefact accumulationrates is dramatic in all zones, but the growth rate is much greater in the main valley bottoms andperiphery ridgetops than on the subsidiary ridgesides (×18, ×21 and ×10 respectively).
Phase 4 had several changes — at the same time as there were decreased rates in allzones previously inhabited (with the periphery ridgetops having a much greater decreasethan the main valley bottoms and subsidiary ridgesides), the remaining three zones wereinhabited for the first time (peninsula ridgetops, main ridgesides and subsidiary valleybottoms). However, the accumulation rates in these three zones are very much lower than inthe three zones inhabited throughout the sequence.
Changes in the artefact accumulation rates which occurred in each phase thereforedid not happen uniformly in each of the topographic zones.
Millennial sequenceThe millennial sequence shows a similar long-term pattern to the phased sequence. However,it reinforces the habitation indices, indicating that artefact accumulation first began in themain valley bottom, did not begin on the peninsula ridgetops and in the subsidiary valleybottoms until the second millennium BP, and it was only in the first millennium BP that itbegan on the main ridgesides (Table 6.16). It also shows that the peak in the artefactaccumulation rates in the 10th and ninth millennia BP took place in the main valley bottoms.
What’s changing: population size or land-use patterns? The archaeology of Upper Mangrove Creek, Sydney Basin
terra australis 21
142

Temporal distribution: quantitative changes in the Upper Mangrove Creek catchment
terra australis 21
143
TTaabbllee 66..1155 Upper Mangrove Creek catchment: random sampling units. Rate of artefact accumulation (number per
millennium) in each phase in each topographic zone, rounded to nearest 50; based on Table 6.14.
Phase Topographic zones Total:
RT-PERI RT-PEN VB-MC VB-SC RS-MC RS-SC all zones
1 150 10,150 400 10,700
2 9650 3000 1700 14,350
3 204,550 53,900 17,700 276,150
4 71,000 150 47,250 5550 2000 14,600 140,550
Total
catchment 33,700 50 18,500 750 250 4450 57,650
TTaabbllee 66..1144 Upper Mangrove Creek catchment: random sampling units. Estimated total number of artefacts accumulated
in each phase in each topographic zone, rounded to nearest 50.
Phase Topographic zones Total:
RT-PERI RT-PEN VB-MC VB-SC RS-MC RS-SC all zones
1 850 63,000 2350 66,200
2 21,250 6600 3700 31,550
3 245,450 64,650 21,250 331,350
4 106,500 250 70,850 8350 3000 21,900 210,850
Total: all phases 374,050 250 205,100 8350 3000 49,200 639,950
TTaabbllee 66..1166 Upper Mangrove Creek catchment: random sampling units. Estimated total number of artefacts accumulated
in each millennium in each topographic zone and rate of artefact accumulation (number per millennium) for millennial
sequence, rounded to nearest 50.
Millennium Topographic zones Total:
BP RT-PERI RT-PEN VB-MC VB-SC RS-MC RS-SC all zones
12th 150 150
11th 3850 3850
10th 24,100 (400) 24,500
9th 50 23,200 (400) 23,650
8th 200 4300 (950) 5450
7th 300 3650 50 4000
6th 800 3550 350 4700
5th 1300 4150 1200 6650
4th 7100 5950 2250 15,300
3rd 194,050 23,050 12,100 229,200
2nd 126,500 100 58,100 750 19,800 205,250
1st 43,750 150 51,050 7600 3000 11,700 117,250
Total No. 374,050 250 205,100 8350 3000 49,200 639,950
Catchment rate 33,700 50 18,500 750 250 4450 57,650

Discussion
In the above analyses of the habitation and artefact indices, several observations are made: 1. the trends observed when millennial divisions are used as the basis for presenting the
quantitative changes differ in their timing and nature from those based ontypological phases;
2. data sets including only habitations with radiocarbon ages indicate different late-Holocene trends compared with data sets including ‘all datable habitations’;
3. the timing and direction of the catchment trends in the habitation establishment rates,the number of habitations used, and the local artefact accumulation rates, were notuniform;
4. the growth rates in each of the three indices were not constant over time; 5. timing and direction of the changes in the artefact accumulation rates at individual
habitations varied widely;6. the trends in the habitation establishment rates, the number of habitations used and
artefact accumulation rates in each topographic zone varied widely; and,7. the timing of the quantitative changes and the appearance of changes in typology,
technology and raw material did not necessarily coincide.
Typological phases versus millennial divisionsUse of the typological phases suggests that either marked, substantial or dramatic changesoccurred in both habitation indices and the local artefact accumulation rates at or after threepoints in time: ca 5000 BP (the beginning of Phase 2), ca 2800 BP (the beginning of Phase 3)and ca 1600 BP (the beginning of Phase 4) (Figs 6.1A, 6.2A and 6.7A).
The millennial sequence indicates slightly different timing for the changes (Fig. 6.1B,6.2B and 6.7B): 1. in the habitation establishment rates, there was: • an increase in the seventh millennium BP (represented by the beginning of habitation
establishment in each millennium), which is not identifiable in the phased sequence;• a marked increase in the fourth, rather than the fifth millennium BP; and,• dramatic increases in both the second and first millennia BP, so that the increases
appear as a continual process, rather than a single dramatic increase occurring onlyhalfway through the second millennium BP with the same level being maintainedinto the first millennium BP;
2. in the numbers of habitations used, there was: • a gradual increase over time until the second millennium BP, rather than a marked
and sudden increase in the fifth millennium BP after a period of no or very littlechange; and,
• dramatic increases in both the second and first millennia BP, which are part of acontinuing process rather than only one dramatic increase occurring halfway through thesecond millennium BP with the same level being maintained in the first millennium BP;
3. in the local artefact accumulation rates there was: • a small peak in the local artefact accumulation rates in the ninth and 10th millennia
BP (i.e., in the early Holocene), which is not apparent in the phased sequence; • a sudden and dramatic increase in the third millennium BP;• the rate remained high in the second millennium BP, i.e., the high rates extended over
a longer period than in the phased sequence;• a substantial decrease in the most recent period, but it was in the first millennium BP,
rather than in second millennium BP (i.e., after 1600 BP).
What’s changing: population size or land-use patterns? The archaeology of Upper Mangrove Creek, Sydney Basin
terra australis 21
144

The above comparison of the millennial and phased sequences enables variations in thetrends produced by each method to be observed. While the overall trends remain the same interms of direction, use of millennial sequences brings out differences (sometimes subtle) in thetiming of the changes, as well as the nature of the changes (i.e., whether a change was gradual orsudden). Temporal boundaries for the phased sequence can in some sense accommodate theinterpretations based on the millennial sequence; that is, the changes occurred within the datesof the phased sequence. However, when changes are stated as occurring in a phase or in anydated period, there is usually an assumption (explicit or implicit) that the change took place atthe beginning of the specified period — which need not be the case.
In general, analyses based on data from the random sampling units support the 1981postulated trends for the storage area habitations which included ‘the more speculative data’and indicate that there was a dramatic increase in the number of habitations being establishedin the Late Bondaian (Phase 4). In addition, the phased sequences suggest that in Phase 4 therewas an inverse relationship between changes in the two habitations indices and the localartefact accumulation rate (the former continuing to increase and the latter decreasingdramatically), and that these changes coincided in time. In contrast, trends based on themillennial sequences indicate that (a) the rates of increase during the early-Holocene were moreeven than the phased sequences indicate; and (b) ca 5000 BP was not a time of significantchange in any of the indices, with the dramatic changes occurring after 3000 BP. The millennialsequences also enable the complex relationships between habitation establishment, habitationsused and local artefact accumulation rates in the late-Holocene to be more clearly identified.For example, initially, in the third millennium BP, a dramatic increase occurred in the localartefact accumulation rate while the habitation establishment rate and the number ofhabitations used were relatively low. It was only in the second millennium BP that thehabitation establishment rate and the number of habitations used increased dramatically (i.e.,while the local artefact accumulation rate was almost stable). Then, in the first millennium BP,the habitation establishment rate and number of habitations used continued to increasewhereas the local artefact accumulation rate dropped substantially. Use of millennial divisionsdemonstrates that major quantitative changes in habitation and artefact indices did notnecessarily coincide in time, direction or magnitude.
The above comparative analysis of the trends in the phased and millennial sequencesillustrates how grouping materials from several excavation units into phases based ontypological (or other) changes, which may have extended over several millennia, can mask thetime at which changes in other events and processes took place. In addition, it can suggest theywere sudden, or even gradual or long-term processes rather than short-term events; the reversemay equally apply (but cf. Morwood 1981: 30). It could be argued that using millennial divisionsstill forces changes to appear as if they occurred either earlier or later than they actually did —that is, at the millennial boundary rather than at some time within a millennium — but this willalso depend on how an author describes and/or interprets the graphs. An alternative may be tocombine dated boundaries (where available) and millennial divisions within units that extendover several millennia. However, the main implication of this comparison is that each aspect ofthe archaeological record is likely to have its own trajectory and temporal sequence, andtherefore should not be presented in terms of previously constructed sequences designed forother purposes. Each strand of evidence from the archaeological record (e.g., artefact types,technological traits, raw materials, artefact accumulation rates, habitation establishment rates,numbers of habitations used and faunal assemblages) should be analysed separately and haveits own sequence established before comparisons are made and correlations, if any, identified.Different methods of presentation and different analytical methods may also contribute to
Temporal distribution: quantitative changes in the Upper Mangrove Creek catchment
terra australis 21
145

apparent regional variations in the timing of different events, particularly if researchers indifferent regions are not using the same methods.
Future discussions, unless indicated, are based on millennial sequences.
Artefact accumulation rates in individual habitationsComparison of the trends in individual habitations shows that the artefact accumulation rates ineach varied widely in timing, direction and magnitude (Fig. 6.6 and Table 6.13); they also oftendiffered from those of the local artefact accumulation rates (Fig. 6.7). At the seven habitationsused for more than 3000 years, the following patterns can be seen: 1. a dramatic or substantial increase in the artefact accumulation rates within the last
3000 years, but usually within the third or second millennium BP. The magnitude ofthe increase varied from habitation to habitation;
2. at only one of these seven habitations (Loggers) (14% of the habitations) did the artefactaccumulation rates continue to increase gradually throughout the depth of the deposit,and the highest artefact accumulation rate occurred in the first millennium BP;
3. at the other six habitations (86% of habitations), a decrease in the artefactaccumulation rates is apparent in the first or second millennium BP, and the peak inthe artefact accumulation rates occurred sometime within the third and secondmillennium BP. The magnitude of the decrease varied from habitation to habitation;in most it was substantial but in others (e.g., Uprooted Tree) it was minor in nature.These differences indicate that the history of use and/or at least the amount of stone
knapping at each habitation varied over time. The inter-site variability in this index furtherconfirms the often-made statement that regional or local prehistories should not be based onthe sequence of evidence from ‘single sites’ (e.g., Struever 1971; Thomas 1979: 283; Attenbrow1981: 119; Davidson 1983: 94–5; Cosgrove 1995: 108–9).
Inter-zonal variability within the catchmentInter-zonal variability is seen in the habitation establishment rates, the numbers of habitationsused and the artefact accumulation rates. In the 12th millennium BP, habitations wereestablished initially in only one zone, the main valley bottoms. In the ninth millennium BP,a second zone (the periphery ridgetops) was used, and then in the seventh millennium BPa third zone (the subsidiary ridgesides; that is, if it was not inhabited in the 10th millenniumBP). It was not until the second millennium BP that habitations were established in anothertwo zones and only in the first millennium BP that all zones were used.
In each zone, the habitation establishment rate and the number of habitations used ineach millennium increased over time. However, the timing, direction and magnitude of thechanges in the artefact accumulation rates were not the same in each zone. In the first threezones inhabited (main valley bottoms, periphery ridgetops and subsidiary ridgesides), theaccumulation rates increased until the second millennium BP — then in the first millenniumBP the rates decreased, but at varying magnitudes. In contrast, the two zones which were notinhabited until the second millennium BP had increased accumulation rates in the firstmillennium BP.
Thus, habitations were not established in all topographic zones at the same time, andthree of the zones were used only within the last 2000 years. This pattern suggests there was agreater dispersal of activities within the catchment over time. It also appears visually, whenmapped (Figs 6.3 and 6.4), to be simply a denser or more concentrated habitation pattern,particularly in the last 2000 years, which is due partially to the distribution of the last-usedzones (main ridgesides, peninsula ridgetops, and subsidiary valley bottoms). Establishment ofhabitations in these three zones could be viewed as ‘movement into marginal areas’ or ‘an
What’s changing: population size or land-use patterns? The archaeology of Upper Mangrove Creek, Sydney Basin
terra australis 21
146

intensification of land-use’ as proposed by Lourandos (see Chapter 2). If so, it is on a muchsmaller scale than the examples given by Lourandos, but this presumably would not precludeit from being part of the same process. As with the individual habitations, each zone appears tohave had its own history of use (Tables 6.15 and 6.16).
Variations over time in the millennial growth rates Growth rates for the habitation and artefact indices reinforce the trends and complexityoutlined above (Table 6.6). In the three indices there are some consecutive millennia in whichgrowth rates were constant, but as a general rule they fluctuated quite markedly over the11,000-year period and varied dramatically between some periods of time. The growth ratesfor the habitation establishment rates varied from zero (×1) to ×3.5 and for the numberof habitations used from zero (×1) to ×1.81. The highest growth rates were in the artefactaccumulation rates — they varied from ×0.23 to ×14.39 — where there were decreases as wellas increases.
Because of the larger numbers of sites and artefacts in the more recent millennia, thequantitative changes that occurred in the habitation and artefact indices are usuallynumerically much larger than those that occurred earlier (i.e., pre-4000 BP). However, thegrowth rates associated with these larger increases and decreases in recent millennia are notalways greater than the growth rates of early-Holocene levels. The highest growth rates in thelocal artefact accumulation rates are recorded in the 10th and third millennia BP. Substantialdeclines in the growth rates occurred in the eighth and first millennia BP.
These variations in growth rates are pertinent to later discussions concerninginterpretations which are based on the assumption that increases in numbers of habitationsand/or artefacts are the product or material manifestation of increases in numbers of people— either general or local population increase, or increased use of a particular habitation.
Relationship between the timing of the quantitative changes and the appearance ofqualitative changes in the stone artefact assemblagesThe quantitative changes over time (i.e., in numbers of sites and artefacts) have beenexplained in terms of the qualitative changes in the stone artefact assemblages, that is, bychanges in typology, technology and raw material (Chapter 2). In the catchment, however, thetiming of the quantitative changes did not coincide with the appearance of new artefact typesand technological features or with changes in raw materials, for example: 1. backed artefacts appeared long before the dramatic increases in both the artefact
accumulation rates at individual habitations in the third or second millennium BPand the local artefact accumulation rate in the third millennium BP;
2. the disappearance of Bondi points and decrease in other backed artefacts occurred about1600 BP (i.e., in the second millennium BP), whereas at most habitations the decreasein the artefact accumulation rates occurred in the first millennium BP. This‘typological’ change thus occurred earlier than the dramatic decrease in the artefactaccumulation rates; and,
3. bipolar artefacts increase markedly in frequency percentage about 2800 BP; this‘typological’ change is related to an increase in bipolar working (a ‘technological’change), which is also correlated with an increase in the percentage frequency of quartz (a‘raw material’ change). Bipolar working is seen on quartz material more often thanon other types of raw material, such as silcrete and chert/tuff, and increases relativeto hand-held percussion. The predominance of quartz over FGS which occurred ca2800 BP was used as the criterion for the beginning of Phase 3 (see Chapter 3,Temporal sequences). The dramatic increase in the local artefact accumulation rate in
Temporal distribution: quantitative changes in the Upper Mangrove Creek catchment
terra australis 21
147

the third millennium BP appears to coincide with the beginning of Phase 3 (ca 2800BP). The dramatic changes in the artefact accumulation rates, however, are unlikelyto be caused directly by the increased use of quartz and/or bipolar working, for thefollowing reasons:
(a) a dramatic increase in the artefact accumulation rates does not necessarily occur inthe same level in which quartz dominates over FGS in individual archaeologicaldeposits — that is, the two events did not occur at the same time (see also Attenbrow1981, 1982a; Stern 1982);
(b) the increase in percentage frequency of quartz artefacts at individual habitationsindicates that the change in dominance from FGS to quartz was a gradual one,beginning about 5000 or 4000 BP and continuing until contact with some minoroscillations (e.g., Loggers, Attenbrow 1981: Fig. 6.13; Deep Creek, Stern 1982: Graph 3);
(c) artefact accumulation rates did not always increase over time in all archaeologicaldeposits. An increase in the percentage frequency of quartz did not always occur inall archaeological deposits, but there is no correlation between those archaeologicaldeposits in which increased artefact accumulation rates occurred and those in whichthe percentage frequency of quartz increased, and vice versa.
Concluding comments
The evidence presented above indicates that habitation patterns in the Upper Mangrove Creekcatchment varied over time, as did the accumulation of artefacts in individual habitations. Therelationships between the late-Holocene dramatic changes in the habitation and artefactindices are not obvious and are likely to have been complex. Subsistence and land-usepatterns associated with the changing habitation distribution patterns and changing artefactaccumulation rates were probably equally complex.
Grinding areas and images are also indicators of land-use and their creation wouldhave varied over time as well, though identifying quantitative changes over time in theircreation and the use of locations with these traits is much more difficult than is the case witharchaeological deposits. The only evidence that suggests a date for pigment images inthe catchment comes from outside the random sampling units. At Dingo and HornedAnthropomorph, polished dark-red ochre of similar colour to images on the walls was foundin the deposits of the southern shelter below an excavated context dated to ca 580 BP (581±120BP, GX-0070; Macintosh 1965: 85, 96–7). In the immediately adjacent northern shelter of thissite, charcoal directly above a layer with ochre of a light-red colour similar to line drawings onthe walls of that shelter was dated to between 144±125 BP and 120±155 BP (GX-0069).Macintosh considered that these dates indicated the northern images were created betweenAD 1750 and AD 1830, and the southern images ca AD 1400.
In the random sampling units, a broken ochred palette was found in Sunny Shelter inlevels with an estimated date of 1400–1600 BP (Fig. 3.18, see Chapter 3). In addition, outsidethe random sampling units, a piece of utilised ochre, dark-red haematite-rich material, wasfound in Deep Creek Shelter in a level dated to ca 2000 years ago (Attenbrow 1982a: 19–20, 27).However, pigment images were not seen on the walls or ceilings of either of these shelters.After his study of the rates of weathering and roof-fall in NSW south coast rockshelters,Hughes (1978: 41) stated, ‘decorated surfaces in shelters not used as habitations, especiallyengravings, might well have survived for hundreds or thousands of years.’ However, heconcluded that ‘it is unlikely that painting and drawings in such occupied shelters wouldhave survived more than a few decades and even rock engravings would probably have been
What’s changing: population size or land-use patterns? The archaeology of Upper Mangrove Creek, Sydney Basin
terra australis 21
148

completely removed within a few hundred years’. It is possible that pigment images onceexisted in Deep Creek and Sunny Shelters, but the surfaces are presently irregular and notfavourable for creating pigment images. It is also possible the ochre used in these shelters wasused for decorating tools, weapons or people’s bodies.
Some information about the grinding grooves, which are assumed to be associatedwith making and maintaining ground-edged implements, can be obtained from the catchment’sarchaeological deposits. Ground-edged implements (e.g., axes/hatchets) and fragments fromthem occur in the deposits only in levels dating to the last 4000 years, and, increasingly, thelast 2000 years (Appendix 1). Stone types used to manufacture ground-edged implementsoccur increasingly in levels dating to the last 4000 years; grinding grooves are thus assumed tohave been made in the catchment some time within the last 4000 years, and principally in thelast 2000 years.
The introduction of ground-edged implements into south-eastern Australia some4000 years ago, and the subsequent increase in their manufacture, would have brought aboutchanges in land-use patterns in the catchment since: 1. the raw materials from which they were made (usually an igneous or an indurated
metamorphic rock) differed from that used to make flaked stone implements; and,2. areas of suitable sandstone (i.e., uniform and coarse-grained) were required to shape
and/or sharpen the axe/hatchet heads. Basalt sources, the rock from which many of the ground implements in the catchment
were made (pers. obs.), are not present within the catchment, but exist within a short distance(<10km) to the west (Mogo Creek) and to the south (e.g., Basalt Hill, Kulnura Hymix quarriesand Popran Creek), as well as elsewhere in the region. The nearby outcrops may not be thespecific sources of basalt used for the catchment implements since the surface exposures wereprobably deeply weathered (as at the unquarried Basalt Hill). However, basalt pebbles ofuseable size and quality occur in creeks below these sources (Mogo, Warre Warren and PopranCreeks respectively) (local residents Lionel Young and Robert Thompson [pers. comm.] andpers. obs.). The need for this type of raw material and the restricted locations in which itoccurs are likely to have influenced or altered the movements of people as well as tradingpatterns and networks.
Grinding grooves in the catchment have a more restricted distribution pattern thanother archaeological traits. They occur on sandstone, in particular, the Hawkesbury sandstone,which is more uniform and coarser-grained than the Narrabeen Group of sandstones, thoughexposed surfaces of the latter are sometimes suitable. In the catchment, the Hawkesburysandstone is restricted to the ridgetops and upper ridgesides. Whether the introduction ofground-edged implements and their manufacture initiated use of different (previouslyunused) topographic zones is not clear. However, it would have meant increased use of certainareas and an increase in the range of activities undertaken in areas which previously may onlyhave been used for, say, hunting and gathering food resources.
Many eastern Australian studies in the 1970s and 1980s documented dramatic orsubstantial increases in the late-Holocene in the number of habitations used and the numberof artefacts accumulated over time (see Chapter 2). The catchment data similarly indicate acontinuing increase in the number of habitations established and used, but the artefactaccumulation rates in many individual habitations and in the catchment as a whole did notcontinue to increase, and there was a dramatic decrease in the first millennium BP. Suchdecreases were rarely acknowledged in the 1970s and 1980s, but they are, however, commonin many other regions and localities in eastern Australia, as will be seen in the followingchapter and as has been shown in more recent studies.
Temporal distribution: quantitative changes in the Upper Mangrove Creek catchment
terra australis 21
149


151
Chronological changes in the numbers of habitations and/or artefacts were assumed by manyresearchers in the 1970s and 1980s to have been produced by changes in the size ofpopulations. Explanations entailing continuing population increase were based, in some cases,on the belief that the rate of artefact production and/or the number of habitations usedcontinued to increase throughout the period of Aboriginal occupation until Europeancolonisation. Archaeological evidence for quantitative changes in several eastern Australianregions is reviewed below with two aims in mind: • firstly, to show that trends identified in the Upper Mangrove Creek catchment are not
anomalous. That is, (a) substantial decreases in artefact accumulation rates alsooccurred in other regions in the last 1000 years, and (b) dramatic or substantialincreases in the artefact accumulation rates, the rate of habitation establishment andthe number of habitations occurred in other regions later than 4000 BP; and,
• secondly, to examine data used by researchers of the 1970s and 1980s as support fortheir propositions that quantitative changes in the archaeological record indicated (a)that the population continued to increase in size until contact; and/or (b) thatdramatic increases in the numbers of habitations and/or artefacts coincided in timewith the introduction of the ‘Small Tool Tradition’ and/or Bondaian phases of theEastern Regional Sequence.The review, initially undertaken in 1987, includes sites and regions studied or used as
supporting evidence for the interpretations and explanations presented in Chapter 2, but alsoincludes other regions and several other sites for which habitation and/or artefact indicescould be calculated. The regions, and the regions in which the sites were located, are: theNSW south coast-Sydney, south-western Victoria, central Queensland highlands, south-easternQueensland, NSW–ACT–Victorian southern uplands-tablelands, the Mallee in north-westernVictoria, the NSW Hunter Valley, NSW Blue Mountains, and the lower Murray Valley in SouthAustralia (Tables 7.1 and 7.2, Figs 7.1 and 7.2; Appendix 4). The review was consideredcomprehensive at the time. There were (and still are) few regions for which data are availableto estimate regional habitation establishment rates and/or to calculate artefact accumulationrates for a number of sites within the same region.
Quantitative changes in other regions ofeastern Australia: a review
7
terra australis 21
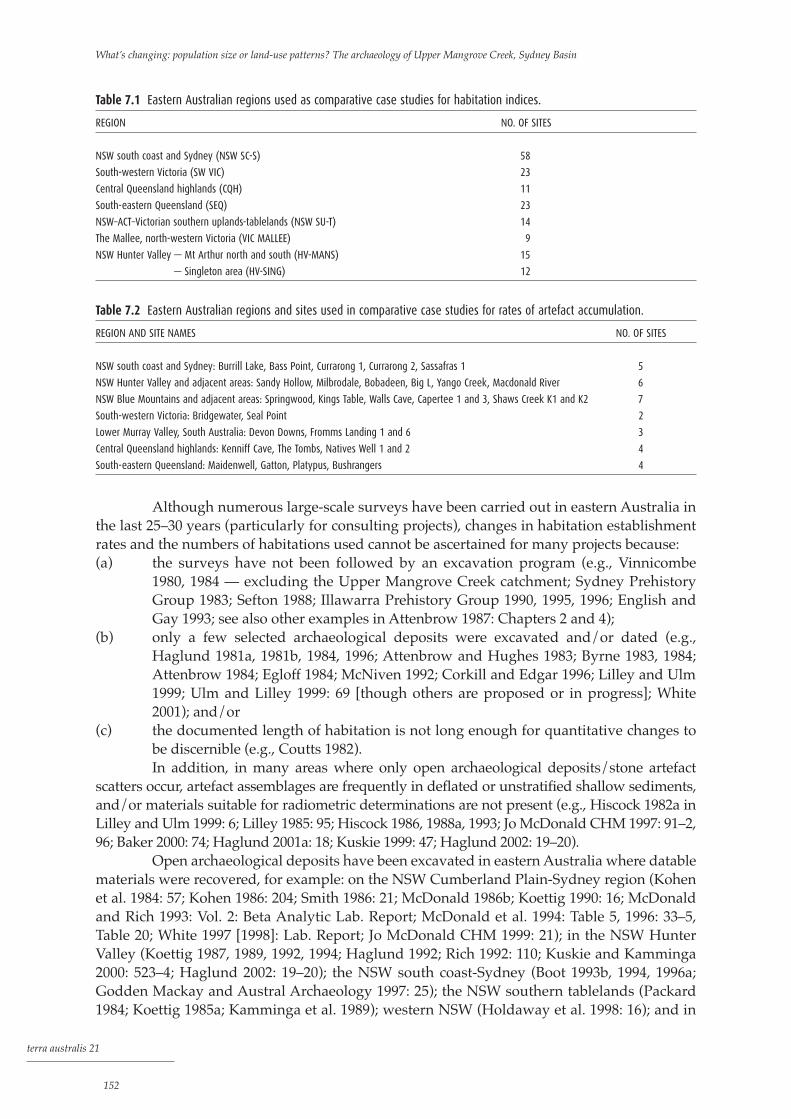
Although numerous large-scale surveys have been carried out in eastern Australia inthe last 25–30 years (particularly for consulting projects), changes in habitation establishmentrates and the numbers of habitations used cannot be ascertained for many projects because: (a) the surveys have not been followed by an excavation program (e.g., Vinnicombe
1980, 1984 — excluding the Upper Mangrove Creek catchment; Sydney PrehistoryGroup 1983; Sefton 1988; Illawarra Prehistory Group 1990, 1995, 1996; English andGay 1993; see also other examples in Attenbrow 1987: Chapters 2 and 4);
(b) only a few selected archaeological deposits were excavated and/or dated (e.g.,Haglund 1981a, 1981b, 1984, 1996; Attenbrow and Hughes 1983; Byrne 1983, 1984;Attenbrow 1984; Egloff 1984; McNiven 1992; Corkill and Edgar 1996; Lilley and Ulm1999; Ulm and Lilley 1999: 69 [though others are proposed or in progress]; White2001); and/or
(c) the documented length of habitation is not long enough for quantitative changes tobe discernible (e.g., Coutts 1982). In addition, in many areas where only open archaeological deposits/stone artefact
scatters occur, artefact assemblages are frequently in deflated or unstratified shallow sediments,and/or materials suitable for radiometric determinations are not present (e.g., Hiscock 1982a inLilley and Ulm 1999: 6; Lilley 1985: 95; Hiscock 1986, 1988a, 1993; Jo McDonald CHM 1997: 91–2,96; Baker 2000: 74; Haglund 2001a: 18; Kuskie 1999: 47; Haglund 2002: 19–20).
Open archaeological deposits have been excavated in eastern Australia where datablematerials were recovered, for example: on the NSW Cumberland Plain-Sydney region (Kohenet al. 1984: 57; Kohen 1986: 204; Smith 1986: 21; McDonald 1986b; Koettig 1990: 16; McDonaldand Rich 1993: Vol. 2: Beta Analytic Lab. Report; McDonald et al. 1994: Table 5, 1996: 33–5,Table 20; White 1997 [1998]: Lab. Report; Jo McDonald CHM 1999: 21); in the NSW HunterValley (Koettig 1987, 1989, 1992, 1994; Haglund 1992; Rich 1992: 110; Kuskie and Kamminga2000: 523–4; Haglund 2002: 19–20); the NSW south coast-Sydney (Boot 1993b, 1994, 1996a;Godden Mackay and Austral Archaeology 1997: 25); the NSW southern tablelands (Packard1984; Koettig 1985a; Kamminga et al. 1989); western NSW (Holdaway et al. 1998: 16); and in
What’s changing: population size or land-use patterns? The archaeology of Upper Mangrove Creek, Sydney Basin
terra australis 21
152
Table 7.1 Eastern Australian regions used as comparative case studies for habitation indices.
REGION NO. OF SITES
NSW south coast and Sydney (NSW SC-S) 58
South-western Victoria (SW VIC) 23
Central Queensland highlands (CQH) 11
South-eastern Queensland (SEQ) 23
NSW–ACT–Victorian southern uplands-tablelands (NSW SU-T) 14
The Mallee, north-western Victoria (VIC MALLEE) 9
NSW Hunter Valley — Mt Arthur north and south (HV-MANS) 15
— Singleton area (HV-SING) 12
Table 7.2 Eastern Australian regions and sites used in comparative case studies for rates of artefact accumulation.
REGION AND SITE NAMES NO. OF SITES
NSW south coast and Sydney: Burrill Lake, Bass Point, Currarong 1, Currarong 2, Sassafras 1 5
NSW Hunter Valley and adjacent areas: Sandy Hollow, Milbrodale, Bobadeen, Big L, Yango Creek, Macdonald River 6
NSW Blue Mountains and adjacent areas: Springwood, Kings Table, Walls Cave, Capertee 1 and 3, Shaws Creek K1 and K2 7
South-western Victoria: Bridgewater, Seal Point 2
Lower Murray Valley, South Australia: Devon Downs, Fromms Landing 1 and 6 3
Central Queensland highlands: Kenniff Cave, The Tombs, Natives Well 1 and 2 4
South-eastern Queensland: Maidenwell, Gatton, Platypus, Bushrangers 4

Quantitive changes in other regions of eastern Australia: a review
terra australis 21
153
BRISBANE
COOKTOWN
MELBOURNE
0 500
km
N
GD
E
C
SYDNEY
UMCC*
A
B
F
K
J
KEY : Regions and abbreviationsA Central Queensland highlands - CQHB South-eastern Queensland - SEQC NSW Hunter valley - NSW HVD NSW South coast and Sydney - NSW SC-SE NSW southern uplands-tablelands - NSW SU-TF Victorian Mallee - MALLEEG South-western Victoria - SW VICH Princess Charlotte Bay J Lower south-eastern South Australia K Younghusband Peninsula (Coorong)
H
Figure 7.1 Regions reviewed in eastern Australia.

What’s changing: population size or land-use patterns? The archaeology of Upper Mangrove Creek, Sydney Basin
terra australis 21
154
KEY: Site names and abbreviations1 Kenniff Cave (KC)2 The Tombs (TT)3 Native Well 1 (NW1)4 Native Well 2 (NW2)5 Maidenwell (Mai)6 Gatton (Gat)7 Bobbadeen (Bob)8 Sandy Hollow (SH)9 Milbrodale (Mil)10 Big L (Big)11 Yango Creek (YC)12 Macdonald River (MR)13 Capertee 1 14 Capertee 3 (Cap3)15 Kings Table (KT)
16 Walls Cave (WC)17 Springwood (SC)18 Shaws Creek19 Shaws Creek (K2)20 Burrill Lake (BL)21 Currarong 1 (Cur1)22 Currarong 2 (Cur2)23 Bass Point (BP)24 Sassafras (Sas)25 Bridgewater26 Seal Point27 Devon Downs (DD)28 Fromms Landing 1 29 Fromms Landing 6 (FL6)
2927/28
25
26
2021/2224
18/19
15/16/17
13/14
7 8/9 10/11
UMCC12
SYDNEY23
BRISBANE
12
3/4
5
6
COOKTOWN
MELBOURNE
*
0 500
km
N
Figure 7.2 Sites reviewed in eastern Australia.

Quantitive changes in other regions of eastern Australia: a review
terra australis 21
155
other eastern states (Ross 1981, 1984; Robins 1996). However, incorporating openarchaeological deposits into an analysis of habitation establishment rates or numbers ofhabitations used based on radiocarbon ages can sometimes be problematic (see below). Otherways of estimating the age of open archaeological deposits through identification ofdiagnostic features in stone artefact assemblages have been attempted (Hiscock 1986, 1988a,1993: 74; Holdaway et al. 1998: 16; Ulm and Hall 1996: 54), though not yet successfully (Baker1992: 10, 64).
To compare the habitation establishment rates, the numbers of habitations used andartefact accumulation rates for the Upper Mangrove Creek catchment with trends in the otherregions meant recalculating available data where these indices had not been calculated for theoriginal studies. However, indices for both habitations and artefacts could not be calculatedfor all regions reviewed. For the Victorian Mallee and the NSW–ACT–Victorian southernuplands-tablelands, data were available for calculating trends in only habitation establishmentand/or use and not the artefact accumulation rates. For the lower Murray Valley and NSWBlue Mountains, the few excavated archaeological deposits allowed calculation of onlyartefact accumulation rates. Data on which to produce inter-site and inter-zonal trends, as wellas local artefact accumulation rates (as calculated for the catchment), are not available for anyof the regions. In some case studies, I comment on the original data and methods used, andpresent alternative ways of analysing or interpreting the data (Appendix 4). Time and spaceconstraints restrict comments about the limitations of the data, but those made illustrate someof the problems and difficulties faced in using quantitative data on sites and artefacts toindicate changes in population size and aspects of human behaviour. For some case studies,more recently radiometrically dated archaeological deposits are added to data sets of earlierresearchers and the data reanalysed (e.g., NSW south coast-Sydney and NSW–ACT–Victoriansouthern uplands-tablelands). For others, e.g., south-eastern Queensland and south-westernVictoria, the results of recent studies are also reported.
Millennial and average annual growth rates for habitation and artefact indices arealso presented for each region (see Chapter 6 for methods of calculation). These rates werecalculated to assess claims for dramatic increases in the rate at which change took place; forexample, a six- to tenfold increase in artefact accumulation rates stated by Hughes andLampert (1982) for the NSW south coast, and a tenfold increase in sites by Ross (1984) for theVictorian Mallee. Average annual growth rates were the most expedient growth rates tocalculate for artefact accumulation rates, and are relevant to discussions about the evidence forpopulation change. Population growth rates are usually discussed in terms of average annualgrowth rates (Ammerman et al. 1976: 29–30; Hassan 1981: 200–2; Gray 1985). Gray (1985: 23)says that a tenfold population increase over 2000 years implies an average annual growth rateof only 0.1% p.a., which is ‘hardly a population explosion’, and evidence for figures in excessof 0.5% p.a. are required ‘to signify a considerable departure from near-stationarity’.
In this and future chapters, the word ‘site/s’ refers only to sites with archaeologicaldeposit (i.e., habitation/s) unless specifically mentioned. Other archaeological traits (e.g.,grinding areas, images, burials and quarries) are not included in the analyses. The termarchaeological deposit includes shell middens, and those referred to as ‘dated’ may have hadtheir age estimated by radiometric methods or on the basis of diagnostic artefacts or othertraits. Archaeological deposits or artefact assemblages which do not have specific ages butwhich were estimated to be, say, ca 7000 BP or ca 3000 BP, are assigned to the seventhmillennium BP or third millennium BP respectively, and not to the eighth millennium BP orfourth millennium BP.

What’s changing: population size or land-use patterns? The archaeology of Upper Mangrove Creek, Sydney Basin
terra australis 21
156
Changes in the habitation indices
In analysing the Upper Mangrove Creek data, the term ‘habitation indices’ was used to refercollectively to two or more of the indices relating to habitations; that is, the habitationestablishment rate and the number of habitations used. For this review, a third index — therate of known-habitation use — has been used for some areas. Trends in these three indices inseveral regions of eastern Australia were investigated to determine: 1. whether there were dramatic changes in the indices in the latter half of the Holocene
(as in the Upper Mangrove Creek catchment) and, if so, the timing of such changes; 2. the nature of these changes; that is, whether there were dramatic increases or
dramatic decreases in these rates in the latter half of the Holocene; and,3. whether growth rates in the habitation indices changed dramatically over time, and
what the magnitude of such changes was. For the Upper Mangrove Creek catchment, the habitation establishment rate and the
number of habitations used in each millennium were described separately. In this review, thesetwo indices are discussed together since many authors did not distinguish between the twoconcepts; ‘an increase in site numbers’ was the term most commonly used. In addition, thehabitation establishment rate and/or the number of habitations used in each millennium couldnot be calculated for all regions. In deep and/or stratified archaeological deposits (usually inrockshelters or as shell middens), it can usually be ascertained whether the habitation continuedto be used regularly and/or whether there were long periods of abandonment, for example, bythe presence or absence of sterile layers. (By this, I don’t mean to imply that habitations wereused continuously throughout each millennium or that all the habitations noted as being usedduring a particular millennium were all used contemporaneously; habitation is assumed to bediscontinuous or intermittent.) However, it is usually not possible to make such assumptions inthe case of shallow open archaeological deposits.
Using age determinations from open habitations which consist of unstratifiedshallow stone artefact or shell scatters for the type of analysis undertaken here is moreproblematic than using those from deep stratified archaeological deposits in boundedlocations such as rockshelters. Firstly, at extensive open habitation sites, materials fromsuccessive visits may not have been superimposed in the same area and so it is often notpossible to ascertain the total length of time over which individual open habitations wereused. Even if several dates are obtained, it is usually not possible to state whether the earliestradiocarbon age relates to the habitation’s establishment or to some other time during its use.Dates gained by radiometric means or based on diagnostic features for a shallow openhabitation can usually indicate only that it was used at that particular time or during thatparticular period/phase. In fact, the habitation may have been established much earlier,and/or it may have been used over a longer period of time than the date/s indicate/s. Themost that can be calculated for regional studies where only open habitations have beenrecorded is the ‘the number of habitations known to be used’ at particular times or inparticular periods. Secondly, the relationship between artefact assemblages in openhabitations and datable materials (say, charcoal) is often less secure than in rockshelterdeposits. For example, unless the charcoal comes from a humanly derived feature (e.g., a heat-treatment or cooking pit, or hearth), there is always the possibility that it has survived in/onthe ground for a very long period of time and that bioturbation or geomorphological slopeprocesses have moved it into association with cultural material of a later age. Thirdly, manyshallow unstratified archaeological deposits do not have diagnostic artefact types or materialsuitable for radiometric dating. Fourthly, the way artefact scatters have been defined and/orinterpreted in a particular project may influence the calculation of indices. For example, two

Quantitive changes in other regions of eastern Australia: a review
terra australis 21
157
artefact scatters visible on eroded land surfaces along a creek bank may have been describedas two archaeological sites, but there may be unexposed buried artefacts between the two‘archaeological sites’ and they are actually one site in physical and behavioural terms. If datesin the same millennium were obtained for both artefact scatters and they were actually part ofthe same site, including both dates when calculating the number of habitations used mayskew the trends.
Within eastern Australia, evidence for changes in the number of habitationsestablished or used is available for only a few widely dispersed regions. Seven regions withinthe area stretching from the central Queensland highlands to south-western Victoria (Table 7.1,Fig. 7.1, Appendix 4) are included in this review of habitation indices. Trends for these sevenregions, along with those for the Upper Mangrove Creek catchment, are summarised in Table7.3. Archaeological evidence from Princess Charlotte Bay, lower south-eastern South Australiaand the Younghusband Peninsula (southern and northern Coorong) was also used as the basisfor proposing demographic change over time, usually in association with local shifts in
TTaabbllee 77..33 Regions in eastern Australia: summary of habitation indices. Italics indicates millennia with highest rate or largest
number of habitations/millennium in region; underline – millennium in which greatest/most dramatic increase occurred in
region; # – millennium in which highest growth rate occurred in region. Table 7.1 has full names of regions.
Rate of habitation establishment Number of habitations used Rate of known-habitation
in each millennium in each millennium use in each millennium
Regions Regions Regions
Mill. UMCC NSW SW CQH SEQ NSW UMCC NSW CQH SEQ NSW VIC MALLEE NSW
BP SC-S VIC SU-T SC-S SU-T STH NTH HV(SING)
25th 1 1
24th 1
23rd 1
22nd 1 1 1
21st 1 1 1 1 1 1
20th 1 1 1 1
19th 2 1 1 1
18th 1 1 3 1 1 2
17th 3 1 1 2
16th 3 1 1 2
15th 1 4 1 1 2
14th 4 1 1 2
13th 1 1 1 4 2 1 2 __ __
12th 1 1 1 4 2 1 2
11th 2 1 1 6 3 1 2 ? ?
10th (1)0 1 (2)1 6 4 1 2
9th 1 2 6 3 1 2 2–3 2–38th 2 1 2 8 3 1 2 low low
7th (0)1 2 3 10 3 1 2
6th 1 3 1 1 4 13 3 2 2
5th 1 2 1 2 #4 5 15 #5 #6 2 __ __
4th 2 #9 1 #2 1 2 7 #24 7 7 # 4 ? ? 2
3rd 2 9 2 #2 3 1 9 33 9 10 5 24 2 4
2nd #7 17 #11 #2 5 2 16 49 11 14 7 high low 5
1st 14 8 5 0 9 #7 #29 55 11 23 #14 7
Total
habitations 30 58 24 11 23 14 121 20 12

What’s changing: population size or land-use patterns? The archaeology of Upper Mangrove Creek, Sydney Basin
terra australis 21
158
population from one environmental zone to another (Chapter 2, Fig. 7.1). However, thesestudies have not been included in this review, as data were not presented that enabledcalculation of artefact indices for individual habitations and habitation indices for the studyarea as a whole and for different environmental zones.
Because of constraints discussed above, I have calculated both the habitationestablishment rate and the number of habitations used in each millennium for only fourregions in which the sample consists of archaeological deposits in rockshelters and/orrelatively deep/stratified open archaeological deposits (NSW south coast and Sydney, centralQueensland highlands, south-eastern Queensland, and NSW–ACT–Victorian southernuplands-tablelands) (Table 7.3). For south-western Victoria, where basal dates are quoted foropen archaeological deposits but not always for the length of habitation, only habitationestablishment rates were calculated. For the NSW Hunter Valley and Victorian Mallee,I calculated only the rate of known-habitation use.
Changes in the rate of habitation establishmentIn the five regions for which the habitation establishment rates were calculated, the rates in thelate-Pleistocene and first half of the Holocene were low, as in the Upper Mangrove Creekcatchment (Table 7.3, Figs 7.3 to 7.7).
In only two regions (south-eastern Queensland and NSW–ACT–Victorian southernuplands-tablelands) did the rates continue to increase until contact, as in the catchment (Figs7.6A and 7.7A). In the other three (NSW south coast-Sydney, south-western Victoria andcentral Queensland highlands), they decreased in the first millennium BP (Figs 7.3A to 7.5A).Decreases in the habitation establishment rates also occurred at other times in the lateHolocene; for example, in the fifth millennium BP in the NSW south coast-Sydney region,fourth millennium BP in south-eastern Queensland and third millennium BP inNSW–ACT–Victorian southern uplands-tablelands (Figs 7.3A, 7.6A and 7.7A). It is interestingto note that the low habitation establishment rate in the fifth millennium BP in the NSW southcoast-Sydney, which was present in Hughes and Lampert’s (1982: Fig. 6) and Attenbrow’s(1987: Fig. 9.4) data sets, still remains despite the increased size of the data set used here. Sincethe sample includes rockshelters as well as sites in the coastal hinterland, it seems unlikelythat this decrease/low rate is due entirely to coastal erosion (cf. Head 1987: 455–8).
In each region, the most dramatic or greatest increase in the habitation establishmentrate occurred in the same millennium as the highest habitation establishment rate. However,this did not happen in the same millennium in each region. It was in the first millennium BP(as in the Upper Mangrove Creek catchment, Fig. 6.1B) in two regions (south-easternQueensland and NSW–ACT–Victorian southern uplands-tablelands, Figs 7.6A and 7.7A), andin the second millennium BP in two regions (NSW south coast-Sydney and south-westernVictoria, Figs 7.3A and 7.4B). In the central Queensland highlands, there is no ‘highest’ rate or‘dramatic’ increase (Fig. 7.5A) — two sites were established in four successive millennia fromthe fifth millennium BP onwards.
Although the highest establishment rates and the greatest increases occurred after 5000BP, there were also substantial increases in the habitation establishment rates in some regions(e.g., NSW south coast-Sydney) as early as the eighth millennium BP (Tables 7.3 and A4/1).
Changes in the number of habitations usedIn the four regions for which the number of habitations used was calculated, the numbersincreased during successive millennia (Table 7.3). All major increases occurred in the late-Holocene. There were no decreases, but numbers remained stable in the central Queenslandhighlands in the second and first millennia BP (Fig. 7.5B).

South coast
South coast hinterland
Sydney
Sydney hinterland
26 24 22 20 18 16 14 12 10 8 6 4 2 0
18
16
14
12
10
8
6
4
2
NO.
OF H
ABITA
TION
S /
MIL
LENN
IUM
YEARS BP (x1000)
26 24 22 20 18 16 14 12 10 8 6 4 2 0
60
56
52
48
44
40
36
32
28
24
20
16
12
8
4
NO.
OF H
ABITA
TION
S /
MIL
LENN
IUM
YEARS BP (x1000)
A.
B.
Quantitive changes in other regions of eastern Australia: a review
terra australis 21
159
Figure 7.3 NSW south coast and Sydney: (A) Rate of habitation establishment in each millennium. (B) Number of
habitations used in each millennium. N = 58, Tables A4/1 and A4/2 have sites included.

What’s changing: population size or land-use patterns? The archaeology of Upper Mangrove Creek, Sydney Basin
terra australis 21
160
8
6
4
2
2 4 6 8 10 12
NO.
OF S
ITES
YEARS BP (x1000)
YEARS BP (x1000)
NO.
OF S
ITES
8
6
4
2
1 2 3 4 5 6 7 8 9 10 11 12 13
open inland sites
rockshelters
coastal shell middens
earth mounds
non-basal dates
A.
B.
Figure 7.4 South-western Victoria: number of habitations established in each millennium. (A) Redrawn from Lourandos
1983: 86, Fig. 3: basal radiocarbon dates from a sample of 19 archaeological sites. (B) Redrawn from Williams 1988: Fig.
10.1: basal radiocarbon dates from a sample of 25 archaeological sites. Tables A4/3 and A4/4 have sites included; Toolondo
drainage system and Werribee burials have been excluded from graphs.

Quantitive changes in other regions of eastern Australia: a review
terra australis 21
161
22 20 18 16 14 12 10 8 6 4 2 0
6
4
2
NO.
OF H
ABITA
TION
S /
MIL
LENN
IUM
YEARS BP (x1000)
22 20 18 16 14 12 10 8 6 4 2 0
12
10
8
6
4
2NO.
OF H
ABITA
TION
S /
MIL
LENN
IUM
YEARS BP (x1000)
x
x The Tombs re-established
?
A.
B.
Figure 7.5 Central Queensland highlands: (A) Rate of habitation establishment in each millennium. (B) Number of
habitations used in each millennium. N = 11, Table A4/5 and A4/6 have sites included.

What’s changing: population size or land-use patterns? The archaeology of Upper Mangrove Creek, Sydney Basin
terra australis 21
162
22 20 18 16 14 12 10 8 6 4 2 0
10
8
6
4
2
NO.
OF H
ABITA
TION
S /
MIL
LENN
IUM
YEARS BP (x1000)
22 20 18 16 14 12 10 8 6 4 2 0
24
22
20
18
16
14
12
10
8
6
4
2
NO.
OF H
ABITA
TION
S /
MIL
LENN
IUM
YEARS BP (x1000)
A.
B.
Figure 7.6 South-eastern Queensland: (A) Rate of habitation establishment in each millennium. (B) Number of habitations
used in each millennium. N = 23, Tables A4/7 and A4/8 have sites included.

Quantitive changes in other regions of eastern Australia: a review
terra australis 21
163
22 20 18 16 14 12 10 8 6 4 2 0
14
12
10
8
6
4
2
NO.
OF H
ABITA
TION
S /
MIL
LENN
IUM
YEARS BP (x1000)
22 20 18 16 14 12 10 8 6 4 2 0
14
12
10
8
6
4
2
NO.
OF H
ABITA
TION
S /
MIL
LENN
IUM
YEARS BP (x1000)
Radiocarbon-dated AD in rockshelter (N=9)
Undated AD in rockshelter (N=5)
Open AD (N=11)
?
25
A.
B.
Radiocarbon-dated AD in rockshelter (N=9)
Undated AD in rockshelter (N=5)
Open AD (N=11)
Figure 7.7 NSW–ACT–Victorian southern uplands-tablelands: (A) Rate of habitation establishment in each millennium.
(B) Number of habitations used in each millennium. N = 25, Tables A4/9 and A4/10 have sites included.

In the NSW south coast-Sydney, south-eastern Queensland and NSW–ACT–Victoriansouthern uplands-tablelands, the highest number of habitations used was in the firstmillennium BP (Figs 7.3B, 7.6B, 7.7B).
In south-eastern Queensland and the NSW–ACT–Victorian southern uplands-tablelands, the greatest increase in the number of habitations used was in the first millenniumBP, and in NSW south coast-Sydney it was in the second millennium BP. In the centralQueensland highlands, there was a uniform increase (+2) in the fifth, fourth, third and secondmillennia BP.
Changes in the rate of known-habitation useFor the Victorian Mallee, Ross’ data suggest a dramatic increase in the rate of known-habitation use in the southern area during the Late Phase (4500 BP to contact). In the northernarea, the Early Phase (ca 12,000 to 6000 BP) rates were similar to (or possibly slightly higher orslightly lower, depending on the method of calculation) than those of the Late Phase (Table7.3, Fig. 7.8). The timing and nature of the increase in the rate of known-habitation use in thesouthern Mallee is, however, equivocal (see case study in Appendix 4). Although Ross placedit at ca 4500 BP, it could have been later or spread out over a number of millennia.
The trend in the NSW Hunter Valley, according to Hiscock’s (1986) analysis of theMount Arthur North and South (MANS) sites near Muswellbrook (Fig. 7.9A, Table A4/14),appears to differ from that in other regions. In Hiscock’s analysis, the most significant increasein the rate of known-habitation use occurred at a relatively late date (ca 1300 BP) and wasfollowed by a subsequent decrease ca 800 BP; that is, both the initial increase and thesubsequent decrease occurred within the last 1500 years. However, depending on when thehabitations were used and how the dates are used, the trend in Hiscock’s figures could be seenas a substantial increase in the second millennium BP and a decrease in the first millennium BP.
In contrast with Hiscock’s figures,trends based on recent radiocarbon datesfrom sites in the Singleton area suggest acontinuing, relatively steady increase in therate of known-habitation use over the last4000 years (Fig. 7.9B, Tables 7.3, A4/15 andA4/16).
Changes in the growth rates forhabitation indicesGrowth rates for habitation establishmentrates of the late-Pleistocene and the first halfof the Holocene were not calculated becauseof the low frequency at which habitationswere established in all regions (Tables 7.4 and7.6). However, data on the number ofhabitations used (Table 7.5) suggest that inmost regions the trend in the growth ratesaltered substantially during the earlyHolocene, and that changes in the last 2000years were part of this longer term trend.The following analyses exclude situations inwhich a twofold increase represents anincrease from one to two sites.
What’s changing: population size or land-use patterns? The archaeology of Upper Mangrove Creek, Sydney Basin
terra australis 21
164
10 8 6 4 2 0
8
6
4
2
NO.
OF H
ABITA
TION
S US
ED /
MIL
LENN
IUM
YEARS BP (x1000)
Southern Mallee Northern Mallee
Figure 7.8 The Mallee, north-western Victoria: rate of
known-habitation use in each millennium based on
radiometrically dated sites, which were assigned to a
millennium on the basis of calibrated radiocarbon dates
and TL dates. N = 9, Table A4/11 has sites included.

Habitation establishment rates: Changes in the millennial growth rates variedregionally (Table 7.4). The increases ranged between +50% (×1.5) and +450% (×5.5) and thedecreases between -33% p.a. (×0.7) and -100% p.a. (×0), although periods of zero growth(stability, 0%, ×1) were also recorded. The highest millennial growth rate did not occur in thesame millennium in every region: fifth millennium BP in south-eastern Queensland, fourthmillennium BP in NSW south coast-Sydney, second millennium BP in south-western Victoria,and first millennium BP in NSW–ACT–Victorian southern uplands-tablelands. In three of thefive regions, the growth rates decreased with negative rates in the first millennium BP.
Quantitive changes in other regions of eastern Australia: a review
terra australis 21
165
Figure 7.9 NSW Hunter Valley: number of habitations known to be used. (A) Mount Arthur North and South, Muswellbrook.
N = 15. (B) Central lowlands (Singleton area). N = 12. Tables A4/14 and A4/15 have sites included.
15 10 5 0
12
10
8
6
4
2
NO.
OF K
NOW
N HA
BITA
TION
S US
ED /
PHA
SE
YEARS BP (x100)
5 4 3 2 1 0
10
8
6
4
2
NO.
OF K
NOW
N HA
BITA
TION
S US
ED /
MIL
LENN
IUM
YEARS BP (x1000)
>1300
B.
A.
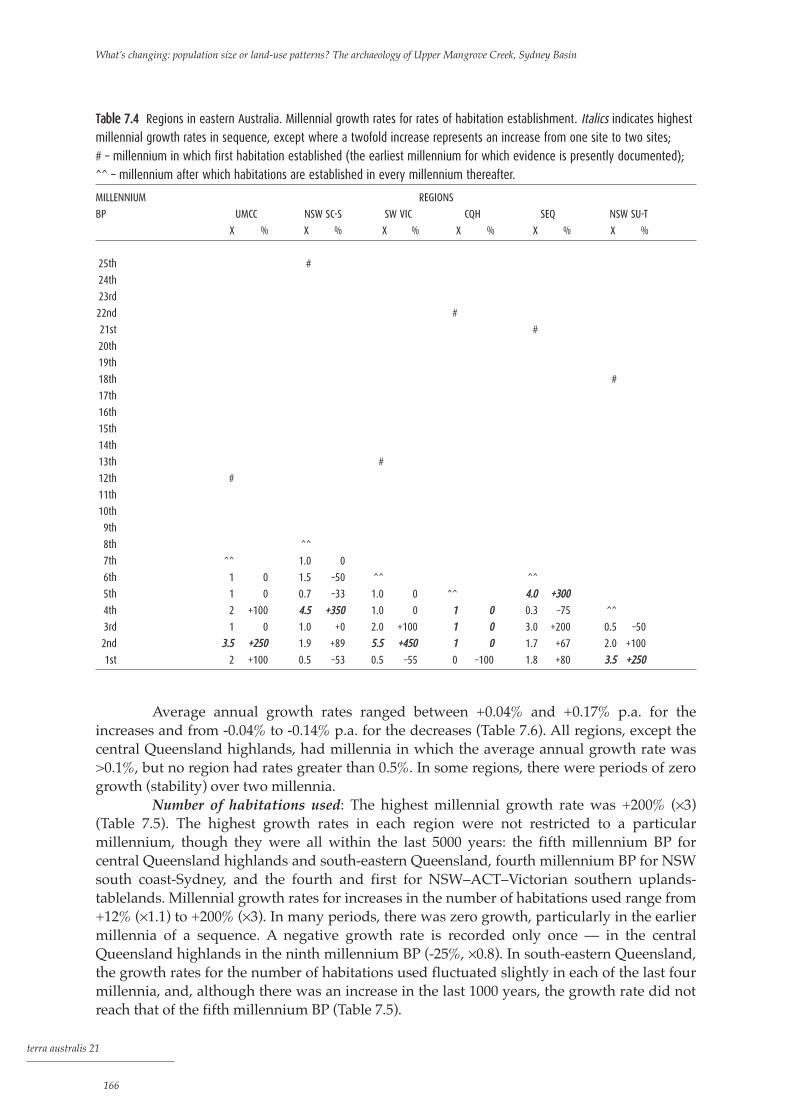
Average annual growth rates ranged between +0.04% and +0.17% p.a. for theincreases and from -0.04% to -0.14% p.a. for the decreases (Table 7.6). All regions, except thecentral Queensland highlands, had millennia in which the average annual growth rate was>0.1%, but no region had rates greater than 0.5%. In some regions, there were periods of zerogrowth (stability) over two millennia.
Number of habitations used: The highest millennial growth rate was +200% (×3)(Table 7.5). The highest growth rates in each region were not restricted to a particularmillennium, though they were all within the last 5000 years: the fifth millennium BP forcentral Queensland highlands and south-eastern Queensland, fourth millennium BP for NSWsouth coast-Sydney, and the fourth and first for NSW–ACT–Victorian southern uplands-tablelands. Millennial growth rates for increases in the number of habitations used range from+12% (×1.1) to +200% (×3). In many periods, there was zero growth, particularly in the earliermillennia of a sequence. A negative growth rate is recorded only once — in the centralQueensland highlands in the ninth millennium BP (-25%, ×0.8). In south-eastern Queensland,the growth rates for the number of habitations used fluctuated slightly in each of the last fourmillennia, and, although there was an increase in the last 1000 years, the growth rate did notreach that of the fifth millennium BP (Table 7.5).
What’s changing: population size or land-use patterns? The archaeology of Upper Mangrove Creek, Sydney Basin
terra australis 21
166
TTaabbllee 77..44 Regions in eastern Australia. Millennial growth rates for rates of habitation establishment. Italics indicates highest
millennial growth rates in sequence, except where a twofold increase represents an increase from one site to two sites;
# – millennium in which first habitation established (the earliest millennium for which evidence is presently documented);
^^ – millennium after which habitations are established in every millennium thereafter.
MILLENNIUM REGIONS
BP UMCC NSW SC-S SW VIC CQH SEQ NSW SU-T
X % X % X % X % X % X %
25th #
24th
23rd
22nd #
21st #
20th
19th
18th #
17th
16th
15th
14th
13th #
12th #
11th
10th
9th
8th ^^
7th ^^ 1.0 0
6th 1 0 1.5 –50 ^^ ^^
5th 1 0 0.7 –33 1.0 0 ^^ 44..00 ++330000
4th 2 +100 44..55 ++335500 1.0 0 11 00 0.3 –75 ^^
3rd 1 0 1.0 +0 2.0 +100 11 00 3.0 +200 0.5 –50
2nd 33..55 ++225500 1.9 +89 55..55 ++445500 11 00 1.7 +67 2.0 +100
1st 2 +100 0.5 –53 0.5 –55 0 –100 1.8 +80 33..55 ++225500

The millennial growth rate for the first millennium BP was lower than that of thesecond millennium BP in the NSW south coast-Sydney and central Queensland highlands.Decreases of similar magnitude occurred in the growth rates in earlier periods in someregions. It is thus not possible to say whether the decreases in the last 1000 years represent thebeginning of what may have been a long-term cumulative decrease or are simply part of an‘unfinished’ fluctuation.
Quantitive changes in other regions of eastern Australia: a review
terra australis 21
167
TTaabbllee 77..55 Regions in eastern Australia. Millennial growth rates for number of habitations used, and for NSW Hunter Valley
known-habitation use. IIttaalliiccss indicates highest millennial growth rates in sequence, except where a twofold increase
represents an increase from one to two habitations.
MILLENNIUM REGIONS
BP UMCC NSW SC-S CQH SEQ NSW SU-T HV[SING] HV[MANS]
X % X % X % X % X % X % X %
25th 1.024th 1.0 023rd 1.0 022nd 1.0 0 1.021st 1.0 0 1.0 0 1.0 1.020th 1.0 0 1.0 0 1.0 0 1.0 019th 2.0 +100 1.0 0 1.0 0 1.0 018th 1.5 +50 1.0 0 1.0 0 2.0 +10017th 1.0 0 1.0 0 1.0 0 1.0 016th 1.0 0 1.0 0 1.0 0 1.0 015th 1.3 +33 1.0 0 1.0 0 1.0 014th 1.0 0 1.0 0 1.0 0 1.0 013th 1.0 0 2.0 +100 1.0 0 1.0 012th 1 1.0 0 1.0 0 1.0 0 1.0 011th 1.0 0 1.5 +50 1.5 +50 1.0 0 1.0 010th 1.0 0 1.0 0 1.3 +33 1.0 0 1.0 09th 2.0 +100 1.0 0 0.8 -25 1.0 0 1.0 08th 1.0 0 1.3 +33 1.0 0 1.0 0 1.0 07th 1.5 +50 1.3 +25 1.0 0 1.0 0 1.0 06th 1.3 +33 1.3 +30 1.0 0 2.0 +100 1.0 05th 1.3 +25 1.2 +15 11..77 ++7700 33..00 ++220000 1.0 04th 1.4 +40 11..66 ++6600 1.4 +40 1.2 +17 22..00 ++1100003rd 1.3 +29 1.4 +38 1.3 +30 1.4 +43 1.3 +25 22..00 ++1100002nd 1.8 +78 1.5 +48 1.2 +22 1.4 +40 1.4 +40 1.3 +30 ? ?1st 11..88 ++8811 1.1 +12 1 0 1.6 +64 22..00 ++110000 1.4 +40 00..33 ––7744
TTaabbllee 77..66 Regions in eastern Australia. Average annual growth rates (excluding 0% p.a. growth rates) for habitation
establishment rates. ^^ – indicates millennium after which habitations were established in each successive millennium; iittaalliiccss –highest growth rates in sequence, except where a twofold increase represents an increase from one to two habitations.
MILLENNIUM REGIONS
BP UMCC NSW SC-S SW VIC CQH SEQ NSW SU-T
% % % % % %
8th ^^7th ^^6th +0.04 ^^ ^^ 5th -0.04 ^^ ++00..11444th +0.07 ++00..1155 -0.14 ^^ 3rd 0.00 0 +0.07 +0.11 -0.072nd ++00..1133 +0.06 ++00..1177 +0.05 +0.071st +0.07 -0.08 -0.08 -100 +0.05 ++00..1133
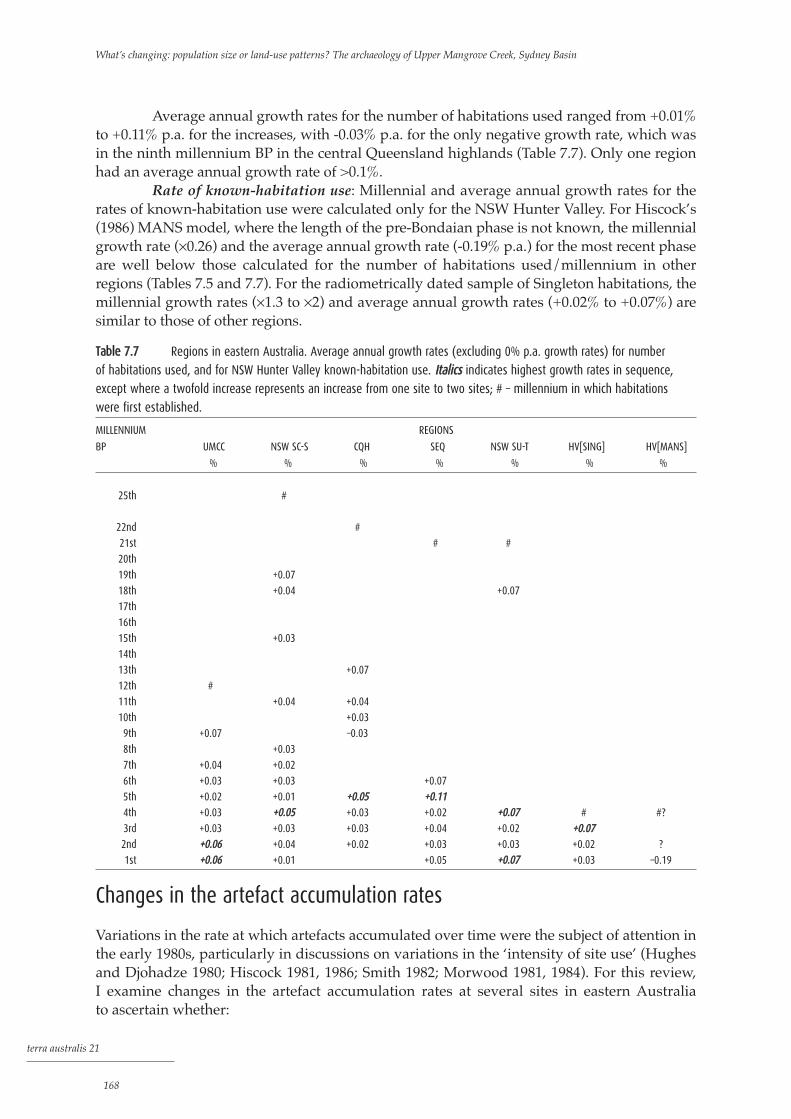
Average annual growth rates for the number of habitations used ranged from +0.01%to +0.11% p.a. for the increases, with -0.03% p.a. for the only negative growth rate, which wasin the ninth millennium BP in the central Queensland highlands (Table 7.7). Only one regionhad an average annual growth rate of >0.1%.
Rate of known-habitation use: Millennial and average annual growth rates for therates of known-habitation use were calculated only for the NSW Hunter Valley. For Hiscock’s(1986) MANS model, where the length of the pre-Bondaian phase is not known, the millennialgrowth rate (×0.26) and the average annual growth rate (-0.19% p.a.) for the most recent phaseare well below those calculated for the number of habitations used/millennium in otherregions (Tables 7.5 and 7.7). For the radiometrically dated sample of Singleton habitations, themillennial growth rates (×1.3 to ×2) and average annual growth rates (+0.02% to +0.07%) aresimilar to those of other regions.
Changes in the artefact accumulation rates
Variations in the rate at which artefacts accumulated over time were the subject of attention inthe early 1980s, particularly in discussions on variations in the ‘intensity of site use’ (Hughesand Djohadze 1980; Hiscock 1981, 1986; Smith 1982; Morwood 1981, 1984). For this review,I examine changes in the artefact accumulation rates at several sites in eastern Australiato ascertain whether:
What’s changing: population size or land-use patterns? The archaeology of Upper Mangrove Creek, Sydney Basin
terra australis 21
168
TTaabbllee 77..77 Regions in eastern Australia. Average annual growth rates (excluding 0% p.a. growth rates) for number
of habitations used, and for NSW Hunter Valley known-habitation use. IIttaalliiccss indicates highest growth rates in sequence,
except where a twofold increase represents an increase from one site to two sites; # – millennium in which habitations
were first established.
MILLENNIUM REGIONS
BP UMCC NSW SC-S CQH SEQ NSW SU-T HV[SING] HV[MANS]
% % % % % % %
25th #
22nd #
21st # #
20th
19th +0.07
18th +0.04 +0.07
17th
16th
15th +0.03
14th
13th +0.07
12th #
11th +0.04 +0.04
10th +0.03
9th +0.07 –0.03
8th +0.03
7th +0.04 +0.02
6th +0.03 +0.03 +0.07
5th +0.02 +0.01 ++00..0055 ++00..11114th +0.03 ++00..0055 +0.03 +0.02 ++00..0077 # #?
3rd +0.03 +0.03 +0.03 +0.04 +0.02 ++00..00772nd ++00..0066 +0.04 +0.02 +0.03 +0.03 +0.02 ?
1st ++00..0066 +0.01 +0.05 ++00..0077 +0.03 –0.19

1. decreased artefact accumulation rates occurred in the uppermost levels ofarchaeological deposits, and the timing of such decreases;
2. dramatic increases occurred in the artefact accumulation rates, and the timing of suchincreases; and,
3. the growth rates in this index changed dramatically over time, as did the magnitudeof such changes.For many excavated sites, insufficient information is available with which to calculate
the artefact accumulation rates for each level/spit, which requires the use of depth/age curves(see Chapters 5 and 6 for method of calculation and limits). Data for 31 sites from seven
Quantitive changes in other regions of eastern Australia: a review
terra australis 21
169
Figure 7.10 NSW south coast: (A) Burrill Lake, (B) Currarong 1, (C) Currarong 2, (D) Sassafras and (E) Bass Point. Redrawn
from Hughes and Lampert 1982: Figs 1 to 5.
7 6 5 4 3 2 1 0
7 6 5 4 3 2 1 0
YEARS BP (x1000)
YEARS BP (x1000)
YEARS BP (x1000) 24 20 16 12 8 4 0
INTE
NSI
TY O
F SI
TE O
CC
UPA
TIO
NIN
TEN
SITY
OF
SITE
OC
CU
PATI
ON
INTENSIT
Y OF
SIT
E OCCU
PATION
INTENSIT
Y OF
SIT
E OCCU
PATION
INTENSIT
Y OF
SIT
E OCCU
PATION
YEARS BP (x1000)
YEARS BP (x1000) 18 16 14 12 10 8 6 4 2 0
ImplementsRoof fall
ImplementsRoof fall
ImplementsRoof fall
A.
B.
C.
ImplementsWindblown sand
ImplementsRoof fall
E.
D.
5 4 3 2 1 0

What’s changing: population size or land-use patterns? The archaeology of Upper Mangrove Creek, Sydney Basin
terra australis 21
170
5 10 15 20 25 30 35 40 45 50 55 60
NO. OF ARTEFACTS / MILLENNIUM (x100)
1
2
YEAR
S BP
(x1
000)
backed artefacts retrieved
57
14
14
23
Phase II Bondaian
Phase II Bondaian
Phase I Bondaian
Phase I Bondaian
Pre-Bondaian
Pre-Bondaian
Figure 7.12 Milbrodale, NSW Hunter Valley: rates of
artefact accumulation (number per millennium). Table
A4/23 has details.
Figure 7.11 Sandy Hollow, NSW Hunter Valley: rates of artefact accumulation (number per millennium). Table A4/22 has
details. Phases after Hiscock 1986.
regions in eastern Australia were examined(Table 7.2, Figs 7.2, 7.10 to 7.29). For 24 of thesesites, data are summarised in Figure 7.30. Fullerdetails about the archaeological evidence at eachof these sites and the artefact accumulation ratesare provided in Appendix 4.
Artefact accumulation rates for theUpper Mangrove Creek catchment (for thecatchment as a whole and individual archaeo-logical deposits) are based on the estimatedtotal number of artefacts accumulated in eachphase and millennium in each archaeologicaldeposit. However, for the sites included in thisreview, artefact accumulation rates based onexcavated assemblages were not extrapolatedto the whole deposit since only the trends forregions and individual sites were beingcompared, not the ‘actual’ rates. Variations inthe area of each spit or level were taken intoaccount, or, where nothing to the contrary wasstated in the published reports, the area wasassumed to be constant or that any variationswere of such small magnitude that the resultswere not overly distorted. The accumulationrates are based on artefact numbers, except forthe NSW south coast-Sydney sites, whereimplement numbers were used in the 1982Hughes and Lampert study; for these sites,accumulation rates for total numbers of artefactsmay differ.

Quantitive changes in other regions of eastern Australia: a review
terra australis 21
171
Figure 7.13 Bobadeen, Ulan, upper Goulburn River, NSW: rates of artefact accumulation (number per millennium). Table
A4/24 has details.
?
5 10 15 20 25 30 35 40 45 50 55
NO. OF ARTEFACTS / MILLENNIUM (x100)
1
2
3
4
5
6
7
8
YEAR
S BP
(x1
000)
Figure 7.15 Yango Creek, NSW Hunter Valley (southern
rim): rates of artefact accumulation (number per
millennium). Table A4/26 has details.
Figure 7.14 Big L, NSW Hunter Valley (southern rim):
rates of artefact accumulation (number per millennium).
Table A4/25 has details.

Only the density or concentrationof artefacts in each spit or level (usuallyexpressed as the number of artefacts percubic metre or kilogram of deposit) wasprovided for some sites. In most sitesreviewed below, where I have calculatedartefact accumulation rates, the rates tendto follow the same trend as the densityfigures; that is, increases and decreases indensity figures occur in the same spits orlevels in which increases and decreasesoccur in the rate of accumulation. However,there are cases where they do not coincide,for example, Springwood Creek. For a fewsites, where artefact accumulation ratesor data on which to calculate artefactaccumulation rates were not available,I used density figures; for example, ShawsCreek K1 and K2, Capertee 1 and 3.Sediment accumulation rates in these sitesmay not have been constant over time, andthus these figures may not equate toartefact accumulation rates. However, theywere included in order to increase the sizeof the data sets for some regions.
What’s changing: population size or land-use patterns? The archaeology of Upper Mangrove Creek, Sydney Basin
terra australis 21
172
Figure 7.17 Springwood Creek, NSW Blue Mountains:
rates of artefact accumulation (number per millennium).
Table A4/28 has details.
STERILE
5 10 15 20 25 30
NO. OF ARTEFACTS / MILLENNIUM / sq. m (x10)
1
2
3
4
5
6
7
8
9
10
YEAR
S BP
(x1
000)
5 10 15 20 25 30 35
NO. OF ARTEFACTS / MILLENNIUM (x1000)
1
2
3
4
5
6
7
YEAR
S BP
(x1
000)
Figure 7.16 Macdonald River, NSW: rates of artefact
accumulation (number per millennium). Table A4/27 has
details.

Growth rates, standardised as average annual growth rates, are calculated for thosesites where artefact accumulation rates are presented. The growth rates are calculated for eachspit/level, except for the earlier levels at some sites where dating is equivocal and/or sterilelayers exist.
Dramatic decreases in artefact accumulation ratesAll regions have habitation sites with decreased artefact accumulation rates or densities intheir most recent levels (Fig. 7.30, Table 7.8). In a majority of the sites (65%), the artefactaccumulation rates in the most recent level/s are lower than those in earlier late-Holocenelevels. Decreasing accumulation rates in the uppermost levels of habitation sites are awidespread and common trend, though their existence was overlooked in many 1970s and1980s interpretations and explanations of the Holocene archaeological record.
The greatest or most dramatic decrease in artefact accumulation rates (or densities)occurred more frequently in the first millennium BP (excluding those associated with sterilelayers), but at some sites it occurred in the second, third or fourth millennium BP.
Dramatic increases in artefact accumulation ratesIn all 31 sites, the highest artefact accumulation rates occurred in the latter half of theHolocene (Figs 7.10 to 7.29; Tables A4/17 to A4/42; summarised in Fig. 7.30). However, very
Quantitive changes in other regions of eastern Australia: a review
terra australis 21
173
Figure 7.18 Kings Tableland, NSW Blue Mountains: rates of artefact accumulation (number per millennium). Table A4/29
has details.
1
2
3
4
5
6
10
14
18
22
26
5 10 15 20 25 30 50 70 90 110
NO. OF ARTEFACTS / MILLENNIUM (x100)
YEAR
S B
P (
x100
0)
Note change in scale
Note change in scale
STER
ILE

few sites had their highest artefactaccumulation rates in the most recentuppermost levels (e.g., Burrill Lake, Currarong2, Springwood: Figs 7.10A, 7.10C and 7.17respectively). Two sites had stable or slightlydecreasing rates/densities (Bass Point, WallsCave: Figs 7.10E and 7.19), and another fourhad fluctuating rates in their upper levels. So,although there was an increase in theuppermost level/s, the highest rates occurredin an earlier period (marked as +1 on Table7.8). High artefact accumulation rates wereusually associated with dramatic orsubstantial increases and decreases in artefactnumbers.
At all sites, the most dramaticincrease in the artefact accumulation ratesoccurred in the latter half of the Holocene,usually after 4000 BP, though the timing ofthese dramatic changes varied at individualsites. For example, at Kenniff Cave, it beganin the latter part of the sixth millennium BP,and at Macdonald River at the end of the fifthmillennium BP; at nine sites it was in thefourth millennium BP, and at five in the third
and at five (possibly six) in the second millennium BP. At only one site, the most dramaticincrease occurred in the first millennium BP (Springwood Creek).
At sites where initial habitation began in the early-Holocene or late-Pleistocene,artefact accumulation rates were initially low but gradually increased over time. Minorfluctuations occurred during this period in some sites and in a few there were substantialpeaks in the artefact accumulation rates or artefact concentrations as at Loggers in thecatchment — for example, at Capertee 3, Shaws Creek K2, Native Well 1 and Kenniff Cave(Figs 7.20, 7.22, 7.24 and 7.26 respectively).
Artefacts present — duration of periodand rate not calculated
?
5 10 15
NO. OF ARTEFACTS / MILLENNIUM (x100)
1
2
3
4
6
8
10
12
YEAR
S BP
(x1
000)
Note change in scale
STER
ILE
Figure 7.19 Walls Cave, NSW Blue Mountains: rates of
artefact accumulation (number per millennium). Table A4/30
has details.
What’s changing: population size or land-use patterns? The archaeology of Upper Mangrove Creek, Sydney Basin
terra australis 21
174
TTaabbllee 77..88 Regions in eastern Australia. Number of habitations and direction of change in artefact accumulation rates in the
most recent/upper levels of habitations in each region (+1 indicates habitations with an increasing trend but not highest
rate in sequence), based on Tables A4/17 to A4/42.
DIRECTION OF CHANGE IN ARTEFACT
ACCUMULATION RATES IN UPPER LEVELS TOTAL NUMBER
REGION DECREASE INCREASE STABLE UNCERTAIN OF SITES
NSW south coast-Sydney 2 2 1 5
NSW Hunter Valley 5 +1 6
Blue Mountains and adjacent areas 4 +1 1 1 7
South-western Victoria 1 1 2
Lower Murray Valley 2 1 3
Central Queensland highlands 3 +1 4
South-eastern Queensland 2 +1 1 4
Total number of sites 19 +4 5 2 1 31

Quantitive changes in other regions of eastern Australia: a review
terra australis 21
175
Figure 7.20 Capertee 3 (Square Q13), Capertee Valley, NSW: density of artefacts in each level (number per kilo of deposit).
Redrawn from Johnson 1979: Fig. 35.
1080±100 BP (ANU-2136)
2330±160 BP (ANU-2137)
4680±450 BP (ANU-2138)
0 10 20 30 40 50
20
40
60
80
100
120
140
160
BONDAIAN
CAPERTIAN
Analysis zone
II
III
IV
V
VI
VII
VIII
IX
X
XI
Depthcm
Number of artefacts / kg deposit
Figure 7.21 Shaws Creek K1, NSW: density of artefacts in each level (number per cubic metre). Table A4/31 has details.

Average annual growth rates for the artefact accumulation ratesAverage annual growth rates for the artefact accumulation rates, which were calculated for 22habitation sites, varied widely (Appendix 4, Tables A4/17 to A4/42). The positive valuesranged from +0.01% to +3.45%, with most (84%) less than +0.5%. However, most habitationshad one or more levels in which the growth rate was +0.1% p.a. or greater. Negative growthrates occurred at many habitations, particularly in the most recent upper level/s. They rangedfrom -0.003% to -1.98%, with most (88%) less than -0.5%.
The highest growth rates usually occurred during the latter half of the Holocene.However, they were not restricted to any particular millennium — at four sites, they began inthe fifth millennium BP, at seven in the fourth millennium BP, at four in the third, four in thesecond and one in the first millennium BP. At some sites the highest rates continued into thenext millennium. Still, figures for Kenniff Cave, where the period with the highest growth ratebegan at the end of the sixth millennium BP (Table A4/39), and Native Well 1, which also hadhigh growth rates in the early Holocene (Table A4/37), suggest substantial change was notrestricted to the latter half of the Holocene. High artefact concentrations at Shaws Creek K2and Capertee 3 in the 13th and seventh millennia BP respectively may also reflect high rates ofaccumulation and may be associated with high growth rates.
In general, high average annual growth rates are associated with the highest artefactaccumulation rates and dramatic increases in the accumulation rates. However, the trendtowards higher artefact accumulation rates did not always begin with a dramatic increase inthe rates or with the highest growth rate, and the most dramatic increase in the artefactaccumulation rates was not always associated with the highest growth rate.
For the artefact accumulation rates, the duration of a particular growth rate isinfluenced by factors such as the rate of sediment accumulation, the depth of individualexcavation units, and, in particular, the estimated length of time over which a spit/levelaccumulated and the analytical methods used in specific studies to portray change over time.
What’s changing: population size or land-use patterns? The archaeology of Upper Mangrove Creek, Sydney Basin
terra australis 21
176
5 10 15 20 25 30 50 70 90 110
NO. OF ARTEFACTS / CUBIC METRE (x100)
20
40
60
80
100
120
140
160
DEPTH
OF
DEP
OSIT
(cm
)
Note change in scale
Phase I
Phase II
Phase III
Phase IV
Phase V
Phase VI
Figure 7.22 Shaws Creek K2 (Square A), NSW: density of artefacts in each level (number per cubic metre). Table A4/32 has
details.

For example, the two extremes are Hughes and Lampert’s study, in which rates werepresented for stratigraphic units which accumulated over periods in excess of 1000 years(Tables A4/17 to A4/21), and Gatton, for which the period of accumulation for many spits iscalculated as 55 years (Table A4/42). Such factors have not been taken into account orexplored in this review.
Relationships between the habitation indices and the artefactaccumulation rates: directions and timingFor only five of the regions reviewed are both habitation indices and artefact accumulationrates for individual sites available: NSW south coast-Sydney, NSW Hunter Valley, centralQueensland highlands, south-eastern Queensland, and south-western Victoria. In theseregions, trends in the habitation indices and artefact accumulation rates at individual
Quantitive changes in other regions of eastern Australia: a review
terra australis 21
177
unifacial points retrieved
2
1
13
6
5 10 15 20 25 30 35 40 45 50 55 60 65
NO. OF ARTEFACTS / MILLENNIUM (x100)
1
2
3
4
5
6
7
YEARS
BP
(x1000)
Figure 7.23 Devon Downs, lower Murray Valley, South Australia: rates of artefact accumulation (number per millennium).
Table A4/34 has details.

What’s changing: population size or land-use patterns? The archaeology of Upper Mangrove Creek, Sydney Basin
terra australis 21
178
5 10 15 20 25 30 35 40 45 50
NO. OF ARTEFACTS / MILLENNIUM (x100)
1
2
3
4
5
6
7
8
9
10
11
12
13
14
15
YEAR
S BP
(x1
000)
backed artefacts retrieved
pirri points retrieved
Figure 7.24 Native Well 1, central Queensland highlands: rates of artefact accumulation (number per millennium). Table
A4/37 has details.

Quantitive changes in other regions of eastern Australia: a review
terra australis 21
179
5 10 15 20 25 30 50 70 90 110
NO. OF ARTEFACTS / MILLENNIUM (x100)
1
2
3
4
5
6
7
8
9
10
11
12
13
14
15
YEAR
S BP
(x1
000)
Note change in scale
backed artefacts retrieved
pirri points retrieved
Figure 7.25 Native Well 2, central Queensland highlands: rates of artefact accumulation (number per millennium). Table
A4/38 has details.

What’s changing: population size or land-use patterns? The archaeology of Upper Mangrove Creek, Sydney Basin
terra australis 21
180
5 10 15 20 25 30
NO. OF ARTEFACTS / MILLENNIUM (x100)
1
2
3
4
5
6
7
8
9
10
11
12
13
14
15
16
17
18
19
YEAR
S BP
(x1
000)
disconformity
Figure 7.26 Kenniff Cave, central Queensland
highlands: rates of artefact accumulation (number
per millennium). Table A4/39 has details.
Figure 7.27 The Tombs, central Queensland highlands: rates
of artefact accumulation (number per millennium). Table
A4/40 has details.
habitations in the last 1000 or so years did notalways follow the same direction. The timingat which dramatic changes occurred in thehabitation and artefact indices also varied.
Direction of trends• In no region did both the habitation indices
and the artefact accumulation rates for allsites continue to increase until contact;
• in the NSW Hunter Valley, the artefactaccumulation rates decreased in all sitesin the last 1000 years or so, in contrastwith the rate of known-habitation use,which varied — increasing in the Singletonarea but decreasing in the Muswellbrookarea;
• in south-eastern Queensland, thehabitation indices continued to increasewhile the artefact accumulation rates inthe most recent period decreased at twosites, increased at one site, and at anotherfluctuated while generally increasing;

• in three regions — NSW south coast-Sydney, south-western Victoria and centralQueensland highlands — the habitation establishment rates decreased in the last 1000years while the direction of artefact accumulation rates at individual sites varied (ratesincreased at some sites, whereas at others they decreased and at one they remained stable);
• the numbers of habitations used continued to increase until contact in NSW south coast-Sydney, while in the central Queensland highlands they remained stable.
Timing• In none of the regions did thedramatic increase in the habitationindices coincide in time with themajority of dates at which the dramaticincreases in the artefact accumulationrates occurred in individual habitations.In general, the dramatic increase in theartefact accumulation rate was earlierthan the dramatic change in thehabitation establishment rate — apattern seen also in the UpperMangrove Creek catchment;• the most dramatic increases in theartefact accumulation rates in individualhabitations did not always coincide intime with the appearance of artefactsaccepted as diagnostic of the ‘Small ToolTradition’ and/or Bondaian assemblages.This is discussed further in thefollowing chapter.
Trends in the direction andtiming of the habitation and/or artefactindices that I identified for some regionsdiffered from those apparentlyperceived by other researchersaccording to their interpretations andexplanations: for example, the artefactaccumulation rates in individualhabitations on the NSW south coast byHughes and Lampert (1982), and insouth-western Victoria by Lourandos(1983a: 85).
It is clear that the trendsobserved in the Upper Mangrove Creekcatchment are not atypical. The lack ofcorrelation in the timing of the dramaticquantitative changes in the habitationand artefact indices is seen also in otherregions in eastern Australia. Many havehabitation establishment rates whichincreased dramatically in the latter half
Quantitive changes in other regions of eastern Australia: a review
terra australis 21
181
5 10 15 20 25 30 35 40
NO. OF ARTEFACTS / MILLENNIUM (x10)
1
2
3
4
5
6
7
8
YEAR
S BP
(x1
000)
backed artefacts retrieved
Figure 7.28 Maidenwell, south-eastern Queensland: rates of
artefact accumulation (number per millennium). Table A4/41
has details.

of the Holocene and then continued to increase until contact, as well as having archaeologicaldeposits in which artefact accumulation rates decreased in the uppermost levels. It is alsoapparent that there was much regional variation, and that the timing of ‘events’ and thedirection of changes in the archaeological record were not uniform across eastern Australia(see also Lampert 1971a: 68–9; Williams 1985: 328–9).
Discussion and conclusions
An examination of the evidence relating to changing site and artefact numbers in severaleastern Australian regions shows that some of the interpretations and explanations proposedby researchers in the 1970s and 1980s are no longer sustainable. In particular, althoughdramatic or substantial increases did occur in the habitation establishment rates, the numbersof habitations used and/or the artefact accumulation rates, the timing varied regionally andthe indices did not always continue to increase from the period of initial occupation until thetime of European contact.
Dramatic or substantial increases in the habitation establishment rates and thenumbers of habitations in other regions did not occur at ca 5000 BP or ca 4000 BP. The dramaticor most substantial increases did not occur in the same period in each region, but were usuallyin the second or first millennium BP. Data for some of the regions suggest there were intra-regional variations in the trends in the establishment and use of habitations, for example, inthe Victorian Mallee, NSW Hunter Valley and NSW south coast-Sydney.
Dramatic increases in the artefact accumulation rates all occurred in the late-Holocene; though it was usually after ca 4000 BP, the timing varied at individual sites.
Substantial decreases in artefact accumu-lation rates in individual habitationswere also documented in the last 1000years in other regions, as in thecatchment. Substantial decreases are alsodocumented in the artefact indices insome regions in earlier periods whenfluctuations in the rates occurred, but themost dramatic decreases usuallyoccurred in the first millennium BP.
High growth rates and thehighest growth rates for the habitationand artefact indices in each region werenot restricted to any particularmillennium BP (Tables 7.4 to 7.7, A4/17to A4/42, Fig. 7.30). The highest growthrates all occurred in the latter half of theHolocene, but high growth rates alsooccurred in earlier periods. However,even where the habitation establishmentrate and/or the number of habitationsused continued to increase into the firstmillennium BP, the millennial andannual growth rates did not necessarilydo so. Some regions had declining and
What’s changing: population size or land-use patterns? The archaeology of Upper Mangrove Creek, Sydney Basin
terra australis 21
182
5 10 15 20 25 30 35 40
NO. OF ARTEFACTS / MILLENNIUM (x100)
1
2
3
4
YEAR
S BP
(x1
000)
Figure 7.29 Gatton, south-eastern Queensland: rates of artefact
accumulation (number per millennium). Table A4/42 has details.

Quantitive changes in other regions of eastern Australia: a review
terra australis 21
183
YRS
BP(x
100)
5 10 15 20 25 30 35 40 45 50 70 90 110
130
150
170
190
210
230
250
YRS
BP(x
100)
5 10 15 20 25 30 35 40 45 50 70 90 110
130
150
170
190
210
230
250
##
#
#
#
#
#
#
##
#
#
#
#
#
#
#
#
##
#
#
#
#
STERILE
STERILE
STERILE
STERILE
STERILE
X
X
X
X
X
X
X
X
X
X
X
X
X
X
X
X
X
X
X
X
Per
iod
with
hig
h ra
tes
of a
rtef
act a
ccum
ulat
ion
P
erio
d w
ith th
e hi
ghes
t rat
e of
art
efac
t acc
umul
atio
nP
erio
d w
ith th
e gr
eate
st in
crea
se in
the
rate
of a
rtef
act a
ccum
ulat
ion
grea
test
dec
reas
eP
erio
d w
ith h
igh
aver
age
annu
al g
row
th r
ate
lo
wes
t ave
rage
ann
ual g
row
th r
ate
Dat
e of
initi
al h
abita
tion
#
X
?
?
?
?
? ?
XNote change in scale
BL
C
ur1
Cur
2
Sa
s
B
P
SH
Mil
Bob
Big
YC
MR
SC
KT
WC
Cap
3
K2
DD
FL6
N
W1
N
W2
K
C
T
T
M
ai
G
at
? ?
?
? ?
Figure 7.30 Habitations in eastern Australia: summary of changes in the rates of artefact accumulation and changes in
growth rates in the artefact accumulation rates.

negative growth rates for the habitation indices in the first millennium BP. Decreasing andnegative average annual growth rates for artefact accumulation also occurred in the upperlevel/s of most habitations in all regions.
For the habitation indices, the millennial growth rates are usually much less than thetwo- to threefold increases quoted by Hughes and Lampert (1981: 20) and the tenfold increaseproposed by Ross (1984: 198–9). Nevertheless, millennial growth rates of between ×2 and ×5.5do occur, particularly in the habitation establishment rates, in all regions except the centralQueensland highlands, but the highest rates are usually restricted to one millennium and nomore than two millennia. Average annual growth rates greater than 0.1% occurred in thehabitation indices in all regions, though they were restricted to one millennium; no regionshad growth rates of 0.5% or greater — all were less than 0.2%.
In the case of the artefact accumulation rates, most habitations had some levels forwhich the average annual growth rate was 0.1% or greater; such growth rates extended forperiods between 110 and 2150 years. Only seven habitations had levels with positive rates ofmore than 0.5%, and two had negative rates of more than 0.5%, but in all cases (mostly inGatton) these rates existed for short periods of between 55 and 500 years. Thus, for bothhabitation and artefact indices, the average annual growth rates are usually much less than the0.5% Gray (1985: 23) considered necessary ‘to signify a considerable departure from near-stationarity’ in human populations. The significance of the millennial and average annualgrowth rates is discussed more fully in the next chapter.
Although some case studies involve large numbers of habitations (e.g., 141 in theVictorian Mallee), the number of dated excavated archaeological deposits in each region issmall — particularly when the size of the regions in which the sites occur is considered. Of theregions studied, the NSW south coast-Sydney had the largest number of radiometrically datedsites (58), though Ulm and Hall’s (1996: Fig. 4, Appendix 1) recent data set for south-easternQueensland has 57. The number of habitations used in the analyses for the Upper MangroveCreek catchment (30) is not as large as that recorded in some other studies, but it is as yet theonly study where: 1. the sample of sites occurs within a relatively small bounded area (ca 100 sq km);2. an attempt has been made to ascertain the establishment date for all habitations in the
sample and to estimate the length of habitation at each site; and,3. the majority of ‘dated’ archaeological deposits (26 of 30) can be assumed on
probability sampling grounds to be an unbiased sample from the locality. Four siteswere originally recorded as potential habitation shelters with potential archaeologicaldeposit and were purposefully selected for excavation.In the case of the habitation indices, data for many regions are likely to be biased
because of (a) the small numbers of sites and the large size of most regions (e.g., central Queensland
highlands with 11 sites in 21,000 sq km); and, (b) the procedures adopted in selecting the sites excavated or analysed — the excavated
or radiocarbon-dated sites were purposefully selected for particular projects andwithin these areas many other undated habitations occur. Comparison of (a) the Upper Mangrove Creek catchment trends when based on a
data set in which only radiocarbon-dated archaeological deposits are used with (b) the trendswhen all sites are included (Figs 6.1 and 6.2) suggests that the decrease in the habitationestablishment rates in regions such as the NSW south coast-Sydney, south-western Victoriaand the central Queensland highlands, may be due to bias in the selection of sites excavated.That is, sites with assumed short habitation periods and/or shallow deposits are less likely tobe selected for excavation and/or dating than sites with multi-phase, deep stratified deposits.
What’s changing: population size or land-use patterns? The archaeology of Upper Mangrove Creek, Sydney Basin
terra australis 21
184

If this is so, then most regions may have had an increase in the habitation establishment rate inthe final 1000 years before contact (though the growth rates could still have declined). Atpresent, however, when dates become available from newly excavated sites in any of theregions discussed above, their inclusion could easily change the trends — as in the case of theNSW south coast-Sydney region, and south-western Victoria (see Appendix 4). Empirical datafrom projects based on site surveys in defined areas using intensive probability samplingmethods and the excavation and dating of unbiased samples of archaeological deposits arerequired to test whether regional trends documented to date are valid or need to be revised.
Similarly, data on artefact accumulation rates come from only a relatively fewwidespread sites in each of the seven regions — the maximum number of sites reviewed inany one region is seven. In addition, data available for each region and site are not uniform.Thus, whether the trends from these few individual sites are representative of the locality orregion as a whole and/or whether they provide a valid basis on which to propose regionalchronological changes in, for example, habitation and land-use patterns, is arguable.
Other Australian regions and sites, and later studiesDespite doubts being raised about the validity of currently documented trends in otherregions of eastern Australia because of sampling issues, studies in other parts of the continentand recent studies of the 1990s support the conclusions outlined above. Dramatic increaseshave been documented in the habitation establishment rate and in the number of habitationsused at varying times in the late-Holocene, for example, in south-western Western Australia(Hallam 1977), western NSW (Allen 1972: 321 in Hughes and Lampert 1982: Fig. 10), and insouth-eastern Cape York and south-eastern Queensland by David and Chant (1995: Fig. 38),Morwood and Hobbs (1995a: Fig. 15.1), Ulm and Hall (1996: Fig. 4), and David and Lourandos(1997).
Decreased artefact accumulation rates and/or artefact densities have beendocumented in recent levels in many sites in many parts of Australia, for example, on thecentral Queensland coast (Cania Gorge — Eales et al. 1999: 39, Figs 8 and 9; Westcott et al.1999: 51, Fig. 9), and the Victoria River district, Northern Territory (Attenbrow et al. 1995: Fig.7). In some cases, Pleistocene levels have very much higher artefact accumulation rates thanHolocene levels (e.g., Fern Cave, south-east Cape York, David 1991: 45, Table 2, Fig. 5).
Intra-regional variations in the late-Holocene trends, with artefact accumulation ratesincreasing throughout the sequence in some sites and decreasing in the most recent levels inothers, have been documented in regions such as Arnhem Land, northern Australia (Jones1985: 291, 293, 296; Jones and Johnson 1985a: 183, 1985b: 71; Allen 1996: 199); in south-westernWestern Australia (Ferguson 1985); in Central Australia (Thorley 1999: 66–67); south-east CapeYork (David and Chant 1995; Morwood and Hobbs 1995b); and the NSW south coast (Boot1996b).
The trends identified in the Upper Mangrove Creek catchment are clearly notanomalous — intra-regional variations in the trends in late-Holocene artefact accumulationrates are a common occurrence in Australia, and substantial decreases in artefactaccumulation rates occurred in many individual sites in other regions in the last 2000–1000years. Dramatic or relatively substantial increases in the habitation indices also occurred laterthan 4000 BP in other regions, but usually in the second or first millennium BP.
If the artefact accumulation rates by themselves are accepted as indicators ofdemographic change, then the trends in some regions indicate that populations may not havecontinued to increase in size until contact in all regions of Australia. In a similar vein, ifhabitation indices are accepted as indicators of demographic change, then the trends in someregions indicate that populations may have increased dramatically in the late-Holocene.
Quantitive changes in other regions of eastern Australia: a review
terra australis 21
185

However, such increases occurred much later than ca 4000 BP, the time when some researchersadvocate that the ‘Small Tool Tradition’ appeared. The differences in direction and timing ofthe dramatic changes in the habitation and artefact indices also indicate that such changesmay not have always coincided in time with the appearance of artefacts accepted as diagnosticof the ‘Small Tool Tradition’ or the Bondaian phases of the Eastern Regional Sequence. Late-Holocene trends in habitation and artefact indices, however, may be indicators of otherbehavioural changes — for example, modifications to habitation, subsistence and land-usepatterns influenced by climatic and environmental changes that were occurring in this period.Each of these issues is discussed more fully in the following chapters.
What’s changing: population size or land-use patterns? The archaeology of Upper Mangrove Creek, Sydney Basin
terra australis 21
186

terra australis 21
187
A review of 1970s and 1980s archaeological studies showed there were numerousinterpretations and explanations for dramatic changes in habitation and artefact indices inseveral regions of eastern Australia (Chapter 2). In this chapter, these explanations andinterpretations are compared with the archaeological evidence on which they were based(presented in Chapter 7 and Appendix 4). This comparison shows that in many instances theexplanations and interpretations cannot be sustained. Equally, it shows that a wide range ofinterpretations and explanations are possible, but that simplistic relationships betweennumbers of sites/artefacts and numbers of people, or between numbers of artefacts and theintroduction of the ‘Small Tool Tradition’ or Bondaian assemblages, are unlikely to describethe full complexity of a region’s prehistory.
Population-change explanations
Assumptions underlying the population-change explanationsMost behavioural-change explanations are based on the assumption that quantitative changes inthe habitation and artefact indices were produced by a change in the number of artefactsmanufactured and habitations used by each person. That is, there were changes in the ratio ofhabitations to people and in the ratio of artefacts to people. Population-change explanations tendto assume (or imply) that those ratios were relatively constant throughout time and thus a changein the number of habitations and/or artefacts is evidence of a change in population size.
Many researchers of the 1970s and 1980s perceived or assumed that the long-termdirection of the quantitative changes in the archaeological records of eastern Australia was onlytowards ‘increase’, or assumed that decreases in the most recent millennium BP were notsignificant. On this basis, they proposed that the quantitative changes indicated a trend towardsincreasing population size, which continued until European contact. The population increaseswere usually seen as part of a general continent-wide phenomenon, though local shifts inpopulation from one environmental zone or geographic area to another, or shifts from one type ofhabitation to another without the inference of a general population increase, were also proposed.
A re-examination of interpretations andexplanations for changes in habitationand artefact indices in eastern Australia
8
Very few advocates of the population-change explanations were explicit about theassumptions on which they based their conclusions; authors who were explicit include Beaton(1985), Ferguson (1985), Ross (1985) and Morwood (1986: 117, 1987: 343; see also O’Connell andAllen 1995: 857).
Beaton (1985: 16) stated that ‘Archaeological sites ultimately mean people, and questionsabout the presence or absence of sites may just as well be phrased in terms of the presence orabsence of people’. Beaton’s (1985: 17–18) discussions about the relationship between trendsindicated by ‘a histogram of sites occupied per thousand year period’ and population-growthmodels show that he accepted changes in population size were reflected in that index.
Ross (1984: 234; 1985: 87) believed an increase in the number of sites to be ‘the mostsuitable indicator’ of population increase, ‘where it can be demonstrated that behaviouralchange and archaeological visibility have not biased the archaeological record’. She qualifiedthis by citing one of three conditions which Bailey (1983b: 163) stipulated should beestablished if one is to accept an increase in site density as evidence of population increase:that is, that the average number of inhabitants per site remained unchanged. Ross concluded:
In other words, it must be possible to demonstrate that a greater number of sites in thelandscape was not a function of purely behavioural change. (Ross 1985: 87)
Ross argued further:
The only behavioural change which could produce more occupation sites in an area, and aconcomitant expansion of people into previously unoccupied or rarely occupied regions,without involving an increased number of people, would be a change involving the samenumber of people spending shorter periods of time at more sites. The obvious expression of thiswould be more sites, but with each site containing sparser occupation debris. (1985: 87) (myemphasis)
Ross then stated, ‘This is clearly not the case in the middle to late Holocene in south-eastern Australia.’ However, this is exactly the evidence that is documented in the UpperMangrove Creek catchment for the first millennium BP — more sites, but with manycontaining ‘sparser occupation debris’. The evidence presented in the previous chaptersuggests this may also be the case in other regions in eastern Australia. Ross’ statementsassume that the ultimate measure of the number of people inhabiting either individual sites orspecific areas of land is the total amount of habitation debris accumulated. In addition, Ross’statement does not allow for the possibility that two behavioural changes may have occurredat the same time; for example, people may have begun to move more frequently at the sametime as they began to make more artefacts per head of population.
Ferguson (1985: 11–12) analysed artefact distributions in the late-Pleistocene throughmid-Holocene levels at several sites in south-western Western Australia to test the assumptionthat ‘since artefacts are products of human activity, the frequency of artefact finds can be seento indicate the intensity of that activity’. He (1985: 492) stated that it is unlikely that theevidence from individual sites in his study area suggests only a change in local settlementpattern or that some other raw material could have been substituted for stone. He (1985:491–2) argued that the artefacts were ‘essential components of the prehistoric society’s culturalcore’ and that there was sufficient continuity in the stone-working process to legitimisecomparison of the relevant late-Pleistocene through to mid-Holocene levels. Ferguson (1985:492–3) concluded, as a result of his analyses, that ‘the drop in artefacts suggests acorresponding drop in the amount of human activity’, and that ‘the region-wide drop inartefact finds during the mid-Holocene suggests a comparable region-wide drop in human
What’s changing: population size or land-use patterns? The archaeology of Upper Mangrove Creek, Sydney Basin
terra australis 21
188

population’. However, he (1985: 12) expressed reservations about whether comparablestatements could be made about the increase in the artefact accumulation rate in the late-Holocene levels of sites since new stone-reduction techniques and artefact types occurred inthis period.
Morwood (1987) argued that archaeological criteria for population increases couldinclude increases in the rate of site formation processes and in occupational intensity at sites,as well as more intensive economic exploitation as indicated by the use of new habitats,resource types, extractive technologies and management strategies. Following Ross (1985) andHughes and Lampert (1982), Morwood said that in south-eastern Queensland ‘The growth ofsite numbers over time … provides a general measure of population increase’ (1987: 343).
Each of these researchers was assuming that changes in the numbers of habitationsand/or artefacts are evidence of changes in the number of people across the land or in sites.There are many problems in accepting this assumption — apart from the fact that validalternative explanations to population change can be proposed for these quantitative changes(as acknowledged by Ferguson for the late-Holocene). For example, it has not been establishedthat changes in the number of people inhabiting a site or region or the amount of time spent(e.g., person-days) in a site or region are the only mechanisms that produced changes in thehabitation establishment rate, the number of habitations used or the rate of artefactaccumulation. It has not been demonstrated yet, nor can it yet be assumed, that (a) knappingwas such a constant part of the activities in a habitation that the debris from this activity canact as a measure of the whole range of activities undertaken at a site, and/or time spent at asite, and/or number of people who used a habitation (Bettinger 1981; M. C. Hall 1981; Hiscock1981: 31–2, 1984: 133–5; Smith 1982: 114–15; see also Chapter 2, Increases in the archaeologicalrecord, Population change); (b) there was a direct relationship between artefact use anddiscard behaviour (Binford 1973; Foley 1981a: 16, 198lb: 165, 1981c: 197); or (c) the rates of useand discard of stone artefacts are known (Foley 1981b: 175).
Implications of population-change premisesIf it is ESTABLISHED or researchers CONTINUE TO ASSUME that changes in the habitationindices and the artefact accumulation rates were produced by changes in population size, thedecreases in the indices that are presently documented for the latter half of the Holocenethrow doubt on explanations which propose that the population continued to increasethroughout Australian prehistory.
Many researchers tended to accept that changes in the habitation indices and artefactaccumulation rates acted in concert; that is, they followed the same trends in timing anddirection. This was not necessarily the case in all areas. In the Upper Mangrove Creekcatchment, changes in the habitation indices and the local artefact accumulation rate did notcoincide in time or direction, and this was also the case with the habitation indices and artefactaccumulation rates for individual habitations in other eastern Australian regions.
If the documented changes in both the habitation and artefact indices for the easternAustralian regions were EACH produced by a change in population size, then variousscenarios can be constructed. For example, assuming a three-phase sequence with group sizeand the magnitude of changes in each index remaining the same, only if there was an increasein both the habitation indices and the artefact accumulation rates in the most recent periodcould the trends be taken as an indication that population continued to increase until contact.If there was a decrease in one index and an increase in the other, it would suggest populationsize remained the same in the final phase as in the second phase; a decrease in both habitationand artefact indices would suggest a decrease in the population size in the final phase.
A re-examination of interpretations and explanations for changes in habitation and artefact indices in Eastern Australia
terra australis 21
189

Following from this, if the regional trends based on the habitations and artefact indicesfor other regions in eastern Australia have any validity, then one can speculate as to likelychanges that occurred in the population size in each region in the first millennium BP. If only thehabitation indices are measures of population change, then there was an increase in populationsize in the majority of regions in the last 1000 years: in the NSW south coast-Sydney region, insouth-eastern Queensland, NSW southern uplands-tablelands, southern Victorian Mallee, aswell as the Upper Mangrove Creek catchment. In two regions there was no change in the size ofthe population (central Queensland highlands and the northern Victorian Mallee), and in theNSW Hunter Valley there was a decrease in population in one area and an increase in another.
In the case of the artefact accumulation rates, rates for individual habitation sites inthese regions did not always follow the same direction in the last 1000 years or so, and fornone of the regions (except the Upper Mangrove Creek catchment) has a local artefactaccumulation rate been calculated. So, if it is assumed that where more than 50% of the siteshave decreased rates in the final phase the local artefact accumulation rate decreased, and ifonly the local artefact accumulation rates are indicators of population change, then there was adecline in population in most regions in the last 1000 years: in the central Queenslandhighlands, south-eastern Queensland, NSW Hunter Valley, NSW Blue Mountains, SouthAustralian lower Murray Valley, as well as the Upper Mangrove Creek catchment. Only tworegions had stable populations: the NSW south coast-Sydney and south-western Victoria.
If the habitation indices and local artefact accumulation rates are both measuresof population change, then in most regions the population was either stable (south-easternQueensland, Upper Mangrove Creek catchment) or had declined (central Queenslandhighlands and NSW Hunter Valley); in only one region did the population increase in the last1000 years (NSW south coast-Sydney).
Based on the above, the minimum implication is that in the first millennium BP thepopulation did not increase, or did not continue to increase in all regions. Such simplisticinterpretations of the data are, of course, not tenable. However, they were presented to showthe type of conclusions that can be reached with the type of data currently available, IF thepopulation-change premise is adopted.
Although the above scenarios are presented in terms of general population change,under the population-change premise, the presently documented trends could also beexplained as: 1. local shifts in population from one geographic or topographic zone to another for
a variety of reasons (e.g., as in Moore 1970; Luebbers 1978, 1981; Beaton 1985;Lourandos 1985a; Ferguson 1985); or,
2. in some regions, particularly country where rockshelters exist, a shift in preferencefrom inhabiting one type of location for another, that is, rockshelters versus opendeposits (e.g., as in Stockton 1970a; Stockton and Holland 1974), in regions such asthe Upper Mangrove Creek catchment, central Queensland highlands, NSW southcoast-Sydney; or preference for one habitation over another, but of the same type,because of changed local environmental conditions (Smith 1982) or a change in thecultural ‘status’ of the location (Morwood 1986).Under the population-change premise, only if one assumes that the gaps in the
archaeological record contain a different trend from that already documented (i.e., that thepresent studies are biased or unrepresentative of the locality or region itself or of thecontinental trends) can one avoid the conclusion that the presently documented trendsindicate that in some regions of eastern Australia there were periods of decreasing population,and that in the last 1000 or 2000 years, the population was less than that of the precedingmillennia.
What’s changing: population size or land-use patterns? The archaeology of Upper Mangrove Creek, Sydney Basin
terra australis 21
190

A re-examination of interpretations and explanations for changes in habitation and artefact indices in Eastern Australia
terra australis 21
191
Growth ratesSome researchers associated dramatic increases in habitation indices and/or artefactaccumulation rates with dramatic increases in their growth rates (e.g., Hughes and Lampert1982; Ross 1984).
IF ever it is demonstrated that the relationship between numbers of habitations andpeople, as well as between stone artefacts and people, was such that the ratio between thesevariables remained constant over time, then it could be assumed that the growth rates in theindices represent the growth rates in the human population. This would allow changes inrelative population size to be proposed, but would not relate to actual population size (forwhich the actual ratio between people and habitations and/or artefacts is required). Averageannual growth rates were calculated for the habitation and artefact indices (Chapters 6 and 7,Appendix 4) so that comparisons could be made with the rates which are normally cited bydemographers in discussions on population growth.
Examination of the average annual growth rates for the habitation indices (Tables 7.6and 7.7) suggests that in some regions lower growth rates prevailed in the first millennium BPthan in earlier millennia. In two regions — NSW southern uplands-tablelands and south-eastern Queensland — late-Holocene growth rates continued increasing into the firstmillennium BP, though in the latter region the rates did not return to the high values of thefifth and sixth millennia BP.
Average annual growth rates for artefact accumulation rates in the first millenniumBP in individual habitations varied within each region (Tables A4/17 to A4/42). Growth ratesfor local artefact accumulation rates could not be calculated for each region, as they were forthe catchment (Table 6.6). The large number of regions with numerous habitations withdecreasing growth rates in the first millennium BP, however, may indicate decreasing or stablepopulations existed in many regions in this period, or, if there was an increase in populationsize, the actual rate of population growth may have declined or remained relatively stable(stationary).
Hughes and Lampert (1982: 20) stated that there was a two- to threefold increase insite numbers and a six- to tenfold increase in ‘the intensity of occupation’ (i.e., rate ofimplement accumulation) after 5000 BP. Ross (1984: 198–9) stated that there was a tenfoldincrease in site numbers after 4000 BP. Although these authors concluded that the mostlikely explanation for the increases was population increase, none claimed that thepopulation growth rate was the same as that for the habitations and/or artefacts. Hughesand Lampert made no comment about the difference in the growth rates that theycalculated for habitation and implement numbers. If the increase in the growth rate forhuman populations was not the same as that for habitations and/or artefacts, this impliesthat the ratio between numbers of people and numbers of habitations and/or artefactschanged at the same time as the growth rates for the habitations and artefacts changed.If so, the relationship between changes in population size and changes in materialbehaviour and habitation patterns is obviously more complex than implied by many of theexplanations reviewed here.
The increases in the growth rates referred to by Hughes and Lampert and Ross tookplace over several millennia — that is, over 2000 years for the artefacts and 5000 years forhabitations on the NSW south coast, and over 4000 years for habitations in the VictorianMallee. The growth rates are very much lower when standardised as millennial or averageannual growth rates. For Hughes and Lampert’s 1982 data, the average annual growth ratesfor south coast habitations are between ×1.0001 and ×1.0002 (+0.01% and +0.02%), and for theimplements ×1.0009 and ×1.0012 (between +0.09% and +0.12%); for the southern Mallee theaverage annual growth rate based on Ross’ figures is ×1.0006 (0.06%).

The average annual growth rates for the eastern Australian regions (including theNSW south coast-Sydney using my recalculated figures, and the Victorian Mallee) can besummarised as follows:
Habitation indices (i.e., numbers of habitations used and rates of known-habitationuse) (Table 7.7):
The average annual growth rates were all less than +0.11% p.a., with positive valuesranging from +0.01% to +0.11%; only one region had a value >0.1%. Only two regions hadnegative growth rates (a decrease) in one period — central Queensland highlands with agrowth rate of –0.03% in the ninth millennium BP, and NSW Hunter Valley (MANS), with–0.19% in the most recent phase.
Artefact accumulation rates (Tables A4/17 to A4/42): Most average annual growth rates with positive values ranged between +0.01% and
+0.94%, with the highest being +3.45%. Most negative values ranged from 0.003% to -0.66%,with the lowest being -1.98%. Four habitations with sterile layers had values of -100%. Mosthabitations had one or more levels in which the growth rate was +0.1% or greater; seven hadlevels with positive values greater than +0.5%. Two habitations had negative values greaterthan –0.5%.
The average annual growth rates for the habitation indices are the average for aperiod of one millennium. The growth rates for the artefact accumulation rates are the averagefor the estimated length of time over which a single spit or level accumulated, which is usuallyless than 1000 years.
There is much temporal and regional variation in the growth rates. As a rule, thehighest growth rates in the indices occur within the last 5000 years, but high growth rates arenot restricted to this period. If these indices indicate population growth rates, then there wasalso much temporal and regional variation in population growth, and all major populationincreases were not restricted to the last 5000 years.
The percentage figures that constitute significant growth rates in demographic andsocial terms for hunter-gatherer populations have been discussed by Ammerman et al. (1976),Weiss (1978: 774), Hassan (1981, 1982) and Gray (1985). Hassan (1981: 143) calculated theaverage annual rate of world population growth during the Pleistocene at well below 0.01%(a figure he says is ‘exceedingly low’). He (1981: 208; 1982: 244–5, Table 3.2) said that duringthe Lower Palaeolithic it was 0.00007%, during the Middle Palaeolithic 0.005% and during theUpper Palaeolithic 0.01%. The acceleration in rates from Lower to Upper Palaeolithic, he said,perhaps reflects greater evolutionary adaptability and biological development from Homoerectus to H. sapiens. Hassan (1981: 140, 201, 221) argued that the maximum rate of growth forhunter-gatherers should be placed at about 0.5% p.a. with an average of 0.1% p.a. Heconsidered that a growth rate of 0.1% is well below the explosive rates of today, which oftenexceed 1% and 2% p.a. in many nations. A rate of 0.5%, however, is sufficiently rapid to alterdemographic conditions in a short time (Hassan 1981: 221). He (1981: 140, 221, 259) pointedout that prehistoric populations were not incapable of rapid rates of population increase — ata rate of 0.5% p.a., the doubling time would be ca 130 years or about seven generations; at arate of 0.1%, doubling would take about 35 generations (ca 650 years). Birdsell (1957 in Hassan1981: 203) proposed an annual growth rate for waves of immigrants sweeping over newlydiscovered territory in Australia of 3.6% (the equivalent to doubling every generation), butHassan (1982: 257) said this figure is unrealistically high and that the rate could not have beenhigher than between 0.5% and 1%. Hassan (1981: 142, 260; 1982: 245) emphasised that theabove figures are average rates and small populations would have been subject to stochasticfluctuations in size, and changes in mortality and fertility rates could have led to populationincrease or decline if no other mechanisms dampened the effect of such fluctuations.
What’s changing: population size or land-use patterns? The archaeology of Upper Mangrove Creek, Sydney Basin
terra australis 21
192

Gray (a demographer) said the apparent population changes referred to byLourandos (1983a, 1984) and Hughes and Lampert (1982) imply a near-stationary state, andthat a tenfold population increase over 2000 years, as suggested by the recent archaeologicalevidence in south-eastern Australia, implies an average annual growth rate of only 0.1% p.a.This, Gray (1985: 23) pointed out, was hardly a population explosion, and local occurrences ofgrowth or decline at this rate actually support the ‘near-stationarity’ hypothesis. Hecommented further that a tenfold population increase over a much shorter period (say 500years) would be needed to signify a considerable departure from ‘near-stationarity’; such anincrease represents a growth rate of 0.5% p.a. Gray (1985: 26) concluded that over time weshould expect to find very considerable changes (increases) in the sizes of Aboriginalpopulations (local and continental), but that such changes over very long periods of time arerelatively insignificant and do not contradict the hypothesis of long-term ‘stationarity’.
Ammerman et al. (1976: 29) stated that it was unreasonable to expect a regionalpopulation to continue growing at a rate of 1% to 3% a year over a period as long as 1000years. However, he believed that even an apparently low rate of growth such as 0.1% a yearwould lead to major changes in population size and probably to socioeconomic changes aswell, if it was maintained over periods in the order of 2000 years.
Thus, the significance that can be assigned to a particular growth rate depends asmuch on the length of time over which it was maintained, as on the actual growth rate itself.
Population-change conclusionsIf the regional changes in the number of habitations and/or artefacts over time are assumed toindicate changes in population size, and if it is accepted that either a 0.1% p.a. growth rateover 2000 years or a 0.5% p.a. growth rate over 500 years may have brought about significantdemographic, social or economic changes, what conclusions can be drawn from thearchaeological evidence? Did growth rates of either 0.1% p.a. over 2000 years or 0.5% p.a. over500 years occur in many or any regions in eastern Australia? Conclusions that can be drawndepend on which set of evidence is taken as the indicator of population change — thehabitation indices or the artefact accumulation rates. • If the habitation indices (number of habitations used and rate of known-habitation
use) are taken as the indicators, then the calculated growth rates suggest significantchange did not occur in any region. All average annual growth rates were less than+0.11% p.a. (Table 7.7). The growth rates for 500-year periods have not beencalculated, but the raw data do not appear to indicate growth rates of greater than0.5% p.a. were maintained for periods of more than 500 years.
• If the artefact accumulation rates are taken as the indicators, then although averageannual growth rates greater than +0.1% occurred at many times, it is not often thatthey were maintained for periods of 2000 years or more (i.e., Bass Point for ca 2150years and Devon Downs for ca 1900 years). Growth rates of +0.5% p.a. or greateroccurred less frequently and at only one site were they maintained for a periodgreater than 500 years (Sandy Hollow for ca 510 years) (Appendix 4, Tables A4/17 toA4/42). At other sites, growth rates of +0.5% or greater were all associated withperiods of less than 220 years (Native Wells 2 and Gatton). Three sites had negativevalues of –0.1% or less which were maintained over 2000 years: at Kenniff Cavebetween ca 16,200 BP and ca 13,700 BP (ca 2500 years), at Native Well 2 between ca2300 BP and ca 100 BP (ca 2200 years), and Fromms Landing 6 between ca 2950 BPand ca 100 BP (ca 2850 years). No sites indicate growth rates of -0.5% or less forperiods of 500 years or more. The evidence from individual sites is, however, likely to represent only the changes in
each particular site and may not be representative of the changes within a locality or region as
A re-examination of interpretations and explanations for changes in habitation and artefact indices in Eastern Australia
terra australis 21
193

a whole. In addition, the length of time over which a growth rate appears to have beensustained (e.g., as at Bass Point and Devon Downs) is a function of the temporal units intowhich the site’s deposits were divided for other analytical purposes. Reanalysis of the datagrouped according to other units may show other trends.
The above conclusions suggest that the ‘dramatic’ increases in the archaeological recordwhich are documented in the previous chapters may not necessarily indicate thatdemographically or socially significant changes occurred in the population growth rates atcertain points in time. Claims for dramatic increases in population growth rates duringspecific periods of time in the late-Holocene may be unfounded. However, even though agrowth rate may not change over time, the size of the increase in a population after a longperiod of time could become relatively substantial (Gray 1985: 26). Thus if a prevailing systemor systems (e.g., social, economic or technological) could not operate effectively beyond acertain population size, then a steady increase in the size of a population over the long-termeventually may have brought about social, economic and/or material changes. AlthoughI argue elsewhere in this monograph that quantitative changes in the archaeological recordmay not be produced by population change, there is no doubt that the population increased insize from the time of initial colonisation to the time of British colonisation in 1788. In addition,over this time, the increasing size of the population would have resulted in larger amounts ofcultural debris being created and larger numbers of sites being inhabited. However,populations no doubt also declined in many regions and perhaps continent-wide at varioustimes, and some arid and semi-arid regions may have been abandoned in some periods, forexample, during the Last Glacial Maximum (Davidson 1990: 53–5; and recent studies, seebelow). In addition, growth rates associated with these increases and decreases in populationneed not have been uniform in direction, magnitude or timing in different areas across thecontinent.
If changes in the habitation and artefact indices are evidence of population change,then the ‘population changes’ were principally small in scale, that is, <0.1% p.a., and wherethey reached >0.5% p.a. they were not sustained over long periods of time, that is, for periodsexceeding 500 years. The growth rates do not indicate any periods which were above ‘nearstationarity’ — that is, the archaeological evidence does not support dramatic increases ordecreases in population sizes during particular periods in time. Investigating theoreticalissues associated with the identification of archaeological indices that measure populationgrowth and decline (see discussion in Beaton 1990: 32) was beyond the scope of this study.However, these issues need to be addressed, as well as the nature and size of samples of siteson which the trends are based, in order to identify archaeological measures of populationchange in hunter-gatherer communities. Associated with these concerns is the identification offactors or processes that would have brought about changes in the growth rate and perhapsresulted in ‘rapid’ population changes (Hassan 1982: 263).
Behavioural change: qualitative changes in stone artefact assemblages
Explanations and interpretations relating to behavioural change are based on the assumptionthat during the Holocene the population size remained stable or fluctuated within only anarrow range. Most of these explanations assume that there were changes in the ratio ofhabitations to people and in the ratio of artefacts to people; that is, the average number ofhabitations used or artefacts manufactured by individual people altered.
Typological, technological and raw material changes are the focus of interpretationsand explanations involving qualitative changes in the stone artefact assemblages. Many
What’s changing: population size or land-use patterns? The archaeology of Upper Mangrove Creek, Sydney Basin
terra australis 21
194

researchers associated dramatic increases in the habitation indices with the introduction ofartefacts diagnostic of the Bondaian assemblages or ‘Small Tool Tradition’ (Lampert andHughes 1974: 233; Bowdler 1981: 108, 1983: 12–13; Morwood 1981, 1984; Hughes and Lampert1982: 26; Rowland 1983: 73; Ross 1984: 200). However, the causal relationships proposedbetween these events were often indirect; for example, the qualitative changes in the stoneartefact assemblages resulted in larger numbers of artefacts which in turn made thearchaeological deposits more visible. Other explanations, which suggest direct relationshipsbetween qualitative changes in the stone artefact assemblages and quantitative changes in thearchaeological record, concern only the dramatic changes in artefact accumulation rates.
Qualitative changes in the stone artefact assemblages have been proposed asexplanations for both the dramatic increases in the artefact accumulation rates in the last 5000or 4000 years BP and for the decreases in the artefact accumulation rates in the last 1000 yearsor so. Some of the explanations were discussed during presentation of the evidence from theUpper Mangrove Creek catchment (Chapter 6), and are apparent in the review of quantitativechanges in eastern Australia (Chapter 7, Appendix 4). Examples quoted below demonstratethat qualitative changes in the stone artefact assemblages cannot be used as a universalexplanation for the quantitative changes in the archaeological record.
Increases in the artefact accumulation rates in the last 5000 or 4000 years BPQualitative changes in the stone artefact assemblages in south-eastern Australia that researchershave related to increases in artefact accumulation rates were said to occur at the beginning ofthe ‘Small Tool Tradition’ or Bondaian Phase of the Eastern Regional Sequence (i.e., Phase 2 inthe Upper Mangrove Creek catchment), as well as at the transition from the Middle to LateBondaian Phase (referred to as Bondaian and post-Bondaian Phases by some researchers[Table 3.7], and as Phases 3 and 4 in the Upper Mangrove Creek catchment).
Introduction of Bondaian assemblages/‘Small Tool Tradition’Increased artefact accumulation rates were said to coincide with or be associated with theintroduction of the ‘Small Tool Tradition’ (e.g., Lampert and Hughes 1974: 233; Bowdler 1981:108, 1983: 12–13; Morwood 1981, 1984; Hughes and Lampert 1982: 26). Introduction of the‘Small Tool Tradition’/Bondaian assemblages has been identified by the appearance(addition) of new implements into the assemblages — a typological change; a change intechnology; and a change in raw materials.
While some of the new implements can be interpreted as innovations, the changes intechnology and raw materials do not represent the introduction of new technology or newraw materials. They are simply a change in the frequency (number of times) that a techniqueor raw material was used.
1. Typological change — the addition of new implements into the assemblages. Newimplements which are said to appear in eastern Australia with the ‘Small Tool Tradition’include backed artefacts such as Bondi points and geometric microliths (but see Hiscock andAttenbrow 1998). Ground-edged artefacts appear for the first time in south-eastern Australia;in Queensland, South Australia and western NSW, unifacial (pirri) points also appear.
Increases in the artefact accumulation rates are usually related to changes in theflaked artefacts and not the ground-edged artefacts. However, the appearance and thensubsequent increase in the use of ground-edged artefacts probably also impacted on manyaspects of Aboriginal life, which may be reflected in the amount of stone artefactmanufacturing debris accumulated at sites. McBryde (1977: 234–6) associated an increase inground-edged implements with a decline in the representation of macropodids and a rise inthat of phalangeridae in the food refuse at sites in the New England region. An association
A re-examination of interpretations and explanations for changes in habitation and artefact indices in Eastern Australia
terra australis 21
195

between the increase in ground-edged implements and the increase in total numbers ofartefacts has not been raised by other researchers and is not discussed here.
Hughes and Lampert (1982: 25) and Ross (1984: 200) stated that the new stoneimplements introduced with the ‘Small Tool Tradition’ expanded the existing range of stoneimplements and did not just replace existing types. Ross as well as Hughes and Lampertargued against the suggestion that these additions resulted in an increase in the number ofartefacts discarded per head of population at a site, not only because of the increased range ofimplements per person but also as a result of the greater quantity of manufacturing debriscreated. Hughes and Lampert (1982: 25) argued that the curves ‘for only maintenance tools(flake scrapers, core tools and elouera)’ at Burrill Lake and Currarong 1 (both on the NSWsouth coast) showed no appreciable divergence from those for ‘all implements’ and thus theaddition of the ‘new tool types’ did not affect the trends.
In addition, the evidence from other regions indicates that the appearance of newimplement types (e.g., backed artefacts, unifacial points) did not always coincide in time witha ‘dramatic’ increase in the artefact accumulation rates in all sites and/or regions; for example,not at Sandy Hollow in the NSW Hunter Valley (Fig. 7.11; Table A4/22), Native Well 1 and 2 inthe central Queensland highlands (Figs 7.24 and 7.25; Tables A4/37 and A4/38) or Maidenwellin south-eastern Queensland (Fig. 7.28; Table A4/41).
In contrast, at Devon Downs, while the disappearance of points in the upper twospits coincides with a dramatic decrease in the artefact accumulation rate (and may be due tothe smaller sample size in these units, Smith 1982: 110–11), there was a more substantial earlierdecrease in the number of unifacial points which appears to coincide in time with a substantialincrease in the artefact accumulation rate (in spit 4). At Native Well 1, pirri points disappearedfrom the assemblage in the same level (4) as the most dramatic increase in the artefactaccumulation rate (though it was not the period with the highest growth rate). Thus dramaticincreases in artefact accumulation rates were associated in one site with the disappearance ofan implement type, and at the other with a reduced frequency of an implement type.
The lack of simultaneity in the appearance of new artefact types and substantial changesin the artefact accumulation rates is also seen in sites outside eastern Australia. For example, atNauwalabila I (the Lindner Site), Arnhem Land, the main concentration of bifacial pointsoccurred in units with the highest number of artefacts per kilo of sediment (units 17 to 9), butthey first appeared (a single occurrence) in a much earlier level (unit 27) (Jones and Johnson1985a: Tables 9.4 and 9.6; Jones 1985: 296). The first appearance of adze/chisel slugs occurred atthe beginning of an upward trend in the concentration figures (unit 19) though a substantialincrease in the concentrations and the highest concentration figures occurred later (units 17 to 9).The adze/chisel slugs remained in the assemblage throughout the sequence and did not declinein number or disappear with the decrease in artefact concentrations in the upper eight units.
2. Technological changes. The appearance of Bondaian assemblages are described asbeing characterised by the increased control in flaking, and changes in the preparation of coresand retouched flakes (Stockton 1977a: 216; Johnson 1979: 95, 110–11; Kohen et al. 1984: 66–7;Hiscock 1986: 42–4).
At Sandy Hollow in the Hunter Valley, Hiscock (1986: 44) said technological changesaccompanied each of three phases which he called Pre-Bondaian, Phase I Bondaian and PhaseII Bondaian. The technological features include faceted platforms (which were introduced andwere present only in the Phase I Bondaian spits) and overhang removal. The latter was presentthroughout the sequence, but the percentage of flakes with overhang removal increased inPhase II Bondaian spits. Pre-Bondaian spits have a virtual absence of platform preparation(Hiscock 1986: 42–4, Table 6). However, although these technological and typological featuresare present in the spits with the highest artefact accumulation rates, their appearance did not
What’s changing: population size or land-use patterns? The archaeology of Upper Mangrove Creek, Sydney Basin
terra australis 21
196
coincide with the most dramatic increase in the artefact accumulation rate (Fig. 7.11, TableA4/22). There was a marked increase in the artefact accumulation rates at the beginning ofPhase I Bondaian, but it was not as dramatic as that which occurred within the pre-Bondaianphase or midway through Phase I Bondaian.
At Devon Downs, the technological change was described as a change in the‘reduction processes from flake technology to an opportunistic mode of stone working’ (Smith1982: 114). Smith concluded, however, that this change was not correlated with changes in the‘amount of stone in the deposit’ (Fig. 7.23, Table A4/34).
The evidence from Sandy Hollow and Devon Downs suggests that the appearance ofa technological change and a dramatic change in the artefact accumulation rates did notalways coincide in time. Artefact accumulation rates also increased at times whentechnological change was not identified.
3. Raw material change. The increased relative frequency of fine-grained materials suchas silcrete, chert and indurated mudstone/tuff, which are usually associated with theintroduction of the Bondaian assemblages and ‘Small Tool Tradition’, was not suggested as areason for the increased accumulation rates. Smith (1982: 110–11) suggested that ‘theavailability of suitable stone’ may be a reason for quantitative changes, but at Devon Downshe argued that there were no obvious changes in the types of raw materials utilised and thusthis type of change did not explain the observed variation.
Transition from Middle to Late Bondaian (Bondaian to post-Bondaian)The disappearance of or a decline in backed artefacts, as well as an increase in the percentagefrequency of ground-edged artefacts, bipolar artefacts and quartz as a raw material have beendocumented at the transition from Middle to Late Bondaian (from Bondaian to post-Bondaian;from Phase 3 to 4 in the Upper Mangrove Creek catchment). The increase in bipolar artefactsrepresents an increase in bipolar working.
The increase in bipolar artefacts (a ‘typological’ change), due to an increase in bipolarworking (a technological change) is usually associated with an increase in the percentagefrequency of quartz (a change in raw material usage). Bipolar working is seen more often onquartz material than on other types of raw material (e.g., silcrete, chert, induratedmudstone/tuff), and increased at the expense of hand-held percussion.
Assemblages in the uppermost levels at many sites in south-eastern Australia(referred to as Late Bondaian, post-Bondaian, Late Small Tool Phase or ‘Recent’) are quartz-dominant (McCarthy 1948: 22; Lampert 1971a: 16, 44–7, Table 5; Flood 1980: 250, 329;Attenbrow 1981: 45–52). The increased percentage frequency of quartz artefacts in ‘recentassemblages’ was used by some to explain the continuing increase in rates of artefactaccumulation at some sites. For example, Williams (1985) suggested that significant increasesin the rates of sedimentation and artefact discard did not occur until after 2000 BP on the NSWsouth coast and that:
Perhaps these changes were associated with shifts in technology … where backed bladestended to drop out of assemblages and were replaced by quartz artefacts, which are mostlyunretouched. (Williams 1985: 327–8)
Hiscock (1982b: 43) considered that quartz domination may have been due to the factthat quartz was more highly reduced than other stone types and therefore may reflect onlychanges in knapping behaviour. An increase in the use of quartz and bipolar technology mayresult in a greater quantity of debitage being produced per unit time. Individual sites in theUpper Mangrove Creek catchment (Chapter 6) and several other sites in eastern Australia(e.g., Currarong 1 [Lampert 1971a: 67]; Sassafras [Flood 1980: 328]; Shaws Creek K2 [Kohen
A re-examination of interpretations and explanations for changes in habitation and artefact indices in Eastern Australia
terra australis 21
197

et al. 1984: Fig. 6]) have quartz-dominant assemblages with decreased rates of artefactaccumulation in the upper levels. This shows that increases in the percentage frequency ofquartz artefacts at individual sites were not always associated with increases in the artefactaccumulation rates.
Conclusion relating to increases in the artefact accumulation rateIt is clear that typological, technological and/or raw material changes, which have been usedto identify the introduction of the Bondaian assemblages or the ‘Small Tool Tradition’ and thetransition from middle to late Bondaian (Bondaian to post-Bondaian), did not always coincidein time with the onset of dramatic changes and/or continuing increases in the artefactaccumulation rates. Quantitative changes occurred at some sites at the same time astypological, technological or raw material changes, but as a general rule it cannot be said thatquantitative changes occurred in all sites or all regions at the same time as the appearance ofthe Bondaian assemblages/‘Small Tool Tradition’.
Decreases in the artefact accumulation rates in the last 1000 yearsDecreases in the artefact accumulation rates were explained in terms of typological,technological and raw material changes. Some explanations incorporate a change from stoneto another type of raw material, rather than the exchange of one stone type for another (i.e.,simple raw material change, as discussed in the previous section).
Typological changeThe decrease or disappearance of backed or other artefacts has not been advocated as a reasonfor decreased artefact accumulation rates — possibly because the latter went unrecognised orwas considered unimportant. However, the following examples indicate that it was unlikelythere is any association between the two events.
At Maidenwell, the loss of/decrease in backed artefacts coincided in time with asubstantial decrease in the artefact accumulation rate at the beginning of the Recent Period, whenthere was also the greatest decline in the growth rate (Fig. 7.28; Table A4/41). (Morwood 1986: 98,believes the backed artefact in the uppermost excavation unit was ‘scuffed up’ from earlierlevels.) At Native Well 1 and Native Well 2, backed artefacts and pirri points respectivelydisappear from the assemblages subsequent to dramatic decreases (Figs 7.24 and 7.25, TablesA4/37 and A4/38). In contrast, in the Upper Mangrove Creek catchment, the decline in backedartefacts began before the dramatic decrease in the artefact accumulation rate (Chapter 6).
Technological changeAgain, as with the other qualitative changes, whether or not there was a correlation betweenchanges in technology and decreases in artefact accumulation rates varied from site to site.Technological change was investigated by Smith (1982: 111, 114–15) as a cause for thequantitative changes at Devon Downs: a ‘change from a well-developed flake technology,including unifacial points, to a more casual approach to stone working in units 1 to 3’. Heconcluded that the decrease in the artefact accumulation rate was not correlated with thetechnological change (Fig. 7.23, Table A4/34).
At Sandy Hollow, reanalysis of the artefact distribution patterns by Hiscock (1986: 44,Fig. 3) and myself (Chapter 7, Appendix 4) show that the beginning of the Phase II Bondaiancoincided with a substantial decrease in the artefact accumulation rate and the greatest declinein the growth rate (Fig. 7.11, Table A4/22).
What’s changing: population size or land-use patterns? The archaeology of Upper Mangrove Creek, Sydney Basin
terra australis 21
198

Raw material changeSmith (1982: 110–11) proposed that changes in the ‘availability of stone’ were likely to affectthe amount of stone in a site. However, for the sequence at Devon Downs, he (1982: 111–12)concluded that the lack of variation in the index used to measure this aspect indicated thatchanges in the availability of stone did not explain the observed variations in either thedecrease or the increase in the artefact accumulation rate.
A change in the nature of the raw materials used was also proposed as an explanationfor decreased amounts of stone in the recent levels of archaeological deposits, i.e., thereplacement of stone by another raw material but one which has not survived (Mulvaney1975: 243), or one which was not left behind (Schrire 1972: 664–6). Both of these explanationsare essentially the same (changes in preferred raw materials) except that the new rawmaterials differ and the reason for the change from the original raw material differs. AlthoughMulvaney’s explanation may partially explain a change in technology (i.e., the ‘degeneration’in stone-working), the fact that all archaeological deposits in the area do not have a decline inthe artefact accumulation rates in the upper levels make it appear less plausible. It remains adifficult hypothesis to test, unless sites are found which have long histories of habitation andexcellent preservation of organic materials throughout.
Conclusions concerning qualitative changes in the stone artefact assemblagesThere are some instances where temporal correlations between quantitative and qualitativechanges in the artefact assemblages are documented. However, as a general rule, the dramaticquantitative changes in the artefact accumulation rates in the latter half of the Holocene didnot occur at the same time (i.e., in the same spit or level in a site) as the appearance ordisappearance of backed artefacts, the increased use of bipolar working, an increased use ofquartz or changes in other raw materials, or changes in technology. The quantitative changesdid not always coincide in time with the appearance of the Bondaian assemblages/‘Small ToolTradition’ or the transition from the Middle to Late Bondaian (Bondaian to post-Bondaian).
Such a conclusion implies that 1. if dramatic changes in the artefact accumulation rates are indicative of changes in the
population size, then the increase in population was not necessarily associated withthe introduction of the ‘Small Tool Tradition’ or Bondaian assemblages, or any of theother qualitative changes examined above (see also Williams 1985: 5, 327–9).
2. Bowdler’s (1981) hypothesis that the association of increases in archaeologicalphenomena with the appearance of the ‘Small Tool Tradition’ in the easternAustralian highlands is an indicator that ceremonial activities were associated withthe first successful occupation of the highlands is not supported. In addition, theevidence presented in previous chapters indicates that dramatic increases in thehabitation establishment rates, the numbers of habitations used and the artefactaccumulation rates were not geographically restricted and occurred over a muchwider area and diversity of environments than the eastern Australian highlands.Dramatic increases in the habitation establishment rates, the numbers of habitations
used and the artefact accumulation rates may be said to be associated with Bondaianassemblages and the ‘Small Tool Tradition’ in so far as they often occur within the period inwhich these assemblages have been identified. However, the dramatic changes in the artefactaccumulation rates cannot necessarily be explained by typological, technological or rawmaterial changes in the stone artefact assemblages (or at least those aspects examined above).The appearance of Bondaian assemblages/the ‘Small Tool Tradition’ and the qualitativechanges in the stone artefact assemblages examined above cannot be used as universalexplanations for the quantitative changes in the archaeological record.
A re-examination of interpretations and explanations for changes in habitation and artefact indices in Eastern Australia
terra australis 21
199

Conclusions and post-1980s studies
During the past 22 years, many other studies have been carried out which incorporate some ofthe explanations and interpretations addressed in this and earlier chapters. These more recentregional studies reinforce the results of 1970s and 1980s studies in documenting increasingnumbers of habitations established and used during the Holocene, and also the fact thatartefact accumulation rates increased in the upper levels of some sites and decreased in otherswithin the same region. Many explanatory models for these quantitative changes still includeintensification and increasing social complexity (Lourandos 1997: 240–3), though suchprocesses are often said to begin much later than originally proposed by Lourandos. Forexample, Ulm and Hall (1996: 54–5) put forward intensification of resource use associatedwith changes in land-use as late as 1200 BP to explain the increase in shell middens andbevelled pounders that occurred in south-eastern Queensland at that time. Sociodemographicmodels have also been proposed (Lourandos 1997: 243, 318–21, 327–30; David and Lourandos1997).
Continent-wide demographic changes are still proposed (e.g., Beaton 1990; Dodson etal. 1992: 119–23; O’Connor et al. 1993: 96, 102; Flood 1995: 248–9), though regional changes,sometimes involving local shifts of population, have been proposed more frequently (e.g.,McNiven 1992a; David and Chant 1995: 514; Morwood 1995: 39; Morwood and Hobbs 1995a:180–2; Morwood and L’Oste-Brown 1995: 175; Ulm and Hall 1996: 55). Researchers still baseconclusions on the assumption that changing numbers of sites or artefacts provide a generalmeasure of population increase, for example: O’Connor et al. (1993: 101) state that:
when the magnitude and direction of change in discard rates are internally consistent at theregional level, this must signal fundamental changes in the regional system … we explicitlyassume that regional changes in discard rates of a large order of magnitude do reflectpopulation change (cf. Ferguson 1985).
Changes in site use, that is, in the ‘intensity of site use’, also remains a common theme(Barker 1991; Lourandos 1993: 74; Boot 1996b: 77–8; David 1991; Morwood and Jung 1995:97–9; Morwood and Hobbs 1995a: 180–1), as well as periods of abandonment (Morwood,Hobbs and Price 1995: 81, 85). A change from the preferential use of rockshelters to openlocations within the same locality was still proposed (McDonald 1994: 74–8, 80, 348–9); andhuman taphonomic processes (treadage) were investigated to account for changes in artefactaccumulation rates (Jung 1992; Morwood and Jung 1995: 99; Morwood and Hobbs 1995a: 181;Lamb 1996b). Natural processes, including the rising sea-level and coastal erosion were stilladvocated to explain the documented increases in site numbers (e.g., Bird and Frankel 1991a:3, 5–6, 1991b: 187–8; Dodson et al. 1992: 119–23; Ulm and Hall 1996: 52–3).
Researchers have begun increasingly to undertake detailed investigations which assesschanges in site numbers and artefact numbers in individual sites, as well as the abundanceand paucity of particular artefact types and stages of reduction at a regional level, in terms ofresponses to changing risk factors (e.g., Hiscock 1994, 2002; Lamb 1996a; Thorley 1999: 67;Clarkson 2001: 67–8), mobility patterns (e.g., McNiven 1992b, 1994; Hiscock 1996; Barton 2000:38–9; Thorley 2001), and tool manufacturing and maintenance behaviour (Barton 2000: 38–40).Hiscock (1993: 65, 75) described the transition from pre-Bondaian to Bondaian as representing‘an increase in the regularity and precision of knapping related to raw material conservation’.Many recent consulting reports involving Aboriginal sites on the Cumberland Plain (Sydneyregion) and in the NSW Hunter Valley incorporate discussions about site function, land-useand mobility patterns. They were among the themes White (2001) explored in addressingreasons why changes in a rockshelter assemblage occurred over time. However, most
What’s changing: population size or land-use patterns? The archaeology of Upper Mangrove Creek, Sydney Basin
terra australis 21
200

consulting reports deal with stone artefact assemblages in open contexts and theirexplanations for assemblage variation in different parts of their study area (e.g., according tostream order) do not address temporal change (e.g., Craib et al. 1999: 138–42; Kuskie andKamminga 2000; AMBS 2002a, 2002b, 2002c, 2000d, 2003).
Studies have increasingly used more than one ‘measure of intensity of site use’ (e.g.,stone artefacts, faunal remains, ochre, sediment) (e.g., Barker 1991: 105–7; David and Chant1995: 514; Morwood and Hobbs 1995b; Morwood and Jung 1995; Mulvaney and Kamminga1999: 272). Some studies have included regional and temporal variations in engraved andpigment images to identify long-term social and demographic changes including changes toterritorial boundaries (e.g., David and Chant 1995: 514; Morwood and Hobbs 1995a, 1995b;Morwood and Jung 1995).
At a more continental scale, decreased artefact accumulation rates and sterilelayers/disconformities at and about the time of the Last Glacial Maximum have beeninterpreted as periods of site or regional abandonment or lower population densities (i.e., localshifts in population) and contraction in the size of territories due to increased aridity,particularly in arid and semi-arid regions in northern Australia (e.g., Hiscock 1988b; Ross et al.1992: 109; Smith 1989; Veth 1989, 1993: 103–14; Allen 1990: 300; O’Connor et al. 1993; Thorley1999: 66–7; O’Connor 1999: 48–9, 121–2) and Cape York (e.g., Morwood and Hobbs 1995a: 180),as well as after the Last Glacial Maximum in south-west Tasmania (Cosgrove et al. 1990;Cosgrove 1995).
On the other hand, evidence from many regions indicates a richness, complexity andvariability in the archaeological record of the late-Pleistocene prior to the Late GlacialMaximum comparable with that documented in many late-Holocene sites in, for example,south-west Tasmania (e.g., Cosgrove et al. 1990; McNiven et al. 1993; McNiven 1994; Cosgrove1995; Holdaway and Porch 1995); the Kimberley and north-west Western Australia (O’Connor1999: 199, 122; Balme 2000; Veth et al. 2000: 56); northern Queensland (David 1991; Hiscock1984; Lamb 1996b); and the NSW south coast (Boot 1996b: 77–8); though David and Chant(1995: 423–4) present an opposing view. The archaeological evidence for the late-Pleistoceneand early-Holocene periods of ‘intensification’ in eastern mainland Australia as speculated byO’Connor (1999: 119, 122) for the Kimberley needs more detailed examination. However,discussions in the final chapters concentrate on explanations for the quantitative changes inthe Holocene archaeological record of the Upper Mangrove Creek catchment.
A re-examination of interpretations and explanations for changes in habitation and artefact indices in Eastern Australia
terra australis 21
201


terra australis 21
203
Environmental changes associated with global climatic changes of the late-Pleistocene andHolocene in south-eastern Australia included changes to vegetation patterns and lake levels,as well as rising sea-level. Along the NSW central coast, these changes were of sufficientmagnitude to affect both the land and subsistence resources available to inhabitants of theUpper Mangrove Creek catchment and the surrounding regions. People would haveresponded to these changes, but in doing so, climatic and environmental conditions weredetermining variables only in so far as they provided a series of options/opportunities andconstraints within which the societies operated. Decisions about which options to take, whento adopt them and how resources were utilised were probably based on factors such as social,economical, political and ideological preferences, as well as technological capacities (Fletcher1977b: 138–40; McBryde 1977: 249; Thomas 1981: 171–2; Gamble 1982: 99–103, 1983: 202, 1984:250, 256, 1986: 29–31; Bailey 1983b: 150, 164–5; Lourandos 1983b: 43; Rowland 1983: 63; Head1986: 122).
These environmental changes would have altered the relative abundance and/orspatial distribution of resources across the land, and thus influenced land and resource-usepatterns. For example, they would have influenced which parts of the land people used andthe methods they adopted to obtain their subsistence needs (including land managementpractices such as the use of fire and burning patterns), and may have influenced the size of thepopulation which inhabited and exploited particular resource zones (Birdsell 1953, 1971;Hayden 1972; Lampert and Hughes 1974: 231; Bailey 1983b: 149–50; Gamble 1983: 208–9; Ross1981: 145, 1984: 94; Jones 1985: 293–4; Mooney 1997: 148). In this way, environmental factorsmay have influenced people’s decisions about their subsistence practices which then led tochanges in habitation patterns, the size of local populations, land-management practices,and/or the tool kits made, used and maintained within the catchment. Firing vegetation to aidhunting and/or promote plant growth may have exacerbated or altered changes initiated byclimatic effects. Environmental change thus indirectly affected the archaeological record bybringing about changes in human behaviour and material culture and the nature and/oramount of physical evidence that was left behind.
Climatic and environmental change ineastern Australia during the late Pleistoceneand Holocene
9

What’s changing: population size or land-use patterns? The archaeology of Upper Mangrove Creek, Sydney Basin
terra australis 21
204
Climatic and environmental factors are examined therefore in exploring possiblereasons for the observed temporal changes in the catchment’s archaeological record. Thediscussions concentrate on the nature and timing of climatic and environmental changes in theHolocene in south-eastern Australia, and on changes to the morphology of the coastline whichwere associated with the rise in sea-level after the Last Glacial Maximum. Discussionsconcentrate on the last 11,000 years, the period for which there is archaeological evidence ofhuman occupation in the catchment.
However, there is very little data on climatic and environmental change available forthe catchment, with the only specific information coming from excavated faunal remains(Aplin 1981; Aplin and Gollan 1982; Butler 2000). Information about the effect of sea-level riseon the NSW coastline (e.g., Roy 1984, 1994; Ferland and Roy 1994; Roy et al. 1997) and somevegetational histories for the lower Hawkesbury River and its tributaries (e.g., Dodson andThom 1992; Johnson 2000) are available. Nevertheless, since the latter studies are limited innumber and duration, and refer only to pollen evidence, the following discussions also drawon evidence from several widespread regions in south-eastern Australia as well as globaltrends.
Climate change
The present climate of the Gosford–Wyong region has been described as temperate maritime,with warm to hot summers and cool to mild winters (NSW Department of Public Works 1977,Vol. 2: 55–6). The Commonwealth Bureau of Meteorology (2003) records for Kulnura, on theeastern watershed of the catchment, indicate mean daily temperatures range from a maximumof 26.4°C in summer to a minimum of 5.6°C in winter. More rainfall is experienced during thesummer months than the rest of the year and this rainfall is generally of high intensity as itoccurs during summer storms. Monthly rainfall ranges from a mean of 169mm in summer to51.7mm in winter. February is the time of highest mean and median rainfall. In the MangroveCreek valley, frosts occur regularly in mid-winter as well as fog and mist, which can remainfor much of the morning. Maritime effects of the adjacent coast are modified by theintervening terrain. Compared with the coast, the valley is somewhat drier, has a slightlygreater seasonal and diurnal temperature range and less strong winds.
The 10,000 years of the Holocene have been regarded by many as stable with verylittle or no climatic or environmental change (Costin 1971: 33; McBryde 1977: 225; Wasson1982: 1). However, climatic and environmental changes have been documented for this period,though the observed variations are both smaller in magnitude and shorter in duration thanthose recorded for the late-Pleistocene (Bowler et al. 1976: 388; Kershaw 1982: 79; de Menocal2001: 668; Dodson and Mooney 2002). Some researchers consider the Holocene changes wereof insufficient magnitude to affect human behavioural patterns (e.g., Pearson 1981: 58–61;Smith 1982: 115), except perhaps at higher elevations (Costin 1971: 37), whereas others arguethe changes were significant in terms of their impact on human resources and subsistence andhabitation patterns (Stockton and Holland 1974: 48, 56, 58, 60; Pearson 1981: 61; Lourandos1983b: 43; Rowland 1983: 62, 70–4, 1999: 146; Ross 1984: 81; Williams 1985: 315–16, 1988: 218,220; Head 1986: 124).
Broad climatic trends in south-eastern Australia during the late-Pleistocene weremuch drier and colder between ca 25,000 and 15,000 BP than present, with periods of extremecold and aridity about the time of the Last Glacial Maximum (Fig. 9.1). At the transition fromlate-Pleistocene to Holocene, ca 10,000 BP, conditions were similar to or still a little drier andperhaps cooler than present, but they became warmer and wetter during the early-Holocene

Climatic and environmental change in Eastern Australia during the late Pleistocene and Holocene
terra australis 21
205
1st
2nd
3rd
4th
5th
6th
7th
8th
9th
10th
11th
12th
0
5
1
0
1
5
0
10
20
30
0
50
1
00
1
50
20
0
250
No.
of h
abita
tions
/ m
ill.
N
o. o
f hab
itatio
ns /
mill
.
No.
of a
rtef
acts
/ m
ill. (
x100
0)
HAB
ITATI
ON E
STAB
LISH
MEN
T R
ATES
NUM
BER
OF
HABI
TATI
ONS
USED
/ M
ILL.
LOCA
L AR
TEFA
CTAC
CUM
ULAT
ION
RA
TE
MILLENNIUM BP
0
4
0
80
120
16
0
Heig
ht o
f gla
ciat
ion
in s
outh
ern
alps
Tempe
ratu
rePr
ecip
itatio
n
1st
2nd
3rd
4th
5th
6th
7th
8th
9th
10th
11th
12th
13th
14th
15th
16th
17th
18th
19th
20th
Cold
Ar
id
8-10° <
today
Dry
Degl
acia
tion
War
ming
Beco
ming
wet
ter
War
mte
mpe
ratu
res
hig
her t
han
today
Wet
prec
ipita
tion
hig
her t
han
today
Cool
ing
Dryi
ng
War
m(a
s today)
Wet
(as
today)
Drie
r th
an today
2-3°
Cool
er
than
today
Sea-
leve
l(m
etre
s be
low
pre
sent
)
MILLENNIUM BP
CLIM
ATIC
CHA
NGE
S
SEA-L
EVEL
CHA
NGE
S
till
As today
+1-2
m_
Figure 9.1 Upper Mangrove Creek catchment: comparison between timing of changes in habitation and artefact indices and
general climatic shifts and sea-level rise in south-eastern Australia. Sea-level curve based on Roy 1998: Fig. 25.5C.

What’s changing: population size or land-use patterns? The archaeology of Upper Mangrove Creek, Sydney Basin
terra australis 21
206
so that from ca 7000 BP to 5000 BP the climate was warmer and wetter than today. In the late-Holocene, temperatures and effective precipitation fluctuated, but for a time became onaverage colder and drier than today. The reported timing of colder–drier conditions variesregionally, but occurred between 3800 BP and 1500 BP. During the last 1500–1000 years,average temperature and precipitation again increased to values similar to those of today.Wind direction and intensity are not immediately relevant to my current investigations andtherefore discussions on climate focus on temperature and precipitation.
The above trends show broad temporal correlation with data from other southernPacific-Rim countries which are linked to El Niño–Southern Oscillation (ENSO) eventsindicating that the general long-term climatic changes in Holocene south-eastern Australiawere part of global climate changes. ENSO’s mode of operation has not been constant overtime, and probably did not operate in its present-day fashion during the period of lower sea-level associated with the Last Glacial Maximum (Markgraf et al. 1992: 194). Timing of thecycles and their strength may also have varied globally. Typical ENSO cycles started to be aninfluencing factor only about 7000 years ago (albeit weakly at first). They began to exercise astrong presence only about 5000 years ago and were not fully developed until about 3000years ago (McGlone et al. 1992: 436, 457–8; Rodbell et al. 1999: 519). Onset of its current state inthe last 5000 years (Kershaw et al. 2000: 502; or 6000 years according to Markgraf and Diaz2000: 465; Moy et al. 2002: 164) produced an increase in climate and environmental variability.The South American evidence indicates peak event frequency occurred ~1200 cal BP and thendecreased towards the present (Moy et al. 2002: 164). The dominant effect of ENSO in south-eastern Australia was to increase the variability of precipitation (McGlone et al. 1992: 435).
Within the broad climatic trends in eastern Australia, some regional variations,particularly after 5000 BP, were linked to ENSO phenomena, and it has been suggested thatchanges occurred later in time in north-eastern Australia than in south-eastern Australia(McGlone et al. 1992: 446; Markgraf and Diaz 2000: 474). In addition, there were regionaldifferences, particularly in effective precipitation, which were due to variations in altitude(e.g., southern highlands versus coastal lowlands), geography (e.g., inland versus coastal;semi-arid versus temperate), and hydrologic conditions (Bowler et al. 1976: 388; Chappell andGrindrod 1983b: 2, 1983c: 27–8; Kodela 1992; Markgraf et al. 1992: 195; Harrison and Dodson1993; Kershaw et al. 2000: 492; Markgraf and Diaz 2000: 474). Variations in the timing andduration of peak conditions have also been reported, sometimes depending on thepalaeoenvironmental records used; for example, lake levels or pollen data (Bowler et al. 1976:388; Harrison and Dodson 1993: 280; Dodson and Mooney 2002: 456, 460).
Late Pleistocene During the late Pleistocene (ca 35,000 BP to ca 10,000 BP), glacial and periglacial conditionsdeveloped in south-eastern Australia and then retreated. This phase of glaciation began about34,000–31,000 years ago. Mean annual temperatures were probably only 3°C below present atthat time, but during the period from ca 25,000 to ca 15,000 BP, they would have been between6°C to 10°C lower than present (Galloway 1965: 603–6; Costin 1971: 33, 1972: 581, 588–9;Bowler et al. 1976: 359, 370; Singh 1983a: 66, 1983b: 24; Markgraf et al. 1992: 194–5; Kershaw1995: 660; Kershaw et al. 2000: 490). Throughout the late-Pleistocene, conditions weregenerally drier than today in the south-east of the continent (Bowler et al. 1976; Rognon andWilliams 1977: 301–2; Dodson and Thom 1992: 121, 132). Absolute and effective precipitationduring the Last Glacial Maximum has been estimated as being about 50% of today’s values(Kershaw et al. 2000: 491).
Glacial conditions and periglacial conditions existed above 1000m, and periglacialconditions existed along the Great Dividing Range as far north as the NSW New England

Tablelands. Along the eastern coast and foothills of the Great Dividing Range, conditions maynot have been as extreme during the Last Glacial Maximum due to the ameliorating effect ofoceanic influences and, in post-glacial times, may have been ameliorated by the rising sea-level (Costin 1971: 35; Kershaw et al. 2000: 490–1).
By about 15,000 BP, temperatures were rising and deglaciation was in progress,though the colder-than-present conditions lasted until about 10,000-9000 BP (Costin 1971: 33,36, 1972: 589; Bowler et al. 1976: 387, 389). In southern Australian coastal areas, the evidenceindicates a gradual increase in rainfall and vegetation growth conditions between ca 15,000 BPand ca 10,000 BP rather than an abrupt change (Dodson and Hope 1983: 75).
The Holocene At the beginning of the Holocene, ca 10,000 BP, conditions in many coastal areas in southernAustralian were similar to those at present, though some areas remained drier, possibly untilca 9000 BP (Dodson and Hope 1983: 75; Harrison and Dodson 1993: 282; Markgraf and Diaz2000: 471). Most changes at this time in southern coastal areas can be attributed to decreasedcontinentality associated with the rising sea-level, which in general resulted in animprovement in the rainfall/evaporation ratio, which continued into the Holocene.
The increasing temperatures and precipitation culminated in an early- to mid-Holocene ‘optimum’, which was warmer and wetter than the preceding 10,000 or so years,and had the highest temperatures and precipitation in the Holocene period (Bowler et al. 1976:378, 388; Rognon and Williams 1977: 305; Kershaw 1995: 667–9). It was up to 25% or 30%wetter and 1°C warmer than present (Kershaw et al. 2000: 490; Dodson and Mooney 2002:456). These conditions lasted from about 8000 BP to 4000 BP, although timing of peakconditions varied regionally, being reached earlier in the south of the continent than in thenorth (McGlone et al. 1992: 435, 446; Markgraf and Diaz 2000: 474; see also Costin 1971: 33;Bowler 1976: 73; Chappell and Grindrod 1983d: 87; Kershaw 1982: 79, 1989: 89; Harrison andDodson 1993: 282, 287–8). In the south-eastern lowlands, maximum moisture conditionsexisted between ca 7000 BP to 5000 BP (Bowler et al. 1976: 378; Markgraf et al. 1992: 195–6;Markgraf and Diaz 2000: 474).
The evidence generally points to a return to a cooler drier climate from about 5000 or4500 BP. It is in this period, especially after 3000 BP, that ENSO began to operate as now andthere is evidence for increasing seasonality and variability in precipitation, leading to moremarked winter–summer precipitation patterns in some areas (Markgraf et al. 1992: 196, 208;McGlone et al. 1992: 435–6, 457; Markgraf and Diaz 2000: 475). Temperatures and precipitationcontinued to drop until conditions became cooler and drier than at present. Dates attributed tothe duration of this ‘colder-drier’ period fall between 3800 BP to 1500 BP, with most between3500 BP and 2000 BP (e.g., Costin 1971: 36–7, 1972: 589; Bowler et al. 1976: 371, 373; Dodson1987: 79; McGlone et al. 1992: 446; Harrison and Dodson 1993: 276, 279–80). Costin (1971: 36;1972: 589) estimated temperatures in the Snowy Mountains from ca 4000–3000 to 1500 BP to beabout 2°C or 3°C lower than today.
With moister conditions, some vegetation zones may have expanded at the expenseof others: more closed vegetation communities increased in area and more open conditionsdecreased; for example, rainforests and wet sclerophyll forests increased and dry sclerophyllforest decreased, forest expanded into woodland areas, woodland expanded into grasslands,and swamps increased in size and some perhaps became lakes (Bowler et al. 1976: 371–3;Williams 1985: 316; Kodela and Dodson 1988 [1989]: 324–5; Dodson and Thom 1992: 133;McGlone et al. 1992: 446; Jones and Dodson 1997: 20). Alternatively, changes may haveoccurred as variations in species abundance within vegetation communities (Scott Mooney,pers. comm., 2003). With drier, more arid conditions, the reverse of these conditions would
Climatic and environmental change in Eastern Australia during the late Pleistocene and Holocene
terra australis 21
207

What’s changing: population size or land-use patterns? The archaeology of Upper Mangrove Creek, Sydney Basin
terra australis 21
208
have applied and more open conditions prevailed. Changes in water availability andvegetation patterns brought on by climatic change would in turn have influenced the animaldistribution patterns. Fire regimes (natural and/or human) may have altered as well.
Locally, pollen and charcoal records come from cores from swamps on Mill Creek, atributary of the Hawkesbury River near its junction with Mangrove Creek, and in Ku-ring-gaiChase National Park on the southern side of Broken Bay. These suggest drier conditionsoccurred between 2900 BP and 1800–1900 BP. At Mill Creek, one core dating from ca 9100 BP toca 2500 BP indicates that about 2800 BP to 2500 BP the forest was more open than in thepreceding period, 9000 BP to 2800 BP, and that the rainforest elements, locally at least, declinedat this time (Dodson and Thom 1992: 127–31, 133). Dodson and Thom (1992: 133) suggest thatabundant charcoal in the core sections containing rainforest elements indicates that the declinein rainforest and development of more open vegetation was in part due to increasedoccurrences of either anthropogenic or natural wildfires, and make no reference to climaticchange. Another Mill Creek core extending over 863 years to 1993 indicates the presence priorto 1790 AD of dry sclerophyll forest on the valley sides with wetland communities on the valleyfloor (Johnson 2000). There was little charcoal input during the prehistoric period comparedwith that of the subsequent European agricultural period beginning in the 1790s (Johnson 2000:217, 223). In Ku-ring-gai Chase National Park, pollen evidence from a core extending back ca6000 years suggests there was a possible dry period about 2900 BP, that climatic conditions ca2000 BP may have been drier than present, and that conditions possibly became slightly drierand the eucalypt canopy opened towards a more woodland type about 1800–1900 BP (Kodelaand Dodson 1988 [1989]: 324–5). In contrast with Mill Creek, charcoal declined in Ku-ring-gaiChase National Park within the last 200 years (p. 323), perhaps reflecting the absence ofAboriginal burning and/or the lack of agricultural opportunities in this catchment.
Aboriginal burning patterns have been proposed by several environmental scientists asbeing responsible for some vegetation and geomorphological changes (or at least foraccelerating changes) during the late-Holocene, though their impact is much debated (Bowler etal. 1976: 388; Hughes and Sullivan 1979: 24–5, 1981, 1986; Hughes 1981; Colhoun 1983: 93; Hope1983: 98; Sullivan and Hughes 1983: 124; Head 1989; Dodson and Thom 1992: 133; McGlone et al.1992: 449, 455–6, 458; Kershaw et al. 2000: 490, 503). However, others state that in manyAustralian, New Zealand and South American pollen records, evidence for increasing firefrequency cannot be ascribed to anthropogenic factors alone, and were likely to be the result ofincreasing climatic variability (Markgraf and Diaz 2000: 475; Dodson and Mooney 2002: 456).
During the last 1000 years, climatic conditions in eastern Australia appear to havebeen relatively stable with slight increases in precipitation compared with the precedingperiod (Harrison and Dodson 1993: 276, 279), and slight increases in temperature until those oftoday were reached (Dodson 1987: 79–80). Marked climatic fluctuations have beendocumented in the Northern Hemisphere; for example, Europe’s Medieval Warm Period inthe 11th and 12th centuries AD (950–750 BP), and the subsequent Little Ice Age of the 16th to19th centuries AD (450–100 BP) (Markgraf and Diaz 2000: 478–9; de Menocal 2001: 668; Joneset al. 2001: 663–5). However, such periods have not been identified in south-eastern Australianrecords to date (Jones et al. 2001: 664; Mooney 1997: 140), though they have in other SouthernHemisphere regions (e.g., the Little Ice Age in South America [Peru] and New Zealand,Mooney 1997: 147).
Palaeoenvironmental evidence from the Upper Mangrove Creek catchmentTemporal changes in excavated faunal assemblages from the catchment may provide someevidence for environmental change during the last 3000 years, the period during which faunalremains have been preserved. Three excavated archaeological deposits — Loggers, Mussel
and Deep Creek — have sufficient faunal remains for changes over time to be investigated. Intwo of these rockshelter sites — Mussel and Deep Creek — there was a change in the faunalassemblages, particularly in the macropodid component, about 1200–1000 BP (Aplin 1981:33–4, 51–3; Aplin and Gollan 1982: 20–6; Butler 2000: 85–8). However, it was not identified inthe sequence at Loggers, which is in a more open section of the valley system. In some south-eastern Australian regions — e.g., the Snowy Mountains — colder–drier conditions have beenrecorded as persisting as late as 1500 BP, but as described above, such conditions have notbeen documented this late in local pollen cores.
In both Mussel and Deep Creek, the lower assemblages are characterised by thepresence of Macropus giganteus (eastern grey kangaroo) and the relative importance of M.rufogriseus (red-necked wallaby). In the upper assemblages, M. giganteus and M. rufogriseus areabsent (the latter is presently uncommon in the catchment) and there is a corresponding rise inWallabia bicolor (swamp wallaby) and Thylogale sp. (pademelon) (Aplin 1982: 20–1). In present-day faunal studies, the two species characterising the earlier levels are observed most often inareas of relatively dry, open forest and woodland; both are grazers feeding on grasses, herbsand forbs (Strahan 2000: 335–8, 350–2). The two species characterising the later levels arecommonly associated with dense, wet understorey communities; the swamp wallaby isprimarily a browser of shrubs and bushes rather than grass, and pademelons have a varied dietof leaves and fruit, or feed on the grassy edges of dense forest (Strahan 2000: 397–400, 404–5).
Aplin suggested that this change in the faunal assemblages could be interpreted aseither (1) a shift in the catchment vegetation patterns involving the areal expansion of wet,closed communities at the expense of drier, more open vegetation (Aplin 1981: 52–3; Aplin andGollan 1982: 21), or (2) a shift in subsistence activities, within a stable environment, towardsthe resources of wetter, more closed forests (Aplin and Gollan 1982: 21). He (1981: 53)suggested that two factors may account for the postulated variation in vegetation: eithervariations in magnitude and frequency of firing events, or water-table fluctuations in thevalley fill and associated changes to the hydrologic regime of the drainage system.Subsequently, Aplin and Gollan (1982: 24) said, ‘a reduction in the frequency of firing eventswould probably be sufficient to bring about the envisaged vegetational change in the DeepCreek valley.’ However, they (1982: 21) argued that since the faunal changes involved ‘thelocal extinction of at least one species of mammal, the grey kangaroo’, it was strong supportfor an environmental interpretation of the sequence. A change in the Aboriginal burningregime seems an unsatisfactory explanation because of the small distances between DeepCreek, Mussel and Loggers shelters (<5km) and because of the implications that the burningwas restricted to the vicinity of shelters which show a decrease in the accumulation rates forboth artefact and faunal assemblages at this time (Attenbrow 1982a: 42–4).
An environmental interpretation for the change in the faunal assemblages accords withthe evidence for a generalised widespread climatic change in the later Holocene from very dryconditions to the moister present-day regime. However, the date for the faunal change in Musseland Deep Creek (ca 1200–1000 BP) is much later than that indicated by the localpalaeoenvironmental records (ca 2000 BP). The reason for this difference is not known. It ispossible that the pollen records, which are from swamp contexts, may not reflect exactly thechanges that were occurring in the surrounding forests or higher up in the river catchment (e.g.,Kodela and Dodson 1988: 324). Further excavated faunal sequences as well as more detailedpalaeoenvironmental records from within or near the catchment are needed to establish thenature of the vegetation changes that occurred during this period. Until such data are available, itis not possible to say unequivocally that the excavated faunal sequence is a consequence ofenvironmental changes or changing fire regimes, or whether it represents a change in the animalspecies people preferred to hunt and eat, which occurred for purely social reasons.
Climatic and environmental change in Eastern Australia during the late Pleistocene and Holocene
terra australis 21
209

What’s changing: population size or land-use patterns? The archaeology of Upper Mangrove Creek, Sydney Basin
terra australis 21
210
Changes in sea-level
The eastern boundary of the Upper Mangrove Creek catchment is presently ~33km from theocean coastline (in the closest direct line), and, to the western shores of Tuggerah Lake andLake Macquarie, it is ~25km and ~28km respectively. The catchment’s southern boundary ispresently ~18km from estuarine conditions in the lower reaches of Mangrove Creek, and~28km from the Hawkesbury River.
Although the entire catchment is within the freshwater reaches of Mangrove Creek,its use and occupation would have been affected by physical changes to the adjacent countrybrought about by the rising sea-level associated with late-Pleistocene and Holocene climaticevents. Rising sea-level affected NSW coastal regions in two main ways: by reducing the areaof dry land, and altering the configuration of the coastline. The reduction in landmass andwestward movement of the coastline in turn affected the degree of continentality experiencedby the coastal hinterland. Even after the sea-level stabilised ca 6500 BP, the coastline did notremain a stable environment.
Changes to countryDuring the Last Glacial Maximum, between 25,000 BP and 15,000 BP, when the sea wasbetween 110m and 130m below its present level (Ferland and Roy 1994: 184–5; Roy 1998: 368),the coastline at Broken Bay would have been between 20km and 25km further east and theHawkesbury River and its present estuary would have been freshwater (Roy and Thom 1981:Figs 5 and 6; Roy 1983: Fig. 4A). As the sea-level rose during the period ca 18,000–17,000 BP toca 6500 BP, the catchment itself was not directly impacted by the changes in sea-level, but landbetween the former (LGM) and current coastline was gradually inundated. At the same time,estuarine conditions gradually extended into the Hawkesbury River valley, with its mouthbecoming and remaining marine-dominated. The Hawkesbury River is the largest drownedriver estuary on the NSW coast.
The rise in sea-level was not constant: the sea rose rapidly until about 8000 BP (ca1m/century), but then slowed down to about half that rate between 8000 BP and 6500 BP (Roy1998: 368). By ca 10,000 BP, it had fallen to –35m; by ca 9000 BP to between –15m and –20m;and, by ca 7000 BP, to between –4m and –6m (Chappell 1983: 121; Chappell and Grindrod1983d: 87; Roy 1994: 255, 1998: 368). Although it reached its present level and stabilised ca 6500BP, the sea had reached the base of the cliffs which form the present coastline about10,000–9000 BP (Roy 1994: 241). When Loggers Shelter was first inhabited, about 11,000 BP, thesea-level was still rising and the shoreline was about 4km to 8km east of the present coastline.To the south, the ocean waters were already extending into the lower sections of theHawkesbury River palaeo-valley.
On its south-eastern margin, the continental shelf is steeper and narrower than inother parts of Australia and the loss of land along the NSW coastline was not as extensive as itwas along the continent’s northern or southern coastlines. The rising sea drowned the rivervalleys along the NSW coast forming ‘rias’ such as the Broken Bay–Hawkesbury River andSydney Harbour (Port Jackson) systems. The present NSW coast is essentially a drownedembayed coast where prior bedrock valleys are partially infilled by sandy barriers, tidal flats,lagoons (often called lakes) and deltaic plains (Roy 1984: 99–100, 1994; Roy and Thom 1981:471). The drowning of these river valleys substantially increased the length of shore withestuarine conditions, and extended the availability of estuarine resources further into thecoastal hinterland. By 6500 BP, estuarine conditions extended ~29km up the HawkesburyRiver and into the lower reaches of Mangrove Creek; and brackish conditions reachedupstream some 50km inland (as far as Windsor).

terra australis 21
211
Although sea-level is usually described as having stabilised ca 6500 years ago, thereis evidence that between 4100 BP and 3200 BP the sea-level along the NSW coast was at least1m, and possibly 2m above the present level due to hydrostatic readjustments (e.g., Chappell1983: 122; Flood and Frankel 1989; Baker and Haworth 1997, 1999, 2000a, 2000b; Roy 1998: 368,371). Evidence for higher sea-levels in this period comes from Valla Beach on the NSW northcoast (Flood and Frankel 1989) as well as Port Jackson (Sydney Harbour) and Port Hacking(Baker and Haworth 1997, 1999, 2000a, 2000b).
Changes to the southern Australian shoreline after ca 8500 BP have been described asminor compared with those in the period between 15,000 BP and 10,000 BP, and, after ca 6500BP, to be negligible except for local progradation in some areas (Chappell and Grindrod 1983d:87) or to be related to gains or losses to the coastal sediment budget (Chapman et al. 1982: 42).However, locally, along the NSW central coast, mid- and late-Holocene changes weresomewhat greater and more diverse than these statements imply. They included the formationand/or modification of rock platforms, the building of coastal barriers, the infilling ofestuaries, as well as the formation of lagoons when barriers developed across the mouths ofdrowned valleys (Langford-Smith and Thom 1969; Roy 1984, 1994). The coastline east of theUpper Mangrove Creek catchment includes large barrier estuaries such as Lake Macquarie,Tuggerah and Munmorah Lakes, and Brisbane Waters (Roy 1994: 247). Lake Macquarie, one ofthe deepest barrier estuaries in NSW, began to form as the sea-level was rising and was ca 5mdeep about 8000 BP (Roy 1994: 250–1, 255, Fig. 8).
Coastal productivity and resource availabilityIn presenting their case for population increase (see Chapter 2), Lampert and Hughes (1974: 228)stated that when the sea-level was rising before ca 7000 BP, any barrier systems that existed on theinner continental shelf would have been less well developed and would have held back smallerbodies of water than those of more recent times; there were probably fewer lagoons and they mayeven have been ephemeral. There were also fewer rock platforms at that time than in the laterperiod of stable sea-level, and the inter-tidal/near-tidal zone was therefore narrower. Thus, theysaid, within the period of human occupation, inter-tidal rock platforms and coastal lagoons ofreasonable size seem to have been restricted to periods of stable sea-level and perhaps the periodjust before the sea began its most recent transgression, that is, during the last 7000 or 5000 years.Lampert and Hughes concluded that coastal resources would have been less accessible during theinitial period of rising sea-level, but marine resources, particularly molluscs, would have becomemore abundant in the late-Holocene as a result of coastal developments.
Callaghan (1980: 47) posited that it took 2000 years, between ca 6000 BP and ca 4000BP, for the marine coastal ecology to stabilise and become favourable for fishing andshellfishing. He based his proposition on basal radiocarbon dates for mid-north coast middenscontaining some molluscan remains, which cluster ca 4000 BP, and a similar date for a drasticincrease in deposition rates in shell middens at Bass Point and Burrill Lake. White andO’Connell (1982: 99) argued that when south-eastern Australian littoral environments wereless extensive, shellfish would have been significantly less numerous than they are today, andwere thus unlikely to have been as important to coastal populations of 6000 years ago as theywere later. Extensive progradation is also said to have changed the nature of subsistenceresources over time in Princess Charlotte Bay in north-eastern Australia (Chappell 1982: 75),where Beaton (1985: 13) argued that the ‘food base offered during the transgressive intertidalperiod’ was much less productive in terms of numbers of individuals of all shellfish speciesthan in the late-Holocene.
The probability that the late-Holocene shoreline was more productive than shorelinesof earlier periods has been substantiated by geological investigations on the continental shelf
Climatic and environmental change in Eastern Australia during the late Pleistocene and Holocene
What’s changing: population size or land-use patterns? The archaeology of Upper Mangrove Creek, Sydney Basin
terra australis 21
212
(e.g., Roy 1984, 1994, 1998, pers.comm. 1986; Pye and Bowman 1984). Present-day rock platformsare the product of long periods of erosion during highstands of the sea and are compositefeatures formed over hundreds and thousands of years, but there were no equivalents to themat the time of the lowest Last Glacial sea-level. The inner continental shelf has bedrock reefsand rocky headlands that extend to depths of 50m to 70m below present sea-level, but belowthis the inner and outer shelf consists of sediment with few outcrops. At the height of the LastGlacial Period, the coastline was a relatively unbroken sandy beach without the currentconfiguration of headlands, cliffs, beaches, lagoons and deep invasive estuaries and rockplatforms. Estuaries in the palaeo-valleys extending across the continental shelf would havebeen much smaller than today and, combined with the less extensive rock platforms, therewould have been correspondingly less abundant fish and shellfish resources. Transgressivebarrier estuaries and lagoons did exist throughout the marine transgression, but initially thecoastal lagoons would have been small with low productivity. They would have attained theirmaximum size only towards the end of the transgression and at the beginning of the stillstandperiod (ca 7000–5000 BP). During stillstand, they have been progressively decreasing in size asthey infill with sediment (Roy 1984: 115, Fig. 5; 1994).
With regard to the effects of progradation on the NSW central and south coast, theShoalhaven and the Hunter Rivers are the only large rivers in areas of subdued coastaltopography where relatively extensive estuarine sedimentation has occurred (Roy 1994, 1998;Roy and Thom 1981). Many other smaller areas of infill have occurred in both embayments andestuaries, such as Brisbane Waters and in Lake Macquarie. The degree and effects ofprogradation vary from estuary to estuary depending on their stage of infilling (Roy 1984); and,in large, deep and steep-sided estuaries such as the Broken Bay–Hawkesbury River system, itwould not have been as great as in the smaller barrier estuaries. Roy (1984: 117–18) states thatpopulation densities of marine fauna would be highest in estuaries in youthful stages, and thatin mature estuaries, estuarine plant and animals experience a general decline in distribution,population numbers and species diversity. In contrast with other parts of the coastline,maximum estuarine productivity was probably reached about 7000 to 5000 years ago.
Coastline modifications associated with the rising sea-level over the last 11,000 yearsaffected the availability of land and subsistence resources on the NSW central coast, thoughthe exact nature and magnitude of the variations in resource abundance are still largelyunknown.
The effect of sea-level change on occupation of the Upper Mangrove Creek catchment
The landThe area of land lost from the coastal plain (i.e., land which now forms part of the continentalshelf) as the sea-level rose between ca 11,000 BP and ca 6500 BP was not as great as that lost inthe previous 7000 or so years (i.e., between 4km or 8km compared with 16km or 17km). Peoplewould have moved from the lands being inundated, but the area lost after 11,000 BP wasprobably insufficient to influence in any major way the distribution of people within a regionwhich would have included the catchment. The loss of land between 18,000 BP and 11,000 BPis more likely to have affected population distributions.
The Hawkesbury River valley experienced changes of a different and more dramaticnature than those of the continental shelf. Drowning of the Hawkesbury palaeo-valley startedwhen the sea-level was at –50m between 12,000 and 11,000 BP. The long, narrow valleybottoms were flooded rapidly up to about Wisemans Ferry. The flooded valley reached itsmaximum size about 9000 BP or 8000 BP, after which shoaling and infilling began as riversediments were deposited in standing water bodies and point bars began forming.

The formation of Broken Bay and the presence of a broader and deeper HawkesburyRiver had several implications. The land lost through inundation may have included alluvialterraces forming river banks (Langford-Smith and Thom 1969: 578), which may have been usedas access routes for movement along the river as well as habitation locations. It is more likely,however, that the Hawkesbury River excavated its valley fill during the sea-level lowstand, andfew terraces were left when the sea-level started to rise (P. Roy, pers. comm., 1986). The river mayalso have formed a greater barrier to movement between areas north and south of the river thanpreviously existed, or alternatively, provided an easier mode of crossing the valley — that is,crossing by boat as opposed to having to walk up and down the sides of a deep valley.
Loss of the broad river terraces, if present, may have affected subsistence strategiesand the movement of people for other activities, and the presence of the broad river may haveaffected relationships between local groups of people north and south of the river. Noarchaeological evidence for either of these possibilities is apparent in the data retrieved to datefrom the Upper Mangrove Creek catchment.
Availability of resourcesEnvironmental changes associated with the rising sea-level would have affected thedistribution and abundance of resources available for people who utilised the catchment inseveral ways. The land lost due to the sea-level rise meant loss of terrestrial resources, that is,animals and plant foods in the coastal zone. However, in hinterland areas such as thecatchment, rainfall/evaporation improved due to decreased continentality and this is likely tohave increased water availability and possibly productivity of the timbered lands. In addition,the increased length of estuarine shoreline produced a greater abundance of marine resources.The rise in sea-level also brought abundant marine resources (both ocean and estuarine) muchcloser to the Upper Mangrove Creek catchment.
These changes in the location, morphology and productivity of the ocean shorelineand estuarine reaches of the Hawkesbury River, lower Mangrove Creek and Brisbane Watersmust have influenced the subsistence movements of those people using the catchment. Thenature of the effects would have depended on the distribution of local groups (clans andlanguage groups), their subsistence ranges and the ‘territorial’ boundaries within which theyoperated. If, in any period, the range of the group/s that inhabited the catchment extended tothe coast and/or Hawkesbury River, then changes in the productivity of the ocean andestuary shorelines may have contributed (wholly or partially) to the changing site and artefactdistribution patterns in the catchment.
If decreasing continentality in areas such as the Upper Mangrove Creek catchmentincreased productivity of the forests as well as water availability, it may have encouragedpeople to extend into or increase their use of these hinterlands by the end of the Pleistoceneperiod. Redistribution of marine resources, both before and after stabilisation of the sea-level,may have influenced local and regional subsistence patterns in the hinterland, including thecatchment, as well as along the coastline itself. There is no direct archaeological evidence toindicate that life in the catchment after 11,000 BP was affected by environmental changesassociated with the rise in sea-level in a way that would have altered the distribution ofhabitations, the habitation establishment rate, the number of habitations used or the artefactaccumulation rates. However, general correspondence between the earliest date for acatchment habitation and the time when the Hawkesbury River palaeo-valley began to beflooded (ca 12,000 BP to 11,000 BP) suggests there may be an association between initialoccupation of the catchment (or at least a level of occupation that is now archaeologicallyvisible) and sea-level rise at this time. People would have been moving westward frominundated coastal lands and also northwards from the inundated Hawkesbury Valley.
Climatic and environmental change in Eastern Australia during the late Pleistocene and Holocene
terra australis 21
213

Conclusions: correlations between climate and environmental changesand catchment trends in habitation and artefact indices
The earliest evidence for occupation in the Upper Mangrove Creek catchment dates to theterminal Pleistocene, ca 11,200 BP, when conditions were warming up after the glacialconditions of the Last Glacial Maximum and rainfall-evaporation ratios were improving ascontinentality decreased due to the rising sea-level (Fig. 9.1). The initial or increased level ofoccupation in the Upper Mangrove Creek catchment just over 11,000 years ago could reflectthe last stages of the westward movement of people as the sea-level rose and coastal landswere inundated, combined with their movement into hinterland areas where resourceproductivity and water availability increased due to decreasing continentality.
As the climate became even warmer and wetter in the early Holocene (reaching apeak sometime between ca 8000 BP and ca 5000 BP, when conditions were warmer and wetterthan today), the habitation establishment rate and the number of habitations used increasedslowly. An increase in habitation establishment rates is evident in the seventh millennium BP.Early-Holocene trends in the artefact accumulation rates differed slightly to those for both theestablishment and use of habitations. They remained low until the fourth millennium BP,apart from a small peak in the 10th and ninth millennia BP, that is, just before the climatebecame warmer and wetter than today.
Although the climate began to get cooler and drier ca 5000-4500 years ago, it was notuntil the fourth millennium BP that there was a small increase in the habitation establishmentrate; however, the trend in the number of habitations used and the artefact accumulation ratedid not change, but continued to increase gradually.
In the last 3000 years, there is not a clear correlation between the timing of theclimatic changes and the times at which dramatic changes occurred in the habitation andartefact indices. In the third millennium BP, when the climate became much cooler and drierand more variable than it had been over the previous 7000 years, the local artefact accumulationrate increased dramatically, but the habitation indices continued increasing gradually asbefore. It was not until later, in the second millenium BP, that there was a dramatic increase inthe habitation establishment rate and the number of habitations used. By that time, the climatewas still colder and drier than today but average temperatures and rainfall had begun toincrease. In contrast with the habitation indices, the local artefact accumulation rate did notincrease — it decreased slightly, and remained almost as high as in the second millennium BP.During the first millennium BP, when the climate became yet warmer and wetter until thepresent climatic regime prevailed, the rate at which habitations were established increasedmarkedly and the number of habitations used rose substantially again, with an increase asgreat as that in the second millennium BP. In strong contrast with the habitation indices, theartefact accumulation rate dropped substantially, though the rate was still much higher thanthose before the third millennium BP.
Lack of correlation in the timing and direction of the trends in the catchment’shabitation and artefact indices over the last 3000 years could be interpreted as there being nocausal relationship between climatic events and the human behaviour which produced thequantitative changes in the archaeological record, but this need not necessarily be the case.The documented trends in habitation and artefact indices in other areas of eastern Australiaalso indicate much variability. They suggest that dramatic changes in the habitation andartefact indices occurred principally within the latter half of the Holocene, but were notnecessarily restricted to that period. A similar pattern is seen in the growth rates for each of theindices indicating that the presently documented dramatic increases are not solely the resultof exponential increase. Again, such regional variation could suggest that changes in the
What’s changing: population size or land-use patterns? The archaeology of Upper Mangrove Creek, Sydney Basin
terra australis 21
214

Climatic and environmental change in Eastern Australia during the late Pleistocene and Holocene
terra australis 21
215
archaeological record and the climatic changes were unrelated. However, the extent to whichthe subsistence resource base was affected would have varied from region to regiondepending on local factors — in some areas, climatic changes may have been beneficial, but inothers detrimental. In addition, the timing of the onset and duration of changedenvironmental conditions in response to a particular climatic variation was not uniform acrossthe continent. Thus, because of variations in the range of options available to each group, thecultural changes that occurred were unlikely to be uniform in all regions (cf. Allen 1996: 201).
Environments with limited water supplies, or an excess of water, were probably affectedmore markedly and earlier than richer environments and thus the subsistence strategies ofpeople occupying these areas are likely to have been affected at an earlier date than those ofpeople in other types of environments. In some areas, the change may have promoted movementinto previously unoccupied environments or the use of specific resources within the sameenvironment, or prompted changes in exploitation strategies which involved changes in thedegree of mobility or the types of material technology used. Regional variation will haveoccurred because of specific local conditions: geographical, social, technological and the historyof events that occurred in the past. For these reasons, the timing and direction of changes inhabitation and artefact indices are unlikely to be uniform in all regions.
Even though the exact nature of the impact of climatic changes on resources is oftenuncertain (cf. Veth et al. 2000: 60, 62), it is generally agreed that variations in the abundanceand distribution of subsistence resources occurred at times of climate and environmentalchange. Warmer–wetter conditions are often referred to as ‘optimal’, and a change towarmer–wetter conditions as ‘ameliorating’, whereas a change to colder–drier conditions isseen as ‘deteriorating’ (e.g., several contributors to Chappell and Grindrod 1983a; Kershaw1984: 69). Many archaeologists appear to accept or assume that periods of colder–drierconditions had less abundant resources and were more stressful, and that the number ofpeople inhabiting a particular area or region was related to the level of resources available(e.g., Lampert and Hughes 1974: 231; Pearson 1981: 57–8; Ross 1981, 1984). Lourandos, forexample, says: ‘If there is a close relationship between population and environment, thendeclining populations could be expected as conditions became drier and more stressful’(1985b: 38), and, ‘the early-Holocene was generally more humid than the late-Holocene which,being drier, was a more stressful period’ (1997: 311). However, in some regions, thecolder–drier period may not have had fewer subsistence resources than the warmer–wetterperiods, and may not have had a lower human population. The consequences of climaticchanges may have been beneficial in some areas but detrimental in others (White andO’Connell 1982: 99; Rowland 1983: 63; Head 1986: 124, 1987: 457; Bird and Frankel 1991a: 10).Similarly, the effect of sea-level changes will not have been the same in all parts of thecontinent (Chappell 1982: 70, 78). Although some information is available for the UpperMangrove Creek catchment, there are still many unknowns, for example: 1. what was the nature of changes in vegetation and faunal distribution patterns at a
regional level — did the faunal changes documented in the catchment occur elsewhereand at the same time?
2. how did overall resource availability and/or productivity change with the climaticchanges?
3. was resource productivity greater in the recent warmer–wetter period than in thepreceding cooler–drier period; that is, was the change advantageous or detrimentalto the region’s inhabitants?More detailed studies are needed, but in the meantime, ways of interpreting and
explaining the catchment’s archaeological record, and of exploring possible influences of theregional climatic and environmental changes on habitation, subsistence and land-use patterns,are addressed in the following chapter.


terra australis 21
217
Many cultural and natural processes have been proposed as explanations for the type ofquantitative changes that have been documented in the habitation and artefact indices of theUpper Mangrove Creek catchment. In interpreting the catchment’s long-term trends, generalbroad-scale demographic changes that affected the whole continent since initial colonisationcannot be discounted as having played a role. However, the catchment’s population trendsmay not have followed continent-wide trends, which have long been debated (Birdsell 1953,1957, 1977; Beaton 1983, 1985, 1990; Lourandos 1985b; Rowland 1989; Davidson 1990). Aninteresting aspect of the catchment data set is that trends in the habitation and artefact indicesvaried, with the dramatic changes in each index occurring in different millennia and thedirection of the changes differing from each other in the last 1000 years (Fig. 9.1). In the firstmillennium BP, habitation indices continued to increase while the local artefact accumulationrate decreased substantially. Therefore, if it is accepted that increasing numbers of artefactsindicate increasing population size, then the decreased numbers of artefacts in the firstmillennium BP could mean there were fewer people inhabiting the catchment at that time.
Inter- or intra-regional shifts in population in different periods of time also cannot bediscounted as having brought about changes in the catchment’s habitation and artefactindices. These movements entail people shifting the focus of their lives and daily activitiesfrom one environmental or geographic zone to another on a long-term basis. For example,they can take place through changes in seasonal subsistence patterns, changes interritorial/range/domain boundaries, or redistribution of populations in response to long-term global environmental changes. These regional-scale options cannot be investigated forthe catchment yet, as appropriate levels of archaeological information are not available inadjacent areas and regions. The presence of estuarine shell (Anadara trapezia, Sydney cockle) inthe upper levels of some of the catchment shelters indicates contact between the coast and/orestuary and the catchment, at least in the recent past, but not necessarily seasonal movements.Regional ethnohistorical descriptions refer to people travelling into the ‘mountains’ from LakeMacquarie ca 30km away on the adjacent coast for trading purposes (Threlkeld 1826 inGunson 1974, Vol. 2: 206), but make no mention of seasonal movements. The ‘mountains’
From numbers of sites and artefactsto habitation, subsistence and land-usepatterns
10

referred to were probably the sandstone plateaux of the coastal hinterland and not the GreatDividing Range, but whether this would have included the catchment is not known. Similarly,in the Sydney region to the south, early colonial descriptions of Aboriginal life provide noevidence for seasonal movements (Attenbrow 2002: 53). However, that is not to say thatseasonal movements between coast and hinterland could not have occurred in the past. In theterminal Pleistocene and early Holocene for instance, when the coastline was further tothe east and more land was available, territories may have been larger and movementsperhaps less restricted than in, say, the last 6000 years. However, no archaeological evidence for seasonal movements has been identified in the catchment or elsewhere on the NSW central coast.
Late-Holocene changes in habitation distribution patterns and the way subsistenceactivities were organised within the catchment, which may have included variations inmobility patterns, are also likely reasons for changes in both the numbers of habitations andthe numbers of artefacts within individual habitations and the catchment as a whole. Thisproposition is examined below with some of the data available for the catchment.
Variations in the ‘intensity of site use’, which refers to changes in the number ofperson-days spent at a habitation, through either variation in the number of people, thenumber of visits or the length of each visit, may also have occurred. Nevertheless, there areother reasons which could account for increasing or decreasing artefact accumulation rates inindividual habitations and these need to be addressed before change in ‘intensity ofsite/catchment use’ is accepted as an explanation. They cannot be fully addressed, however,until other analyses of the excavated assemblages (some of which are discussed below) arecompleted.
Dramatic changes in the artefact accumulation rates in the catchment, as in other regionsin eastern Australia, were not correlated in time with either the introduction of new implementtypes or changes in technology or raw materials, all of which were part of geographicallywidespread, long-term changes in the stone artefact assemblages (Chapters 2, 6, 7 and 8). Thereasons for such changes in the stone artefact assemblages are still subject to research and debate.Suggested explanations include changes in the availability of and access to stone materialsbecause of variations in group boundaries and relationships due to social and territorialreorganisation, and/or changes in the nature and level of subsistence risk as a consequence ofvariations in plant and animal resource availability associated with climatic and environmentalchanges. Possible causes of subsistence risk, and risk minimisation strategies which may haveproduced increases and decreases in the artefact accumulation rates, are explored below.
Changing trends in both the habitation and artefact indices reflect the way peoplelived within only one part of their country: the Upper Mangrove Creek catchment. Thecatchment (which is only 12km by 10km) would have been only part of a clan territory and partof the range of a band or bands who, at contact, belonged to a language group now known asthe Darginung. In 1788 (at the time of British colonisation), and for an unknown timebeforehand, the Darginung (and their predecessors) would have belonged to a yet larger‘culture-area’ (cf. Lampert 1971a: 70) which was east of the Great Dividing Range and extendedfrom Port Macquarie in the north to the NSW/Victorian border in the south (Fraser 1892: ix,map, 1892 [1893]: 32, map, Appendix X: 92; Eades 1976; Attenbrow 2002: 33) (a smaller areathan the south-eastern culture area of Peterson [1976: Fig. 8]). Trends in the catchment’shabitation and artefact indices thus cannot be interpreted without reference to what peoplemay have been doing in other parts of their country or their neighbours’ country, which lay oneach side of the catchment.
In south-eastern Australia, the appearance of new implement types and changes intechnology and raw materials (Chapters 2, 7 and 8) were part of a sequence of stone artefact
What’s changing: population size or land-use patterns? The archaeology of Upper Mangrove Creek, Sydney Basin
terra australis 21
218

terra australis 21
219
assemblages which McCarthy (1964a, 1964b: 201–2, 1976: 96–8) called the Eastern RegionalSequence, and which is presently under review (Hiscock and Attenbrow in press). There areregional and sometimes local variations in the assemblages of each phase and the phasesappear to have begun at slightly different times in different regions. Such regional differenceswere possibly due to variations in local environmental conditions and the way each regionresponded to climatic change as well as to regional variations in social organisation,territoriality and subsistence patterns due to historical precedents (Attenbrow 1987: 365–8). Inaddition, and for the same reasons, there would also have been variations in thehabitation–subsistence organisation of each region or locality. These broad-scale behaviouralchanges, which are reflected in the stone artefact assemblages across the culture-area, wouldhave been a ‘background’ to habitation and subsistence strategies used in the catchment. Thecatchment’s habitation and subsistence strategies would have been related to its specificenvironmental characteristics and the role they played in its inhabitants’ lives.
In earlier chapters, it has been shown that several explanations for dramatic changesin habitation and artefact indices do not apply to the catchment. For example, the impact ofgeomorphological processes (e.g., burial, erosion and deflation) on habitation distributionpatterns in the catchment were found to be an unlikely source of bias in the observed trends inrockshelter sites, though they may have skewed the recording of open archaeological deposits(Chapter 5). Greater visibility of habitation sites due to an increase in the number of stoneartefacts manufactured per person is also unlikely given the fact that the local artefactaccumulation rate, as well as the rate in many individual habitations, decreased during theperiod when substantial increases occur in the habitation indices. Some explanations cannotbe investigated without further fieldwork, for example, intra-site changes in the location ofdiscard. Comparison of sequences in individual 50 × 50cm pits within the same rocksheltersuggests this is an unlikely reason, particularly given the relatively small size of manycatchment rockshelters.
The following discussions therefore focus on behavioural explanations and processesthat are likely to have affected the catchment’s archaeological record. Interpretations of thedramatic increase in the habitation indices revolve around habitation patterns and subsistenceorganisation, while those for the artefact accumulation rates centre on subsistence methodsand equipment. They include the concepts of mobility and risk, which were highlightedearlier as potentially fruitful avenues to explore the dramatic changes in the catchment’shabitation and artefact indices (Attenbrow 1982b: 76–7; 1987: 368–77, 384).
Habitation patterns and subsistence organisation
In earlier chapters, the habitations have all been treated as functionally equal, although it wasforeshadowed in Chapter 3 (defining Archaeological Deposits) that they may not all have beenused for the same activities. Their likely function is thus explored as a start to investigating thehabitation and mobility patterns and subsistence organisation that operated within thecatchment.
Base camps, transit camps and activity locationsBinford’s (1978, 1980, 1982, 1983) ethnographically based forager–collector model has beenimportant in identifying past habitation, subsistence and land-use patterns fromarchaeological site distribution patterns. In Binford’s model, the principal contexts for discardor abandonment of artefactual remains, and thus places which can be identifiedarchaeologically, were ‘residential (home) bases’ and ‘locations’. Binford (1980: 9) defined
From numbers of sites and artefacts to habitation, subsistence and land-use patterns

What’s changing: population size or land-use patterns? The archaeology of Upper Mangrove Creek, Sydney Basin
terra australis 21
220
residential bases as ‘the hub of subsistence activities, the locus out of which foraging partiesoriginate and where most processing, manufacturing, and maintenance activities take place’.Locations, also referred to as ‘functionally specific sites’, were defined as
… a place where extractive tasks are exclusively carried out … only limited quantities [of foodand raw materials] are procured there during any one episode, and therefore the site isoccupied for only a very short period of time … abandonment of tools is at a very low rate. Infact, few if any tools may be expected to remain at such a site. A good example of a locationgenerated by foragers, a wood-procurement site … (Binford 1980: 9–10)
Binford (1980: 10) defined three other places associated with the ‘collector end’ of theforager–collector continuum: ‘field camp’ (overnight camps while away from the residentialbase), ‘station’ (e.g., ambush locations or hunting stands) and ‘cache’. In his model, these latterplaces were associated with collectors who were characterised by storing food for at least partof the year and who logistically organised procurement parties. Such locations were usedrarely by foragers, who typically did not store food but obtained it daily, ranging out on an‘encounter’ basis before returning to their home base each afternoon or evening (p. 5); theystayed only occasionally in overnight camps when hunting (p. 7–8).
Binford’s model was based on ethnographic studies of the Nunamiut Eskimo ofAlaska, the Gwi San and Dobe !Kung of the Kalahari Desert, as well as equatorial groups(Binford 1978). Other researchers, however, based on their own ethnographic observations inother countries, included a much wider range of places as ‘activity locations’ within foragersubsistence strategies; for example: hunting hides, viewing/lookout points, artefactpreparation locations, manufacturing localities, tree-felling areas, waterholes, ceremoniallocales, burial areas, shade areas, as well as areas associated with food procurement (e.g., killand butchery sites, and plant gathering areas), firewood and raw material sources (Foley1981b: 164, 1981c: 11, 107, Table 2.1; Bettinger 1991: 66; Veth 1993: 83, 90). In northern Australia,in addition to base camps used by the present-day Anbarra, Meehan (1988: 179–80) describedovernight (transit) camps, and places which she referred to as ‘dinner-time camps’. At some‘dinner-time camps’, shellfish were processed and the meat was taken back to the base to eat.
Characteristics that have been said to identify base camps or distinguish them fromactivity locations in archaeological contexts include size (area in square metres) as well as thediversity, richness and nature of artefact types and faunal remains. Binford (1982: 15)proposed that base camps would have the most complex mix of archeological remains sincethey were commonly used logistically when residential camps were elsewhere. Meehan (1988:179–80) observed that base camps have a much larger area and much wider range of foodspecies, and, since parts of some animals would be eaten at dinner-time camps, home basesmay not have the remains of whole animals. Nelson (1991: 79–81, 85) said locations identifiedarchaeologically as base camps have a greater diversity and richness of artefacts representinga greater range of activities undertaken on site and in the immediate area, in contrast withactivity locations that have low diversity of artefact types used for a few specific and focusedactivities. She cautioned, however, that the nature of the stone artefact assemblages andclasses of artefacts representing reduction strategies at base camps would depend on thetechnological system operating at the time. Evidence of storage was another characteristic shesaid distinguished base camps from activity locations (Nelson 1991: 82).
For the Upper Mangrove Creek catchment, there are no historical or ethnographicdescriptions of subsistence strategies or land-use practices for the early colonial period.Historical sources for adjacent areas suggest that groups moved frequently and thoseinhabiting the hinterland of the NSW central coast would have employed strategies closer

to those of foragers rather than collectors (e.g., Threlkeld 1825–26, 1826; see also Brayshaw1986; Vinnicombe 1980; Attenbrow 2002). On this basis, it is proposed that the catchment’sinhabitants were relatively mobile hunter-gatherers who moved between many short-termbase camps within their country, with group size varying according to weather, season andlocality. While in the catchment, family groups stayed at base camps for several nightsundertaking a range of domestic tasks, members going out daily to obtain food and rawmaterials. Tasks undertaken at activity locations away from base camps may have included:(a) hunting, butchering, fishing (including eels) and shellfishing (freshwater mussel), plantand honey collecting; (b) procuring raw materials, such as stone, wood, plant fibre andresin; and, (c) religious or ritual responsibilities. During these daily forays, to places insideor outside the catchment, damaged tools and implements would have been mended, andfood prepared and/or eaten at locations away from the base camp. People also may have sought protection in rockshelters during the day from the extreme heat of summer, thefrosts and cold winds of winter, and the rain at any time of the year. Individuals or smallgroups would have made occasional longer trips for subsistence, trade or social purposes toplaces which necessitated the use of overnight/transit camps away from their base camps.Large gatherings for ceremonial purposes probably occurred at locations outside thecatchment.
Within the catchment, in addition to the numerous archaeological deposits(habitations), there are also many sites with images (mostly pigment drawings in shelters) andgrinding grooves (and a scarred tree outside the random sampling units). Together, this suiteof archaeological sites demonstrates that many of the activities described above were carriedout. Overnight camping and a range of domestic tasks were undertaken at habitations. Thegrinding grooves indicate that the shaping and sharpening of ground-edged implementsoccurred, and the pigment and engraved images were likely created in association with bothreligious and secular activities. Although there is no outcropping bedrock in the catchmentfrom which stone artefacts can be made, pebbles and cobbles eroded from the Hawkesburysandstone and conglomerate beds in the Narrabeen sandstones are available on the ridgesidesand in creek beds (Chapter 3). Some catchment habitations may have been used as transitcamps by people travelling from one locality to another on ceremonial business or to procureraw materials by direct access or trade — for example, along the historically documentedroute between the Hunter Valley and Brisbane Waters via the Wollombi Valley and the ridgeforming the catchment’s eastern boundary, which also linked with other routes extendingwest as far as Mudgee–Rylstone (McCarthy 1936: 2–3, 1939a: 1, 1939b: 407, 1939c: 100).
Identifying base camps, activity locations/transit campsAlthough I address only the habitation indices in this section, it is not realistically possible toaddress the habitation indices by themselves. As mentioned above, the number of artefacts ineach habitation varied widely, and the small size of the assemblages in some (even whenextrapolated to estimated total numbers) suggests all were not base camps. Even the six long-term habitations (i.e., those used for more than 3000 years) with the most abundant and richestassemblages were unlikely to have been only base camps throughout their history of use.Their earliest use may have been as activity locations or transit camps (cf. Morwood andL’Oste-Brown 1995: 161).
Stone artefact analyses appropriate to investigating whether ‘habitations’ are basecamps, transit camps or activity locations, and whether their function varied over time, havenot been undertaken (see below). Therefore, to explore this idea further, I used thebreakdown into ‘millennial assemblages’ for individual habitations, which was used incalculating the local artefact accumulation rates (Table 6.13, Appendix 2). These figures
terra australis 21
221
From numbers of sites and artefacts to habitation, subsistence and land-use patterns

What’s changing: population size or land-use patterns? The archaeology of Upper Mangrove Creek, Sydney Basin
terra australis 21
222
represent the estimated total number of artefacts that accumulated in a habitation site ineach millennium. To devise a model based on assemblage size which can be tested laterthrough the archaeological assemblages, a K-means cluster analysis was employed as itprovides a good approximation of the number of divisions into which a population can besplit (Orton 1980: 52–3; Wright 1992). This analysis indicated that the millennial assemblagescould be grouped into either four or seven clusters (Table 10.1). In both series, there are largegaps between the clusters at the higher end of the figures, but at the lower end, there is noobvious break between ‘small’ and ‘large’ assemblages. There is thus no clear indication ofwhat can be assigned as activity locations/transit camps or base camps, assuming theformer would have a small number of artefacts discarded at them whereas the latter wouldhave had much larger assemblages incorporating debitage from stone implementmanufacture. So, for the purpose of model-building, the lowest group in the cluster of seven(0–2350) was taken as activity locations/transit camps, and the other groups as base camps.This assignment on the basis of estimated artefact numbers is still somewhat arbitrary andspeculative. However, when the grouping into four clusters was chosen and assemblages inthe 0–7000 cluster were assigned as activity locations/transit camps, there were no basecamps in the catchment until the third millennium BP, except in Loggers in the 10th andninth millennia BP. While that is a possibility, it seems a less reasonable basis on which todevelop a hypothesis than the one adopted.
Clearly, in testing the proposed habitation and land-use model, one avenue toinvestigate will be whether the ‘habitations’ and/or the millennial assemblages in long-term‘habitations’ in ‘Group 0–2350’ are activity locations or transit camps and whether the othersare base camps. Assemblages resulting from very short-term or infrequently used base campscould overlap in size with frequently used activity locations. Assemblage/artefact attributeschosen for analysis need to be those that will identify whether assemblages were derived fromdomestic activities at base camps (e.g., cooking and eating of meals by family groups, andimplement manufacture), hunting and gathering tasks that would happen in activity locations(e.g., minor maintenance of hunting equipment and butchery of large animals), or preparationand consumption of food by small groups as would occur in transit camps. Questions toaddress include: what level of diversity exists in tool types and faunal species (bearing inmind the effect of sample size; Attenbrow 1981: 170, 1987: 134–5, 147; Grayson 1984: 116–30;Thomas 1989: 86; Hiscock 2001)? What activities are represented by the assemblages? What douse-wear and residue analyses tell us about tool functions? What reduction stages are
TTaabbllee 1100..11 Upper Mangrove Creek catchment: millennial assemblages grouped according to K-means analysis.
NO. AND SIZE OF CLUSTER MILLENNIAL ASSEMBLAGES SITES
Grouped into 4 clusters
0–7000 63 [3] 30
11,550–25,250 12 6
36,450–66,350 4 4
165,200 1 1
Grouped into 7 clusters
0–2350 52 [3] 28
2650–7000 11 5
11,550–17,200 9 6
23,200–25,250 3 2
36,450–46,300 3 3
66,350 1 1
165,200 1 1
represented in the stone artefacts — stone implement manufacture or only tool maintenance?What particular skeletal parts of animals are present? What other cultural features are present,e.g., hearths or heat-treatment pits? Issues relating to measuring ‘intensity of site use’ could beaddressed by analysing deposition rates for more than one set of evidence; for example, faunalas well as stone artefact assemblages, charcoal and sediments (cf. Smith 1982; Hiscock 1984:134; Morwood 1986). Site location analysis may also identify whether any category isassociated with specific environmental or topographic contexts and habitat/resource zones(Foley 1981a: 4–7).
Using the above basis for assigning assemblages as base camps or activitylocations/transit camps, only one of the seven long-term ‘habitations’ appears to have beena base camp throughout it history of use — Emu Tracks 2, first established in the fourthmillennium BP. The function (or principal function) of the other long-term ‘habitations’changed over time from activity location to base camp. Loggers was used initially as anactivity location in the 12th millennium BP (i.e., <2350 artefacts accumulated in thatmillennium, see Table 6.13), and it was not until the next millennium that a base camp wasestablished there, which was then used for such purposes throughout its history. Threelong-term ‘habitations’ were not used as base camps until the third and another until thesecond millennium BP. In the first millennium BP, only one ‘habitation’ was first used andestablished as a base camp (Mangrove Mansions, though it is its large area that results in ahigh estimate for the total number of artefacts and places it in this category, rather than theexcavated assemblage size), and another used as a base camp in the second millennium BPreverted back to use as an activity location. Of the 22 ‘habitations’ used solely as activitylocations, only one was initially used before 3000 BP — Kangaroo and Echidna. This wasestablished by at least 6700 BP, based on a radiocarbon age for a level 28cm deep.Extrapolation of this date to the base of the cultural deposit at 43cm using a depth/agecurve would place initial establishment about 9800 BP (Table A2/12), but this seemsimprobable and here a maximum age of 7000 BP is assumed.
Most activity locations were first used in the last 2000 years — seven in the secondmillennium BP and 13 in the first millennium BP. Some may have been used only once,whereas others were used on numerous occasions over centuries or millennia. Even onceestablished as a base camp, ‘habitations’ would have been used occasionally or frequently asan activity location on daily forays, or as a transit camp on long-distance trips for trade,ceremonial or other social purposes (cf. Binford 1982: 15; Ebert 1992: 30–1).
Variations in the number of base camps and activity locations in different millennia(Table 10.2, Fig. 10.1) support the proposition that habitation patterns and subsistenceorganisation in the catchment changed over the last 11,000 years, and that change of anunprecedented scale and nature began in the third millennium BP. In this period, a substantialincrease in base camps occurred which contrasts with the lower number of locations usedsolely as activity locations/transit camps. The timing of this change, based on the size ofassemblages within ‘habitations’ was earlier than the dramatic increase in the habitationindices, which was in the second millennium BP (Fig. 9.1). As well as an increase in thenumber of activity locations in the second and first millennia BP, there was also the use oftopographic zones which had not been used (or not often used) before (Table 10.2), thoughgiven the small size of the catchment this should not be interpreted as movement intomarginal environments (Lourandos 1983a: 82; 1985a: 391, 400) or into unfamiliar territory(Hiscock 1994: 277–8, 282).
During the last 4000 years, and perhaps more commonly in the last 2000 years, inaddition to activities that occurred within ‘habitations’, the manufacture and maintenance ofground-edged implements occurred on sandstone where water was available, e.g., in creek-
terra australis 21
223
From numbers of sites and artefacts to habitation, subsistence and land-use patterns

What’s changing: population size or land-use patterns? The archaeology of Upper Mangrove Creek, Sydney Basin
224
lines, adjacent to rock pools and seepage areas on rock platforms, and beneath rockshelterdriplines. Chronological assignment of these activities is based on the presence of groundimplements and ground fragments in stone artefact assemblages dated to the last 4000 years,and increasingly in the last 2000 years, when there is also a greater amount of igneous materialin the assemblages (Table 10.3, Figs 10.2 and 10.3). Most sites with grinding grooves (74%)occur in the upper elevations of the catchment — on Hawkesbury sandstone exposed in creek-lines and on rock platforms principally in the periphery ridgetop zones (Table 4.2, Figs 4.1 and4.2). This grinding groove distribution pattern reinforces the view that activities wereincreasingly dispersed across the catchment in the last few thousand years.
Half the locations with images (principally pigment in rockshelters) are on ridgesidesabove subsidiary creeks; the rest are relatively evenly distributed in each of the other zones,
Figure 10.1 Upper Mangrove Creek catchment: number of base camps and activity locations/transit camps used
in each millennium.
TTaabbllee 1100..22 Upper Mangrove Creek catchment: distribution of base camps (BC) and activity locations/transit camps
(AL/TC) in each topographic zone in each millennium. Numbers in square brackets indicate a location possibly used in that
millennium.
MILL. BP MAIN VALLEY PERIPHERY SUBSIDIARY MAIN SUBSIDIARY PENINSULA RATIO TOTAL
BOTTOMS RIDGETOPS RIDGESIDES RIDGESIDES VALLEY BOTTOMS RIDGETOPS ‘HABITATIONS’
BC AL/TC BC AL/TC BC AL/TC BC AL/TC BC AL/TC BC AL/TC BC:AL/TC
12th 1 0:1 111th 1 1:0 110th 1 [1] 1:[1] 1 +[1]9th 1 1 [1] 1:1+[1] 2 +[1]8th 1 1 [1] 1:1+[1] 2 +[1]7th 1 1 1 1:2 36th 1 1 2 1:3 45th 1 2 2 1:4 54th 1 1 1 2 2 2:5 73rd 2 2 2 1 2 5:4 92nd 2 4 1 5 2 2 7:9 161st 2 1 3 2 1 9 2 1 6 2 7:22 29
terra australis 21

except peninsula ridgetops. Unfortunately, the creation of pigment and engraved imagescannot be incorporated into the chronology. McDonald (1994: 152) assumes pigment imagesare more likely to ‘correspond in age with more intensive occupation’ (i.e., the period duringwhich high artefact accumulation rates are documented) in the shelter in which the imagesoccur. However, I have not assumed such a correlation since (as suggested above) the functionof many shelters may have changed over time (see also Rosenfeld 2002: 76). The only evidencethat indicates an age for pigment images in the catchment is outside the random samplingunits, in a shelter called Dingo and Horned Anthropomorph. In this shelter, red ochre ofsimilar colour to images on the shelter walls was found in excavated contexts dated to ca 580BP and younger (Macintosh 1965: 85, 96–7).
terra australis 21
225
From numbers of sites and artefacts to habitation, subsistence and land-use patterns
Figure 10.2 Upper Mangrove Creek catchment: number and percentage frequency of ground implements and ground
fragments in each millennium.
TTaabbllee 1100..33 Upper Mangrove Creek catchment: number and percentage frequency of backed, ground, igneous, bipolar
and quartz artefacts in each millennium.
MILLENNIUM TOTAL NO. BACKED GROUND IGNEOUS BIPOLAR QUARTZ
BP OF ARTEFACTS ARTEFACTS ARTEFACTS ARTEFACTS ARTEFACTS ARTEFACTS
NO. % NO. % NO. % NO. % NO. %
12th 5 2 40.0011th 145 1 0.69 51 35.1710th 906 2 0.22 1 0.11 309 34.119th 873 1 0.11 3 0.34 1 0.11 332 38.038th 167 1 0.60 1 0.60 1 0.60 53 31.747th 146 1 0.68 58 39.736th 167 2 1.20 3 1.80 53 31.745th 219 1 0.46 5 2.28 4 1.83 81 36.994th 444 5 1.13 1 0.23 3 0.68 11 2.48 144 32.433rd 5936 67 1.13 9 0.15 58 0.98 196 3.30 3079 51.872nd 6694 30 0.45 16 0.24 222 3.32 288 4.30 3754 56.081st 3455 8 0.23 24 0.69 144 4.17 189 5.47 1942 56.21

It is therefore proposed that the number of activity locations/transit camps used inthe catchment gradually increased until 3000 BP. Then, particularly after 2000 BP, there was adramatic increase in their number associated with the use of topographic zones not previouslyused or only infrequently used (Table 10.2). Base camps were first established in the 11thmillennium BP, but the number did not increase until the fourth millennium BP, with thegreatest increase in establishment occurring in the third millennium BP.
Mobility — residential or logistical?In his collector–forager model, Binford (1980, 1982) described residential mobility andlogistical mobility as organisational alternatives that could be employed in varying mixes indifferent settings. Logistical mobility was a strategy adopted by collectors in which basecamps were inhabited for relatively long periods, and task groups went out overnight orlonger using field camps, stations and caches, and then brought resources back to base camps.Residential mobility related to the movement of people between base camps. It was a strategyused by foragers, who had high residential mobility, in which people moved so that theycamped near the resources they were exploiting.
Residentially mobile groups operated within a foraging range around each basecamp within which they used a number of activity locations, which included huntingblinds and other special-use locations (Binford 1982: 7, 11, Fig. 2). The field camps, stationsand caches used by the logistically mobile groups were beyond their foraging range, butwithin a logistical range. Highly mobile foragers did not develop a logistical range,although occasional logistical trips were undertaken. Binford states that ‘with anycondition that restricts residential mobility of either foragers or collectors, we can expect (among other things) a responsive increase in the degree of logistically organised production’ (1980: 17; see also Nelson 1991: 85). The several residential baseswith their associated foraging ranges and logistical ranges, which were used over thecourse of a year, were within an ‘annual range’ (Binford 1982: 7). ‘Long-term mobility’involved circulation through a series of annual ranges, perhaps every decade, and the
What’s changing: population size or land-use patterns? The archaeology of Upper Mangrove Creek, Sydney Basin
terra australis 21
226
Figure 10.3 Upper Mangrove Creek catchment: number and percentage frequency of igneous artefacts in each millennium.

country which encompassed several annual ranges of a community formed an ‘extendedrange’ (Binford 1983: 382–3).
The concept of a series of ‘ranges’ to describe Aboriginal subsistence patterns is wellaccepted in Australian ethnographic studies (e.g., Stanner 1965; Maddock 1982: 42–7), butBinford’s forager–collector model is not without problems and it has often been applied toosimplistically (Bamforth 1991; Bettinger 1991: 71–3; Odell 1996: 52–3; Lourandos 1997: 19–20).Kelly (1992: 44–5, 50, 60) pointed out that there are many different dimensions to mobility —individual mobility, group residential, territorial shifts and migrations, each of which can varyindependently of the others. He considered it is not useful to speak of a continuum betweenmobile and sedentary systems, since mobility is not merely variable but multidimensional.The concept of residential mobility involves not just the movement between base camps butalso the frequency of movements and distance (km) between them, as well as the duration ofvisits at base camps (or duration of time between each move). It also involves the totaldistance covered in residential moves each year (Kelly 1983: 278–9; Shott 1986: 26; Andrefsky1998: 212), as well as distance covered from the base camps in daily forays, which can vary inlength according to circumstances. For example, the longer people stayed at a base camp, thefurther they had to go each day to gain resources; that is, the distances covered on trips outfrom the base camp became greater (Kelly 1992: 46–7). Bettinger (1991: 72) questionedBinford’s claim that increasing population pressure should lead to an increase in logisticalmobility (and a decrease in residential mobility), as surrounding populations would haverestricted group movements. However, Australian ethnographic studies (e.g., Gould 1975:149–50; Maddock 1982: 42–7) show that controlled territorial boundaries are oftencounterbalanced by social mechanisms based on kinship and exogamous marriage rules,which facilitate subsistence movements across boundaries in times of need — though whensuch systems came into being is not yet known. Binford’s model also does not include a termfor groups part-way along the continuum, e.g., those who are residentially mobile but whoundertake occasional logistical forays. The terminology in effect imposes a binary view ofhunter-gatherer strategies: they are either foragers or collectors. As well, mobility models byBinford and others are based on ethnographic studies of communities who inhabited differentenvironments to that of the catchment (which is forested plateau country with a temperateclimate) and who were removed in time for most of the period over which the catchment wasused. The mobility patterns and subsistence organisation of groups using the catchment(particularly those of the distant past) were probably quite different to those of thecommunities on which the models were based.
Although the catchment habitations have been assigned provisionally as either basecamps or activity locations/transit camps on the basis of assemblage size, it is more difficult toidentify the degree of mobility or the mobility strategy/strategies under which they wereformed. Part of the difficulty arises because the catchment is of a size (12km by 10km) that itwould have been only part of the daily, annual or extended range over which groups operated(Higgs and Vita Finzi 1982: 30–3; Foley 1981a: 4–9; Binford 1982: 7). However, intensivearchaeological fieldwork programs equivalent to that of the catchment have not been carriedout in adjacent catchments or regions. The location of base camps in adjacent regionsthroughout the Holocene is not known. The closest excavated shelters to the catchment areMogo Creek, ca 7km to the west in the adjacent Macdonald River catchment (Kohen 1995),and Upside-Down Man, ca 18km to the south on Ironbark Creek, a tributary of lowerMangrove Creek (McDonald 1994: Appendix 3). Both may have been within the daily or atleast annual range of groups using the catchment. Mogo Creek Shelter, first used at least 2340years ago (Kohen 1995: 15), has an upper layer which has a very rich and diverse faunalassemblage but very few stone artefacts; unfortunately, this layer is highly disturbed. Upside-
terra australis 21
227
From numbers of sites and artefacts to habitation, subsistence and land-use patterns

Down Man was first used about 4000 years ago, but it is only in levels post-dating 1500 BP thattotal estimated numbers of artefacts (based on McDonald 1994: Appendix 3: 264–6, TablesA3.13 and A3.24, Fig. A3.14) are high enough to suggest it was a base camp (according to mymethods of categorising catchment habitations).
As stated above, people using the catchment would have been relatively mobilehunter-gatherers — certainly in the recent past, based on early colonial descriptions for theNSW central coast, but probably also throughout the Holocene. Any variation in mobilitypatterns would have been within the ‘forager’ end of the spectrum rather than ‘collector’.However, many details are not known for any period of time, even the historical period; forexample: (a) how long groups stayed at particular base camps or activity locations; (b) howmany base camps people used each year; (c) how often groups returned to particular campsor activity locations; (d) how often people moved throughout a year from base camp to basecamp; (e) what distance they moved between base camps or, (f) the size of the group/s(band/s) that visited the catchment. Groups may have varied in size and composition whenthey were in different parts of their annual range according to resource abundance andsocial/ceremonial occasions. It is also not known how far they ventured out from basecamps on daily foraging trips (their daily range); how often they undertook subsistence tripsrequiring overnight camps away from their base camps (logistical trips); the size of theirannual subsistence range; or where clan and language group boundaries were. Oral historiesindicate movements from Singleton in the Hunter Valley (ca 60km distant to the north) via the catchment’s eastern periphery ridgetop to Brisbane Waters (28km away to the south-east). These trips entailed movement into territories of other clans and language groups, butwe do not know the frequency of such special-purpose trips (e.g., to obtain raw materials orattend rituals/ceremonial functions), or whether people travelled yet greater distances. Eachvariable listed above would not have been constant, but may have varied over the course ofa year, seasonally, in different environmental zones, and over the 11,000 years of thecatchment’s use.
Rowland (1983: 73) proposed that more short-term, briefly occupied sites may resultafter a change from reasonably stable and semi-sedentary activities to those based on greatermobility and more geographically or seasonally separated resources. Whether changes in thedistribution patterns of base camps and activity locations/transit camps in the catchmentinvolved variations in residential mobility patterns and the length of subsistence trips, is notclear from the archaeological evidence. However, since the location and nature of base campsoutside the catchment for most of the Holocene is unknown, the nature of any logistical tripsundertaken is uncertain. Nevertheless, the archaeological evidence does indicate that land-usepatterns changed many times throughout the Holocene, as people reorganised theirhabitation, subsistence and manufacturing activities within the catchment — a suggestedmodel is presented in Table 10.4.
Other measures of mobility patternsHabitation patterns by themselves cannot be taken as the only indication of mobility,irrespective of the area over which habitation patterns have been recorded. Modifications tosubsistence tools and equipment may also have been associated with or made in response tochanges in mobility strategies (Odell 1996: 53). Other proposed measures of residentialmobility involve certain characteristics of stone artefact assemblages from habitation sites, aswell as the nature of site structure and the presence of specific features or facilities such asheat-treatment pits (Kelly 1992: 56–7) or storage places (Nelson 1991: 82). None are absolutemeasures that distinguish different levels of mobility in hunter-gatherer communities — mostare relative measures between what went before and what came after, and many are
What’s changing: population size or land-use patterns? The archaeology of Upper Mangrove Creek, Sydney Basin
terra australis 21
228

interrelated. Advocated measures of mobility involving stone artefact assemblages includevariations in tool-kit/assemblage diversity and richness, and multifunctionalism (versatilityand flexibility) of tools; curated versus expedient artefacts/technology and longevity; theproduction/use of blades; the use of bipolar technology; the portability (transportability) ofimplements; tool/artefact size and weight; and selectivity in raw material use. These issueshave been discussed by many authors (e.g., Binford 1977: 34; Ebert 1979; Torrence 1983, 2001:86; Binford and O’Connell 1984; Bamforth 1986; Shott 1986; Parry and Kelly 1987; Kelly andTodd 1988: 237; Baker 1992: 16; Nelson 1991: 70–1, 74, 76; Kelly 1992: 55; Hiscock 1993, 1994,1996; McNiven 1994; Morwood and L’Oste Brown 1995: 161; Hayden et al. 1996; O’Dell 1996;Andrefsky 1998: Chapter 9; Jochim 1998: 201–4; Clarkson 2002).
A number of these measures involve the concept of raw material conservatism orstone rationing (Bamforth 1986: 39–40; Nelson 1991: 74–7; Morwood and L’Oste Brown 1995:161; Hiscock 1996; Bamforth and Bleed 1997, Table 7.3; White 2001: 10–15, Table 3), which isalso said to incorporate increasing core reduction, including the use of bipolar technology;selection and procurement of better quality stone material; rotating cores, and re-using/recycling previously discarded cores and flakes; more careful knapping strategies suchas platform preparation and overhang removal; reducing tool size, producing blades, anddevelopment of hafted tools; and extending the use-life of tools by additional retouch. Theadoption of stone rationing strategies such as the use of bipolar technology has been said to beimportant under conditions of low residential mobility (i.e., increased sedentism), though itdepends on the availability and abundance of stone (Parry and Kelly 1987: 300–1; Hiscock1996).
Many of the above strategies are reflected not only in the catchment’s assemblagesbut also in the stone artefact assemblages in other parts of the south-eastern coastal NSWculture-area, though expressed to varying degrees according to the specific environment and/oravailability of resources. As such, these strategies may be indicators of what were general,prevailing regional or culture-area customs and practices and they are not necessarilypredictors of the mobility patterns in one small area of a group’s range. In addition, theusefulness of some proposed measures has been questioned. Some systems or terms used in theabove propositions (e.g., curated/expedient/opportunistic, reliable/maintainable, andflexibility/versatility) are not mutually exclusive and are often interdependent, and someindicators are over-simplifications and sometimes contradictory (e.g., Bamforth 1986, 1991;Jochim 1989; Myers 1989: 86–8; Torrence 1989a: 62–4; Nelson 1991; Kelly 1992: 55–6; Hayden etal. 1996; Nash 1996; Odell 1996; Odell et al. 1996: 378–9, 381–2; Bamforth and Bleed 1997: 134;Andrefsky 1998: 214, 221–9; Mulvaney and Kamminga 1999: 266; Daniel 2001: 239, 250–2). Inaddition, some terms are not self-explanatory and unless defined in each study are open toambiguous use and interpretation.
In the case of the catchment, it will ultimately be best to look at the assemblages as awhole to identify relationships between different technological strategies (e.g., withinmanufacturing as well as subsistence practices) and their place in the total technologicalsystem, and then to study how the system changed over time. However, as an initial stage inthis process, the use of bipolar technology as an indicator of mobility levels is examined belowwith presently available catchment data.
Bipolar technologyExpedient technologies, such as the bipolar reduction of cores, are argued to be associatedwith low residential mobility — in particular, with a shift from high mobility to increasedsedentism (Parry and Kelly 1987: 300; Hiscock 1996; Morwood and L’Oste-Brown 1995: 161).However, based on ethnographic analogies from New Guinea, Brazil, Western Australia and
terra australis 21
229
From numbers of sites and artefacts to habitation, subsistence and land-use patterns

What’s changing: population size or land-use patterns? The archaeology of Upper Mangrove Creek, Sydney Basin
terra australis 21
230
T Ta ab bl l
e e 1 10 0
. .4 4A
habi
tatio
n, s
ubsis
tenc
e an
d la
nd-u
se m
odel
for t
he U
pper
Man
grov
e Cr
eek
catc
hmen
t.
MIL
LENN
IUM
BP
HABI
TATI
ON D
ISTR
IBUT
ION
PATT
ERN
IN C
ATCH
MEN
TM
OVEM
ENTS
AND
MOB
ILIT
Y
12th
mill
enni
um B
P (1
1,50
0–11
,000
BP)
11th
mill
enni
um B
P (1
1,00
0–10
,000
BP)
10th
mill
enni
um B
P (1
0,00
0–90
00 B
P)
9th
and
8th
mill
enni
a BP
(900
0–70
00 B
P)
7th
and
6th
mill
enni
a BP
(700
0–50
00 B
P)
5th
mill
enni
um B
P (5
000–
4000
BP)
4th
mill
enni
um B
P(4
000–
3000
BP)
3rd
mill
enni
um B
P (3
000–
2000
BP)
An a
ctiv
ity lo
catio
n/tra
nsit
cam
p w
as u
sed
in th
e m
ain
valle
y bo
ttom
. (1
AL/T
C)
A ba
se c
amp
was
est
ablis
hed
in th
e m
ain
valle
y bo
ttom
in th
e sh
elte
r pre
viou
sly
used
as
an a
ctiv
ity lo
catio
n/tra
nsit
cam
p. (
1 BC
)
The
base
cam
p in
the
mai
n va
lley
botto
m c
ontin
ued
to b
e us
ed, a
nd a
n ac
tivity
loca
tion/
trans
it ca
mp
on a
sub
sidia
ry ri
dges
ide
may
hav
e be
en u
sed.
(1
BC a
nd 1
? AL
/TC)
The
base
cam
p in
the
mai
n va
lley
botto
m c
ontin
ued
to b
e us
ed. A
n ac
tivity
loca
tion/
trans
it ca
mp
was
use
d on
the
north
-eas
tern
sec
tor o
f the
per
iphe
ry ri
dget
op (
the
catc
hmen
t wat
ersh
ed)
and
an a
ctiv
ity lo
catio
n/tra
nsit
cam
p m
ay h
ave
been
use
d on
asu
bsid
iary
ridg
esid
e. (
1 BC
and
1+1
? AL
/TC)
The
base
cam
p in
the
mai
n va
lley
botto
m a
nd th
e ac
tivity
loca
tions
on
the
perip
hery
ridge
top
cont
inue
d to
be
used
and
act
ivity
loca
tions
/tra
nsit
cam
ps w
ere
used
incr
easin
gly
on s
ubsid
iary
ridg
esid
es. (
1 BC
and
2–3
AL/
TC)
The
base
cam
p co
ntin
ued
to b
e us
ed in
mai
n va
lley
botto
m. T
he n
umbe
r of a
ctiv
itylo
catio
ns/t
rans
it ca
mps
incr
ease
d gr
adua
lly w
ith a
noth
er b
eing
use
d by
the
end
of th
ispe
riod,
aga
in in
a p
revi
ousl
y in
habi
ted
zone
— th
e pe
riphe
ry ri
dget
op. (
1 BC
and
4 A
L/TC
)
The
base
cam
p co
ntin
ued
in u
se in
mai
n va
lley
botto
m w
ith a
sec
ond
base
cam
pes
tabl
ished
— th
is tim
e on
the
perip
hery
ridg
etop
in a
diff
eren
t loc
atio
n to
the
activ
itylo
catio
n/tra
nsit
cam
p al
read
y us
ed in
this
zone
. Use
of a
ctiv
ity lo
catio
ns/t
rans
it ca
mps
incr
ease
d br
ingi
ng th
e to
tal t
o fiv
e by
the
end
of th
e pe
riod.
All
base
cam
ps a
nd a
ctiv
itylo
catio
ns/t
rans
it ca
mps
wer
e in
the
sam
e to
pogr
aphi
c zo
nes
as b
efor
e —
the
mai
n va
lley
botto
ms,
the
perip
hery
ridg
etop
s an
d su
bsid
iary
ridg
esid
es. (
2 BC
and
5 A
L/TC
)
The
base
cam
ps in
the
mai
n va
lley
botto
ms
and
perip
hery
ridg
etop
s co
ntin
ued
to b
eus
ed, a
nd a
noth
er th
ree
wer
e es
tabl
ished
— th
e la
tter w
ere
all i
n sh
elte
rs p
revi
ousl
y us
edas
act
ivity
loca
tions
/tra
nsit
cam
ps in
the
mai
n va
lley
botto
ms,
the
perip
hery
ridg
etop
san
d su
bsid
iary
ridg
esid
es. T
wo
shel
ters
con
tinue
d to
be
used
as
activ
ity lo
catio
ns/t
rans
itca
mps
, and
an
addi
tiona
l tw
o w
ere
used
— s
till o
n th
e pe
riphe
ry ri
dget
ops
and
subs
idia
rycr
eek
ridge
sides
. (5
BC a
nd 4
AL/
TC)
The
earli
est g
roup
/s to
visi
t the
cat
chm
ent h
ad th
eir b
ase
cam
p ou
tsid
e th
e ca
tchm
ent.
Mem
bers
of t
he g
roup
/s v
isite
d th
e ca
tchm
ent o
ccas
iona
lly to
get
food
and
raw
mat
eria
ls o
rw
ere
simpl
y tra
nsiti
ng th
roug
h th
e ca
tchm
ent s
tayi
ng o
vern
ight
on
thei
r way
els
ewhe
re fo
rtra
de o
r cer
emon
ial p
urpo
ses.
Regi
onal
sub
siste
nce
patte
rns
wer
e re
orga
nise
d in
this
perio
d. G
roup
s no
w s
pent
mor
e tim
e in
the
catc
hmen
t, ca
mpi
ng fo
r sev
eral
day
s in
at l
east
one
bas
e ca
mp
arou
nd w
hich
they
hun
ted,
gath
ered
food
pla
nts
and
obta
ined
raw
mat
eria
ls.
Subs
isten
ce p
atte
rns
wer
e sim
ilar t
o th
ose
of th
e pr
eced
ing
perio
d. T
he a
ctiv
ity lo
catio
n w
asus
ed fr
om b
ase
cam
ps w
ithin
or o
utsid
e th
e ca
tchm
ent.
Subs
isten
ce p
atte
rns
rem
aine
d th
e sa
me.
The
she
lter o
n th
e no
rth-e
aste
rn p
erip
hery
ridg
etop
was
use
d as
an
activ
ity lo
catio
n, o
r as
a tra
nsit
cam
p du
ring
use
of th
e rid
ge a
s an
acc
ess
rout
efo
r tra
de o
r cer
emon
ial a
ctiv
ities
bet
wee
n th
e Hu
nter
Val
ley
and
Brisb
ane
Wat
ers,
as
hist
orica
llydo
cum
ente
d.
Regi
onal
sub
siste
nce
patte
rns
cont
inue
d as
bef
ore.
The
nor
ther
n an
d ea
ster
n pe
riphe
ryrid
geto
ps c
ontin
ued
to b
e us
ed a
s ac
cess
rout
es.
Regi
onal
sub
siste
nce
patte
rns
bega
n ch
angi
ng. T
he la
rger
num
ber o
f act
ivity
loca
tions
/tra
nsit
cam
ps s
ugge
sts
an in
crea
sing
use
of th
e ca
tchm
ent,
and
incr
easin
g us
e of
the
acce
ss ro
ute
alon
g th
e no
rther
n an
d ea
ster
n ca
tchm
ent b
ound
ary.
Regi
onal
sub
siste
nce
patte
rns
wer
e re
orga
nise
d w
ith g
reat
er c
atch
men
t use
and
/or t
he lo
ng-
dist
ance
acc
ess
rout
e al
ong
the
north
-eas
tern
bou
ndar
y w
as m
ore
frequ
ently
use
d. G
roun
d-ed
ged
hatc
hets
/im
plem
ents
beg
an to
be
used
, mad
e an
d/or
mod
ified
with
in th
e ca
tchm
ent.
Maj
or re
-org
anisa
tion
of re
gion
al s
ubsis
tenc
e pa
ttern
s an
d ha
bita
tion
patte
rns
with
in th
eca
tchm
ent.
The
smal
ler n
umbe
r of a
ctiv
ity lo
catio
ns c
ompa
red
with
the
num
ber o
f bas
e ca
mps
sugg
ests
peo
ple
did
not h
unt,
fish
or g
athe
r pla
nt fo
ods
far f
rom
thei
r bas
e ca
mps
, or t
hat t
heba
se c
amps
wer
e al
so u
sed
as a
ctiv
ity lo
catio
ns fr
om o
ther
bas
e ca
mps
(with
in o
r out
side
the
catc
hmen
t). A
s th
e ca
tchm
ent i
s on
ly 1
2km
by
10km
in a
rea,
all
parts
cou
ld h
ave
been
reac
hed
from
a s
ingl
e ca
tchm
ent b
ase
cam
p. A
ltern
ativ
ely,
gro
ups
coul
d ha
ve m
oved
seq
uent
ially
from
one
base
cam
p to
ano
ther
, gai
ning
thei
r res
ourc
es in
the
imm
edia
te v
icini
ty o
f eac
h or
in a
diff
eren
tse
ctor
of t
he c
atch
men
t (cf
. Bin
ford
198
2: F
ig. 2
; McN
iven
199
2b: 5
05–6
, Fig
. 7),
with
per
haps
mor
e in
tens
ive
cove
rage
of t
he a
reas
use
d (B
info
rd 1
980:
5).
Esta
blish
men
t of e
xtra
bas
e ca
mps
on th
e no
rth-e
aste
rn c
atch
men
t bou
ndar
y m
ay re
flect
mor
e nu
mer
ous
long
-dist
ance
mov
emen
tsas
socia
ted
with
cer
emon
ial p
urpo
ses
or g
row
th in
trad
e, a
nd fi
rmer
est
ablis
hmen
t of t
he ro
ute
betw
een
the
Hunt
er V
alle
y an
d Br
isban
e W
ater
s.

South Africa, as well as North Americanarchaeological examples, Parry and Kelly (1987)outline how expedient core technologies can beassociated with both high and low residentialmobility depending on factors such as theabundance and distribution of raw materials. Inregions where stone material is abundant andwidely distributed, highly mobiles groups canpractice an expedient technology. In contrast, inareas where raw stone sources are scarce, distantand localised, highly mobile groups will designtools to overcome a potential lack of raw materialavailability and use a formal core technology. Parryand Kelly maintain that, although it is a technologywasteful of stone, more frequent bipolar corereduction was associated with low residentialmobility/sedentary groups for whom the mainconsideration in stone-working was to have anadequate supply of useable stone at locations whereit was needed. Such a supply could be maintained atresidential locations by stockpiling materialobtained through trips to quarries.
Hiscock (1982b: 39–41; 1996: 152) explainedthat bipolar knapping is not necessarily wasteful, inthe sense that it can be used to extend the life spanof rocks by enabling flakes to be removed from acore that is too small to be worked by otherpercussion techniques (see also Parry and Kelly1987: 301–2; Odell 1996: 70–1, 76; Andrefsky 1998:227). However, the nature, distribution andavailability of stone material can also influence thedegree to which bipolar reduction is adopted(Nelson 1991: 75; Andrefsky 1998: 227). Hiscock(1996: 152) considered that bipolar techniquesconferred advantages on groups with lowresidential mobility if they were not campedadjacent to a large quarry, as it reduced thefrequency with which stone needed to betransported to a base camp, in that more flakescould be gained from a single core. In a study ofsites on the Kakadu flood plain in Arnhem Land, hedemonstrated that in assemblages of the same ageat different locations in relatively close proximity toeach other, evidence for the use of bipolar and hand-held technologies varied in frequency as each siteincreased in distance from the raw material sources(Hiscock 1996: 152). Hiscock considered that theincreased use of bipolar technology during the late-Holocene demonstrates an increased use of
terra australis 21
231
From numbers of sites and artefacts to habitation, subsistence and land-use patterns
T Ta ab bl l
e e 1 10 0
. .4 4(c
ontin
ued)
MIL
LENN
IUM
BP
HABI
TATI
ON D
ISTR
IBUT
ION
PATT
ERN
IN C
ATCH
MEN
TM
OVEM
ENTS
AND
MOB
ILIT
Y
2nd
mill
enni
um B
P(2
000–
1000
BP)
1st m
illen
nium
BP
(100
0 BP
–184
0 AD
)
Five
bas
e ca
mps
con
tinue
d to
be
used
and
two
addi
tiona
l bas
e ca
mps
wer
e es
tabl
ished
inpr
evio
us a
ctiv
ity lo
catio
ns/t
rans
it ca
mps
on
the
perip
hery
ridg
etop
s. T
here
was
a v
ery
larg
e in
crea
se in
the
num
ber o
f act
ivity
loca
tions
/tra
nsit
cam
ps u
sed
— s
ome
wer
e in
alre
ady
inha
bite
d zo
nes
but o
ther
s w
ere
now
alo
ng th
e pe
nins
ula
ridge
tops
, the
val
ley
botto
ms
in s
ubsid
iary
cre
eks
and
ridge
sides
abo
ve th
e m
ain
cree
k. (
7 BC
and
9 A
L/TC
)
Six
base
cam
ps c
ontin
ued
to b
e us
ed, o
ne w
as u
sed
only
as
an a
ctiv
ity lo
catio
n/tra
nsit
cam
p, a
nd o
ne n
ew b
ase
cam
p w
as e
stab
lishe
d. O
ne e
xist
ing
activ
ity lo
catio
n/tra
nsit
cam
p ce
ased
to b
e us
ed, b
ut a
ll ot
hers
con
tinue
d to
be
used
with
an
even
gre
ater
num
ber o
f diff
eren
t loc
atio
ns n
ow u
sed
for t
hese
pur
pose
s in
all
topo
grap
hic
zone
s w
ithin
the
catc
hmen
t. (7
BC
and
22 A
L/TC
)
Furth
er s
ubst
antia
l reo
rgan
isatio
n of
sub
siste
nce
patte
rns.
The
unp
rece
dent
ed n
umbe
r of
activ
ity lo
catio
ns u
sed
in a
gre
ater
num
ber o
f top
ogra
phic
zon
es, i
n ad
ditio
n to
the
incr
ease
inba
se c
amps
, sug
gest
s zo
nes
from
whi
ch fo
od a
nd ra
w m
ater
ials
wer
e ob
tain
ed a
roun
d ea
chba
se c
amp
beca
me
larg
er. A
ltern
ativ
ely,
an
incr
easin
g nu
mbe
r of t
rips
wer
e m
ade
out f
rom
catc
hmen
t bas
e ca
mps
, and
/or t
here
was
a g
reat
ly in
crea
sing
num
ber o
f trip
s in
to th
eca
tchm
ent f
or h
untin
g, g
athe
ring
or ra
w m
ater
ials
from
bas
e ca
mps
in a
djac
ent v
alle
ys o
rfu
rther
dow
nstre
am a
long
Man
grov
e Cr
eek.
Man
ufac
ture
/mai
nten
ance
of g
roun
d-ed
ged
axe/
hatc
het h
eads
incr
ease
d in
the
perip
hery
ridg
etop
s.
Habi
tatio
n pa
ttern
s ch
ange
d sl
ight
ly, b
ut a
ctiv
ities
ass
ocia
ted
with
hun
ting
and
gath
erin
g, a
sw
ell a
s ga
inin
g ra
w m
ater
ials
and
tool
man
ufac
ture
, wer
e ca
rried
out
at a
n in
crea
singl
y gr
eate
rnu
mbe
r of a
reas
with
in th
e ca
tchm
ent.

expedient technology associated with increased sedentism, or at least decreased mobilityduring this period. Variations may also occur in assemblages of the same age however,because of the different function of sites in the subsistence system. For example, base campsmay contain greater evidence of bipolar core reduction than activity locations at which only ashort time (i.e., no more than one night) is spent.
In the catchment, the number of bipolar pieces (cores and flakes) in Loggers andBlack Hands increased during the late-Holocene (Tables A1/33 and A1/7 respectively). InEmu Tracks 2, Uprooted Tree and White Figure, in addition to an increase in bipolar cores andflakes, the ratio of hand-held cores to bipolar cores decreased (Tables A1/25, A1/47 andA1/51). Quartz as well as FGS, silcrete and chert were all reduced by bipolar techniquesthough quartz bipolar cores and flakes are much more abundant in the assemblages. In thecatchment as a whole, there was a greater and increasing use of bipolar technology at theexpense of hand-held core reduction starting ca 6000 years ago, but more dominantly in thelast 3000 years (Table 10.3, Fig. 10.4). The amount of quartz in the assemblages was similarover the last 3000 years (Fig. 10.5), suggesting other stone materials were increasingly reducedby bipolar techniques. If the use of bipolar technology in core reduction was associated withlow residential mobility, then this component of the stone artefact assemblages suggestspeople using the catchment gradually became less residentially mobile from ca 6000 years ago,but especially after 4000 BP.
In many parts of the central and south coast of NSW, the increasing use of bipolarcore reduction in the late-Holocene has been documented in numerous stratified rockshelterdeposits and is thus associated with broad-scale culture-area changes (e.g., Burrill Lake andCurrarong, Lampert 1971a: 38, 46–7, 65–8, Tables 3 and 15; Curracurrang 1, Megaw 1974: 35–7;Curracurrang 2, Glover 1974: 15, Table 2; Lapstone Creek, McCarthy 1948: 22; MacdonaldRiver, Moore 1981, Table 6; Mill Creek 11, Koettig 1985b: 45–9, Table 12, 1990: 1; Mt Yengo,McDonald 1994, Appendix 1: 61, 73–4; Sassafras 1 and 2, Flood 1980: 229, 233, Figs 40, 43;Shaws Creek K2, Kohen et al. 1984: 66, Table 5; Upside-Down Man, McDonald 1994, Appendix3: 245–6). While bipolar core reduction is well documented in excavated rockshelter depositsin sandstone regions of south-eastern NSW, it is much less common in non-sandstone areas
What’s changing: population size or land-use patterns? The archaeology of Upper Mangrove Creek, Sydney Basin
terra australis 21
232
Figure 10.4 Upper Mangrove Creek catchment: number and percentage frequency of bipolar artefacts in each millennium.

where silcrete, chert/tuff and other fine-grained siliceous materials are locally available andpredominantly used, but quartz is much less readily available and much less commonly used;for example, the Cumberland Plain (AMBS 2002b: 9–11, 32–5, Table 14), Hunter Valley centrallowlands (Baker 1992: 7, 20) and upper Shoalhaven River Valley (Attenbrow and Hughes 1983;Attenbrow 1984). Thus, inter-regional variations, which appear to correlate with the availabilityof certain raw materials, are evident in the use of bipolar technology.
Use of bipolar technology may have been the most efficient way to exploit the stonematerials available in the sandstone country. For example, in the catchment, raw materialsources suitable for making flaked tools are pebbles and cobbles from the conglomerate bedsin the Narrabeen Group sandstones and quartz pebbles from the Hawkesbury sandstone. Thelargest cobble I observed in the catchment was of FGS and was 160 × 110 × 70mm in size, butthe majority were much smaller, particularly the quartz pebbles (generally < = 25mm). Silcreteand chert/tuff materials are not available within the catchment, with the nearest sources ofthe former being in the Hunter Valley lowlands (ca 60km to the north) and the south of theHawkesbury River (e.g., Cumberland Plain, ca 55km to the south). Sources of chert/tuff arealso available in the Hunter Valley lowlands as well as the Colo and Grose River valleys of theBlue Mountains and the Hawkesbury River gravels (35–60km to the south — all distances asthe crow flies, but ground travel distances would be longer). Thus, changes in access to andavailability of stone material sources which were not available within the catchment may haveinfluenced the degree to which bipolar working was used in core reduction. It may have beenused to exploit the imported silcrete and chert/tuff materials to the maximum and, at thesame time, would have been the most suitable method to gain useful flakes from the local,small-sized quartz pebbles (Lampert 1971a: 47; Hiscock 1982b). The need to reduce cores ofimported materials by the bipolar technique in order to maximise their use may have led to itsgreater use with other local materials when there was a demand for greater numbers of stoneimplements (see below). Groups in regions such as the Hunter Valley and Cumberland Plainhad no need to adopt bipolar core reduction techniques on a large scale since they hadcontinuing access to quality materials such as silcrete and chert/tuff.
terra australis 21
233
From numbers of sites and artefacts to habitation, subsistence and land-use patterns
Figure 10.5 Upper Mangrove Creek catchment: number and percentage frequency of quartz artefacts in each millennium.

Taçon (1991: 198–9, 203–4) suggested quartz and quartzite were especially valued asraw materials in western Arnhem Land because they were shiny and iridescent, propertiesassociated with Ancestral Beings. In south-eastern Australia, this could be the case with quartzcrystals, which are reported as being associated with rituals and ceremonies (Mathews 1897:2–3; Howitt 1904 [1996]: 357–8). However, quartz in reef and pebble/cobble forms is soubiquitous in so many areas it is hard to accept that such forms of quartz had symbolicsignificance or special powers in this part of Australia. Its easy accessibility combined with theabsence of preferred raw materials may be the reason for its increased use in sandstonecountry of the culture-area. Why it increased in the catchment at the expense of FGS whereboth materials are readily available is presently inexplicable.
It is possible that the increasing use of bipolar core reduction in the catchment in thelate-Holocene was initially a response to restrictions in access to preferred raw materialsunavailable in the catchment (i.e., silcrete and chert/tuff). Such restrictions may have been aresult of reorganisation of social relationships in the culture-area, which led to greaterterritoriality and/or more tightly controlled territorial boundaries. Newly establishedboundaries, or more tightly controlled boundaries, may have meant groups inhabiting thesandstone country could no longer make long-distance trips to stone sources in the non-sandstone country without prior permission or outside the context of trading partnershipsand marital relationships. Such a scenario suggests long-distance mobility patterns may havechanged, but whether reduced residential mobility was also involved is not yet clear.
Subsistence methods and equipment
The proposed habitation, subsistence and land-use model (Table 10.4) based on the tentativeassignment of habitations as either base camps or activity locations provides an explanationfor late-Holocene trends in the habitation indices. While artefact numbers were used toproduce the model, the model does not explain either the dramatic increase in the localartefact accumulation rate in the third millennium BP or the subsequent substantial decreasein the last 1000 years. Changes in the local artefact accumulation rate do not coincide in time,direction or magnitude with changes in the habitation indices. However, the major increase inbase camps in the third millennium BP does coincide in time with the dramatic increase in thelocal artefact accumulation rate (compare Figs 9.1 and 10.1). The question now has to be asked:are the major increases in both numbers of base camps and the local artefact accumulationrates linked and simply due to a greater number of people inhabiting each base camp and thecatchment as a whole, or are they due to some other events or circumstances? The followingdiscussion addresses only changes in the local artefact accumulation rates. Variations in theartefact accumulation rates of individual habitations will be addressed elsewhere.
One explanation for changing local artefact accumulation rates that is explored belowis that they reflect a change in the number of implements that were made/used by eachperson in response to changing levels of subsistence risk rather than local, regional orcontinental population increase. That is, were risk minimisation strategies adopted in the thirdand first millennia BP that could have led to changes in the tool-kit, which in turn resulted inthe dramatic increase in the local artefact accumulation rate in the third millennium BP as wellas the substantial decrease in the last 1000 years BP? In fact, advocating population increase ata time when the climate was colder and drier would be incongruous — such conditions areusually described as ‘deteriorating’ and as being associated with low levels of subsistenceresources (e.g., David and Lourandos 1998: 212), although whether resource levels were lowerat this time in temperate coastal south-eastern Australia is not certain.
What’s changing: population size or land-use patterns? The archaeology of Upper Mangrove Creek, Sydney Basin
terra australis 21
234

No new flaked implement types appeared in the late-Holocene assemblages; that is,tool-kit diversity remained the same. It appears that an increase occurred in the averagenumber of implements used by each person in the third millennium BP that did not involve anincrease in the number of implement types. Flaked implements that did increase in abundancein the catchment in the third millennium BP (both in number and as a percentage of thecatchment assemblage) are the backed artefacts (Bondi points, geometric microliths andelouera). Most backed artefacts (85%) were in levels dated to between ca 3000 BP and ca 1000BP (Table 10.3, Fig. 10.6). The possible use of backed artefacts in risk minimisation strategies isexplored below.
The similarity in percentage frequencies for backed artefacts as a proportion of thetotal catchment assemblage in both the fourth and third millennia BP (despite the largedifference in size between the assemblage for each millennium) suggests that there may havebeen a relationship between the proliferation of backed artefacts and the dramatic increase inthe local artefact accumulation rate in the third millennium BP. However, it seems unlikelythat backed artefact production was the sole reason for the similarly high local artefactaccumulation rate in the second millennium BP as backed artefacts decreased in the numberand percentage in this period despite a slight increase in the total number of artefacts. Inassemblages of the first millennium BP, backed artefacts are represented only by eloueras andgeometric microliths — no Bondi points have been identified in catchment assemblages datingto this period.
Tasks for which Bondi points and geometric microliths were used are still debated.The original view was that Bondi points were ‘surgical knives’ (Etheridge and Whitelegge1907: 238), but the most common view now is that they were barbs for hunting spears(McCarthy 1958: 186; Lampert 1971a: 69; McBryde 1974: 264–5, 326, 1977: 234, 1985; Mulvaney1975: 229; Kamminga 1980: 5, 9, 11; Kohen 1986: 313, 323, 1995: 77, 82; Flood 1999: 224–5;Mulvaney and Kamminga 1999: 236; Moore 2000: 35–6). It has also been suggested that Bondipoints were points or barbs for multi-pronged fishing spears (McCarthy 1958: 186, 1965: 79;Branagan and Megaw 1969: 8). Others say they could also be small cutting tools/knives —hafted or even hand-held (Stockton 1970b: 227–9, 1979: 54; Moore 2000: 36–7); awls (needles or
terra australis 21
235
From numbers of sites and artefacts to habitation, subsistence and land-use patterns
Figure 10.6 Upper Mangrove Creek catchment: number and percentage frequency of backed artefacts in each millennium.

points) for skin-working (Tindale 1957: 27; Stockton 1970b: 227–9, 1979: 54; Kamminga 1980:5), or ceremonial objects (White and O’Connell 1982: 123). As with other parts of AustralianAboriginal tool-kits, they may have been multifunctional components used in a range ofdifferent tools for a range of different tasks (Dickson 1973: 7); though Mulvaney andKamminga (1999: 266) question this. Examination of use-wear patterns and residues adheringto backed artefacts from eastern NSW assemblages suggests various uses: spear barbs andplant processing (Boot 1993a: Tables 8–11), and hafting as a knife rather than a spear (Therin2000; Haglund 2001b: 35–6). Robertson’s (2002) examination of backed artefacts from thecatchment sites Deep Creek and Emu Tracks 2 has revealed traces of bird feathers. For thefollowing discussion, I assume backed artefacts were multi-functional components and theirfunctions included being points and barbs in hunting spears.
Risk minimisation strategiesRisk can be defined as the probability of loss, or, more specifically when related to foodresources, it can be seen as the probability of failing to meet dietary requirements and the costsof such failure, for example hunger and malnutrition (Wiessner 1982a: 172–3; Torrence 1989a:59; Bamforth and Bleed 1997: 117, 133–4). There are thus two components to the concept ofrisk: the first, the likelihood of an event’s occurrence, and the second, the magnitude of thatevent (Kelly 1992: 47) or the cost or consequence of losing the sought-after resource (Cashdan1985; Bamforth and Bleed 1997: 112, 117).
In ethnographic studies, mobility is seen as the simplest response to subsistence risk,which works by taking advantage of the spatial and temporal variations in resourceabundance and moving away from areas with scarce food resources (Gould 1980: 84–7;Halstead and O’Shea 1989: 3–4; O’Shea and Halstead 1989: 124; Veth et al. 2000). Risk andmobility are thus interconnected (Parry and Kelly 1987; Torrence 1989a, 1989c, 2001: 88; Odell1996: 53). However, many other strategies aimed at reducing or avoiding subsistence riskshave been documented ethnographically (e.g., Colson 1979; Wiessner 1982a: 172–3, 1982b: 65;Cashdan 1983, 1985; Whitelaw 1983: 58–62; Boydston 1989: 75–6; Myers 1989: 84–5; Thorley2001: 10; Torrence 2001: 80). These include food storage; transmission of information aboutfamine foods; conversion of surplus food into durable valuables which could be stored andtraded for food in an emergency; transfer of risk or loss from one party to another;diversification of activities and/or resources rather than specialisation; and, switching todifferent resources or switching territories (Colson 1979: 21; Wiessner 1982b: 172–3; Kelly andTodd 1988: 233). Other ethnographic examples include pooling or sharing of risk, whichcombines principles of risk transfer with principles of storage, and storage of obligations (i.e.,generalised reciprocity) (Wiessner 1982b: 172–3). This strategy operates at varying levels andinvolves the establishment of social relationships as well as kinship and exchange networksand political alliances (at inter- and intra-group levels), which enables the use of foodresources in the territories of other clans or language groups in times of hardship (i.e., groupmobility) (Colson 1979: 21; Gould 1980: 84–7; Maddock 1982: 42–7; Halstead and O’Shea 1989:3–4; Myers 1989: 85; O’Shea and Halstead 1989: 124). Prevention of loss through measuressuch as rituals, control of resources through burning, land rights (territoriality) and defence ofterritory, so that a group can plan a yearly round without the risk that others will come intothe area unexpectedly and exhaust critical resources, have also been reported as methods ofreducing risk (Wiessner 1982b: 172–3).
Most hunter-gatherer communities have a variety of strategies and have differentstrategies for use in different contexts, though some categories are mutually incompatible(e.g., food storage and mobility) and others mutually reinforcing (mobility and diversification)(Halstead and O’Shea 1989: 4; O’Shea and Halstead 1989: 124). The two most common
What’s changing: population size or land-use patterns? The archaeology of Upper Mangrove Creek, Sydney Basin
terra australis 21
236

strategies mentioned in ethnographic literature are risk pooling (reciprocity) and riskavoidance in the form of local mobility, but Torrence (1989a: 58–9) pointed out that the role oftools and technology was often left out of anthropological and archaeological discussionsabout risk minimisation. The term technology in this context is used more broadly than I havedone in previous chapters and includes the use, transport and discard, as well as all stages inmaking and maintaining the components of a tool-kit (Nelson 1991: 57).
Technological optionsTechnological options that have been proposed as subsistence risk minimisation strategiesinclude a reduction in expedient tools and/or opportunistic technological behaviour(Nelson 1991: 64–5; Torrence 2001: 84–5), as well as the introduction or increased use ofhighly structured tools and techniques (Wiessner 1982a and 1982b). Other suggested optionscomprise tended and untended facilities (Torrence 2001: 80); tools designed forcuration/longevity and portability (transportability) (Nelson 1991: 62–4, 73–6; Torrence2001: 84, 86–8); diversified assemblages (tool-kit diversity), including special-purpose tools,as well as increased complexity of tools (number of component parts) (Bleed 1986: 743;Myers 1989: 86; Torrence 1989a: 60–2); efficient and specialised tools that require high investment in production time — specialising in a small set of reliable resources(Bamforth and Bleed 1997: 115); reliable, versatile and portable tools that require lowinvestment in production time, used in association with resource diversification (Bamforthand Bleed 1997: 115); multifunctional, readily modifiable, easily portable tools — that is,formal tools (Andrefsky 1998: 214); reliable and maintainable technological systems which,separately or together, ensure tools are available and work when they are needed (Bleed1986; Torrence 1989a: 60, 62–3, 2001: 82–9; Myers 1989: 87; Nelson 1991: 66–73; Odell 1996: 53;Jochim 1998: 205–6).
As with proposed measures of mobility based on stone artefact assemblage variables,not all of the above propositions have proved useful when applied in archaeological studies(e.g., Hayden et al. 1996). The central problem that technological strategies have to solve is toensure that the tools are available and are in a useful condition when needed; that is,technology reduces risk by preventing or at least reducing the probability that loss will occur(Torrence 1989a: 59; Bamforth and Bleed 1997: 116). Efforts to devise loss-reducing technologywill be greatest where the consequences of resource loss or the frequency with which risk willoccur is greatest (Torrence 1989a: 59–60). However, the context in which the risk occurs alsoneeds to be considered; similar events with similar probabilities of occurrence may result invery different costs in different environments/regions and different communities and thusresponses will vary (e.g., Jochim 1989: 110–11); choosing one technological option overanother, or a technological rather than a social solution, may also impose costs. Alternativetechnological solutions have to be acceptable within constraints imposed by other demandson time and the resources of the community, and options must be effective as well as feasible;thus some options may not be acceptable in certain circumstances or contexts (Bamforth andBleed 1997: 125, 133–4). Torrence (1989a: 61–2) considered technological strategies would beused for coping with short-term risk associated with potentially serious consequences but, asthe severity and/or frequency of the risk encountered diminished, different forms of socialbehaviour would be introduced; for example, mobility and information sharing would beadopted for spatial variations in resource availability. Another technological cost, in additionto application failure (i.e., breakage during use or because of poor tool design), is the cost ofproduction. Such costs include the failure to produce sufficient numbers of tools due to, say,breakages during manufacture, the inability to obtain sufficient raw materials because of time,or social constraints (Bamforth and Bleed 1997: 112, 127–8). The necessity to prepare some
terra australis 21
237
From numbers of sites and artefacts to habitation, subsistence and land-use patterns

stone materials by heat treatment also may have incurred considerable wastage (Mulvaneyand Kamminga 1999: 266). Thus, high technological costs may constrain some choices, andopportunities and constraints would have been balanced against or perhaps integrated witheach other in some circumstances.
Backed artefactsSeveral European studies have linked changes in the availability of game with an emphasis onbacked artefacts (microlithic tools) in stone artefact assemblages (e.g., Myers 1989: 90–1;Jochim 1989, 1998: 201–14; Torrence 2001: 88–9). These studies interpret the trend as anincrease in the number of stone points/barbs on spears, whereby they could easily be replacedand/or the spear could continue in use even if one was broken. Myers (1989: 82, 87–8, 90–1)proposed that the alteration in microliths from large forms in early Mesolithic Britishassemblages to smaller more abundant late Mesolithic forms represented a change in tool-kit,in which the microliths were standardised components in multi-pronged tools, which werepart of a more diverse, reliable and maintainable tool-kit. This change was a response to aclimatically associated faunal change — from migratory species that inhabited openvegetation and could be intercepted along known routes, to non-migratory species thatinhabited a denser understorey, were dispersed and unpredictable in location. The lateMesolithic microliths were part of a strategy to enable animal resources to be procured quicklyand effectively once they were encountered.
The introduction of new tool-kits (including backed artefacts, unifacial/bifacial pointsand tulas) and stone-working strategies in Australia in the mid-Holocene (between 6000 BP and3000 BP) has been explained by Hiscock (1994: 268; 2002) as the introduction of technologicalsolutions to risks created by scheduling uncertainties. At that time, he said, organisationaldifficulties were imposed by particular systems of settlement and mobility (p. 273) during theuse and/or colonisation of previously unoccupied or unfamiliar country, the latter includingrapidly changing environments, such as areas in Arnhem Land impacted by the final stages ofthe rising sea-levels (Hiscock 1994: 277–8, 282). Hiscock described these tools as standardised,multifunctional, reliable, maintainable and portable, with their production geared to rawmaterial conservatism (Hiscock 1994: 278, 287). The subsequent decline in backed artefacts andpoints, he maintained, was ‘primarily a response to the economics of raw material usageassociated with low residential mobility together with a reduction of uncertainty in landscapeuse’ (Hiscock 1994: 286). In a recent article building on earlier ideas but focusing on backedartefacts, Hiscock (2002: 171, 174) considered that broad chronological trends in theproliferation of their production in many different contexts in southern Australia may wellreflect one cultural response to risk incurred by increased environmental variability — a drierand more variable ENSO-controlled late-Holocene climate beginning 5000–4000 BP. Thisresponse, he pointed out, was increased production of a pre-existing implement form. He(2002: 172–3) said that other shifts in food resource use in the mid-Holocene in several parts ofthe continent would have been risk-reduction mechanisms in the face of environmentalvariation, increased pressure through population increase, and/or reduction of territory size.The subsequent late-Holocene decline in backed artefacts, he said, was, however, not aresponse to reduction of foraging risk, but to ‘the onset of new environmental and socialcontexts involving factors such as sedentism, territoriality and population increase, that has amore potent effect on the selection of appropriate technology’ (Hiscock 2002: 172).
Sources of risk and risk minimisation in the Upper Mangrove Creek catchmentEnvironmental changes associated with late-Holocene climatic shifts may have altered thelevels of subsistence risk experienced by the catchment’s inhabitants. The general correlation
What’s changing: population size or land-use patterns? The archaeology of Upper Mangrove Creek, Sydney Basin
terra australis 21
238

terra australis 21
239
in timing of late-Holocene climatic changes with the dramatic changes in the local artefactaccumulation rates, and the proliferation and decline of backed artefacts, all of which occurwithin the last 4000 years, suggest an association. Late-Holocene climatic changes (asdiscussed in the previous chapter) are likely to have affected the catchment’s vegetationcommunities and animal populations, though it would have been the areal extent and/orabundance of certain plants that altered rather than a loss of communities.
Archaeological faunal evidenceArchaeological evidence from Deep Creek and Mussel Shelters indicates that there may havebeen a change in the macropod populations in the catchment in the late-Holocene. Severalmacropod species were identified (Aplin 1981: Tables 4 and 7; Aplin and Gollan 1982: Tables 7and 8). Faunal assemblages dating from ca 3000 BP to ca 1200–1000 BP were characterised bythe presence of the eastern grey kangaroo (Macropus giganteus) and the relative importance ofthe red-necked wallaby (M. rufogriseus) and later assemblages (less than ca 1200–1000 BP old)by pademelons (either Thylogale stigmatica, red-legged pademelon, or Thylogale thetis, red-necked pademelon). The later assemblages also have a greater abundance of swamp wallabies(Wallabia bicolor) than the early assemblages. The two macropod species distinguishing theearlier assemblages are much larger in size than the macropod species characterising the laterfaunal assemblages (Table 10.5).
The habitats of these macropod species suggest that the forest understorey in thecatchment was generally more open in the early period from ca 3000 BP to 1200–1000 BP thanduring the last 1000 years or so. Such vegetation changes are in general agreement withregional pollen records, which indicate forests were more open between ca 2800 BP and ca1800 BP and the climate was colder and drier than in the preceding five or six millennia. In thewarmer–wetter millennia of the early to mid-Holocene, the forest understorey may have beenas dense as or denser than it was in the last 1000 years. Consequently, both the eastern greykangaroo and the red-necked wallaby may have been less numerous in the catchment in theearly to mid-Holocene than between 3000 to 1200-1000 BP. If so, the transition to a more openforest environment in the late-Holocene may have provided a situation in which the use ofstone-barbed spears and/or multi-barbed spears (incorporating Bondi points) became apreferred method of hunting macropods, including the then more common large eastern greykangaroo and red-necked wallaby.
Backed artefactsThe onset of increasingly colder and drier conditions following the early Holocene ‘optimum’began ca 5000 or 4000 BP, and at this time backed artefacts began to increase as a proportion ofthe catchment’s artefact assemblages (Fig. 10.6). However, after ca 3000 BP, when conditionsbecame very much colder and drier than at any other time during the Holocene, the numbers
From numbers of sites and artefacts to habitation, subsistence and land-use patterns
TTaabbllee 1100..55 Upper Mangrove Creek catchment: size of common macropod species in each period (weights from Strahan 2000).
PERIOD MACROPOD SPECIES WEIGHT
Early Macropus giganteus, eastern grey kangaroo up to 66kg for males/32kg for females
Early Macropus rufogriseus, red-necked wallaby up to 26.8kg males/15.5kg females
Early–Late Macropus robustus, wallaroo, euro up to 46.5kg males/25kg females
Early–Late Wallabia bicolor, swamp wallaby up to 20.5kg males/15.4kg females
Early–Late Petrogale penicillata, brush-tailed rock wallaby up to 10.9kg males/8.2kg females
Late Thylogale thetis, red-necked pademelon up to 9.1kg males/4.3kg females
Late Thylogale stigmatica, red-legged pademelon up to 6.8kg males/4.2kg females

of backed artefacts produced in the catchment increased dramatically — that is, thetechnological response to climatic change was far greater than earlier on. Weather conditionsbecame more variable with the onset of current ENSO phenomena ca 3000 BP. Increasingseasonality and variability in precipitation, combined with the colder–drier conditions, mayhave increased the magnitude of resource fluctuations and thus increased the levels ofsubsistence risk (cf. Bamforth and Bleed 1997: 113). By ca 3000 BP, the probability of failure inthe hunt may have become too great to ignore. Macropod populations inhabiting thecatchment had changed to the extent that there was a greater level of risk associated withhunting them — the probability of failing to spear (kill) a kangaroo or wallaby had increased.Part of the response was increased production of backed artefacts to act as points and barbs inhunting spears so that each hunter had more stone-barbed spears and/or each spear had morebarbs than previously to increase their chance of hunting success. Hunters may have mademore stone-barbed spears to ensure against loss or breakage of a spear shaft during the chase.Alternatively, more barbs were inserted in their spears because of the larger size of the animalsand/or such a method of manufacture would have enabled the hunter to continue the chaseeven if one barb had broken or been lost.
The evidence for the end of the colder–drier period is not as easily interpreted. Thepollen evidence indicates drier conditions lasted only to ca 1800 BP. The number andpercentage of backed artefacts decreased during the second millennium BP, with Bondi pointsabsent after ca 1600 BP. However, the change in the macropod populations, according to thearchaeological evidence, did not occur until ca 1200–1000 BP. Macropod species were possiblyable to maintain their population levels well after the late-Holocene driest–coldest conditionsprevailed. Alternatively, perhaps the hunters continued for as long as they could to catch thespecies to which they had become accustomed, despite variations in their abundance, butused different equipment and/or moved to strategies that involved the production of fewerbacked artefacts.
By ca 1000 BP, climatic conditions had returned to a warmer-wetter regime andvegetation patterns that were similar to those at the time of British colonisation. The macropodspecies commonly represented in the faunal assemblages of this period — swamp wallaby,pademelon and brush-tailed rock wallaby — are smaller than the eastern grey kangaroo and red-neck wallaby, which are present only in the early assemblage (Table 10.5). The continued decline inbacked artefact production (including the abandonment or much reduced use of Bondi points)may have occurred because stone-barbed spears were not as useful or efficient as other methods tocatch the smaller macropods, and even the larger species such as the euro, which is presentthroughout the deposits, in the denser understorey of this period. Other ways of minimising risk,such as the use of traps or communal hunting, may have been more common. The latter wereobserved in early colonial times in adjacent areas: Macdonald River (Mathew 1833 in Havard 1943:237); Lake Macquarie (Threlkeld 1825 in Gunson 1974, Vol. 2: 191), and near Maitland in theHunter Valley central lowlands (Dawson 1830: 8 in Brayshaw 1986: 79, Table B). In some instances,nets were fixed among the trees (Fawcett 1898: 153 in Brayshaw 1986: 79). The use of woodenbarbed and/or wooden pointed spears may have increased, or the quartz pieces produced bybipolar core reduction may have begun to replace backed artefacts in stone-barbed hunting spears.Both wooden pointed and quartz barbed hunting spears were used locally on the coast at LakeMacquarie in the early colonial period (Threlkeld 1825–26 in Gunson 1974, Vol. 1: 67).
If the catchment’s archaeological record is representative of changes that happened inthe forested sandstone plateau of the NSW central hinterland, then similar faunal sequencesshould be identified in future excavations where conditions are suitable for the preservation oforganic remains. Outside the sandstone plateau country, in areas where vegetation and faunalcommunities were different and responses to climatic changes may have differed, human
What’s changing: population size or land-use patterns? The archaeology of Upper Mangrove Creek, Sydney Basin
terra australis 21
240

responses may have varied as well, especially in the adjacent coastal zones where ocean andestuarine resources were available. However, the widespread distribution of backed artefactsand their ubiquitous proliferation ca 3000 BP across the wider culture-area and south-easternAustralia generally, indicates that, if their increased production was due to their adoption inrisk minimisation strategies at this time of marked climatic and environmental changes, theirpre-existence and multifunctional nature meant they were accepted as ‘a universal panacea’ready for a variety of contexts (Hiscock 2002).
So, in seeking explanations for the dramatic increase in the local artefact accumulationrate in the third millennium BP, I propose that it may partially reflect the greatly increasedproduction of backed artefacts as a technological response to variations in subsistence risk. Inthe catchment, the increased risk may have arisen because of a change in the abundance ofspecific macropod species, which was brought about by changing climate and vegetationpatterns.
It seems likely, however, that variations in the rate of backed artefact production werenot the only technological or behavioural change involved in the dramatic changes in the localartefact accumulation rates, particularly in the second and first millennia BP. For example,backed artefacts began to decline in the second millennium BP, whereas the faunal assemblageand local rate of artefact accumulation remained unchanged until the first millennium BP.
Ground-edged implementsAlthough no new flaked implements appeared in the catchment’s late-Holocene assemblages,new stone implements did occur earlier than the third millenium BP proliferation of backedartefacts. In the fourth millennium BP, ground-edged implements appear. They are evidenced aswhole implements as well as fragments which increase over time, both in abundance and as aproportion of the catchment assemblages (Table 10.3, Fig. 10.2). Ground-edged implements mayhave been used in manufacturing wooden food-procurement equipment, such as spears, spear-throwers, clubs, traps or containers, or in gaining possums from tree trunks. Climatic conditionswere beginning to get colder and drier in the fourth millennium BP. In these conditions, ground-edged implements may have been adopted as part of risk minimisation strategies to cope withassociated environmental changes to vegetation or faunal communities, before strategies andequipment using greater numbers of backed artefacts were devised.
Later again, in the second and first millennia BP, with lesser use of strategiesincorporating backed artefacts, there was an increase in subsistence methods using ground-edged implements, or wooden implements or equipment. By the historical period, ground-edged implements were commonly used by both men and women for a wide range ofsubsistence and manufacturing purposes (Collins 1798 [1975]: 456; Hunter 1793 [1968]: 61;Tench 1793: 191 [1979]: 284).
Unanswered questions and further researchThe above model provides plausible reasons why each hunter required more backed artefactswith the onset of the coldest–driest conditions, and why they subsequently declined in use.There are, however, still some areas of uncertainty. For example, the function of the backedartefacts as spear points and barbs still needs to be demonstrated. Although bird feathers havebeen identified on some backed artefacts from the catchment (Robertson 2002), no evidencefor their being hafted as spear points or barbs has been observed. If backed artefacts were notspear points/barbs or were not associated with hunting land animals solely for food asdiscussed above, what was their function and what promoted their proliferation ca 3000 yearsago? Was that function associated with risk of another nature, such as personal health andcomfort and the manufacture of skin cloaks for warmth?
terra australis 21
241
From numbers of sites and artefacts to habitation, subsistence and land-use patterns

In addition, the cost of failure — not killing an animal — is not known because thereis insufficient knowledge about alternative reliable food sources (plant and animal) in thecatchment. If such technological steps were taken to minimise the risk of failure/loss, itsuggests there were possibly fewer alternative reliable food sources than in the precedingperiod. The effect of the proposed vegetation changes on plant food sources needs to beexplored. Did some resources become more restricted or limited in availability andabundance, while others became more widespread and plentiful? Failure in the hunt may alsohave had a social cost to the hunters — their status as a hunter and food provider was at risk(e.g., Gould 1969: 17).
The series of archaeological changes that occurred at the beginning of the coldest-driest period (ca 3000 BP) differed from those at the end of the period. The decrease in the localartefact accumulation rate in the last 1000 years was not as great as the initial increase in thethird millennium BP. Although the decrease in the local artefact accumulation rate correlatesrelatively well in time with the change in the archaeological faunal assemblages, the decline inbacked artefacts began earlier — in the previous millennium, when ground-edgedimplements increased (Table 10.3, Figs 9.1, 10.2 and 10.6). The nature of these changes suggeststhat subsistence activities and their associated technologies did not return to those of previoustimes — a conclusion supported by other long-term changes in the stone artefact assemblages(e.g., the increasing use of bipolar technology) and the habitation distribution patterns. By ca1000 BP, social behaviour, including the nature of social interactions within and beyond theculture-area, was substantially different from that of the period preceding ca 3000 BP.
Social and territorial organisationDuring the first millennium BP, at the same time as technological solutions were being adopted tominimise newly encountered subsistence risk, social and territorial organisation within theregion and wider culture-area may have changed too. For example, the effects of modifications tothe nature and position of territorial boundaries of clans and language groups, as suggestedabove in relation to the increased use of bipolar core reduction, might have been offset bydeveloping and extending trading and political alliance networks (cf. Wiessner 1982a: 172–3;David and Lourandos 1998: 198, 212). The alliances, which may have begun initially manymillennia before as trading partnerships and networks based initially on relationships betweenindividuals (cf. Gamble 1998), eventually evolved together with the systems of kinship,exogamous marriage and ceremonial life into the social and territorial organisations that existedat the time of European contact. These networks and alliances, therefore, facilitated not only theprocurement of raw materials and the performance of ceremonies associated with religiousbeliefs, but also the sharing of subsistence risk by enabling people to move into the country ofother clans and language groups in times of hardship.
The late-Holocene archaeological record of the catchment could be interpreted as aseries of diverse measures implemented to minimise subsistence risk in a period of increasingclimatic variability — such measures incorporating both technological and social solutions.The dramatic increase in the local artefact accumulation rate ca 3000 BP and the substantialdecrease ca 1000 BP may be the consequence not only of an increase and subsequent decreasein the production of backed artefacts, but also of the increasing production and use of ground-edged implements and the increasing number of quartz pieces produced by bipolar core-reduction techniques. Such measures were only some of the actions taken to amelioratesubsistence risk at various points in time. Further research as outlined above is needed tosupport these claims, particularly those relating to the nature and timing of social andterritorial reorganisation, for which there is presently little unambiguous physical evidence.
What’s changing: population size or land-use patterns? The archaeology of Upper Mangrove Creek, Sydney Basin
terra australis 21
242

Conclusions and future research
In the course of investigating interpretations and explanations for the quantitative changes inthe catchment’s archaeological record — that is, the habitation and artefact indices — severalthemes have been explored. This has led to the production of explanatory models which willrequire evaluation and testing by future research.
The provisional assignment of individual ‘habitations’ as either home bases oractivity locations/transit camps, and their spatial distribution within the catchment indifferent periods of time, suggests that changing habitation and land-use patterns, involvingshifts in subsistence and mobility patterns, may explain the dramatic late-Holocene increasesin the habitation indices. Very few base camps were established during the early Holocene andit appears that it was not until the fourth millennium BP that increasing numbers of basecamps began to be established in the catchment — at a time when ground-edged implementsfirst appeared. Nevertheless, the third millennium BP stands out as a period when somethingdifferent occurred, with a substantial increase in base camps and a reversal in the ratio of basecamps to locations used only as activity locations or transit camps. The dramatic increases inthe habitation indices in the last 2000 years appear to be almost totally due to increases inactivity locations/transit camps and not in the numbers of base camps. However, activitylocations/transit camps are not assumed to be associated only with logistical movements, andconsequently are not taken as indicators of frequent logistical mobility and the transformationof foragers into collectors. The inhabitants of the Upper Mangrove Creek catchment continuedto be relatively mobile hunter-gatherers throughout the Holocene. Even so, the continuallychanging ‘habitation’ distribution pattern indicates that a reorganisation of mobility patterns(in the broadest meanings of the term) relating to camp life and subsistence activities tookplace in the catchment at frequent intervals and even more frequently and dynamically withinthe last 4000 years.
If the increasing use of bipolar core reduction in the catchment from ca 4000 BP wasrelated to a reduction in residential mobility, then to some extent this is paralleled in thehypothesised initial increase in the establishment of catchment base camps. The continuingincrease in the proportion of bipolar artefacts in the assemblages of the last 1000 years, however,is not paralleled by an increase in the number of catchment base camps. In addition, with presentdata, it cannot yet be established whether the dramatic increase in activity locations/transitcamps in the first millennium BP was associated with greater logistical mobility from within oroutside the catchment, or due to some other subsistence strategy. Changes in the abundance ofquartz, FGS, silcrete and tuff-type chert in the catchment assemblages suggest that access toand/or availability of non-local stone resources altered over time. Such restrictions may alsoaccount for the increased use of bipolar reduction techniques. The stone material changes mayhave been associated with variations in long-distance movements and/or trade, which wereinfluenced by changing territorial boundaries/trading networks and alliances, as well asculturally determined preferences in raw material use.
In summary, the long-term trends in the habitation indices and in the changingnumbers of base camps and activity locations, as well as the increasing use of bipolar corereduction, suggest there was a reorganisation of subsistence strategies and land-use patternsinvolving changes in habitation and possibly long-distance and local mobility patterns. Thechanges in habitation patterns and mobility may have been associated with climaticallyassociated environmental changes. Even the initial establishment of a base camp in Loggers inthe 12th millennium BP may have been part of a redistribution of populations as theyresponded to the rising sea-level, which by this time had reached the base of the presentcoastal clifflines and was extending further up the palaeo-Hawkesbury River Valley.
terra australis 21
243
From numbers of sites and artefacts to habitation, subsistence and land-use patterns
Comparison of the timing of late-Holocene climatic changes with trends in the habitationindices (Fig. 9.1) shows that dramatic changes in the latter did not correlate with the onset ofthe increasingly colder and drier conditions (which began ca 4000–3500 years ago), the periodthat was much colder and drier than the present (ca 3000 BP to ca 1800 BP), or the onset of thecurrent El Niño mode of operation (ca 3000 BP). However, the initial increase in theestablishment of base camps in the fourth millennium BP does coincide with the onset ofcolder–drier conditions. In addition, the major increase in base camp numbers and the localartefact accumulation rate correlate with the beginning of the coldest-driest Holocene periodin the third millennium BP. The warmer-wetter conditions of the last 1000 years were notmatched by a return to a smaller number of base camps, though artefact numbers decreased insome. More detailed studies of the stone artefact assemblages and ‘intensity of site use’ arerequired before concluding that these correlations reflect greater rockshelter use — whether inresponse to demographic pressures or the need for greater protection from the weather whichthey would have provided.
The changing Holocene climatic conditions, particularly the period of coldest-driestconditions in the late-Holocene, which brought about changes in the catchment’s vegetationpatterns and in the catchment’s macropod population, is also seen as the impetus for theadoption of a series of risk minimisation strategies (cf. Torrence 2001: 94). These strategies,which were designed to minimise or avoid subsistence risk, initially involved the introductionof ground-edged implements and greatly increased production of backed artefacts possiblyused as spear points and barbs, as well as changes in local and long-distance mobility patternswhich are reflected in the increasing use of bipolar core reduction. These changes to the tool-kit and stone reduction techniques probably only partially explain the dramatic increase in thelocal artefact accumulation rate in the third millennium BP and the continuing high rate in thesecond millennium BP.
The substantial decrease in the local artefact accumulation rate in the first millenniumBP can, again, be explained only partially by changes in the tool-kit and technology, such as thereduced production of backed artefacts, the effects of which may have been offset partially bythe increasing manufacture and use of ground-edged tools and bipolar pieces. It is likely thatsubsistence risk was also minimised by the adoption of social solutions which enabled greatermobility (residential, logistical and long-distance) and reciprocity of subsistence resources atthe inter- and intra-group level. During this period, network systems based on kinship, trade,ceremonial responsibilities and obligations, and political alliances may have attained the levelof organisation and complexity similar to that observed at the time of British colonisation, eventhough these systems and alliances had their origins many millennia in the past.
The decreased local artefact accumulation rate may also represent decreasedcatchment use. Decreasing population seems an unlikely correlate of increasingly warmer-wetter conditions if these ‘ameliorating’ conditions were associated with an increasingabundance of food sources. However, if this was the case, a decline in the catchment populationcould represent a redistribution of the regional population which led to higher densities in thecoastal zone where fish-hooks were introduced some 900 years ago (Attenbrow et al. 1998).Adoption of this small implement may have enabled the resources of the ocean shoreline,estuaries and lagoons to be more efficiently harvested. Such a scenario could accommodate areduction in catchment use in the last 1000 years, however, demographic change does not haveto be invoked to explain or interpret the quantitative changes in the catchment’s archaeologicalrecord.
The foregoing models go part way to understanding and interpreting the catchment’sarchaeological record, in terms of the use of habitations, the land and its resources. Onlyselected data sets were incorporated: the habitations as places where a variety of activities or
What’s changing: population size or land-use patterns? The archaeology of Upper Mangrove Creek, Sydney Basin
terra australis 21
244

functions were undertaken and between which people moved in their daily lives; bipolar corereduction as a measure of mobility; and backed artefacts and ground-edged implements as aresponse to subsistence risk. Each of the studies presented here has looked at different aspectsof life and material culture.
Further research using other data sets and with other theoretical contexts is requiredto establish the strength of the models. Such studies could begin by testing the proposedhabitation and land-use model by reanalysing the excavated assemblages to identify thefunctions of each habitation in each millennium and the activities which took place insidethem. Secondly, they would investigate the artefact accumulation rates in individualhabitations to explore ‘intensity of site use’, and, thirdly, they would involve spatial analysesincorporating all archaeological traits in the catchment. Additional studies are also needed toinvestigate the use, availability and accessibility of the various stone materials to test whetherreasons for the increasing use of bipolar core reduction techniques are solely reducedresidential mobility, or involve restricted access to distant raw materials. In the context of riskminimisation, it is essential to have more detailed palaeo-ecological data about past vegetationand faunal changes and the availability and abundance of food resources, which will allowidentification of options and constraints in different periods of time (cf. Jochim 1989: 108; Vethet al. 2000: 60, 62). Such data would assist in assessing the level of subsistence risk that mayhave existed. Similarly, the nature of Aboriginal burning regimes in the past and the effect thatthe people themselves may have had on the vegetation and faunal populations of thecatchment also requires further research.
Ideally, and eventually, it will be fruitful to look at the various strands of thecatchment’s archaeological record as an integrated body of data (cf. Nelson 1991: 57–8, 89–90):all archaeological traits and their assemblages, all materials and manufacturing processes andthe tool-kit. Ultimately, they are all related — just as the behaviours and processes that createdthem were interrelated. For example, with mobility and risk, the degree of risk involved inacquiring a certain resource may influence adoption of particular mobility patterns (Myers1989: 84, 90–1; Odell 1996: 53; Torrence 1989a: 61–2, 2001: 88). However, before that can bedone, studies of individual aspects of the various archaeological traits and excavated materials(faunal remains as well as stone assemblages, sediments and charcoal) are needed. In addition,the catchment has to be set in a wider regional context taking into account changes along thecoast and other parts of the region.
While many questions remain to be addressed, this study reaffirms that a region’sprehistory cannot be portrayed on the evidence from a single site or a few selected sites. It isnot sufficient to look at only habitation indices or only artefact accumulation rates in isolation,particularly when investigating long-term regional habitation, land- and resource-usepatterns. I agree with Lourandos (1996: 17–18) that general trends in the use and establishmentof habitations must be differentiated from those of stone artefacts, but stone artefacts are not a‘subsidiary indicator’ to sites in regional studies seeking to identify long-term trends inhabitation and land-use patterns. Both habitation and artefact indices, as well as the natureand diversity of artefact assemblages, and habitation function and distribution patterns, needto be taken into account whether demographic-change or behavioural-change explanationsare proposed as part of a region’s prehistory.
terra australis 21
245
From numbers of sites and artefacts to habitation, subsistence and land-use patterns


terra australis 21
247
Allen, H. 1972. Where the Crow Flies Backward. Man and Land in the Darling Basin. Unpublished PhDthesis, Australian National University, Canberra.
Allen, H. 1990. Environmental history in south-western New South Wales during the Late Pleistocene.In C. Gamble and O. Soffer (eds), The World at 18,000 BP, Vol. 2: Low Latitudes, pp. 296–321.Unwin Hyman.
Allen, H. 1996. The time of the mangroves: changes in mid-Holocene estuarine environments andsubsistence in Australia and Southeast Asia. In I. C. Glover and P. Bellwood (eds), Indo-PacificPrehistory: The Chiang Mai Papers, Vol. 2, Indo-Pacific Prehistory Association Bulletin 15: 193–205.
AMBS (Australian Museum Business Services). 2002a. Archaeological Salvage Excavation of Site HVS38(37-5-167), Riverview Mine, Hunter Valley. Report to Coal and Allied Pty Ltd, Singleton.
AMBS (Australian Museum Business Services). 2002b. Liverpool–Parramatta Transitway (LPT). OrphanSchool Creek Archaeological Test Excavations. Unpublished report to the Roads and TrafficAuthority Transitway.
AMBS (Australian Museum Business Services). 2002c. Parklea Leisure Centre Stage I. ArchaeologicalInvestigation of Site PK/PC6. Vol. 1: Main Report. Unpublished report prepared for BlacktownCity Council.
AMBS (Australian Museum Business Services). 2002d. Warkworth Mine Western ExtensionArchaeological Assessment of Aboriginal Heritage. Unpublished report to Coal and AlliedPty Ltd, Singleton.
AMBS (Australian Museum Business Services). 2003. Extension of West Pit, Hunter Valley Operations.Archaeological Assessment. Unpublished report to Coal and Allied Operations Pty Ltd,Singleton.
Ammerman, A. J., L. L. Cavalli-Sforza and D. K. Wagener. 1976. Toward the estimation of populationgrowth in Old World prehistory. In E. B. W. Zubrow (ed.), Demographic Anthropology. QuantitativeApproaches, pp. 27–61. Albuquerque: University of New Mexico Press.
Andrefsky, W., Jr. 1998. Lithics. Macroscopic Approaches to Analysis. Cambridge University Press.Aplin, K. 1981. Faunal Remains from Archaeological Sites in Mangrove Creek Catchment. Appendix 4 in V.
Attenbrow, Mangrove Creek Dam Salvage Excavation Project, Vol. 2. Unpublished report toNSW National Parks and Wildlife Service on behalf of NSW Department of Public Works.
References

terra australis 21
248
References
Aplin, K. 1985. Faunal Remains from Archaeological Sites in the Mangrove Creek Catchment. ReportNo 3. The Random Sampling Units. Appendix 6B in V. Attenbrow, 1987, The Upper MangroveCreek Catchment. A Study of Quantitative Changes in the Archaeological Record.Unpublished PhD thesis, University of Sydney.
Aplin, K. and K. Gollan. 1982. Faunal Remains from Archaeological Sites in the Mangrove CreekCatchment II: The Deep Creek Fauna. Appendix 3 in V. Attenbrow, ArchaeologicalInvestigation of Deep Creek Shelter, Mangrove Creek Dam. Unpublished report to NSWNational Parks and Wildlife Service on behalf of NSW Department of Public Works.
Attenbrow, V. 1976. Aboriginal Subsistence Economy on the Far South Coast of New South Wales,Australia. Unpublished BA(Hons) thesis, University of Sydney.
Attenbrow, V. 1980. Loggers Shelter, Upper Mangrove Creek, near Sydney. Australian Archaeology 11:25–7.
Attenbrow, V. 1981. Mangrove Creek Dam Salvage Excavation Project. 2 vols. Unpublished report to NSW National Parks and Wildlife Service on behalf of NSW Department of Public Works.
Attenbrow, V. 1982a. Archaeological Investigation of Deep Creek Shelter, Mangrove Creek Dam.Unpublished report to NSW National Parks and Wildlife Service on behalf of NSWDepartment of Public Works.
Attenbrow, V. 1982b. The archaeology of Upper Mangrove Creek catchment: research in progress. In S.Bowdler (ed.), Coastal Archaeology in Eastern Australia. Proceedings of the 1980 Valla Conference onAustralian Prehistory, pp. 67–78. Canberra: Department of Prehistory, Research School ofPacific Studies, Australian National University.
Attenbrow, V. 1982c. Loggers Shelter, Mangrove Creek Dam. Documentation of Fourth Season ofFieldwork — September 1981. Unpublished report to NSW National Parks and WildlifeService.
Attenbrow, V. 1984. Welcome Reef Dam Project. Investigations into Aboriginal Archaeological Sites —Stage II. Unpublished report to the Metropolitan Water Sewerage and Drainage Board,Sydney.
Attenbrow, V. 1987. The Upper Mangrove Creek Catchment. A Study of Quantitative Changes in theArchaeological Record. Unpublished PhD thesis, University of Sydney.
Attenbrow, V. 1992a. Port Jackson Archaeological Project — Stage II. Work carried out between January1990 and 30 June 1992. Unpublished report to Australian Institute of Aboriginal and TorresStrait Islander Studies, Canberra.
Attenbrow, V. 1992b. Shell bed or shell midden. Australian Archaeology 34: 3–21.Attenbrow, V. 1993. Preliminary Report on 1993 Excavations at Balmoral Beach 2. Port Jackson
Archaeological Project — Stage II. Unpublished report for NSW National Parks and WildlifeService, Sydney, and Australian Institute of Aboriginal and Torres Strait Islander Studies,Canberra.
Attenbrow, V. 1994. Port Jackson Archaeological Project — Stage II (1993). Work undertaken betweenJanuary 1993 and March 1994. Unpublished final report to Australian Institute of Aboriginaland Torres Strait Islander Studies, Canberra.
Attenbrow, V. 1995. Port Jackson Archaeological Project — Stage II (1994). Work undertaken betweenApril 1994 and August 1995. Unpublished final report (with additions and amendments 1996)to Australian Institute of Aboriginal and Torres Strait Islander Studies, Canberra.
Attenbrow, V. 1997 [1998]. The Upper Mangrove Creek Catchment, near Gosford/Wyong, NSW —Open Archaeological Deposits. Unpublished report to the Australian Museum and NSWNational Parks and Wildlife Service, Sydney.
Attenbrow, V. 2002. Sydney’s Aboriginal Past. Investigating the Archaeological and Historical Records.Sydney: UNSW Press.
Attenbrow, V.J. 2003–2004. Potential archaeological deposits in the storage area of the Mangrove CreekDam in the NSW Central Coast. Newsletter of the Australian Association of ConsultingArchaeologists 94: 17–18

Attenbrow, V. and B. Conyers. 1983. Off Bindea Street, Bonnet Bay. Proposed Residential Subdivision.Report on Archaeological Investigations. Unpublished report to Stocks and Holdings Pty Ltd,Sydney.
Attenbrow, V., B. David and J. Flood. 1995. Mennge-ya and the origins of points: new insights into theappearance of points in the semi-arid zone of the Northern Territory. Archaeology in Oceania30(3): 105–20.
Attenbrow, V., R. Fullagar and C. Szpak. 1998. Stone files and shell fish-hooks in south-easternAustralia. In R. Fullagar (ed.), A Closer Look: Recent Australian Studies of Stone Tools, pp. 127–48.Sydney University Archaeological Methods Series 6. Sydney: Archaeological ComputingLaboratory, School of Archaeology, University of Sydney.
Attenbrow, V. and P. Hughes. 1983. Welcome Reef Dam Project: Preliminary Investigations intoAboriginal Archaeological Sites. Unpublished report to the Metropolitan Water Sewerage andDrainage Board, Sydney.
Attenbrow, V. and T. Negerevich. 1981. Lucas Heights Waste Disposal Depot: Proposed Extensions.Aboriginal Sites in Bardens Creek Valley. Unpublished report to the Metropolitan WasteDisposal Authority, Sydney.
Attenbrow, V. and T. Negerevich. 1984. The assessment of sites. Lucas Heights Waste Disposal Depot: acase study. In S. Sullivan and S. Bowdler (eds), Site Surveys and Significance Assessment inAustralian Archaeology, pp. 136–51. Canberra: Department of Prehistory, Research School ofPacific Studies, Australian National University.
Attenbrow, V. and D. Steele. 1995. Fishing in Port Jackson, New South Wales — more than met the eye.Antiquity 69 (262): 47–60.
Bahn, P. G. 1983. Late Pleistocene economies of the French Pyrenees. In G. Bailey (ed.), Hunter-GathererEconomy in Prehistory: A European Perspective, pp. 168–86. Cambridge University Press.
Bailey, G. N. 1983a. Concepts of time in Quaternary prehistory. Annual Review of Anthropology 12: 165–92.Bailey, G. 1983b. Economic change in late Pleistocene Cantabria. In G. Bailey (ed.), Hunter-Gatherer
Economy in Prehistory: A European Perspective pp. 149–65. Cambridge University Press.Bailey, G. 1983c. Hunter-gatherer behaviour in prehistory: problems and perspectives. In G. Bailey (ed.),
Hunter-Gatherer Economy in Prehistory: A European Perspective, pp. 1–6. Cambridge UniversityPress.
Bailey, G. (ed.), 1983d. Hunter-Gatherer Economy in Prehistory: A European Perspective. Cambridge UniversityPress.
Bailey, G., P. Carter, C. Gamble and H. Higgs. 1983. Epirus revisited: seasonality and inter-site variationin the Upper Palaeolithic of north-west Greece. In G. Bailey (ed.), Hunter-Gatherer Economy inPrehistory: A European Perspective, pp. 64–78. Cambridge University Press.
Baker, N. 1992. NSW National Parks and Wildlife Service Hunter Valley Aboriginal Sites AssessmentProject: Stone Artefact Assessment and Analysis — Recording Techniques and Methodology.Unpublished report to the NSW National Parks and Wildlife Service.
Baker, N. 1994. Analysis of Stone Artefacts from Site W6, Sandy Hollow Creek, Warkworth, HunterValley, NSW. Report to Haglund and Associates for Warkworth Mining Ltd.
Baker, N. 2000. Mungerie Park Town Centre. Archaeological Salvage Excavations near Kellyville,Cumberland Plain, NSW. 2 vols. Unpublished report by Australian Museum BusinessServices to the Department of Urban Affairs and Planning, Sydney.
Baker, N. and G. Martin. 2001. Salt Ash Air Weapons Range Aboriginal Heritage Assessment forEnvironmental Assessment Report. Unpublished report by Australian Museum BusinessServices to URS Australia Pty Ltd for the Department of Defence.
Baker, R., S. Feary and P. J. Hughes. 1984. An Archaeological Assessment of Two Proposed Sand MiningAreas at Lake Bathurst, NSW. Unpublished report to Mr L. Maas, ‘Gilmour’, via LakeBathurst, NSW.
Baker, R. G. V. and R. J. Haworth. 1997. Further evidence from relic shellcrust sequences for a late-Holocene higher sea level for eastern Australia. Marine Geology 141: 1–9.
terra australis 21
249
References

Baker, R. G. V. and R. J. Haworth. 1999. Evidence for the nature of late-Holocene sea level fall on theNew South Wales coast from fixed biological indicators: was the fall smooth or fluctuating? InJ. A. Kesby, J. M. Stanley, R. F. McLean and L. J. Olive (eds), Geodiversity: Readings in AustralianGeography at the Close of the 20th Century, pp. 351–9. School of Geography and Oceanography,University College, University of New South Wales, Australian Defence Force Academy,Canberra, on behalf of the Institute of Australian Geographers Inc., Canberra.
Baker, R. G. V. and R. J. Haworth. 2000a. Smooth or oscillating late-Holocene sea level curve? Evidencefrom cross-regional statistical regressions of fixed biological indicators. Marine Geology 163:353–65.
Baker, R. G. V. and R. J. Haworth. 2000b. Smooth or oscillating late-Holocene sea level curve? Evidencefrom the palaeo-zoology of fixed biological indicators in east Australia and beyond. MarineGeology 163: 367–86.
Balme, J. 2000. Excavations revealing 40,000 years of occupation at Mimbi Caves, south centralKimberley, Western Australia. Australian Archaeology 51: 1–5.
Bamforth, D. B. 1986. Technological efficiency and tool curation. American Antiquity 51 (1): 38–50.Bamforth, D. B. 1991. Technological organisation and hunter-gatherer land use: a California example.
American Antiquity 56 (2): 216–34.Bamforth, D. B. and P. Bleed. 1997. Technology, flaked stone technology, and risk. In C. M. Barton and G.
A. Clark (eds), Rediscovering Darwin: Evolutionary Theory and Archaeological Explanation, pp.109–39. Arlington: American Anthropological Association.
Barbetti, M., T. Bird, G. Dolezal, G. Taylor, R. Francey, E. Cook and M. Peterson. 1992. Radiocarbonvariations from Tasmanian conifers: first results from late Pleistocene and Holocene logs.Radiocarbon 34 (3): 806–17.
Barker, B. C. 1991. Nara Inlet 1: coastal resource use and the Holocene marine transgression in theWhitsunday Islands, central Queensland. Archaeology in Oceania 26 (3): 102–9.
Barker, G. W. W. 1975. Prehistoric territories and economies in central Italy. In E.S. Higgs (ed.),Palaeoeconomy, pp. 111–75. Cambridge University Press.
Barrallier, F. 1801. Letter to Greville, precise date unknown, as translated in part by Greville. BanksPapers–Brabourne Papers, Vol. 4, pp. 78e–83. ML: FM4 1747. Reproduced in A. McQueen,1993, Blue Mountains to Bridgetown. The Life and Journeys of Barrallier 1773–1853. Appendix 2:Report on Bass Strait and the Hunter River, pp. 131–3. Springwood: Andy McQueen.
Barton, H. 2000. The behaviour of raw materials or the behaviour of hunter-gatherers? In T. Denhamand S. Blau (eds), National Archaeology Students’ Conference. Proceedings of the Second NationalArchaeology Students’ Conference, pp. 37–41. Canberra: School of Archaeology and Anthropology,Australian National University.
Beaton, J. M. 1977. Dangerous Harvest. Investigations in Late Prehistoric Occupation of Upland South-east Central Queensland. Unpublished PhD thesis, Australian National University, Canberra.
Beaton, J. M. 1982. Fire and water: aspects of Australian Aboriginal management of Cycads. Archaeologyin Oceania 17 (1): 51–8.
Beaton, J. M. 1983. Does Intensification account for changes in the Australian Holocene archaeologicalrecord? Archaeology in Oceania 18 (2): 94–7.
Beaton J. M. 1985. Evidence for a coastal occupation time-lag at Princess Charlotte Bay (NorthQueensland) and implications for coastal colonisation and population growth theories forAboriginal Australia. Archaeology in Oceania 20 (1): 1–20.
Beaton, J. M. 1990. The importance of past population for prehistory. In B. Meehan and N. White (eds),Hunter-Gatherer Demography. Past and Present, pp. 23–40. Oceania Monograph 39. Sydney:University of Sydney.
Bender, B. 1978. Gatherer-hunter to farmer: a social perspective. World Archaeology 10 (2): 204–22.Benson, D. H. 1978. Vegetation Survey of Upper Mangrove Creek, Wyong, NSW. Unpublished
typescript, National Herbarium of New South Wales, Royal Botanic Gardens, Sydney.Bettinger, R. L. 1977. Aboriginal human ecology in Owens Valley: prehistoric change in the Great Basin.
American Antiquity 42 (1): 3–17.
terra australis 21
250
References

terra australis 21
251
References
Bettinger, R. L. 1981. Sampling and statistical inference in Owens Valley. American Antiquity 46 (3):656–60.Bettinger, R. L. 1991. Hunter–Gatherers. Archaeological and Evolutional Theory. New York: Plenum Press.Binford, L. R. 1968. Post-Pleistocene adaptations. In S. R. Binford and L. R. Binford (eds), New Perspectives
in Archaeology, pp. 313–41. Atherton: Aldine.Binford, L. R. 1973. Interassemblage variability — the Mousterian and the ‘functional’ argument. In C.
Renfrew (ed.), The Explanation of Culture Change: Models in Prehistory, pp. 227–54. London:Duckworth.
Binford, L. R. 1975. Sampling, judgment, and the archaeological record. In J.W. Mueller (ed.), Samplingin Archaeology, pp. 251–7. Tucson: University of Arizona Press.
Binford, L. R. 1977. Forty-seven trips. A case study in the character of archaeological formation processes.In R. V. S. Wright (ed.), Stone Tools as Cultural Markers: Change, Evolution and Complexity,pp. 24–36. Canberra: Australian Institute of Aboriginal Studies and New Jersey: HumanitiesPress Inc.
Binford, L. R. 1978. Dimensional analysis of behaviour and site structure: learning from an Eskimohunting stand. American Antiquity 43 (3): 330–61.
Binford, L. R. 1980. Willow smoke and dogs’ tails: hunter-gatherer settlement systems and archaeologicalsite formation. American Antiquity 45 (1): 4–20.
Binford, L. R. 1982. The archaeology of place. Journal of Anthropological Archaeology 1 (1): 5–31.Binford, L. R. 1983. Long-term land-use patterning: some implications for archaeology. In L.R. Binford
(ed.), Working at Archaeology, pp. 379–86. Academic Press.Binford, L. R. and J. O’Connell. 1984. An Alyawara day: the stone quarry. Journal of Archaeological
Research 40: 406–32.Bird, C. F. M. and D. Frankel. 1991a. Chronology and explanation in western Victoria and south-east
South Australia. Archaeology in Oceania 26 (1): 1–16.Bird, C. F. M. and D. Frankel. 1991b. Problems in constructing a prehistoric regional sequence: Holocene
south-east Australia. World Archaeology 23 (2): 179–92.Bird, C. F. M. and D. Frankel. 2001. Excavations at Koongine Cave: Lithics and land-use in the terminal
Pleistocene and Holocene of South Australia. Proceedings of the Prehistoric Society 67: 49–83.Bird, C. F. M., D. Frankel and N. van Waarden. 1998. New radiocarbon determinations from the
Grampians-Gariwerd region, western Victoria. Archaeology in Oceania 33 (1): 31–6.Birdsell, J. B. 1953. Some environmental and cultural factors influencing the structuring of Australian
Aboriginal populations. American Naturalist 87 (834): 171–207. Birdsell, J. B. 1957. Some population problems involving Pleistocene man. Cold Spring Harbor Symposia
on Quantitative Biology 22: 47–69.Birdsell, J. B. 1971. Australia. Ecology, spacing mechanisms and adaptive behaviour in Aboriginal land
tenure. In R. Crocombe (ed.), Land Tenure in the Pacific, pp. 334–61. London: Oxford UniversityPress.
Birdsell, J. B. 1977. The recalibration of a paradigm for the first peopling of greater Australia. In J. Allen,J. Golson and R. Jones (eds), Sunda and Sahul. Prehistoric Studies in Southeast Asia, Melanesia andAustralia, pp. 113–67. Academic Press.
Blackwell, A. 1982. Bowen Island: further evidence for economic change and intensification on thesouth coast of New South Wales. In S. Bowdler (ed.), Coastal Archaeology in Eastern Australia.Proceedings of the 1980 Valla Conference on Australian Prehistory, pp. 46–51. Canberra: Departmentof Prehistory, Research School of Pacific Studies, Australian National University.
Bleed, P. 1986. The optimal design of hunting weapons: maintainability or reliability? AmericanAntiquity 51 (4): 737–47.
Blong, R. J. and R. Gillespie. 1978. Fluvially transported charcoal gives erroneous 14C ages for recentdeposits. Nature 271 (5647): 739–41.
Bonhomme, T. 1984. An archaeological survey of Boomerang Creek, Mangrove Creek Dam Catchment,NSW. Unpublished report to Gutteridge Haskins and Davey Pty Ltd for the NSW Departmentof Public Works.
Bonhomme, T. 1985. Excavation of An Aboriginal Open Site at Boomerang Creek, Mangrove Creek Dam,NSW. Unpublished report for the NSW Department of Public Works (Gosford/Wyong).

Boot, P. G. 1993a. Analysis of resins and other plant residues on stone artefacts from Graman, NewSouth Wales. In B. L. Fankhauser and J. R. Bird (eds), Archaeometry: Current AustralasianResearch, pp. 3–12. Canberra: Department of Prehistory, Research School of Pacific Studies,Australian National University.
Boot, P. 1993b. Pleistocene date from archaeological excavations in the hinterlands of the New SouthWales south coast. Australian Archaeology 37: 59.
Boot, P. 1994. Recent research into the prehistory of the hinterland of the south coast of New SouthWales. In M. Sullivan, S. Brockwell and A. Webb (eds), Archaeology in the North. Proceedings ofthe 1993 Australian Archaeological Association Conference, pp. 319–40. Darwin: North AustraliaResearch Unit, Australian National University.
Boot, P. 1996a. Aspects of prehistoric change in the south coast hinterland of New South Wales. In S.Ulm, I. Lilley and A. Ross (eds), Australian Archaeology ’95. Proceedings of the 1995 AustralianArchaeological Association Annual Conference, pp. 63–79. Tempus 6. St Lucia, Brisbane: AnthropologyMuseum, University of Queensland.
Boot, P. 1996b. Pleistocene sites in the south coast hinterland of New South Wales. In S. Ulm, I. Lilleyand A. Ross (eds), Australian Archaeology ’95. Proceedings of the 1995 Australian ArchaeologicalAssociation Annual Conference, pp. 275–88. St Lucia, Brisbane: Tempus 6. Anthropology Museum,University of Queensland.
Bowdler, S. 1970. Bass Point: The Excavation of a South-east Australian Shell Midden showing Culturaland Economic Change. BA(Hons) thesis, University of Sydney.
Bowdler, S. 1971. Balls Head: The excavation of a Port Jackson rock shelter. Records of the AustralianMuseum 28 (7): 117–28.
Bowdler, S. 1976. Hook, line, and dilly bag: an interpretation of an Australian coastal shell midden.Mankind 10 (4): 248–58.
Bowdler, S. 1981. Hunters in the highlands: Aboriginal adaptations in the eastern Australian uplands.Archaeology in Oceania 16 (2): 99–111.
Bowdler, S. 1983. Aboriginal Sites in the Megalong, Kanimbla and Hartley Valleys, New South Wales.Unpublished report for Roland Breckwoldt.
Bowdler, S. 1993. Views of the past in Australian prehistory. In M. Spriggs, D. E. Yen, W. Ambrose, R.Jones, A. Thorne and A. Andrews (eds), A Community of Culture. The People and Prehistory of thePacific, pp. 123–38. Canberra: Department of Prehistory, Research School of Pacific Studies,Australian National University.
Bowler, J. M. 1976. Recent developments in reconstructing late Quaternary environments in Australia.In R. L. Kirk and A. G. Thorne (eds), The Origin of the Australians, pp. 55–77. Canberra:Australian Institute of Aboriginal Studies, and New Jersey: Humanities Press Inc.
Bowler, J. M., G. S. Hope, J. N. Jennings, G. Singh and D. Walker. 1976. Late Quaternary climates ofAustralia and New Guinea. Quaternary Research 6: 359–94.
Bowler, J. M., R. Jones, H. Allen and A. G. Thorne. 1970. Pleistocene human remains from Australia:a living site and human cremation from Lake Mungo, western New South Wales. WorldArchaeology 2 (1): 39–60.
Boydston, R. A. 1989. A cost–benefit study of functionally similar tools. In R. Torrence (ed.), Time, Energyand Stone Tools, pp. 67–77. Cambridge University Press.
Bradley, W. 1786–1792 [1969]. A Voyage to New South Wales, The Journal of Lieutenant William Bradley RN ofHMS Sirius 1786–1792. Facsimile reproduction of original manuscript and charts, the Trusteesof the Public Library of New South Wales in association with Ure Smith Pty Ltd, Sydney.
Branagan, D. F. and J. V. S. Megaw. 1969. The lithology of a coastal Aboriginal settlement atCurracurrang, NSW. Archaeology and Physical Anthropology in Oceania 4 (1):1–17.
Brayshaw, H. 1986. Aborigines of the Hunter Valley. A Study of Colonial Records. Scone, NSW: Scone andUpper Hunter Historical Society.
Butler, R. H. 2000. Bone Mineral Density of Macropodidae: Implications for the Interpretation ofArchaeological Assemblages. An Example from the Deep Creek Faunal Assemblage.Unpublished BA(Hons) thesis, La Trobe University, Melbourne.
Byrne, D. 1983. The Five Forests: An Archaeological and Anthropological Investigation. 2 vols. NSW NationalParks and Wildlife Service.
terra australis 21
252
References

terra australis 21
253
References
Byrne, D. 1984. A survey strategy for a coastal forest. In S. Sullivan and S. Bowdler (eds), Site Surveys andSignificance Assessment in Australian Archaeology, pp. 61–70. Canberra: Department ofPrehistory, Research School of Pacific Studies, Australian National University.
Callaghan, M. 1980. Some previously unconsidered environmental factors of relevance to south coastprehistory. Australian Archaeology 11: 43–9.
Capell, A. 1970. Aboriginal languages in the south central coast, New South Wales: fresh discoveries.Oceania 41:20–7.
Cashdan, E. 1983. Territoriality among human foragers: ecological models and an application to fourBushman groups. Current Anthropology 24 (1): 47–66.
Cashdan, E. 1985. Coping with risk: reciprocity among the Basarwa of Northern Botswana. Man 20 (n.s.)(3): 454–74.
Chang, K. C. 1972. Settlement Patterns in Archaeology. An Addison-Wesley Module in Anthropology 24:1–26.
Chapman, D. M., M. Geary, P. S. Roy and B. G. Thom. 1982. Coastal Evolution and Coastal Erosion in NewSouth Wales. A report prepared for the Coastal Council of New South Wales, Sydney.
Chappell, J. 1982. Sea levels and sediments: some features of the context of coastal archaeological sitesin the tropics. Archaeology in Oceania 17 (2): 69–78.
Chappell, J. 1983. Sea level changes, 0 to 40KA. In J. M. A. Chappell and A. Grindrod (eds), Climanz.Proceedings of the First Climanz Conference, pp. 121–2. Canberra: Department of Biogeographyand Geomorphology, Research School of Pacific Studies, Australian National University.
Chappell, J. M. A. and A. Grindrod (eds). 1983a. Climanz. Proceedings of the First Climanz Conference.Canberra: Department of Biogeography and Geomorphology, Research School of PacificStudies, Australian National University.
Chappell, J. M. A. and A. Grindrod. 1983b. 32 +/- 5KA: review. In J. M. A. Chappell and A. Grindod(eds), Climanz. Proceedings of the First Climanz Conference, pp. 1–3. Canberra: Department ofBiogeography and Geomorphology, Research School of Pacific Studies, Australian NationalUniversity.
Chappell, J. M. A. and A. Grindrod. 1983c. 25–20KA review. In J. M. A. Chappell and A. Grindod (eds),Climanz. Proceedings of the First Climanz Conference, pp. 27–28. Canberra: Department ofBiogeography and Geomorphology, Research School of Pacific Studies, Australian NationalUniversity.
Chappell, J. M. A. and A. Grindrod. 1983d. 7 +/- 2KA review. In J. M. A. Chappell and A. Grindod (eds),Climanz. Proceedings of the First Climanz Conference, pp. 87–88. Canberra: Department ofBiogeography and Geomorphology, Research School of Pacific Studies, Australian NationalUniversity.
Chenhall, R. G. 1975. A rationale for archaeological sampling. In J. W. Mueller (ed.), Sampling inArchaeology, pp. 3–25. Tucson: The University of Arizona Press.
Chippindale, C. 2001. What are the right words for rock-art in Australia? Australian Archaeology 53:12–15.Clark, G. A. and L. G. Strauss. 1983. Late Pleistocene hunter-gatherer adaptations in Cantabrian Spain.
In G. Bailey (ed.), Hunter-Gatherer Economy in Prehistory: A European Perspective, pp. 131–48.Cambridge University Press.
Clarkson, C. 2001. Technological change in Wardaman Country: a report on the 1999 field season.Australian Aboriginal Studies 2001/1: 63–8.
Clarkson, C. 2002. Holocene scraper reduction, technological organisation and landuse at IngaladdiRockshelter, Northern Australia. Archaeology in Oceania 37 (2): 79–86.
Clegg, J. K. 1965. A note on the stone industry of Cathedral Cave, Carnarvon Gorge, Queensland.Mankind 6 (5): 237.
Clegg, J. K. 1977. The four dimensions of artifactual variation. In R. V. S. Wright (ed.), Stone Tools asCultural Markers: Change, Evolution and Complexity, pp. 60–66. Canberra: Australian Institute ofAboriginal Studies, and New Jersey: Humanities Press Inc.
Clegg, J. 1984. The evaluation of archaeological significance: prehistoric pictures and/or rock art. In S.Sullivan and S. Bowdler (eds), Site Surveys and Significance Assessment in AustralianArchaeology, pp. 10–18. Canberra: Department of Prehistory, Research School of PacificStudies, Australian National University.

Clegg, J. 1985. Comments on: The interpretation of prehistoric art, by David Groenfeldt. Rock ArtResearch 2 (1): 35–45.
Cogger, H. 2000. 6th ed. Reptiles and Amphibians of Australia. Sydney: Reed New Holland.Colhoun, E.A. 1983. The climate of Tasmania 7 ± 2KA BP. In J. M. A. Chappell and A. Grindrod (eds),
Climanz. Proceedings of the First Climanz Conference, pp. 93–4. Canberra: Department ofBiogeography and Geomorphology, Research School of Pacific Studies, Australian NationalUniversity.
Colley, S. 1997. A pre- and post-contact Aboriginal shell midden at Disaster Bay, New South Wales southcoast. Australian Archaeology 45: 1–19.
Collier, S. 1976. Report on Archaeological Impact Survey of the Proposed Gosford-Wyong Water Supply.Unpublished report to the NSW Department of Public Works.
Collins, D. 1798 [1975]. An Account of the English Colony in New South Wales Vol. 1. Edited by B. H.Fletcher. The Strand, London: T. Cadell Jr, and W. Davies. [Republished by A. H. and A. W.Reed in association with the Royal Australian Historical Society, Sydney.]
Colson, E. 1979. In good years and in bad: food strategies of self-reliant societies. Journal of AnthropologicalResearch 35 (1): 18–29.
Commonwealth Bureau of Meteorology. 2003. http: //www.bom.gov.au/climate/averages/tables/cw_061029.shtm
Conkey, M. W. 1978. Style and information in cultural evolution: towards a predictive model for thePaleolithic. In C. L. Redman, M. J. Berman, E. V. Curtin, W. T. Langhorne Jr, N. M. Versaggi andJ. C. Wanser (eds), Social Archaeology. Beyond Subsistence and Dating, pp. 61–85. Academic Press.
Conkey, M. W. 1984. To find ourselves: art and social geography of prehistoric hunter gatherers. In C.Schrire (ed.), Past and Present in Hunter Gatherer Studies, pp. 253–76. Academic Press.
Corkill, T. 1995. Aboriginal Archaeology of M2 Motorway. Test Excavation and Significance Assessmentof Rockshelter PAD X/CF6, Darling Mills State Forest, Carlingford, NSW. Unpublished reportto Roads and Transport Authority of NSW, Sydney.
Corkill, T. and J. Edgar. 1996. Aboriginal Archaeology of M2 Motorway Salvage Excavation ofRockshelter Site CF6, Darling Mills State Forest, Carlingford, NSW. Unpublished report toNSW Roads and Traffic Authority, Sydney.
Cosgrove, R. 1995. The Illusion of Riches. Scale, Resolution and Explanation in Tasmanian Pleistocene HumanBehaviour. British Archaeological Reports, International Series 608. Oxford: TempusReparatum, Archaeological and Historical Associates Limited.
Cosgrove, R., J. Allen and B. Marshall. 1990. Palaeo-ecology and Pleistocene human occupation in southcentral Tasmania. Antiquity 64 (242): 59–78.
Costin, A. B. 1971. Vegetation, soils and climate in late Quaternary south-eastern Australia. In D. J.Mulvaney and J. Golson (eds), Aboriginal Man and Environment in Australia, pp. 26–37.Canberra: Australian National University Press.
Costin, A. B. 1972. Carbon-14 dates from the Snowy Mountains area, south-eastern Australia, and theirinterpretation. Quaternary Research 2: 579–90.
Coutts, P. J. F. 1982. Victoria Archaeological Survey activities report 1979–80. In P. J. F. Coutts (ed.),Cultural Resources Management in Victoria 1979–1981. Records of the Victorian ArchaeologicalSurvey 13: 1–27.
Cowgill, G. 1975. A selection of samplers: comments on archaeo-statistics. In J. W. Mueller (ed.),Sampling in Archaeology, pp. 258–74. Tucson: The University of Arizona Press.
Craib, J. L., T. Bonhomme, G. R. Mangold and S. S. Williams. 1999. Archaeological Salvage Excavations atSite RS1 (45-5-982), Regentville, western Sydney. Final Report. Unpublished report to TransGrid.
Dallas, M. Consulting Archaeologists. 2002. Sutherland Shire Council. Aboriginal Cultural HeritageStudy. Report to Sutherland Shire Council.
Daniel, I. R., Jr. 2001. Stone raw material availability and Early Archaic settlement in the south-easternUnited States. American Antiquity 66 (2): 237–65.
David, B. 1990. Echidna’s Rest, Chillagoe: a site report. Queensland Archaeological Research 7: 73–94.David, B. 1991. Fern Cave, rock art and social formations: rock art regionalisation and demographic
models in south-eastern Cape York Peninsula. Archaeology in Oceania 26 (2): 41–57.
terra australis 21
254
References

terra australis 21
255
References
David, B. and D. Chant. 1995. Rock art and regionalisation in north Queensland prehistory. Memoirs ofthe Queensland Museum 37 (2): 357–528.
David, B. and L. Dagg. 1993. Two caves. Memoirs of the Queensland Museum 33 (1): 143–62.David, B. and H. Lourandos. 1997. 37,000 years and more in tropical Australia: investigating long-term
archaeological tends in Cape York Peninsula. Proceedings of the Prehistoric Society 63: 1–23.David, B. and H. Lourandos. 1998. Rock art and socio-demography in northeastern Australian
prehistory. World Archaeology 30 (2): 193–219.Davidson, I. 1983. Site variability and prehistoric economy in Levante. In G. Bailey (ed.), Hunter-
Gatherer Economy in Prehistory: A European Perspective, pp. 79–95. Cambridge University Press.Davidson, I. 1990. Prehistoric Australian demography. In B. Meehan and N. White (eds), Hunter-Gatherer
Demography. Past and Present, pp. 41–58. Oceania Monograph 39. University of Sydney.Davidson, I. 1997. Book review: B. David and D. Chant. 1995. Rock Art and Regionalisation in North
Queensland Prehistory. Memoirs of the Queensland Museum 37 (2). Archaeology in Oceania 32 (3):217–18.
Dawson, R. 1830. The Present State of Australia. London.de Menocal, P. B. 2001. Cultural response to climate change during the late-Holocene. Science
(Paleoclimate) 292: 667–73.Dickson, F. P. n.d. [ca 1973]. Aboriginal prehistory of Botany Bay. In D. J. Anderson (ed.), The Botany Bay
Project. A Handbook of the Botany Bay Region — Some Preliminary Background Papers, pp. 44–50.Sydney: The Botany Bay Project Committee.
Dickson, F. P. 1973. Backed blades and points. Mankind 9 (1): 7–14.Dodson, J. R. 1987. Mire development and environmental change, Barrington Tops, New South Wales,
Australia. Quaternary Research 27: 73–81.Dodson, J., R. Fullagar and L. Head. 1992. Dynamics of environment and people in the forested
crescents of temperate Australia. In J. Dodson (ed.), The Naive Lands, pp.115–59. Melbourne:Longman Cheshire.
Dodson, J. R. and G. Hope. 1983. Southern Australian coastal areas, 15,000–10,000 BP. In J. M. A.Chappell and A. Grindrod (eds), Climanz. Proceedings of the First Climanz Conference, pp. 74–5.Canberra: Department of Biogeography and Geomorphology, Research School of PacificStudies, Australian National University.
Dodson, J. R. and S. D. Mooney. 2002. An assessment of historic human impact on south-easternAustralian environmental systems, using late-Holocene rates of environmental change.Australian Journal of Botany 50: 455–64.
Dodson, J. R. and B. G. Thom. 1992. Holocene vegetation history from the Hawkesbury Valley, NewSouth Wales. Proceedings of the Linnean Society of New South Wales 113 (2): 121–34.
Doelman, T., J. Webb and M. Domanski. 2001. Source to discard: patterns of lithic raw materialprocurement and use in Sturt National Park, north-western New South Wales. Archaeology inOceania 36 (1): 15–33.
Eades, D. K. 1976. The Dharawal and Dhurga Languages of the New South Wales South Coast. Canberra:Australian Institute of Aboriginal Studies.
Eales, T., C. Westcott, I. Lilley, S. Ulm, D. Brian, and C. Clarkson. 1999. Roof Fall Cave, Cania Gorge: sitereport. Queensland Archaeological Research 11: 29–42.
Ebert, J. I. 1979. An ethnoarchaeological approach to reassessing the meaning of variability in stone toolassemblages. In C. Kramer (ed.), Ethnoarchaeology: Implications of Ethnography for Archaeology,pp. 61–74. New York: Columbia University Press.
Ebert, J. I. 1992. Distributional Archaeology. Albuquerque: University of New Mexico Press.Egloff, B. J. 1984. Sampling the Five Forests. In S. Sullivan and S. Bowdler (eds), Site Surveys and
Significance Assessment in Australian Archaeology, pp. 71–78. Canberra: Department of Prehistory,Research School of Pacific Studies, Australian National University.
English, T. and L. Gay. 1993. Merriwa Region Archaeological Survey 1992, September 28th to October9th. Vol. 1. Unpublished report to the Wanaruah Aboriginal Land Council.
Enright, W. J. 1935. Distribution of Merewether chert. Mankind 1 (12): 8.

terra australis 21
256
References
Etheridge, R., Jr, and T. Whitelegge. 1907. Aboriginal workshops on the coast of New South Wales, andtheir contents. Records of the Australian Museum 6 (4): 233–50.
Extract from a letter written by an officer of the marines, dated Port Jackson, 18th November, 1788(Banks Papers). 1892 [1978]. In Historical Records of New South Wales 1 (2) — Phillip 1783–1792,pp. 221–4. Sydney: Government Printer.
Fawcett, J. W. 1898. Notes on the customs and dialect of the Wonnah-Ruah tribe. Science of Man 1 (n.s.) 7:152–4.
Ferguson, W. C. 1985. A Mid-Holocene Depopulation of the Australian South-west. Unpublished PhDthesis, Australian National University, Canberra.
Ferland, M. A. and P. S. Roy. 1994. Lowstand sedimentation on the central NSW outer shelf: descriptionand implications. In C. F. K. Diessel and R. L. Boyd (convenors), Proceedings of the 28thNewcastle Symposium on Advances in the Study of the Sydney Basin, pp. 180–87. Newcastle:Department of Geology, University of Newcastle.
Ferry, J. 1979. The failure of the New South Wales Missions to the Aborigines before 1845. AboriginalHistory 3(1): 25–36.
Fletcher, R. 1977a. Alternatives and differences. In M. Spriggs (ed.), Archaeology and Anthropology: Areasof Mutual Interest, pp. 49–67. Oxford: British Archaeological Reports, Supplementary Series 19.
Fletcher, R. 1977b. Settlement studies (micro and semi-micro). In D. L. Clarke (ed.), Spatial Archaeology,pp. 47–162. Academic Press.
Fletcher-Jones, N. A. 1985. Across the First Frontier: The Behavioural Ecology of the Sydney RegionAborigines. 2 vols. Unpublished PhD thesis, University of Durham, Britain.
Flood, J. M. 1973. The Moth Hunters — Investigations towards a Prehistory of the SoutheasternHighlands of Australia. Unpublished PhD thesis, Australian National University, Canberra.
Flood, J. 1976. Man and ecology in the highlands of south-eastern Australia: a case study. In N. Peterson(ed. ), Tribes and Boundaries in Australia, pp. 30–49. Canberra: Australian Institute of AboriginalStudies, and New Jersey: Humanities Press Inc.
Flood, J. 1980. The Moth Hunters: Aboriginal Prehistory of the Australian Alps. Canberra: AustralianInstitute of Aboriginal Studies.
Flood, J. 1999. Archaeology of the Dreamtime. The Story of Prehistoric Australia and its People. Sydney: Angusand Robertson.
Flood, J. 1997. Australian Aboriginal use of caves. In C. Bonsall and C. Tolan–Smith (eds), The Human Use ofCaves, pp. 193–200. British Archaeological Reports, International Series 667. Oxford: Archaeopress.
Flood, J. , B. David, J. Magee and B. English. 1987. Birrigai: a Pleistocene site in the south-easternhighlands. Archaeology in Oceania 22 (1): 9–26.
Flood, P. G. and E. Frankel. 1989. Late Holocene higher sea level indicators from eastern Australia.Marine Geology 90: 193–5.
Foley, R. 1981a. A model of regional archaeological structure. Proceedings of the Prehistoric Society 47:1–17. Foley, R. 1981b. Off-site archaeology: an alternative approach for the short-sited. In I. Hodder, G. Isaac
and N. Hammond (eds), Pattern of the Past: Studies in Honour of David Clarke, pp. 157–84.Cambridge University Press.
Foley, R. 1981c. Off-site Archaeology and Human Adaptation in Eastern Africa: An Analysis of RegionalArtefact Density in the Amboseli, Southern Kenya. A. R. Hands and D. R. Walker (eds),Cambridge Monographs in African Archaeology 3. Oxford: British Archaeological Reports,International Series 97.
Frankel, D. 1988. Characterising change in prehistoric sequences: a view from Australia. Archaeology inOceania 23 (2): 41–8.
Fraser, J. 1892. Map of New South Wales as occupied by Native Tribes (frontispiece), and Introduction.In L. E. Threlkeld, An Australian Language as spoken by the Awabakal, the People of Awaba or LakeMacquarie (near Newcastle, New South Wales); being an account of their language, traditions, andcustoms, pp. ix–lxvi. Edited by J. Fraser [Republication of Threlkeld 1834, unpublished 1857and 1859 manuscripts, with text rearranged, condensed and edited, plus appendix by J.Fraser]. Sydney: Government Printer.

Fraser, J. 1892 [1893]. The Aborigines of New South Wales. Published by authority of New South WalesCommissioners for the World’s Columbian Exposition, Chicago, 1893. Sydney: GovernmentPrinter.
Furey, L. 1978. Archaeological Survey. Mangrove Creek — Dam Storage Area. Unpublished report toNSW National Parks and Wildlife Service.
Galloway, R. W. 1965. Late Quaternary climates in Australia. The Journal of Geology 73 (4): 603–18. Gamble, C. 1982. Interaction and alliance in Palaeolithic society. Man (NS) 17: 92–107. Gamble, C. 1983. Culture and society in the Upper Palaeolithic of Europe. In G. Bailey (ed.), Hunter-
Gatherer Economy in Prehistory: A European Perspective, pp. 201–11. Cambridge University Press. Gamble, C. 1984. Regional variation in hunter-gatherer strategy in the Upper Pleistocene of Europe. In
R. Foley (ed.), Hominid Evolution and Community Ecology. Prehistoric Human Adaptation inBiological Perspective, pp. 237–60. Academic Press.
Gamble, C. 1986. The Palaeolithic Settlement of Europe. Cambridge University Press. Gamble, C. 1998. Palaeolithic society and the release from proximity: a network approach to intimate
relations. World Archaeology 29 (3): 426–49. Gillespie, R. 1982. Radiocarbon Users Handbook. Quaternary Research Unit Occasional Publication 1.
North Ryde, Sydney: Macquarie University. Gillespie, R. 1990. The Australian marine shell correction factor. In R. Gillespie (ed.), Quaternary Dating
Workshop 1990, p. 15. Canberra: Department of Biogeography and Geomorphology, ResearchSchool of Pacific Studies, Australian National University.
Gillespie, R. and R. B. Temple. 1976. Sydney University natural radiocarbon measurements III.Radiocarbon 18 (1): 96–109.
Glover, E. 1974. Report on the excavation of a second rock shelter at Curracurrang Cove, New SouthWales. In J. V. S. Megaw (ed.), The Recent Archaeology of the Sydney District. Excavations1964–1967, pp. 13–18. Canberra: Australian Institute of Aboriginal Studies.
Godden Mackay Pty Ltd and Austral Archaeology Pty Ltd. 1997. POW Project 1995. Randwick DestituteChildren’s Asylum Cemetery. Archaeological Investigation. Vol. 2: Archaeology, Part 3 —Aboriginal Archaeology. Unpublished report prepared for the South Eastern Sydney AreaHealth Service, Heritage Council of NSW and NSW Department of Health, Sydney.
Godfrey, M. C. S. 1989. Shell midden chronology in south-western Victoria: reflections of change inprehistoric population and subsistence? Archaeology in Oceania 24 (2): 65–9.
Gould, R. A. 1969. Yiwara: Foragers of the Australian Desert. London: Collins.Gould, R. A. 1975. Ecology and adaptive response among the Tolowa Indians of north-western
California. The Journal of California Anthropology 2 (2): 149–170. Gould, R. A. 1980. Living Archaeology. Cambridge: Cambridge University Press. Gray, A. 1985. Limits for demographic parameters of Aboriginal populations in the past. Australian
Aboriginal Studies 1985/1: 22–7. Grayson, D. K. 1984. Quantitative Zooarchaeology. Topics in the Analysis of Archaeological Faunas. Academic
Press. Greer, S. 1985. Salvage Program: Proposed Extensions F3 Freeway (Wahroonga–Berowra). Unpublished
report to NSW Department of Main Roads, Sydney. Gunn, R. 1979. Report on the Aboriginal Rock Art of the Upper Mangrove Creek Catchment Area.
(Documentation of ‘Art’ Sites to be destroyed by the Mangrove Creek Dam storage area.)Unpublished report to NSW National Parks and Wildlife Service.
Gunson, N. (ed. ) 1974. Australian Reminiscences and Papers of L. E. Threlkeld, Missionary to the Aborigines,1824–1859. Vol. 1. Canberra: Australian Institute of Aboriginal Studies.
Haglund, L. 1981a. Archaeological Investigations in the Area of the Proposed Kerrabee Dam.Unpublished report to NSW National Parks and Wildlife Service on behalf of the NSW WaterResources Commission.
Haglund, L. 1981b. Archaeological Survey and Sampling at the Site of the Ulan Coal Mine Ulan, NSW.Unpublished report prepared for Longworth and McKenzie Pty Ltd.
Haglund, L. 1984. Archaeological investigations in the area of the proposed Kerrabee Dam, New SouthWales: a case study. In S. Sullivan and S. Bowdler (eds), Site Surveys and Significance Assessmentin Australian Archaeology, pp. 79–87. Canberra: Department of Prehistory, Research School ofPacific Studies, Australian National University.
terra australis 21
257
References

Haglund, L. 1989. Technological Change. A Comparison of Developments in the Goulburn and HunterRiver Valleys. Unpublished report for the Australian Institute of Aboriginal and Torres StraitIslander Studies, Canberra.
Haglund, L. 1992. Archaeological Investigations at Doctors Creek, Warkworth, NSW. Salvage Excavationand Surface Collection in compliance with NPWS Salvage requirements. Sites NPWS 37-6-158,37-6-162 and 37-6-458. Vol. 6, Appendix G: Reports on radiocarbon and thermoluminescencedating. Unpublished report by Haglund and Associates to Warkworth Mining Limited.
Haglund, L. 1995. The Proposed M2 Motorway: Investigation of Aboriginal Heritage Significance. TestExcavation of Rock Shelter PAD1/DC1 on Devlins Creek, Pennant Hills–Beecroft. Unpublishedreport prepared by Haglund and Associates Cultural Heritage Consultants for NSW Roadsand Traffic Authority, Sydney.
Haglund, L. 1996. Salvage Excavation completed for Ulan Coal Mines Ltd: NPWS site 36-3-177, UlanHeritage Identifier 116, in compliance with requirements under NPWS Consent No. 786.Unpublished report to Ulan Coal Mines Ltd.
Haglund, L. 2001a. Archaeological Investigations within Warkworth Mining Lease relating to Sullivansand Dights Creek, NSW. Vol. 4: Summary and Discussion of Results. Unpublished report byHaglund and Associates to Warkworth Mining Limited.
Haglund, L. 2001b. Salvage Excavation completed for Ulan Coal Mines Ltd: Site SG5, Aboriginal RockShelter Site, in compliance with requirements under NPWS Consent No. 1002. Vol. 1: Overview.With a report on usewear and residue analysis by Michael Therin. Unpublished report byHaglund and Associates to Ulan Coal Mines Ltd.
Haglund, L. 2002. Archaeological Investigations within Warkworth Mining Lease: Aboriginal Sitesalong Sandy Hollow Creek, NSW. Vol. 1a: Site W6 (NPWS 37-6-151). Unpublished report byHaglund and Associates to Warkworth Mining Limited.
Haglund, L. and J. Stockton. 1983. Archaeological Investigations of Proposed Sandstone Extraction Areaat Cattai: Lot 71B and Lot 1, D. P. 40740, Cheesemans Road. Unpublished report to Collin C.Donges and Associates Pty Ltd on behalf of N. L. Perry and Son Pty Ltd.
Hale, H. M. and N. B. Tindale. 1930. Notes on some human remains in the Lower Murray Valley, SouthAustralia. Records of the South Australian Museum 4 (2): 145–218.
Hall, J. 1982. Sitting on the crop of the bay: an historical and archaeological sketch of Aboriginalsettlement and subsistence in Morton Bay, southeast Queensland. In S. Bowdler (ed. ), CoastalArchaeology in Eastern Australia. Proceedings of the 1980 Valla Conference on Australian Prehistory,pp. 79–95. Canberra: Department of Prehistory, Research School of Pacific Studies, AustralianNational University.
Hall, J. and P. Hiscock. 1988. Platypus Rockshelter (KBA: 70), S. E. Queensland: chronological changesin site use. Queensland Archaeological Research 5: 42–62.
Hall, J. and P. Hiscock 1988b. The Moreton Regional Archaeological Project (MRAP). Stage II: an outlineof objectives and methods. Queensland Archaeological Research 5: 4–24.
Hall, M. C. 1981. Land-use changes in Owens Valley prehistory: a matter of statistical inference.American Antiquity 46 (3): 648–56.
Hall, R. and K. Lomax. 1996. A regional landscape approach to the management of stone artefact sites inforested uplands in eastern Australia. Australian Archaeology 42: 35–8.
Hallam, S. J. 1972. An archaeological survey of the Perth Area, Western Australia: a progress report onart and artefacts, dates and demography. Australian Institute of Aboriginal Studies Newsletter 3(5): 11–19.
Hallam, S. 1977. Topographic archaeology and artifactual evidence. In R. V. S. Wright (ed. ), Stone Toolsas Cultural Markers: Change, Evolution and Complexity, pp. 169–77. Canberra: AustralianInstitute of Aboriginal Studies, and New Jersey: Humanities Press Inc.
Hallam, S. J. 1979. (reprint) Fire and Hearth: A Study of Aboriginal Usage and European Usurpation in South-western Australia. Canberra: Australian Institute of Aboriginal Studies.
Halstead, P. and J. O’Shea. 1989. Introduction: cultural responses to risk and uncertainty. In P. Halsteadand J. O’Shea (eds), Bad Year Economics: Cultural Responses to Risk and Uncertainty, pp. 1–7.Cambridge: Cambridge University Press.
terra australis 21
258
References

Harrison, S. P. and J. Dodson. 1993. Climates of Australia and New Guinea since 18,000 yr BP. In H. E.Wright, Jr, J. E. Kutzbach, T. Webb III, W. F. Ruddiman, F. A. Street-Perrott and P. J. Bartlein(eds), Global Climates since the Last Glacial Maximum, pp. 265–92. Minneapolis: University ofMinnesota Press.
Hassan, F. A. 1981. Demographic Archaeology. New York: Academic Press. Hassan, F. A. 1982. Demographic archaeology. In M. B. Schiffer (ed.), Advances in Archaeological Method
and Theory. Selections for Students from Volumes 1 through 4, pp. 225–79. Academic Press. Havard, O. 1943. Mrs Felton Mathew’s Journal (continued). Journal and Proceedings of the Royal Australian
Historical Society 29 (4): 217–52. Haviland, J. and L. Haviland. 1979. Report on fieldwork at Hopevale, May–August 1979. Reference No.
pMs 3185, Australian Institute of Aboriginal Studies Library, Canberra. Hayden, B. 1972. Population control among hunter/gatherers. World Archaeology 4 (2): 205–21. Hayden, B. 1979. Palaeolithic Reflections. Lithic Technology and Ethnographic Excavation among Australian
Aborigines. Canberra: Australian Institute of Aboriginal Studies.Hayden, B., N. Franco and J. Spafford 1996. Evaluating lithic strategies and design criteria. In G. H. Odell
(ed.) Stone Tools. Theoretical Insights into Human Prehistory, pp. 9–45. New York: Plenum Press. Head, L. 1983. Environment as artefact: a geographic perspective on the Holocene occupation of south-
western Victoria. Archaeology in Oceania 18 (2): 73–80. Head, L. 1985. Pollen analysis of sediments from the Bridgewater Caves archaeological site, south-
western Victoria. Australian Archaeology 20: 1–15. Head, L. 1986. Palaeoecological contributions to Australian prehistory. Archaeology in Oceania 21 (2):
121–9. Head, L. 1987. The Holocene prehistory of a coastal wetland system: Discovery Bay, south-eastern
Australia. Human Ecology 15 (4): 435–62. Head, L. 1989. Prehistoric Aboriginal impacts on Australian vegetation: an assessment of the evidence.
Australian Geographer 20 (1): 37–46. Herbert, C. and R. Helby. 1980. A Guide to the Sydney Basin. Geological Survey of New South Wales Bulletin
26. Sydney: Department of Mineral Resources. Higgs, E. S. and C. Vita-Finzi. 1972. Prehistoric economies: a territorial approach. In E. S. Higgs (ed.),
Papers in Economic Prehistory, pp. 27–36. Cambridge University Press. Hiscock, P. 1981. Comments on the use of chipped stone artefacts as a measure of ‘intensity of site
usage’. Australian Archaeology 13: 30–4. Hiscock, P. 1982a. An Archaeological Assessment of Site 1, Awoonga Dam, Queensland. Unpublished
report to the Gladstone Area Water Board. Hiscock, P. 1982b. A technological analysis of quartz assemblages from the south coast. In S. Bowdler
(ed.), Coastal Archaeology in Eastern Australia. Proceedings of the 1980 Valla Conference onAustralian Prehistory, pp. 32–45. Canberra: Department of Prehistory, Research School ofPacific Studies, Australian National University.
Hiscock, P. 1984. A preliminary report on the stone artefacts from Colless Creek Cave, North-westQueensland. Queensland Archaeological Research 1: 120–51.
Hiscock, P. 1985. The need for a taphonomic perspective in stone artefact analysis. QueenslandArchaeological Research 2: 82–97.
Hiscock, P. 1986. Technological change in the Hunter River valley and the interpretation of late-Holocene change in Australia. Archaeology in Oceania 21 (1): 40–50.
Hiscock, P. 1988a. Developing a relative dating system for the Moreton Region: an assessment ofprospects for a technological approach. Queensland Archaeological Research 5: 113–32.
Hiscock, P. D. 1988b. Prehistoric Settlement Patterns and Artefact Manufacture at Lawn Hill, North-west Queensland. PhD thesis, University of Queensland, Brisbane.
Hiscock, P. 1993 Bondaian technology in the Hunter Valley, New South Wales. Archaeology in Oceania 28(2): 65–76.
Hiscock, P. 1994. Technological responses to risk in Holocene Australia. Journal of World Prehistory 8 (3):267–92.
Hiscock, P. 1996. Mobility and technology in the Kakadu coastal wetlands. In I. C. Glover and P.Bellwood (eds), Indo-Pacific Prehistory: The Chiang Mai Papers, Vol. 2. Indo-Pacific PrehistoryAssociation Bulletin 15: 151–7.
terra australis 21
259
References

terra australis 21
260
Hiscock, P. 2001. Sizing up prehistory: sample size and composition of artefact assemblages. AustralianAboriginal Studies 2001/1: 48–62.
Hiscock, P. 2002. Pattern and context in the Holocene proliferation of backed artifacts in Australia. In R.G. Elston and S. L. Kuhn (eds), Thinking Small: Global Perspective on Microlithization. ArchaeologicalPapers of the American Anthropological Association (AP3A) 12: 163–77.
Hiscock, P. and H. Allen. 2000. Assemblage variability in the Willandra Lakes. Archaeology in Oceania 35(3): 97–103.
Hiscock, P. and V. Attenbrow. 1998. Early Holocene backed artefacts from Australia. Archaeology inOceania 33 (2): 49–62.
Hiscock, P. and V. Attenbrow. 2004. A revised sequence of backed artefact production at Capertee 3,New South Wales. Archaeology in Oceania, 39(2): 94–99.
Hiscock, P. and V. Attenbrow. 2004. in press. Australia’s Eastern Regional Sequence Revisited: Technology andChange at Capertree 3. British Archaeological Reports, International Series. Oxford: Archaeopress.
Hiscock, P. and J. Hall. 1988. Technological change at Bushrangers Cave (LA: A11), southeastQueensland. Queensland Archaeological Research 5: 90–112.
Hiscock, P. and M. Koettig. 1985. The Salvage Excavation and Collection of Archaeological Sites. Vol.3A: in ANUTECH Pty Ltd, Archaeological Investigations at Plashett Dam, Mount ArthurNorth and Mount Arthur South in the Hunter Valley, New South Wales. Unpublished reportprepared for the Electricity Commission of NSW and Mount Arthur South Coal Pty Ltd.
Holdaway, S. and N. Porch. 1995. Cyclical patterns in the Pleistocene human occupation of South-westTasmania. Archaeology in Oceania 30 (2): 74–82.
Holdaway, S., D. Witter, P. Fanning, R. Musgrave, G. Cochrane, T. Doelman, S. Greenwood, D. Pigdonand J. Reeves. 1998. New approaches to open site spatial archaeology in Sturt National Park,New South Wales, Australia. Archaeology in Oceania 33 (1): 1–19.
Hope, G. 1983. Southern Australia 7000–5000 BP. In J. M. A. Chappell and A. Grindrod (eds), Climanz.Proceedings of the First Climanz Conference, p. 98. Canberra: Department of Biogeography andGeomorphology, Research School of Pacific Studies, Australian National University.
Horton, D. R. 1978. Preliminary notes on the analysis of Australian coastal middens. Australian Instituteof Aboriginal Studies Newsletter 10. p. 30–3.
Howitt, A. W. 1904 [1996]. The Native Tribes of South-East Australia. London: Macmillan and Co. Limited,.[Facsimile edition by Aboriginal Studies Press, Canberra.]
Hughes, P. J. 1977. A Geomorphological Interpretation of Selected Archaeological Sites in SouthernCoastal New South Wales. Unpublished PhD thesis, University of New South Wales, Sydney.
Hughes, P. J. 1978. Weathering in sandstone shelters in the Sydney Basin and the survival of rock art. InC. Pearson (ed.), Conservation of Rock Art, pp. 36–41. Canberra: Institute for the Conservationof Cultural Material, Canberra College of Advanced Education.
Hughes, P. J. 1981. The impact of bushfires on soils and soil erosion. In P. Stanbury (ed.), Bushfires. TheirEffect on Australian Life and Landscape, pp. 33–7. The Macleay Museum, the University of Sydney.
Hughes, P. J. 1982. A Geoarchaeological Interpretation of the Deep Creek Shelter Archaeological Site,Mangrove Creek, NSW. Appendix I in V. Attenbrow, Archaeological Investigation of DeepCreek Shelter, Mangrove Creek Dam. Unpublished report to NSW National Parks andWildlife Service on behalf of NSW Department of Public Works.
Hughes, P. J. 1985. Summary of Investigations, and the Recommendations. In Vol. 1: in ANUTECH PtyLtd, Archaeological Investigations at Plashett Dam, Mount Arthur North, and Mount ArthurSouth in the Hunter Valley, New South Wales. Unpublished report prepared for the ElectricityCommission of NSW and Mount Arthur South Coal Pty Ltd.
Hughes, P. J. , R. K. Barz and P. Hiscock. 1984. An Archaeological Investigation of the Bungendore SandsQuarry, Lake George, NSW. Unpublished report to Corkhill Bros. Pty Ltd, Fyshwick, ACT.
Hughes, P. J. and V. Djohadze. 1980. Radiocarbon Dates from Archaeological Sites on the South Coast of NewSouth Wales and the Use of Depth/Age Curves. Canberra: Department of Prehistory, ResearchSchool of Pacific Studies, Australian National University.
Hughes, P. J., M. Hermes, and A. Lance. 1984. North Head Shell Midden, Batemans Bay, NSW. Analysesof Midden Contents. A report to NSW National Parks and Wildlife Service, South East Region,Queanbeyan.
References

Hughes, P. J. and R. J. Lampert. 1982. Prehistoric population change in southern coastal New SouthWales. In S. Bowdler (ed.), Coastal Archaeology in Eastern Australia. Proceedings of the 1980 VallaConference on Australian Prehistory, pp. 16–28. Canberra: Department of Prehistory, ResearchSchool of Pacific Studies, Australian National University.
Hughes, P. J. and M. E. Sullivan. 1979. A Geoarchaeological Investigation of Sandstone ShelterArchaeological Sites in the Mangrove Creek Catchment, New South Wales. Appendix 2 in V.Attenbrow (1981), Mangrove Creek Dam Salvage Excavation Project, Vol. 2. Unpublishedreport to NSW National Parks and Wildlife Service on behalf of NSW Department of PublicWorks.
Hughes, P. J. and M. E. Sullivan. 1981. Aboriginal burning and late-Holocene geomorphic events ineastern NSW. Search 12 (8): 277–8.
Hughes, P. J. and M. E. Sullivan. 1986. Aboriginal landscape. In J. S. Russell and R. F. Isbell (eds),Australian Soils: The Human Impact, pp. 117–33. University of Queensland Press in associationwith the Australian Society of Soil Science Incorporated.
Hunter, J. 1793 [1968]. An Historical Journal of the Transactions at Port Jackson and Norfolk Island, …including the journals of Governors Phillip and King, and of Lieut. Ball; and the voyages from the firstsailing of the Sirius in 1787 to the return of that Ship’s company to England in 1792. Printed for JohnStockdale, Piccadilly, London. [Australiana Facsimile Editions No. 148, reproduced byLibraries Board of South Australia, Adelaide.]
Illawarra Prehistory Group. 1990. 1989–1990 Archaeological Survey of the Cordeaux River andWoronora River. Unpublished report for Australian Institute of Aboriginal and Torres StraitIslander Studies, Canberra.
Illawarra Prehistory Group. 1995. 1994–1995 Archaeological Survey of Kangaroo Creek, Royal NationalPark. Unpublished report for Australian Institute of Aboriginal and Torres Strait IslanderStudies, Canberra.
Illawarra Prehistory Group. 1996. 1995–1996 Archaeological Survey of the North and Western Side ofthe Hacking River including Royal National Park and Garrawarra State Recreation Area.Unpublished report for Australian Institute of Aboriginal and Torres Strait Islander Studies,Canberra.
Jochim, M. A. 1989. Optimization and stone tool studies: problems and potentials. In R. Torrence (ed.),Time, Energy and Stone Tools, pp. 106–11. Cambridge University Press.
Jochim, M. A. 1998. A Hunter-Gatherer Landscape. South-west Germany in the Late Paleolithic and Mesolithic.New York: Plenum Press.
Johnson, A. G. 2000. Fine resolution palaeoecology confirms anthropogenic impact during the late-Holocene in the lower Hawkesbury Valley, NSW. Australian Geographer 31 (2): 209–35.
Johnson, I. 1979. The Getting of Data. A Case Study from the Recent Industries of Australia. PhD thesis,Australian National University, Canberra.
Jones, D. S. and G. J. Morgan. 1994. A Field Guide to Crustaceans of Australian Waters. Sydney: Reed.Jones, P. D., T. J. Osborn and K. R. Briffa. 2001. The evolution of climate over the last millennium. Science
(Paleoclimate) 292: 662–7. Jones, R. 1977. The Tasmanian paradox. In R. V. S. Wright (ed.), Stone Tools as Cultural Markers: Change,
Evolution and Complexity, pp. 189–204. Canberra: Australian Institute of Aboriginal Studies,and New Jersey: Humanities Press Inc.
Jones, R. 1985, Archaeological conclusions. In R. Jones (ed.), Archaeological Research in Kakadu NationalPark, pp. 291–8. Australian National Parks & Wildlife Service and the Department ofPrehistory, Research School of Pacific Studies, Australian National University, Canberra.
Jones, R. and J. Allen. 1978. Caveat excavator: a sea bird midden on Steep Head Island, north westTasmania. Australian Archaeology 8: 142–5.
Jones, R. and I. Johnson. 1985a. Deaf Adder Gorge: Lindner Site, Nauwalabila I. In R. Jones (ed.),Archaeological Research in Kakadu National Park, pp. 165–227. Australian National Parks &Wildlife Service and Department of Prehistory, Research School of Pacific Studies, AustralianNational University, Canberra.
terra australis 21
261
References

Jones, R. and I. Johnson. 1985b. Rockshelter excavations: Nourlangie and Mt Brockman massifs. In R.Jones (ed.), Archaeological Research in Kakadu National Park, pp. 39–76. Canberra: AustralianNational Parks & Wildlife Service and Department of Prehistory, Research School of PacificStudies, Australian National University.
Jones, R. L. and J. R. Dodson. 1997. A Holocene vegetation record from Wrights Creek Valley, NewSouth Wales. Proceedings of the Linnean Society of New South Wales 118: 1–22.
Judge, W. J., J. I. Ebert, and R. K. Hitchcock. 1975. Sampling in regional archaeological survey. In J. W.Mueller (ed.), Sampling in Archaeology, pp. 82–123. Tucson: University of Arizona Press.
Jung, S. 1992. Trample damage of stone flakes as an index of occupation intensity: a case study fromMagnificent Gallery. Queensland Archaeological Research 9: 26–8.
Kamminga, J. 1980. A functional investigation of Australian microliths. The Artefact 5 (1 and 2): 1–18. Kamminga, J., R. Paton and I. Macfarlane. 1989. Archaeological Investigations in the Thredbo Valley,
Snowy Mountains. Unpublished report to Farabo Pty Ltd. Kefous, K. 1982. Prehistoric site patterning in the Victorian Mallee. Archaeology in Oceania 17 (2): 98–9. Kelly, M. 1982. A Practical Reference Source to Radiocarbon Dates obtained from Archaeological Sites in
Queensland. Cultural Resource Management Monograph Series Number 4. Brisbane:Archaeology Branch, Department of Aboriginal and Islander Advancement.
Kelly, R. L. 1983. Hunter-gather mobility strategies. Journal of Anthropological Research 39 (3): 277–306. Kelly, R. L. 1992. Mobility/sedentism: concepts, archaeological measures, and effects. Annual Review of
Anthropology 21: 43–66. Kelly, R. L. and L. C. Todd 1988. Coming into the country: early Paleoindian hunting and mobility.
American Antiquity 53 (2): 231–44. Kershaw, A. P. 1982. Holocene palaeoecology In B. G. Thom and R. J. Wasson (eds), Holocene Research in
Australia 1978–1982, pp. 78–82. Duntroon, ACT: Department of Geography, Faculty of MilitaryStudies, University of New South Wales, Royal Military College.
Kershaw, A. P. 1984. Review of Quaternary studies in Australia – plant and invertebrate palaeoecology.In G. E. Wilford (compiler), Quaternary Studies in Australia: Future Directions. Record 1984/14p. 69. Bureau of Mineral Resources, Geology and Geophysics.
Kershaw, A. P. 1989. Was there a ‘Great Australian Arid Period’? Search 20 (3): 89–92. Kershaw, A. P. 1995. Environmental change in greater Australia. In J. Allen and J. F. O’Connell (eds),
Transitions. Pleistocene to Holocene in Australia and Papua New Guinea. Antiquity 69 (Special No.265): 656–75.
Kershaw, P., P. G. Quilty, B. David, S. van Huet, and A. McMinn. 2000. Palaeobiogeography of theQuaternary of Australasia. In A. J. Wright, G. C. Young, J. A. Talent and J. R. Laurie (eds),Palaeobiogeography of Australasian Faunas and Floras, pp. 471–515. Memoir 23 of the Associationof Australasian Palaeontologists, Canberra.
Kinhill Engineers Pty Ltd. 1995. Morisset Forestry District EIS. An Assessment of AboriginalArchaeological Sites. Unpublished report to State Forests of New South Wales, Taree.
Kodela, P. G. 1992. Rainforest, pollen and palaeoecological studies in the Robertson area. Eucryphia 5:5–8.
Kodela, P. G. and J. R. Dodson. (1988) 1989. A late-Holocene vegetation and fire record from Ku-ring-gaiChase National Park, New South Wales. Proceedings of the Linnean Society of NSW 110 (4):317–26.
Koettig, M. 1976. Rising Damp: Aboriginal Structures in Perspective. Unpublished MA Qual. thesis.Department of Anthropology, University of Sydney.
Koettig M. 1985a. Archaeological Investigations of the Sites HCA. 11, HCA. 13 and HCA. 14, nearBerrima, Southern Tablelands, NSW: Investigation of Sites Along State Highway No 2 —Hume Section. Unpublished report to NSW Department of Main Roads.
Koettig, M. 1985b. Archaeological Investigations of Three Sites on Upper Mill Creek: near LucasHeights, Sydney. Unpublished report for Metropolitan Waste Disposal Authority, Sydney.
Koettig, M. 1986. Test Excavations at Six Locations along the Proposed Pipeline Route betweenSingleton and Glennies Creek Dam, Hunter Valley Region, NSW. Unpublished report to NSWDepartment of Public Works.
terra australis 21
262
References
Koettig, M. 1987. Monitoring Excavations at Three Locations along the Singleton to Glennies CreekPipeline Route, Hunter Valley, NSW. (Third report on archaeological investigations along thisroute.) Unpublished report to the NSW Department of Public Works .
Koettig, M. 1989. Test Excavations at Portion 147 Pokolbin, near Cessnock. Unpublished report to theMcInnes Group of Companies.
Koettig, M. 1990. Report on Salvage Excavations at M14, Upper Mill Creek, Near Lucas Heights,Sydney. Unpublished report to the Waste Management Authority, NSW, Sydney.
Koettig, M. 1991. Survey and Test Excavations Bulga Lease Authorisation 219. Unpublished report toSaxonvale Coal Pty Ltd.
Koettig, M. 1992. Salvage Excavations of Aboriginal Sites on the Camberwell Lease. Vol. 3: Table,Illustrations, Photos. Unpublished report to Camberwell Coal Pty Ltd.
Koettig, M. 1994. Bulga Lease Authorisation 219. Salvage Excavations. 5 vols. Unpublished report toSaxonvale Coal Pty Ltd.
Koettig, M. and P. J. Hughes. 1983. An Archaeological Survey of the Proposed Hungry CreekRural/Residential Subdivision, Upper Wollombi Brook, NSW. A report to John Cameron,Dungeness Pastoral Company, Murrays Run via Laguna, NSW.
Kohen, J. L. 1986. Prehistoric Settlement in the Western Cumberland Plain: Resources, Environment andTechnology. Unpublished PhD thesis, Macquarie University, Sydney.
Kohen, J. 1995. Excavation of A Rock Shelter Site at Mogo Creek, Yengo National Park. Unpublishedreport prepared for NSW National Parks and Wildlife Service, Sydney, and Darkinjung LocalAboriginal Land Council, Wyong.
Kohen, J. , E. Stockton and M. Williams 1981. Where plain and plateau meet: recent excavations atShaws Creek rock-shelter, eastern New South Wales. Australian Archaeology 13: 63–8.
Kohen, J. L., E. D. Stockton, and M. A. J. Williams. 1984. Shaws Creek KII rock-shelter: a prehistoricoccupation site in the Blue Mountains piedmont, eastern New South Wales. Archaeology inOceania 19 (2): 57–73.
Kuskie, P. J. 1999. An Aboriginal Archaeological Assessment of the Proposed Mount Arthur North CoalMine, Near Muswellbrook, Hunter Valley, New South Wales. Vol. A. Unpublished report toDames and Moore, Brisbane.
Kuskie, P. J. and J. Kamminga. 2000. Salvage of Aboriginal Archaeological Sites in relation to the F3Freeway near Lenaghans Drive, Black Hill, New South Wales. Vol. A: Report. Unpublishedreport by South East Archaeology to Roads and Traffic Authority, New South Wales (MajorProjects, Northern Region, Newcastle).
Lamb, L. 1996a. A methodology for the analysis of backed artefact production on the South Molle Islandquarry, Whitsunday Islands. In S. Ulm, I. Lilley and A. Ross (eds), Australian Archaeology ‘95.Proceedings of the 1995 Australian Archaeological Association Annual Conference, pp. 151–59.Tempus 6. St Lucia, Brisbane: Anthropology Museum, University of Queensland.
Lamb, L. 1996b. Investigating changing stone technologies, site use and occupational intensities at FernCave, north Queensland. Australian Archaeology 42: 1–7.
Lampert, R. J. 1966. An excavation at Durras North, New South Wales. Archaeology and PhysicalAnthropology in Oceania 1 (2): 83–118.
Lampert, R. J. 1971a. Burrill Lake and Currarong. Coastal Sites in Southern New South Wales. Terra Australis1. Canberra: Department of Prehistory, Research School of Pacific Studies, Australian NationalUniversity.
Lampert, R. J. 1971b. Coastal Aborigines of south-eastern Australia. In D. J. Mulvaney and J. Golson(eds), Aboriginal Man and Environment in Australia, pp. 114–32. Canberra: Australian NationalUniversity Press.
Lampert, R. J. and P. J. Hughes. 1974. Sea level change and Aboriginal coastal adaptations in southernNew South Wales. Archaeology and Physical Anthropology in Oceania 9 (3): 226–35.
Langford-Smith, T. and B. G. Thom. 1969. New South Wales coastal morphology. In G. H. Packard (ed.),Geology of New South Wales. Journal of Geological Society of Australia 16, Part I: 572–80.
Lawrence, R. 1968. Aboriginal Habitat and Economy. Canberra: Department of Geography, School ofGeneral Studies, Australian National University.
terra australis 21
263
References

Lawrence, R. J. 1971. Habitat and economy: a historical perspective. In D. J. Mulvaney and J. Golson(eds), Aboriginal Man and Environment in Australia, pp. 249–61. Canberra: Australian NationalUniversity Press.
Lilley, I. 1984. Late Holocene subsistence and settlement in subcoastal southeast Queensland.Queensland Archaeological Research 1: 8–32.
Lilley, I. A. 1985. An experiment in statistical location analysis in sub-coastal southeast Queensland.Australian Archaeology 21: 91–112.
Lilley, I. 2000. So near and yet so far: reflections on archaeology in Australia and Papua New Guinea,intensification and culture contact. Australian Archaeology 50: 36–44.
Lilley, I. and S. Ulm. 1999. The Gooreng Gooreng Cultural Heritage Project: preliminary results ofarchaeological research, 1993–1997. Queensland Archaeological Research 11: 1–14.
Lourandos, H. 1976. Aboriginal settlement and land use in south western Victoria: a report on currentfield work. The Artefact 1 (4): 174–93.
Lourandos, H. 1977. Aboriginal spatial organisation and population: south western Victoriareconsidered. Archaeology and Physical Anthropology in Oceania 12 (3): 202–25.
Lourandos, H. 1980a. Change or stability?: hydraulics, hunter-gatherers and population in temperateAustralia. World Archaeology 11 (3): 245–64.
Lourandos, H. 1980b. Forces of Change: Aboriginal Technology and Population in South WesternVictoria. Unpublished PhD thesis, University of Sydney.
Lourandos, H. 1983a. Intensification: a late Pleistocene–Holocene archaeological sequence from south-western Victoria. Archaeology in Oceania 18 (2): 81–94.
Lourandos, H. 1983b. 10,000 years in the Tasmanian highlands. Australian Archaeology 16: 39–47. Lourandos, H. 1984. Changing perspectives in Australian prehistory: a reply to Beaton. Archaeology in
Oceania 19 (1): 29–33. Lourandos, H. 1985a. Intensification and Australian prehistory. In T. D. Price and J. A. Brown (eds),
Prehistoric Hunter-Gatherers. The Emergence of Cultural Complexity, pp. 385–423. Academic Press. Lourandos, H. 1985b. Problems with the interpretation of late-Holocene changes in Australian prehistory.
Archaeology in Oceania 20 (1): 37–9. Lourandos, H. 1987. Pleistocene Australia. Peopling a continent. In O. Soffer (ed.), The Pleistocene Old
World. Regional Perspectives, pp. 147–65. New York: Plenum Press. Lourandos, H. 1988. Palaeopolitics: resource intensification in Aboriginal Australia and Papua New
Guinea. In T. Ingold, D. Riches and J. Woodburn (eds), Hunters and Gatherers 1. History,Evolution and Social Change, pp. 148–160. Oxford: Berg.
Lourandos, H. 1993. Hunter-gatherer cultural dynamics: long- and short-term trends in Australianprehistory. Journal of Archaeological Research 1 (1): 67–88.
Lourandos, H. 1996. Change in Australian prehistory: scale, trends and frameworks of interpretation.In S. Ulm, I. Lilley and A. Ross (eds), Australian Archaeology ‘95. Proceedings of the 1995Australian Archaeological Association Annual Conference, pp. 15–21. Tempus 6. St Lucia, Brisbane:Anthropology Museum, University of Queensland.
Lourandos, H. 1997. Continent of Hunter-Gatherers. New Perspectives in Australian Prehistory. CambridgeUniversity Press.
Lourandos, H. and A. Ross. 1994. The great ‘intensification debate’: its history and place in Australianarchaeology, Australian Archaeology 39: 54–63.
Luebbers, R. A. 1978. Meals and Menus: A Study of Change in Prehistoric Coastal Settlements in SouthAustralia. Unpublished PhD thesis, Australian National University, Canberra.
Luebbers, R. A. 1981. The Coorong Report: An Archaeological Survey of the Southern YounghusbandPeninsula. Unpublished report prepared for the South Australian Department of Environmentand Planning.
Luebbers, R. A. 1984. The Coorong Report. An Archaeological Survey of The Northern Coorong, 1982.Unpublished (draft) report prepared for the South Australian Department for Environmentand Planning.
Maddock, K. 1982. 2nd ed. The Australian Aborigines. A Portrait of their Society. Ringwood: Penguin BooksAustralia.
Markgraf, V. and H. F. Diaz. 2000. The past ENSO record: a synthesis. In H. F. Diaz and V. Markgraf(eds), El Niño and The Southern Oscillation. Multiscale Variability and Global and Regional Impacts,pp. 465–88. Cambridge: Cambridge University Press.
terra australis 21
264
References

Markgraf, V., J. R. Dodson, A. P. Kershaw, M. S. McGlone, and N. Nicholls. 1992. Evolution of latePleistocene and Holocene climates in the circum-South Pacific land areas. Climate Dynamics 6:193–211.
Mathews, R. H. 1896a The Bu-nan ceremony of New South Wales. American Anthropologist 9 (10): 327–44. Mathews, R. H. 1896b. Stone cooking-holes and grooves for stone-grinding used by the Australian
Aborigines. Journal of the Anthropological Institute of Great Britain 25 (3): 255–9. Mathews, R. H. 1897. The Burbung of the Darkinung Tribes. Carlton, Melbourne: Ford and Son,
[Reprinted from Proceedings of the Royal Society of Victoria 10 (n. s.) (1): 1–12, July 1897.] Mathews, R. H. 1901. Rock-holes used by the Aborigines for warming water. Journal and Proceedings of
the Royal Society of New South Wales 35: 213–16. Mazel, A. D. 1989a. Changing social relations in the Thukela Basin, Natal 7000–2000 BP. South African
Archaeological Society Goodwin Series 6: 33–41. Mazel, A. D. 1989b. People making history: the last ten thousand years of hunter-gatherer communities
in the Thukela Basin. Natal Museum Journal of Humanities 1: 1–168. Macarthur, E. 1791 [1893]. The Letters — Mrs Macarthur’s Letters to Relatives and Friends in England.
Sydney, Port Jackson N. S. Wales, March the 7th, 1791 (extracts). In Appendix B. TheMacarthur Papers. In F. M. Bladen (ed.), Historical Records of New South Wales, Vol. 2: Grose andPaterson 1793–1795, pp. 494–512. Sydney: Government Printer.
McBryde, I. 1974. Aboriginal Prehistory in New England. An Archaeological Survey of Northeastern NewSouth Wales. Sydney: Sydney University Press.
McBryde, I. 1977. Determinants of assemblage variation in New England prehistory. Environment,subsistence economies, site activities, or cultural tradition? In R. V. S. Wright (ed.), Stone Toolsas Cultural Markers: Change, Evolution and Complexity, pp. 225–50. Canberra: AustralianInstitute of Aboriginal Studies, and New Jersey: Humanities Press Inc.
McBryde, I. 1985. Backed blade industries from the Graman rock shelters, New South Wales: someevidence on function. In V. N. Misra and P. Bellwood (eds), Recent Advances in Indo-PacificPrehistory. Proceedings of the International Symposium held at Poona, December 19–21, 1978, pp.231–49. New Delhi: Oxford and IBH Publishing Co.
McCarthy, F. D. 1936. Archaeological Reconnaissance of Mangrove Mountain. 28/7/1936. Report dated31 July, 1936. Australian Museum Archives: Series 10, Correspondence 240/1936.
McCarthy, F. D. 1939a. Archaeological Reconnaissance to Wollombi District. Report dated 18 April 1939.Australian Museum Archives: Series 10, Correspondence 166/39.
McCarthy, F. D. 1939b. ‘Trade’ in Aboriginal Australia, and ‘trade’ relationships with Torres Strait, NewGuinea and Malaya. Oceania 9 (4): 405–38.
McCarthy, F. D. 1939c. ‘Trade’ in Aboriginal Australia, and ‘trade’ relationships with Torres Strait, NewGuinea and Malaya. B. Articles bartered over wide areas. Oceania 10 (1): 80–104.
McCarthy, F. D. 1948. The Lapstone Creek excavation: two culture periods revealed in eastern NewSouth Wales. Records of the Australian Museum 22 (1): 1–34.
McCarthy, F. D. 1958. Culture succession in south eastern Australia. Mankind 5 (5): 177–90. McCarthy, F. D. 1961. Australia. Asian Perspectives 5 (1): 98–104. McCarthy, F. D. 1964a. Australia. Asian Perspectives 8 (1): 102–11. McCarthy, F. D. 1964b. The archaeology of the Capertee Valley, New South Wales. Records of the
Australian Museum 26 (6): 197–246. McCarthy, F. D. 1965. The Aboriginal past: archaeological and material equipment. In R. M. Berndt and
C. H. Berndt (eds), Aboriginal Man in Australia. Essays in honour of Emeritus Professor A. P. Elkin,pp. 71–100. Sydney: Angus and Robertson.
McCarthy, F. D. 1976. 2nd ed. revised. Australian Aboriginal Stone Implements. Sydney: The AustralianMuseum Trust.
McCarthy, F. D. 1978. New light on the Lapstone Creek excavation. Australian Archaeology 8: 49–60. McDonald, J. 1985. An Excavation at Cherrybrook. Site 45-6-1649; and Addendum. Unpublished report
prepared for the Metropolitan Water, Sewerage and Drainage Board, NSW. McDonald, J. 1986a. Maroota Historic Site Archaeological Survey. Part I. Unpublished report to the
NSW National Parks and Wildlife Service. McDonald, J. 1986b. Preliminary Archaeological Reconnaissance of the Proposed Schofields Regional
Depot, Plumpton, NSW. Unpublished report prepared by Brayshaw and Associates for theMetropolitan Waste Disposal Authority, Sydney.
terra australis 21
265
References

McDonald, J. 1992a. The Archaeology of the Angophora Reserve Rock Shelter. Environmental HeritageMonograph Series 1. Sydney: NSW National Parks and Wildlife Service.
McDonald, J. 1992b. The Great Mackerel Rockshelter excavation: women in the archaeological record?Australian Archaeology 35: 32–50.
McDonald, J. 1994. Dreamtime Superhighway: An Analysis of Sydney Basin Rock Art and PrehistoricInformation Exchange. Unpublished PhD thesis, Australian National University, Canberra.
McDonald, Jo, Cultural Heritage Management Pty Ltd. 1997. Archaeological Salvage of Site RM1 atRichmond, NSW. Test and Salvage Excavation Report. Unpublished report prepared forRestifa and Partners on behalf of Woolworths.
McDonald, Jo, Cultural Heritage Management Pty Ltd 1999. Test Excavation of PAD 5 (RH/SP9) andPAD 31 (RH/CC2) for the Rouse Hill (Stage 2) Infrastructure Project at Rouse Hill andKellyville, NSW. Unpublished report to Rouse Hill Infrastructure Consortium.
McDonald, J., P. Mitchell and E. Rich. 1996. A Further Investigation of Site RS1 (45-5-892) at Regentville,Mulgoa Creek, Western Sydney. Unpublished report for Environmental Services, PacificPower, Sydney.
McDonald, J. and E. Rich. 1993. Archaeological Investigations for the Rouse Hill Infrastructure Project(Stage I) Works along Caddies, Smalls and Second Ponds Creeks, Rouse Hill and Parklea,NSW. Final Report on Test Excavation Program. 2 vols. Unpublished report for Rouse Hill(Stage I) Pty Ltd.
McDonald, J., E, Rich and H. Barton. 1994. The Rouse Hill Infrastructure Project (Stage 1) on theCumberland Plain, western Sydney. In M. Sullivan, S. Brockwell and A. Webb (eds),Archaeology in the North. Proceedings of the 1993 Australian Archaeological Association Conference,pp. 259–93. Darwing: North Australia Research Unit, Australian National University.
MacDonald, K. and I. Davidson. n.d. [ca 1998]. The Bayswater Archaeological Research Project. Vol. 1.School of Human and Environmental Studies, University of New England, Armidale.
MacDonald, K., M. Ridges and I. Davidson. 1998. Report on the 1997 field season of the BayswaterArchaeological Research Project, NSW Hunter Valley. Australian Archaeology 46: 37–8.
McGlone, M. S., A. P. Kershaw and V. Markgraf. 1992. El Niño/Southern Oscillation climatic variabilityin Australasian and South American paleoenvironmental records. In H. F. Diaz and V.Markgraf (eds), El Niño: Historical and Paleoclimatic Aspects of the Southern Oscillation, pp.435–62. Cambridge University Press.
Macintosh, N. W. G. 1965. Dingo and horned anthropomorph in an Aboriginal rock shelter. Oceania 36(2): 85–101
McManamon, F. P. 1984. Discovering sites unseen. In M. B. Schiffer (ed.), Advances in ArchaeologicalMethod and Theory 7: 223–92. Academic Press.
MacNeish, R. S. 1964. Ancient Mesoamerican civilization. Science 143 (3606): 531–7. MacNeish, R. S. 1973. The evolution of community patterns in the Tehuacán Valley of Mexico and
speculations about the cultural processes. In R. Tringham (ed.), Ecology and AgriculturalSettlements: An Ethnographic and Archaeological Perspective, pp. R2: 1–27. Massachusetts: WarnerModular Publications Inc.
McNiven, I. 1992a. Sandblow sites in the Great Sandy Region, coastal southeast Queensland:implications for models of late-Holocene rainforest exploitation and settlement restructuring.Queensland Archaeological Research 9: 1–16.
McNiven, I. J. 1992b. Shell middens and mobility: the use of off-site faunal remains, Queensland,Australia. Journal of Field Archaeology 19: 495–508.
McNiven, I. J. 1994. Technological organisation and settlement in south-west Tasmania after the glacialmaximum. Antiquity 68 (258): 75–82.
McNiven, I. J. 2000. Backed to the Pleistocene. Archaeology in Oceania 35 (1): 48–52. McNiven, I., B. Marshall, J. Allen, N. Stern and R. Cosgrove. 1993. The Southern Forests Archaeological
Project: An overview. In M. A. Smith, M. Spriggs and B. Fankhauser (eds), Sahul in Review.Pleistocene Archaeology in Australia, New Guinea and Island Melanesia, pp. 213–24. Canberra:Department of Prehistory Research School of Pacific Studies, Australian National University.
Meehan, B. 1982. Shell Bed to Shell Midden. Canberra: Australian Institute of Aboriginal Studies.Meehan, B. 1988. The ‘dinnertime camp’. In B. Meehan and R. Jones (eds), Archaeology with Ethnography:
An Australian Perspective, pp. 171–81. Canberra: Department of Prehistory, Research School ofPacific Studies, Australian National University.
terra australis 21
266
References

Megaw, J. V. S. 1965. Excavations in the Royal National Park, New South Wales: a first series ofradiocarbon dates from the Sydney district. Oceania 35 (3): 202–7.
Megaw, J. V. S. 1968a. A dated culture sequence for the south Sydney region of New South Wales.Current Anthropology 9 (4): 325–9.
Megaw, J. V. S. 1968b. Trial excavations in Captain Cook’s Landing Place Reserve, Kurnell, NSW.Australian Institute of Aboriginal Studies Newsletter 2 (9): 17–19.
Megaw, J. V. S. 1974. The recent archaeology of the south Sydney district — a summary. In J. V. S.Megaw (ed.), The Recent Archaeology of the Sydney District. Excavations 1964–1967, pp. 35–8.Canberra: Australian Institute of Aboriginal Studies.
Megaw, J. V. S. and A. Roberts. 1974. The 1967 excavations at Wattamolla Cove — Royal National Park,New South Wales. In J. V. S. Megaw (ed.), The Recent Archaeology of the Sydney District.Excavations 1964–1967, pp. 1–12. Canberra: Australian Institute of Aboriginal Studies.
Megaw, J. V. S. and R. V. S. Wright. 1966. The excavation of an Aboriginal rock-shelter on Gymea Bay,Port Hacking, NSW. Archaeology and Physical Anthropology in Oceania 1 (1): 23–50.
Mellars, P. A. 1973. The character of the Middle-Upper Palaeolithic transition in south-west France. In C.Renfrew (ed.), The Explanation of Culture Change: Models in Prehistory, pp. 255–76. London:Duckworth.
Merrick, J. R. 1993. Freshwater Crayfishes of New South Wales. Sydney: The Linnean Society of New SouthWales.
Miller, R. D. 1983. Bull Cave: Its Relevance to the Prehistory of the Sydney Region. UnpublishedBA(Hons) thesis, University of Sydney.
Mooney, S. 1997. A fine-resolution palaeoclimatic reconstruction of the last 2000 years, from LakeKeilambete, south-eastern Australia. The Holocene 7 (2): 139–149.
Moore, D. R. 1970. Results of an archaeological survey of the Hunter River Valley, New South Wales,Australia. Part I: The Bondaian Industry of the Upper Hunter and Goulburn River Valleys.Records of the Australia Museum 28: 25–64.
Moore, D. R. 1981. Results of an archaeological survey of the Hunter River Valley, New South Wales,Australia. Part II: Problems of the lower Hunter and contacts with the Hawkesbury Valley.Records of the Australian Museum 33 (9): 388–442.
Moore, M. W. 2000. Technology of Hunter Valley microlith assemblages, New South Wales. AustralianArchaeology 51: 28–39.
Morphy, H. 1999. Encoding the Dreaming — a theoretical framework for the analysis of representationalprocesses in Australian Aboriginal art. Australian Archaeology 49: 13–22.
Morwood, M. J. 1979. Art and Stone. Towards a Prehistory of Central Western Queensland. UnpublishedPhD thesis, Australian National University, Canberra.
Morwood, M. J. 1981. Archaeology of the central Queensland highlands: the stone component.Archaeology in Oceania 16 (1): 1–52.
Morwood, M. J. 1984. The prehistory of the central Queensland highlands. In F. Wendorf and A. Close(eds), Advances in World Archaeology 3: 325–80.
Morwood, M. J. 1986. The archaeology of art: excavations at Maidenwell and Gatton shelters, southeastQueensland. Queensland Archaeological Research 3: 88–132.
Morwood, M. J. 1987. The archaeology of social complexity in south-east Queensland. Proceedings of thePrehistoric Society 53: 337–50.
Morwood, M. J. 1995. Aboriginal ethnography, S. E. Cape York peninsula. In M. J. Morwood and D. R.Hobbs (eds), In Quinkan Prehistory. The Archaeology of Aboriginal Art in S. E. Cape York Peninsula,Australia, pp. 33–9. Tempus 3. St Lucia, Brisbane: Anthropology Museum, University ofQueensland.
Morwood, M. J. and D. R. Hobbs. 1995a. Conclusions. In Quinkan Prehistory. The Archaeology of AboriginalArt in S. E. Cape York Peninsula, Australia, pp. 178–85. Tempus 3. St Lucia, Brisbane: AnthropologyMuseum, University of Queensland.
Morwood M. J. and D. R. Hobbs (eds) 1995b. In Quinkan Prehistory. The Archaeology of Aboriginal Art in S.E. Cape York Peninsula, Australia. Tempus 3. St Lucia, Brisbane: Anthropology Museum,University of Queensland.
Morwood, M. J. , D. R. Hobbs and D. M. Price. 1995. Excavations at Sandy Creek 1 and 2. In QuinkanPrehistory. The Archaeology of Aboriginal Art in S. E. Cape York Peninsula, Australia, pp. 71–91.Tempus 3. St Lucia, Brisbane: Anthropology Museum, University of Queensland.
terra australis 21
267
References

Morwood, M. J. and S. Jung. 1995. Excavations at Magnificent Gallery. In Quinkan Prehistory. TheArchaeology of Aboriginal Art in S. E. Cape York Peninsula, Australia, pp. 93–100. Tempus 3. St Lucia,Brisbane: Anthropology Museum, University of Queensland.
Morwood, M. J. and S. L’Oste-Brown. 1995. Chronological changes in stone artefact technology. InQuinkan Prehistory. The Archaeology of Aboriginal Art in S. E. Cape York Peninsula, Australia, pp.161–77. Tempus 3. St Lucia, Brisbane: Anthropology Museum, University of Queensland.
Moy, C. M., G. O. Seltzer, D. T. Rodbell and D. M. Anderson. 2002. Variability of El Niño/SouthernOscillation activity at millennial timescales during the Holocene epoch. Nature 420: 162–5.
Mueller, J. W. 1975. Archaeological research as cluster sampling. In J. W. Mueller (ed.), Sampling inArchaeology, pp. 33–41. Tucson: University of Arizona Press.
Mulvaney, D. J. 1960. Archaeological excavations at Fromm’s Landing on the lower Murray River, SouthAustralia. Proceedings of the Royal Society of Victoria 72 (2): 53–85.
Mulvaney, D. J. 1969. 1st ed. The Prehistory of Australia. London: Thames and Hudson. Mulvaney, D. J. 1975. 2nd ed. The Prehistory of Australia. Australia: Penguin Books. Mulvaney, D. J. and E. B. Joyce. 1965. Archaeological and geomorphological investigations on Mt
Moffatt Station, Queensland, Australia. Proceedings of the Prehistoric Society 31: 147–212. Mulvaney, D. and J. Kamminga. 1999. Prehistory of Australia. Sydney: Allen and Unwin. Mulvaney, D. J., G. H. Lawton and C. R. Twidale. 1964. Archaeological excavation of rock shelter No 6
Fromm’s Landing, South Australia. Proceedings of the Royal Society of Victoria 77 (2): 479–516. Murray-Wallace, C. V. and S. M. Colley. 1997. Amino acid racemisation and radiocarbon dating of a
contact period midden, Greenglade rock-shelter, New South Wales. Archaeology in Oceania 32(2): 163–9.
Myers, A. 1989. Reliable and maintainable technological strategies in the Mesolithic of mainland Britain. InR. Torrence (ed.), Time, Energy and Stone Tools, pp. 78–91. Cambridge University Press.
Nanson, G. C., R. W. Young and E. D. Stockton. 1987. Chronology and palaeoenvironment of theCranebrook Terrace (near Sydney) containing artefacts more than 40,000 years old.Archaeology in Oceania 22 (2): 72–8.
Nash, S. E. 1996. Is curation a useful heuristic? In G. H. Odell (ed.), Stone Tools. Theoretical Insights intoHuman Prehistory, pp. 81–99. New York: Plenum Press.
NSW Department of Public Works. 1977. Gosford–Wyong Water Supply. Mangrove Creek DamEnvironmental Impact Statement: Vol. 1: Summary of Investigations for Water Supply to theGosford–Wyong Region. Vol. 2: Environmental Impact of the Proposed Mangrove CreekDam. NSW Department of Public Works.
NSW National Parks & Wildlife Service. 1979. For Planners and Developers. Aboriginal Sites in NSW. NSWNational Parks & Wildlife Service.
Neal, R. and E. Stock. 1986. Pleistocene occupation in the south-east Queensland coastal region. Nature323 (6089): 618–21.
Nelson, M. C. 1991. The study of technological organisation. In M. B. Schiffer (ed.), Archaeological Methodand Theory 3: 57–100. Tucson: University of Arizona Press.
Nolan, A. 1986. Sandstone Point: Temporal and Spatial Patterns of Aboriginal Site Use at a MiddenComplex, South-east Queensland. Unpublished BA(Hons) thesis, University of Queensland,Brisbane.
O’Connell, J. F. and J. Allen. 1995. Human reactions to the Pleistocene–Holocene transition in GreaterAustralia: a summary. In J. Allen and J. F. O’Connell (eds), Transitions. Pleistocene to Holocene inAustralia and Papua New Guinea. Antiquity 69 (Special No. 265): 855–62.
O’Connor, S. 1999. 30,000 Years of Aboriginal Occupation: Kimberley, North West Australia. Terra Australis14. Canberra: Department of Archaeology and Natural History and Centre for ArchaeologicalResearch, Australian National University.
O’Connor, S., P. Veth, and N. Hubbard. 1993. Changing interpretations of postglacial human subsistenceand demography in Sahul. In M. A. Smith, M. Spriggs, and B. Fankhauser (eds), Sahul inReview. Pleistocene Archaeology in Australia, New Guinea and Island Melanesia, pp. 95–105.Canberra: Department of Prehistory, Research School of Pacific Studies, Australian NationalUniversity.
terra australis 21
268
References

Odell, G. H. 1996. Economizing behaviour and the concept of ‘curation’. In G. H. Odell (ed.), Stone Tools.Theoretical Insights into Human Prehistory, pp. 51–80. New York: Plenum Press.
Odell, G. H., B. D. Hayden, J. K. Johnson, M. Kay, T. A. Morrow, S. E. Nash, M. S. Nassaney, J. W. Rick,M. F. Rondeau, S. A. Rosen, M. J. Shott and P. T. Thacker. 1996. Some comments on acontinuing debate. In G. H. Odell (ed.), Stone Tools. Theoretical Insights into Human Prehistory,pp. 337–92. New York: Plenum Press.
O’Donnell, G. and M. J. Walker. 1982. Archaeological Excavation at Reef Beach, Balgowlah, NSW.Unpublished report for NSW National Parks and Wildlife Service.
Orton, C. 1980. Mathematics in Archaeology. Cambridge University Press. O’Shea, J. and P. Halstead. 1989. Conclusions: bad year economics. In P. Halstead and J. O’Shea (eds),
Bad Year Economics: Cultural Responses to Risk and Uncertainty, pp. 123–26. CambridgeUniversity Press.
Owen, J. F. 1984. Bones to scale: the interpretation of fish remains from New South Wales coastalmiddens. Unpublished BA (Hons) thesis, University of Sydney.
Owen, J. F. and J. R. Merrick. 1994. Analysis of coastal middens in south-eastern Australia: sizing of fishremains in Holocene deposits. Journal of Archaeological Science 21: 3–10.
Packard, P. W. 1984. With A Pinch of Salt: The Archaeology of Saline–Seepage Erosion Sites in the YassRiver Basin. Unpublished B. Litt. thesis, Australian National University, Canberra.
Packard, P. 1992. An Archaeological Assessment of State Forests in the Kempsey and Wauchope ForestryManagement Areas. Unpublished report to Forestry Commission of New South Wales, Sydney.
Parry, W. J. and R. L. Kelly. 1987. Expedient core technology and sedentism. In J. K. Johnson and C. A.Morrow (eds), The Organization of Core Technology, pp. 285–304. Boulder: Westview SpecialStudies in Archaeological Research. Westview Press.
Paton, R. and I. Macfarlane. 1989. An Excavation of Abrahams Bosom Rockshelter 1 near Currarong,Jervis Bay, New South Wales. Unpublished report to the NSW National Parks and WildlifeService and the NSW Department of Lands.
Pearson, M. 1981. Seen Through Different Eyes: Changing Land Use and Settlement Patterns in theUpper Macquarie Region of NSW, from Prehistoric Times to 1860. Unpublished PhD thesis,Australian National University, Canberra.
Peterson, N. 1976. The natural and cultural areas of Aboriginal Australia: a preliminary analysis ofpopulation groupings with adaptive significance. In N. Peterson (ed.), Tribes and Boundaries inAustralia, pp. 50–71. Canberra: Australian Institute of Aboriginal Studies, and New Jersey:Humanities Press Inc.
Poiner, G. 1971. Process of The Year. Unpublished BA(Hons) thesis, University of Sydney. Poiner, G. 1974. The trial excavation of an estuarine rock shelter at Yowie Bay. In J. V. S. Megaw (ed.), The
Recent Archaeology of the Sydney District. Excavations 1964–1967, pp. 28–34. Canberra: AustralianInstitute of Aboriginal Studies.
Poiner, G. 1976. The process of the year among Aborigines of the central and south coast of New SouthWales. Archaeology and Physical Anthropology in Oceania 11 (3): 186–206.
Pye, K. and G. M. Bowman. 1984. The Holocene marine transgression as a forcing function in episodicdune activity on the eastern Australian coast. In B. G. Thom (ed.), Coastal Geomorphology inAustralia, pp. 179–96. Academic Press.
Read, D. W. 1975. Regional sampling. In J. W. Mueller (ed.), Sampling in Archaeology, pp. 45–60. Tucson:University of Arizona Press.
Rich, E. 1992. Narama Salvage Project, Lower Bayswater Creek, Hunter Valley, NSW. Vol. 1: Overview.Unpublished report by Brayshaw McDonald Pty Ltd for Envirosciences Pty Ltd and NaramaJoint Venture, Sydney/Newcastle.
Richardson, N. 1992. Conjoin sets and stratigraphic integrity in a sandstone shelter: Kenniff Cave(Queensland, Australia). Antiquity 66 (251): 408–18.
Richardson, N. 1996. Seeing is believing: a graphical illustration of the vertical and horizontaldistribution of conjoined artefacts using DesignCAD 3D. In S. Ulm, I. Lilley and A. Ross (eds),Australian Archaeology ’95. Proceedings of the 1995 Australian Archaeological Association AnnualConference, pp. 81–95. Tempus 6. St Lucia, Brisbane: Anthropology Museum, University ofQueensland.
terra australis 21
269
References

Rivett, L. 1980. The Photogrammetric Recording of Aboriginal Art Sites in the North Metropolitan andHawkesbury Districts. Unpublished report by Department of Surveying, University ofMelbourne, to NSW National Parks & Wildlife Service.
Roberts, A. L. and F. D. Pate. 1999. Late Holocene climatic changes recorded in macropod bone collagenstable carbon and nitrogen isotopes at Fromms Landing, South Australia. AustralianArchaeology 49: 48–9.
Robertson, G. 2002. Birds of a feather stick: microscopic feather residues on stone artefacts from DeepCreek Shelter, New South Wales. In S. Ulm, C. Westcott, J. Reid, A. Ross, I. Lilley, J. Prangnelland L. Kirkwood (eds), Barrier, Borders, Boundaries. Proceedings of the 2001 Australian ArchaeologicalAssociation Annual Conference, pp. 175–182. Tempus 7. St Lucia, Brisbane: AnthropologyMuseum, The University of Queensland.
Robins, R. 1996. A report on archaeological investigations of open hearth sites in south-westQueensland. Queensland Archaeological Research 10: 25–35.
Robins, R. P. 1997. Patterns in the landscape: a case study in nonsite archaeology from south-westQueensland. Memoirs of the Queensland Museum, Cultural Heritage Series 1 (1): 23–56.
Rodbell, D. T., G. O. Seltzer, D. M. Anderson, M. B. Abbott, D. B. Enfield and J. H. Newman. 1999. An~15,000-year record of El Niño-driven alluviation in south-western Ecuador. Science 283:516–20.
Rognon, P. and M. A. J. Williams. 1977. Late Quaternary climatic changes in Australia and North Africa:a preliminary interpretation. Palaeogeography, Palaeoclimatology, Palaeoecology 21: 285–327.
Rosenfeld, A. 2002. Rock-art as an indicator of changing social geographies in Central Australia. InB. David and M. Wilson (eds), Inscribed Landscapes. Marking and Making Place, pp. 61–78.Honolulu: University of Hawai’i Press.
Rosenfeld, A., D. Horton and J. Winter. 1981. Early Man in North Queensland. Art and Archaeology in theLaura Area. Terra Australis 6. Canberra: Department of Prehistory, Research School of PacificStudies, Australian National University.
Rosenfeld, A., J. Winston-Gregson and K. Maskell. 1983. Excavations at Nursery Swamp 2, GudgenbyNature Reserve, Australian Capital Territory. Australian Archaeology 17: 48–58.
Ross, A. 1976. Inter-tribal Contacts — What The First Fleet Saw. Unpublished BA(Hons) thesis,University of Sydney.
Ross, A. 1981. Holocene environments and prehistoric site patterning in the Victorian Mallee.Archaeology in Oceania 16 (3): 145–54.
Ross, A. 1982. Absence of evidence: reply to Keryn Kefous. Archaeology in Oceania 17 (2): 99–101. Ross, A. 1984. If There Were Water: Prehistoric Settlement Patterns in the Victorian Mallee. Unpublished
PhD thesis, Macquarie University, Sydney. Ross, A. 1985. Archaeological evidence for population change in the middle to late-Holocene in south-
eastern Australia. Archaeology in Oceania 20 (3): 81–9. Ross, A. 1988. Tribal and linguistic boundaries: a reassessment of the evidence. In G. Aplin (ed.), A
Difficult Infant. Sydney before Macquarie, pp. 42–53. Sydney: New South Wales University Press. Ross, A., T. Donnelly and R. Wasson. 1992. The peopling of the arid zone: human–environment
interactions. In J. Dodson (ed.), The Naive Lands, pp. 77–114. Longman Cheshire. Ross, A. and J. Specht. 1976. An archaeological survey on Port Jackson, Sydney. Australian Archaeology 5:
14–17. Ross, V. 1981. A Hawkesbury Story. Sydney: Library of Australian History. Rowland, M. J. 1983. Aborigines and environment in Holocene Australia: changing paradigms.
Australian Aboriginal Studies 1983/2: 62–77. Rowland, M. J. 1989. Population increase, intensification or a result of preservation? Explaining site
distribution patterns on the coast of Queensland. Australian Aboriginal Studies 1989/2: 32–42. Rowland, M. J. 1999. The Keppel Islands — ‘a 3000 year’ event revisited. In J. Hall. and I. J. McNiven
(eds), Australian Coastal Archaeology, pp. 141–55. Canberra: ANH Publications, Department ofArchaeology and Natural History, Research School of Pacific and Asian Studies, AustralianNational University.
Roy, P. S. 1983. Quaternary geology. In C. Herbert (ed.), Geology of the Sydney 1: 100,000 Sheet 9130,pp. 41–91. Sydney: Geological Survey of New South Wales, Department of Mineral Resources.
terra australis 21
270
References

Roy, P. S. 1984. New South Wales estuaries: their origin and evolution. In B. G. Thom (ed.), CoastalGeomorphology in Australia, pp. 99–121. Academic Press.
Roy, P. S. 1994. Holocene estuary evolution — stratigraphic studies from south-eastern Australia.Incised-valley Systems: Origin and Sedimentary Sequences SEPM Special Publication 51: 241–63.Society for Sedimentary Geology.
Roy, P. S. 1998. Cainozoic geology of the coast and shelf. In E. Scheibner, H. Basden (eds), Geology of NewSouth Wales — Synthesis. Vol. 2: Geological Evolution, pp. 361–85. Geological Survey of New SouthWales Memoir Geology 13 (2).
Roy, P. S. and B. G. Thom. 1981. Late Quaternary marine deposition in New South Wales and southernQueensland — an evolutionary model. Journal of the Geological Society of Australia 28: 471–89.
Roy, P. S., W. -Y. Zhuang, G. F. Birch, P. J. Cowell and L. Congxian. 1997. Quaternary Geology of theForster–Tuncurry Coast and Shelf, Southeast Australia. Geological Survey Report: GS 1992/201.Final Report on the Marine Minerals Investigation — 1990 to 1991 — A Joint Government/IndustryResearch Project. Sydney: Geological Survey of New South Wales, Department of MineralResources.
Schiffer, M. B. 1976. Behavioural Archaeology. Academic Press. Schrire, C. 1972. Ethno-archaeological models and subsistence behaviour in Arnhem Land. In D. L. Clarke
(ed.), Models in Archaeology, pp. 653–70. London: Methuen and Co Ltd. Schrire, C. 1982. The Alligator Rivers. Prehistory and Ecology in Western Arnhem Land. Terra Australia 7.
Canberra: Department of Prehistory, Research School of Pacific Studies, Australian NationalUniversity.
Schwartz, D. W. 1956. Demographic changes in the early periods of Cohonina prehistory. In G. R. Willey(ed.), Prehistoric Settlement Patterns in the New World, pp. 26–31. Viking Fund Publications inAnthropology 23. Wenner Gren Foundation for Anthropological Research Inc.
Sefton, C. E. 1988. Site and Artefact Patterns on the Woronora Plateau. Unpublished MA thesis, Universityof Sydney.
Shott, M. J. 1986. Technological organisation and settlement mobility: an ethnographic examination. Journalof Anthropological Research 42: 15–51.
Shott, M. J. 1989. Shovel-test sampling in archaeological survey: comments on Nance and Ball, andLightfoot. American Antiquity 54 (2): 396–404.
Singh, G. 1983a. Late Quaternary vegetation and lake level record from Lake George, New South Wales: 18+/- 2KA. In J. M. A. Chappell and A. Grindrod (eds), Climanz. Proceedings of the First ClimanzConference, p. 66. Canberra: Department of Biogeography and Geomorphology, Research Schoolof Pacific Studies, Australian National University.
Singh, G. 1983b. Late Quaternary vegetation and lake level record from Lake George, New South Wales: 32+/- 5KA. In J. M. A. Chappell and A. Grindrod (eds), Climanz. Proceedings of the First ClimanzConference, pp. 23-4. Canberra: Department of Biogeography and Geomorphology, ResearchSchool of Pacific Studies, Australian National University.
Smith, L. J. 1986. Artefact analysis of a 3450 year old open site at Quaker’s Hill on the Cumberland Plain,New South Wales. Australian Archaeology 23: 11–24.
Smith, M. A. 1982. Devon Downs reconsidered: changes in site use at a lower Murray Valley rock-shelter.Archaeology in Oceania 17 (3): 109–16.
Smith, M. A. 1989. The case for a resident human population in the Central Australian Ranges during fullglacial aridity. Archaeology in Oceania 24 (3): 93–105.
Stanner, W. E. H. 1965. Aboriginal territorial organisation: Estate, range, domain and regime. Oceania 36 (1):1–26.
Steele, D. 1987. Intra-site Refuse Disposal and Australian Rock Shelters. Unpublished BA(Hons) thesis,University of Sydney.
Stern, N. 1981. A Preliminary Analysis of the Retouched/Use-wear Component of the Loggers StoneAssemblage. Appendix 3 in V. Attenbrow, Mangrove Creek Dam Salvage Excavation Project,Vol. 2. Unpublished report to NSW National Parks & Wildlife Service on behalf of NSWDepartment of Public Works.
terra australis 21
271
References
terra australis 21
272
Stern, N. 1982. Analysis of the Stone Artefact Component from Deep Creek Shelter, Mangrove Creek, NSW.Appendix 2 in V. Attenbrow, Archaeological Investigation of Deep Creek Shelter, MangroveCreek Dam. Unpublished report to NSW National Parks & Wildlife Service on behalf of NSWDepartment of Public Works.
Stockton, E. D. 1970a. An archaeological survey of the Blue Mountains. Mankind 7 (4): 295–301. Stockton, E. D. 1970b. Some observations on Bondi points. Mankind 7 (3): 227–9. Stockton, E. D. 1973. Shaws Creek shelter: human displacement of artefacts and its significance. Mankind
9 (2): 112–17. Stockton, E. D. 1977a. Pre-microlithic industries in south-east Australia. The Artefact 2 (4): 209–19. Stockton, E. D. 1977b. Review of early Bondaian dates. Mankind 11 (1): 48–51. Stockton, E. D. 1977c. Taxonomy at the service of prehistory. In R. V. S. Wright (ed.), Stone Tools as
Cultural Markers: Change, Evolution and Complexity, pp. 340–3. Canberra: Australian Institute ofAboriginal Studies, and New Jersey: Humanities Press Inc.
Stockton, E. D. 1979. The search for the first Sydneysiders. In P. Stanbury (ed.), 10,000 Years of Sydney Life.A Guide to Archaeological Discovery, pp. 49–54. University of Sydney: The Macleay Museum.
Stockton, E. D. 1981. Reflections around the campfire. The Artefact 6: 3–16. Stockton, E. D. 1993. Archaeology of the Blue Mountains. In E. Stockton (ed.), Blue Mountains Dreaming.
The Aboriginal Heritage, pp. 23–52. Winmalee, NSW: A Three Sisters Publication.Stockton, E. D. n.d. [ca 1973]. Kings Table Shelter. Report submitted to NSW National Parks and
Wildlife Service. Stockton, E. D. and W. Holland. 1974. Cultural sites and their environment in the Blue Mountains.
Archaeology and Physical Anthropology in Oceania 9 (1): 36–65. Strahan, R. (ed.) 2000. The Mammals of Australia: The National Photographic Index of Australian Wildlife.
Sydney: The Australian Museum and Reed New Holland. Straus, L. G. and G. A. Clark. 1983. Further reflections on adaptive change in Cantabrian prehistory. In
G. Bailey (ed.), Hunter-Gatherer Economy in Prehistory: A European Perspective, pp. 166–67.Cambridge University Press.
Struever, S. 1968. Woodland subsistence-settlement systems in the Lower Illinois Valley. In S. R. Binfordand L. R. Binford (eds), New Perspectives in Archaeology, pp. 285–312. Atherton: Aldine.
Struever, S. 1971. Comments on archaeological data requirements and research strategy. AmericanAntiquity 36 (1): 9–19.
Stuiver, M. and P. J. Reimer. 1993a. CALIB User’s Guide Rev. 3. 0. 1. Seattle: Quaternary Research CentreAK-60, University of Washington.
Stuiver, M. and P. J. Reimer. 1993b. Extended 14C data base and revised CALIB 3. 0 14C calibrationprogram. Radiocarbon 35 (1): 215–230.
Stuiver, M., P. J. Reimer, E. Bard, J. W. Beck, G. S. Burr, K. A. Hughen, B. Kromer, F. G. McCormac, J. vander Plicht and M. Spurk. 1998 INTCAL98: Radiocarbon age calibration 24,000 — 0 cal BP.Radiocarbon 40 (3): 1041–1083.
Sullivan, M. E. 1982a. Aboriginal Shell Middens in the Coastal Landscape of New South Wales.Unpublished PhD thesis, Australian National University, Canberra.
Sullivan, M. E. 1982b. Exploitation of offshore islands along the New South Wales coastline. AustralianArchaeology 15: 8–19.
Sullivan, M. E. 1984. A shell midden excavation at Pambula Lake on the far south coast of New SouthWales. Archaeology in Oceania 19 (1): 1–15.
Sullivan, M. E. and P. J. Hughes. 1983. The geoarchaeology of the Sydney Basin sandstones. In R. W.Young and G. C. Nanson (eds), Aspects of Australian Sandstone Landscapes, pp. 120–26.Australian and New Zealand Geomorphology Group Special Publication 1. Department ofGeography, University of Wollongong.
Sullivan, S. 1983. Making a discovery: the finding and reporting of Aboriginal sites. In G. Connah (ed.),Australian Field Archaeology. A Guide to Techniques, pp. 1–9. Canberra: Australian Institute ofAboriginal Studies.
Sutton, S. A. 1990. Pleistocene axes in Sahul: a response to Morwood and Tresize. QueenslandArchaeological Research 7: 95–109.
References

terra australis 21
273
Sydney Prehistory Group 1983. In Search of the Cobrakall. A Survey of Aboriginal Sites in the CampbelltownArea, South of Sydney. 2 vols. Sydney: NSW National Parks and Wildlife Service.
Szpak, C. 1997. But… has it been used? An Analysis of the Attributes of Shelters with Evidence of Use andShelters with the Potential for Use. Unpublished Diploma of Arts thesis, University of Sydney.
Taçon, P. 1991. The power of stone: symbolic aspects of stone use and tool development in westernArnhem Land, Australia. Antiquity 65 (247): 192–207.
Tench, W. 1789 and 1793 [1979]. Sydney’s First Four Years, being a reprint of a Narrative of the Expedition toBotany Bay, and A Complete Account of the Settlement at Port Jackson. Republished by Library ofAustralian History in association with the Royal Australian Historical Society, Sydney.
Therin Archaeological Consulting. 2000. Spring Gully 5 Salvage Excavation. Use-wear and ResidueReport, prepared for Haglund and Associates. Appendix in: Laila Haglund (2001), SalvageExcavation completed for Ulan Coal Mines Ltd: Site SG5, Aboriginal Rock Shelter Site, incompliance with requirements under NPWS Consent No. 1002. Vol. 1: Overview.
Thomas, D. H. 1975. Non-site sampling in archaeology: up the creek without a site? In J. W. Mueller(ed.), Sampling in Archaeology, pp. 61–81. Tucson: University of Arizona Press.
Thomas, D. H. 1979. Archaeology. USA: Holt, Rinehart and Winston. Thomas, N. 1981. Social theory, ecology and epistomology: theoretical issues in Australian prehistory.
Mankind 13 (2): 165–77. Thomas, D. H. 1989. Diversity in hunter-gatherer cultural geography. In R. D. Leonard and G. T. Jones
(eds), Quantifying Diversity in Archaeology, pp. 85–91. Cambridge: Cambridge University Press.Thorley, P. 1999. Regional archaeological research in the Palmer River catchment. Australian Aboriginal
Studies 1999/2: 62–8. Thorley, P. 2001. Uncertain supplies: water availability and regional archaeological structure in the
Palmer River catchment, central Australia. Archaeology in Oceania 36 (1): 1–14. Threlkeld, L. E. 1825. London Missionary Society. Aboriginal Mission, New South Wales, December,
1852[sic]. LMS Report December 1825 [printed, Sydney]. In N. Gunson (ed.), 1974. AustralianReminiscences and Papers of L. E. Threlkeld, Missionary to the Aborigines, 1824–1859, Vol. 2:189–94. Canberra: Australian Institute of Aboriginal Studies.
Threlkeld, L. E. 1825–26. Reminiscences of the Aborigines of New South Wales. Traits of the Aboriginesof New South Wales. In N. Gunson (ed.), 1974 Australian Reminiscences and Papers of L. E.Threlkeld, Missionary to the Aborigines, 1824–1859, Vol. 1: 41–80. Canberra: Australian Instituteof Aboriginal Studies.
Threlkeld, L. E. 1826. Second Half Yearly Report of the Aboriginal Mission supported by the LondonMissionary Society. L. E. Threlkeld, Missionary to the Aborigines New South Wales, Newcastle,June 21st 1826 [LMS Report 21 June 1826] [LMS Australia Letters]. In N. Gunson (ed.), 1974Australian Reminiscences and Papers of L. E. Threlkeld, Missionary to the Aborigines, 1824–1859 Vol.2: 204–10. Canberra: Australian Institute of Aboriginal Studies.
Tindale, N. B. 1957. Culture succession in south eastern Australia from late Pleistocene to the present.Records of the South Australian Museum 13 (1): 1–49.
Tindale, N. B. 1964. Radiocarbon dates of interest to Australian archaeologists. Australian Journal ofScience 27 (1): 24.
Torrence, R. 1983. Time budgeting and hunter-gatherer technology. In G. Bailey (ed.), Hunter-GathererEconomy in Prehistory. A European Perspective, pp. 11–22. Cambridge University Press.
Torrence, R. 1989a. Retooling: towards a behavioural theory of stone tools. In R. Torrence (ed.), Time,Energy and Stone Tools, pp. 57–66. Cambridge University Press.
Torrence, R. (ed.) 1989b. Time, Energy and Stone Tools. Cambridge University Press. Torrence, R. 1989c. Tools as optimal solutions. In R. Torrence (ed.), Time, Energy and Stone Tools, pp. 1–6.
Cambridge University Press.Torrence, R. 2001. Hunter-gatherer technology: macro- and microscale approaches. In C. Panter-Brick,
R. H. Layton and P. Rowley-Conwy (eds), Hunter-gatherers: An Interdisciplinary Perspective, pp.73–98. Cambridge University Press.
Tracey, R. 1974. Three minor sites near Curracurrang Cove with a preliminary note on a rock shelter atNewport. In J. V. S. Megaw (ed.), The Recent Archaeology of the Sydney District. Excavations1964–1967, pp. 19–27. Canberra: Australian Institute of Aboriginal Studies.
References

Tresize, P. 1971. Rock Art of South-east Cape York. Canberra: Australian Institute of Aboriginal Studies.Ulm, S. and J. Hall. 1996. Radiocarbon and cultural chronologies in southeast Queensland prehistory. In
S. Ulm, I. Lilley and A. Ross (eds), Australian Archaeology ‘95. Proceedings of the 1995 AustralianArchaeological Association Annual Conference, pp. 45–62. Tempus 6. St Lucia, Brisbane: AnthropologyMuseum, University of Queensland.
Ulm, S. and I. Lilley 1999. The archaeology of the southern Curtis Coast: an overview. QueenslandArchaeological Research 11: 59–73.
Vestjens, W. J. M. 1973. Feeding of White Ibis on freshwater mussels. The Emu 73 (2): 71–2. Veth, P. 1989. Islands in the interior: a model for the colonization of Australia’s arid zone. Archaeology in
Oceania 24 (3): 81–92. Veth, P. M. 1993. Islands in the Interior. The Dynamics of Prehistoric Adaptations within the Arid Zone of
Australia. Michigan: International Monographs in Prehistory. Veth, P., S. O’Connor and L. A. Wallis. 2000. Perspectives on ecological approaches in Australian
archaeology. Australian Archaeology 50: 54–66. Vinnicombe, P. 1980. Predilection and Prediction: A Study of Aboriginal Sites in the Gosford–Wyong
Region. Unpublished report to NSW National Parks & Wildlife Service. Vinnicombe, P. 1984. Single sites or site complexes? A case study from north of the Hawkesbury, New
South Wales. In S. Sullivan and S. Bowdler (eds), Site Surveys and Significance Assessment inAustralian Archaeology, pp. 107–18. Canberra: Department of Prehistory, Research School ofPacific Studies, Australian National University.
Wade, J. P. 1967. Excavation of a rock-shelter at Connels Point, New South Wales. Archaeology andPhysical Anthropology in Oceania 2 (1): 35–40.
Wasson, R. J. 1982. Holocene terrestrial stratigraphy. In B. G. Thom and R. J. Wasson (eds), HoloceneResearch in Australia, 1978–1982 pp. 1–4. Duntroon ACT: Department of Geography, Faculty ofMilitary Studies, University of New South Wales, Royal Military College.
Watchman, A. 1982. A Brief Inspection of the Preservation of Aboriginal Rock-art at Mangrove Creek,New South Wales. Unpublished report sent to Val Attenbrow.
Webb, S. and S. Cane. 1986. An Excavation and Analysis of 2 Aboriginal Shell Middens near Merimbula,New South Wales. Unpublished report to Sinclair Knight and Partners Pty Ltd.
Weiss, K. M. 1978. Archaeological approaches to population inference. American Antiquity 43 (4): 773–6. Westcott, C., I. Lilley, S. Ulm, C. Clarkson and D. Brian. 1999. Big Foot Art Site, Cania Gorge: site report.
Queensland Archaeological Research 11: 43–58. White, C. and N. Peterson. 1969. Ethnographic interpretations of the prehistory of western Arnhem
Land. South-western Journal of Anthropology 25 (1): 45–67. White, E. 1997 [1998]. Archaeological Salvage of Site WGO3-2 (NPWS No. 45-5-971) at Wattle Grove,
NSW. Unpublished report prepared for Jo McDonald Cultural Heritage Management forDelfin Management Services Pty Ltd.
White, E. 2001. Stone Artefact Analysis. Volume 2 in L. Haglund, Salvage Excavation completed forUlan Coal Mines Ltd: Site SG5, Aboriginal Rock Shelter Site, in compliance with requirementsunder NPWS Consent No. 1002. Unpublished report to Ulan Coal Mines Ltd.
White, J. 1790 [1962]. Journal of a Voyage to New South Wales. Piccadilly: J. Debrett. [Republished by Angus and Robertson in association with the Royal Australian Historical Society, Sydney.]
White, J. P. and P. J. Habgood. 1985. La préhistoire de l’Australie. La Recherche 167: 730–7. White, J. P. and J. F. O’Connell. 1982. A Prehistory of Australia, New Guinea and Sahul. Academic Press. White, J. P. and C. Wieneke. n.d. [ca 1975.]. Henry Lawson Drive Rockshelter: Excavation Report.
Unpublished report to NSW National Parks & Wildlife Service. Whitelaw, T. 1983. People and space in hunter-gatherer camps: a generalizing approach in
ethnoarchaeology. Archaeological Review from Cambridge 2 (2): 48–66. Wiessner, P. 1982a. Beyond willow smoke and dogs’ tails: a comment on Binford’s analysis of hunter-
gatherer settlement systems. American Antiquity 47 (1): 171–8. Wiessner, P. 1982b. Risk, reciprocity and social influence on !Kung San economics. In E. R. Leacock and
R. B. Lee (eds), Politics and History in Band Societies, pp. 61–84. Cambridge University Press andEditions de la Maison des Sciences de l’Homme, Paris.
terra australis 21
274
References
Willey, G. R. 1953. Prehistoric Settlement Patterns in the Virú Valley, Perú. Smithsonian Institution, Bureauof American Ethnology Bulletin 155. Washington: United States Government Printing Office.
Willey, G. R. 1956. Problems concerning prehistoric settlement patterns in the Maya lowlands. In G. R.Willey (ed.), Prehistoric Settlement Patterns in the New World, pp. 107–14. Wenner-GrenFoundation for Anthropological Research Inc.
Willey, G. R. and P. Phillips. 1962. Method and Theory in American Archaeology. Phoenix Books, theUniversity of Chicago Press.
Williams, E. 1985. Wet Underfoot? Earth Mound Sites and the Recent Prehistory of South-westernVictoria. Unpublished PhD thesis, Australian National University, Canberra.
Williams, E. 1987. Complex hunter-gatherers: a view from Australia. Antiquity 61 (232): 310–21. Williams, E. 1988. Complex Hunter-Gatherers. A Late Holocene Example from Temperate Australia. Oxford:
British Archaeological Reports, International Series 423. Williamson, C. 1998. Late Holocene Australia and the writing of Aboriginal history. In T. Murray (ed.),
Archaeology of Aboriginal Australia. A Reader, pp. 141–8. Sydney: Allen and Unwin. Wobst, H. M. 1983. We can’t see the forest for the trees: sampling and the shapes of archaeological
distributions. In J. A. Moore and A. S. Keene (eds), Archaeological Hammers and Theories, pp.37–85. Academic Press.
Worgan, G. B. 1788 [1978]. Journal of a First Fleet Surgeon. The William Dixson Foundation: Publication16. Sydney: the Library Council of New South Wales in association with the Library ofAustralian History.
Worrall, L. 1980. Geoarchaeological Investigations at Mangrove Creek, NSW. Unpublished BA(Hons)thesis, Australian National University, Canberra.
Wright, R. V. S. 1992. 2nd ed. Doing Multivariate Archaeology and Prehistory: Handling Large Data Sets withMV-Arch. Balmain: R. V. S. Wright.
Yoffee, N. 1985. Perspectives on ‘trends toward social complexity in prehistoric Australia and PapuaNew Guinea’. Archaeology in Oceania 20 (2): 41–9.
Zola, N. and B. Gott. 1992. Koorie Plants Koorie People. Traditional Aboriginal Food, Fibre and Healing Plantsof Victoria. Melbourne: Koorie Heritage Trust.
terra australis 21
275
References


terra australis 21
277
APPENDIX 1
The Upper Mangrove Creek catchment —random sampling units
Distribution of artefact types and rawmaterials in each archaeological deposit
Key to abbreviations in Appendix 1 tables
Stone artefact types and abbreviations used in tables: BP Bondi pointGeo Geometric microlithBMs Miscellaneous backed artefactEl EloueraRuw Other flaked artefact with retouch and/or use wear (on conchoidal or bipolar
flake, or flaked piece)GrF Fragment of ground implement, for example, flake or flaked piece with ground
surfaceCHh Core — hand-held percussionCBi Bipolar coreFBi Bipolar flake or fragmentFP Flaked piece — see notes belowGrI Ground implement — whole or broken/damagedH/M Hammerstone or manuportSP Split pebble — see notes belowFrP Fractured piece — see notes belowWste Waste — see notes below

What’s changing: population size or land-use patterns? The archaeology of Upper Mangrove Creek, Sydney Basin
terra australis 21
278
Notes on artefact types
Bipolar cores, flakes and flaked piecesFor Loggers and Black Hands, which were analysed during the salvage project, artefactsshowing evidence of bipolar reduction were grouped together under the heading ‘bipolarpieces’ and were not classified separately into bipolar core, flake or fragment.
WasteThis category includes whole and broken flakes as well as flaked pieces. The category flakedpiece includes: (a) pieces which are clearly artefacts, in that they have surfaces with remnants of the
flaking process — for example, partial flake scars — but lack clear features (such asstriking platforms, impact points, bulbs of percussion, ring cracks or distinct ventralsurfaces which show the direction of blow) to enable their definite identification ascores or flakes. These pieces may derive from either hand-held cores or bipolartechniques, and many probably result from uncontrolled fracturing along incipientfracture planes in the raw material during knapping. Most of the catchment artefactsare made from river pebbles, which were probably derived from the sandstoneconglomerates in the catchment. Because of their geological history, many of thepebbles have distinct fracture planes running through their bodies as well as visibleimpact points on the outer cortex.
(b) heat-fractured fragments. They were not separated out or quantified, but appeared tobe relatively few in number.
Split pebbles are pebbles with a single break (i.e., as if the pebble had been split in half). Thebroken surface has a fresh appearance with unworn/unrounded edges, but there are nodiscernible impact points or flake scars. There was thus no clear sign that they were humanlyproduced artefacts. However, since they occur mainly in sites with large assemblages — forexample, Loggers, Black Hands, Emu Tracks 2 — it seems likely they are present throughhuman activities rather than being roof-fall. Their presence principally in large assemblagesmay well be a result of sample size. However, if they were roof-fall or slopewashed materialstheir abundance would relate more to the area excavated rather than assemblage size, which isnot always the case.
Fractured pieces, as with split pebbles, do not show any distinguishing features. However,because of their angular shape, the fresh appearance of their fractures and surfaces, and/orraw material type (usually quartz), they are considered more likely to be humanly producedartefacts derived from uncontrolled shatter during knapping than naturally broken pebblesderived from roof-fall or slopewash. Obvious naturally fractured pebbles which had roundededges or ‘stained’ inner surfaces, or where two half pebbles could conjoin, were not includedin this category.

Raw material categories and abbreviations used in tables:
Qz QuartzFGS Fine-grained siliceous — see notes belowCht Chert — see notes belowSilc SilcreteQzte Quartzite — also includes meta-quartzite, orthoquartzite/indurated sandstone
and possibly some coarse-grained silcreteIgn Igneous — principally basalt
Notes on raw materialsMost artefacts are made from pebbles and cobbles of quartz, FGS, chert (excluding tuff) andquartzite which have eroded out of the Narrabeen Group (sandstone) conglomerate layerswithin the catchment and can be collected from lower ridgesides and particularly creek bedswithin that geological stratum (pers. obs.).
The chert category in the following tables includes jasper, chalcedony, induratedsiltstone/mudstone, as well as volcanic tuff. The volcanic tuff is similar to and may be Nobbystuff (or tuffite), which is exposed in various places in the Hunter Valley, such as the cliffs at themouth of the Hunter River (Herbert and Helby 1980: 465–72), and the Blue Mountains, such asthe Grose Valley, which drains into the Hawkesbury River. Enright (1935: 8) and Moore (1981:422–3) referred to this material as Merewether chert. Sources of similar tuffaceous materialoccur in the Upper Grose Valley and in the gravels of the Grose and Hawkesbury Rivers.
Other terms used in tables
Surfgen The general surface of the shelter deposit, outside the excavated squares or test pits
T/Surf The surface of the excavated square or test pit
terra australis 21
279
Appendix 1
TTaabbllee AA11//11 Artefact types in surface collections from rockshelters and open locations. [1] GRI is a preform for an axe/hatchet,
flaked and possibly partially ground. [2] GRI is a broken ground-edged implement ca 9 x 6 x 1.5cm.
SITE NAME ARTEFACT TYPES
BP GEO BMS EL RUW GRF CHH CBI FBI WSTE GRI H/M SP/FRP TOTAL
Axehead Shelter 0 0 0 0 0 0 0 0 0 0 [1]1 0 0 1
Button Shelter 0 0 0 0 0 0 0 1 0 3 0 0 0 4
Kyola Road Open 0 0 0 0 0 0 1 0 0 3 0 0 0 4
Deposit
Palmers Crossing 0 0 0 0 1 0 0 0 0 1 0 0 0 2
Open Deposit
Token Male Shelter 0 0 0 0 0 0 1 0 0 1 [2]1 0 0 3
Willow Tree Gully 0 0 0 0 0 0 2 0 0 4 0 0 1 7
Open Deposit

What’s changing: population size or land-use patterns? The archaeology of Upper Mangrove Creek, Sydney Basin
terra australis 21
280
TTaabbllee AA11//22 Raw materials in surface collections from rockshelters and open locations.
SITE NAME RAW MATERIALS
QZ FGS CHT SILC QZTE IGN OTHER TOTAL
AXEHEAD SHELTER 0 0 0 0 0 1 0 1
BUTTON SHELTER 4 0 0 0 0 0 0 4
KYOLA ROAD OPEN DEPOSIT 1 0 0 0 3 0 0 4
PALMERS CROSSING OPEN DEPOSIT 0 0 2 0 0 0 0 2
TOKEN MALE SHELTER 1 1 0 0 0 1 0 3
WILLOW TREE GULLY OPEN DEPOSIT 2 3 2 0 0 0 0 7
TTaabbllee AA11//33 Anadara Shelter: distribution of artefact types.
SQ/SPIT BP GEO BMS EL RUW GRF CHH CBI FBI WSTE GRI H/M SP/FRP TOTAL
AS/SURFGEN 0 0 0 0 0 0 1 0 0 2 0 0 0 3
AS/T1/SURF-4 0 0 0 0 0 0 0 0 0 0 0 0 0 0
AS/T2/SURF 0 0 0 0 0 0 0 0 0 0 0 0 0 0
AS/T2/1 0 0 0 0 0 0 0 0 0 0 0 0 0 0
AS/T2/2-BRN 0 0 0 0 0 0 0 0 0 0 0 0 0 0
AS/T2/2-RB 0 0 0 0 1 0 0 0 0 1 0 0 0 2
AS/T2/3-BRN 0 0 0 0 0 0 0 0 0 0 0 0 0 0
AS/T2/3-RB (STH) 0 0 0 0 0 0 0 0 0 1 0 0 0 1
AS/T2/4-BRN 0 0 0 0 1 0 0 0 0 1 0 0 0 2
AS/T2/5-BRN 0 0 0 0 1 1 0 1 1 11 0 0 0 15
TOTAL EXC+SURFGEN 0 0 0 0 3 1 1 1 1 16 0 0 0 23
TTaabbllee AA11//44 Anadara Shelter: distribution of raw materials.
SQ/SPIT QZ FGS CHT SILC QZTE IGN OTHER TOTAL
AS/SURFGEN 2 1 0 0 0 0 0 3
AS/T1/SURF–4 0 0 0 0 0 0 0 0
AS/T2/SURF 0 0 0 0 0 0 0 0
AS/T2/1 0 0 0 0 0 0 0 0
AS/T2/2-BRN 0 0 0 0 0 0 0 0
AS/T2/2-RB 1 0 1 0 0 0 0 2
AS/T2/3-BRN 0 0 0 0 0 0 0 0
AS/T2/3-RB (STH) 1 0 0 0 0 0 0 1
AS/T2/4-BRN 1 1 0 0 0 0 0 2
AS/T2/5-BRN 6 4 4 0 0 1 0 15
TOTAL EXC+SURFGEN 11 6 5 0 0 1 0 23

terra australis 21
281
TTaabbllee AA11//55 Black Hands Open Deposit: distribution of artefact types.
SQ/SPIT BP GEO BMS EL RUW GRF CHH CBI FBI WSTE GRI H/M SP/FRP TOTAL
BHO/SURFGEN 0 0 0 0 2 1 2 2 2 2 0 0 3 14
BHO/T1/SURF 0 0 0 0 0 0 0 0 0 0 0 0 0 0
BHO/T1/1 0 0 0 0 0 0 0 0 0 0 0 0 0 0
BHO/T1/2 0 0 0 0 0 0 0 1 0 1 0 0 0 2
BHO/T1/3–8 0 0 0 0 0 0 0 0 0 0 0 0 0 0
BHO/T2/SURF 0 0 0 0 0 0 0 0 0 0 0 0 0 0
BHO/T2/1 0 0 0 0 0 0 0 0 2 2 0 0 0 4
BHO/T2/2 0 0 0 0 0 0 0 1 3 1 0 0 0 5
BHO/T2/3 0 0 0 0 0 0 0 0 0 1 0 0 0 1
BHO/T2/4 0 0 0 0 0 0 0 0 0 0 0 0 0 0
TOTAL EXC+SURFGEN 0 0 0 0 2 1 2 4 7 7 0 0 3 26
TTaabbllee AA11//66 Black Hands Open Deposit: distribution of raw materials.
SQ/SPIT QZ FGS CHT SILC QZTE IGN OTHER TOTAL
BHO/SURFGEN 6 6 1 0 0 1 0 14
BHO/T1/SURF 0 0 0 0 0 0 0 0
BHO/T1/1 0 0 0 0 0 0 0 0
BHO/T1/2 2 0 0 0 0 0 0 2
BHO/T1/3–8 0 0 0 0 0 0 0 0
BHO/T2/SURF 0 0 0 0 0 0 0 0
BHO/T2/1 2 1 0 1 0 0 0 4
BHO/T2/2 3 1 0 1 0 0 0 5
BHO/T2/3 0 1 0 0 0 0 0 1
BHO/T2/4 0 0 0 0 0 0 0 0
TOTAL EXC+SURFGEN 13 9 1 2 0 1 0 26
TTaabbllee AA11//77 Black Hands Shelter (Square F): distribution of artefact types. [1] Surface artefacts present but not collected or
recorded. [2] Artefacts in this assemblage were analysed during the salvage program and bipolar flakes were included with
bipolar cores in a category bipolar pieces.
SQ/SPIT BP GEO BMS EL RUW GRF CHH CBI FBI[2] WSTE GRI H/M SP/FRP TOTAL
BHS/SURFGEN[1]
BHS/F/SURF+1 0 0 0 0 1 1 1 4 X 29 0 0 0 36
BHS/F/2 0 0 0 0 3 2 0 18 X 153 0 0 5 181
BHS/F/3 0 0 0 0 11 0 0 20 X 311 0 0 1 343
BHS/F/4 0 1 0 0 13 1 2 19 X 449 0 0 0 485
BHS/F/5 0 0 0 0 23 0 2 36 X 599 0 0 4 664
BHS/F/6 3 1 4 0 18 3 8 60 X 977 0 0 2 1076
BHS/F/7-S 4 0 1 0 1 0 5 12 X 353 0 0 1 377
BHS/F/8-S 0 0 0 0 0 0 0 1 X 82 0 0 0 83
BHS/F/9-S 1 0 1 0 0 0 0 2 X 41 0 0 0 45
BHS/F/10-SE 0 0 0 0 1 0 0 0 X 9 0 0 0 10
BHS/F/11-SE 0 0 0 0 0 0 0 0 X 2 0 0 0 2
TOTAL EXC+SURFGEN 8 2 6 0 71 7 18 172 X 3005 0 0 13 3302
Appendix 1

What’s changing: population size or land-use patterns? The archaeology of Upper Mangrove Creek, Sydney Basin
terra australis 21
282
TTaabbllee AA11//88 Black Hands Shelter (Square F): distribution of raw materials. [1] Surface artefacts present but not collected or
recorded.
SQ/SPIT QZ FGS CHT SILC QZTE IGN OTHER TOTAL
BHS/SURFGEN[1]
BHS/F/SURF+1 24 7 2 1 0 2 0 36
BHS/F/2 116 40 11 2 2 10 0 181
BHS/F/3 258 70 10 2 1 2 0 343
BHS/F/4 311 143 21 1 1 9 0 485
BHS/F/5 410 204 36 2 6 6 0 664
BHS/F/6 741 246 57 6 9 17 0 1076
BHS/F/7-S 205 118 44 4 5 1 0 377
BHS/F/8-S 80 27 6 0 0 0 0 83
BHS/F/9-S 25 14 3 1 2 0 0 45
BHS/F/10-SE 5 4 0 1 0 0 0 10
BHS/F/11-SE 2 0 0 0 0 0 0 2
TOTAL EXC+SURFGEN 2177 873 190 20 26 47 0 3302
TTaabbllee AA11//99 Boat Cave: distribution of artefact types.
SQ/SPIT BP GEO BMS EL RUW GRF CHH CBI FBI2 WSTE GRI H/M SP/FRP TOTAL
BC/SURFGEN 0 0 0 1 0 0 0 1 0 1 0 0 0 3
BC/T/SURF 0 0 0 0 0 0 0 0 0 0 0 0 0 0
BC/T/1 0 0 0 0 0 0 0 0 0 3 0 0 0 3
BC/T/2 0 0 0 0 0 0 0 0 0 7 0 0 0 7
BC/T/3 0 0 0 0 0 0 0 0 0 0 0 0 0 0
BC/T/4 0 0 0 0 0 0 0 0 0 1 0 0 0 1
BC/T/5 0 0 0 0 0 1 0 0 0 2 0 0 0 3
BC/T/6 0 0 0 0 2 0 0 0 0 4 0 0 0 6
BC/T/7 0 0 0 0 0 0 0 0 0 1 0 0 0 1
BC/T/8 0 0 0 0 0 0 0 0 0 0 0 0 0 0
TOTAL EXC+SURFGEN 0 0 0 1 2 1 0 1 0 19 0 0 0 24
TTaabbllee AA11//1100 Boat Cave: distribution of raw materials. [1] Other is glass.
SQ/SPIT QZ FGS CHT SILC QZTE IGN OTHER TOTAL
BC/SURFGEN 0 0 2 0 0 0 [1]1 3
BC/T/SURF 0 0 0 0 0 0 0 0
BC/T/1 1 2 0 0 0 0 0 3
BC/T/2 3 3 1 0 0 0 0 7
BC/T/3 0 0 0 0 0 0 0 0
BC/T/4 0 0 0 0 0 1 0 1
BC/T/5 1 1 0 0 0 1 0 3
BC/T/6 1 1 4 0 0 0 0 6
BC/T/7 0 1 0 0 0 0 0 1
BC/T/8 0 0 0 0 0 0 0 0
TOTAL EXC+SURFGEN 6 8 7 0 0 2 1 24

terra australis 21
283
TTaabbllee AA11//1111 Boronia Shelter: distribution of artefact types.
SQ/SPIT BP GEO BMS EL RUW GRF CHH CBI FBI2 WSTE GRI H/M SP/FRP TOTAL
BoS/SURFGEN 0 0 0 0 0 0 1 0 0 0 0 0 0 1
BoS/T/SURF 0 0 0 0 0 0 0 0 0 0 1 0 0 1
BoS/T/1 0 0 0 0 0 0 0 0 0 0 0 0 0 0
BoS/T/2 0 0 0 0 0 0 0 0 0 1 0 0 0 1
BoS/T/3 0 0 0 0 0 1 0 0 0 1 0 0 0 2
BoS/T/4 0 0 0 0 0 0 0 0 0 0 0 0 0 0
BoS/T/5 0 0 0 0 0 0 0 0 0 0 0 0 0 0
TOTAL EXC+SURFGEN 0 0 0 0 0 1 1 0 0 2 1 0 0 5
TTaabbllee AA11//1122 Boronia Shelter: distribution of raw materials.
SQ/SPIT QZ FGS CHT SILC QZTE IGN OTHER TOTAL
BoS/SURFGEN 0 1 0 0 0 0 0 1
BoS/T/SURF 0 0 0 0 0 1 0 1
BoS/T/1 0 0 0 0 0 0 0 0
BoS/T/2 1 0 0 0 0 0 0 1
BoS/T/3 0 1 0 0 0 1 0 2
BoS/T/4 0 0 0 0 0 0 0 0
BoS/T/5 0 0 0 0 0 0 0 0
TOTAL EXC+SURFGEN 1 2 0 0 0 2 0 5
TTaabbllee AA11//1133 Caramel Wave Shelter: distribution of artefact types.
SQ/SPIT BP GEO BMS EL RUW GRF CHH CBI FBI2 WSTE GRI H/M SP/FRP TOTAL
CW/SURFGEN 0 0 0 0 0 0 0 0 0 0 0 0 0 0
CW/T1/SURF 0 0 0 0 0 0 0 0 0 0 0 0 0 0
CW/T1/1 0 0 0 0 0 0 0 0 0 0 0 0 0 0
CW/T1/2 0 0 0 0 0 0 0 0 0 0 0 0 0 0
CW/T1/3-OB 0 0 0 0 0 0 0 0 1 1 0 0 0 2
CW/T1/3-P 0 0 0 0 0 0 0 0 1 3 0 0 0 4
CW/T1/4 0 0 0 0 0 0 0 0 0 2 0 0 0 2
CW/T1/5 0 0 0 0 0 0 0 0 0 0 0 0 0 0
CW/T1/6 0 0 0 0 0 0 0 0 1 0 0 0 0 1
CW/T2/SURF 0 0 0 0 0 0 0 0 0 0 0 0 0 0
CW/T2/1 0 0 0 0 0 0 0 0 0 0 0 0 0 0
CW/T2/2 0 0 0 0 0 0 0 0 0 1 0 0 0 1
CW/T2/3 0 0 0 0 0 0 0 0 2 2 0 0 0 4
CW/T2/4-OB 0 0 0 0 0 0 0 0 0 0 0 0 0 0
CW/T2/4-P 0 0 0 0 0 0 0 0 0 0 0 0 0 0
TOTAL EXC+SURFGEN 0 0 0 0 0 0 0 0 5 9 0 0 0 14
Appendix 1

What’s changing: population size or land-use patterns? The archaeology of Upper Mangrove Creek, Sydney Basin
terra australis 21
284
TTaabbllee AA11//1144 Caramel Wave Shelter: distribution of raw materials.
SQ/SPIT QZ FGS CHT SILC QZTE IGN OTHER TOTAL
CW/SURFGEN 0 0 0 0 0 0 0 0
CW/T1/SURF 0 0 0 0 0 0 0 0
CW/T1/1 0 0 0 0 0 0 0 0
CW/T1/2 0 0 0 0 0 0 0 0
CW/T1/3-OB 2 0 0 0 0 0 0 2
CW/T1/3-P 4 0 0 0 0 0 0 4
CW/T1/4 2 0 0 0 0 0 0 2
CW/T1/5 0 0 0 0 0 0 0 0
CW/T1/6 1 0 0 0 0 0 0 1
CW/T2/SURF 0 0 0 0 0 0 0 0
CW/T2/1 0 0 0 0 0 0 0 0
CW/T2/2 0 1 0 0 0 0 0 1
CW/T2/3 2 0 2 0 0 0 0 4
CW/T2/4-OB 0 0 0 0 0 0 0 0
CW/T2/4-P 0 0 0 0 0 0 0 0
TOTAL EXC+SURFGEN 11 1 2 0 0 0 0 14
TTaabbllee AA11//1155 Delight Open Deposit: distribution of artefact types.
SQ/SPIT BP GEO BMS EL RUW GRF CHH CBI FBI WSTE GRI H/M SP/FRP TOTAL
DeO/SURFGEN 0 0 0 0 0 0 4 2 0 1 0 0 2 9
DeO/A/SURF–2 0 0 0 0 0 0 0 0 0 0 0 0 0 0
DeO/B/SURF–3 0 0 0 0 0 0 0 0 0 0 0 0 0 0
DeO/C/SURF–2 0 0 0 0 0 0 0 0 0 0 0 0 0 0
TOTAL EXC+SURFGEN 0 0 0 0 0 0 4 2 0 1 0 0 2 9
TTaabbllee AA11//1166 Delight Open Deposit: distribution of raw materials.
SQ/SPIT QZ FGS CHT SILC QZTE IGN OTHER TOTAL
DeO/SURFGEN 5 2 0 0 2 0 0 9
DeO/A/SURF–2 0 0 0 0 0 0 0 0
DeO/B/SURF–3 0 0 0 0 0 0 0 0
DeO/C/SURF–2 0 0 0 0 0 0 0 0
TOTAL EXC+SURFGEN 5 2 0 0 2 0 0 9

terra australis 21
285
TTaabbllee AA11//1177 Delight Shelter: distribution of artefact types.
SQ/SPIT BP GEO BMS EL RUW GRF CHH CBI FBI WSTE GRI H/M SP/FRP TOTAL
DeS/SURFGEN 0 0 0 0 1 0 5 0 0 8 0 0 0 14
DeS/T/SURF 0 0 1 0 3 0 4 0 0 47 0 0 0 55
DeS/T/1 0 0 0 0 2 0 2 0 1 67 0 0 0 72
DeS/T/2 1 0 2 0 1 0 0 0 0 78 0 0 0 82
DeS/T/3 1 2 0 0 1 0 1 0 2 90 0 0 0 97
DeS/T/4 0 0 0 0 0 1 0 0 0 33 0 0 0 34
DeS/T/5 0 0 0 0 0 0 0 0 0 11 0 0 0 11
DeS/T/6 0 0 0 0 0 0 0 0 0 1 0 0 0 1
DeS/T/7 0 0 0 0 0 0 0 0 0 1 0 0 0 1
TOTAL EXC+SURFGEN 2 2 3 0 8 1 12 0 3 336 0 0 0 367
TTaabbllee AA11//1188 Delight Shelter: distribution of raw materials.
SQ/SPIT QZ FGS CHT SILC QZTE IGN OTHER TOTAL
DeS/SURFGEN 7 6 0 0 1 0 0 14
DeS/T/SURF 24 20 6 1 4 0 0 55
DeS/T/1 43 21 3 1 40 0 0 72
DeS/T/2 41 25 5 7 3 0 1 82
DeS/T/3 48 34 5 6 4 0 0 97
DeS/T/4 18 13 0 1 1 1 0 34
DeS/T/5 8 1 0 1 1 0 0 11
DeS/T/6 1 0 0 0 0 0 0 1
DeS/T/7 0 1 0 0 0 0 0 1
TOTAL EXC+SURFGEN 190 121 19 17 18 1 1 367
TTaabbllee AA11//1199 Dingo Shelter (Squares Ta and Tb): distribution of artefact types. [1] I–III refers to levels; the spits cross-cut
stratigraphic layers, but excavation units within spits were dug according to the stratigraphic boundaries. For analysis the
excavation units have been grouped according to the stratigraphic layers and designated Analytical Levels I to III. [2] Artefacts
were not collected but were recorded in the field as ‘flakes’.
SQ/LEVEL[1] BP GEO BMS EL RUW GRF CHH CBI FBI WSTE GRI H/M SP/FRP TOTAL TOTAL
TA+TB TB
DiS/SURFGEN 0 0 0 0 0 0 0 0 0 [2]2 0 0 0 2 0
DiS/I SURF 0 0 0 0 0 0 2 0 0 2 0 0 0 4 4
DiS/I-GB 0 0 0 0 0 0 1 0 0 7 0 0 0 8 1
DiS/II-GB 0 0 0 0 0 0 0 0 0 3 0 0 0 3 3
DiS/II-PB 0 0 0 0 0 0 0 0 0 21 0 0 0 21 21
DiS/III-GB UPR 0 0 0 0 0 0 0 0 1 12 0 0 0 13 8
DiS/III-GB LWR 0 0 0 0 0 0 1 0 1 1 0 0 0 3 3
TOTAL 0 0 0 0 0 0 4 0 2 48 0 0 0 54 40
EXC+SURFGEN
Appendix 1

TTaabbllee AA11//2200 Dingo Shelter (Squares Ta and Tb): distribution of raw materials. [1] I–III refers to levels; spits cross-cut
stratigraphic layers, but excavation units within spits were dug according to the stratigraphic boundaries. For analysis,
excavation units have been grouped according to the stratigraphic layers and designated Analytical Levels I to III.
SQ/LEVEL[1] QZ FGS CHT SILC QZTE IGN OTHER TOTAL
DiS/SURFGEN 2 0 0 0 0 0 0 2
DiS/I SURF 1 3 0 0 0 0 0 4
DiS/I-GB 2 6 0 0 0 0 0 8
DiS/II-GB 0 1 2 0 0 0 0 3
DiS/II-PB 2 14 4 0 1 0 0 21
DiS/III-GB UPR 8 2 3 0 0 0 0 13
DiS/III-GB LWR 2 0 0 0 1 0 0 3
TOTAL EXC+SURFGEN 17 26 9 0 2 0 0 54
TTaabbllee AA11//2211 Elngarrah Shelter: distribution of artefact types.
SQ/SPIT BP GEO BMS EL RUW GRF CHH CBI FBI WSTE GRI H/M SP/FRP TOTAL
ES/SURFGEN 0 0 0 0 0 0 0 0 0 4 0 0 0 4
ES/T/SURF 0 0 0 0 0 0 0 0 0 0 0 0 0 0
ES/T/1 0 0 0 0 0 0 0 0 0 2 0 0 0 2
ES/T/2 0 0 0 0 0 0 0 0 0 1 0 0 0 1
TOTAL EXC+SURFGEN 0 0 0 0 0 0 0 0 0 7 0 0 0 7
TTaabbllee AA11//2222 Elngarrah Shelter: distribution of raw materials.
SQ/SPIT QZ FGS CHT SILC QZTE IGN OTHER TOTAL
ES/SURFGEN 3 1 0 0 0 0 0 4
ES/T/SURF 0 0 0 0 0 0 0 0
ES/T/1 1 0 0 0 0 1 0 2
ES/T/2 0 1 0 0 0 0 0 1
TOTAL EXC+SURFGEN 4 2 0 0 0 1 0 7
TTaabbllee AA11//2233 Elongated Figure: distribution of artefact types.
SQ/SPIT BP GEO BMS EL RUW GRF CHH CBI FBI WSTE GRI H/M SP/FRP TOTAL
EFS/SURFGEN 0 0 0 0 0 0 0 0 0 0 0 0 0 0
EFS/T/SURF 0 0 0 0 0 0 0 0 0 0 0 0 0 0
EFS/T/1 0 0 0 0 0 0 0 0 0 0 0 0 0 0
EFS/T/2 0 0 0 0 0 0 1 0 0 4 0 0 0 5
EFS/T/3 0 0 0 0 0 0 0 0 0 0 0 0 0 0
EFS/T/4 0 0 0 0 0 0 0 0 0 0 0 0 0 0
EFS/T/5 0 0 0 0 0 0 0 0 0 2 0 0 0 2
EFS/T/6 0 0 0 0 0 0 0 0 0 2 0 0 0 2
EFS/T/7 0 0 0 0 0 0 0 0 0 3 0 0 0 3
TOTAL EXC+SURFGEN 0 0 0 0 0 0 1 0 0 11 0 0 0 12
What’s changing: population size or land-use patterns? The archaeology of Upper Mangrove Creek, Sydney Basin
terra australis 21
286

terra australis 21
287
TTaabbllee AA11//2244 Elongated Figure Shelter: distribution of raw materials.
SQ/SPIT QZ FGS CHT SILC QZTE IGN OTHER TOTAL
EFS/SURFGEN 0 0 0 0 0 0 0 0
EFS/T/SURF 0 0 0 0 0 0 0 0
EFS/T/1 0 0 0 0 0 0 0 0
EFS/T/2 0 5 0 0 0 0 0 5
EFS/T/3 0 0 0 0 0 0 0 0
EFS/T/4 0 0 0 0 0 0 0 0
EFS/T/5 2 0 0 0 0 0 0 2
EFS/T/6 2 0 0 0 0 0 0 2
EFS/T/7 1 2 0 0 0 0 0 3
TOTAL EXC+SURFGEN 5 7 0 0 0 0 0 12
TTaabbllee AA11//2255 Emu Tracks 2 Shelter: distribution of artefact types. [1] WOB refers to ‘wombat overburden’, which was deposit
on surface of square T2 and which came from a wombat hole at the back of the shelter.
SQ/SPIT BP GEO BMS EL RUW GRF CHH CBI FBI WSTE GRI H/M SP/FRP TOTAL
ET2/SURFGEN 0 0 0 0 0 0 1 3 0 11 0 0 0 15
ET2/T2/WOB[1] 0 0 0 0 0 2 0 2 1 18 0 0 1 24
ET2/T2/SURF 0 0 0 0 0 0 0 0 0 0 0 0 0 0
ET2/T2/1 0 0 0 0 0 0 1 1 1 93 0 0 1 97
ET2/T2/2 0 0 0 0 0 1 0 0 0 80 0 0 2 83
ET2/T2/3 0 0 0 0 5 3 1 7 6 463 0 0 4 489
ET2/T2/4 0 0 0 0 8 1 1 7 10 551 0 0 0 578
ET2/T2/5 1 0 0 0 6 0 1 6 22 477 0 0 1 514
ET2/T2/6 2 0 1 0 17 3 1 28 19 810 0 0 2 883
ET2/T2/7 0 0 0 0 2 0 5 13 23 723 0 0 1 777
ET2/T2/8 2 0 2 0 14 0 6 16 18 840 0 0 2 900
ET2/T2/9 5 4 7 0 14 1 19 18 43 1038 0 0 4 1153
ET2/T2/10 8 2 6 0 18 0 16 12 15 745 0 0 5 827
ET2/T2/11 11 3 5 0 10 0 7 0 6 583 0 0 8 633
ET2/T2/12 1 2 0 0 6 0 1 0 0 246 0 0 1 257
ET2/T2/13 3 0 0 0 0 0 0 0 0 51 0 0 0 54
ET2/T2/14 0 0 0 0 0 0 0 0 0 20 0 0 0 20
ET2/T2/15 0 0 0 0 0 0 0 0 0 13 0 0 0 13
TOTAL T2 33 11 21 0 110 9 59 108 163 6733 0 0 31 7278
ET2/T1/SURF 0 0 0 0 0 0 0 0 0 0 0 0 0 0
ET2/T1/1 0 0 0 0 0 0 0 0 0 1 0 0 0 1
ET2/T1/2 0 0 0 0 0 0 0 0 0 2 0 0 0 2
ET2/T1/3 0 0 0 0 0 0 1 0 0 7 0 0 0 8
ET2/T1/4 0 0 0 0 1 1 0 0 1 22 0 0 0 25
ET2/T1/5 0 0 0 0 0 1 0 0 0 6 0 0 0 7
ET2/T1/6 0 0 0 0 0 1 0 0 0 24 0 0 0 25
ET2/T1/7 0 0 0 0 0 0 0 0 1 15 0 0 0 16
ET2/T1/8 0 0 0 0 0 0 0 0 0 35 0 0 0 35
TOTAL T1 0 0 0 0 1 3 1 0 2 112 0 0 0 119
TOTAL EXC+
SURFGEN +WOB 33 11 21 0 111 14 61 113 166 6874 0 0 32 7436
Appendix 1

What’s changing: population size or land-use patterns? The archaeology of Upper Mangrove Creek, Sydney Basin
terra australis 21
288
TTaabbllee AA11//2266 Emu Tracks 2 Shelter: distribution of raw materials. [1] WOB refers to ‘wombat overburden’, which was deposit
on surface of square T2 and which came from a wombat hole at the back of the shelter.
SQ/SPIT QZ FGS CHT SILC QZTE IGN OTHER TOTAL
ET2/SURFGEN 9 2 2 1 0 1 0 15
ET2/T2/WOB[1] 13 3 0 0 0 8 0 24
ET2/T2/SURF 0 0 0 0 0 0 0 0
ET2/T2/1 60 19 4 1 2 11 0 97
ET2/T2/2 44 28 5 0 2 4 0 83
ET2/T2/3 219 93 50 4 19 103 1 489
ET2/T2/4 265 180 51 4 21 57 0 578
ET2/T2/5 283 158 32 5 20 16 0 514
ET2/T2/6 443 298 69 5 45 22 1 883
ET2/T2/7 396 275 53 3 42 8 0 777
ET2/T2/8 494 250 97 11 39 9 0 900
ET2/T2/9 648 255 144 32 60 9 5 1153
ET2/T2/10 422 215 117 30 34 6 3 827
ET2/T2/11 306 150 91 31 47 0 8 633
ET2/T2/12 70 96 39 30 22 0 0 257
ET2/T2/13 20 19 7 4 2 2 0 54
ET2/T2/14 11 4 1 2 2 0 0 20
ET2/T2/15 6 4 2 0 1 0 0 13
TOTAL T2 3687 2044 762 162 358 247 18 7278
ET2/T1/SURF 0 0 0 0 0 0 0 0
ET2/T1/1 0 1 0 0 0 0 0 1
ET2/T1/2 1 1 0 0 0 0 0 2
ET2/T1/3 6 1 0 0 0 1 0 8
ET2/T1/4 10 9 2 1 0 3 0 25
ET2/T1/5 3 2 0 1 0 1 0 7
ET2/T1/6 10 10 2 0 0 3 0 25
ET2/T1/7 9 3 3 0 1 0 0 16
ET2/T1/8 18 11 5 1 0 0 0 35
TOTAL T1 57 38 12 3 1 8 0 119
TOTAL EXC T1+T2+
SURFGEN+WOB 3766 2087 776 166 359 264 18 7436
TTaabbllee AA11//2277 Geebung Shelter: distribution of artefact types.
SQ/SPIT BP GEO BMS EL RUW GRF CHH CBI FBI WSTE GRI H/M SP/FRP TOTAL
GS/SURFGEN 0 0 0 0 0 0 0 0 0 0 0 0 0 0
GS/T1/SURF 0 0 0 0 0 0 1 0 0 0 0 0 0 1
GS/T1/1 0 0 0 0 0 0 0 0 0 5 0 0 0 5
GS/T2/SURF 0 0 0 0 0 0 0 0 0 0 0 0 0 0
GS/T2/1 0 0 0 0 0 0 0 0 1 1 0 0 0 2
TOTAL EXC+SURFGEN 0 0 0 0 0 0 1 0 1 6 0 0 0 8

terra australis 21
289
TTaabbllee AA11//2288 Geebung Shelter: distribution of raw materials.
SQ/SPIT QZ FGS CHT SILC QZTE IGN OTHER TOTAL
GS/SURFGEN 0 0 0 0 0 0 0 0
GS/T1/SURF 0 1 0 0 0 0 0 1
GS/T1/1 3 0 1 0 1 0 0 5
GS/T2/SURF 0 0 0 0 0 0 0 0
GS/T2/1 2 0 0 0 0 0 0 2
TOTAL EXC+SURFGEN 5 1 1 0 1 0 0 8
TTaabbllee AA11//2299 Harris Gully Shelter: distribution of artefact types.
SQ/SPIT BP GEO BMS EL RUW GRF CHH CBI FBI WSTE GRI H/M SP/FRP TOTAL
HG/SURFGEN 0 0 0 0 0 1 1 0 0 0 0 0 0 2
HG/T/SURF 0 0 0 0 0 0 0 0 0 0 0 0 0 0
HG/T/1 0 0 0 0 0 0 0 0 0 0 0 0 0 0
HG/T/2 0 0 0 0 0 0 0 0 0 1 0 0 0 1
HG/T/3 0 0 0 0 0 0 0 0 0 8 0 0 0 8
HG/T/4 0 0 0 0 0 1 0 0 0 3 0 0 0 4
HG/T/5 0 0 0 0 0 0 0 0 0 0 0 0 0 0
HG/T/6 0 0 0 0 0 0 0 0 0 4 0 0 0 4
HG/T/7 0 0 0 0 0 0 0 0 0 7 0 0 0 7
HG/T/8 0 0 0 0 0 0 1 0 0 7 0 0 1 9
HG/T/9 0 0 0 0 0 0 0 0 0 1 0 0 0 1
HG/T/10 0 0 0 0 0 0 0 0 0 0 0 0 0 0
HG/T/11 0 0 0 0 0 0 0 0 0 0 0 0 0 0
TOTAL EXC+SURFGEN 0 0 0 0 0 2 2 0 0 31 0 0 1 36
TTaabbllee AA11//3300 Harris Gully Shelter: distribution of raw materials.
SQ/SPIT QZ FGS CHT SILC QZTE IGN OTHER TOTAL
HG/SURFGEN 0 1 0 0 0 1 0 2
HG/T/SURF 0 0 0 0 0 0 0 0
HG/T/1 0 0 0 0 0 0 0 0
HG/T/2 0 1 0 0 0 0 0 1
HG/T/3 1 0 1 0 6 0 0 8
HG/T/4 2 1 0 0 0 1 0 4
HG/T/5 0 0 0 0 0 0 0 0
HG/T/6 4 0 0 0 0 0 0 4
HG/T/7 4 3 0 0 0 0 0 7
HG/T/8 8 1 0 0 0 0 0 9
HG/T/9 0 1 0 0 0 0 0 1
HG/T/10 0 0 0 0 0 0 0 0
HG/T/11 0 0 0 0 0 0 0 0
TOTAL EXC+SURFGEN 19 8 1 0 6 2 0 36
Appendix 1

What’s changing: population size or land-use patterns? The archaeology of Upper Mangrove Creek, Sydney Basin
terra australis 21
290
TTaabbllee AA11//3311 Kangaroo and Echidna Shelter: distribution of artefact types.
SQ/SPIT BP GEO BMS EL RUW GRF CHH CBI FBI WSTE GRI H/M SP/FRP TOTAL
KE/SURFGEN 0 0 0 0 1 0 0 0 0 0 0 0 0 1
KE/T1/SURF 0 0 0 0 0 0 0 0 0 0 0 0 0 0
KE/T1/1 0 0 0 0 0 0 0 0 0 0 0 0 0 0
KE/T1/2 0 0 0 0 0 0 0 0 0 1 0 0 0 1
KE/T1/3 0 0 0 0 0 0 0 0 0 0 0 0 0 0
KE/T1/4 0 0 0 0 0 0 0 0 0 0 0 0 0 0
KE/T1/5 0 0 0 0 0 0 0 0 0 0 0 0 0 0
KE/T1/6 0 0 0 0 0 0 0 0 0 1 0 0 0 1
TOTAL T1 0 0 0 0 0 0 0 0 0 2 0 0 0 2
KE/T2/SURF 0 0 0 0 0 0 0 0 0 0 0 0 0 0
KE/T2/1 0 0 0 0 0 0 0 1 2 9 0 0 0 12
KE/T2/2 0 0 0 0 0 0 0 0 0 11 0 0 0 11
KE/T2/3 1 0 0 0 1 0 1 1 1 21 3 3 0 32
KE/T2/4 0 0 0 0 0 0 0 0 0 1 0 0 0 1
KE/T2/5 0 0 0 0 0 0 0 0 0 5 0 0 0 5
KE/T2/6 0 0 0 0 0 0 0 0 0 0 0 0 0 0
KE/T2/7 0 0 0 0 0 0 0 0 0 0 0 0 0 0
KE/T2/8 0 0 0 0 0 0 0 0 0 0 0 0 0 0
TOTAL T2 1 0 0 0 1 0 1 2 3 47 3 3 0 61
TOTAL EXC+SURFGEN 1 0 0 0 2 0 1 2 3 49 3 3 0 64
TTaabbllee AA11//3322 Kangaroo and Echidna Shelter: distribution of raw materials.
SQ/SPIT QZ FGS CHT SILC QZTE IGN OTHER TOTAL
KE/SURFGEN 0 1 0 0 0 0 0 1
KE/T1/SURF 0 0 0 0 0 0 0 0
KE/T1/1 0 0 0 0 0 0 0 0
KE/T1/2 1 0 0 0 0 0 0 1
KE/T1/3 0 0 0 0 0 0 0 0
KE/T1/4 0 0 0 0 0 0 0 0
KE/T1/5 0 0 0 0 0 0 0 0
KE/T1/6 0 1 0 0 0 0 0 1
TOTAL T1 1 1 0 0 0 0 0 2
KE/T2/SURF 0 0 0 0 0 0 0 0
KE/T2/1 11 0 0 0 1 0 0 12
KE/T2/2 2 8 0 0 1 0 0 11
KE/T2/3 9 18 1 0 1 3 0 32
KE/T2/4 0 1 0 0 0 0 0 1
KE/T2/5 0 3 0 1 0 1 0 5
KE/T2/6 0 0 0 0 0 0 0 0
KE/T2/7 0 0 0 0 0 0 0 0
KE/T2/8 0 0 0 0 0 0 0 0
TOTAL T2 22 30 1 1 3 4 0 61
TOTAL EXC+SURFGEN 23 32 1 1 3 4 0 64

291
TTaabbllee AA11//3333 Loggers Shelter (Squares E/F): distribution of artefact types. [1] Surface artefacts present but not collected or
recorded. [2] Artefacts in this assemblage were analysed during the salvage program; bipolar flakes were included with
bipolar cores in a category bipolar pieces.
SQ/SPIT BP GEO BMS EL RUW GRF CHH CBI FBI[2] WSTE GRI H/M SP/FRP TOTAL
LS/SURFGEN[1]
LS/EF/SURF+1 0 0 0 0 9 1 2 29 X 617 0 0 0 678LS/EF/2 0 2 0 2 11 3 12 46 X 604 1 0 9 690LS/EF/3 2 0 1 0 10 2 13 23 X 361 0 0 17 429LS/EF/4 2 0 0 0 8 0 18 24 X 376 0 0 4 432LS/EF/5 2 0 1 0 3 0 3 6 X 193 0 1 2 211LS/EF/6 0 0 0 0 5 0 14 3 X 237 0 0 3 262LS/EF/7 1 0 0 0 2 0 6 1 X 179 0 0 4 193LS/EF/8 0 0 0 0 1 0 6 0 X 66 0 0 11 184LS/EF/9 1 0 0 0 8 0 10 1 X 170 0 1 15 206LS/EF/10 0 0 0 0 2 0 17 0 X 235 0 0 24 278LS/EF/11 0 0 0 0 3 0 15 0 X 295 0 0 11 325LS/EF/12 0 0 0 0 12 0 6 1 X 320 0 0 19 358LS/EF/13 0 0 0 0 6 0 7 0 X 312 0 0 8 333LS/EF/14 0 0 0 0 0 0 3 0 X 31 0 0 2 36LS/EF/15 0 0 0 0 2 0 2 0 X 24 0 0 10 38LS/EF/16 0 0 0 0 0 0 1 0 X 38 0 0 3 42LS/EF/17 0 0 0 0 0 0 1 0 X 27 0 0 4 31LS/EF/18 0 0 0 0 1 0 2 0 X 29 0 0 0 32LS/EF/19 0 0 0 0 0 0 0 0 X 17 0 0 0 17LS/EF/20 0 0 0 0 0 0 0 0 X 21 0 0 2 23LS/EF/21 0 0 0 0 1 0 0 0 X 4 0 0 0 5TOTAL EXC EF+SURFGEN 8 2 2 2 84 6 148 134 X 4256 1 2 158 4803
TTaabbllee AA11//3344 Loggers Shelter (Squares E/F): distribution of raw materials. [1] Surface artefacts present but not collected or
recorded.
SQ/SPIT QZ FGS CHT SILC QZTE IGN OTHER TOTAL
LS/SURFGEN[1]
LS/EF/SURF+1 380 232 24 12 16 14 0 678LS/EF/2 330 266 44 11 21 18 0 690LS/EF/3 211 161 25 7 15 10 0 429LS/EF/4 197 172 25 7 25 4 2 432LS/EF/5 87 96 8 3 12 5 0 211LS/EF/6 104 123 8 6 16 3 2 262LS/EF/7 53 107 10 8 13 1 1 193LS/EF/8 42 111 12 0 16 0 3 184LS/EF/9 63 112 18 1 12 0 0 206LS/EF/10 106 123 23 8 17 1 0 278LS/EF/11 121 135 42 5 18 1 3 325LS/EF/12 154 133 38 3 25 1 4 358LS/EF/13 129 135 40 8 17 1 3 333LS/EF/14 16 13 2 0 3 0 2 36LS/EF/15 10 22 4 0 2 0 0 38LS/EF/16 17 20 2 0 3 0 0 42LS/EF/17 12 12 3 0 4 0 0 31LS/EF/18 8 16 5 0 3 0 0 32LS/EF/19 5 8 2 0 0 0 2 17LS/EF/20 9 10 3 0 0 1 0 23LS/EF/21 2 1 1 0 1 0 0 5TOTAL EXC EF+SURFGEN 2056 2008 339 79 239 60 22 4803
Appendix 1
terra australis 21

What’s changing: population size or land-use patterns? The archaeology of Upper Mangrove Creek, Sydney Basin
terra australis 21
292
TTaabbllee AA11//3355 Low Frontage Shelter: distribution of artefact types.
SQ/SPIT BP GEO BMS EL RUW GRF CHH CBI FBI WSTE GRI H/M SP/FRP TOTAL
LF/SURFGEN 0 0 0 0 0 0 0 0 0 0 0 0 0 0
LF/T/SURF 0 0 0 0 0 0 0 0 0 0 0 0 0 0
LF/T/1 0 0 0 0 0 0 0 0 0 0 0 0 0 0
LF/T/2 0 0 0 0 0 1 0 0 1 1 0 0 0 3
LF/T/3 0 0 0 0 0 0 0 0 0 1 0 0 0 1
LF/T/4 0 0 0 0 0 0 0 0 0 1 0 0 0 1
LF/T/5 0 0 0 0 0 0 0 0 0 0 0 0 0 0
LF/T/6 0 0 0 0 0 0 0 0 0 0 0 0 0 0
LF/T/7 0 0 0 0 0 0 0 0 0 0 0 0 1 1
LF/T/8 0 0 0 0 0 0 0 0 0 0 0 0 0 0
TOTAL EXC+SURFGEN 0 0 0 0 0 1 0 0 1 3 0 0 1 6
TTaabbllee AA11//3366 Low Frontage Shelter: distribution of raw materials.
SQ/SPIT QZ FGS CHT SILC QZTE IGN OTHER TOTAL
LF/SURFGEN 0 0 0 0 0 0 0 0
LF/T/SURF 0 0 0 0 0 0 0 0
LF/T/1 0 0 0 0 0 0 0 0
LF/T/2 1 0 1 0 0 1 0 3
LF/T/3 1 0 0 0 0 0 0 1
LF/T/4 1 0 0 0 0 0 0 1
LF/T/5 0 0 0 0 0 0 0 0
LF/T/6 0 0 0 0 0 0 0 0
LF/T/7 1 0 0 0 0 0 0 1
LF/T/8 0 0 0 0 0 0 0 0
TOTAL EXC+SURFGEN 4 0 1 0 0 1 0 6
TTaabbllee AA11//3377 McPherson Shelter: distribution of artefact types.
SQ/SPIT BP GEO BMS EL RUW GRF CHH CBI FBI WSTE GRI H/M SP/FRP TOTAL
McP/SURFGEN 0 0 0 0 0 0 1 0 0 0 0 0 0 1
McP/T/SURF 0 0 0 0 0 0 0 0 0 0 0 0 0 0
McP/T/1 0 0 0 0 0 0 0 0 0 0 0 0 0 0
McP/T/2 0 0 0 0 0 0 0 0 0 4 0 0 0 4
McP/T/3 0 0 0 0 0 0 0 0 0 19 0 0 0 19
TOTAL EXC+SURFGEN 0 0 0 0 0 0 1 0 0 23 0 0 0 24

TTaabbllee AA11//3388 McPherson Shelter: distribution of raw materials.
SQ/SPIT QZ FGS CHT SILC QZTE IGN OTHER TOTAL
McP/SURFGEN 0 1 0 0 0 0 0 1
McP/T/SURF 0 0 0 0 0 0 0 0
McP/T/1 0 0 0 0 0 0 0 0
McP/T/2 3 1 0 0 0 0 0 4
McP/T/3 10 6 2 0 1 0 0 19
TOTAL EXC+SURFGEN 13 8 2 0 1 0 0 24
TTaabbllee AA11//3399 Mangrove Mansions Shelter (East and West): distribution of artefact types.
SQ/SPIT BP GEO BMS EL RUW GRF CHH CBI FBI WSTE GRI H/M SP/FRP TOTAL
MME/SURFGEN 0 0 0 0 0 0 0 0 0 0 0 0 0 0
MME/T1/SURF 0 0 0 0 0 0 0 0 0 0 0 0 0 0
MME/T1/1 0 0 0 0 0 0 0 0 0 0 0 0 0 0
MME/T1/2 0 0 0 0 11 0 0 0 0 18 0 0 0 9
MME/T1/3 0 0 0 0 0 0 0 0 0 1 0 0 0 1
MME/T1/4 0 0 0 0 0 0 0 1 0 2 0 0 0 3
MME/T1/5-Y 0 0 0 0 0 0 0 0 0 0 0 0 0 0
MME/T1/5-M 0 0 0 0 0 0 0 0 0 0 0 0 0 0
MME/T1/6-MX 0 0 0 0 0 0 0 0 0 0 0 0 0 0
MME/T1/6-Y 0 0 0 0 0 0 0 0 0 0 0 0 0 0
MMW/SURFGEN 0 0 0 0 0 0 0 0 0 0 0 0 0 0
MMW/T2/SURF–4 0 0 0 0 0 0 0 0 0 0 0 0 0 0
TOTAL EXC+SURFGEN 0 0 0 0 1 0 0 1 0 11 0 0 0 13
TTaabbllee AA11//4400 Mangrove Mansions Shelter (East and West): distribution of raw materials.
SQ/SPIT QZ FGS CHT SILC QZTE IGN OTHER TOTAL
MME/SURFGEN 0 0 0 0 0 0 0 0
MME/T1/SURF 0 0 0 0 0 0 0 0
MME/T1/1 0 0 0 0 0 0 0 0
MME/T1/2 0 0 9 0 0 0 0 9
MME/T1/3 0 0 1 0 0 0 0 1
MME/T1/4 2 1 0 0 0 0 0 3
MME/T1/5-Y 0 0 0 0 0 0 0 0
MME/T1/5-M 0 0 0 0 0 0 0 0
MME/T1/6-MX 0 0 0 0 0 0 0 0
MME/T1/6-Y 0 0 0 0 0 0 0 0
MMW/SURFGEN 0 0 0 0 0 0 0 0
MMW/T2/SURF–4 0 0 0 0 0 0 0 0
TOTAL EXC+SURFGEN 2 1 10 0 0 0 0 13
terra australis 21
293
Appendix 1

TTaabbllee AA11//4411 One Tooth Shelter: distribution of artefact types.
SQ/SPIT BP GEO BMS EL RUW GRF CHH CBI FBI WSTE GRI H/M SP/FRP TOTAL
OT/SURFGEN 0 0 0 0 0 0 0 0 1 2 1 0 0 4
OT/T/SURF 0 0 0 0 0 0 0 0 0 0 0 0 0 0
OT/T/1 0 0 0 0 0 0 0 0 1 1 0 0 0 2
OT/T/2 0 0 0 0 0 0 0 1 0 1 0 0 0 2
OT/T/3 0 0 0 0 0 0 0 0 0 3 0 0 0 3
OT/T/4 0 0 0 0 0 0 0 0 0 0 0 0 0 0
OT/T/5 0 0 0 0 0 0 0 0 0 1 0 0 0 1
OT/T/6 0 0 0 0 0 0 0 0 0 0 0 0 0 0
OT/T/7 0 0 0 0 0 0 0 0 0 0 0 0 0 0
TOTAL EXC+SURFGEN 0 0 0 0 0 0 0 1 2 8 1 0 0 12
TTaabbllee AA11//4422 One Tooth Shelter: distribution of raw materials.
SQ/SPIT QZ FGS CHT SILC QZTE IGN OTHER TOTAL
OT/SURFGEN 0 3 0 0 0 1 0 4
OT/T/SURF 0 0 0 0 0 0 0 0
OT/T/1 2 0 0 0 0 0 0 2
OT/T/2 1 0 0 0 0 1 0 2
OT/T/3 1 1 0 0 0 1 0 3
OT/T/4 0 0 0 0 0 0 0 0
OT/T/5 0 0 0 1 0 0 0 1
OT/T/6 0 0 0 0 0 0 0 0
OT/T/7 0 0 0 0 0 0 0 0
TOTAL EXC+SURFGEN 4 4 0 1 0 3 0 12
TTaabbllee AA11//4433 Sunny Shelter: distribution of artefact types. [1] GRI in SS/T/6 is a broken sandstone slab with ochre on it (an
ochre palette).
SQ/SPIT BP GEO BMS EL RUW GRF CHH CBI FBI WSTE GRI H/M SP/FRP TOTAL
SuS/SURFGEN 0 0 0 0 1 0 0 2 1 2 1 0 0 7
SuS/T/SURF 0 0 0 0 0 0 0 0 0 0 0 0 0 0
SuS/T/1 0 0 0 0 0 0 0 0 0 25 0 0 1 26
SuS/T/2 0 0 0 0 0 1 0 2 1 73 0 0 0 77
SuS/T/3–5 0 0 0 0 0 5 0 4 10 263 0 0 0 282
SuS/T/6 0 0 0 0 5 1 2 7 3 255 [1]1 0 0 274
SuS/T/7 1 0 0 0 0 2 0 5 1 176 0 0 0 185
SuS/T/8 1 0 0 0 0 0 5 0 5 173 0 0 0 184
SuS/T/9 0 0 0 0 1 0 2 0 0 99 0 0 0 102
SuS/T/10 0 0 1 0 1 0 0 0 0 77 0 0 1 80
SuS/T/11 0 0 0 0 1 0 0 0 0 28 0 0 0 29
SuS/T/12 0 0 0 0 0 0 0 0 0 8 0 0 0 8
SuS/T/13 0 0 0 0 0 0 0 0 0 9 0 0 1 10
SuS/T/14 0 0 0 0 0 0 0 0 0 3 0 0 0 3
TOTAL EXC+SURFGEN 2 0 1 0 9 9 9 20 21 1191 12 0 3 1267
What’s changing: population size or land-use patterns? The archaeology of Upper Mangrove Creek, Sydney Basin
terra australis 21
294

terra australis 21
295
TTaabbllee AA11//4444 Sunny Shelter: distribution of raw materials. [1] Other raw material in SS/T/6 is a broken sandstone slab with
ochre on it (an ochre palette).
SQ/SPIT QZ FGS CHT SILC QZTE IGN OTHER TOTAL
SuS/SURFGEN 4 2 0 0 0 1 0 7
SuS/T/SURF 0 0 0 0 0 0 0 0
SuS/T/1 16 5 3 0 1 1 0 26
SuS/T/2 53 18 2 0 0 4 0 77
SuS/T/3–5 170 66 9 1 1 35 0 282
SuS/T/6 157 78 22 2 6 7 [1] 2 274
SuS/T/7 114 45 14 2 3 7 0 185
SuS/T/8 115 35 17 6 10 1 0 184
SuS/T/9 74 15 5 8 0 0 0 102
SuS/T/10 52 14 5 9 0 0 0 80
SuS/T/11 23 1 4 1 0 0 0 29
SuS/T/12 7 0 0 1 0 0 0 8
SuS/T/13 9 1 0 0 0 0 0 10
SuS/T/14 3 0 0 0 0 0 0 3
TOTAL EXC+SURFGEN 797 280 81 30 21 56 12 1267
TTaabbllee AA11//4455 Ti-tree Shelter: distribution of artefact types.
SQ/SPIT BP GEO BMS EL RUW GRF CHH CBI FBI WSTE GRI H/M SP/FRP TOTAL
TT/SURFGEN 0 0 0 0 0 0 0 0 0 0 0 0 0 0
TT/T1/SURF–3 0 0 0 0 0 0 0 0 0 0 0 0 0 0
TT/T2/SURF 0 0 0 0 0 0 0 0 0 0 0 0 0 0
TT/T2/1 0 0 0 0 0 0 0 1 1 5 0 0 0 7
TT/T2/2 0 0 0 0 0 0 0 0 0 1 0 0 0 1
TT/T2/3 0 0 0 0 0 0 0 0 0 2 0 0 0 2
TT/T2/4 0 0 0 0 0 0 0 0 0 0 0 0 0 0
TT/T2/5 0 0 0 0 0 0 0 0 0 1 0 0 0 1
TOTAL EXC+SURFGEN 0 0 0 0 0 0 0 1 1 9 0 0 0 11
TTaabbllee AA11//4466 Ti-tree Shelter: distribution of raw materials.
SQ/SPIT QZ FGS CHT SILC QZTE IGN OTHER TOTAL
TT/SURFGEN 0 0 0 0 0 0 0 0
TT/T1/SURF–3 0 0 0 0 0 0 0 0
TT/T2/SURF 0 0 0 0 0 0 0 0
TT/T2/1 1 16 0 0 0 0 0 7
TT/T2/2 1 0 0 0 0 0 0 1
TT/T2/3 0 2 0 0 0 0 0 2
TT/T2/4 0 0 0 0 0 0 0 0
TT/T2/5 1 0 0 0 0 0 0 1
TOTAL EXC+SURFGEN 3 8 0 0 0 0 0 11
Appendix 1

TTaabbllee AA11//4477 Uprooted Tree Shelter: distribution of artefact types. [1] Ground implement is a pebble with ground/abraded areas.
SQ/SPIT BP GEO BMS EL RUW GRF CHH CBI FBI WSTE GRI H/M SP/FRP TOTAL
UTS/SURFGEN 0 0 0 0 0 0 0 1 0 2 0 0 0 3
UTS/T/SURF 0 0 0 0 0 0 0 0 0 0 0 0 0 0
UTS/T/1 0 0 0 0 1 1 0 2 0 47 [1]1 0 0 52
UTS/T/2 0 0 0 0 0 0 0 2 0 77 0 0 0 79
UTS/T/3 0 1 0 0 0 3 0 2 2 199 0 0 0 207
UTS/T/4 0 0 0 0 1 0 0 4 3 177 0 0 0 185
UTS/T/4+5-TN 0 0 0 0 0 0 0 0 0 2 0 0 0 2
UTS/T/5 0 0 1 0 1 0 0 0 2 103 0 0 0 107
UTS/T/6 0 0 0 0 0 0 0 1 0 71 0 0 0 72
UTS/T/7 0 0 0 0 0 0 1 1 1 37 0 0 0 40
UTS/T/8 0 0 0 0 0 0 0 0 0 18 0 0 0 18
UTS/T/9 0 0 0 0 0 0 0 0 1 3 0 0 0 34
UTS/T/10 0 0 0 0 0 0 0 0 0 30 0 0 0 30
UTS/T/11 0 0 0 0 1 0 0 0 0 26 0 0 0 27
UTS/T/12 0 0 0 0 0 0 0 0 0 11 0 0 0 11
UTS/T/13 0 0 0 0 0 0 0 0 0 7 0 0 0 7
UTS/T/14 0 0 0 0 0 0 0 0 0 3 0 0 0 3
UTS/Tb/15 0 0 0 0 0 0 0 0 0 1 0 0 0 1
UTS/Tb/16 0 0 0 0 0 0 0 0 0 0 0 0 0 0
UTS/Tb/17 0 0 0 0 0 0 0 0 0 0 0 0 0 0
UTS/Tb/18 0 0 0 0 0 0 0 0 0 0 0 0 0 0
TOTAL EXC+SURFGEN 0 1 1 0 4 4 1 13 9 844 11 0 0 878
TTaabbllee AA11//4488 Uprooted Tree Shelter: distribution of raw materials.
SQ/SPIT QZ FGS CHT SILC QZTE IGN OTHER TOTAL
UTS/SURFGEN 3 0 0 0 0 0 0 3
UTS/T/SURF 0 0 0 0 0 0 0 0
UTS/T/1 18 22 3 2 0 6 1 52
UTS/T/2 32 34 4 2 2 5 0 79
UTS/T/3 94 78 15 7 1 12 0 207
UTS/T/4 78 80 8 6 2 11 0 185
UTS/T/4+5-TN 0 2 0 0 0 0 0 2
UTS/T/5 50 40 8 4 2 3 0 107
UTS/T/6 35 30 1 3 3 0 0 72
UTS/T/7 18 14 4 1 3 0 0 40
UTS/T/8 9 6 2 1 0 0 0 18
UTS/T/9 10 16 0 2 6 0 0 34
UTS/T/10 7 16 2 2 3 0 0 30
UTS/T/11 7 13 2 1 4 0 0 27
UTS/T/12 0 7 1 1 2 0 0 11
UTS/T/13 1 1 0 0 5 0 0 7
UTS/T/14 0 3 0 0 0 0 0 3
UTS/Tb/15 0 1 0 0 0 0 0 1
UTS/Tb/16 0 0 0 0 0 0 0 0
UTS/Tb/17 0 0 0 0 0 0 0 0
UTS/Tb/18 0 0 0 0 0 0 0 0
TOTAL EXC+SURFGEN 362 363 50 32 33 37 1 878
What’s changing: population size or land-use patterns? The archaeology of Upper Mangrove Creek, Sydney Basin
terra australis 21
296

terra australis 21
297
TTaabbllee AA11//4499 Venus Shelter: distribution of artefact types.
SQ/SPIT BP GEO BMS EL RUW GRF CHH CBI FBI WSTE GRI H/M SP/FRP TOTAL
VS/SURFGEN 0 0 0 0 0 0 0 1 0 0 0 0 0 1
VS/T/SURF 0 0 0 0 0 0 0 0 0 0 0 0 0 0
VS/T/1 0 0 0 0 0 0 0 0 0 0 0 0 0 0
VS/T/2 0 0 0 0 0 0 0 0 0 10 0 0 0 10
VS/T/3 0 0 0 0 0 0 0 0 1 5 0 0 0 6
VS/T/4 0 0 0 0 0 0 0 0 2 3 0 0 0 5
VS/T/5 0 0 0 0 0 0 0 0 0 0 0 0 0 0
TOTAL EXC+SURFGEN 0 0 0 0 0 0 0 1 3 18 0 0 0 22
TTaabbllee AA11//5500 Venus Shelter: distribution of raw materials.
SQ/SPIT QZ FGS CHT SILC QZTE IGN OTHER TOTAL
VS/SURFGEN 1 0 0 0 0 0 0 1
VS/T/SURF 0 0 0 0 0 0 0 0
VS/T/1 0 0 0 0 0 0 0 0
VS/T/2 1 9 0 0 0 0 0 10
VS/T/3 2 4 0 0 0 0 0 6
VS/T/4 3 1 1 0 0 0 0 5
VS/T/5 0 0 0 0 0 0 0 0
TOTAL EXC+SURFGEN 7 14 1 0 0 0 0 22
TTaabbllee AA11//5511 White Figure Shelter: distribution of artefact types.
SQ/SPIT BP GEO BMS EL RUW GRF CHH CBI FBI WSTE GRI H/M SP/FRP TOTAL
WF/SURFGEN 0 0 0 0 0 0 0 0 0 0 0 0 0 0
WF/T/SURF 0 0 0 0 0 0 0 0 0 7 0 0 0 7
WF/T/1 0 0 0 0 1 0 2 2 0 22 0 0 1 28
WF/T/2 0 0 0 0 0 0 0 1 0 30 0 0 2 33
WF/T/3 0 0 0 0 0 0 0 0 0 83 0 0 0 83
WF/T/4 0 0 0 0 0 1 1 1 1 248 0 0 2 254
WF/T/5 3 0 1 0 0 1 1 5 2 388 0 0 5 406
WF/T/6 0 0 0 0 1 2 3 4 0 185 0 0 0 195
WF/T/7 0 0 0 0 0 0 0 0 0 65 0 0 0 65
WF/T/8 0 0 0 0 1 0 0 0 0 12 0 0 0 13
WF/T/9 0 0 0 0 0 0 0 0 0 3 0 0 0 3
TOTAL EXC+SURFGEN 3 0 1 0 3 4 7 13 3 1043 0 0 10 1087
Appendix 1

TTaabbllee AA11//5522 White Figure Shelter: distribution of raw materials.
SQ/SPIT QZ FGS CHT SILC QZTE IGN OTHER TOTAL
WF/SURFGEN 0 0 0 0 0 0 0 0
WF/T/SURF 0 7 0 0 0 0 0 7
WF/T/1 3 14 9 0 2 0 0 28
WF/T/2 6 21 3 0 2 1 0 33
WF/T/3 28 46 6 1 1 1 0 83
WF/T/4 115 103 20 4 0 12 0 254
WF/T/5 196 156 21 12 4 16 1 406
WF/T/6 88 78 11 6 2 10 0 195
WF/T/7 20 31 5 6 2 1 0 65
WF/T/8 5 5 0 2 1 0 0 13
WF/T9 0 3 0 0 0 0 0 3
TOTAL EXC+SURFGEN 461 464 75 31 14 41 1 1087
TTaabbllee AA11//5533 Wolloby Gully Shelter: distribution of artefact types.
SQ/SPIT BP GEO BMS EL RUW GRF CHH CBI FBI WSTE GRI H/M SP/FRP TOTAL
WoG/SURFGEN 0 0 0 0 0 0 0 0 0 0 0 0 0 0
WoG/T/SURF 0 0 0 0 0 0 0 0 0 0 0 0 0 0
WoG/T/1 0 0 0 0 0 0 0 0 0 0 0 0 0 0
WoG/T/2 0 0 0 0 0 0 0 0 0 0 0 0 0 0
WoG/T/3 0 0 0 0 0 0 0 0 0 9 0 0 0 9
WoG/T/4 0 0 0 0 0 0 0 0 0 0 0 0 0 0
WoG/T/5 0 0 0 0 0 0 0 0 0 0 0 0 0 0
WoG/T/6 0 0 0 0 0 0 0 0 0 0 0 0 0 0
TOTAL EXC+SURFGEN 0 0 0 0 0 0 0 0 0 9 0 0 0 9
TTaabbllee AA11//5544 Wolloby Gully Shelter: distribution of raw materials.
SQ/SPIT QZ FGS CHT SILC QZTE IGN OTHER TOTAL
WoG/SURFGEN 0 0 0 0 0 0 0 0
WoG/T/SURF 0 0 0 0 0 0 0 0
WoG/T/1 0 0 0 0 0 0 0 0
WoG/T/2 0 0 0 0 0 0 0 0
WoG/T/3 0 9 0 0 0 0 0 9
WoG/T/4 0 0 0 0 0 0 0 0
WoG/T/5 0 0 0 0 0 0 0 0
WoG/T/6 0 0 0 0 0 0 0 0
TOTAL EXC+SURFGEN 0 9 0 0 0 0 0 9
What’s changing: population size or land-use patterns? The archaeology of Upper Mangrove Creek, Sydney Basin
terra australis 21
298

terra australis 21
299
Notes
The number of artefacts accumulated in each millennium/excavated pit is obtained by addingtogether the numbers of artefacts in spits which can be assigned to the same millennium.Where the boundary between two millennia falls within a spit, the number of artefacts in thatspit is divided proportionately. For example, if the depth/age duration of a spit is 750 BP to1750 BP and the number of artefacts in the spit is 40, then 25% (10) are assigned to the firstmillennium BP and 75% (30) to the second millennium BP.
The estimated total number of artefacts accumulated in the archaeological deposit is obtained by firstlyconverting the number of artefacts accumulated in each millennium/excavated pit into the ‘number ofartefacts accumulated in each millennium per square metre’ (cf. Table 4.12). That figure is thenmultiplied by the estimated area over which the deposit is likely to extend at the same levelacross the site (Table 4.4). These extrapolations take into account the known and assumedvariations in depth of deposit across the shelter, as well as the potential for the deposit tocontain archaeological materials (see Chapter 4). Figures are rounded to the nearest 50.
The average depth of deposit is used in the calculations rather than the maximum depth ofdeposit (Table 3.4) or the depth of archaeological deposit (Table 4.4). This is because the depthacross the base of the excavated squares, and also the base of individual spits, was often notuniform, and so the average depth of the spits/base of square has been used. The depthquoted in these tables for the basal spits thus often varies from those in Tables 3.4 and 4.4 (seealso Chapters 3 and 4). Figures are rounded to the nearest 0.5cm.
APPENDIX 2
The Upper Mangrove Creek catchment —random sampling units
Number of artefacts in each millenniumand estimated total number of artefactsaccumulated in each archaeological deposit
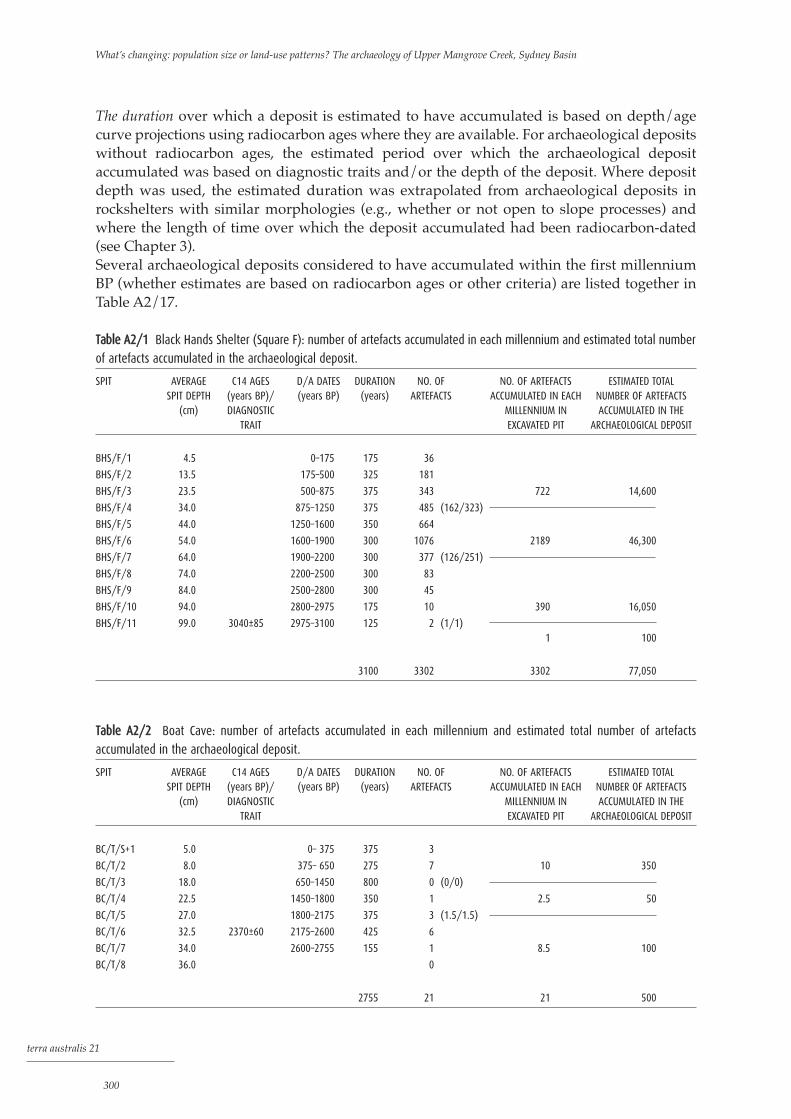
The duration over which a deposit is estimated to have accumulated is based on depth/agecurve projections using radiocarbon ages where they are available. For archaeological depositswithout radiocarbon ages, the estimated period over which the archaeological depositaccumulated was based on diagnostic traits and/or the depth of the deposit. Where depositdepth was used, the estimated duration was extrapolated from archaeological deposits inrockshelters with similar morphologies (e.g., whether or not open to slope processes) andwhere the length of time over which the deposit accumulated had been radiocarbon-dated(see Chapter 3). Several archaeological deposits considered to have accumulated within the first millenniumBP (whether estimates are based on radiocarbon ages or other criteria) are listed together inTable A2/17.
TTaabbllee AA22//11 Black Hands Shelter (Square F): number of artefacts accumulated in each millennium and estimated total number
of artefacts accumulated in the archaeological deposit.
SPIT AVERAGE C14 AGES D/A DATES DURATION NO. OF NO. OF ARTEFACTS ESTIMATED TOTAL SPIT DEPTH (years BP)/ (years BP) (years) ARTEFACTS ACCUMULATED IN EACH NUMBER OF ARTEFACTS
(cm) DIAGNOSTIC MILLENNIUM IN ACCUMULATED IN THETRAIT EXCAVATED PIT ARCHAEOLOGICAL DEPOSIT
BHS/F/1 4.5 0–175 175 36
BHS/F/2 13.5 175–500 325 181
BHS/F/3 23.5 500–875 375 343 722 14,600
BHS/F/4 34.0 875–1250 375 485 (162/323)
BHS/F/5 44.0 1250–1600 350 664
BHS/F/6 54.0 1600–1900 300 1076 2189 46,300
BHS/F/7 64.0 1900–2200 300 377 (126/251)
BHS/F/8 74.0 2200–2500 300 83
BHS/F/9 84.0 2500–2800 300 45
BHS/F/10 94.0 2800–2975 175 10 390 16,050
BHS/F/11 99.0 3040±85 2975–3100 125 2 (1/1)1 100
3100 3302 3302 77,050
TTaabbllee AA22//22 Boat Cave: number of artefacts accumulated in each millennium and estimated total number of artefacts
accumulated in the archaeological deposit.
SPIT AVERAGE C14 AGES D/A DATES DURATION NO. OF NO. OF ARTEFACTS ESTIMATED TOTAL SPIT DEPTH (years BP)/ (years BP) (years) ARTEFACTS ACCUMULATED IN EACH NUMBER OF ARTEFACTS
(cm) DIAGNOSTIC MILLENNIUM IN ACCUMULATED IN THETRAIT EXCAVATED PIT ARCHAEOLOGICAL DEPOSIT
BC/T/S+1 5.0 0– 375 375 3
BC/T/2 8.0 375– 650 275 7 10 350
BC/T/3 18.0 650–1450 800 0 (0/0)
BC/T/4 22.5 1450–1800 350 1 2.5 50
BC/T/5 27.0 1800–2175 375 3 (1.5/1.5)
BC/T/6 32.5 2370±60 2175–2600 425 6
BC/T/7 34.0 2600–2755 155 1 8.5 100
BC/T/8 36.0 0
2755 21 21 500
What’s changing: population size or land-use patterns? The archaeology of Upper Mangrove Creek, Sydney Basin
terra australis 21
300

TTaabbllee AA22//33 Boronia Shelter: number of artefacts accumulated in each millennium and estimated total number of artefacts
accumulated in the archaeological deposit.
SPIT AVERAGE C14 AGES D/A DATES DURATION NO. OF NO. OF ARTEFACTS ESTIMATED TOTAL NUMBERSPIT DEPTH (years BP)/ (years BP) (years) ARTEFACTS ACCUMULATED IN EACH OF ARTEFACTS
(cm) DIAGNOSTIC MILLENNIUM IN ACCUMULATED IN THETRAIT EXCAVATED PIT ARCHAEOLOGICAL DEPOSIT
BoS/T/S+1 2 0– 250 250 1
BoS/T/2 8 250– 800 550 1 3 100
BoS/T/3 17 800–1550 750 2 (1/1)
BoS/T/4 23 1880±60 0 1 50
BoS/T/5+6 33 0
1550 4 4 150
TTaabbllee AA22//44 Caramel Wave Shelter (Squares T1 and T2): number of artefacts accumulated in each millennium and estimated
total number of artefacts accumulated in the archaeological deposit. [1] Depth/age dates based on square T1.
SPIT AVERAGE C14 AGES D/A DATES DURATION NO. OF NO. OF ARTEFACTS ESTIMATED TOTAL SPIT DEPTH (years BP)/ (years BP) (years) ARTEFACTS ACCUMULATED IN EACH NUMBER OF ARTEFACTS
(cm) DIAGNOSTIC MILLENNIUM IN ACCUMULATED IN THETRAIT EXCAVATED PIT ARCHAEOLOGICAL DEPOSIT
CW/S+1 3.0 0– 275 275 0
CW/2 5.5 275– 475 200 1
CW/3-4 11.0 475– 900 425 12 13 450
CW/5-6 22.0 1430±60 900–1600 700
1 50
1600 14 14 500
TTaabbllee AA22//55 Delight Shelter: number of artefacts accumulated in each millennium and estimated total number of artefacts
accumulated in the archaeological deposit.
SPIT AVERAGE C14 AGES D/A DATES DURATION NO. OF NO. OF ARTEFACTS ESTIMATED TOTAL SPIT DEPTH (years BP)/ (years BP) (years) ARTEFACTS ACCUMULATED IN EACH NUMBER OF ARTEFACTS
(cm) DIAGNOSTIC MILLENNIUM IN ACCUMULATED IN THETRAIT EXCAVATED PIT ARCHAEOLOGICAL DEPOSIT
DeS/T/Surf ) 55 79 1100
DeS/T/1 3.0 ) 0–1600 1600 72 (24/48)
DeS/T/2 6.0 Bondi points 1600–1775 175 82 185 2650
DeS/T/3 12.5 1775–2175 400 97 (55/42)
DeS/T/4 17.5 2175–2575 400 34
DeS/T/5 22.5 2575–2650 75 11
DeS/T/6 27.5 2650–2730 80 1
DeS/T/7 31.5 Qz predom 2730–2800 70 1 89 1250
2800 353 353 5000
terra australis 21
301
Appendix 2

TTaabbllee AA22//66 Dingo Shelter (Square Tb only): number of artefacts accumulated in each millennium and estimated total number
of artefacts accumulated in the archaeological deposit.
SPIT AVERAGE C14 AGES D/A DATES DURATION NO. OF NO. OF ARTEFACTS ESTIMATED TOTAL SPIT DEPTH (years BP)/ (years BP) (years) ARTEFACTS ACCUMULATED IN EACH NUMBER OF ARTEFACTS
(cm) DIAGNOSTIC MILLENNIUM IN ACCUMULATED IN THETRAIT EXCAVATED PIT ARCHAEOLOGICAL DEPOSIT
DiS/Tb/I 3.0 0– 290 290 5
DiS/Tb/II 11.0 290– 890 600 24 31 2000
DiS/Tb/IIIU 21.0 890–1600 710 8 (2/6)
DiS/Tb/IIIL 26.0 1840±60 1600–2000 400 3 9 600
2000 40 40 2600
TTaabbllee AA22//77 Elngarrah Shelter: number of artefacts accumulated in each millennium and estimated total number of artefacts
accumulated in the archaeological deposit. [1] Estimated date of initial habitation based on depth of archaeological deposit.
SPIT AVERAGE C14 AGES D/A DATES DURATION NO. OF NO. OF ARTEFACTS ESTIMATED TOTAL SPIT DEPTH (years BP)/ (years BP) (years) ARTEFACTS ACCUMULATED IN EACH NUMBER OF ARTEFACTS
(cm) DIAGNOSTIC MILLENNIUM IN ACCUMULATED IN THETRAIT EXCAVATED PIT ARCHAEOLOGICAL DEPOSIT
ES/T/S+1 5.0 0–1000 1000 2 2 50
ES/T/2 16.0 1000–<1300 <300 1 1 50
1300 3 3 100
TTaabbllee AA22//88 Elongated Figure Shelter: number of artefacts accumulated in each millennium and estimated total number of
artefacts accumulated in the archaeological deposit.
SPIT AVERAGE C14 AGES D/A DATES DURATION NO. OF NO. OF ARTEFACTS ESTIMATED TOTAL SPIT DEPTH (years BP)/ (years BP) (years) ARTEFACTS ACCUMULATED IN EACH NUMBER OF ARTEFACTS
(cm) DIAGNOSTIC MILLENNIUM IN ACCUMULATED IN THETRAIT EXCAVATED PIT ARCHAEOLOGICAL DEPOSIT
EF/T/1 3.0 0– 125 125 0
EF/T/2 10.0 125– 460 335 5
EF/T/3 16.5 460– 800 340 0
EF/T/4 21.5 800–1050 250 0 5 400
EF/T/5 25.5 1050–1250 200 2
EF/T/6 31.5 1250–1600 350 2
EF/T/7 37.0 1810±80 1600–2000 400 3 7 550
2000 12 12 950
What’s changing: population size or land-use patterns? The archaeology of Upper Mangrove Creek, Sydney Basin
terra australis 21
302
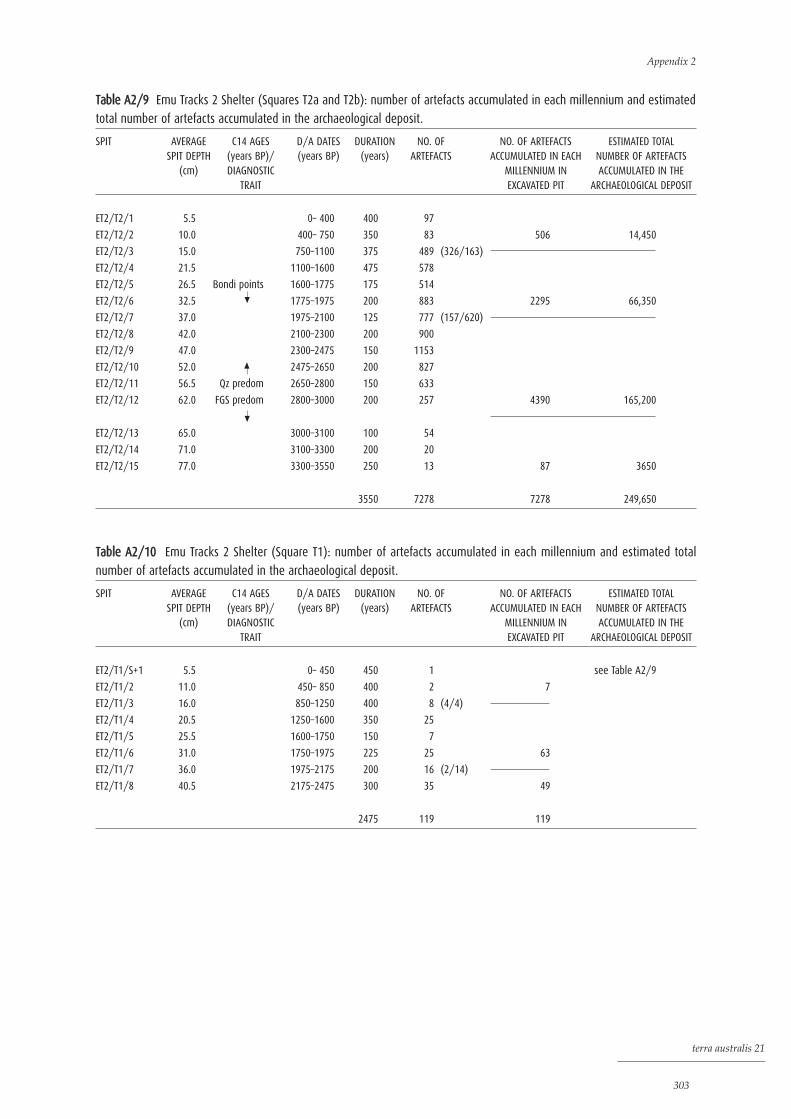
terra australis 21
303
TTaabbllee AA22//99 Emu Tracks 2 Shelter (Squares T2a and T2b): number of artefacts accumulated in each millennium and estimated
total number of artefacts accumulated in the archaeological deposit.
SPIT AVERAGE C14 AGES D/A DATES DURATION NO. OF NO. OF ARTEFACTS ESTIMATED TOTAL SPIT DEPTH (years BP)/ (years BP) (years) ARTEFACTS ACCUMULATED IN EACH NUMBER OF ARTEFACTS
(cm) DIAGNOSTIC MILLENNIUM IN ACCUMULATED IN THETRAIT EXCAVATED PIT ARCHAEOLOGICAL DEPOSIT
ET2/T2/1 5.5 0– 400 400 97
ET2/T2/2 10.0 400– 750 350 83 506 14,450
ET2/T2/3 15.0 750–1100 375 489 (326/163)
ET2/T2/4 21.5 1100–1600 475 578
ET2/T2/5 26.5 Bondi points 1600–1775 175 514
ET2/T2/6 32.5 1775–1975 200 883 2295 66,350
ET2/T2/7 37.0 1975–2100 125 777 (157/620)
ET2/T2/8 42.0 2100–2300 200 900
ET2/T2/9 47.0 2300–2475 150 1153
ET2/T2/10 52.0 2475–2650 200 827
ET2/T2/11 56.5 Qz predom 2650–2800 150 633
ET2/T2/12 62.0 FGS predom 2800–3000 200 257 4390 165,200
ET2/T2/13 65.0 3000–3100 100 54
ET2/T2/14 71.0 3100–3300 200 20
ET2/T2/15 77.0 3300–3550 250 13 87 3650
3550 7278 7278 249,650
TTaabbllee AA22//1100 Emu Tracks 2 Shelter (Square T1): number of artefacts accumulated in each millennium and estimated total
number of artefacts accumulated in the archaeological deposit.
SPIT AVERAGE C14 AGES D/A DATES DURATION NO. OF NO. OF ARTEFACTS ESTIMATED TOTAL SPIT DEPTH (years BP)/ (years BP) (years) ARTEFACTS ACCUMULATED IN EACH NUMBER OF ARTEFACTS
(cm) DIAGNOSTIC MILLENNIUM IN ACCUMULATED IN THETRAIT EXCAVATED PIT ARCHAEOLOGICAL DEPOSIT
ET2/T1/S+1 5.5 0– 450 450 1 see Table A2/9
ET2/T1/2 11.0 450– 850 400 2 7
ET2/T1/3 16.0 850–1250 400 8 (4/4)
ET2/T1/4 20.5 1250–1600 350 25
ET2/T1/5 25.5 1600–1750 150 7
ET2/T1/6 31.0 1750–1975 225 25 63
ET2/T1/7 36.0 1975–2175 200 16 (2/14)
ET2/T1/8 40.5 2175–2475 300 35 49
2475 119 119
Appendix 2

TTaabbllee AA22//1111 Harris Gully Shelter: number of artefacts accumulated in each millennium and estimated total number of
artefacts accumulated in the archaeological deposit. [1] Estimated date of initial habitation based on depth of archaeological
deposit, predominance of quartz throughout the sequence and presence of fragments of ground-edged implements.
SPIT AVERAGE C14 AGES D/A DATES DURATION NO. OF NO. OF ARTEFACTS ESTIMATED TOTAL SPIT DEPTH (years BP)/ (years BP) (years) ARTEFACTS ACCUMULATED IN EACH NUMBER OF ARTEFACTS
(cm) DIAGNOSTIC MILLENNIUM IN ACCUMULATED IN THETRAIT EXCAVATED PIT ARCHAEOLOGICAL DEPOSIT
HG/T/S+1 1.0 0– 60 60 0
HG/T/2 5.0 60– 200 140 1
HG/T/2 10.0 200– 375 175 8
HG/T/4 15.5 375– 575 200 4
HG/T/5 20.5 575– 750 175 0
HG/T/6 25.5 750– 900 150 4 21 1150
HG/T/7 30.0 900–1075 175 7 (4/3)
HG/T/8 35.0 1075–1250 175 9
HG/T/9 39.0 [1] 1250–1370 120 1 13 700
HG/T/10 43.0 0
HG/T/11 47.5 0
1370 34 34 1850
TTaabbllee AA22//1122 Kangaroo and Echidna Shelter (Squares T1 and T2): number of artefacts accumulated in each millennium and
estimated total number of artefacts accumulated in the archaeological deposit. [1] D/a dates and duration based on Square
T2; the number of artefacts retrieved from Square T1 is added in to the final two columns.
SPIT AVERAGE C14 AGES D/A DATES DURATION NO. OF NO. OF ARTEFACTS ESTIMATED TOTAL SPIT DEPTH (years BP)/ (years BP) (years) ARTEFACTS ACCUMULATED IN EACH NUMBER OF ARTEFACTS
(cm) DIAGNOSTIC MILLENNIUM IN ACCUMULATED IN THETRAIT EXCAVATED PIT ARCHAEOLOGICAL DEPOSIT
7 350
KE/T2/S+1 5.0 0–1600 1600 12 (7/5)
10 (+1 from T1) 1400
KE/T2/2 10.0 1600–2800 1200 11 (5/6)
9 450
KE/T2/3UP 16.0) 2800– 14 700
KE/T2/3LR 22.0) –5000 2200 32 (3/14/15) 15 750
0.5 50
0.5 50
KE/T2/4ab 28.0 6700±150 5000–7300 2300 1 (0.5/0.5)
1 (+1 from T1) 950
2 400
KE/T2/5b 41.5 7300–9790 2490 5 (1/2/2) 2 400
KE/T2/6b 51.0 0
KE/T2/7b 58.5 0
KE/T2/8b 68.0 0
9790 61 +2 = 63 61 +2 = 63 5500
What’s changing: population size or land-use patterns? The archaeology of Upper Mangrove Creek, Sydney Basin
terra australis 21
304

TTaabbllee AA22//1133 Loggers Shelter (Squares E/F): number of artefacts accumulated in each millennium and estimated total
number of artefacts accumulated in the archaeological deposit.
SPIT AVERAGE C14 AGES D/A DATES DURATION NO. OF NO. OF ARTEFACTS ESTIMATED TOTAL SPIT DEPTH (years BP)/ (years BP) (years) ARTEFACTS ACCUMULATED IN EACH NUMBER OF ARTEFACTS
(cm) DIAGNOSTIC MILLENNIUM IN ACCUMULATED IN THETRAIT EXCAVATED PIT ARCHAEOLOGICAL DEPOSIT
LS/EF/S+1 9 0– 200 200 678
LS/EF/2 18 530± 90 200– 1000 800 690 1368 36,450
LS/EF/3 27 1000– 1950 950 429
442 11,800
LS/EF/4 38 2480± 60 1950– 3600 1650 432 (13/
262/ 262 7000
157)
219 5850
LS/EF/5 45 3600– 4950 1350 211 (62/149)
156 4150
LS/EF/6 55 4950– 6900 1950 262 (7/
134/ 134 3550
121)
LS/EF/7 65 7950± 80 6900– 8050 1150 193 (16/ 137 3650
161/ 161 4300
16)
LS/EF/8 73 8050– 8250 200 184
LS/EF/9 82 8380±120 8250– 8550 300 206
LS/EF/10 91 8550– 8800 250 278 870 23,200
LS/EF/11 103 8800– 9150 350 325 (186/139)
LS/EF/12 109 9150– 9300 150 358
LS/EF/13 120 9450±120 9300– 9600 300 333
LS/EF/14 130 9600– 9800 200 36
LS/EF/15 139 9800–10,000 200 38 904 24,100
LS/EF/16 150 10,000–10,200 200 42
LS/EF/17 157 10,200–10,350 150 31
LS/EF/18 169 10,350–10,600 250 32
LS/EF/19 179 10,600–10,800 200 17
LS/EF/20 189) 10,800–11,000 200 23 145 3850
)
LS/EF/21 206) 11,050±135 11,000–11,275 275 5 5 150
11,275 4803 4803 128,050
terra australis 21
305
Appendix 2
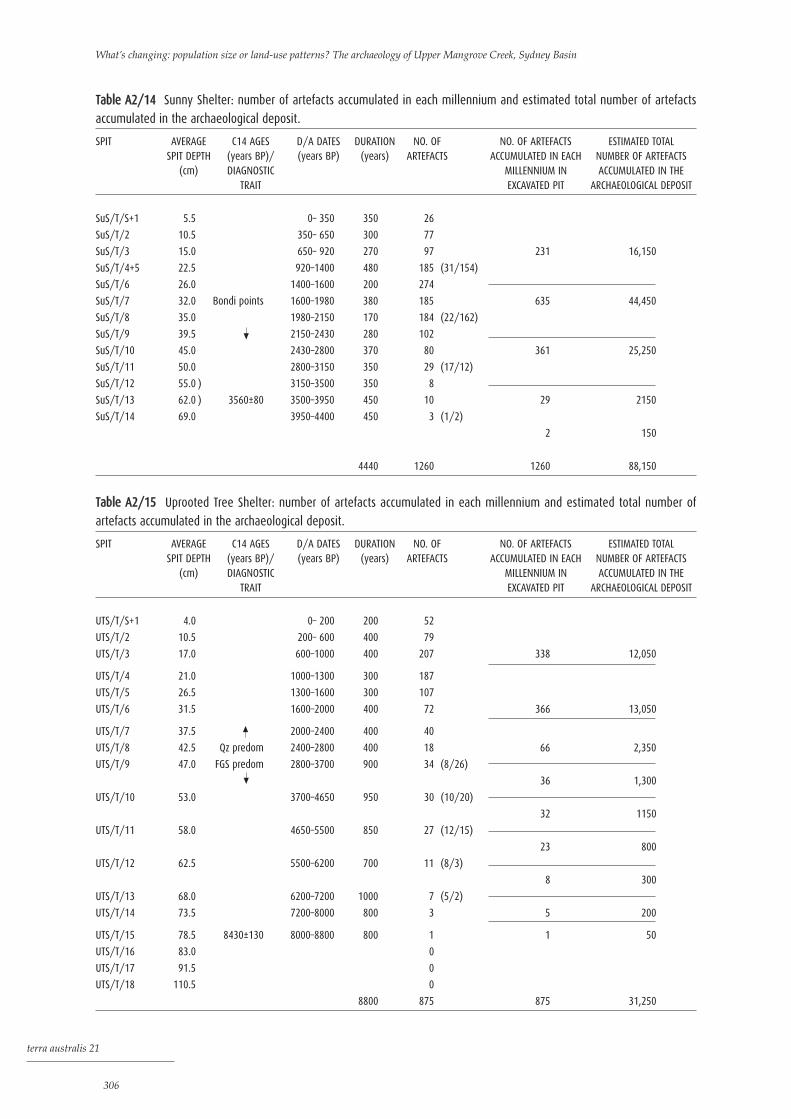
TTaabbllee AA22//1144 Sunny Shelter: number of artefacts accumulated in each millennium and estimated total number of artefacts
accumulated in the archaeological deposit.
SPIT AVERAGE C14 AGES D/A DATES DURATION NO. OF NO. OF ARTEFACTS ESTIMATED TOTAL SPIT DEPTH (years BP)/ (years BP) (years) ARTEFACTS ACCUMULATED IN EACH NUMBER OF ARTEFACTS
(cm) DIAGNOSTIC MILLENNIUM IN ACCUMULATED IN THETRAIT EXCAVATED PIT ARCHAEOLOGICAL DEPOSIT
SuS/T/S+1 5.5 0– 350 350 26
SuS/T/2 10.5 350– 650 300 77
SuS/T/3 15.0 650– 920 270 97 231 16,150
SuS/T/4+5 22.5 920–1400 480 185 (31/154)
SuS/T/6 26.0 1400–1600 200 274
SuS/T/7 32.0 Bondi points 1600–1980 380 185 635 44,450
SuS/T/8 35.0 1980–2150 170 184 (22/162)
SuS/T/9 39.5 2150–2430 280 102
SuS/T/10 45.0 2430–2800 370 80 361 25,250
SuS/T/11 50.0 2800–3150 350 29 (17/12)
SuS/T/12 55.0 ) 3150–3500 350 8
SuS/T/13 62.0 ) 3560±80 3500–3950 450 10 29 2150
SuS/T/14 69.0 3950–4400 450 3 (1/2)
2 150
4440 1260 1260 88,150
TTaabbllee AA22//1155 Uprooted Tree Shelter: number of artefacts accumulated in each millennium and estimated total number of
artefacts accumulated in the archaeological deposit.
SPIT AVERAGE C14 AGES D/A DATES DURATION NO. OF NO. OF ARTEFACTS ESTIMATED TOTAL SPIT DEPTH (years BP)/ (years BP) (years) ARTEFACTS ACCUMULATED IN EACH NUMBER OF ARTEFACTS
(cm) DIAGNOSTIC MILLENNIUM IN ACCUMULATED IN THETRAIT EXCAVATED PIT ARCHAEOLOGICAL DEPOSIT
UTS/T/S+1 4.0 0– 200 200 52
UTS/T/2 10.5 200– 600 400 79
UTS/T/3 17.0 600–1000 400 207 338 12,050
UTS/T/4 21.0 1000–1300 300 187
UTS/T/5 26.5 1300–1600 300 107
UTS/T/6 31.5 1600–2000 400 72 366 13,050
UTS/T/7 37.5 2000–2400 400 40
UTS/T/8 42.5 Qz predom 2400–2800 400 18 66 2,350
UTS/T/9 47.0 FGS predom 2800–3700 900 34 (8/26)
36 1,300
UTS/T/10 53.0 3700–4650 950 30 (10/20)
32 1150
UTS/T/11 58.0 4650–5500 850 27 (12/15)
23 800
UTS/T/12 62.5 5500–6200 700 11 (8/3)
8 300
UTS/T/13 68.0 6200–7200 1000 7 (5/2)
UTS/T/14 73.5 7200–8000 800 3 5 200
UTS/T/15 78.5 8430±130 8000–8800 800 1 1 50
UTS/T/16 83.0 0
UTS/T/17 91.5 0
UTS/T/18 110.5 0
8800 875 875 31,250
What’s changing: population size or land-use patterns? The archaeology of Upper Mangrove Creek, Sydney Basin
terra australis 21
306
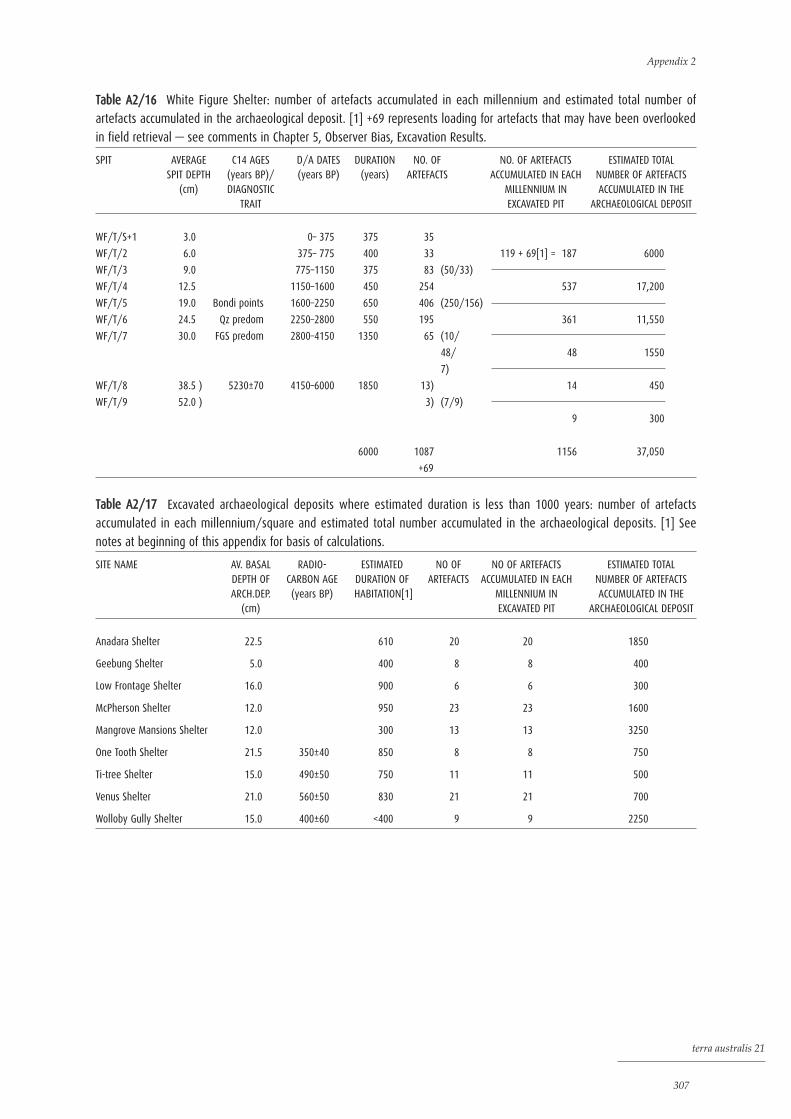
TTaabbllee AA22//1166 White Figure Shelter: number of artefacts accumulated in each millennium and estimated total number of
artefacts accumulated in the archaeological deposit. [1] +69 represents loading for artefacts that may have been overlooked
in field retrieval — see comments in Chapter 5, Observer Bias, Excavation Results.
SPIT AVERAGE C14 AGES D/A DATES DURATION NO. OF NO. OF ARTEFACTS ESTIMATED TOTAL SPIT DEPTH (years BP)/ (years BP) (years) ARTEFACTS ACCUMULATED IN EACH NUMBER OF ARTEFACTS
(cm) DIAGNOSTIC MILLENNIUM IN ACCUMULATED IN THETRAIT EXCAVATED PIT ARCHAEOLOGICAL DEPOSIT
WF/T/S+1 3.0 0– 375 375 35
WF/T/2 6.0 375– 775 400 33 119 + 69[1] = 187 6000
WF/T/3 9.0 775–1150 375 83 (50/33)
WF/T/4 12.5 1150–1600 450 254 537 17,200
WF/T/5 19.0 Bondi points 1600–2250 650 406 (250/156)
WF/T/6 24.5 Qz predom 2250–2800 550 195 361 11,550
WF/T/7 30.0 FGS predom 2800–4150 1350 65 (10/
48/ 48 1550
7)
WF/T/8 38.5 ) 5230±70 4150–6000 1850 13) 14 450
WF/T/9 52.0 ) 3) (7/9)
9 300
6000 1087 1156 37,050
+69
TTaabbllee AA22//1177 Excavated archaeological deposits where estimated duration is less than 1000 years: number of artefacts
accumulated in each millennium/square and estimated total number accumulated in the archaeological deposits. [1] See
notes at beginning of this appendix for basis of calculations.
SITE NAME AV. BASAL RADIO- ESTIMATED NO OF NO OF ARTEFACTS ESTIMATED TOTAL DEPTH OF CARBON AGE DURATION OF ARTEFACTS ACCUMULATED IN EACH NUMBER OF ARTEFACTS ARCH.DEP. (years BP) HABITATION[1] MILLENNIUM IN ACCUMULATED IN THE
(cm) EXCAVATED PIT ARCHAEOLOGICAL DEPOSIT
Anadara Shelter 22.5 610 20 20 1850
Geebung Shelter 5.0 400 8 8 400
Low Frontage Shelter 16.0 900 6 6 300
McPherson Shelter 12.0 950 23 23 1600
Mangrove Mansions Shelter 12.0 300 13 13 3250
One Tooth Shelter 21.5 350±40 850 8 8 750
Ti-tree Shelter 15.0 490±50 750 11 11 500
Venus Shelter 21.0 560±50 830 21 21 700
Wolloby Gully Shelter 15.0 400±60 <400 9 9 2250
terra australis 21
307
Appendix 2


terra australis 21
309
Part 1. Upper Mangrove Creek catchment. Native animal taxa identified in faunal assemblagesfrom the archaeological deposits.
Part 2. Faunal remains from archaeological sites in the Mangrove Creek catchment — reportno. 3 . The random sampling units. Ken Aplin, 1985.
Part 3. Extracts from: Faunal remains from archaeological sites in the Mangrove Creekcatchment. A report to NPWS of NSW. Ken Aplin, 1981.
Part 4. Report on analysis of hair samples from four deposits in the Upper Mangrove Creekcatchment. Barbara Triggs, 2002.
APPENDIX 3
The Upper Mangrove Creek catchment —random sampling units
Faunal remains

What’s changing: population size or land-use patterns? The archaeology of Upper Mangrove Creek, Sydney Basin
terra australis 21
310
PART 1
Upper Mangrove Creek catchment. Native animal taxa identified in faunalassemblages from the archaeological deposits[1].
A: MAMMALSACROBATIDAE Acrobates pygmaeus Feathertail glider, pygmy glider
BURRAMYIDAE Cercartetus nanus Eastern pygmy-possum
CANIDAE Canis lupus dingo Dingo
DASYURIDAE Antechinus flavipes Yellow-footed antechinusAntechinus stuartii Brown antechinusAntechinus swainsonii Dusky antechinusDasyurus maculatus Spotted-tailed quoll, tiger catDasyurus sp. Quoll, native cat, tiger cat
MACROPODIDAE Large macropodid Kangaroo or euroMacropus robustus Euro/common wallarooMacropus giganteus Eastern grey kangarooMedium macropodid WallabyMacropus rufogriseus Red-necked wallabyWallabia bicolor Swamp wallabySmall macropodid Wallaby or pademelonPetrogale penicillata Brush-tailed rock wallabyThylogale sp. Pademelon
MICROCHIROPTERA Microbats
MURIDAE Pseudomys oralis Hastings River mousePseudomys novaehollandiae New Holland mouseRattus fuscipes Bush ratRattus lutreolus Swamp rat
ORNITHORHYNCHIDAE Ornithorhynchus anatinus Platypus
PERAMELIDAE Isoodon sp. (probably Bandicoot (southern bandicoot, I. obesulus) short-nosed bandicoot)Perameles nasuta Long-nosed bandicoot
PETAURIDAE Petaurus australis Yellow-bellied gliderPetaurus breviceps Sugar gliderPetaurus sp. Lesser gliding possum
PHALANGERIDAE Trichosurus vulpecula Common brushtail possum
PHASCOLARCTIDAE Phascolarctus cinereus Koala
[1] Includes species found in catchment sites outside the random sampling units, e.g., Mussel and Deep Creek Shelters. Scientificnames for mammals according to Strahan 2000; and for reptiles according to Cogger 2000.

POTOROIDAE Bettongia gaimardi Eastern or Tasmanian bettongPotorous tridactylus Long-nosed potorooPotorous sp. Potoroo
PSEUDOCHEIRIDAE Petauroides volans Greater gliderPseudocheirus peregrinus Common ringtail possum
PTEROPODIDAE Pteropus scapulatus Little red flying-fox
TACHYGLOSSIDAE Tachyglossus aculeatus Short-beaked echidna
VOMBATIDAE Vombatus ursinus Common wombat
B: REPTILESLACERTILIAVaranidae Varanus sp. Goanna, monitorAgamidae Unidentified DragonScincidae (e.g., Egernia sp.) Skink
Medium lizardUnsized lizard
OPHIDIABoidae Unidentified PythonElapidae Unidentified Front-fanged snake (venomous)
Medium snakeSmall snakeUnsized snake
C: BIRDSCasuariidae cf. Dromaius novaehollandiae Emu
Medium-sized birdUnidentified bird
D: FROGS AND FISHANURA FrogTELEOST Bony fish, unidentified
E: INVERTEBRATES — Molluscs and CrustaceaHYRIIDAE possibly Velesunio ambiguus, Freshwater mussel
Hyridella australis and/or H. depressa
ARCIDAE Anadara trapezia Sydney cockleOSTREIDAE Saccostrea glomerata Rock oyster
(prev. S.commercialis)GASTROPODA Unidentified terrestrial landsnail
PARASTACIDAE possibly Euastacus australasiensis, Yabby/freshwater crayfish E. nobilis and/or E. spinifer
F: UNIDENTIFIED FAUNAL REMAINSBone fragments not assigned to specific faunal category due to small size and/or lack ofdiagnostic features.
terra australis 21
311
Appendix 3 (Part 1)

PART 2
Faunal remains from archaeological sites in the Mangrove Creekcatchment — report no. 3. The random sampling units.
by Ken Aplin 1985
General comments
PreservationOn average, this series of assemblages appears to be significantly better preserved than thosefrom Upper Mangrove Creek sites previously analysed (Aplin 1981; Aplin and Gollan 1982).Three sites containing archaeological material, and one with purely non-archaeological bone,stand out as being especially well-preserved, and thus of particular promise for further work.These are:
Archaeological sites: White FigureDingo (upper levels)Caramel Wave
Non-archaeological sites: Two Moths
In each of these sites, however, bone densities are relatively low compared with themajor faunal assemblages in the catchment (Loggers, Mussel and Deep Creek Shelters). This isparticularly noteworthy given the somewhat better preservation of the present series.Densities of invertebrate taxa, by contrast, appear to be somewhat higher on average; thispresumably reflects the better preservation. Given the relatively low densities of bone in thesesites, I estimate that, in order to obtain adequate faunal samples for detailed analysis, it wouldbe necessary to excavate between 5 and 10 sq m of each deposit.
Origin of the remainsThe fact that so many of the present series of sites contain non-archaeological faunal remains isprobably partly explicable in terms of the generally good preservation. However, otherfactors, such as the probable lower levels of human activity in the sites, might also be at play.
Faunal compositionAll of the taxa identified in the present series of sites are either: (a) known as living animals in the Mangrove Creek area; or (b) have previously been identified in the recent archaeological materials. Two mammalian taxa new to the recorded prehistoric fauna are the microchiropteran bat (orbats), and the feathertail glider, Acrobates pygmaeus. As indicated in the ‘comments’ on WollobyGully Shelter, the recovery of a medium-sized bird from that site is of interest; I should be ableto more clearly identify this specimen.
Among the invertebrate remains, features of interest are: (1) the regular occurrence of ‘yabbies’ in the faunas; and (2) the presence of Anadara shell fragments in many sites.
As indicated in the individual assemblage reports, the yabby remains, wherever theyoccur, appear to derive from human activities. Although their regular occurrence might bepartly a reflection of the better preservation, I suspect that this is not the full story. However,without some basic information about the habitat preferences of these animals in the
What’s changing: population size or land-use patterns? The archaeology of Upper Mangrove Creek, Sydney Basin
terra australis 21
312

catchment, it is difficult to suggest any ‘environmental’ reason for their abundance. What I cansay is that elsewhere in NSW (Capertee region) I have found these ‘yabbies’ (probably parastacidfreshwater crayfish) occur primarily in fast-flowing, clear water. Could it be that the presentseries of sites are all located higher in the catchment than the previous ones?
With regard to the Anadara shell, it is my impression that the pieces recovered arederived mostly from large shells, and that these are almost always burnt. To me, at least, itwould seem highly probable that the Anadara fragments represent bits of tools of some kind —the firing possibly used to harden the shell. Unfortunately for that theory, none of the piecesshows obvious ‘use-damage’. But then, most pieces are either very small fragments only ORare too corroded to tell one way or the other. Certainly, Anadara would never have occurredlocally in the Upper Mangrove Creek catchment and must have been brought up somedistance from the estuarine regions.
Methods of analysis and data presentationThe assemblages have been analysed according to the methods developed during the earlierstudies (Aplin 1981; Aplin and Gollan 1982); these should be consulted for further details. Thetables presented below employ the following conventions:
Table *.1 Burning categories abbreviated as follows: U — unburnt bones B — burnt bones C — calcined bone
Shell types as follows: B — freshwater bivalve, possibly Velesunio ambiguus, Hyridella australis and/or
H. depressaA — estuarine bivalve, Anadara trapezia, Sydney cockleT — terrestrial snail
All weights are presented in grams and to nearest 0.1g.
Table *.2 Burning status indicated in brackets and abbreviated as for Table *.1. Other abbreviations as follows:
L left sideB right sideM (e.g. M4-5) molar
Individual assemblage reports
Anadara (AS)Several bone fragments from the surface of this deposit bear tooth-marks and other damagewhich suggest their introduction by a large carnivore, probably a dog. The excavated material,however, is typically archaeological in character (Tables A3-2/1 and A3-2/2).
Bird Tracks (BT)This small but well-preserved assemblage appears to contain both archaeological and non-archaeological material (Tables A3-2/1 and A3-2/2). The non-archaeological component makesup the bulk of the assemblage, and probably accounts for all of the smaller mammal and lowervertebrate remains. This material is consistent in general character with an owl-pellet origin.
An archaeological component is inferred from the presence of two heavily burnedspecimens including the swamp wallaby tooth.
terra australis 21
313
Appendix 3 (Part 2)

TTaabbllee AA33––22//11 Summary of faunal assemblage by excavation unit for small assemblages. See separate tables for Dingo, Two
Moths and White Figure. Weights and counts exclude hairs and feathers listed in Table A3-2/2.
PROVENANCE BONE BURNING SHELL SHELL TYPE YABBY
WT (g) NO U B C WT (g) NO. B A T WT (g) NO.
Anadara AS/SurfGen 18.0 5 5AS/T1/2 2.2 2 2AS/T2/1 0.3 1 1Totals 20.5 8 7 1
Bird TracksBT/T/1 0.4 3 3BT/T/2 1.4 11 10 1BT/T/3 0.2 1 1Totals 2.0 15
BoroniaBoS/SurfGen 4.3 1 *Caramel WaveCW/SurfGen 4.2 1 *CW/T1/2 0.1 1 1CW/T1/30B 0.8 1 1CW/T1/3P 2.3 10 2 6 2 0.4 21CW/T1/4 0.1 1 1 0.1 1CW/T1/5 0.1 1 1CW/T2/1 0.5 1 1CW/T2/2 0.4 1 1CW/T2/3 0.5 4 4 0.1 2 *Totals 4.8 20 4 9 7 4.3 3 0.5 22
DelightDeS/Tb/1 0.1 1 1
ElngarrahES/Tb/1 0.1 1 1ES/Td/1 0.1 1 1ES/Td/2 0.1 1 *Totals 0.2 2 2 0.1 1
Elongated FigureEF/T/2 0.3 5 5
Emu Tracks 2ET2/T2a/WOB 0.1 5 *ET2/T2a/1 0.1 1 *ET2/T2b/1 0.7 1 *Totals 0.9 7
Harris GullyHG/SurfGen 0.3 1 1HG/T/1 0.1 1 *HG/T/2 0.1 3 3Totals 0.4 4 0.1 1
Kangaroo and EchidnaKE/T2a/1 0.3 1 1KE/T2d/2 1.0 2 *Totals 0.3 1 1 1.0 2 *
What’s changing: population size or land-use patterns? The archaeology of Upper Mangrove Creek, Sydney Basin
terra australis 21
314

TTaabbllee AA33––22//11 (Continued)
PROVENANCE BONE BURNING SHELL SHELL TYPE YABBY
WT (g) NO. U B C WT (g) NO. B A T WT (g) NO.
McPhersonMcP/SurfGen 1.1 1 1
Mangrove MansionsMM/T1/1 0.2 2 2MM/T1/2 1.1 30 23 4 0.1 1 *MM/T1/3 4.0 19 8 11MM/T1/4 0.6 4 2 2Totals 5.9 55 35 17 0.1 1 *Moss GullyMG/T/3 0.1 1 *One ToothSurfGen 0.3 1 1OT/T/1 12.7 6 3 2 1 2.2 7 *OT/T/2 0.9 20 3 4 13 0.1 3 *OT/T/3 0.2 3 2 2 0.1 2 *Totals 14.1 30 8 6 16 2.4 12
Uprooted TreeUTS/Tb/1 0.2 1 *UTS/Tb/7 0.1 1? 1?Totals 0.1 1? 1? 0.2 1
Wolloby GullyWoG/Ta/2 0.2 2 1 1 0.1 1WoG/Ta/3 3.7 13 4 4 5 0.6 7 *WoG/Ta/4 0.1 3 1 2 0.1 1Totals 4.0 18 0.6 7 0.2 2
TTaabbllee AA33––22//22 Taxonomically diagnostic faunal remains listed by site and excavation unit for small assemblages.
PROVENANCE ANIMAL SKELETAL ELEMENT BURNING STATE
AnadaraAS/SurfGen medium-sized macropodid R. maxilla/palatine/pterygoid fragments U
caudal vertebra; tooth-marked Ufemur shaft fragment; tooth-marked U
AS/T2/1 small macropodid tibial shaft fragment B
Bird TracksBT/T/1 frog sacral complex U
Perameles nasuta R. maxilla with M2 UR. radius U
BT/T/2 Wallabia bicolor R. lower molar protolophid Bsmall macropodid fibular shaft fragment (broken in two) Umurid L. upper incisor U
ulna shaft fragment Uvertebra fragment Ucalvarial fragment U
Rattus sp. cf. fuscipes L. dentary UR. dentary U
Cercartetus nanus L. squamosal UBT/T/3 lizard long bone fragment U
terra australis 21
315
Appendix 3 (Part 2)
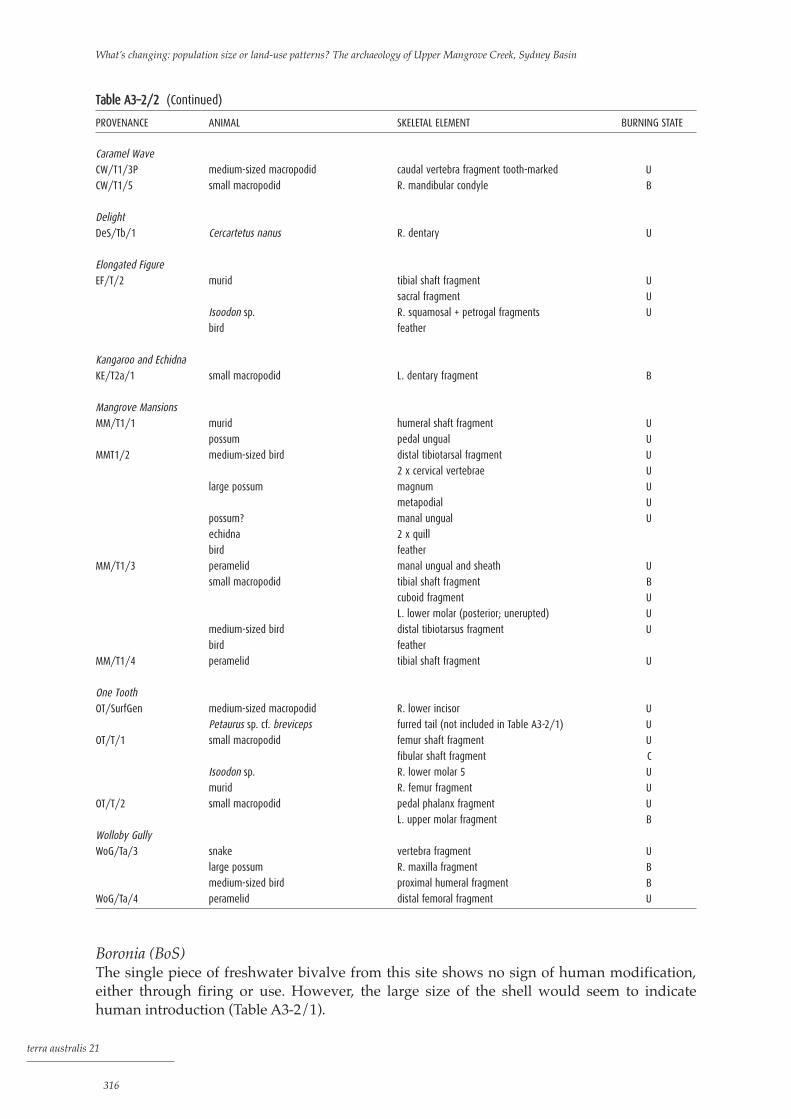
TTaabbllee AA33––22//22 (Continued)
PROVENANCE ANIMAL SKELETAL ELEMENT BURNING STATE
Caramel WaveCW/T1/3P medium-sized macropodid caudal vertebra fragment tooth-marked U
CW/T1/5 small macropodid R. mandibular condyle B
DelightDeS/Tb/1 Cercartetus nanus R. dentary U
Elongated FigureEF/T/2 murid tibial shaft fragment U
sacral fragment U
Isoodon sp. R. squamosal + petrogal fragments U
bird feather
Kangaroo and EchidnaKE/T2a/1 small macropodid L. dentary fragment B
Mangrove MansionsMM/T1/1 murid humeral shaft fragment U
possum pedal ungual U
MMT1/2 medium-sized bird distal tibiotarsal fragment U
2 x cervical vertebrae U
large possum magnum U
metapodial U
possum? manal ungual U
echidna 2 x quill
bird feather
MM/T1/3 peramelid manal ungual and sheath U
small macropodid tibial shaft fragment B
cuboid fragment U
L. lower molar (posterior; unerupted) U
medium-sized bird distal tibiotarsus fragment U
bird feather
MM/T1/4 peramelid tibial shaft fragment U
One ToothOT/SurfGen medium-sized macropodid R. lower incisor U
Petaurus sp. cf. breviceps furred tail (not included in Table A3-2/1) U
OT/T/1 small macropodid femur shaft fragment U
fibular shaft fragment C
Isoodon sp. R. lower molar 5 U
murid R. femur fragment U
OT/T/2 small macropodid pedal phalanx fragment U
L. upper molar fragment B
Wolloby GullyWoG/Ta/3 snake vertebra fragment U
large possum R. maxilla fragment B
medium-sized bird proximal humeral fragment B
WoG/Ta/4 peramelid distal femoral fragment U
Boronia (BoS)The single piece of freshwater bivalve from this site shows no sign of human modification,either through firing or use. However, the large size of the shell would seem to indicatehuman introduction (Table A3-2/1).
What’s changing: population size or land-use patterns? The archaeology of Upper Mangrove Creek, Sydney Basin
terra australis 21
316

terra australis 21
317
Caramel Wave (CW)With the possible exception of the single, tooth-marked specimen from T1/3P, this assemblageappears to be of purely archaeological origin, including the abundant and uniformly burnt‘yabby’ remains found in T1/3P and T1/4 (Tables A3-2/11 and A3-2/2). Preservation of theassemblage is relatively good throughout, though some deterioration with depth is evident. Inthe absence of strong evidence for differential preservation within the deposit, it seems likely thatthe concentration of faunal remains in T1/3P is due to a peak in human activity at that time.
As with the preceding site, the freshwater bivalve found on the surface, by virtue of itslarge size, is likely to be a human introduction.
Delight (DeS)The solitary pygmy-possum jaw from this site displays a distinct tooth puncture on its lingualsurface (Tables A3-2/1 and A3-2/2). The size of this puncture suggests a small species ofDasyurid or a brush-tailed phascogale (tuan), Phascogale tapoatafa, as the agent of introduction.
Dingo (DiS)This assemblage also appears to be of dual origin, the two components in this case showing aspatial segregation in addition to distinct physical properties (Tables A3-2/3 and A3-2/4). Thefirst component, concentrated in square Ta, comprises the unburnt and little fragmentedremains of small mammals and frogs. This material most likely represents the remains of dis-aggregated owl pellets.
The second component, which is of probable archaeological origin, is spread moreevenly between the two excavated squares. In contrast with the non-archaeological bone, thismaterial is more thoroughly fragmented, is nearly always burnt to some degree, and is oflarger prey species. Also of likely archaeological origin are the highly fragmented freshwaterbivalve and Anadara materials, and the relatively abundant ‘yabby’ remains, virtually all ofwhich show evidence of firing.
Preservation of both components is good throughout square Ta, and through spits 1 to5 of square Tb. Material from Tb/6-7, by contrast, shows clear signs of post-depositionaldegradation; this probably accounts for the reduced quantities of shell and of ‘yabby’ in thesespits. The sudden change in condition of the remains between Tb/5 and Tb/6 suggests somestratigraphic complexity at this level.
TTaabbllee AA33––22//33 Dingo Shelter: summary of faunal assemblage by excavation unit.
PROVENANCE BONE BURNING SHELL SHELL TYPE YABBY
WT (g) NO. U B C WT (g) NO. B A T WT (g) NO.
DiS/Ta/1 3.0 45 10 11 24 0.2 9 * * 0.2 6
DiS/Ta/2 2.5 33 10 16 7 0.1 6 * * * 0.1 7
DiS/Ta/3 4.7 45 9 19 17 0.9 6 * * 0.4 14
DiS/Ta/4 0.1 10 3 4 3 0.1 5 * 0.1 7
DiS/Ta/Swpgs 0.1 1 1 0.1 1 * 0.1 2
DiS/Tb/Surf 2.4 5 5 1.5 2 * * 0.1 2
DiS/Tb/1 0.6 8 1 4 3 0.1 3 * * 0.1 3
DiS/Tb/2Upr 1.2 13 2 7 4 0.1 1 * 0.1 1
DiS/Tb/2Upr(SWC) 0.6 6 2 4 0.1 3 * * 0.1 3
DiS/Tb/2LwrPB 0.6 9 4 5 0.3 12 * 0.1 13
DiS/Tb/3GB 1.1 10 8 2 0.1 11
DiS/Tb/3PB(Nth) 7.4 62 6 48 8 0.4 3 * 0.4 15
Appendix 3 (Part 2)

TTaabbllee AA33––22//33 (Continued)
PROVENANCE BONE BURNING SHELL SHELL TYPE YABBY
WT (g) NO. U B C WT (g) NO. B A T WT (g) NO.
DiS/Tb/3LwrPB 1.4 21 2 14 5 0.6 4 * * 0.8 30
DiS/Tb/4GB 2.2 17 1 11 5 0.1 5 * 0.1 2
DiS/Tb/4GBSth 4.0 61 19 28 14 0.4 15 * 0.3 13
DiS/Tb/5 3.7 8 7 1 0.5 21 * 0.1 2
DiS/Tb/6 0.9 17 13 4 0.5 20
DiS/Tb/7 1.4 9 3 6
DiS/Tb/8 1.6 17 1 16
DiS/Tb/Swpgs 0.1 2 2
Totals 39.6 399 5.5 96 3.7 152
TTaabbllee AA33––22//44 Dingo Shelter: taxonomically diagnostic faunal remains listed by excavation unit.
PROVENANCE ANIMAL SKELETAL ELEMENT BURNING STATE
DiS/Ta/1 medium-sized snake rib fragment B
murid cervical vertebra U
thoracic vertebra U
caudal vertebra U
bandicoot scapular fragment U
DiS/Ta/2 frog cranial fragment U
long bone fragment U
murid lumbar vertebra U
macropodid caudal vertebra fragment B
DiS/Ta/3 medium-sized macropodid R. dentary fragment B
Petaurus australis/Petauroides volans ulna shaft U
DiS/Tb/Surf murid L. femur U
medium-sized macropodid L. metatarsal V fragment U
DiS/Tb/1 small macropodid manal ungual B
DiS/Tb/3PB(Nth) large macropodid L. lower incisor fragment B
medium-sized macropodid metatarsal IV fragment B
astragalar fragment B
metatarsal IV distal epip. B
DiS/Tb/3LwrPB medium-sized/large macropodid lower incisor fragment B
DiS/Tb/4GB pseudocheirine R. dentary with teeth B
DiS/Tb/4GB(Sth) macropodid lower incisor fragment U
DiS/Tb/5 small/medium-sized macropodid R. metatarsal V fragment B
DiS/Tb/6 small macropodid lower incisor fragment B
DiS/Tb/7 peramelid L. maxilla fragment B
DiS/Tb/8 small macropodid cuboid fragment B
Elngarrah (ES)Both bone fragments from this site display a type of surface polishing and rounding offracture edge that is often seen in material derived from dog faeces. The small fragment offreshwater bivalve from Td/2 likewise shows no human modification, and could not by itselfbe regarded as evidence of human activity at the site (Table A3-2/1).
What’s changing: population size or land-use patterns? The archaeology of Upper Mangrove Creek, Sydney Basin
terra australis 21
318

Elongated Figure (EF)This small assemblage does not appear to contain any humanly derived material (Tables A3-2/1 and A3-2/2). Although the presence of small mammals might suggest an owl-pelletorigin, the occurrence of one non-diagnostic fragment showing gastric corrosion suggests thatat least some of the material derives from dog faeces.
Emu Tracks 2 (ET2)All specimens from this site are unburnt and lack signs of human utilisation (Tables A3-2/1and A3-2/2). The Anadara fragment in spit T2b/1, however, must presumably be a humanintroduction.
Harris Gully (HG)The three calcined bone fragments from T/2 are all highly degraded, suggesting a high rate offaunal decay in this site (Table A3-2/1). This in turn makes it seem unlikely that either theunburnt bone from the surface of the site or the snail shell from T/1 are of archaeologicalvintage.
Kangaroo and Echidna (KE)The solitary macropodid jaw recovered from this site is thoroughly burnt and hencepresumably derives from human activity (Tables A3-2/1 and A3-2/2). Both shell fragmentsfrom T2d/2 are unburnt however, and are thus of equivocal status.
McPherson (McP)The single non-diagnostic bone fragment from this site is not obviously derived from humanactivity (Table A3-2/1).
Mangrove Mansions (MM)This assemblage is also of probable multiple origin, some fragments showing clear gastriccorrosion, and others showing the thorough burning and fine fragmentation of archaeologicalremains (Tables A3-2/1 and A3-2/2). Because of the potentially large overlap in prey speciesbetween dog and human, it is not possible on present evidence to estimate the contribution ofeach component in this assemblage.
Preservation of both components is good throughout. Given this fact, the relativepaucity of shell and the absence of ‘yabby’ are probably both ‘original’ features of theassemblage.
Moss Gully (MG)The single unburnt terrestrial snail fragment from this site is almost certainly not of humanderivation (Table A3-2/1).
One Tooth (OT)This small assemblage most likely includes two components, a probable non-archaeologicalcomponent confined to the surface and spit 1, and an archaeological component which extendsthrough spits 1 to 3 (Tables A3-2/1 and A3-2/2). The recovery of a furred tail of a glider (Petaurussp.) from the surface suggests the continued use of the site by a raptor, probably an owl.
Preservation of the archaeological material is relatively good in spit 1, but becomesprogressively worse with depth. The small quantities of shell, and the absence of ‘yabby’ fromthe site, may thus both be due to post-depositional factors.
terra australis 21
319
Appendix 3 (Part 2)

Two Moths (TMS)With the possible exception of the large freshwater bivalve fragment in T/5, this assemblageappears to be entirely non-archaeological in origin (Tables A3-2/5 and A3-2/6). Even so, theassemblage appears complex, some material (e.g., the bats) being of likely pelletal origin, yetother specimens showing clear signs of gastric corrosion. These latter specimens occur at all levels in the site, but appear particularly common below spit T/5. Other material again (hairs and juvenile skeletal remains) would seem to derive from recent usage of thesite by wombats.
Preservation is excellent throughout the deposit, suggesting very dry conditions. Todate, Two Moths represents the only occurrence of a stratified and well-preserved micro-faunain the Mangrove Creek area. As such, the site could well be of considerable value from apalaeo-ecological viewpoint. However, because of the relatively low density of remains, itwould probably be necessary to excavate 5 sq m or more to ensure an adequate sample ofdiagnostic remains for detailed analysis.
TTaabbllee AA33--22//55 Two Moths: summary of faunal assemblage by excavation unit (totals exclude feathers and hairs).
PROVENANCE BONE BURNING STATE SHELL SHELL TYPE YABBY
WT (g) NO. U B C WT (g) NO. B A T WT (g) NO.
TMS/T/1 0.2 8 8 0.1 1 *TMS/T/2 1.4 14 14
TMS/T/4 0.1 1 1
TMS/T/5 0.9 18 18 7.1 1 *TMS/T/6 0.6 16 16
TMS/T/7 0.6 15 15
TMS/T/8 0.5 9 9
TMS/T/9 0.1 3 3
Totals 4.4 84 7.2 2
TTaabbllee AA33––22//66 Two Moths: taxonomically diagnostic faunal remains listed by excavation unit.
PROVENANCE ANIMAL SKELETAL ELEMENTS BURNING STATE
TMS/T/1 bird feathers
large mammal (wombat?) numerous hairs
murid caudal vertebra U
2 x thoracic vertebrae U
peramelid pubic symphysis U
lizard long bone shaft U
TMS/T/2 bird feathers
large mammal (wombat?) hair
microchiropteran bat manal phalanx U
murid thoracic vertebra U
Vombatus ursinus distal radial epip. U
distal ulna epip. U
TMS/T/4 murid L. lower incisor fragment U
TMS/T/5 Potorous sp. L. lower incisor U
small dasyurid L. dentary fragment U
Pseudomys oralis L. maxilla with M1-3 U
murid L. ulna U
frog tibial shaft U
What’s changing: population size or land-use patterns? The archaeology of Upper Mangrove Creek, Sydney Basin
terra australis 21
320
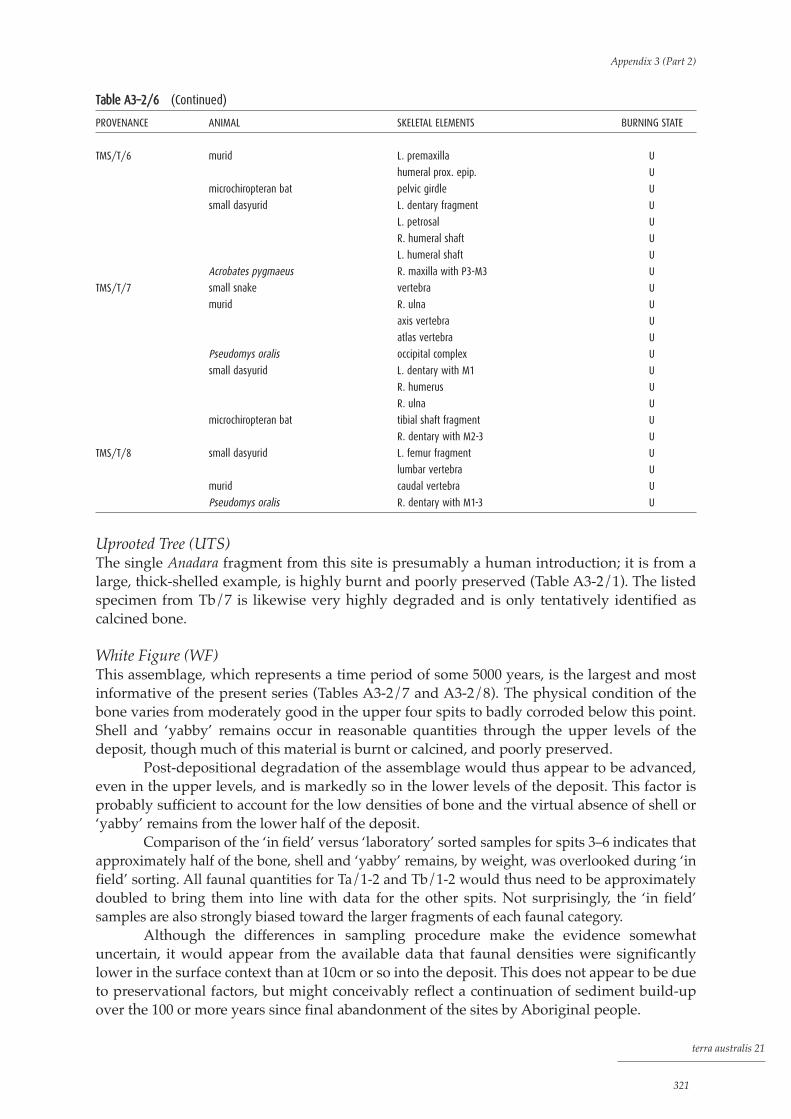
TTaabbllee AA33––22//66 (Continued)
PROVENANCE ANIMAL SKELETAL ELEMENTS BURNING STATE
TMS/T/6 murid L. premaxilla U
humeral prox. epip. U
microchiropteran bat pelvic girdle U
small dasyurid L. dentary fragment U
L. petrosal U
R. humeral shaft U
L. humeral shaft U
Acrobates pygmaeus R. maxilla with P3-M3 U
TMS/T/7 small snake vertebra U
murid R. ulna U
axis vertebra U
atlas vertebra U
Pseudomys oralis occipital complex U
small dasyurid L. dentary with M1 U
R. humerus U
R. ulna U
microchiropteran bat tibial shaft fragment U
R. dentary with M2-3 U
TMS/T/8 small dasyurid L. femur fragment U
lumbar vertebra U
murid caudal vertebra U
Pseudomys oralis R. dentary with M1-3 U
Uprooted Tree (UTS)The single Anadara fragment from this site is presumably a human introduction; it is from alarge, thick-shelled example, is highly burnt and poorly preserved (Table A3-2/1). The listedspecimen from Tb/7 is likewise very highly degraded and is only tentatively identified ascalcined bone.
White Figure (WF)This assemblage, which represents a time period of some 5000 years, is the largest and mostinformative of the present series (Tables A3-2/7 and A3-2/8). The physical condition of thebone varies from moderately good in the upper four spits to badly corroded below this point.Shell and ‘yabby’ remains occur in reasonable quantities through the upper levels of thedeposit, though much of this material is burnt or calcined, and poorly preserved.
Post-depositional degradation of the assemblage would thus appear to be advanced,even in the upper levels, and is markedly so in the lower levels of the deposit. This factor isprobably sufficient to account for the low densities of bone and the virtual absence of shell or‘yabby’ remains from the lower half of the deposit.
Comparison of the ‘in field’ versus ‘laboratory’ sorted samples for spits 3–6 indicates thatapproximately half of the bone, shell and ‘yabby’ remains, by weight, was overlooked during ‘infield’ sorting. All faunal quantities for Ta/1-2 and Tb/1-2 would thus need to be approximatelydoubled to bring them into line with data for the other spits. Not surprisingly, the ‘in field’samples are also strongly biased toward the larger fragments of each faunal category.
Although the differences in sampling procedure make the evidence somewhatuncertain, it would appear from the available data that faunal densities were significantlylower in the surface context than at 10cm or so into the deposit. This does not appear to be dueto preservational factors, but might conceivably reflect a continuation of sediment build-upover the 100 or more years since final abandonment of the sites by Aboriginal people.
terra australis 21
321
Appendix 3 (Part 2)

In terms of taxonomic composition and general character, the White Figureassemblage is closely comparable with other ‘archaeological’ assemblages from theMangrove Creek area. Special features of this assemblage include the relatively highabundance of Potorous sp. among the mammals, and the constant occurrence of the ‘yabby’remains. Of these, the high abundance of Potorous sp. might suggest the proximity of thesite to dense and relatively wet vegetation of the kind now found in the more shelteredportions of the upper catchment.
Wolloby Gully (WoG)This small assemblage (Tables A3-2/1 and A3-2/2) probably derives solely from humanoccupation of the site. Preservation is relatively good throughout. The presence of a medium-sized bird in the assemblage is of interest in view of the poor representation of this group inthe other Mangrove Creek sites. Further comparisons presently under way should result in acloser identification of this specimen.
TTaabbllee AA33––22//77 White Figure: summary of faunal assemblage by excavation unit (FS = field sort; LS = laboratory sort; Total =
FS+LS; see Chapter 5).
PROVENANCE BONE BURNING STATE SHELL SHELL TYPE YABBY
WT (g) NO. U B C WT (g) NO. B A T WT (g) NO.
WF/Ta/1 FS = Total 0.4 8 1 7 0.4 4 * * 0.1 2
WF/Ta/2 FS = Total 2.7 29 1 8 20 0.3 4 * * 0.1 2
WF/Ta/3 FS 6.7 43 1 15 27 0.4 14 * * *WF/Ta/3 LS 6.7 188 8 45 135 0.5 24 * * * 0.2 24
WF/Ta/3 Total 13.4 231 9 60 162 0.9 38 * * * 0.2 24
WF/Ta/4 FS 6.9 55 24 31 0.4 5 * 0.1 2
WF/Ta/4 LS 7.2 218 12 38 168 0.2 13 * 0.1 11
WF/Ta/4 Total 14.1 273 12 62 199 0.6 18 * 0.2 13
WF/Ta/5 FS 4.7 17 1 7 9 0.8 4 * * 0.1 2
WF/Ta/5 LS 2.1 58 5 53
WF/Ta/5 Total 6.8 75 1 12 62 0.8 4 * * 0.1 2
WF/Ta/6 FS 0.1 1 1
WF/Ta/6 LS 0.2 8 3 5
WF/Ta/6 Total 0.3 9 3 6
WF/Tb/Surf 0.1 1 1
WF/Tb/1 FS = Total 2.7 34 4 30 0.3 4 * * 0.1 2
WF/Tb/2 FS = Total 5.9 57 4 13 40 1.2 10 * 0.1 3
WF/Tb/3 FS 2.8 27 2 8 17 0.2 10 * *WF/Tb/3 LS 3.1 95 4 14 77 0.1 4 * 0.1 10
WF/Tb/3 Total 5.9 122 6 22 94 0.3 14 * 0.1 10
WF/Tb/4 FS 4.0 3+30 5 2+11 1+14 0.1 3 *WF/Tb/4 LS 3.9 126 5 19 102 0.1 3 * 0.1 2
WF/Tb/4 Total 7.9 159 10 32 117 0.2 6 * 0.1 2
WF/Tb/5 FS 0.4 2 2
WF/Tb/5 LS 1.9 35 1 34 0.1 1
WF/Tb/5 Total 2.3 37 1 36 0.1 1
WF/Tb/6 FS = Total 0.2 5 5
WF/Tb/7 FS = Total 0.1 1 1 0.1 1 * 0.1 1
Totals WF/Ta+Tb 62.8 1041 5.1 103 1.2 61
What’s changing: population size or land-use patterns? The archaeology of Upper Mangrove Creek, Sydney Basin
terra australis 21
322

terra australis 21
323
TTaabbllee AA33––22//88 White Figure: taxonomically diagnostic faunal remains listed by excavation unit.
PROVENANCE ANIMAL SKELETAL ELEMENT BURNING STATE
WF/Ta/2 peramelid L. tibial shaft B
small/medium-sized macropodid petrosal fragment B
fibular shaft fragment B
possum? clavicle fragment B
WF/Ta/3 medium-sized/large macropodid lower incisor fragment B
small macropodid fibular shaft fragment B
pseudocheirine L. dentary with M4-5 U
WF/Ta/3 FS small/medium-sized macropodid R. dentary fragment C
cf. Potorous sp. L. petrosal fragment C
metatarsal IV fragment C
small macropodid lower incisor fragment B
upper molar protoloph fragment B
peramelid L. dentary fragment B
medium-sized snake L. dentary fragment B
WF/Ta/4 small/medium-sized macropodid mandibular condyle C
lower incisor fragment B
small agamid L. maxilla fragment B
medium-sized snake R. dentary fragment C
WF/Ta/4 FS small/medium-sized macropodid rib fragment B
lower molar fragment U
Potorous sp. L. lower incisor fragment C
L. dentary fragment C
small dasyurid R. dentary fragment U
medium-sized lizard articular fragment C
medium-sized snake vertebra fragment C
WF/Ta/5 FS small/medium-sized macropodid metatarsal IV fragment C
WF/Tb/2 medium-sized macropodid L. metatarsal IV fragment B
WF/Tb/3 small macropodid fibular shaft fragment C
WF/Tb/3 FS medium-sized snake vertebra fragment C
WF/Tb/4 FS Potorous sp. posterior molar fragment B
peramelid L. maxilla fragment B
small/medium-sized macropodid L. upper molar fragment B
lower incisor fragment B
ReferencesAplin, K. 1981. Faunal Remains from Archaeological Sites in Mangrove Creek Catchment. Appendix 4
in V. Attenbrow, Mangrove Creek Dam Salvage Excavation Project — Volume 2. Unpublishedreport to National Parks & Wildlife Service of NSW on behalf of Department of Public Worksof NSW.
Aplin, K. and K. Gollan. 1982. Faunal Remains from Archaeological Sites in the Mangrove CreekCatchment 2: The Deep Creek Fauna. Appendix 3 in V. Attenbrow, Archaeological Investigationof Deep Creek Shelter, Mangrove Creek Dam. Unpublished report to National Parks &Wildlife Service of NSW on behalf of Department of Public Works of NSW.
Appendix 3 (Part 2)

PART 3
Extracts from:Faunal remains from archaeological sites in the Mangrove Creekcatchment. A report to National Parks & Wildlife Service of NSW.
Appendix 4 in V. Attenbrow 1981, Mangrove Creek Dam SalvageExcavation Project, Volume 2.
by Ken Aplin 1981
Details for Loggers, Black Hands and Geebung Shelters
Loggers (LS)While faunal remains are preserved throughout the upper metre of the deposit, more than95% by weight are derived from the first 50cm and thereby represent only a short part of thetotal sequence.
On the basis of changes within the stone artefact assemblage, Attenbrow divides thesequence into a total of six cultural levels. Only levels I-V produced faunal remains (Table A3-3/2).
TTaabbllee AA33––33//11 Loggers, Black Hands and Geebung: total number and weight of faunal remains (from Aplin 1981: Table 1).
BONE SHELL – TOTAL
TOTAL IDENTIFIED
SITE NAME NO. WT (g) NO. NO. WT (g)
Loggers Shelter 9633 1317.7 395 211 20.1
Black Hands 451 55.0 12 1 0.1
Geebung Shelter 1 0.1 – – 0.1
FaunaFaunal remains were recovered from all squares excavated but did not extend below 90cminto the deposit (Tables A3-3/2 and A3-3/3). Figure A3–3/1 summarises variations in thedensity and physical condition of faunal materials found along the transect from square Ainside the dripline, to square F near the outward limit of the deposit.
TTaabbllee AA33––33//22 Loggers Shelter: bone from all squares (from Aplin 1981: Table 2).
ANALYTICAL UNIT UNBURNT BURNT TOTAL
NO. WT (g) NO. WT (g) NO. WT (g)
LS/I 576 150.9 6641 903.4 7217 1054.3
LS/II 80 10.5 1920 199.4 2000 210.1
LS/III 5 0.3 218 19.6 223 19.9
LS/IV - - 50 4.7 50 4.7
LS/V - - 3 0.2 3 0.2
What’s changing: population size or land-use patterns? The archaeology of Upper Mangrove Creek, Sydney Basin
terra australis 21
324
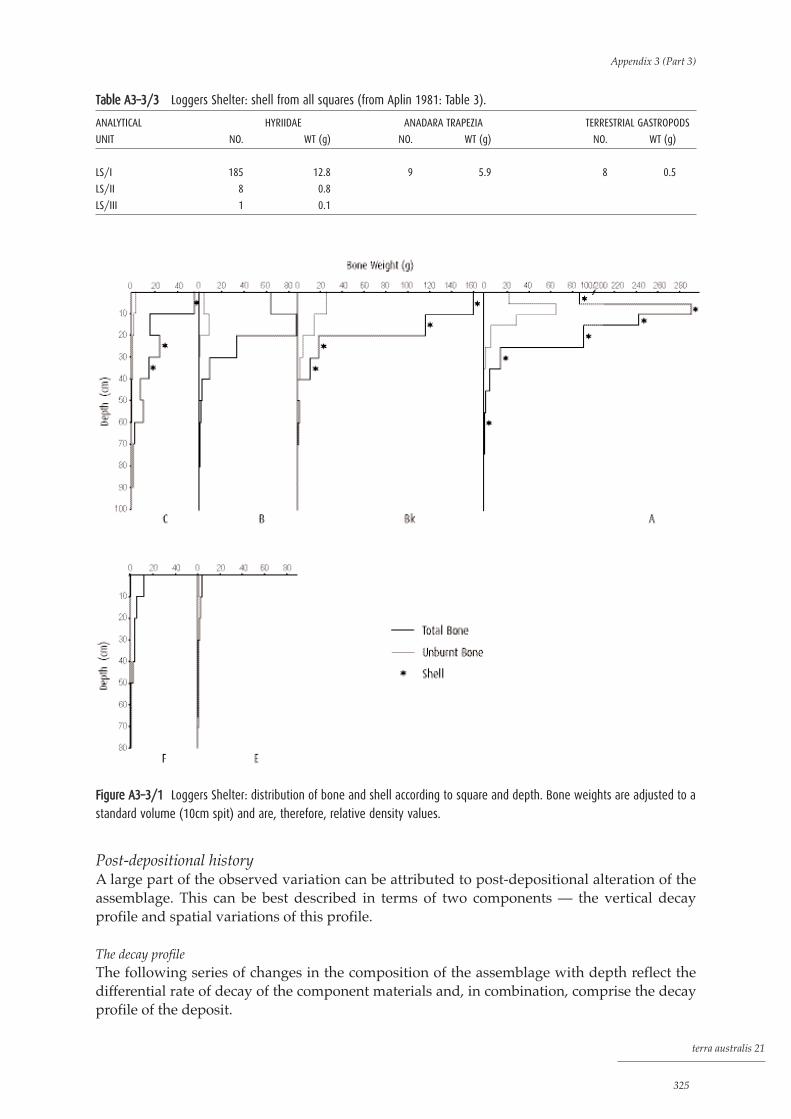
terra australis 21
325
TTaabbllee AA33––33//33 Loggers Shelter: shell from all squares (from Aplin 1981: Table 3).
ANALYTICAL HYRIIDAE ANADARA TRAPEZIA TERRESTRIAL GASTROPODS
UNIT NO. WT (g) NO. WT (g) NO. WT (g)
LS/I 185 12.8 9 5.9 8 0.5
LS/II 8 0.8
LS/III 1 0.1
Post-depositional historyA large part of the observed variation can be attributed to post-depositional alteration of theassemblage. This can be best described in terms of two components — the vertical decayprofile and spatial variations of this profile.
The decay profileThe following series of changes in the composition of the assemblage with depth reflect thedifferential rate of decay of the component materials and, in combination, comprise the decayprofile of the deposit.
Appendix 3 (Part 3)
FFiigguurree AA33––33//11 Loggers Shelter: distribution of bone and shell according to square and depth. Bone weights are adjusted to a
standard volume (10cm spit) and are, therefore, relative density values.

1. Where preserved at all, shell and crustacean exoskeleton are confined to the upperlevels of the profile.
2. Bone density decreases with depth, with unburnt bone disappearing more rapidlythan burnt bone.
Additional features of the decay profile which are not represented in Figure A3–3/1, are: 3. lightly burnt bone decays and disappears more rapidly than calcined bone. As a
result, calcined bone forms a progressively greater proportion of the total bone withdepth.
4. the average weight of bone fragments shows a gradual decline with depth asremaining fragments are reduced in size by the decay process.The overall regularity with which these changes take place in each square is
suggestive evidence that, at least for the upper part of the deposit, the quantity of bone originally deposited in the site did not fluctuate markedly over time. Attenbrowdescribes a similar lack of change in the density of stone artefacts through the upper metreof the deposit.
Spatial variationThe faunal remains show as much variation in density and character along the spatial transectas down the decay profile. These variations clearly reflect the relative degree of exposure ofthe various squares.
Squares A and BkThese squares lie wholly (A) or partly (Bk) inside the dripline of the shelter and haveproduced a large proportion of the total faunal assemblage. The greater part of thisconcentration is contained within the upper 25cm of the profile, where moderate quantities ofshell and high densities of bone were encountered. The bone from these levels is relativelywell preserved and includes a high proportion of unburnt and lightly burnt remains. Bonedensity decreases slightly through these levels but undergoes a dramatic decline about 20cminto the deposit. At this depth, the organic matter content also declines rapidly and the deposittakes on a mottled appearance. Below this point the surviving bone is virtually all calcinedand bone densities fall more gradually.
Squares B and CSquares B and C are positioned outside the dripline, but in the central, slightly mounded areaof the deposit. Shell was not recovered from square B but a few fragments from square C attestto its former presence in this part of the site. Bone is considerably less abundant in the upperlevels of these squares than at the same depth inside the dripline, but nevertheless, includes areasonable proportion of unburnt and lightly burnt remains. As in squares A and Bk, thesecomponents have all but disappeared within 20cm of the surface, leaving only calcinedremains to continue for a further 70cm into the deposit.
Squares E and FThese squares occupy a comparable position relative to the dripline as squares B and C. Shellis entirely absent from both squares and, while bone is preserved to similar depth as elsewherein the site, it is present at uniformly low densities and contains a high proportion of calcinedremains.
What’s changing: population size or land-use patterns? The archaeology of Upper Mangrove Creek, Sydney Basin
terra australis 21
326

DiscussionThe marked spatial variations within the faunal assemblage from Loggers Shelter provide aunique insight into the rate at which faunal remains may decay under different conditions.
Assuming the high density of remains found within the dripline to have once beencontinuous across the site, the difference between this quantity and the density of bonepresent at other points in the site constitutes a minimum estimate of the quantity of bone lostaltogether over a time span of several centuries. In the case of squares E and F, the survivingbone would, by this reasoning, represent less than one-thirtieth of the postulated originalquantity of remains. This represents an absolute decay rate in the order of 1kg of bone/cubicmetre/100 years, which, given the exposed situation of these squares, must be near amaximum rate for a deposit of this kind.
Origin of the remainsOnly the faunal remains from the upper levels of squares A and Bk are sufficiently wellpreserved to indicate their mode of accumulation. The following comments are basedprimarily on this material but apply equally to the entire assemblage.
The virtual absence of small vertebrate taxa from the assemblage excludes anylikelihood that a raptorial predator has made a significant contribution. Furthermore, the fewelements that do represent the smaller forms are fragmented and burnt, and do not stand outas an external element within the total fauna.
It is rather more difficult to exclude the possibility that the site was utilised bycarnivores at various times during the past. Although no persuasive evidence of carnivoreactivity, such as tooth-marked bones, was noted within the assemblage, the general characterof the material and, in particular, its thorough and even fragmentation, are reminiscent ofsome predator accumulations. The assemblage is also thoroughly burnt and, while this doesnot negate the presence of a secondarily burnt non-archaeological component, the degree ofburning is probably sufficient to account for the fragmentation of the bone without thenecessity of invoking other factors.
Faunal composition
InvertebratesThree types of mollusc and two crustaceans are represented among the small quantity ofinvertebrate remains recovered (Table A3-3/1). A large proportion of the molluscan remains iscontributed by the freshwater bivalve family Hyriidae, the more complete specimens of whichappear to represent the genus Hyridella. Occasional fragments of at least two types ofterrestrial gastropod, a large and a small form, are represented, but as these were all found ator near the surface of the deposit they are probably a recent addition.
In addition to these locally available forms, nine fragments of the estuarine bivalveAnadara trapezia, the Sydney cockle, were recovered from Level I of the deposit. The nearestpopulations of this species are probably found within the mangrove communities alongLower Mangrove Creek, approximately 20km downstream of Loggers Shelter. Although therobust shells of this species were quite possibly taken into the Upper Mangrove Creek area foruse as implements, the specimens recovered thus far from Loggers Shelter and elsewhere inthe catchment show no signs of any such function.
The two types of crustacean represented in the assemblage are a locally availablefreshwater yabby (family Parastacidae), and an as yet undetermined type of crab. The latter isalmost certainly derived from the same estuarine reaches of Lower Mangrove Creek as theSydney cockle.
terra australis 21
327
Appendix 3 (Part 3)

VertebratesVertebrates are represented by a total of 395 identified elements, most of which come fromlevels I (N = 319) and II (N = 66) of the deposit (Table A3-3/4). Analysis of the faunal sequenceis thereby limited to a comparison of these samples.
TTaabbllee AA33––33//44 Loggers Shelter: number of identified taxon for each analytical unit in all squares and a site total (from Aplin
1981: Table 4).
IDENTIFIED TAXON ANALYTICAL UNIT SITE TOTAL
I II III IV
Macropus robustus 3 - - - 3
Large macropodid 27 9 - - 36
Macropus rufogriseus 2 1 - - 3
Wallabia bicolor 7 - 1 - 8
Medium macropodid 83 20 2 3 108
Petrogale penicillata 3 1 - - 4
Thylogale sp. 2 1 - - 3
Small macropodid 123 21 2 - 146
Potorous sp. 3 - - - 3
Potoroidae 13 4 - - 17
Trichosurus vulpecula 9 2 1 - 12
Pseudocheirus peregrinus - 1 - - 1
Pseudocheirine petaurid 8 1 1 - 10
Petaurus sp. - 1 - - 1
Isoodon sp. 2 - - - 2
Peramelidae 10 - - - 10
Vombatus ursinus 1 - - - 1
Pteropus scapulatus 1 - - - 1
Boidae 4 1 - - 5
Elapidae 1 1 - - 2
Ophidia 5 2 - - 7
Agamidae 2 - - - 2
Egernia sp. 1 - - - 1
cf. Dromaius novaehollandiae 1 - - - 1
Teleost fish 8 - - - 8
Total number 319 66 7 3 395
The vertebrate faunas from levels I and II are extremely similar in virtually allrespects. The main features in common are as follows: 1. Mammals are dominant in both levels and contribute 93.4% of the total identified
sample. Small numbers of reptiles (4.3%), fish (2%) and a bird (0.3%) account for theremainder of the material.
2. Macropodids are by far the most commonly represented mammalian family,comprising between 71.5% and 100% of the identified remains. Size classes withinthis family maintain a constant order of abundance with the frequency ofsmall/medium/large in both levels.
3. There is an almost complete correspondence in the range of the mammal species presentand their relative abundances. In particular, a number of macropodids (Petrogalepenicillata, Thylogale sp. and Macropus rufogriseus) and several other small mammals(Potorous sp., Trichosurus sp. and pseudocheirines) are equally abundant in both levels.Several aspects of the close similarity between the two levels may well be little more
than an artefact of differential destruction of smaller or less compact elements during the early
What’s changing: population size or land-use patterns? The archaeology of Upper Mangrove Creek, Sydney Basin
terra australis 21
328

terra australis 21
329
phases of post-depositional decay of the assemblage. This is probably true of the virtualabsence of fish bone from the deposit and may also partly account for the general abundanceof the macropodids.
Other stable features of the assemblage are, however, almost certainly not a productof differential decay. Most convincing in this regard is the predominance of the smaller andmedium-sized macropodids over the larger forms (Table A3-3/5), an ordering contrary to thatexpected if differential decay alone was determining the faunal spectrum.
TTaabbllee AA33––33//55 Loggers Shelter: percentage composition of selected fauna (from Aplin 1981: Table 21).
IDENTIFIED TAXON PERCENTAGE FREQUENCY
Large macropodid 9.9
Medium macropodid 30.1
Small macropodid 38.7
Potoroidae 5.1
Phalangeridae 3.0
Petaurinae 0.2
Pseudocheirinae 2.8
Paramelidae 3.0
Vombatidae 0.1
Chiroptera 0.1
Ophidia 3.5
Lacerilia 0.8
Teleost fish 2.0
Aves 0.2
Total (no.) 395
Total macropodid 78.7
Total macropodoid 83.8
Total phalangerid and petaurid 6.0
Despite this overall stability within the faunal sequence, a number of differences existbetween levels I and II. These can be summarised as follows: 1. Large macropodids decrease in relative abundance from level II (13.6%) to level I
(9.4%). This is compensated for partly by an increase in the abundance of smallmacropodids. The ecological significance of these changes is obscure.
2. Wallabia bicolor is present in low numbers in level I but absent from level II. Thisspecies appears to inhabit wet dense understorey in forested areas and its slightincrease in abundance may indicate moister conditions during the later phase. It is,however, represented in the small assemblage from level III, suggesting that thissequence may be more complex than indicated through a study of levels I and II alone.
3. The remains of bandicoots are confined to level I, where they are relatively common.Within this class of remains, all diagnostic elements represent the short-nosedbandicoot, Isoodon sp., an inhabitant of dense understorey in drier communities. Thisindication of drier conditions during level I times is in contradiction to that suggestedby the appearance at that time of W. bicolor.
4. A number of taxa were found only in level I. These include several mammals(Vombatus ursinus and Pteropus scapulatus) and reptiles (Agamidae, Egernia sp.), andthe emu (Dromaius novaehollandiae). All of these occur infrequently, however, and theirabsence from level II is best attributed to the fivefold difference in sample size. Fish arealso unrepresented in level II, but in this case, differential decay may be responsible.
Appendix 3 (Part 3)

In summary, the faunal sequence from Loggers Shelter displays a remarkablestability through time, both in overall composition and in the relative contributions of thevarious minor taxa. Species indicative of both ‘wet’ and ‘dry’ conditions are present in roughlyeven proportions, and this is taken to indicate the presence within the broad reaches of themain valley of a diverse mosaic of vegetation types from moist and dense to more open, drycommunities. Evidence for change within the sequence is contradictory but weighs in favourof a slight areal reduction of wet communities between levels II and I.
Black Hands (BH)This site is located in an isolated boulder near the foot of a long north-west-facing slope. Thecavernous overhang has formed in the western face of the boulder, thereby leaving the floorarea unprotected against the action of slopewash from the hillside above.
Due to recent disturbance within this site, the excavation (Square F) was conductedoutside the dripline. At this point, more than one metre thickness of slopewashed sedimentshas accumulated over the last 3000 years. The deposit is sandy and possesses a low organiccontent throughout.
FaunaSmall quantities of poorly preserved shell were recovered from near the surface in theexcavated area (Table A3-3/6). Larger quantities of better preserved shell were found in adisturbed context inside the dripline, thereby indicating that conditions may have been rathermore conducive to preservation within the confines of the shelter overhang. Only freshwatershellfish are represented in these small samples.
TTaabbllee AA33––33//66 Black Hands and Geebung Shelters: bone and shell (from Aplin 1981: Table 8).
SITE NAME SQUARE/SPIT UNBURNT BONE BURNT BONE TOTAL BONE HYRIIDAE ANADARA TERRESTRIAL
TRAPEZIA GASTROPOD
NO. WT (g) NO. WT (g) NO. WT (g) NO. WT (g) NO. WT (g) NO. WT (g)
Black Hands F/1 26 3.3 26 3.3
F/2 2 0.2 110 15.0 112 15.2 1 0.1
F/3 127 16.0 127 16.0
F/4 49 4.8 49 4.8
F/5 51 4.5 51 4.5
F/6 10 0.4 10 0.4
F/7 1 0.1 1 0.1
Total 2 0.2 374 44.1 376 44.3 1 0.1
Geebung T/1 1 0.1 1 0.1 2 0.1
Bone was recovered to a depth of 85cm in the excavation. Near the surface of thedeposit, it was present in moderate quantities but is thoroughly degraded even here. Virtually nounburnt or lightly burnt bone has survived what must amount to a century or more of exposurein the surface context. Below this level, bone density decreases regularly with depth. Throughoutthe greater depth of its occurrence, the bone retains virtually none of its original morphology.
Due to the extremely poor condition of the remains, very few bone fragments proveddiagnostic at even the broadest taxonomic level (Table A3-3/7). Macropodids of various sizesaccount for most of the identified sample and probably also comprise a large proportion of theunidentified remains. A single fragment of a pseudocheirine completes the assemblage.
What’s changing: population size or land-use patterns? The archaeology of Upper Mangrove Creek, Sydney Basin
terra australis 21
330

TTaabbllee AA33––33//77 Black Hands Shelter, Square F: faunal composition (from Aplin 1981: Table 10).
IDENTIFIED TAXON SPIT
SURFACE F/1 F/2 F/3 F/4 F/5
Large macropodid 1
Medium macropodid 1
Petrogale penicillata 1 2
Small macropodid 1 2 1
Pseudocheirine petaurid 1
Geebung (GS)A single piece of calcined bone and some fragments of freshwater bivalve were recovered fromthis shelter (Tables A3-3/1 and A3-3/6), which contains a shallow and very exposed deposit.
terra australis 21
331
Appendix 3 (Part 3)
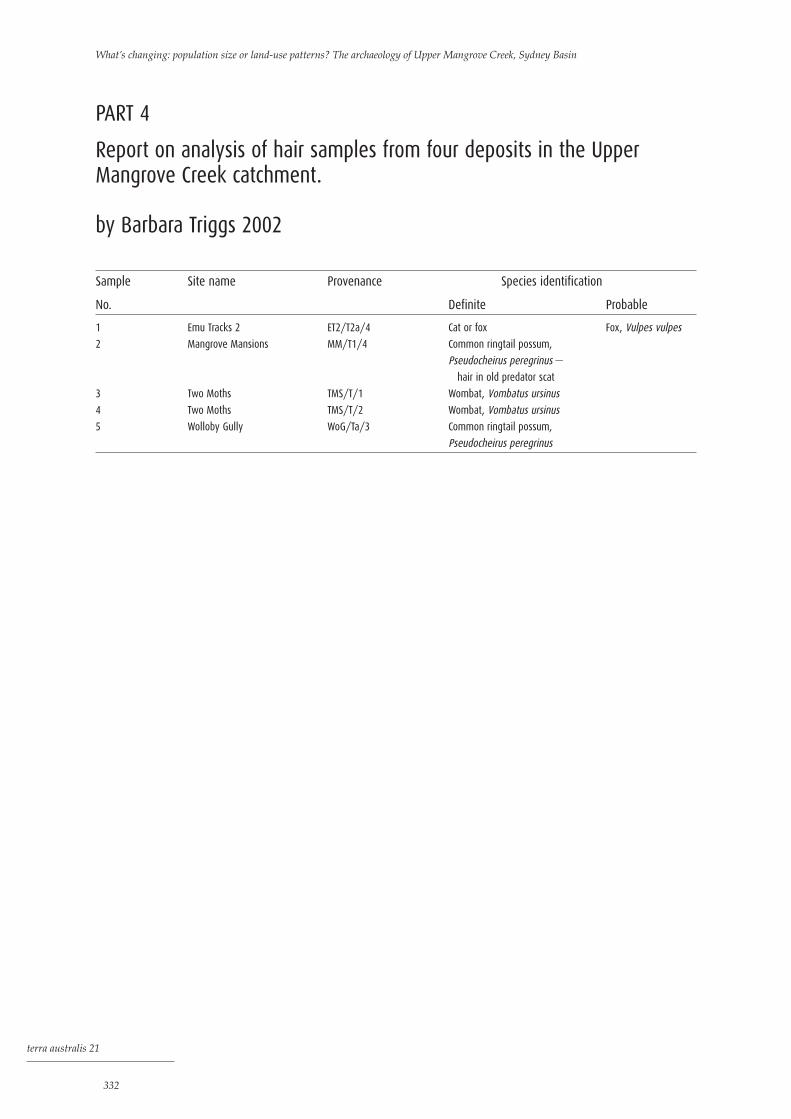
PART 4
Report on analysis of hair samples from four deposits in the UpperMangrove Creek catchment.
by Barbara Triggs 2002
Sample Site name Provenance Species identification
No. Definite Probable
1 Emu Tracks 2 ET2/T2a/4 Cat or fox Fox, Vulpes vulpes
2 Mangrove Mansions MM/T1/4 Common ringtail possum,
Pseudocheirus peregrinus —
hair in old predator scat
3 Two Moths TMS/T/1 Wombat, Vombatus ursinus
4 Two Moths TMS/T/2 Wombat, Vombatus ursinus
5 Wolloby Gully WoG/Ta/3 Common ringtail possum,
Pseudocheirus peregrinus
What’s changing: population size or land-use patterns? The archaeology of Upper Mangrove Creek, Sydney Basin
terra australis 21
332

terra australis 21
333
A: Habitation indices
NSW south coast and SydneyOver the past 35 years, several researchers have based comments about population increaseon numbers of sites in the NSW south coast-Sydney region.
Wade’s (1967: 39) conclusion that increased site numbers in the Bondaian phase were‘indicative of changes in settlement pattern probably due to an increase in population’, isbased on a data set that, except for one site, consists of rockshelter sites from the Sydney area.The exception is Sassafras 1 in the hinterland of the NSW south coast. Curracurrang 1CU5/-,first occupied about 7500 years ago, is the only site with both pre-Bondaian and Bondaianevidence; other sites with Bondaian assemblages are Connels Point, Lapstone Creek, SmithsCreek, Marra Marra Creek, Gymea Bay and the minor Curracurrang sites.
Megaw and Roberts’ (1974: 9) statement that Phase II (Bondaian) was ‘a key period formaximum population expansion’ was based on evidence from Royal National Park, whereonly one excavated site, Curracurrang 1CU5/-, has a Phase I (pre-Bondaian) assemblagecompared with the more numerous sites with Bondaian and post-Bondaian (Phase III)assemblages. Based on his results from Curracurrang 1CU5/-, Megaw (1974: 35, Table 1)placed the beginning of the Bondaian phase in Sydney (and thus the increase in population) atbetween 3000±120 (Gak-394b) and 2360±90 (Gak-688), with transition to the most recent post-Bondaian phase at ca 840 BP.
APPENDIX 4
Review of quantitative changes in otherregions of eastern Australia: case studies
A: habitation indices B: artefact accumulation rates in individual habitations

Tracey (1974: 27) assigned sites to one of three phases: Early Bondaian (nine sites),Intermediate (three sites), and ‘First occupied later’ (seven sites) (the third period refers to ‘thelatest or post-Bondaian phase’). Tracey had a larger sample (19) than Wade, which includedadditional Sydney and south coast sites but excluded Connels Point. Tracey considered ‘thenumbers too even’ to support Wade’s comments. However, if the ‘intermediate’ sites (whichall contain backed artefacts) are included with her earliest phase, her tabulated data suggestthat there was a greater number of habitations established in the Bondaian phase than in themost recent period (12 and seven respectively).
Using data sets such as that on which Tracey calculated habitation establishment ratesfor different phases is, however, problematic. Tracey assigned sites to particular culturalphases according to whether or not their assemblages had backed artefacts, but her data setincludes sites from areas where the timing of the transition from one phase to another differedfrom that of Curracurrang 1CU5/-. For example, at Lapstone Creek, backed artefacts werefound in levels dated to 3650±100 BP (ANU-010) (McCarthy 1978: 55), which is earlier than thedate Megaw assigned to the beginning of the Bondaian at Curracurrang 1CU5/-. AtCurrarong 1, backed artefacts were not found in levels dating later than ca 1600 BP, a muchearlier date for their disappearance than the date given as the beginning of the post-Bondaianat Curracurrang 1CU5/- (ca 840 BP — see above). It is therefore not appropriate to calculatethe habitation establishment rate for each cultural phase using samples such as Tracey’s asthere are no ‘common’ dates for the beginning and end of each cultural phase. Data sets needto consist of sites from geographic areas where it can be assumed that the timing for thetransition from one phase to another was the same.
Hughes and Lampert (1982: Tables 1 to 3, Figs 6 and 7) analysed a larger and revised setof sites to show changes in the ‘number of sites first occupied per 1000 years’. Their sample has20 coastal sites from Sydney and the NSW south coast (but no hinterland sites). The earliest datefor occupation at Burrill Lake, 20,830±810 BP (ANU-138) was extrapolated back to 25,000 BP(Hughes and Lampert 1982: Table 1). Hughes and Lampert (1982: 19) said that most excavatedsites in the Sydney and south coast region ‘apparently date from about the last 3000 years’. Theirdata (Hughes and Lampert 1982: Fig. 6) suggest habitation establishment rates fluctuated over thelast 8000 years and that there were three periods in which the rate increased markedly — theseventh, third and first millennia BP — though in the eighth millennium BP, the rate increasedsuch that habitations were established from thereafter in each millennium. Their data alsoindicate that the habitation establishment rate was highest in the last 1000 years. (In Hughes andLampert’s Fig. 6 and Table 3, data for the periods 8000 to 6000 BP, 6000 to 4000 BP and 4000 to2000 BP have been averaged, which masks the fact that no sites in their sample were initiallyinhabited in the fourth and sixth millennia BP.) In terms of the number of habitations used, theirdata (1982: Tables 1 to 3, Fig. 7) show that the largest number used was in the last 1000 years.
I analysed data for the NSW south coast and Sydney (Fig. 7.3, Table A4/1) using onlyradiometrically dated sites given the large number now available. My data set (Table A4/2)thus excludes some sites used by Hughes and Lampert, but includes several more recentlydated/excavated archaeological deposits as well as four south coast sites which theyexcluded. The 58 sites come from both coastal and hinterland zones in a region which extendsfrom the Hawkesbury River in the north to Disaster Bay (Bay Cliff) in the south (ca 460km),and includes hinterland sites as far west as Lapstone Creek and Sassafras (65km and 30kmfrom the coast respectively; that is, an area of ca 20,600 sq km). These 58 sites exclude shallowopen, partially buried and/or deflated archaeological deposits (artefact scatters) and shellmiddens where it is not clear whether the site was occupied prior or subsequent to theradiometric age obtained (see Boot 1996b: Appendix 1 and Attenbrow 2002: Table 3.1 for otherdated sites in the NSW south coast-Sydney region).
What’s changing: population size or land-use patterns? The archaeology of Upper Mangrove Creek, Sydney Basin
terra australis 21
334

terra australis 21
335
TTaabbllee AA44//11 NSW south coast and Sydney: rate of habitation establishment and number of habitations used in each
millennium. N = 58, see Table A4/2 for sites included. [1] Figure excludes Yowie Bay, abandoned ca 2000 BP (Poiner 1974:
29); [2] figure excludes John Curtin Reserve, which has no deposit younger than 1500 BP (Attenbrow 1994), and PK20
Buckenboura, abandoned ca 1600 BP (Boot 1996a: 74).
PERIOD/ NO. OF HABITATIONS RATE OF HABITATION NO. OF HABITATIONS
MILLENNIUM BP ESTABLISHED IN ESTABLISHMENT USED IN EACH
EACH MILLENNIUM (NO. PER MILLENNIUM) MILLENNIUM
25,000–24,000 1 ) 1
24,000–23,000 ) 1
23,000–22,000 ) 1
22,000–21,000 ) 0.2 1
21,000–20,000 ) 1
20,000–19,000 ) 1
19,000–18,000 1 ) 2
18,000–17,000 1 ) 3
17,000–16,000 ) 0.5 3
16,000–15,000 ) 3
15,000–14,000 1 ) 4
14,000–13,000 ) 4
13,000–12,000 ) 0.3 4
12,000–11,000 ) 4
11,000–10,000 2 ) 6
10,000– 9000 ) 0.7 6
9000– 8000 ) 6
8000– 7000 2 2 8
7000– 6000 2 2 10
6000– 5000 3 3 13
5000– 4000 2 2 15
4000– 3000 9 9 24
3000– 2000 9 9 33
2000– 1000 17 17 49 [1]
1000–contact 8 8 55 [2]
TTaabbllee AA44//22 NSW south coast and Sydney: sites included in Table A4/1 and Figure 7.3, with millennium in which
establishment is estimated to have occurred, radiometric age, geographic location and reference. [1] Ex. indicates that time of
establishment has been extrapolated from the radiocarbon age. [2] Conventional radiocarbon ages are quoted, though sites
are listed in millennium and in order as if corrected for marine reservoir effect. Sh indicates uncorrected shell date; correction
factor for the NSW south and central coast is minus 450±35 years (Gillespie 1982: 21–2; 1990: 15); all other ages are from
charcoal samples. [3] Coast includes ocean and estuarine locations.
MILLEN- SITE NAME EARLIEST RADIOMETRIC AGE [1] [2] SOUTH SYDNEY COAST[3] HINTER REFERENCE
NIUM BP YEARS BP LAB. NO. COAST -LAND
25th Burrill Lake Ex 20,830±810 ANU-138 x x Lampert 1971a: 9
19th Bulee Brook 2 18,810±160 ANU-9375 x x Boot 1996a: Table 1; 1996b: App. 1
18th Bass Point 17,010±650 ANU-536 x x Hughes and Djohadze 1980: 15
15th Shaws Creek K2 14,700±250 Beta-12423 x x Nanson et al. 1987: 76
11th Bob’s Cave 10,850±300 ANU-8313 x x Boot 1993b: 59; 1994: Table 2
11th Darling Mills SF2 10,150±130 Wk-2511 x x Attenbrow 1994: 4, Table 10
Appendix 4

What’s changing: population size or land-use patterns? The archaeology of Upper Mangrove Creek, Sydney Basin
terra australis 21
336
TTaabbllee AA44//22 (Continued)
MILLEN- SITE NAME EARLIEST RADIOMETRIC AGE [1] [2] SOUTH SYDNEY COAST[3] HINTER REFERENCE
NIUM BP YEARS BP LAB. NO. COAST -LAND
8th Curracurrang 1CU5/- 7450±180 GaK-482 x x Megaw 1974: 35
8th Jamisons Creek 7010±110 SUA-1233 x x Kohen et al. 1984: 57
7th Currarong 1 Ex 3790±100 NSW-70 x x Hughes and Djohadze 1980: 10
7th Currarong 2 ExSh 5990± 80 SUA-224 x x Hughes and Djohadze 1980: 6
6th John Curtin Reserve 5640± 80 Wk-2085 x x Attenbrow 1992a: Table 1
6th Cammeray Sh 5840± 50 Wk-3219 x x Attenbrow 1994: Table 9
6th Henry Lawson Drive 5240±100 SUA-60 x x White and Wieneke n.d. [ca 1975]
5th Bantry Bay 3 Sh 4520±100 SUA-593 x x Ross and Specht 1976: 1
5th Bourkes Road 2 4210± 50 ANU-9871 x x Boot 1996a: Table 1, 1996b: App. 1
4th Sugarloaf Sh 4170± 40 Wk-4196 x x Attenbrow 1995: Appendix 5
4th PK 20 Buckenboura 4000±580 ANU-8762 x x Boot 1996a: Table 1
4th Balmoral Beach BB2 3780±140 Beta-58864 x x Attenbrow 1993: Table 2
4th Sassafras 1 3770±150 ANU-743 x x Flood 1980: 226, 328
4th Great Mackerel 3670±150 ANU-6615 x x McDonald 1992b: 39
4th Lapstone Creek >3650±100 ANU-010 x x McCarthy 1978: 55
4th Merimbula H. MHE-8 3610± 80 ANU-5000 x x Webb and Cane 1986: Table 13
4th Burrill Shelter 2 3280± 70 ANU-8422 x x Boot 1994: Table 2
4th Merimbula H. MHE-10 Sh <3570± 90 ANU-5308 x x Webb and Cane 1986: Table 13
3rd Pambula Lake B Sh <3150±170 ANU-2254 x x Sullivan 1982a: Table 8-1,1984: 4
3rd Sassafras 2 >2780±115 ANU-744 x x Flood 1980: 233, 330
3rd Mill Creek 11 2690± 50 SUA-2259 x x Koettig 1990: 24
3rd Yowie Bay 2670± 85 ANU-175 x x Poiner 1974: 29
3rd Bate Bay Site BHW 2402± 88 NZA-2323 x x Brayshaw pers. comm.
3rd Bindea Street 2340±100 Beta-5787 x x Attenbrow and Conyers 1983: 23
3rd Cherrybrook 2200± 60 Beta-11896 x x McDonald 1985: Addendum
3rd Rock Pool 2140± 80 ANU-9376 x x Boot 1996a: Table 1, 1996b: App.1
3rd Bardens Creek 9 Ex 1630± 90 SUA-1746 x x Attenbrow and Negerevich 1981,1984: 143
2nd Bomaderry Creek 1930± 60 ANU-1021 x x Steele 1987: 68
2nd Wattamolla (WL/-) 1900±115 ANU-178 x x Megaw and Roberts 1974: 4
2nd Curracurrang 2CU5/- 1930± 80 Gak-898 x x Glover 1974: 17
2nd Angophora Reserve 1890±130 ANU-6585 x x McDonald 1992a: 46-47, Table 1
2nd Bull Cave 1820± 90 SUA-2106 x x Miller 1983: 25
2nd Gnatilia Creek 3 1740± 60 ANU-8426 x x Boot 1993b: 59; 1994: Table 2
2nd Abrahams Bosom 1630± 70 ANU-6446 x x Paton and Macfarlane 1989: 22
2nd Boat Harbour BH1 Sh 1950±100 ANU-895 x x Dickson n.d. [ca 1973]: 47
2nd Devlins Creek 1410± 50 Beta-76606 x x Haglund 1995: 13
2nd McCue Midden 1840± 40 Beta-165771 x x Dallas 2002: Table 2.2
2nd CC Landing Place (BB4/-) 1330±100 ANU-721 x x Megaw 1974: 36
2nd Mt Trefle Sh 1730± 50 Wk-2082 x x Attenbrow and Steele 1995: 51
2nd Castle Cove Sh 1650± 40 OZC-901 x x Attenbrow unpublished
2nd Gymea (GY/-) 1220± 55 NSW-6 x x Megaw and Wright 1966: 28
2nd Bowen Island 1180±260 ANU-2345 x x Blackwell 1982: 48
2nd Hydrofoil Sh 1630± 60 Wk-2510 x x Attenbrow 1994: 43
2nd Curracurrang 7CU5/- 1050±100 ANU-179 x x Tracey 1974: 25
1st North Head 15/67B Sh <1400± 70 ANU-3717 x x Hughes et al. 1984: Table 5
1st Reef Beach Sh 1150± 90 SUA-401 x x O’Donnell and Walker 1982: 3

TTaabbllee AA44//22 (Continued)
MILLEN- SITE NAME EARLIEST RADIOMETRIC AGE [1] [2] SOUTH SYDNEY COAST[3] HINTER REFERENCE
NIUM BP YEARS BP LAB. NO. COAST -LAND
1st Kangaroo Hill 4 550± 70 ANU-8438 x x Boot 1994: Table 2
1st Durras North 480± 80 Gak-873 x x Lampert 1966: 94
1st Greenglade 460±110 ANU-6934 x x Colley 1997: 7; Murray-Wallace andColley 1997
1st Cumberland Street Sh 890± 60 Beta-47633 x x Attenbrow 1992b: 20
1st Bay Cliff 330±110 ANU-6930 x x Colley 1997: 15
1st Shellharbour ca 140±100 Gak-337 x x Tindale 1964: 24
Trends based on this revised data set are similar to Hughes and Lampert’s. The eighthmillennium BP still appears as the period in which sites began to be established in eachmillennium (Fig. 7.3 and Table A4/1) and the highest number of habitations used was in thefirst millennium BP, though some sites have evidence of abandonment in either the second orfirst millennia BP. However, there are some differences in that: • the greatest increases in the habitation establishment rate occurred in the fourth (+7)
and second (+8) millennia BP and not the third and first millennia BP; • the highest habitation establishment rate (17) and the most dramatic increase in the
number of habitations used is in the second millennium BP rather than the third andfirst millennia BP; and,
• the habitation establishment rate decreased in the first millennium BP rather thancontinuing to increase. Hughes and Lampert (1982: 20) quoted ca 5000 BP as the point after which
substantial increases occurred in the number of sites showing evidence of occupation (i.e., inthe number of habitations used), but the habitation establishment rate for the fifth millenniumBP is low and, interestingly, remains low in the updated data set. It seems unlikely that thislow figure is due entirely to coastal erosion as posited by Head (1987: 455–8), as the sampleincludes rockshelters as well as sites in the coastal hinterland.
A breakdown of the data set into sites from the south coast and Sydney, and the coastand hinterland (coded differently in Fig. 7.13A), suggests that late-Holocene habitationestablishment rates may have varied in different geographic areas within the region.Alternatively, the patterns of site destruction, site recording and/or radiocarbon dating havevaried in different parts of the region.
Hughes and Lampert concluded that ‘over the last 5000 years the increase in thenumber of sites showing evidence of occupation was roughly two to three-fold’ (1982: 20); thatis, there was an increase in the number of habitations used from seven by 5000 BP to 20 by thetime of contact. However, the growth rate in the first half of their data set (for example, in the5000 years from 10,000 BP to 5000 BP when there was an increase in the number of habitationsused from three to seven) could also be described as a two- to threefold increase (×2.3 versus×2.9). The average annual growth rate for a twofold increase over 5000 years is +0.01% p.a.,and is +0.02% p.a. for a threefold increase over the same length of time.
Millennial growth rates for Hughes and Lampert’s data set for the number of habitationsused fluctuated, ranging from ×1 to ×1.75, with the highest in the seventh millennium BP. Inmy data set, millennial growth rates for the number of habitations used also fluctuated with arange from ×1 to ×1.6 (Table 7.5), though the highest growth rate was in the fourth millenniumBP. Millennial growth rates for habitation establishment rates, which are calculated for only thelast 7000 years, also fluctuated widely, ranging from ×0.5 to ×4.5 (Table 7.4), with the highestgrowth rate in the fourth millennium BP.
terra australis 21
337
Appendix 4

Average annual growth rates for the habitation establishment rates (Table 7.6) rangefrom +0.04% to +0.15% for increases, and from -0.04% to -0.8% for decreases. For the numbersof habitations used in each millennium (Table 7.7), there are no decreases and the increasesrange between +0.01% and +0.05% (excluding increases from one to two sites).
South-western VictoriaEvidence for habitation establishment rates in south-western Victoria comes from Lourandos(1983a, 1985a) and Williams (1985, 1987, 1988). Basal habitation dates for all sites in these datasets were estimated by Lourandos or Williams, but no abandonment dates were given.
Lourandos (1985a: 393) said the archaeological sequence from south-western Victoria,which covers 12,500 years, ‘indicates that the most intensive period of site establishment and useoccurred increasingly during the last 4000 years or so’. Lourandos’ evidence consisted of 19dated sites (five excavated rockshelters, five coastal shell middens, five earth mounds, threeopen inland sites and Toolondo drainage system) (Lourandos 1983a: 86; Table 2). The earliestsite (Lake Bolac) was established in the terminal Pleistocene (ca 12,500 BP), but Lourandos(1983a: 86) said most sites date to the last 4000 or 3000 years. Lourandos continued: ‘During thisfinal period sites appear to have been increasingly established, with the last 2000 yearsexperiencing the most intensive phase.’ As support for his argument, Lourandos added that alarge number of surface sites have artefacts of the Small Tool Tradition, which generally date tothe last 4000 years or so, but sites with earlier assemblages are quite rare. However, the graphpresented by Lourandos to show that ‘sites appear to have been increasingly established’ (hisFig. 3 — a modified version is reproduced as my Fig. 7.4A), also indicates that fewer habitationswere established in the final 1000 years than in the previous period.
Williams (1985, 1987, 1988) used a similar set of dated excavated sites to show the recentintroduction of mound sites. William’s (1985, 1988) Fig. 10.1 (1987: Fig. 4; a modified version isreproduced as my Fig. 7.4B) excluded some sites listed by Lourandos, but included other morerecently excavated sites. Williams’ sample of 25 sites is from the same geographic region asLourandos’ sample, but excludes Toolondo drainage system and several mound sites where she(1985: 311; 1988: 216) was not certain whether basal dates are dating the period of moundconstruction or an underlying occupation surface. Trends apparent in Williams’ analysis aresimilar to those of Lourandos’. In Lourandos’ (1983a) Figure 3, the habitation establishment rateincreased to the stage where habitations were established in each millennium by the fourthmillennium BP. In Williams’ data set (1985, 1988: Fig. 10.1), this stage is reached in the sixthmillennium BP — a difference probably attributable to the larger sample size in her study. In bothstudies, the most dramatic increase in the habitation establishment rate occurs in the secondmillennium BP and there is a marked decrease in the rate in the last 1000 years.
Williams (1985: 323–4) saw little if any change in the types or numbers of habitationsused until after ca 2500 BP, especially after ca 2000 BP, when mounds were introduced andwhen there was an exponential increase in site numbers generally. She (see also 1988: 216–20)indicated that an increase in the habitation numbers is seen even when mounds are excluded;that is, there is an increase in previously existing habitation types such as shell middens andarchaeological deposits in rockshelters. When Toolondo drainage system (210±120 BP, GX-4785) and Werribee burial site (7290±140, SUA-1085) are excluded, as they are not habitations(see Tables A4/3 and A4/4), the peak in the eighth millennium BP and the increase in thesecond half of the first millennium BP do not occur.
Millennial growth rates for the habitation establishment rates are calculated for the last 5000years only (Table 7.4). The growth rate in the second millennium BP (×5.5) was much greaterthan at any other time in the preceding millennia (×2 to ×1) or in the first millennium BP (×0.5).Average annual growth rates (Table 7.6) are +0.07% and +0.17% for the third and second
What’s changing: population size or land-use patterns? The archaeology of Upper Mangrove Creek, Sydney Basin
terra australis 21
338
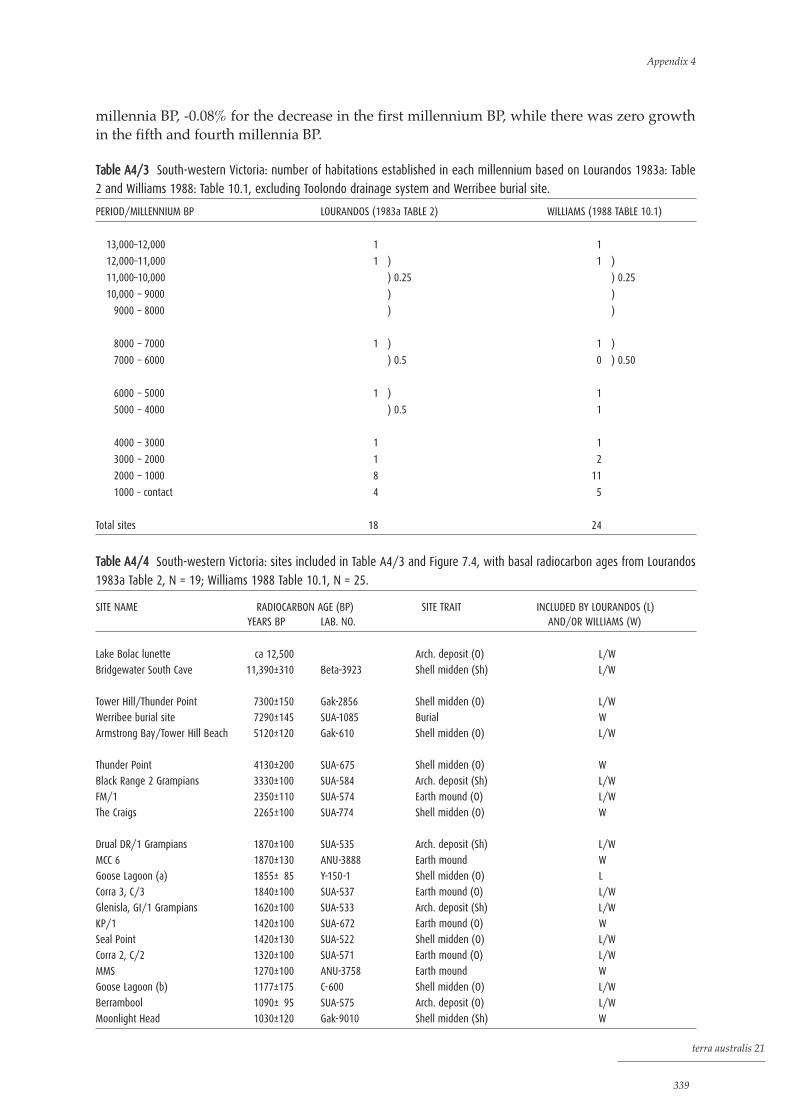
terra australis 21
339
millennia BP, -0.08% for the decrease in the first millennium BP, while there was zero growthin the fifth and fourth millennia BP.
TTaabbllee AA44//33 South-western Victoria: number of habitations established in each millennium based on Lourandos 1983a: Table
2 and Williams 1988: Table 10.1, excluding Toolondo drainage system and Werribee burial site.
PERIOD/MILLENNIUM BP LOURANDOS (1983a TABLE 2) WILLIAMS (1988 TABLE 10.1)
13,000–12,000 1 1
12,000–11,000 1 ) 1 )
11,000–10,000 ) 0.25 ) 0.25
10,000 – 9000 ) )
9000 – 8000 ) )
8000 – 7000 1 ) 1 )
7000 – 6000 ) 0.5 0 ) 0.50
6000 – 5000 1 ) 1
5000 – 4000 ) 0.5 1
4000 – 3000 1 1
3000 – 2000 1 2
2000 – 1000 8 11
1000 – contact 4 5
Total sites 18 24
TTaabbllee AA44//44 South-western Victoria: sites included in Table A4/3 and Figure 7.4, with basal radiocarbon ages from Lourandos
1983a Table 2, N = 19; Williams 1988 Table 10.1, N = 25.
SITE NAME RADIOCARBON AGE (BP) SITE TRAIT INCLUDED BY LOURANDOS (L)YEARS BP LAB. NO. AND/OR WILLIAMS (W)
Lake Bolac lunette ca 12,500 Arch. deposit (O) L/W
Bridgewater South Cave 11,390±310 Beta-3923 Shell midden (Sh) L/W
Tower Hill/Thunder Point 7300±150 Gak-2856 Shell midden (O) L/W
Werribee burial site 7290±145 SUA-1085 Burial W
Armstrong Bay/Tower Hill Beach 5120±120 Gak-610 Shell midden (O) L/W
Thunder Point 4130±200 SUA-675 Shell midden (O) W
Black Range 2 Grampians 3330±100 SUA-584 Arch. deposit (Sh) L/W
FM/1 2350±110 SUA-574 Earth mound (O) L/W
The Craigs 2265±100 SUA-774 Shell midden (O) W
Drual DR/1 Grampians 1870±100 SUA-535 Arch. deposit (Sh) L/W
MCC 6 1870±130 ANU-3888 Earth mound W
Goose Lagoon (a) 1855±185 Y-150-1 Shell midden (O) L
Corra 3, C/3 1840±100 SUA-537 Earth mound (O) L/W
Glenisla, GI/1 Grampians 1620±100 SUA-533 Arch. deposit (Sh) L/W
KP/1 1420±100 SUA-672 Earth mound (O) W
Seal Point 1420±130 SUA-522 Shell midden (O) L/W
Corra 2, C/2 1320±100 SUA-571 Earth mound (O) L/W
MMS 1270±100 ANU-3758 Earth mound W
Goose Lagoon (b) 1177±175 C-600 Shell midden (O) L/W
Berrambool 1090±195 SUA-575 Arch. deposit (O) L/W
Moonlight Head 1030±120 Gak-9010 Shell midden (Sh) W
Appendix 4

TTaabbllee AA44//44 (Continued)
SITE NAME RADIOCARBON AGE (BP) SITE TRAIT INCLUDED BY LOURANDOS (L)YEARS BP LAB. NO. AND/OR WILLIAMS (W)
CH/1 995±100 SUA-778 Earth mound (O) W
MK/1 820±195 SUA-583 Earth mound (O) L
MCC 5 790±190 ANU-3762 Earth mound (O) W
Chatsworth 640±195 SUA-572 Earth mound (O) L
Gorrie Swamp Hut 380±150 ANU-3588 Arch. deposit (O) W
Glen Aire Shelter 370±145 NZ-367 Shell midden (Sh) L/W
M 33 300±160 ANU-4322 Earth mound (O) W
Toolondo 210±120 GX-4785 Drainage system L
Lake Bolac 105±1.8% SUA-414 Arch. deposit (O) L
Williams (1985: 324) commented that although differential preservation of sites couldbe responsible for the lack of some early sites, the increase in site numbers is so marked andabrupt that it appears the phenomenon is real. In addition, since distribution ‘tails off’ in therecent period, she contended that preservation factors alone are not responsible for the shapeof the histogram. Williams acknowledged the lesser number of sites in the last 1000 years, butdid not advance an explanation.
Bird and Frankel (1991a: Appendix) provided a more extensive list of radiometric agesfor sites in western Victoria and south-eastern South Australia. These data confirm Williams’identification of the initial establishment of middens after 2500 years BP, indicate an increasein middens in the last 2000 years, and a more common use of rockshelters from ca 4000 yearsBP (Bird and Frankel 1991a: 9). However, of greater consequence for models proposed byLourandos and Williams, as well as by Ross (1981), are the more recently obtained radiocarbonages for previously dated rockshelters in the Grampians–Gariwerd region (Bird et al. 1998).Basal dates of 22,140±160 (Beta-88523) and 22,160±150 (Beta-98020) for Drual now extendoccupation in the Grampians back to the time of the Last Glacial Maximum (Bird et al. 1998:35, Table 1). Results for another shelter (Billimina/Glenisla 1) indicate use of the shelter beganbefore the end of the Pleistocene rather than in the late-Holocene.
Central Queensland highlandsMorwood’s 1984 synthesis of data for the central Queensland highlands included the resultsof archaeological investigations by Mulvaney and Joyce (1965), Beaton (1982) and his ownfieldwork (Morwood 1979, 1981). These investigations provided a sample of 11 rocksheltersites for an area of some 21,000 sq km (Morwood 1984: 325). Basal habitation dates range fromca 22,000 BP at Kenniff Cave to ca 1280 BP at Goat Rock 2 (Morwood 1984: Table 6.2; my TableA4/5).
Beaton (1977: 185; 192 in Rowland 1983: 66) claimed there was a marked intensificationof Aboriginal use of the south central Queensland uplands about 5000 BP to 4000 BP. Thedeposits he excavated are all younger than ca 4300 BP and are characterised by assemblages ofthe ‘Small Tool Tradition’. To Beaton, this indicated that the increase was not gradual butoccurred abruptly at the temporal boundary of the two major tool traditions.
Morwood (1984: 356–60) referred to the central Queensland highlands sequence ofartefact assemblages as the ‘Core Tool and Scraper Industry’, the ‘Small Tool Industry’ and the‘Recent Industry’. He (1984: 358) divided the ‘Small Tool Industry’ into an early and late phase— the early phase, characterised by the restricted presence of pirri points, lasted from ca 4300
What’s changing: population size or land-use patterns? The archaeology of Upper Mangrove Creek, Sydney Basin
terra australis 21
340

BP to ca 3560 BP. Morwood (1984: 358) argued that increased rates of sediment, artefact andpigment deposition indicated shelter use could have become more intensive about 3560 BP,and that the increased number of sites with late-phase assemblages (i.e., from five to ninesites) suggested Aboriginal use of the central highlands became more extensive after ca 3560BP; that is, during the ‘Small Tool Industry’ late phase.
Habitation establishment rates. Presenting the data as habitation establishment ratesfor each industry and phase (Table A4/5A, based on Morwood 1984: Table 6.2 and Fig. 6.8)indicates the rate was highest at the time of the ‘Small Tool Industry’, but also suggests therate for both the early and late phases was similar (2.7 and 2.6). Since a relatively long time —ca 4000 years — elapsed before re-use of The Tombs (see below), it is included as a ‘new’establishment in my analysis.
TTaabbllee AA44//55 Central Queensland highlands: rate of habitation establishment and number of habitations used in each
millennium. N = 11, see Table A4/6 for sites included. –1/+1 indicates The Tombs abandoned then re-inhabited.
A. PHASED SEQUENCE
PHASE/INDUSTRY DATES BP DURATION NO. OF RATE OF HABITATION NO. OF HABITATIONS
(YEARS) HABITATIONS ESTABLISHMENT USED IN EACH
ESTABLISHED (NO./MILLENNIUM) PHASE
Core Tool and Scraper 22,000/18,000 to 4300 17,700 or 13,700 4 0.3 – 0.2 4
Early Small Tool 4300 to 3560 740 1+1 2.7 (1.4) 5
Late Small Tool 3560 to 2000 1560 4 2.6 9
Recent 2000 to contact 1900 2 1.0 11
B. MILLENNIAL SEQUENCE
PERIOD/ NO. OF HABITATIONS RATE OF HABITATION NO. OF HABITATIONS
MILLENNIUM ESTABLISHED IN ESTABLISHMENT USED IN EACH
EACH MILLENNIUM (NO./MILLENNIUM) MILLENNIUM
22,000–21,000 1 1 1
21,000–20,000 1
20,000–19,000 1
19,000–18,000 1
18,000–17,000 1
17,000–16,000 1
16,000–15,000 1
15,000–14,000 1
14,000–13,000 1
13,000–12,000 1 1 2
12,000–11,000 2
11,000–10,000 1 1 3
10,000– 9000 1 1 4
9000– 8000 –1 3
8000– 7000 3
7000– 6000 3
6000– 5000 3
5000– 4000 1+1 2 5
4000– 3000 2 2 7
3000– 2000 2 2 9
2000– 1000 2 2 11
1000–contact 11
terra australis 21
341
Appendix 4

TTaabbllee AA44//66 Central Queensland highlands: sites included in Table A4/5 and Figure 7.5, with radiocarbon ages from Morwood
1984: Table 6.2.
SITE NAME RADIOCARBON AGE COMMENTS
YEARS BP LAB. NO.
Kenniff Cave 18,800±480 ANU-345 Extrapolated on d/a curve to 22,000 BP (Morwood 1984: 339)
Native Wells I 10,910±140 ANU-2034 Extrapolated on d/a curve to 13,000 BP (Morwood 1981: 27)
Native Wells II 10,770±135 ANU-2035
The Tombs 9410±100 NPL-64 Gap of ca 5300 years between 9410 and 4100 BP
Wanderers Cave 4320±180 ANU-1522
The Tombs re-inhabited 4100
Cathedral Cave 3560±180 ANU-1762
Rainbow Cave 1 3600±100 ANU-1521
Rainbow Cave 2 2750±180 ANU-2119
Turtle Rock 2800±300 ANU-2202
Ken's Cave 2000±180 ANU-2090 To 530±80 (ANU-2118) then abandoned for past 500 years
Goat Rock 2 1280±170 ANU-2004
The habitation establishment rates, when calculated in millennial increments, suggestthat although the highest rates occurred after ca 5000 BP, in each of the millennia between ca5000 BP and ca 1000 BP the rate remained the same (two habitations/millennium) (Fig. 7.5Aand Table A4/5B). However, the number of sites in this study is extremely small (11, see TableA4/6) and the addition of even one newly dated site between ca 5000 and ca 1000 BP couldalter the trends presented here. In the last 1000 years no sites were established.
The millennial and average annual growth rates for the late-Holocene habitationestablishment rates (Tables 7.4 and 7.6) suggest there was zero growth in the fourth, third andsecond millennia BP and a decrease in the first millennium BP.
Number of habitations used. All the archaeological deposits were in rockshelters and,apart from Ken’s Cave and The Tombs, they appear to have been regularly inhabited at somestage in each millennium from the time of establishment to contact. Habitation ceased atca 530 BP at Ken’s Cave, and at The Tombs there was an apparent abandonment of the shelterbetween ca 9400 BP and ca 4100 BP.
The number of habitations used in each millennium fluctuated over time — there was aninitial slow increase, then a decrease during the ninth millennium BP, when The Tombs wasabandoned (Fig. 7.5B and Table A4/5B). The number did not increase again until the fifthmillennium BP with one ‘new’ site and re-establishment of The Tombs. Between ca 5000 BP andca 1000 BP, the increases were greatest, but they remained at the same level in the last 1000 yearsas in the second millennium BP. Abandonment of Ken’s Cave in the first millennium BP is notreflected in the tables and graphs as it remained in use for the first part of the millennium.
The highest millennial growth rate and average annual growth rate occurred in the fifthmillennium BP (x1.7 and +0.5% respectively). However, the millennial growth rates in the 11th and10th millennia BP are similar to and/or higher than those in the fourth, third and secondmillennia BP (Table 7.5). Average annual growth rates for the number of habitations used, except for −0.03% in the ninth millennium BP, are increases ranging from +0.02% to +0.07% (Table 7.7).
South-eastern QueenslandMorwood (1987: 343, Fig. 4) used a sample of 25 sites excavated by several researchers toindicate that there was a mid-Holocene increase in site numbers, especially after ca 4000 BP, insouth-eastern Queensland (an area of about 158,125 sq km). He pointed out that from 4500 BP,the growth of site numbers over time appeared to be logarithmic rather than linear. Theearliest date of 20,560±250 BP (SUA-2341) is for Wallen Wallen Creek, a deeply stratified open
What’s changing: population size or land-use patterns? The archaeology of Upper Mangrove Creek, Sydney Basin
terra australis 21
342
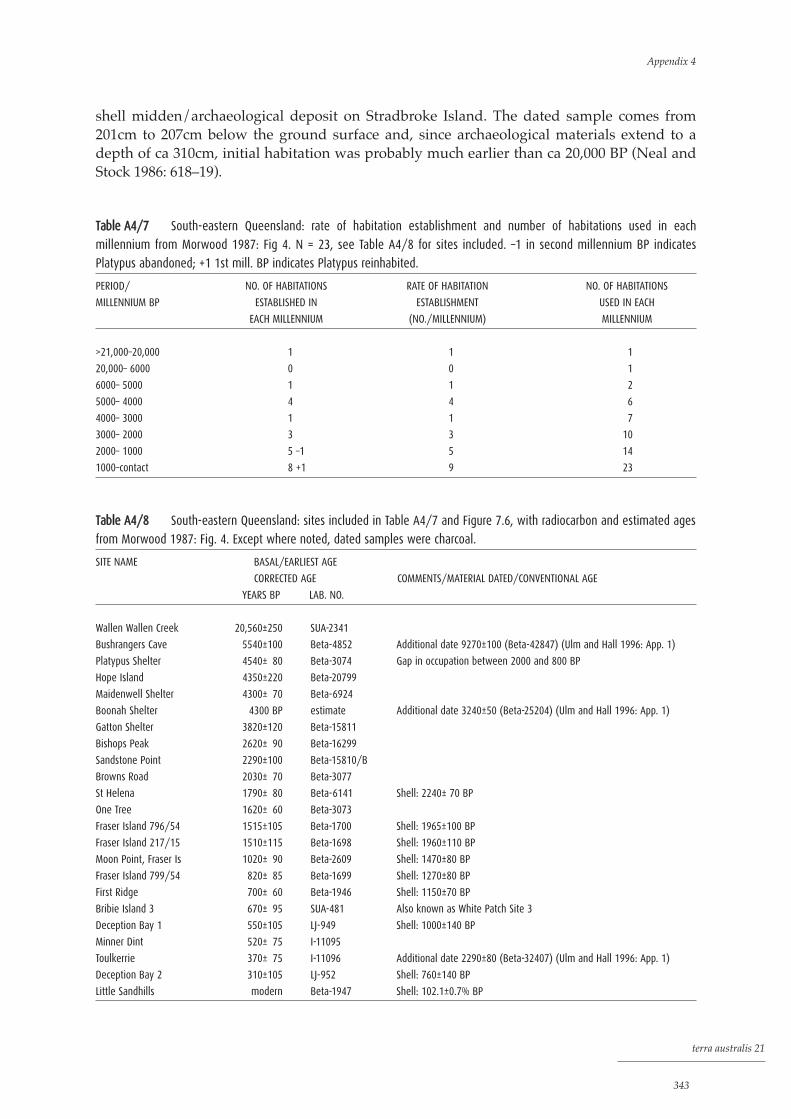
shell midden/archaeological deposit on Stradbroke Island. The dated sample comes from201cm to 207cm below the ground surface and, since archaeological materials extend to adepth of ca 310cm, initial habitation was probably much earlier than ca 20,000 BP (Neal andStock 1986: 618–19).
TTaabbllee AA44//77 South-eastern Queensland: rate of habitation establishment and number of habitations used in each
millennium from Morwood 1987: Fig 4. N = 23, see Table A4/8 for sites included. –1 in second millennium BP indicates
Platypus abandoned; +1 1st mill. BP indicates Platypus reinhabited.
PERIOD/ NO. OF HABITATIONS RATE OF HABITATION NO. OF HABITATIONS
MILLENNIUM BP ESTABLISHED IN ESTABLISHMENT USED IN EACH
EACH MILLENNIUM (NO./MILLENNIUM) MILLENNIUM
>21,000–20,000 1 1 1
20,000– 6000 0 0 1
6000– 5000 1 1 2
5000– 4000 4 4 6
4000– 3000 1 1 7
3000– 2000 3 3 10
2000– 1000 5 –1 5 14
1000–contact 8 +1 9 23
TTaabbllee AA44//88 South-eastern Queensland: sites included in Table A4/7 and Figure 7.6, with radiocarbon and estimated ages
from Morwood 1987: Fig. 4. Except where noted, dated samples were charcoal.
SITE NAME BASAL/EARLIEST AGE
CORRECTED AGE COMMENTS/MATERIAL DATED/CONVENTIONAL AGE
YEARS BP LAB. NO.
Wallen Wallen Creek 20,560±250 SUA-2341
Bushrangers Cave 5540±100 Beta-4852 Additional date 9270±100 (Beta-42847) (Ulm and Hall 1996: App. 1)
Platypus Shelter 4540±180 Beta-3074 Gap in occupation between 2000 and 800 BP
Hope Island 4350±220 Beta-20799
Maidenwell Shelter 4300±170 Beta-6924
Boonah Shelter 4300 BP estimate Additional date 3240±50 (Beta-25204) (Ulm and Hall 1996: App. 1)
Gatton Shelter 3820±120 Beta-15811
Bishops Peak 2620±190 Beta-16299
Sandstone Point 2290±100 Beta-15810/B
Browns Road 2030±170 Beta-3077
St Helena 1790±180 Beta-6141 Shell: 2240± 70 BP
One Tree 1620±160 Beta-3073
Fraser Island 796/54 1515±105 Beta-1700 Shell: 1965±100 BP
Fraser Island 217/15 1510±115 Beta-1698 Shell: 1960±110 BP
Moon Point, Fraser Is 1020±190 Beta-2609 Shell: 1470±80 BP
Fraser Island 799/54 820±185 Beta-1699 Shell: 1270±80 BP
First Ridge 700±160 Beta-1946 Shell: 1150±70 BP
Bribie Island 3 670±195 SUA-481 Also known as White Patch Site 3
Deception Bay 1 550±105 LJ-949 Shell: 1000±140 BP
Minner Dint 520±175 I-11095
Toulkerrie 370±175 I-11096 Additional date 2290±80 (Beta-32407) (Ulm and Hall 1996: App. 1)
Deception Bay 2 310±105 LJ-952 Shell: 760±140 BP
Little Sandhills modern Beta-1947 Shell: 102.1±0.7% BP
terra australis 21
343
Appendix 4

Morwood included the Talgai skull (12th millennium BP) and Broadbeach burial site(first and second millennia BP) in his sample but, as they are not habitations, they areexcluded from my Figure 7.6 and Tables A4/8 and A4/7.
Habitation establishment rates. The largest increases in the habitation establishmentrates occurred in the fifth and first millennia BP (+3 and +4 above the rate of the previousmillennium respectively) (Fig. 7.6A and Table A4/7). A decrease occurs in the fourthmillennium BP, when only one habitation was established. Although the highest habitationestablishment rate (nine) is in the first millennium BP, the millennial growth rate for that periodis not as high as in the fifth millennium BP, which has the highest millennial growth rate (x4)(Table 7.4). The average annual growth rates range between +0.05% and +0.14% for the increases,with -0.14% for the decrease in the fourth millennium BP (Table 7.6).
Number of habitations used. The largest number of habitations used was in the firstmillennium BP (23). Increases in the number of habitations used were relatively high in thefifth and second millennia BP, but were highest in the first millennium BP (Fig. 7.6B and TableA4.7). The highest millennial growth rate in the number of habitations used occurred in the fifthmillennium BP (x3) (Table 7.5). In the last 4000 years, the growth rates were lower than thoseof the sixth and fifth millennia BP, fluctuating between x1.2 and x1.6. Average annual growthrates are all increases ranging between +0.02% and +0.11%, with the highest in the fifthmillennium BP (Table 7.7).
Morwood’s data set indicates an increase in both habitation indices in the firstmillennium BP, and the millennial and average annual growth rates for both of the indicesindicate a slight increase in the first millennium BP, but not back to the much higher level of thefifth millennium BP. Most of the sites in his data set are open coastal shell middens (only six ofthe 23 are rockshelters). It is, in fact, a curious data set in that all sites <2000 BP are open coastalshell middens and all of the rockshelter sites are >2500 BP. If only rockshelter sites were used forthe analysis, it would suggest no sites were established in the first or second millennium BP andno sites were occupied along the coastal strip — an obviously spurious suggestion.
Recently, Ulm and Hall (1996: Fig. 4, Appendix 1) produced an updated list ofradiocarbon dates for this region which contained 57 sites (including burials, as well asrockshelters with deposit and open shell middens). As well as numerous additional sites,further dates have been obtained for Boonah, Bushrangers Cave and Toulkerrie, whichincrease the length of habitation at these sites. These revisions still show similar long-termtrends over time to those illustrated in Figure 7.6, with increasing numbers of habitationsbeing established and used in the last 2000 years. They concluded that ‘the number of coastalsites increases gradually but consistently from about 6000 BP to ca 1200 BP after which adramatic acceleration in site creation is apparent’ (Ulm and Hall 1996: 52).
NSW–ACT–Victoria: southern uplands-tablelandsFlood’s (1973, 1976, 1980) original search for Pleistocene occupation of the southern uplands-tablelands encompassed a wide geographic area, including the NSW coastal ranges (the sitesof Sassafras 1 and 2) as well as the foothills in north-eastern Victoria (Cloggs Cave, Buchan).Flood recorded numerous sites, most of which are open archaeological deposits.
In the archaeological deposits which Flood excavated and/or dated for this study,evidence for Pleistocene and early Holocene habitation was absent (i.e., no sites were older than4000 years) (Flood 1976: 32–3, 1980: 254) until the search was extended to the foothills nearBuchan, Victoria, where habitation evidence at Cloggs Cave extends back to 17,720±840 BP(ANU-1044) (Flood 1980: 259, Table 24). In addition, in the 50 open archaeological depositsrecorded, Flood (1976: 32) saw no artefacts which could be assigned to Pleistocene or earlyHolocene assemblages. It appeared as if the NSW–ACT–Victorian southern uplands-tablelandshad not been occupied in the Pleistocene and early Holocene.
What’s changing: population size or land-use patterns? The archaeology of Upper Mangrove Creek, Sydney Basin
terra australis 21
344

Subsequently, several dates between 21,000±220 BP (Beta-16886) and 10,160±160 (Beta-16653) came from artefact-bearing levels in a small rockshelter at Birrigai near Tidbinbilla,ACT, on the northern fringes of the south-eastern highlands (Flood et al. 1987: 9–16). At 730mabove sea-level, the site is lower in elevation than other sites excavated by Flood, except forSassafras 1 and 2 (also at 730m a.s.l.) and Cloggs Cave (<500m a.s.l.). Other recent research andconsulting projects provide further dates for habitations in the southern uplands/tablelands(Tables A4/9 and A4/10). All new dates, except that for Nursery Swamp 2, are for openarchaeological deposits. All radiocarbon dates fall within the last 4500 years, though one site(Butmaroo) has deep stratified deposits where initial habitation may be much older (RhysJones, pers. comm. 1996). Thus, although the presently available evidence shows that theNSW–ACT–Victorian southern uplands-tablelands (or at least their lower elevations) wereoccupied during the Pleistocene, most dates for initial occupation of habitations are within thelatter half of the Holocene.
TTaabbllee AA44//99 NSW–ACT–Victorian southern uplands-tablelands: rate of habitation establishment and number of habitations used
in each millennium. Rockshelter deposits N = 14, open deposits N = 11; see Table A4/10 for sites included. Sh indicates
rockshelter; UndSh = undated rockshelter; OAD = open archaeological deposit.
PERIOD/ NO. OF HABITATIONS ESTABLISHED RATE OF HABITATION NO. OF HABITATIONS USED
MILLENNIUM BP IN EACH MILLENNIUM ESTABLISHMENT (NO./MILLENNIUM) IN EACH MILLENNIUM
Sh UndSh OAD Sh Sh+OAD Sh Sh+OAD
21,000–20,000 1 1 1 1
20,000–18,000 1 1
18,000–17,000 1 1 2 2
17,000–10,000 2 2
10,000– 4000 1 1 2 3
5000– 4000 1 1 2 4
4000– 3000 2 1 2 3 4 7
3000– 2000 1 1 1 2 5 9
2000– 1000 2 1 2 3 7 12
1000–contact 2 5 6 7 13 14 25
TTaabbllee AA44//1100 NSW–ACT–Victorian southern uplands-tablelands: sites included in Table A4/9 and Figure 7.7, with radiocarbon
and estimated ages for rockshelters and time of known-use for open archaeological deposits, and references.
SITE NAME RADIOCARBON OR ESTIMATED AGE COMMENTS BY RESEARCHER REFERENCE
YEARS BP LAB. NO.
Rockshelter sites (date of establishment)
Birrigai 21,000±220 Beta-16886 Flood et al. 1987: 16, 22
Cloggs Cave 17,720±840 ANU-1044 Flood 1980: 259, Table 24
Sassafras I 3770±150 ANU-743 Flood 1980: 226, 328
Nursery Swamp 2 3700±110 ANU-3033 Rosenfeld et al. 1983: 54
Sassafras II >2780±115 ANU-744 Flood 1980: 232-3, 330
Caddigat 1600± 60 ANU-1049 Flood 1980: 239
Yankee Hat 2 > 770±140 ANU-1051 Base of horizon above backed
artefacts (assigned 2nd mill. BP) Flood 1980: 239
Yankee Hat 1 <1000 Mainly Late Small Tool phase Flood 1980: 239, 333
terra australis 21
345
Appendix 4

TTaabbllee AA44//1100 (Continued)
SITE NAME RADIOCARBON OR ESTIMATED AGE COMMENTS BY RESEARCHER REFERENCE
YEARS BP LAB. NO.
Bogong 1 <1000± 60 Flood 1980: 342
Bogong 2 1000± 60 ANU-1050 Flood 1980: 246, 343S
Hanging Rock 1 370± 60 ANU-1047 Basal Flood 1980: 239
Hanging Rock 2 <1000± 60 Recent use Flood 1980: 341
Rendezvous <1000± 60 Recent quartz industry Flood 1980: 239, 334
Front Paddock <1000± 60 Last phase Flood 1980: 335
Dated open archaeological deposits (date of known-use)
Butmaroo >4000 possibly back to 10,000 BP Rhys Jones pers. comm. 1996
Little Thredbo 2 4390±180 ANU-6867 Kamminga et al. 1989
SS2.4, nr Gundaroo 3300±100 ANU-3704 Packard 1984: 57–8, Fig.12
Little Thredbo 3 2460±120 ANU-6868 Kamminga et al. 1989
HCA.14, nr Berrima 1780±160 SUA-2351 Koettig 1985a: 120
Nardoo >760±110 ANU-1060 Above backed artefacts (assigned Flood 1980: 347
2nd mill. BP)
Little Thredbo 1 940±150 ANU-6866 Kamminga et al. 1989
G17, Goulburn 330±100 SUA-2141 Koettig pers.comm.
ELG.1, nr L. George <1000± 60 Baker, Feary and Hughes 1984
GIL.1, nr L. Bathurst <1000± 60 Hughes, Barz and Hiscock 1984
GIL.2, nr L. Bathurst <1000± 60 Hughes, Barz and Hiscock 1984
There are only nine dated rockshelter habitations in this region and, to produce ananalysable data set, I included several archaeological deposits which were not radiocarbon-dated but were assigned to specific millennia on the basis of their assemblages (Fig. 7.7, TablesA4/9 and A4/10). In the southern uplands-tablelands, Flood (1980: 341) records Bondaianartefacts (e.g., Bondi points) continuing into the first half of the first millennium BP. I thusassigned sites with assemblages referred to by Flood (1980) as ‘Late Small Tool Phase’ (pp. 221,239, 250–1), ‘recent quartz industry’ (p. 239) or ‘later quartz period‘ (p. 333) to the firstmillennium BP. Dated open archaeological deposits included in the analysis are listedseparately in Table A4/9 and are coded differently in Figure 7.7.
Using only the dated rockshelters, the data suggest habitation establishment rates and thenumber of habitations used were very low until ca 4000 BP and relatively stable thereafter. If theundated rockshelters are included, the decreased habitation establishment rate in the thirdmillennium BP remains, and a substantial increase and the most dramatic increase occurred inboth habitation indices in the first millennium BP. If the open archaeological deposits areincluded, the trends remain essentially the same as that for all rockshelters.
The highest millennial growth rate for the habitation establishment rates, calculated foronly the last 4000 years for all rockshelter deposits (both dated and undated), was in the firstmillennium BP (×3.5) (Table 7.4). For the number of habitations used, the highest millennialgrowth rate (×2) occurred in the fourth and first millennium BP (Table 7.5).
The average annual growth rate for the decrease in the habitation establishment rate inthe third millennium BP was -0.07%; increases in the second and first millennia BP were+0.07% and +0.13% respectively (Table 7.6). For the number of habitations used in eachmillennium, the average annual growth rates were all increases ranging between +0.02% and+0.07%, the highest values being in the fourth millennium BP (Table 7.7).
What’s changing: population size or land-use patterns? The archaeology of Upper Mangrove Creek, Sydney Basin
terra australis 21
346

The Mallee, north-western VictoriaThe area of the Victorian Mallee studied by Ross is 30,000 sq km (1981: 146). The followingdiscussion is based principally on data from Ross 1984, which provides greater detail than the1981 article. The 141 open archaeological deposits in Ross’ analyses are mostly stone artefactscatters but include some shell scatters. They occur on dune blow-outs, on lake-side sedimentsor on aeolian ridges around salinas where grass cover is thin (Ross 1984: 103). Some of theartefact or shell scatters recorded as individual sites may represent multiple exposures of asingle partially buried site (Ross 1984: 106). However, the information presented does notindicate which scatters are likely to be part of the same site in order to work out ‘minimumnumbers’, so site numbers quoted by Ross are used.
Nine archaeological deposits were dated by absolute methods (radiocarbon dating offreshwater mussel and charcoal, and thermoluminescent dating of burnt hearth materials) (TableA4/11). The earliest date for an archaeological deposit is 7650±110 BP (SUA-766) (Ross 1984: 178).Ross (1981: 149, 1982: 99–100, 1984: 116, 265) assigned undated sites to either an Early Phase (ca12,000-10,000 BP to 6000 BP) or a Late Phase (<4500 BP to contact) on the presence or absence ofgeometric microliths and/or the size of artefacts. The date of 4500 BP was used on the assumptionthat geometric microliths entered the Victorian Mallee archaeological record about 4500–4000 BP.Ross assigned sites with assemblages predating 4500 BP to the period 12,000–10,000 BP to 6000 BP,since this was the period when the Mallee was wettest (Table A4/12).
Ross based her interpretations of the Victorian Mallee archaeological record on: 1. her calculations that there was a tenfold increase in the number of sites occupied after
4500–4000 BP in the southern Mallee (1984: 201, 235–8, 267); and, 2. the major period of use in the northern Mallee occurred during the early Holocene (i.e.,
between ca 12,000/10,000 BP and ca 6000 BP) rather than after ca 6000 BP (1984: 182–4,265).
TTaabbllee AA44//1111 The Mallee, north-western Victoria: sites included in Figure 7.8 with radiometric ages from Ross 1984: 178–80.
Note: radiocarbon ages have not been corrected for environmental effects or calibrated; TL ages are in calendar years (Ross
1984: 178); ch indicates charcoal and sh = freshwater mussel shell.
SOUTHERN MALLEE NORTHERN MALLEE
SITE NAMES RADIOMETRIC AGES SITE NAMES RADIOMETRIC AGES
Pine Plains (Pleasant Grove) 6200±600 Alpha-819 TL Raak II 7650±100 SUA-766 C14-sh
Sunset Desert (Birthday Plain) 5780±100 Alpha-820 TL HWH III 6390±700 Alpha-817 TL
possibly younger
Megaw 3 7030± 80 SUA-2103 C14-ch
below artefacts
Pine Plains (Lake Bambruk 1) 1970± 90 SUA-1109 C14-sh Eyesore 1015±100 Alpha-816 TL
Overall Hill (Pine Plains) 1200±1800 Alpha-818 TL
Pine Plains (Lake Bambruk 2) 1170± 90 SUA-1110 C14-sh
The northern MalleeThe northern Mallee sample consists of 20 sites at Raak Plains (Ross 1984: 134). Ross said thesesites are distinguishable from the southern Mallee sites on the basis of artefact type, shape andsize (1984: 159, 169), and are dominated by large core tools and large broad but thinimplements which she considered belong to the ‘Core Tool and Scraper Tradition’ (1984: 123,171). Of the 20 northern Mallee sites, Ross (1984: 120, 134) stated 60% contain artefacts mostcommonly associated with Pleistocene and early-Holocene technologies; only two containstone artefacts in any quantity, and six (30%) are devoid of lithic remains consisting of onlyshell scatters or fireplaces; two (10%) have no clear diagnostic materials.
terra australis 21
347
Appendix 4

TTaabbllee AA44//1122 The Mallee, north-western Victoria: rates of known-habitation use. N = 141. [1] One Rocket Lake site used in
both phases; +3, –3 and bracketed totals in Late Phase represent figures if Rocket Lake sites were included in the northern
Mallee. [2] Rate A is rate according to index used by Ross (1984: 198–9); Rate B is rate calculated as number of sites per
millennium.
PERIOD NORTHERN MALLEE SOUTHERN MALLEE
NO. OF RATE OF KNOWN NO. OF DATED NO. OF RATE OF KNOWN NO. OF DATED
HABITATIONS [1] HABITATION USE [2] HABITATIONS HABITATIONS [1] HABITATION USE [2] HABITATIONS
RATE A RATE B RATE A RATE B
Early Phase
6000 years 12 1:500 2.0 2 11 1:545 1.8 3
4000 years 1:335 3.0 1:365 2.8
Late Phase 8 1:565 1.8 1 111 1:41 24.0 3
+/- Rocket +3 = 11 1:410 2.4 –3 = 108 1:42 23.8
Totals 20[23] 3 121[118] 6
No northern Mallee site was said to contain any quantity of diagnostic artefacts of the‘Small Tool Tradition’ (Ross 1984: 141); only Raak II was said (1984: 134, Tables 6.1) to havetools of the ‘Small Tool Tradition’ — four geometrics (out of a total of some 2500 artefacts).Ross (1984: 177) associated sites without stone artefacts with recent small-scale visitation; forexample, Eyesore, a freshwater shell scatter with numerous hearths, one of which was TLdated to 1015±100 BP (Alpha-816) (Ross 1984: 179). She (1984: 180) argued that because largersites on the southern part of Raak Plains are older than ca 5200 BP (TL = 4500 radiocarbonyears BP), late-Holocene occupation of the plains was a much less substantial event.
Twelve of the northern Mallee sites were assigned to the Early Phase, and eight to theLate Phase (Table A4/12). If the rate of known-habitation use is calculated in the same waythat Ross calculated the ‘rate’ for both the southern Mallee (see below), the figures suggest thatthe rates of known-habitation use for the Early and Late Phases are similar if the early periodis taken as lasting from 12,000 BP to 6000 BP (6000 years); the rates are 1:500 for the EarlyPhase and 1: 560 years for the Late Phase. If the Early Phase is taken as 10,000 BP to 6000 BP(4000 years) then the rate for this period becomes 1:335 years, which is higher than the rate forthe Late Phase. Ross (1984: 182, 198) based her statement that late-Holocene occupation in thenorthern Mallee was much less substantial than that of the early period on the lower numberof artefacts in sites assigned to the late period.
Ross included Rocket Lake in the southern Mallee sample in her analyses, eventhough it is very close to Raak Plains (10km) and is shown in her 1984 Figure 3.3 as beingwithin the area defined as northern Mallee. Three sites at Rocket Lake contain geometricmicroliths (Ross 1984: 335–6), which, at two sites, represent between 2% and 5% of theartefacts (1984: Fig. 6.5). If the Rocket Lake sites do belong in the northern Mallee, then,1. geometrics are ‘abundant’ (>2%) at some northern Mallee sites, contrary to Ross’
statement (1984: 141); and,2. the rate of known-habitation use increased in the more recent period (1:410 years),
though it may not alter the observation that there are fewer artefacts in Late Phasehabitations.
The southern MalleeRoss’ southern Mallee sample includes 121 sites (1984: 120–30), which are described as havingprimarily tools characteristic of the ‘Small Tool Tradition’ (1984: 171). Artefacts diagnostic of
What’s changing: population size or land-use patterns? The archaeology of Upper Mangrove Creek, Sydney Basin
terra australis 21
348

the Small Tool Tradition (‘backed blades, geometric microliths, bipolar implements and tulas’)are present at 54 sites (42.3%) (1984: 134); backed artefacts represent <5% of the totalassemblage in at least 16 sites (1984: 141), though this is less if Rocket Lake is included in thenorthern zone.
Large cores and flake tools were recorded at 10 of the 121 southern Mallee sites. Eightof the 10 were associated with quarries where large tools may be expected (Ross 1984: 134),but Ross believed her analysis showed that this did not negate their assignation to the EarlyPhase. In addition to these 10 sites, hearth materials at Pleasant Grove (Pine Plains) yielded aTL date of 6200±600 BP (Alpha-819). This date, along with the presence of numerousgeometrics, suggests Pleasant Grove was visited during both the Early and Late Phases. Thus,artefact assemblages and/or radiometric dates at 11 southern Mallee sites indicated to Ross(1984: 198–9) that the southern Mallee was visited in the early Holocene wet period (from ca12,000–10,000 BP to ca 6000 BP).
Ross calculated the rate of known-habitation use (referred to as the ‘density of sites overtime’ [1984: 198–9]) for the Early Phase in the southern Mallee as ‘approximately one site every400 years’ (1:400), and for the Late Phase as ‘approximately one site every 40 years’ (1: 40) (‘atleast 110 sites’ in 4500 years). On this basis, there was a tenfold increase in the rate of known-habitation use in the later period as well as a tenfold increase in the number of habitationsknown to be used (11:111). Ross’ 1:400 for the Early Phase is an averaged figure. If the EarlyPhase is taken as 6000 years (i.e., ca 12,000 BP to ca 6000 BP) the rate of known-habitation use is1:545 years and the growth rate for this index is greater than tenfold (×13); but, if taken as 4000years, then the growth rate is 1:365, which is less than tenfold (×9) (Table A4/12).
However, the increase in the rate of known-habitation use takes place over severalmillennia — that is, 11 sites between ca 12,000–10,000 BP and 6000 BP, and 111 sites between4500 BP and contact. The establishment and/or use of these sites may have been spread out overthese periods, or they may have been established/used within very restricted time periods.If the temporal distribution of known-habitation use was as set out in Table A4/13, thenmillennial growth rates were much lower than tenfold (×3 to ×1.5). That is, there could havebeen a gradual process of growth without any sudden increases, even if the number of sitesused by the time of contact (111) was 10 times the number used by 6000 BP (11). The averageannual growth rates based on the hypothetical figures range between 0.04% and 0.11% p.a.
TTaabbllee AA44//1133 The southern Mallee, north-western Victoria: hypothetical distribution of number of known-habitations used
in each millennium. N = 121.
MILLENNIUM HYPOTHETICAL NUMBER HYPOTHETICAL HYPOTHETICAL
BP OF KNOWN-HABITATIONS MILLENNIAL AVERAGE ANNUAL
IN EACH MILLENNIUM GROWTH RATE GROWTH RATE
x % %
10th 1 )9th 2 ) 2 +100 0.078th 3 ) 1.5 + 50 0.047th 5 ) 11 1.6 + 60 0.05
6th 0 0 -100
5th 2 ) –4th 4 ) 2 +100 0.073rd 8 ) 2 +100 0.072nd 24 ) 3 +200 0.111st 44 ) 111 1.9 + 88 0.06
terra australis 21
349
Appendix 4

Kefous (1982: 98) queried Ross’ (1981) use of 4500 BP as the date for the appearance ofthe ‘Small Tool Tradition’ and her assumption that sites with geometric microliths postdate4500 BP. Kefous argued that such sites could have formed any time after 5500 BP (see also Birdand Frankel 1991a: 3). If this was the case, then the rate of known-habitation use and growthrates for the Late Phase would be lower than those presented above.
Radiometric dates for the Victorian Mallee sites fall between ca 7750 BP (C14) and ca5680 BP (TL), and between ca 2060 BP (C14) and ca 915 BP (TL), using 2-sigma ranges foruncorrected and uncalibrated radiocarbon and TL determinations (Table A4/11 and Fig. 7.8).When the radiocarbon dates are calibrated to make them comparable with the TL dates, whichare in calendar years, the earlier time period begins possibly as early as ca 8600 BP andextends to ca 5680 BP, and the later period extends from ca 2130 to ca 925 BP. These dates couldbe taken to suggest that the Mallee was inhabited between ca 8600 BP and ca 5700 years BPand then again between or just before ca 2200 BP and ‘contact’. It is therefore possible that thedates indicate re-occupation of the Mallee only after ca 2000 BP (Williams 1985: 326) whenenvironmental conditions improved. Another possible interpretation is that there was a peakin occupation in the southern Mallee between ca 2000 and ca 1000 BP with a concomitantdecrease in the last 1000 years, and that the increase in habitations may not have coincidedwith the introduction of the ‘Small Tool Tradition’ (cf. Ross 1984: 200).
The evidence presented by Ross for the northern Mallee suggests the rates of known-habitation use in both the early and late-Holocene were similar, or else higher in the earlierperiod. In the southern Mallee, the rate of known-habitation use appears to be much higher inthe late-Holocene than in the early-Holocene (between ×9 and ×13), but this occurred within a4500-year period and the millennial and average annual growth rates would be much lower.Whether the radiometric dates are indicative of regional trends and there was a late-Holocenepeak habitation period in the second millennium BP, or whether there was a more even spreadof occupation, will not be clear until more detailed work has been carried out and methodsdiscovered which provide a finer scale of dating the establishment and length of occupation ofopen archaeological deposits.
NSW Hunter ValleyIn the Hunter Valley, which is immediately to the north of the Upper Mangrove Creekcatchment, Hiscock (Hiscock and Koettig 1985; Hiscock 1986: 45) undertook technologicalanalyses of stone artefacts from 15 open archaeological deposits and Sandy Hollow, arockshelter with a stratified archaeological deposit excavated by Moore (1970) in the 1960s.The open deposits were in the Mount Arthur North and South coal leases near Muswellbrookin the central lowlands.
On the basis of a sequence he identified at Sandy Hollow (SH/1), Hiscock (1986: 41)divided the Bondaian assemblages into an early phase (Bondaian-Phase I dated from ca 1300BP to ca 800 BP) and a late phase (Bondaian-Phase II, ca 800 BP to ca 110 BP, i.e., 1840 AD[contact]). Assemblages of both phases were recognised at sites in Mount Arthur North andMount Arthur South coal leases.
Of the 15 open archaeological deposits, three were identified as having only aBondaian-Phase II assemblage, while 10 had Bondaian-Phase I assemblages, one site wasclassified as pre-Bondaian, and one contained elements of both Bondaian-Phases I and II(Table A4/14). Hiscock (1986: 45) discounted arguments for destruction of early sites. Hepointed out that the pattern of high numbers during the Bondaian-Phase I and decreasednumbers in Bondaian-Phase II parallels trends in accumulation rates at Sandy Hollow 1 (seefollowing section on artefact accumulation rates in Hunter Valley sites). Hiscock (1986: 45)observed similar patterns in other areas of the central lowlands and he believed the Mount
What’s changing: population size or land-use patterns? The archaeology of Upper Mangrove Creek, Sydney Basin
terra australis 21
350

Arthur North and South pattern probably accurately represent gross changes in site numbersnear Muswellbrook during the Holocene. Hiscock (1986: 40) said his study indicates declinesin site numbers and site use in this area during the last 800 years. His 1986 results also suggesta dramatic increase in the rate of known-habitation use in the period from ca 1300 BP to ca 800BP. Hiscock (1993: 71) subsequently stated that he considered the date of ca 1300 BP for theappearance of Phase I a minimum.
TTaabbllee AA44//1144 NSW Hunter Valley (central lowlands — Mt Arthur North and South): number of habitations known to be used
and rates of known-habitation use in each phase. Hiscock’s 1986 open archaeological deposits, N = 15.
HISCOCK’S HISCOCK’S DURATION NO. OF HABITATIONS RATE OF KNOWN-
PHASES DATES (BP) (YEARS) KNOWN TO BE USED HABITATION USE
IN EACH PHASE (NO./MILLENNIUM)
Pre-Bondaian >1300 ?? 1 <1
Bondaian
Phase 1 1300 – 800 500 11 22
Phase 2 800 – contact 700 4 5.7
Given the uncertainties about the timing and duration of the Bondaian Phase I andpre-Bondaian phases, millennial and average annual growth rates for the number of known-habitations used were calculated for only the last phase (Tables 7.5 and 7.7). Changes of thesemagnitudes (as decreases or increases) are not recorded for the number of habitationsused/millennium in any other region.
Although Hiscock used a greater number of diagnostic features to assignassemblages to phases than Ross (1984), the same methodological predicament exists in thatassemblages are assigned to phases on the basis of diagnostic attributes. The date at whicheach habitation was established or used may be within that phase, but not necessarily at thebeginning of the phase. It may be that the trend was more gradual than data in Figure 7.9Aand Table A4/14 suggest, or that there were dramatic increases and decreases but thesechanges occurred later or earlier than the dates given for the phase boundaries. In addition tothe problems that Hiscock acknowledged (1986: 45), there are two other problems: 1. the 15 knapping floors on which Hiscock’s model is based are only a small,
purposefully selected sample of artefacts (Hiscock and Koettig 1985: 47–8) from asmall number of all the recorded surface artefact scatters in both lease areas — a totalof 228 sites (Hughes 1985: 7–8). Given the small percentage that the analysed samplerepresents, if the remaining sites could be assigned to the phases in which they wereoccupied, the trend may be quite different to that presented by Hiscock; and,
2. the sites are a series of artefact scatters in ground surface exposures along the relativelyflat banks of small creeks; for example, in the Mount Arthur North samples, the 11 sitesextend along both sides of a single creek. Some of the artefact scatters designated sitesmay be small areas of exposure within a single very large, partially buried scatter.For many years, the earliest radiocarbon date from excavated archaeological deposits
in the central lowlands of the Hunter Valley was 1410±90 BP (ANU-122) from Milbrodale(Moore 1970: 45). Further sites have been dated during salvage excavations and the earliestdates are now 3120±70 BP (Beta-62207) from Bulga (Koettig 1994, Vol. 5: 25) and 3600±300 (W-1417) from Warkworth, both near Singleton (Haglund 1992, Vol. 6: Appendix G). In other partsof the Hunter Valley, the earliest dates vary widely. In the southern sandstone rim, the earliest
terra australis 21
351
Appendix 4

date is 2495±105 BP (ANU-756) (Big L, Moore 1981: 398). Further west, along the GoulburnRiver (a major tributary of the Hunter River), earliest dates are 3710±210 BP (SUA-1669) fromKD/41 (Haglund 1981a: 32, 1984: 85) and 7750±120 BP (ANU-124) from Bobadeen (Moore1970: 48). Moore (1981: 391) believed the latter date (ANU-124) pre-dates habitation inBobadeen rockshelter and says other radiocarbon dates from the deposit indicate habitationbegan about 6000 BP. Along Fal Brook in the Hunter Valley’s north-eastern mountains, stoneartefacts were found at SGCD.16 in soils in which charcoal provided three dates: >20,020 BP(Beta-20056), 13,020±360 BP (Beta-17271) and 34,580±650 BP (Beta-17009); charcoal processedfor the first of these dates came from a hearth. On the basis of these determinations, theartefacts were assigned a late Pleistocene age — sometime between 35,000 BP and 10,000 BP(Koettig 1987: 98–9).
Dates are now available for several open archaeological deposits excavated duringsalvage projects in the Singleton area of the Hunter Valley central lowlands (Table A4/15)(Koettig 1989: 8, 1992, Vol. 3: Table 1.1; Haglund 1992, Vol. 6: Appendix G; Rich 1992: 110;Koettig 1994, Vol. 5: 25; Haglund 2002: 28, Appendix D). Some of these sites have multipledates which show they were inhabited during more than one century/millennium. Forexample, the 11 radiocarbon dates for Camberwell GCC 7/8 fall into three different millennia,with seven dates in the first millennium BP, one in the second millennium BP and three in thethird millennium BP (Table A4/15). When these sites are assigned on the basis of theradiocarbon dates to a millennial sequence for the rate of known-habitation use (Table A4/16,Fig. 7.9B), the trends vary from Hiscock’s 1986 model of a dramatic decrease in site numbersand site use in the last 800 or 1000 years. In contrast, they suggest a continual relatively steadyincrease in habitations, though with lower millennial and average annual growth rates in thelast 2000 years (Tables 7.7 and A4/16 respectively).
TTaabbllee AA44//1155 NSW Hunter Valley (central lowlands — Singleton area): sites included in Table A4/16 and Figure 7.9B with
radiometric ages and references. All radiocarbon ages are from charcoal samples, except where TL noted after laboratory number.
PROJECT SITE NAME RADIOCARBON AGES REFERENCE
YEARS BP LAB. NO.
Bulga Site B8, Area II 1730± 50 Beta-62206 Koettig 1994, Vol. 5: 25
Site B8, Area IV 3120± 70 Beta-62207 ditto
Site B58, Area I 2060± 50 Beta-62208 ditto
Site B58, Area II 2620± 60 Beta-62209 ditto
Camberwell GCC 7/8 200± 60 Beta-44524 Koettig 1992, Vol. 3: Table 1.1
260± 60 Beta-39203 ditto
270± 60 Beta-39206 ditto
340± 60 Beta-44525 ditto
450± 80 Beta-44523 ditto
830± 50 Beta-39201 ditto
970± 50 Beta-39207 ditto
1200± 70 Beta-39205 ditto
2210± 50 Beta-39200 ditto
2460± 50 Beta-39204 ditto
2750± 60 Beta-39202 ditto
GCC 28/29 600± 60 Beta-39208 ditto
660± 50 Beta-39210 ditto
970± 50 Beta-39209 ditto
What’s changing: population size or land-use patterns? The archaeology of Upper Mangrove Creek, Sydney Basin
terra australis 21
352

terra australis 21
353
TTaabbllee AA44//1155 (Continued)
PROJECT SITE NAME RADIOCARBON AGES REFERENCE
YEARS BP LAB. NO.
GCC 33 960± 60 Beta-39212 ditto
1020± 70 Beta-39213 ditto
2370± 60 Beta-39211 ditto
GCC 35 1890± 50 Beta-39214 ditto
Pokolbin POK4 2820±50 Beta-32614 Koettig 1989: 8, Beta Analytic Lab. report
Narama Site 30 260±60 Beta-48519 Rich 1992: 110
Site 48 680±50 Beta-48521 ditto
700±60 Beta-48520 ditto
Warkworth Doctors Creek WL (Sample 3) 800±60 Beta-54012 Haglund 1992, Vol. 6: Appendix G
(Sample 2) 830±60 Beta-54011 ditto
Doctors Creek WH (Upper) 3600±300 W-1417 [TL] ditto
Sandy Hollow Creek W6 300±100 W-1615 [TL] Haglund 2002: 28, Appendix D
600±100 W-1617 [TL] ditto
1800±200 W-1619 [TL] ditto
TTaabbllee AA44//1166 NSW Hunter Valley (central lowlands — Singleton area): rates of known-habitation use in each century/millennium.
N = 12, see Table A4/15 for sites included.
CENTURY/MILLENNIUM NO. OF HABITATIONS KNOWN TO RATE OF KNOWN-HABITATION MILLENNIAL
BE USED IN EACH CENTURY USE (NO./MILLENNIUM) GROWTH RATE
x %
4000–3000 2 ] 2
3000–2000 4 ] 4 2.25 +100
2000–1900 0 ]
1900–1800 1 ]
1800–1700 2 ]
1700–1200 0 ] 5 1.25 +30
1200–1100 1 ]
1100–1000 1 ]
1000– 900 3 ]
900– 800 2 ]
800– 700 1 ]
700– 600 2 ]
600– 500 2 ] 7 1.40 +40
500– 400 1 ]
400– 300 1 ]
300– 200 3 ]
200–contact 1 ]
Appendix 4

More recent technological analyses of stone artefact assemblages in other parts of thecentral lowlands (e.g., Narama, Rich 1992: 23–5; Bulga, Koettig 1994; Baker 1994: 4) and theGoulburn River (Haglund 1989) have not found the same associations or chronological sequenceof technological attributes identified by Hiscock at Sandy Hollow. It appears that spatial andtemporal variations in the manufacture of stone artefacts in the Hunter Valley are more diversethan Hiscock originally envisaged. Dating open sites by Hiscock’s methods may prove to be ofadvantage in some studies. However, using data sets such as those for Mount Arthur North andSouth to provide trends in the numbers of habitations established or used may be best applied asheuristic devices to set up hypotheses for testing with other evidence. As with the VictorianMallee, whether the present radiometric dates are indicative of regional trends will not be clearuntil more detailed work has been carried out and methods discovered which provide a finerscale of dating for the establishment and length of occupation of open archaeological deposits.
B: Artefact accumulation rates in individual habitations
NSW south coast and SydneyImplement accumulation rates for five sites on the NSW south coast have been presented byLampert and Hughes (1974: Fig. 2) and Hughes and Lampert (1982: Figs 1 to 5). Each site wasinhabited over a long period of time, that is, >/ = 7000 years, except for one where habitationextended back to ca 4000 BP. Hughes and Lampert’s 1982 graphs are based on implementcounts and not total numbers of artefacts.
Lampert and Hughes (1974: 232–3) presented evidence for Burrill Lake and BassPoint to show that increasing numbers of implements had accumulated at these sites, as wellas at Curracurrang 1CU5/-, throughout their period of habitation. They believed that ‘anincrease in stone-working coincided with the arrival of the new small tool stone technology’and with an increase in the rate of humanly induced sedimentation. At Bass Point thedramatic increase is said to have occurred about 4000 BP, at Burrill Lake the increase was lessdramatic, and at Curracurrang ICU5/- it occurred within the past 2000 or 3000 years.
In a later paper, Hughes and Lampert (1982) used evidence from five sites to describeincreasing implement accumulation rates and sediment rates at sites on the NSW south coast(Burrill Lake, Bass Point, Currarong 1 and Currarong 2) and its hinterland (Sassafras 1) (1982:16–20, Figs 1 to 5 reproduced as my Fig. 7.10 and Tables A4/17 to A4/21). They (1982: 19)argued that there was a ‘marked intensification of site occupation during Holocene times’with the most dramatic increase (a six- to tenfold increase on average) occurring in the last5000 years. They saw this increase continuing at least until 2000 BP, then ‘after that time thetrends diverged in that at some sites the increase in intensity of site occupation continued’(Burrill Lake and Currarong 2), ‘but at others the intensity levelled off or there was a slightdecline’. Hughes’ (1977) data and Hughes and Lampert’s (1982) graphs suggest: • at Bass Point: the rate of implement accumulation ceased to increase sometime after
ca 1800 BP and then levelled off or declined slightly; sediment accumulationcontinued to increase (Table A4/20 and Fig. 7.10E);
• at Currarong 1: the rate of implement accumulation increased substantially after ca2000 BP and then declined after ca 780 BP (Table A4/18 and Fig. 7.10B); and,
• at Sassafras 1: the rate of implement accumulation increased dramatically between ca3000 BP and ca 1700 BP then decreased (Table A4/21 and Fig. 7.10D); the sedimentrate was stable in the last 3000 years.
What’s changing: population size or land-use patterns? The archaeology of Upper Mangrove Creek, Sydney Basin
terra australis 21
354

terra australis 21
355
TTaabbllee AA44//1177 Burrill Lake, NSW south coast: rates of implement accumulation and average annual growth rates based on data
from Hughes 1977: Table 2.13. IIttaalliiccss indicates highest number or rate, underline = greatest/most dramatic increase.
UNIT PERIOD DURATION NO. OF IMPLEMENTS AVERAGE ANNUAL
(years BP) (years) DISCARDED/100 YEARS GROWTH RATE
%
Shell midden 1550–7100 1450 11..1111 ++00..1100
Top upper sand 7500–7550 5950 0.27 +0.02
Btm upper sand 20,500–7500 13,000 0.11 ––
TTaabbllee AA44//1188 Currarong 1, NSW south coast: rates of implement accumulation and average annual growth rates based on data
from Hughes 1977: Table 3.10. IIttaalliiccss indicates highest number or rate, underline = greatest/most dramatic increase.
UNIT PERIOD DURATION NO. OF IMPLEMENTS AVERAGE ANNUAL
(years BP) (years) DISCARDED/100 YEARS GROWTH RATE
%
4 780–7100 680 54 -0.04
5 2040–7780 1260 6699 ++00..11886 7000–2040 4960 7 —
TTaabbllee AA44//1199 Currarong 2, NSW south coast: rates of implement accumulation and average annual growth rates based on data
from Hughes 1977: Table 3.11. IIttaalliiccss indicates highest number or rate, underline = greatest/most dramatic increase.
UNIT PERIOD DURATION NO. OF IMPLEMENTS AVERAGE ANNUAL
(years BP) (years) DISCARDED/100 YEARS GROWTH RATE
%
1 1100–7100 1000 1155..66 +0.04
2 2100–1100 1000 10.3 ++00..1177
3 3650–2100 1550 1.9 +0.05
4 7000–3650 3350 0.9 ––
TTaabbllee AA44//2200 Bass Point, NSW south coast: rates of implement accumulation and average annual growth rates based on data
from Hughes 1977: Table 5.6. IIttaalliiccss indicates highest number or rate, underline = greatest/most dramatic increase.
UNIT PERIOD DURATION NO. OF ARTEFACTS AVERAGE ANNUAL
(years BP) (years) (EXCLUDING WASTE GROWTH RATE
FLAKES) DISCARDED/ %
sq m/100 YEARS
Upper midden 740–7100 640 1.25 -0.003
Lower midden 1800–7740 1060 11..2277 +0.03
Grey sand 3950–1800 2150 0.88 ++00..1100Upper white sand 7700–3950 3750 0.11 +0.03
Lower white sand 17,500–7700 9800 0.03 ––
TTaabbllee 44//2211 Sassafras 1, NSW south coast hinterland: rates of implement accumulation and average annual growth rates based
on data from Hughes 1977: Table 4.3. IIttaalliiccss denotes highest number or rate; underline = greatest/most dramatic increase.
PERIOD DURATION NO. OF IMPLEMENTS AVERAGE ANNUAL
(years BP) (years) DISCARDED IN EXCAVATED GROWTH RATE
LEVELS/100 YEARS %
1695–7100 1595 28 -0.04
3090–1695 1395 4433 ++00..11003770–3090 680 9 ––
Appendix 4

What’s changing: population size or land-use patterns? The archaeology of Upper Mangrove Creek, Sydney Basin
terra australis 21
356
Thus, of the five sites examined by Hughes and Lampert, only two show that implementaccumulation rates continued to increase until contact — Burrill Lake and Currarong 2 (Figs7.10A and 7.10C, Tables A4/17 and A4/19). However, very little of the upper deposits remainedat Burrill Lake at the time Lampert excavated the site, and the figures for the most recent periodfor this site were extrapolated from Currarong 2 (Hughes 1977: 66–7). It is thus possible that theimplement accumulation rates at Burrill Lake did not continue to increase until contact.
Average annual growth rates. Hughes and Lampert (1982: 19–20) postulated a six- totenfold increase over the last 5000 years. Average annual growth rates based on Hughes’ data(1977: Tables 2.13, 3.10, 3.11, 4.3 and 5.6) show that the highest average annual growth rate ateach site falls between +0.1% and +0.18% (Tables A4/17 to A4/21). The period in which thehighest growth rate occurred was not the same in each site, though it occurred after ca 4000 BPat each site. In all sites, the highest growth rate occurred in the same period as the mostdramatic increase in the implement accumulation rates.
NSW Hunter Valley and adjacent areasIn the late 1960s, Moore (1970) excavated two rockshelter sites in the sandstone areas of theHunter Valley (Sandy Hollow and Milbrodale) and a third (Bobadeen) on the upper reaches ofthe Goulburn River. He (Moore 1981) subsequently excavated two sandstone rockshelters onthe southern rim of the Hunter Valley (Big L and Yango Creek) and another in the MacdonaldRiver valley. Radiocarbon dates and extrapolations on the basis of depth/age curves suggestthat initial habitation at these six sites began between ca 2000 BP and ca 6000 BP (Tables A4/22to A4/27).
TTaabbllee AA44//2222 Sandy Hollow, NSW Hunter Valley (Goulburn River): rates of artefact accumulation and average annual growth
rates based on data from Moore 1970: 35–7, Table 2. IIttaalliiccss indicates highest number or rate; underline = period with
greatest/most dramatic increase. [1] Excavation taken to 42 inches (107cm), but archaeological materials extend to only 38
inches (96.5cm).
LEVEL DEPTH RADIOCARBON DATES D/A DATES DURATION NO. OF RATE OF ARTEFACT AVERAGE ANNUAL
(cm)[1] Years BP Lab. No. years BP (years) ARTEFACTS ACCUMULATION GROWTH RATE
NO./MILLENNIUM %
1 0–15 530±80 ANU-125 570–1100 470 698 1485 -0.11
2 15–31 820–1570 250 624 2500 -0.34
3 31–46 1080–1820 260 11551111 55881100 +0.24
4 46–61 1300±100 ANU-12 1320–1080 240 746 3110 +0.15
5 61–76 1580–1320 260 564 2170 ++00..99226 76–91 1830–1580 250 49 200 +0.65
7 91–96 1910–1830 80 3 40
TTaabbllee AA44//2233 Milbrodale, NSW Hunter Valley (central lowlands): rates of artefact accumulation and average annual growth
rates based on data from Moore 1970: 41–45, Table 4. IIttaalliiccss indicates period with highest number or rate; underline = period
with greatest/most dramatic increase.
LEVEL DEPTH RADIOCARBON DATES D/A DATES DURATION NO. OF RATE OF ARTEFACT AVERAGE ANNUAL
(cm) Years BP Lab. No. years BP (years) ARTEFACTS ACCUMULATION GROWTH RATE
No./millennium %
1 0–15 630±60 ANU-121 990– 100 890 672 755 -0.07
2 15–31 1410±90 ANU-122 1830– 990 840 11115500 11337700 +0.21
3 31–46 2600–1830 770 189 245 <<++00..22774 46–<76 <3000–2600 <400 12 >30

TTaabbllee AA44//2244 Bobadeen, Ulan, NSW Hunter Valley (upper Goulburn River): rates of artefact accumulation and average annual
growth rates based on data from Moore 1970: 45–9, Table 6. IIttaalliiccss indicates highest number or rate; underline = period with
greatest/most dramatic increase. [1] Radiocarbon date 5150±170 BP (ANU-287) comes from between 63.5–66cm (25–26
inches) below the surface; 7750±120 BP (ANU-124) comes from between 63.5–76cm (25–30 inches) below the surface, but
see comments by Moore (1981: 391).
LEVEL DEPTH RADIOCARBON DATES D/A DATES DURATION NO. OF RATE OF ARTEFACT AVERAGE ANNUAL
(cm) Years BP Lab. No. [1] years BP (years) ARTEFACTS ACCUMULATION GROWTH RATE
NO./MILLENNIUM %
1 0–15 730±70 ANU-123 950–1100 850 3745 4406 -0.02
2 15–31 2100–1950 1150 66001111 55222277 +0.03
3 31–38 2700–2100 600 2216 3690 -0.03
4 38–46 3300–2700 600 2628 4380 +0.13
5 46–53 3900–3300 600 1193 1990 +0.18
6 53–61 4120±175 ANU-790 4650–3900 750 511 680 ++00..2200
7 61–76 5150±170 ANU-287 4650–
7750±120 ANU-124 >6000? >1850? 235 <130?
8 76–91 ?? –>6000 70
TTaabbllee AA44//2255 Big L, NSW Hunter Valley (southern rim): rates of artefact accumulation and average annual growth rates based
on data from Moore 1981: 398, Table 2. IIttaalliiccss indicates highest number or rate; underline = period with greatest/most
dramatic increase. [1] Moore (1981: 398) considered radiocarbon ages from spit 9 anomalous, and they were disregarded in
calculating the depth/age curve.
LEVEL DEPTH RADIOCARBON DATES D/A DATES DURATION NO. OF RATE OF ARTEFACT AVERAGE ANNUAL
(cm) Years BP Lab. No. [1] years BP (years) ARTEFACTS ACCUMULATION GROWTH RATE
No./millennium %
1 0– 8 324–1100 224 216 964 +0.14
2 8–15 648–1324 324 226 698 +0.20
3 15–23 972–1648 324 112 346 -0.37
4 23–31 1296–1972 324 364 1123 0.00
5 31–38 1620–1296 324 361 1114 -0.05
6 38–46 1944–1620 324 424 1309 -0.02
7 46–53 2268–1944 324 444455 11337733 +0.06
8 53–61 2495±105 SUA-756 2592–2268 324 372 1148 +0.33
9 61–69 480±75 ANU-648 2916–2592 324 127 392 +0.31
930±50 ANU-648/2
10 69–76 3240–2916 324 47 145 ++00..443311 76–96 4000–3240 864 31 36
terra australis 21
357
Appendix 4

TTaabbllee AA44//2266 Yango Creek, NSW Hunter Valley (southern rim): rates of artefact accumulation and average annual growth rates
based on data from Moore 1981: 398–401, Table 4. IIttaalliiccss indicates highest number or rate; underline = period with
greatest/most dramatic increase.
LEVEL DEPTH RADIOCARBON DATES D/A DATES DURATION NO. OF RATE OF ARTEFACT AVERAGE ANNUAL
(cm) Years BP Lab. No. years BP (years) ARTEFACTS ACCUMULATION GROWTH RATE
No./millennium %
1 0– 8 306–1100 206 32 155 -0.11
2 8–15 612–1306 306 59 193 -0.40
3 15–23 918–1612 306 183 598 -0.44
4 23–31 1224–1918 306 716 2340 -0.01
5 31–38 1530–1224 306 728 2379 -0.01
6 38–46 1836–1530 306 773355 22440022 +0.08
7 46–53 2142–1836 306 576 1882 +0.07
8 53–61 2350±85 ANU-648 2448–2142 306 458 1497 +0.29
9 61–69 2754–2448 306 191 624 +0.29
10 69–76 3060–2754 306 80 261 +0.24
11 76–84 3366–3060 306 38 124 ++00..883312 84–96 3366–3876 510 5 10
TTaabbllee AA44//2277 Macdonald River (Squares A–AA–BB–CC), NSW: rates of artefact accumulation and average annual growth rates
based on data from Moore 1981: 401–15, Table 5 and Fig. 4. IIttaalliiccss indicates highest number or rate; underline = period with
greatest/most dramatic increase.
LEVEL DEPTH RADIOCARBON DATES D/A DATES DURATION NO. OF RATE OF ARTEFACT AVERAGE ANNUAL
(cm) Years BP Lab. No. years BP (years) ARTEFACTS ACCUMULATION GROWTH RATE
No./millennium %
1 0– 13 515–1100 415 106 225 -0.10
2 13– 25 1030–1515 515 198 384 -0.17
3 25– 38 1545–1030 515 467 907 -0.10
4 38– 51 2060–1545 515] 11552299 11448844 +0.02
5 51– 54 2370±100 SUA-387 2575–2060 515]
6 54– 76 3294–2575 719 831 1156 +0.04
7 76– 89 4013–3294 719 605 841 ++00..1166
8 89–101 4732–4013 719]
9 101–114 5451–4732 719] 587 272
10–11 114–127 5820±110 SUA-564 6170–5451 719]
In each site, the highest number of artefacts does not occur in the uppermost level.For Big L, Yango Creek and Macdonald River, Moore (1981: 415) noted that the maximumoccurrence of artefacts was in levels dating from ca 2300 BP to ca 1800 BP, ca 2000 BP to ca 1700BP, and ca 2300 BP to ca 1800 BP respectively. My estimated dates for these levels, usingdepth/age curves based on information in Moore (1970, 1981), vary slightly from Moore’s butindicate the same trends.
Artefact accumulation rates (Tables A4/22 to A4/27, Figs 7.11 to 7.16) indicate that ateach of the six sites: • levels with the highest number of artefacts also have the highest artefact
accumulation rates. For Macdonald River (Table A4/27 and Fig. 7.16), figures are
What’s changing: population size or land-use patterns? The archaeology of Upper Mangrove Creek, Sydney Basin
terra australis 21
358

based on artefacts from squares A, AA, BB and CC and correlation of the levels asdepicted in Moore’s (1981) Figure 4, rather than the figures in Moore’s (1981) Table 6,which were used in Attenbrow 1987: Fig. 9.18. For Sandy Hollow, Hiscock’s (1986:Table 1) artefact accumulation rates (based on squares AA and BB only) differ slightlyfrom mine in magnitude relative to each other, but level 3 still has the highest artefactaccumulation rate and the overall trends are the same (Table A4/22).
• in each site, levels with the highest artefact accumulation rates began accumulatingabout or after 2600 BP. At Sandy Hollow and Milbrodale, the most dramatic increase inthe artefact accumulation rate occurred in the level with the highest artefactaccumulation rate. However, at the other sites the most dramatic increase occurred inlevels earlier than those with the highest artefact accumulation rate — at Bobadeen,Big L, Yango Creek and Macdonald River.
• the artefact accumulation rates decreased in the most recent levels. The figures suggestthat the decreases occurred within the last 1000 years BP at three sites (Sandy Hollow,Milbrodale, Bobadeen), after ca 1550 BP at two sites (Yango Creek, Macdonald River),and at Big L after 2000 BP. The magnitude of decreases at each site varied, and at BigL, where the decrease was earliest, the rate rose again in the last 600 or so years.
Average annual growth rates. The highest average annual growth rate occurred atdifferent times in individual sites (Tables A4/22 to A4/27), though it was always between ca4000 BP and ca 1250 BP. The highest average annual growth rate did not always occur in thesame level as the greatest increase in the artefact accumulation rate or the highest artefactaccumulation rate. At all sites except Macdonald River, it occurred in an earlier level. AtMacdonald River, the highest growth rate (+0.16%) occurred in the same level as the greatestincrease in the artefact accumulation rate (level 7).
Decreases in the average annual growth rates occurred in the upper levels of all sites.There are substantial decreases in the growth rates, associated with substantial decreases in theartefact accumulation rates, in three sites; for example, Sandy Hollow -0.34% in level 2; Big L -0.37% in level 3 and Yango Creek -0.44% in level 3. In each of these sites the substantialdecrease occurs after 1000 BP.
NSW Blue Mountains and adjacent areasMany (>27) sites have been excavated in the Blue Mountains and adjacent districts (Stockton1970a, 1973, 1993; Stockton and Holland 1974; Johnson 1979). Only seven of these sites hadinformation available on the artefact accumulation rates or artefact densities (number of artefactsper cubic metre) — Springwood Creek, Kings Tableland, Walls Cave, Capertee 1 and 3, ShawsCreek K1 and K2 (Tables A4/28 to A4/32). Revised radiocarbon dates for Springwood Creek andKings Tableland published since Stockton and Holland (1974) (Gillespie and Temple 1976: 99;Stockton 1993) were used in estimating the age of deposits based on a depth/age curve.
Of the excavated Blue Mountains sites, three contain stratified deposits with more thanone cultural assemblage — Walls Cave, Springwood Creek and Kings Tableland. Excavationsat these sites indicate that habitation in the Blue Mountains dates back at least 22,000 years.The distribution of artefacts throughout the deposits and radiocarbon dates at these sites (inparticular, Walls Cave and Springwood Creek) suggested to Stockton and Holland (1974: 46)that there was a hiatus in occupation of the Blue Mountains between ca 6000 and ca 3360 BP.They (1974: 60) believed this hiatus occurred between the Capertian and Bondaianassemblages, and they dated these two assemblages in the Blue Mountains from ca 12,000 BPto ca 6000 BP and from ca 3360 BP to contact respectively. Stockton and Holland divided theBondaian period into Early, Middle and Late Bondaian.
terra australis 21
359
Appendix 4

What’s changing: population size or land-use patterns? The archaeology of Upper Mangrove Creek, Sydney Basin
terra australis 21
360
TTaabbllee AA44//2288 Springwood Creek, NSW Blue Mountains: rates of artefact accumulation and average annual growth rates based
on data taken from Stockton and Holland 1974: Table 3 and Appendix, and revised radiocarbon ages from Stockton 1993:
38–9. IIttaalliiccss indicates highest number or rate; underline = period with greatest/most dramatic increase.
PHASE LEVEL DEPTH RADIOCARBON AGES D/A DATES DURATION ARTEFACTS AREA RATE OF AVERAGE
(cm) Years BP Lab. No. years BP (years) No. DENSITY EXCAVATED ARTEFACT ANNUAL
No./m3 m2 ACCUM- GROWTH RATE
ULATION
No./mill. %
Surf 1–2 0– 6 100–3950) <100
I 3 6– 12 200–1100)
4 12– 20 600–1200) 500 221144 888 1.5 228855 ++00..1155
II 5 20– 28 595±85 SUA-204 1500–1600) 900 158 11331199 1.5 137 +0.05
III 6 28– 36 2500–1500) 1000 139 1111 1.5 93 +0.09
IV 7 36– 44 2930±165 SUA-17 3300–2500)
8 44– 52 3950–3300)
9 52– 60 4600–3950) 2100 121 313 1.5 38 *
STERILE 10 60– 68 5300–4600) 700 0 0 1.5 0 -100.00
V 11 68– 76 6050±170 SUA-18 6000–5300)
12 76– 86 6700–6000) 1400 85 181 2.0 30 +0.09
VI 13 86– 90 7000–6700)
(14 90– 95) –7000)
(15 95–100) 7420±140 SUA-205
16 100–120 7440±140 SUA-206 7700–
17 120–140 8565±430 SUA-285 9000–7700) 2300 56 15 3.0 8
TTaabbllee AA44//2299 Kings Tableland, NSW Blue Mountains: rates of artefact accumulation and average annual growth rates based on
data from Stockton and Holland 1974: Table 3 and Appendix, Stockton n.d.; revised radiocarbon ages from Stockton 1977b:
49; 1993: 33. [1] SUA-157 and SUA-229 averaged for depth/age curve. IIttaalliiccss indicates highest number or rate; underline =
period with greatest/most dramatic increase.
PHASE LEVEL DEPTH RADIOCARBON AGES D/A DATES DURATION ARTEFACTS RATE OF AVERAGE ANNUAL
(cm) Years BP Lab. No.[1] years BP (years) NO. DENSITY ARTEFACT GROWTH RATE
No./m3 ACCUMULATION
No./mill. %
I 1 0– 8
2 8– 13
3 13– 18 750– 100 650 886699 4333 1337 -0.04
II 4 18– 23
5 23– 25 965±75 SUA-155 1050– 750 300 515 66444499 1717 -0.46
III 6 25– 29 ) ) )
7 29– 33 ) 464) 4988)
) ) )

terra australis 21
361
TTaabbllee AA44//2299 (Continued)
PHASE LEVEL DEPTH RADIOCARBON AGES D/A DATES DURATION ARTEFACTS RATE OF AVERAGE ANNUAL
(cm) Years BP Lab. No.[1] years BP (years) NO. DENSITY ARTEFACT GROWTH RATE
No./m3 ACCUMULATION
No./mill. %
IV 8 33– 39 ) ) )
9 39– 42 ) ) )
10 42– 47 ) 482) 3014)
) 1250–1050 200 ) ) 99445555 *
V 11 47– 53 ) ) )
12 53– 61 ) ) )
13 61– 66 ) ) )
14 67– 71 ) 793) 1139)
) ) )
VI 15 71– 76 1100±80 SUA-229 ) ) )
16 76– 84 1060±115 SUA-157 ) ) )
17 84– 90 ) 152) 445)
10cm sterile zone — at bottom of level 17 and on top of level 18 0 0 0 -100.00
VII 18 90–100 ) 28)
19 100–110 14,534± 300 SUA-194 )24,000–12,400 11,600 8)
20 110–120 ) 10)
21 120–130 22,400±1000 SUA-158 ) 1) 86 4 *
Sterile 130–220 taken to bedrock 0
TTaabbllee AA44//3300 Walls Cave (Site B), NSW Blue Mountains: rates of artefact accumulation and average annual growth
rates based on depth/age curve for Levels 1 to 3, assuming constant rate of sediment accumulation using data from Stockton
and Holland 1974: Table 3 and Appendix. IIttaalliiccss indicates highest number or rate; underline = period with greatest/most
dramatic increase.
PHASE LEVEL DEPTH RADIOCARBON AGES D/A DATES DURATION NO. OF RATE OF AVERAGE ANNUAL
(cm) Years BP Lab. No. years BP (years) ARTEFACTS ARTEFACT GROWTH RATE
ACCUMULATION %
No./millennium
Surf 1 0– 12 European
II 2 12– 19 2600– 100 2500 8855 34 --00..000055
III 3 19– 30 3360±100 Gak-3446 4000–2600 1400 53 3388
STERILE 4 30– 37
5 37– 55
6 55– 82 0 0 -100.00
IV 7 82–106
8 106–122 12,000±350 Gak-3448 11 *
STERILE 9 122–146
Appendix 4

What’s changing: population size or land-use patterns? The archaeology of Upper Mangrove Creek, Sydney Basin
terra australis 21
362
Stockton and Holland (1974: 56, 60, 64) stated that in the Bondaian period there wasan increasing abundance of flaked material in rockshelters, with peak concentrations about1000 BP (Stockton’s Middle Bondaian). For example, at Springwood Creek the peak occurredin a level dating to ca 595±85 BP (SUA-204) and, consequently, the final Bondaian levels have alower density of flaked material. Decreasing artefact densities in upper levels are documentedfor Kings Tableland as well (Stockton and Holland 1974: Table 3).
Springwood CreekAt Springwood Creek, initial habitation is dated by a radiocarbon date of 8563±430 BP(SUA-285) in the basal level (Stockton and Holland 1974: 64). The two habitation phases at the site are separated by a sterile sediment layer in level 10. The Capertian assemblage datesfrom initial occupation to about 6000 BP (6050±170 BP, SUA-18) and the Bondaian assemblagefrom sometime before 3000 BP (2930±165 BP, SUA-17) — ca 4600 BP based on depth/age curve— to contact.
Artefact accumulation rates. Reanalysis of the Springwood Creek data (Fig. 7.17 andTable A4/28) indicates that: • decreasing artefact concentrations in the uppermost levels do not reflect decreasing
artefact accumulation rates; • the artefact accumulation rate was higher in the last 500 years of habitation than in
the previous 8500 years (see also Johnson 1979: 24, 39);• the artefact accumulation rate for the uppermost level of the Capertian phase (V) is
similar to that for the lowest level of the Bondaian phase (IV).The highest average annual growth rate (+0.15%) was in Phase I, which lasted from ca
600 BP to ca 100 BP (Table A4/28). The only decreases in the artefact accumulation rate and the average annual growth rates were those associated with the sterile layer between PhasesIV and V.
Kings TablelandInitial habitation associated with a radiocarbon date of 22,400±1000 BP (SUA-158) is represented by only a single artefact in level 21, but the three overlying levels, whichtogether with Level 21 comprise Phase VII, have higher numbers (10, 8, 28) (Table A4/29).More than one artefact is thus present below Level 19, which was radiocarbon-dated to 14,534±300 BP (SUA-194). Evidence for earliest occupation at this site is scant, but incontrast to Johnson (1979: 28–9) and Bowdler (1981: 102), I do not discount occupation atabout 22,000 BP. Two main cultural components were identified which, based on a depth/agecurve, date from about 24,000 BP to 12,400 BP, and from 1250 BP to contact. The twoassemblages were separated by a sterile zone about 10cm deep, partly in Level 17 and partlyin Level 18 (Stockton and Holland 1974: 64). Stockton (1993: 34) attributes the gap between thetwo components to removal of deposits by storm water about 1000 years ago.
The upper component had a much greater sedimentation rate than the earliercomponent, particularly levels 6 to 17, where about 70cm of deposit accumulated insomewhere between one and possibly 300 years (see Johnson 1979: 29 for discussions andalternative interpretations).
Artefact accumulation rates. Assuming that a major disturbance did not occur (Johnson1979: 29), the depth/age curve and artefact accumulation rates for the upper deposit (Fig. 7.18and Table A4/29) suggest that for a short (but possibly up to 200 years long) period about 1100BP, the artefact accumulation rate was very much higher than in either the final habitationphases (I and II) or the earliest phase (VII).

Average annual growth rates could be calculated for only the most recent phases (I andII). These both had negative values, that for Phase II between ca 1050 BP and ca 750 BP(-0.46%) indicating a dramatic decrease (Table 4/29).
Walls CaveAs at Kings Tableland, two habitation components were identified at Walls Cave. The earlierwas a small assemblage associated with a radiocarbon date of 12,000±350 BP (Gak-3448)(Stockton and Holland 1974; Stockton 1993: 36–7). This was separated by some 50cm of sterilesediment from the later component, which dates from ca 4000 BP possibly to contact.
Artefact accumulation rates and average annual growth rates were calculated for only the upper unit, assuming a constant rate of sediment accumulation throughout the period (Fig. 7.19, Table A4/30). These figures suggest that in the most recent habitation phase therewas a very slight decrease in the artefact accumulation rates, which is not consideredsignificant and is assumed to represent stability in use.
Capertee 1 and 3Capertee 1 and 3, on the western side of the Blue Mountains, were excavated in the 1960s by F.D. McCarthy (1964b) and re-excavated in the 1970s by Ian Johnson (1979). Initial habitation ofCapertee 3 was dated to 7360±125 (V18) (Johnson 1979: Table 16), but no radiocarbon dateswere obtained for Capertee 1.
McCarthy’s distribution table (1964b: Table 3) includes ‘only “tools” and a smallselection of “waste”’ (Johnson 1979: 41), and relevant information is not available on which tocalculate artefact accumulation rates for each millennium for the materials he recovered (butsee Hiscock and Attenbrow [in press, Table 76 and 81] for discard rates for retouched flakesand backed artefacts). McCarthy’s artefact distribution table suggests, if it is accepted asindicative of the total assemblage size in each level, that there was a decrease in the number ofartefacts recovered in the upper spits at Capertee 1 and 3 (see also Johnson 1979: 43).
Artefact densities. Johnson presented artefact densities (artefacts/kilo of deposit,implements/kilo of deposit) for his excavations at Capertee 3 (Johnson 1979: Figs 34 and 35;Fig. 35 is reproduced as my Fig. 7.20). If the variations in artefact densities reflect changes inartefact accumulation rates then these figures also indicate that in the last 1000 years BP therewas a continuing decrease in artefacts accumulated at Capertee 3.
Shaws Creek K1 and K2Shaws Creek K1 and K2 are near Emu Plains, adjacent to a tributary of the Nepean River at thebase of the Blue Mountains eastern escarpment.
Shaws Creek K1 was excavated by Stockton (1973). No radiocarbon dates are available, butassemblages in the upper levels are typically Bondaian, and those in the lower levels (8 to 10)are described by Stockton (1973: 112) as ‘archaic’ and by Johnson (1979: 26) as havingsimilarities with Capertian assemblages at Springwood Creek.
Artefact densities. In the absence of spit depths, I divided the estimated volumes forPhases IV, V and VI (0.15, 0.15 and 0.25 cu m) evenly to calculate artefact densities for thelevels in each of these phases (Fig. 7.21 and Table A4/31). Variations in the artefact densities inthe 10 levels suggest that there was an initial increase in artefacts accumulated (levels 10 to 5),and a subsequent decrease in the upper levels. Level 2 has a higher artefact density than Level3, but it is still not as high as levels 4 and 5. Level 1 has a mixture of European and Aboriginalhabitation debris, and Stockton (1973: 112) considered the flaked stone artefacts in this level tobe displaced from lower deposits (see also discussions in Johnson 1979: 25–8, Fig. 6, Tables 2
terra australis 21
363
Appendix 4

and 4). The distribution of backed artefacts in Levels 1 to 8 (Stockton 1973: 113, Tables 1 and 2)suggests peak artefact densities were within the Bondaian phase, and that the decrease beganin the latter part of this phase.
Shaws Creek K2 was excavated from 1979 to 1980 by Kohen, Stockton and Williams (1981,1984). Evidence for occupation of this shelter goes back more than 15,000 years (14,700±250 BP[Beta-12423], Nanson et al. 1987: 76; Stockton 1993: 39). Charcoal for this date was associatedwith stone artefacts in the earliest part of Phase V in Soil Unit 3. Published information is notavailable on which artefact accumulation rates can be calculated (e.g., the actual number ofartefacts in each square and spit, and the area excavated in each spit which appears to beunequal), and artefact densities calculated by Kohen are used below.
Artefact densities. The density or concentration of artefacts per cubic metre of depositis provided for square A and for combined squares ABF, which are in undisturbed areas of theshelter deposits (Kohen et al. 1984: Table 7, reproduced in my Table A4/32). These figures
What’s changing: population size or land-use patterns? The archaeology of Upper Mangrove Creek, Sydney Basin
terra australis 21
364
TTaabbllee AA44//3311 Shaws Creek K1, NSW: number and density of artefacts in each level based on data from Stockton 1973 and
Johnson 1979: Tables 2 and 4. B indicates levels with backed artefacts; iittaalliiccss = highest number or rate; underline = period
with greatest increase.
PHASE LEVEL DEPTH ESTIMATED TOTAL NO. OF NO. OF ARTEFACTS
(cm) VOLUME ARTEFACTS PER CUBIC METRE
m3
I 1 0– 5 0.05 36 B 720
II 2 5–15 0.10 872 B 8720
III 3 15–25 0.10 492 B 4920
IV 4) 25-40 0.15 988 B 13,173 ) 1177,,992200
5) 11770000 B 22,667 )
V 6) 40-55 0.15 930 B 12,430 ) 11,040
7) 726 B 9680 )
VI 8) 55-80 0.25 398 B 3980 )
9) 255 2550 ) 2724
10) 28 560 )
TTaabbllee AA44//3322 Shaws Creek K2, NSW: density of artefacts in each unit based on data from Kohen et al. 1984: 67, Table 7. IIttaalliiccssindicates highest number or rate; underline = period with greatest/most dramatic increase.
SOIL PHASE SQUARES ABF SQUARE A ONLY KOHEN’S ESTIMATED
UNIT NO./m3 NO./m3 DEPTH (cm) DATES (YEARS BP)
6 I 5743 2240 0–155
8420 5–115
5/6 II 77882200 99553333 15–130 1700
5 III 3177 6242 30–145 2200
4 IV 110 60 45–160 4100
160 60–170 7900
3 V 1000 5529 70–185 13,000
60 85–105
2 VI 865 910 105–125
1 607 125–150

show variations throughout the ca 15,000 years of habitation. Two peaks occur — one in PhaseV in the Capertian levels and the other in Phase II in the Bondaian levels (Fig. 7.22). Phase II isplaced at ca 1700 BP and Phase V at ca 13,000 BP by Kohen et al. (1981: 66; 1984: Table 7; Kohen1986: Table 6.1).
Figures based only on Square A suggest that densities in the first part of Phase I werealmost as high as Phase II (8420/cu m and 9533/cu m respectively) followed by a dramaticdrop to 2240/cu m in the second part of Phase I. Even though there is obvious spatial variationin artefact densities across the shelter floor, and the figures for Square A and Squares ABFindicate the magnitude of the differences, both sets of data indicate similar trends over timeand include a decrease in the uppermost levels.
Comment: Blue Mountains and adjacent areasHuman occupation of the Blue Mountains extends back at least 22,000 years, albeit itspresent late-Pleistocene/early-Holocene representation by small assemblages and periodsof site abandonment. All sites indicate more substantial late-Holocene occupation.
Of the three sites in the Blue Mountains where artefact accumulation rates werecalculated, one site had a substantial increase in the last 600 years (Springwood Creek), onesite had a short period of massive accumulation about 1000 years BP and a subsequentdecrease in the last 1000 years (Kings Tableland); and the third site (Walls Cave) shows arelatively steady rate over the last 4000 years. The Springwood Creek sequence suggestedto Johnson (1979: 39) that ‘use of the plateau area may only have reached its contact-periodintensity during the recent past’. In making this statement on the basis of his recalculatedfigures from Springwood Creek, Johnson seemed to be assuming that the regionalpopulation size at contact was greater than in previous periods. Evidence from KingsTableland suggests decreasing artefact accumulation rates occurred in the most recentperiod there, and it could be, for example, that events at Kings Tableland offset those atSpringwood Creek. The number of excavated sites involved is too small, the artefactnumbers are too low and the area too big for valid statements to be made about variationsin the habitation levels on a regional scale. However, even if the evidence can be interpretedas a decrease in the ‘intensity of use’ of the plateau area in the most recent period, Johnson’sstatement ‘that use of the plateau area may only have reached its contact-period intensityduring the recent past’ is still valid.
All sites where only artefact densities were available have decreased values in theiruppermost levels (Capertee 1 and 3 to the west of the Blue Mountains, and Shaws Creek K1and K2 at the base of the eastern escarpment). The sequences at Capertee 1 and ShawsCreek K1 were undated, but in Capertee 3 and Shaws Creek K2, the decreased artefactdensities occurred within the last 1000 years and 2000 years respectively.
South-western VictoriaAt the time of Lourandos’ study, very few deep stratified archaeological deposits had beenexcavated in south-western Victoria and his evidence from this region came from twoexcavated sites — Seal Point and Bridgewater.
BridgewaterAt Bridgewater, two cultural units were distinguished in the archaeological deposit: an upperUnit C and a lower Unit A. Outside the rockshelter, these two units are separated by a zone ofsterile rockfall (Unit B), which may be partial collapse of the overhang as it is not presentinside the rockshelter (Lourandos 1983a: 83). A date of 11,390±310 BP (Beta-3923) comes fromUnit A in the rockshelter at a depth of ca 65cm. Outside the shelter, cultural materials extend toa maximum depth of ca 3m, and it is probable that the rockshelter was first inhabited earlier
365
Appendix 4
terra australis 21
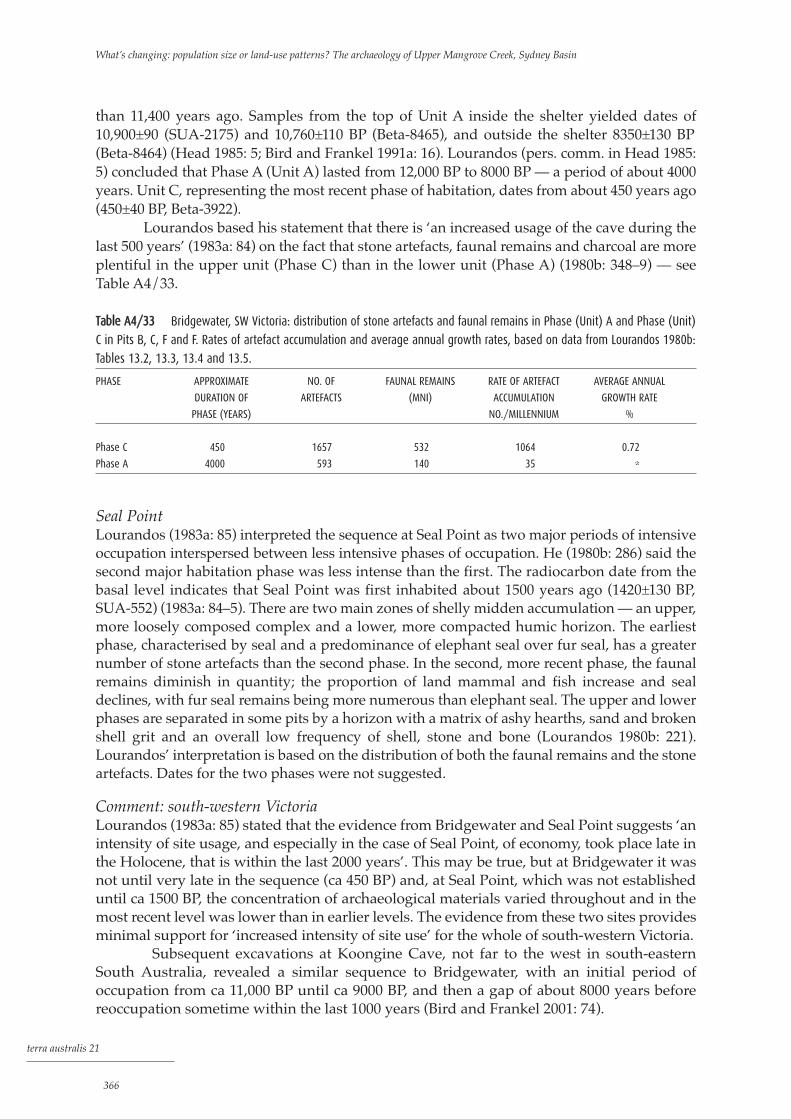
than 11,400 years ago. Samples from the top of Unit A inside the shelter yielded dates of10,900±90 (SUA-2175) and 10,760±110 BP (Beta-8465), and outside the shelter 8350±130 BP(Beta-8464) (Head 1985: 5; Bird and Frankel 1991a: 16). Lourandos (pers. comm. in Head 1985:5) concluded that Phase A (Unit A) lasted from 12,000 BP to 8000 BP — a period of about 4000years. Unit C, representing the most recent phase of habitation, dates from about 450 years ago(450±40 BP, Beta-3922).
Lourandos based his statement that there is ‘an increased usage of the cave during thelast 500 years’ (1983a: 84) on the fact that stone artefacts, faunal remains and charcoal are moreplentiful in the upper unit (Phase C) than in the lower unit (Phase A) (1980b: 348–9) — seeTable A4/33.
TTaabbllee AA44//3333 Bridgewater, SW Victoria: distribution of stone artefacts and faunal remains in Phase (Unit) A and Phase (Unit)
C in Pits B, C, F and F. Rates of artefact accumulation and average annual growth rates, based on data from Lourandos 1980b:
Tables 13.2, 13.3, 13.4 and 13.5.
PHASE APPROXIMATE NO. OF FAUNAL REMAINS RATE OF ARTEFACT AVERAGE ANNUAL
DURATION OF ARTEFACTS (MNI) ACCUMULATION GROWTH RATE
PHASE (YEARS) NO./MILLENNIUM %
Phase C 450 1657 532 1064 0.72
Phase A 4000 593 140 35 *
Seal PointLourandos (1983a: 85) interpreted the sequence at Seal Point as two major periods of intensiveoccupation interspersed between less intensive phases of occupation. He (1980b: 286) said thesecond major habitation phase was less intense than the first. The radiocarbon date from thebasal level indicates that Seal Point was first inhabited about 1500 years ago (1420±130 BP,SUA-552) (1983a: 84–5). There are two main zones of shelly midden accumulation — an upper,more loosely composed complex and a lower, more compacted humic horizon. The earliestphase, characterised by seal and a predominance of elephant seal over fur seal, has a greaternumber of stone artefacts than the second phase. In the second, more recent phase, the faunalremains diminish in quantity; the proportion of land mammal and fish increase and sealdeclines, with fur seal remains being more numerous than elephant seal. The upper and lowerphases are separated in some pits by a horizon with a matrix of ashy hearths, sand and brokenshell grit and an overall low frequency of shell, stone and bone (Lourandos 1980b: 221).Lourandos’ interpretation is based on the distribution of both the faunal remains and the stoneartefacts. Dates for the two phases were not suggested.
Comment: south-western VictoriaLourandos (1983a: 85) stated that the evidence from Bridgewater and Seal Point suggests ‘anintensity of site usage, and especially in the case of Seal Point, of economy, took place late inthe Holocene, that is within the last 2000 years’. This may be true, but at Bridgewater it wasnot until very late in the sequence (ca 450 BP) and, at Seal Point, which was not establisheduntil ca 1500 BP, the concentration of archaeological materials varied throughout and in themost recent level was lower than in earlier levels. The evidence from these two sites providesminimal support for ‘increased intensity of site use’ for the whole of south-western Victoria.
Subsequent excavations at Koongine Cave, not far to the west in south-easternSouth Australia, revealed a similar sequence to Bridgewater, with an initial period ofoccupation from ca 11,000 BP until ca 9000 BP, and then a gap of about 8000 years beforereoccupation sometime within the last 1000 years (Bird and Frankel 2001: 74).
What’s changing: population size or land-use patterns? The archaeology of Upper Mangrove Creek, Sydney Basin
terra australis 21
366

Lower Murray Valley, South Australia Three published excavated sites with deep sequences and in relative proximity to each otheroccur in the lower Murray Valley: Devon Downs and Fromms Landing 2 and 6. Artefactaccumulation rates for these sites are discussed below.
Devon DownsMaterial from this site, originally excavated by Hale and Tindale (1930), was re-examined bySmith (1982), who presented data on the ‘total numbers of artefacts’ as well as othercomponents of the assemblages in the six analytical units of Trench C.
Considerable variation in the distribution of stone artefacts occurs throughout the 6mdepth of stratified deposit, which spans 6000–5000 years of habitation. Smith’s (1982: 110, Fig. 3)analyses show that there were marked rises in the number of stone artefacts and in the totalweight of stone in Units 5 and 4, and that the numbers drop dramatically in Unit 2 and remainsimilarly low in Unit 1. This trend is also seen in the retouched artefacts, unmodified flakesand cores. Ochre is markedly concentrated in Unit 4 and the faunal remains (according tocounts of the minimum numbers of individuals [MNI]) are concentrated in Units 5, 4 and 3.Smith (1982: 114) argued that the idea of changes ‘in the intensity of site use’ is supported bythe very similar distributions through time in the various types of archaeological remains. Theperiod in which Smith (1982: 114–15) says ‘the shelter was used more intensively’, i.e., 4000 BPto 2000 years ago, is represented by Units 4 and 3, which contain the highest numbers ofartefacts (both have twice the number of Unit 5).
Artefact accumulation rates are based on data provided by Smith (1982) and assume thearea of each excavated unit was roughly equal (Fig. 7.23, Table A4/34). These rates follow thesame trends as the figures presented by Smith. Units 4 and 3 had the highest artefactaccumulation rates (Unit 4 had the highest). The artefact accumulation rate increasedmarkedly in Unit 5, but more substantially in Unit 4. There is a dramatic decrease after Unit 3to the lowest rates in Units 2 and 1.
The highest average annual growth rates were in Unit 5 (+0.11% p.a. between ca 4800 BPand ca 3800 BP) and in Unit 4 (+0.1% p.a. between 3800 BP and 2900 BP); that is, there weretwo successive periods in the sequence where the growth rates increased substantially (TableA4/34). The decrease in the artefact accumulation rate after 2000 BP (in Unit 2) also involved adramatic decrease in the average annual growth rate (-0.3%).
TTaabbllee AA44//3344 Devon Downs (Trench C), lower Murray Valley, South Australia: rates of artefact accumulation and average
annual growth rates based on data from Smith 1982. Bracketed figures represent number of unifacial points retrieved in unit.IIttaalliiccss indicates highest number or rate; underline = period with greatest/most dramatic increase.
UNIT RADIOCARBON AGES D/A DATES DURATION NO. OF RATE OF ARTEFACT AVERAGE ANNUAL
YEARS BP LAB. NO. YEARS BP (YEARS) ARTEFACTS ACCUMULATION GROWTH RATE
NO./MILLENNIUM %
1 1200–1100 1100 25 23 -0.08
2 1900–1200 700 38 54 -0.30
3 2900–1900 1000 500 (2) 500 -0.02
4 2980±90 Gak-1021
3460±100 Gak-1022 3800–2900 900 553388 (1) 559988 +0.10
5 4360±110 Gak-1023
4290±140 L-217G 4800–3800 1000 250 (13) 250 ++00..1111
6 5180±100 Gak-1024 6300–4800 1500 130 (6) 87 **
terra australis 21
367
Appendix 4

Fromms Landing 2Fromms Landing 2 (18km downstream from Devon Downs) has a near basal date of 4850±100 BP(R-456/1, NZ-364) (Mulvaney 1960: 70, 1975: 290). At this site, Smith (1982: 114) said there was a
comparable increase in intensity of site use beginning about 4000 years BP, although themarked decline in the amount of occupational debris noted at Devon Downs in the recent levelsis not matched.
The vertical distribution of artefacts at Fromms Landing 2 (Mulvaney 1960: Table 1;my Table A4/35) suggests a fluctuating increase in the number of artefacts accumulated overtime, with the highest figure in Level 0 (the uppermost analytical level). However, thedimensions of the excavated trench varied in width and depth along its length. The width ofthe area excavated each season varied from 7 feet (215cm) in 1956 to 11 feet (335cm) in 1958,except for the first 2 feet (61cm) in depth, where it was 14 feet (427cm) wide (Mulvaney 1960:59). The composite trench was 32 feet (975cm) long at the surface of the deposit but the backwall of the rockshelter (bedrock) sloped outwards so that with depth the trench decreased inlength (Mulvaney 1960: Fig. 3). The area over which Levels 0, 1, 2 and 3 extended was aboutone-third greater than the area of Levels 4 to 6, which was greater again than the area of Levels7 to 11. Estimated length measurements are given in Table A4/35. Each level also varied indepth, but the measurements were not given.
TTaabbllee AA44//3355 Fromms Landing 2, lower Murray Valley, South Australia: number of artefacts in each level, radiocarbon dates and
approximate length of pit, based on data from Mulvaney 1960: 65, 70, Table 1, Fig. 3; Mulvaney et al. 1964: Table 3; Roberts and
Pate 1999: Table 1. IIttaalliiccss indicates highest number or rate; underline = period with greatest/most dramatic increase.
LEVEL RADIOCARBON AGES NO. OF APPROXIMATE
YEARS BP LAB. NO. ARTEFACTS LENGTH OF PIT (cm)
0 660099 975
1 201 975
2 601 975
3 487 700–760
4 3240±80 R-456/2 (NZ-365) 55 700–760
5 322 670
6 3750±85 P-308 508 670
7 279 550–610
8 3870±85 P-309 169 550–610
9 4050±85 P-311 112 550–610
10 4850±100 R-456/1 (NZ-364) 72 550–610
11 8 550
Since all dimensions for each level were not available and were so obviously variable,I did not calculate artefact accumulation rates. If allowance is made for the extra area in theupper levels, artefact densities and accumulation rates are unlikely to be as high in the upperlevels (relative to the lower levels) as suggested by the raw figures in Mulvaney’s Table 1(1960). Whether there was a decline or increase in the artefact accumulation rates in the upperlevels cannot be stated from the published information.
Fromms Landing 6This rockshelter, ca 400m from Fromms Landing 2, has a near basal date of 3450±90 BP (NPL-63) (Mulvaney et al. 1964: 490). Level 11 has a date of 3170±94 BP (NPL-29) and Level 8 a dateof 2950±91 BP (NPL-28). The depth of every level is not given and the section of the excavated
What’s changing: population size or land-use patterns? The archaeology of Upper Mangrove Creek, Sydney Basin
terra australis 21
368

deposit suggests the area of each level varied markedly (becoming smaller with depth)(Mulvaney et al. 1964: Fig. 2). However, the vertical distribution of artefacts and the radiocarbondates (Mulvaney et al. 1964: Table 1) suggest that the upper levels (6–1) had a much lowernumber of artefacts than the middle levels (11–7).
Artefact accumulation rates and average annual growth rates based on the available dataprovide a rough substantiation of these conclusions (Table A4/36). They indicate a decrease inboth the accumulation rate and the growth rate in the more recent period of the rockshelter’shabitation; say, within the last 3000 years BP.
TTaabbllee AA44//3366 Fromms Landing 6, lower Murray Valley, South Australia: rates of artefact accumulation and average annual
growth rates based on data from Mulvaney et al. 1964: 490, Table 1. IIttaalliiccss indicates highest number or rate; underline =
period with greatest/most dramatic increase.
LEVEL RADIOCARBON AGES DEPTH DURATION ‘TOTAL FLAKES RATE OF ARTEFACT AVERAGE ANNUAL
YEARS BP LAB. NO. (cm) (YEARS) ETC’ ACCUMULATION GROWTH RATE
NO./MILLENNIUM %
1 15 )
2 19 )
3 3 )
4 2850 31 ) 208 73 -0.14
5 0 )
6 8 )
7 132 )
8 2950±91 NPL-28 137 336633 )
9 249 )
10 220 279 ) 11005522 44778822 ++00..994411 3170±94 NPL-29 214 161 )
12 65 )
13 24 )
14 280 42 ) 170 611
15 3 )
16 3450±90 NPL-63 275 36 )
17 41
18A 8
18B 5
Summary: Lower Murray ValleyIn two sites in the lower Murray valley (Devon Downs and Fromms Landing 6), dramaticdecreases occurred in the artefact accumulation rates of the uppermost levels — after ca 1900BP at Devon Downs, and ca 3000 BP at Fromms Landing 6. These changes also involvedsubstantial decreases in the average annual growth rate. At Fromms Landing 2, it was notpossible to state whether there was a decrease or increase in the artefact accumulation rate.
At Devon Downs, there were also substantial increases in the growth rate during theperiods ca 4800 BP to ca 3800 BP and ca 3800 BP to ca 1900 BP.
Central Queensland highlandsOf the 11 sites excavated in the central Queensland highlands, artefact accumulation rates (orthe information from which they can be calculated) were available for four — Native Well 1and 2, Kenniff Cave and The Tombs (Mulvaney and Joyce 1965; Morwood 1979, 1981, 1984).
terra australis 21
369
Appendix 4
Native Well 1Native Well 1 has a near basal date of 10,910±140 BP (ANU-2034), from which Morwood (1981:27) extrapolated an initial habitation date of ca 13,000 BP; deposition rates, however, weretaken to ca 14,000 BP (1981: Fig. 23). Morwood (1981: 29–31) divided the stone artefactassemblages into three industries: the earliest, the Core and Scraper Industry (spits 16 to 8)lasting from ca 13,000 BP to ca 4300-4200 BP; the Small Tool Industry (spits 7 to 3) dating fromca 4300–4200 BP to ca 2300 BP; and the latest, the Recent Industry (spits 2 and 1) dating fromca 2300 BP to contact. Variation occurred throughout the depth of deposit in the number ofimplements (tools) and artefacts in each spit.
Implement accumulation rates. Morwood (1981: 32) briefly discussed implementdeposition rates and variations in the rate of implement deposition in each 100 years areshown in Morwood’s (1981) Figure 23 (see my Fig. A4/1). However, his discussions (1981:28–31) about the stone assemblages refer principally to variations in the number of artefacts orimplements per spit, noting the following changes throughout the depth of deposit: 1. in spits 16 to 8, in the lower half of the deposit: ‘The number of tools/spit … peaks in
Spit 12 … Above this spit there are very few artefacts until spit 7’ (1981: 28);2. from spit 7 to spit 4, ‘the number of implements/spit increases rapidly… then declines’
(1981: 28);3. ‘at 50–60cm depth there was a sudden increase in the number of artefacts per spit’
(1981: 29–30) (spit 7 is at this depth);4. spits 1 and 2, which accumulated during the last 2300 years, had ‘a marked decrease
in the number of artefacts and waste flakes/spit, the deletion of many implementtypes from the assemblage, and a minimum 48% decrease in the rate of sedimentaccumulation’ (1981: 31; see also 1984: 354).In terms of total artefact numbers, spits 7 and 8 have similar totals (456 and 410
respectively), and spit 6 rather than spit 7 has a substantial increase (Morwood 1981: Table 11,see my Table A4/37), with greater increases in spit 5 (after the gap in occupation) and spit 4.Morwood’s implement accumulation rates, however, indicate that it is only in spit 5 that adramatic increase occurred, though the trend towards increasing implement accumulation ratesbegan much earlier — after spit 11 (1981: Fig. 23; see my Fig. A4/1).
Morwood’s depth/age curve (1981: Fig. 19) indicates that spit 6 accumulated over theperiod ca 4500 BP to ca 4200 BP, spit 7 between ca 5000 BP to ca 4500 BP, and spit 2 began toaccumulate about 2300 BP. Based on these dates, implement accumulation rates wererelatively low and fluctuating until ca 4000 BP; the highest rate occurred in the latter part ofthe fourth millennium BP/first half of the third millennium BP, but the most dramatic increasewas in the first half of the fourth millennium BP; and, in the latter half of the third millenniumBP/second millennium BP, two dramatic decreases of similar magnitude occurred. Accumulationrates were very low in the last 2000 years.
Artefact accumulation rates were calculated using Morwood’s data (1981: Table 11 andFig. 23). Trends in the artefact accumulation rates (Fig. 7.24, Table A4/37) are similar to thosein the implement accumulation rates, though there are some variations: rates in the lower spits(>4500 BP) increased gradually, with only one decrease (rather than fluctuating); spits 5 and 6had similar rates (rather than spit 5 having a much higher rate); spit 4 still had the highest rateof accumulation; the most dramatic increase did not occur until spit 4 (rather than spit 5); anddramatic decreases in the last 2860 years are still apparent.
The highest average annual growth rate (+0.27%) occurred between ca 4500 BP and ca4200 BP (spit 6), although there were also high growth rates between ca 6500 BP and ca 5935BP (spit 10 with +0.21%) and between ca 3435 BP and ca 2865 BP (spit 4 with +0.13%) (TableA4/37). Substantial decreases (-0.1%) prevailed between ca 2865 BP and ca 1175 BP.
What’s changing: population size or land-use patterns? The archaeology of Upper Mangrove Creek, Sydney Basin
terra australis 21
370

TTaabbllee AA44//3377 Native Well 1, central Queensland highlands: rates of implement accumulation, rates of artefact accumulation
and average annual growth rates based on data from Morwood 1979 and Morwood 1981: Figure 23 and Table 11. B indicates
backed artefacts, P = pirri points recovered from these spits; iittaalliiccss = highest number or rate; underline = period with
greatest/most dramatic increase.
SPIT RADIOCARBON AGES D/A DATES DURATION IMPLEMENT NO. OF ARTEFACT AVERAGE ANNUAL
YEARS BP LAB. NO. YEARS BP (YEARS) ACCUMULATION ARTEFACTS ACCUMULATION GROWTH RATE
RATE (NO./CENT.) RATE (NO./MILL.) %
1 1175– 1100 1075 1.2 492 B 458 -0.05
2 1270±70 ANU-2002 2300– 1175 1125 3.6 912 B 811 -0.10
3 2865– 2300 565 17.0 1357 B 2402 -0.10
4 3435– 2865 570 3333..00 22446699 BB 44333322 +0.13
5 4000– 3435 565 24.0 1192 BP 2110 *STERILE 4200– 4000 200 0 0 0 -100.00
6 4230±90 ANU-2171 4520– 4200 320 5.1 729 BP 2278 ++00..2277
4320±90 ANU-2003
7 4990– 4520 470 2.2 456 BP 970 +0.02
8 5465– 4990 475 2.0 410 863 +0.03
9 5935– 5465 470 1.0 356 757 +0.04
10 6190±100 ANU-2001 6495– 5935 560 1.7 348 621 +0.21
11 7783– 6497 1286 0.9 244 190 -0.05
12 9070– 7783 1287 4.0 476 370 +0.04
13 10,295– 9070 1225 1.7 285 233 +0.07
14 10,910±140 ANU-2034 11,431–10,295 1136 0.9 109 96 +0.04
15 12,747–11,431 1316 1.6 84 64 +0.07
16 14,034–12,747 1287 0.7 29 23
terra australis 21
371
Appendix 4
FFiigguurree AA44//11 Native Well 1, central Queensland highlands: rates of implement accumulation. Redrawn from Morwood 1981:Fig 23.
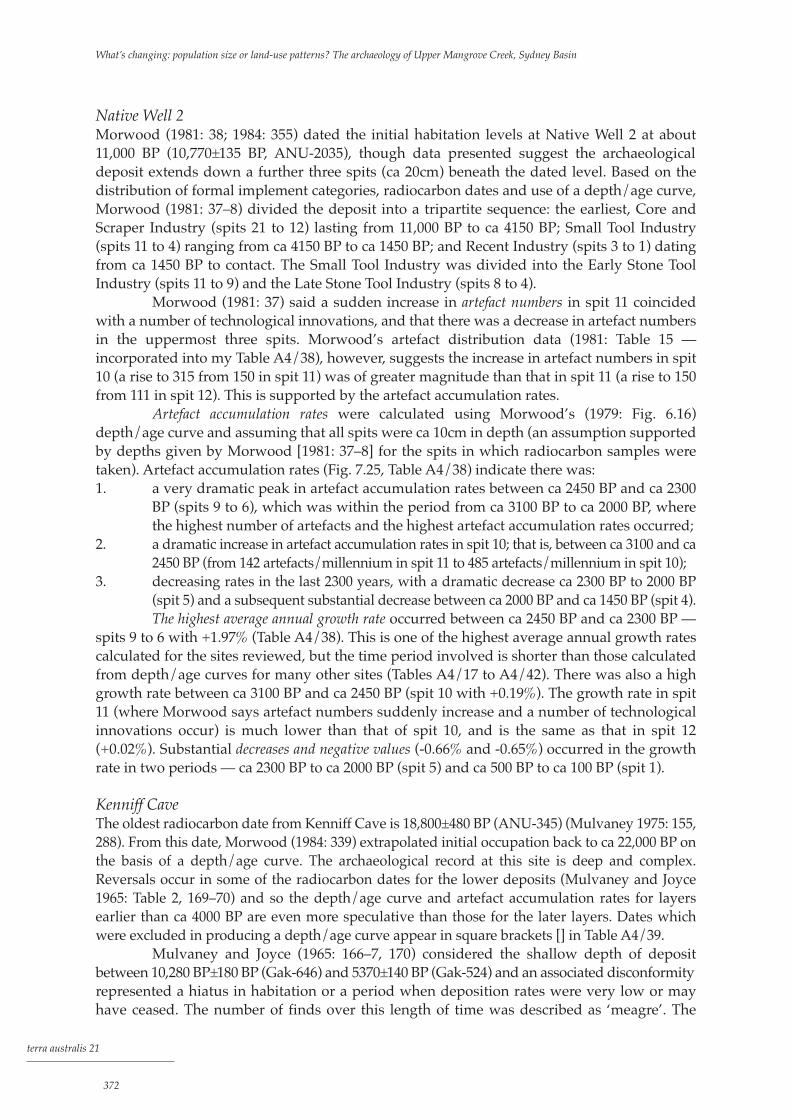
Native Well 2Morwood (1981: 38; 1984: 355) dated the initial habitation levels at Native Well 2 at about11,000 BP (10,770±135 BP, ANU-2035), though data presented suggest the archaeologicaldeposit extends down a further three spits (ca 20cm) beneath the dated level. Based on thedistribution of formal implement categories, radiocarbon dates and use of a depth/age curve,Morwood (1981: 37–8) divided the deposit into a tripartite sequence: the earliest, Core andScraper Industry (spits 21 to 12) lasting from 11,000 BP to ca 4150 BP; Small Tool Industry(spits 11 to 4) ranging from ca 4150 BP to ca 1450 BP; and Recent Industry (spits 3 to 1) datingfrom ca 1450 BP to contact. The Small Tool Industry was divided into the Early Stone ToolIndustry (spits 11 to 9) and the Late Stone Tool Industry (spits 8 to 4).
Morwood (1981: 37) said a sudden increase in artefact numbers in spit 11 coincidedwith a number of technological innovations, and that there was a decrease in artefact numbersin the uppermost three spits. Morwood’s artefact distribution data (1981: Table 15 —incorporated into my Table A4/38), however, suggests the increase in artefact numbers in spit10 (a rise to 315 from 150 in spit 11) was of greater magnitude than that in spit 11 (a rise to 150from 111 in spit 12). This is supported by the artefact accumulation rates.
Artefact accumulation rates were calculated using Morwood’s (1979: Fig. 6.16)depth/age curve and assuming that all spits were ca 10cm in depth (an assumption supportedby depths given by Morwood [1981: 37–8] for the spits in which radiocarbon samples weretaken). Artefact accumulation rates (Fig. 7.25, Table A4/38) indicate there was: 1. a very dramatic peak in artefact accumulation rates between ca 2450 BP and ca 2300
BP (spits 9 to 6), which was within the period from ca 3100 BP to ca 2000 BP, wherethe highest number of artefacts and the highest artefact accumulation rates occurred;
2. a dramatic increase in artefact accumulation rates in spit 10; that is, between ca 3100 and ca2450 BP (from 142 artefacts/millennium in spit 11 to 485 artefacts/millennium in spit 10);
3. decreasing rates in the last 2300 years, with a dramatic decrease ca 2300 BP to 2000 BP(spit 5) and a subsequent substantial decrease between ca 2000 BP and ca 1450 BP (spit 4).The highest average annual growth rate occurred between ca 2450 BP and ca 2300 BP —
spits 9 to 6 with +1.97% (Table A4/38). This is one of the highest average annual growth ratescalculated for the sites reviewed, but the time period involved is shorter than those calculatedfrom depth/age curves for many other sites (Tables A4/17 to A4/42). There was also a highgrowth rate between ca 3100 BP and ca 2450 BP (spit 10 with +0.19%). The growth rate in spit11 (where Morwood says artefact numbers suddenly increase and a number of technologicalinnovations occur) is much lower than that of spit 10, and is the same as that in spit 12(+0.02%). Substantial decreases and negative values (-0.66% and -0.65%) occurred in the growthrate in two periods — ca 2300 BP to ca 2000 BP (spit 5) and ca 500 BP to ca 100 BP (spit 1).
Kenniff CaveThe oldest radiocarbon date from Kenniff Cave is 18,800±480 BP (ANU-345) (Mulvaney 1975: 155,288). From this date, Morwood (1984: 339) extrapolated initial occupation back to ca 22,000 BP onthe basis of a depth/age curve. The archaeological record at this site is deep and complex.Reversals occur in some of the radiocarbon dates for the lower deposits (Mulvaney and Joyce1965: Table 2, 169–70) and so the depth/age curve and artefact accumulation rates for layersearlier than ca 4000 BP are even more speculative than those for the later layers. Dates whichwere excluded in producing a depth/age curve appear in square brackets [] in Table A4/39.
Mulvaney and Joyce (1965: 166–7, 170) considered the shallow depth of depositbetween 10,280 BP±180 BP (Gak-646) and 5370±140 BP (Gak-524) and an associated disconformityrepresented a hiatus in habitation or a period when deposition rates were very low or mayhave ceased. The number of finds over this length of time was described as ‘meagre’. The
What’s changing: population size or land-use patterns? The archaeology of Upper Mangrove Creek, Sydney Basin
terra australis 21
372

terra australis 21
373
Appendix 4
TTaabbllee AA44//3388 Native Well 2, central Queensland highlands: rates of artefact accumulation and average annual growth rates
based on data from Morwood 1979, 1981: Table 15. B indicates backed artefacts, P = pirri points recovered from these spits;iittaalliiccss indicates highest number or rate; underline = period with greatest/most dramatic increase.
SPIT RADIOCARBON AGES D/A DATES DURATION NO. OF RATE OF ARTEFACT AVERAGE ANNUAL
YEARS BP LAB. NO. YEARS BP (YEARS) ARTEFACTS ACCUMULATION GROWTH RATE
(NO./MILLENNIUM) %
1 500–10,100 400 5 13 -0.66
2 1000–10,500 500 92 184 -0.16
3 1450–1.1000 450 182 404 -0.10
4 2000– ,1450 550 349 B 635 -0.12
5 2170±80 ANU-2117 2300– ,2000 300 375 B 1250 -0.65
6) –2300) 358 B )
7) ) 447711 B )
8) ) 150 204 B ) 99004400 ++11..9977
9) 2450– ) 323 PB)
10 2470±80 ANU-2091 3100– ,2450 650 315 PB 485 +0.19
11 4150– ,3100 1050 150 PB 142 +0.02
12 5100– ,4150 950 111 117 +0.02
13 6100– ,5100 1000 102 102 -0.02
14 7100– ,6100 1000 125 125 +0.01
15 8100– ,7100 1000 117 117 -0.04
16 9100– ,8100 1000 172 172 -0.01
17 10,150– ,9100 1050 195 186 -0.04
18 10,770±135 ANU-2035 11,300–10,150 1150 140 121 +0.16
19 12,400–11,300 1100 23 21 +0.05
20 13,500–12,400 1100 13 12 -0.07
21 14,500–13,500 1000 27 27
TTaabbllee AA44//3399 Kenniff Cave, central Queensland highlands: rates of artefact accumulation and average annual growth rates
based on data from Mulvaney and Joyce 1965: Tables 2 and 3; Mulvaney 1975: 155, 288. B indicates backed artefacts; p =
points; P = Pirri points; E = Elouera recovered in these layers; iittaalliiccss indicates highest number or rate; underline = period with
greatest/most dramatic increase.
LAYER DEPTH RADIOCARBON AGES D/AGE DATES DURATION NO. OF RATE OF ARTEFACT AVERAGE ANNUAL
1964 (cm) YEARS BP LAB. NO. YEARS BP (YEARS) ARTEFACTS ACCUMULATION GROWTH RATE
NO./MILLENNIUM %
11--66 11770000–– 110000 11660000 22118811 11336633 ++00..0022
1 0– 10 400– 100 300 515 1717
2 10– 19 800– 400 400 767 1918
3 19– 32 1050– 800 250 428 1712
4 32– 36 1350– 1050 300 186 620
5 36– 41 1550– 1350 200 89 445
6 41– 43 1600±100 Gak-522 1700– 1550 150 196 1307

What’s changing: population size or land-use patterns? The archaeology of Upper Mangrove Creek, Sydney Basin
terra australis 21
374
TTaabbllee AA44//3399 (Continued)
LAYER DEPTH RADIOCARBON AGES D/AGE DATES DURATION NO. OF RATE OF ARTEFACT AVERAGE ANNUAL
1964 (cm) YEARS BP LAB. NO. YEARS BP (YEARS) ARTEFACTS ACCUMULATION GROWTH RATE
NO./MILLENNIUM %
77--99 33550000–– 11770000 11880000 11773366 996644 --00..000044
7 43– 48 1850– 1700 150 714 4760
8 48– 61 2300– 1850 450 291 B 647
9 61– 79 2550±90 NPL-32 3500– 2300 1200 731 pB 609
1100--1111 33990000–– 33550000 440000 441155 11003388 --00..2255
10 79– 81 3800– 3500 300 262 pB 873
11 81– 84 3830±90 NPL-65 3900– 3800 100 153 pB 1530
1122--1144 44220000–– 33990000 330000 883377 22779900 ++00..0055
12 84– 91 3950– 3900 50 489 pB 9780
13 91– 95 4050– 3950 100 181 pE 1810
14 95–105 4130± 90 Gak-523 4200– 4050 150 167 pE 668
1155--1199 55220000–– 44220000 11000000 22339944 22339944 ++00..1111
15 105–109 592 pPE
16 109–122 570 pE
17 122–123 70
18 123–126 5020±90 NPL-66 736)
19 126–130 [4650±100 Gak-525] 426)
D I S C O N F O R M I T Y
2200--2233 1100,,880000–– 55220000 55660000 44666699 883344 --00..0022
20 130–138 5370±140 Gak-524 6500– 5200 1300 658 505
21 138–147 8000– 6500 1500 3002 2001
22 147–156 9900– 8000 1900 637 335
23 156–164 10,280±180 Gak-646 10,800– 9900 900 372 413
2244--2266 1122,,665500––1100,,880000 11885500 33885555 22008844 ++00..0011
24 164–174 11,800–10,800 1000 265 265
25 174–180 12,250–11,800 450 1911 4247
26 180–188 12,610±110 NPL-67 12,650–12,250 400 1679 4198
2277--2299 1133,,770000––1122,,665500 11005500 11886611 11777722 ++00..0099
27/28 188–197 12,850–12,650 200 1490 7450
29 197–204 12,900±170 NPL-33 13,700–12,850 850 371 437
3300--3322 1166,,220000––1133,,770000 22550000 11779944 771188 --00..1100
30 204–213 14,800–13,700 1100 1152 1047
31 213–222 15,800–14,800 1000 279 279
32 222–226 16,130±140 NPL-68 16,200–15,800 400 363 908
3333--4422 1199,,330000––1166,,220000 33110000 22882277 991122 **33 226–239 16,500–16,200 300 250 833
34 239–244 16,675–16,500 175 477 2728
35 244–249 16,850–16,675 175 277 1583
36 249–257 17,070–16,850 220 138 627
37 257–264 17,290–17,070 220 92 418
38 264–272 17,510–17,290 220 77 350
39 272–284 [13,200±300 Gak-526] 17,950–17,510 440 449 1020
40 284–293 18,200–17,950 350 240 686
41 293–305 [9650±100 Gak-645] 18,500–18,200 300 337 1123
42 305–328 [9300±200 Gak-527]
‘336’ 18,800±480 ANU-345 19,300–18,500 800 490 613

vertical distribution of artefacts suggests the deposit between these dates was not sterile. Theartefact accumulation rate for this period (834/millennium, see Table A4/39) is slightly higherthan the rate for layers 30–32, which is the lowest rate for the sequence. Layers 20–23 and30–32 may be periods of very low sediment accumulation with lower artefact accumulationrates than other periods, the latter (if not both) being due to less frequent use of the rockshelterfor habitation or stone-working activities rather than total human avoidance.
Richardson’s (1992, 1996) conjoin analysis, which indicates vertical movements ofartefacts up to 50cm and in one case possibly up to 90cm (1996: 85), also adds anotherdimension to the complexity of the site’s archaeological record. However, the implications ofRichardson’s results for interpreting the overall distribution of artefacts and artefactaccumulation rates are not yet clear. The wide fluctuations in the artefact accumulation ratesfor individual layers could partly reflect original deposition rates as well as subsequent siteformation processes (Mulvaney and Joyce 1965: 164–7; Richardson 1992, 1996). Exceedinglyhigh accumulation rates occurred in five individual layers — 7, 12, 25, 26 and 27/28. Theserates may be due partially to the short durations assigned to them according to the depth/agecurve. In light of the foregoing knowledge, I graphed artefact accumulation rates andcalculated average annual growth rates for groups of layers between the radiocarbon datesonly and not for individual layers (Fig. 7.26).
Artefact accumulation rates. High accumulation rates occurred in both the Holoceneand Pleistocene levels. The highest artefact accumulation rate is in combined Layers 12–14dating from ca 4200 BP to ca 3900 BP. Very high accumulation rates also occurred in thepreceding period (Layers 15–19) and in combined Layers 24–26 dating from ca 12,650 BP to ca10,800 BP.
Although accumulation rates calculated by Hiscock (1986: 46) for unretouched flakesdeclined in the last 1600 years relative to the preceding period (i.e., 117 flakes/100 years fromca 1600 BP to contact in contrast with 197 flakes/100 years for the period ca 2500 BP to ca 1600BP), a slight increase is shown in artefact accumulation rates based on the total artefactnumbers taken from Mulvaney and Joyce’s (1965) Tables 2 and 3 (Fig. 7.26, Table A4/39).A substantial decreased accumulation rate is, however, seen in the period between ca 3900 BPand ca 3500 BP.
The highest average annual growth rate (+0.11%) was within a period with a highaccumulation rate (between ca 5200 BP and ca 4200 BP), but not the highest (Table A4/39).There was also a relatively high growth rate (+0.09%) in the Pleistocene, ca 13,700 to ca 12,650BP (Layers 29–27). A significant decline in the growth rate occurred between ca 3900 BP and ca3500 BP (-0.25%), though it was not associated with the lowest accumulation rates.
The TombsThis rockshelter was inhabited briefly about 9410 BP (Mulvaney and Joyce 1965) and notreoccupied until ca 4400 BP or ca 5000 BP (the latter dates are suggested by radiocarbon datesand a depth/age curve based on Mulvaney and Joyce 1965: Table 5).
Artefact accumulation rates. For a short period, between ca 3600 BP and ca 3400 BP, thehighest artefact accumulation rate occurred, but then, over the next 1100 years, the ratesdecreased dramatically (Fig. 7.27, Table A4/40). The final 2200 years saw a continuing butminor decrease.
The area of each layer of excavated deposit was not equal as the back wall slopesbackwards and is undercut, and large rocks were present (Mulvaney and Joyce 1965: 195–7,Fig. 24). Where the back wall is undercut, the deposit extends back further with depth and thearea excavated in the middle layers (3 and 4) was greater than in the upper layers. This mayaccount for the higher rates in Layer 3. However, Mulvaney and Joyce’s section drawings
terra australis 21
375
Appendix 4

(1965, Fig. 24) suggest that the additional deposit excavated due to the undercut back wall wasnot of such magnitude to account fully for the decreasing trends in the upper levels. Thedifference between the artefact accumulation rates in Layers 3A and 2 is so great (i.e., a ninefolddrop from 2050/millennium to 244/millennium) that a reduction in the artefact accumulationrate also must have been involved.
Average annual growth rates were highest in the period with the highest accumulationrates and the most dramatic increase in accumulation rates (Table A4/40).
Comment: central Queensland highlandsIn four of the central Queensland highland sites, a dramatic increase in the artefactaccumulation rate is followed by a dramatic decrease in the uppermost layers. At Kenniff Cave,where habitation began much earlier than in the other sites, the figures suggest thatsubstantial increases and decreases occurred in artefact accumulation rates in the late-Pleistocene/early-Holocene as well as in the late-Holocene.
At Kenniff Cave, the greatest increase and decrease in the artefact accumulation rates in theHolocene layers occurred earlier than at the other sites (i.e., between ca 5200 BP and ca 4200 BPfor the increase, and between ca 3900 BP and ca 3500 BP for the decrease). There is an increasein the accumulation rates in the uppermost layers (1–6) at Kenniff Cave but they do not reachthose of between ca 5200 BP and ca 3900 BP. At the other three sites, the timing of the dramaticincrease varied, but always occurred within the period ca 3600 BP to ca 2300 BP.
At The Tombs, the greatest decrease in the artefact accumulation rate began in the fourthmillennium BP (ca 3400 BP); at Native Wells 1 and 2 in the third millennium BP (ca 2900 BPand ca 2300 BP respectively). It therefore seems that major increases were occurring at somesites at the same time as major decreases were occurring at others.
At Native Well 2, Kenniff Cave and The Tombs, the highest average annual growth ratecoincided in time with the most dramatic increase in the artefact accumulation rate; at NativeWell 1, the highest growth rate occurred earlier. At Native Well 1 and 2 and The Tombs thegrowth rates declined in the uppermost levels. At Kenniff Cave, while there was a dramaticdecrease in the last 3900 years, the final 1700 years had a minor increase in the growth rate.
What’s changing: population size or land-use patterns? The archaeology of Upper Mangrove Creek, Sydney Basin
terra australis 21
376
TTaabbllee AA44//4400 The Tombs (shelter), central Queensland highlands: rates of artefact accumulation and average annual growth
rates, based on data from Mulvaney and Joyce 1965: Table 5, Shelter excavation. Bracketed figures represent alternative
dates, duration and rates of artefact accumulation depending how depth/age curve is drawn. IIttaalliiccss indicates highest number
or rate; underline = period with greatest/most dramatic increase.
LEVEL DEPTH RADIOCARBON AGES D/A DATES DURATION NO. OF RATE OF ARTEFACT AVERAGE ANNUAL
(cm) YEARS BP LAB. NO. YEARS BP (YEARS) ARTEFACTS ACCUMULATION GROWTH RATE
(NO./MILLENNIUM) %
1 0.0 – 30.5 2300–2100 2200 345 157 -0.02
2 30.5– 58.5 3400±97 NPL-30 3400–2300 1100 268 224 -0.19
3A 58.5– 81.3 3600–3400 200 410 22005500 ++00..7744
(+0.33)
3B 81.3–119.4 3600±93 NPL-31 4500–3600 900 442266 473 +0.21
(4000–3600) (400) (1065) (+0.62)
4A 119.4–129.5 5000–4500 500 36 72 **(4400–4000) (400) (90)
4B 129.5–205.7 0 0 -100.00
5 205.7–213.4 9410±100 NPL-64 22
6 213.4–228.6 0

South-eastern QueenslandAt two of the sites excavated in south-eastern Queensland — Maidenwell and Gatton —Morwood (1986) considered the stone artefacts to be concentrated in their middle levels.Subsequent excavations at Platypus Rockshelter and Bushrangers Cave showed divergingtrends in the last 2000 years (Hall and Hiscock 1988a, 1988b).
MaidenwellAt Maidenwell, the lowest date, 4300±70 BP (Beta-6924), comes from a depth of 38±4cm.Morwood (1986: 92, 98) concluded that use of the site began ca 4300 BP, though extrapolationfrom a depth/age curve using 55cm as the depth of the basal spit suggests it was earlier (TableA4/41 — based on Morwood’s data [principally Table 1], and assuming a constant rate ofsediment accumulation between radiocarbon dates; dates for various levels on my depth/agecurve differ slightly from those on Morwood’s).
Morwood (1986: 95–8) described the vertical distribution of artefacts in the site asfollows: artefacts tended to be concentrated between 15cm and 30cm below the surface, orfrom about 3000 BP to 1000 BP ‘on the basis of linear extrapolation’; at about 1000 BP the‘artefact deposition rate decreased significantly’ and the use of backed artefacts may haveceased at this time. ‘Backed blades, blade scrapers and axes are not definitely present until ca2800 BP’, when there is ‘a significant increase in artefact density’ (1986: 98).
The artefact accumulation rates which I calculated show similar trends (Fig. 7.28, TableA4/41), though there are two levels which could be said to show ‘significant’ or substantialincreases: • ‘level’ 25–30cm, in which the accumulation rate increased from 60 to 172
artefacts/millennium — this is the increase in ‘artefact density’ Morwood referred toas being about 2800 BP;
• ‘level’ 15–20cm, in which there was an increase from 245 to 380 artefacts/millennium.The increase at the time the backed artefacts appeared is not as great as the later one,
which is associated with the highest artefact accumulation rate.The average annual growth rate associated with the earliest increase (0.11%) is not as
great as that associated with the later increase (+0.18%) (Table A4/41), which occurred wellafter the backed artefacts appeared.
GattonAt Gatton, the earliest radiocarbon date is 3820±120 BP (Beta-15811) from a depth of 122±4cm,immediately above bedrock (Morwood 1986: 104). Morwood (1986: 107) considered themajority of stone artefacts occurred in deposits dating between ca 3000 BP and ca 1000 BP. He(1986: 107, 117) believed that from about 3000 BP there were increases in the ‘artefactdeposition rates’, the range of stone tool types and range of knapping debris. Greater numbersof backed artefacts occur in these levels, though they are also present in the earlier deposits.
About 1000 BP, there was a decrease in the quantity and range of knapping debrisand the manufacture of backed blades and ‘barbs’ appears to have ceased. Those found insurface deposits derive from a fossicker’s trench (Morwood 1986: 107, Table 5). Morwood(1986: 106, 177) pointed out that deposition rates for faunal remains increased significantlyover the last 1000 years, with the upper levels having more than double the number ofindividuals per spit per 100 years. He (1986: 117) concluded that the increased rates of faunal,charcoal and sediment deposition in the last 1000 years indicate the site was being used moreintensively, and that there were general changes in the technology of predation rather than adecrease in activity range and occupational intensity, which the stone artefact distributionpattern suggests.
terra australis 21
377
Appendix 4

Artefact accumulation rates were calculated for this site on the basis of the radiocarbondates and data in Morwood’s Table 5 (Table A4/42, Fig. 7.29). Though Morwood (1986: 92)commented that spits averaged between 3–5cm deep, I assumed an average spit depth of 4cmfor the calculations on the basis of Table 5. This procedure will have produced rates which areslightly higher or lower than those resulting if the actual depths had been used.
The highest artefact accumulation rates are about 3000 BP. After 2900 BP the rates forindividual spits fluctuate widely but all are relatively high. The average accumulation ratesfor spits between 0cm and 32cm and between 32cm and 68cm suggest the decrease in theartefact accumulation rate in the last 1000 years was not great (i.e., from 1753 artefacts/millennium to 1576/millennium).
Average annual growth rates. The growth rates fluctuated markedly throughout theperiod of habitation (Table A4/42). Many spits have high growth rates (>0.1%). The highestgrowth rates occurred about 3500 BP and 3150 BP (+3.45% and +2.98% respectively; these arethe highest rates recorded at any of the sites reviewed, but the artefact numbers are small andthe periods of time are short).
Platypus RockshelterAt Platypus Rockshelter, occupied for some 5000 years (4540±80, Beta-3074), there was aninitial increase in the artefact accumulation rates (according to weight rather than number),followed by a decline in the upper two spits representing the last 2400 years (Hall and Hiscock1988a: 57, Table 1). There was also a decline in the abundance of freshwater mussel shell andanimal bone in the upper two spits. Hall and Hiscock (1988a: 59–60) argued, however, thattrends in edge-damage and heat-shattering throughout the sequence make it plausible that theintensity of occupation continued to increase and did not decline in the last 2400 years.
Bushrangers CaveAt Bushrangers Cave, first occupied ca 6000 years ago (5540±100, Beta-4852), density figuresdisplay a clear bimodal pattern (Hall and Hiscock 1988b: 94, Tables 1 and 3). Artefactaccumulation rates in the last 2350 years are generally higher than those of the previous 3350years (Hall and Hiscock 1988b: 94, Table 2). Highest accumulation rates are in spits 2 and 3,with a much lower figure in Spit 1. Faunal remains have a similar vertical distribution to stoneartefacts and, taken together, imply more intensive use of the shelter in the last 2500 years thanpreviously (p. 102). Hall and Hiscock commented that the sharp decline in artefact and bonedensity in spit 1 is suggestive of the decreased discard rates seen at other eastern Australiansites (p. 103).
Summary: south-east QueenslandThe trends in the artefact accumulation rates in Maidenwell, Gatton and Platypus rocksheltersand Bushrangers Cave differ markedly with the highest rates and the dramatic increasesoccurring at different times, and the timing direction of trends varying in the uppermost levelsof each site.
Highest artefact accumulation rates at Gatton were about 3300 BP, whereas atMaidenwell, Platypus and Bushrangers they were in the last 1000 years. Dramatic increases inthe artefact accumulation rate at each site occurred in different millennia — between ca 4300BP and ca 4800 BP and again between ca 1400 BP and ca 950 BP at Bushrangers; about 3100 BPat Gatton, between 2600 and 775 BP at Maidenwell, and in the last 1000 years at Platypus.Substantial decreases in the artefact accumulation rates in the final phases of occupation atBushrangers Cave and Maidenwell occurred in the last 2000 and 1000 years respectively.
What’s changing: population size or land-use patterns? The archaeology of Upper Mangrove Creek, Sydney Basin
terra australis 21
378

Average annual growth rates were calculated only for Maidenwell and Gatton.Gatton has widely fluctuating rates with both negative and positive values, with the highestvalues in the third millennium BP. Maidenwell’s highest growth rate was at the beginning ofthe first millennium BP.
TTaabbllee AA44//4411 Maidenwell, south-eastern Queensland: rates of artefact accumulation and average annual growth rates based
on data from Morwood 1986: 92–3, Table 1. B indicates levels with backed artefacts; iittaalliiccss = highest number or rate;
underline = period with greatest/most dramatic increase.
LEVEL/DEPTH RADIOCARBON AGES D/A DATES DURATION NO. OF RATE OF ARTEFACT AVERAGE ANNUAL
(cm) YEARS BP LAB. NO. YEARS BP (YEARS) ARTEFACTS ACCUMULATION GROWTH RATE
NO./MILLENNIUM %
0– 5 275–1100 175 12 B 69 -0.16
5–10 525–1275 250 23 92 -0.23
10–15 775–1525 250 41 164 -0.34
15–20 1025–1775 250 95 B 338800 ++00..1188
20–25 1210±100 SUA-1915 1600–1025 575 141 B 245 +0.06
25–30 2600–1600 1000 117722 B 172 +0.11
30–35 3650–2600 1050 63 60 +0.05
35–40 4300±70 Beta-6924 4700–3650 1050 36 34 +0.03
40–45 5750–4700 1050 26 25 +0.06
45–50 6750–5750 1000 13 13 ++00..2266
50–55 7750–6750 1000 1 1
TTaabbllee AA44//4422 Gatton, south-eastern Queensland: rates of artefact accumulation and average annual growth rates based on
data from Morwood 1986: 104–7, Table 5. B indicates levels with backed artefacts; iittaalliiccss = highest number or rate; underline
= period with greatest/most dramatic increase.
DEPTH RADIOCARBON AGES DEPTH D/A DATES DURATION NO. OF RATE OF ARTEFACT AVERAGE ANNUAL
(cm) YEARS BP LAB. NO. (cm) YEARS BP (YEARS) ARTEFACTS ACCUMULATION GROWTH RATE
NO./MILLENNIUM %
180– 100 80 197 B 2463] +0.28
320– 180 140 276 1971] +0.33
460– 320 140 175 1250] -0.06
600– 460 140 191 B 1364] +0.16
20 740– 600 140 152 1086] 1596 -0.35
880– 740 140 248 1771] +0.12
1020– 880 140 211 1507] -0.09
1090±70 Beta-5897 31±2 1172–1020 152 261 1717] +0.01
1389–1172 217 367 B 1691] +0.04
40 1606–1389 217 340 B 1567] +0.21
1823–1606 217 214 B 986] -0.25
2040–1823 217 366 B 1687] 1756 -0.18
2257–2040 217 554455 B 2512] +0.09
2474–2257 217 453 B 2088] 0.00
60 2691–2474 217 453 B 2088] +0.25
2908–2691 217 262 B 1207] -0.25
3030±90 Beta-5898 67±2 3050–2908 142 297 B 2902] -0.45
terra australis 21
379
Appendix 4

TTaabbllee AA44//4422 (Continued)
DEPTH RADIOCARBON AGES DEPTH D/A DATES DURATION NO. OF RATE OF ARTEFACT AVERAGE ANNUAL
(cm) YEARS BP LAB. NO. (cm) YEARS BP (YEARS) ARTEFACTS ACCUMULATION GROWTH RATE
NO./MILLENNIUM %
3105–3050 55 218 B 33996644] +0.61
3160–3105 55 156 B 22883366] +2.98
80 3215–3160 55 31 564] -1.44
3270–3215 55 71 1291] -0.53
3325–3270 55 95 1727] +1.07
3380–3325 55 53 B 964] +1.04
3435–3380 55 30 B 546] 1033 -0.23
100 3490–3435 55 34 618] -0.97
3545–3490 55 58 B 1055] ++33..4455
3600–3545 55 9 164] +1.07
3655–3600 55 5 91] +0.41
3710–3655 55 4 B 73] -1.25
120 3765–3710 55 8 146] -1.98
3820±120 Beta-15811 122±4 3820–3765 55 24 B 436] +2.55
3875–3820 55 6 109 -1.77
3930–3875 55 16 291
What’s changing: population size or land-use patterns? The archaeology of Upper Mangrove Creek, Sydney Basin
terra australis 21
380