A voyage to Terra Australis: human-mediated dispersal of cats
10
RESEARCH ARTICLE Open Access A voyage to Terra Australis: human-mediated dispersal of cats K. Koch 1* , D. Algar 2 , J. B. Searle 3 , M. Pfenninger 1 and K. Schwenk 1,4 Abstract Background: Cats have been transported as human commensals worldwide giving rise to many feral populations. In Australia, feral cats have caused decline and extinction of native mammals, but their time of introduction and origin is unclear. Here, we investigate hypotheses of cat arrival pre- or post-European settlement, and the potential for admixture between cats of different invasion events. We analyse the genetic structure and diversity of feral cats from six locations on mainland Australia, seven Australian islands and samples from Southeast Asia and Europe using microsatellite and mitochondrial DNA data. Results: Our results based on phylogeographic model selection are consistent with a European origin of cats in Australia. We find genetic distinctiveness of Australian mainland samples compared with Dirk Hartog Island, Flinders Island, Tasman Island and Cocos (Keeling) Island samples, and genetic similarities between some of the island populations. Historical records suggest that introduction of cats to these islands occurred at the time of European exploration and/or in connection with the pearling, whaling and sealing trades early in the 19th century. On-going influx of domestic cats into the feral cat population is apparently causing the Australian mainland populations to be genetically differentiated from those island populations, which likely are remnants of the historically introduced cat genotypes. Conclusion: A mainly European origin of feral cats in Australia, with possible secondary introductions from Asia following the initial establishment of cats in Australia is reasonable. The islands surrounding Australia may represent founding populations and are of particular interest. The results of the study provide an important timeframe for the impact of feral cats on native species in Australia. Keywords: Felis silvestris catus, Human introduction, Commensal, Feral cat, Phylogeography, Colonization history Background The deliberate or accidental translocation of species from their native habitat to new environments by humans [1, 2] may trigger substantial environmental effects [3, 4]. The consequences for native biodiversity and their eco- nomic impact have been a focus of many ecological and conservation-related studies [1, 5]. For example, approxi- mately 40 % of the species listed as threatened or endan- gered under the Endangered Species Act of the US are considered to be primarily at risk through competition with or predation by invasive species [6]. The economic costs caused by invasive species through environmental damage and losses are perceived as a major concern throughout the world [7]. Considering Australia, the focus of this study, the economic impact of 11 key vertebrate pest species has been calculated at 720 million Australian dollars per annum [8]. The introduction of invasive spe- cies, historical changes in land use and habitat trans- formation in Australia have led to the extinction of approximately 22 terrestrial vertebrate species and a critically endangered status for 43 others [9, 10]. Over the last few hundred years the number of species invasions has increased by orders of magnitude world- wide [4, 11]. This is true of Australia [8] for which two of the 22 invasive mammalian species are predators: the European red fox (Vulpes vulpes) and the domestic cat (Felis silvestris catus) [12]. Cats are the subject of this paper and as invasive domesticates may be grouped into three categories: (1) Feral cats are defined as free-living, * Correspondence: [email protected] 1 Biodiversity and Climate Research Centre (BiK-F) by Senckenberg Naturforschende Gesellschaft and Goethe-University, Senckenberganlage 25, 60325 Frankfurt am Main, Germany Full list of author information is available at the end of the article © 2015 Koch et al. Open Access This article is distributed under the terms of the Creative Commons Attribution 4.0 International License (http://creativecommons.org/licenses/by/4.0/), which permits unrestricted use, distribution, and reproduction in any medium, provided you give appropriate credit to the original author(s) and the source, provide a link to the Creative Commons license, and indicate if changes were made. The Creative Commons Public Domain Dedication waiver (http://creativecommons.org/publicdomain/zero/1.0/) applies to the data made available in this article, unless otherwise stated. Koch et al. BMC Evolutionary Biology (2015) 15:262 DOI 10.1186/s12862-015-0542-7
Transcript of A voyage to Terra Australis: human-mediated dispersal of cats

RESEARCH ARTICLE Open Access
A voyage to Terra Australis: human-mediateddispersal of catsK. Koch1*, D. Algar2, J. B. Searle3, M. Pfenninger1 and K. Schwenk1,4
Abstract
Background: Cats have been transported as human commensals worldwide giving rise to many feral populations.In Australia, feral cats have caused decline and extinction of native mammals, but their time of introduction andorigin is unclear. Here, we investigate hypotheses of cat arrival pre- or post-European settlement, and the potentialfor admixture between cats of different invasion events. We analyse the genetic structure and diversity of feral catsfrom six locations on mainland Australia, seven Australian islands and samples from Southeast Asia and Europeusing microsatellite and mitochondrial DNA data.
Results: Our results based on phylogeographic model selection are consistent with a European origin of cats inAustralia. We find genetic distinctiveness of Australian mainland samples compared with Dirk Hartog Island,Flinders Island, Tasman Island and Cocos (Keeling) Island samples, and genetic similarities between some of theisland populations. Historical records suggest that introduction of cats to these islands occurred at the time ofEuropean exploration and/or in connection with the pearling, whaling and sealing trades early in the 19th century.On-going influx of domestic cats into the feral cat population is apparently causing the Australian mainlandpopulations to be genetically differentiated from those island populations, which likely are remnants of thehistorically introduced cat genotypes.
Conclusion: A mainly European origin of feral cats in Australia, with possible secondary introductions from Asiafollowing the initial establishment of cats in Australia is reasonable. The islands surrounding Australia may representfounding populations and are of particular interest. The results of the study provide an important timeframe for theimpact of feral cats on native species in Australia.
Keywords: Felis silvestris catus, Human introduction, Commensal, Feral cat, Phylogeography, Colonization history
BackgroundThe deliberate or accidental translocation of speciesfrom their native habitat to new environments by humans[1, 2] may trigger substantial environmental effects [3, 4].The consequences for native biodiversity and their eco-nomic impact have been a focus of many ecological andconservation-related studies [1, 5]. For example, approxi-mately 40 % of the species listed as threatened or endan-gered under the Endangered Species Act of the US areconsidered to be primarily at risk through competitionwith or predation by invasive species [6]. The economiccosts caused by invasive species through environmental
damage and losses are perceived as a major concernthroughout the world [7]. Considering Australia, the focusof this study, the economic impact of 11 key vertebratepest species has been calculated at 720 million Australiandollars per annum [8]. The introduction of invasive spe-cies, historical changes in land use and habitat trans-formation in Australia have led to the extinction ofapproximately 22 terrestrial vertebrate species and acritically endangered status for 43 others [9, 10].Over the last few hundred years the number of species
invasions has increased by orders of magnitude world-wide [4, 11]. This is true of Australia [8] for which twoof the 22 invasive mammalian species are predators: theEuropean red fox (Vulpes vulpes) and the domestic cat(Felis silvestris catus) [12]. Cats are the subject of thispaper and as invasive domesticates may be grouped intothree categories: (1) Feral cats are defined as free-living,
* Correspondence: [email protected] and Climate Research Centre (BiK-F) by SenckenbergNaturforschende Gesellschaft and Goethe-University, Senckenberganlage 25,60325 Frankfurt am Main, GermanyFull list of author information is available at the end of the article
© 2015 Koch et al. Open Access This article is distributed under the terms of the Creative Commons Attribution 4.0International License (http://creativecommons.org/licenses/by/4.0/), which permits unrestricted use, distribution, andreproduction in any medium, provided you give appropriate credit to the original author(s) and the source, provide a link tothe Creative Commons license, and indicate if changes were made. The Creative Commons Public Domain Dedication waiver(http://creativecommons.org/publicdomain/zero/1.0/) applies to the data made available in this article, unless otherwise stated.
Koch et al. BMC Evolutionary Biology (2015) 15:262 DOI 10.1186/s12862-015-0542-7
independent of humans and reproducing in self-perpetuatingpopulations. (2) Stray cats, rely to some extent on humanprovision (typically rubbish tips). These were originallyhousecats that went astray and now refrain from humancontact. (3) Housecats and fancy breed cats that dependalmost entirely on humans [13].Feral cats have established long-lasting and stable inva-
sive populations over large geographical areas. There isstrong evidence that cats have a detrimental impact onnative wildlife, driving the declines of bird, mammal andreptile species [14, 15]. Attempts to reintroduce threat-ened species in the arid zone of Australia have often failedbecause of extensive predation by feral cats [16, 17].Although feral cats do not depend on humans, they
derive from cats that did; and the genetic equivalency isinformative. Therefore, the current populations of catsmay, through genetic analysis [18], allow inferences aboutthe mostly maritime introduction history and routes. Catswere likely domesticated around 11,000 years ago in theNear East, perhaps first associating with early humansettlements because the presence of rodent pests providedprey opportunities, and becoming a companion animalthereafter [19, 20]. Once domesticated, cats would havebeen moved around by humans. Especially since 1800,domestic cats have actively been transported on sailingvessels of explorers, sealers, whalers and colonists eitherfor controlling rodents or as pets - first on board and laterin new settlements [13, 21] leading to the global distribu-tion of cats covering most continents and even remoteislands [19, 21, 22]. Feral cats can thus derive from thisdeliberate transport, or from cats that were transportedaccidentally - which may have happened quite frequentlywith large ships.The origin and sequence of invasions of cats into
Australia is unresolved [13, 23–25]. It would be reason-able to suggest that cats may be a relatively recent intro-duction with European explorers and settlers in the late18th century [13, 23]. Another alternative assumes catarrival to Australia prior to European settlement from(i) shipwrecks in Western Australia around 1600, (ii) orwith Malaysian trepangers from about 1650 in northernAustralia, (iii) or even earlier with the introduction ofthe dingo (Canis lupus dingo) around 4500 years ago(which, of course, goes against the normal assumptionof arrival of cats in Australia within the last few hundredyears) [23, 25–28].Admixture of putative cat source populations is almost
certain to have been of importance. Even if cats were firstintroduced from Asia, it is likely that there has been in-terbreeding with cats from secondary multiple introduc-tions at various occasions by European settlers [23] andcontinuously since then through stray housecats frommixed geographic origin (Australian Social Trends, 1995,Australian Bureau of Statistics). In order to unravel the
evolutionary history and dispersal patterns of Australianferal cats, we applied a phylogeographic approach cover-ing the Australian mainland and offshore islands. Theoret-ical and empirical studies have shown that hybridizationand intermixing through multiple introductions is lesslikely to occur on islands than in comparable mainlandpopulations [29]. Thus, island populations may be genetic-ally representative of the original founder population.We therefore analysed samples from six mainland and
seven island locations including Australian Indian OceanTerritories (Christmas Island and Cocos (Keeling) Island;hereafter referred to as Cocos Island) as well as samplesfrom Southeast Asia and previously published data fromEurope [19]. Christmas and Cocos Islands were inhab-ited by European merchants during the time of explor-ation and settlement of Australia [30, 31]. Microsatelliteand mitochondrial DNA data were used to address thefollowing specific questions: (i) Do Australian cat popu-lations share alleles and haplotypes with European and/or Asian populations? (ii) What is the regional geneticpopulation structure and how many genetically distinctgroups exist across Australia? We discuss our findings inthe context of historical reports about the early explor-ation and settlements in the Australasian region. Wefollow a phylogeographic approach for the study ofhuman-mediated movement of commensals, domesticatesand other species closely associated with people [27].
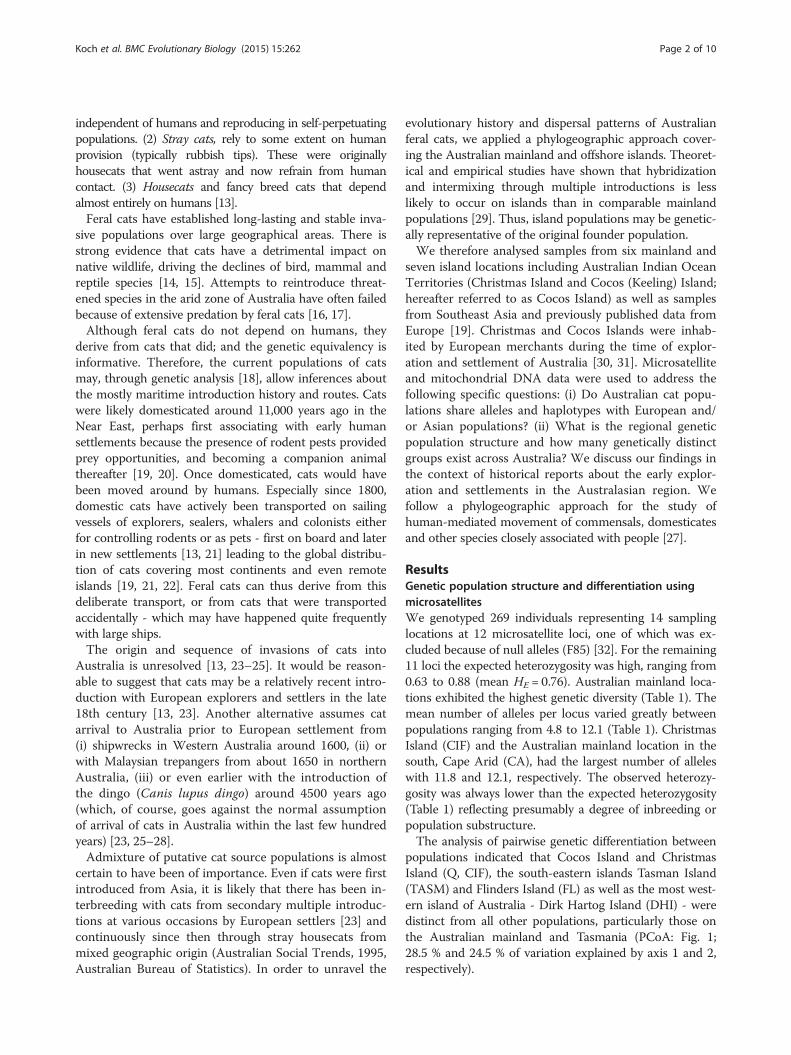
ResultsGenetic population structure and differentiation usingmicrosatellitesWe genotyped 269 individuals representing 14 samplinglocations at 12 microsatellite loci, one of which was ex-cluded because of null alleles (F85) [32]. For the remaining11 loci the expected heterozygosity was high, ranging from0.63 to 0.88 (mean HE = 0.76). Australian mainland loca-tions exhibited the highest genetic diversity (Table 1). Themean number of alleles per locus varied greatly betweenpopulations ranging from 4.8 to 12.1 (Table 1). ChristmasIsland (CIF) and the Australian mainland location in thesouth, Cape Arid (CA), had the largest number of alleleswith 11.8 and 12.1, respectively. The observed heterozy-gosity was always lower than the expected heterozygosity(Table 1) reflecting presumably a degree of inbreeding orpopulation substructure.The analysis of pairwise genetic differentiation between
populations indicated that Cocos Island and ChristmasIsland (Q, CIF), the south-eastern islands Tasman Island(TASM) and Flinders Island (FL) as well as the most west-ern island of Australia - Dirk Hartog Island (DHI) - weredistinct from all other populations, particularly those onthe Australian mainland and Tasmania (PCoA: Fig. 1;28.5 % and 24.5 % of variation explained by axis 1 and 2,respectively).
Koch et al. BMC Evolutionary Biology (2015) 15:262 Page 2 of 10

The Bayesian assignment approach gave K = 4 (Additionalfile 1: Table S1). Individual cluster assignments are shownin Fig. 2 (for reference, results for K = 2 and 3 are shownin Additional file 2: Figure S1). This analysis grouped theAustralian mainland and Tasmanian samples togetherwith the Southeast Asian samples. Cats from the Tasman,Flinders and Cocos Islands (TASM, FL, Q) had similarancestry structures, while cats from Christmas Island(CIF) and Dirk Hartog Island (DHI) were distinctive fromall other populations (Fig. 2).The major portion of nuclear genetic variation was
found within populations (AMOVA: 67.8 %; FST = 0.32;P < 0.001) with 7.5 % (FCT = 0.07; P = 0.224) amongthe four geographic regions (EU, AS, OZ, CIQ) and24.7 % (FSC = 0.26; P < 0.001) among populations withinregions.
Mitochondrial phylogeographyIn total 2603 base pairs of the mitochondrial segmentwere sequenced. Altogether we detected 63 haplotypesin the dataset of which 25 were present in the Europeanpopulations (N = 39, haplotype diversity = 0.94, nucleotidediversity = 0.0080). All other populations (N = 1 – 39)exhibited between 1 to 6 haplotypes, and had haplo-type diversities of 0 – 0.80 and nucleotide diversitiesof 0 – 0.0020.The Bayesian phylogenetic tree (Fig. 3) revealed the two
major clades described by Driscoll et al. [19] for Europeancats, clade I and IV (further details in Additional file 3:
Figure S2). Clade I only represents the European wildcatsequences from Driscoll et al. All the Australasian sampleswere of clade IV together with European sequences fromDriscoll et al. Within clade IV, subclades A and C ofDriscoll et al. can be seen. A small subclade of Australiansamples (DHI, TSW, CA) could not be matched withcertainty with Driscoll et al.’s subclades. The largest sub-clade (A) consists of a mixed group of Australian islands(DHI, TASM, FL and TAS) and mainland (PE, MK, FG,CA, KIM, TSW, P, VIC) populations and samples fromSoutheast Asia, Christmas and Cocos Island and through-out Europe. Subclade C mainly consists of samples fromAsia, Christmas Island, Tasmania, Tips South West andwestern and central Europe.Pairwise population comparisons showed low genetic
differentiation between samples from Europe and else-where (mean FST of 0.18) and between samples fromAsia and elsewhere (mean pairwise FST of 0.16; Table 2).Significant strong genetic differentiation to most otherpopulations was found for CIF (except with TAS), for FL(except with TASM) and TASM. Very low genetic differ-entiation was found between TAS, TSW, CIF and EUwith pairwise FST values ranging from 0.03 to 0.25.Comparison of potential invasion routes using the
model selection approach supported an invasion ofcats from Europe with bidirectional movement betweenAustralia, Christmas and Cocos Island and Southeast Asia(Fig. 2; model 10 in Additional file 1: Table S2, Additionalfile 4: Figure S3: LnL of -851.35 and AIC of 1724.70).
Table 1 Microsatellite statistics of Australian and Southeast Asian populations
Group Population (abbreviation) N NA HO HE FIS PA PA/N
Territorial Islands Christmas Island (CIF) 79 11.8 0.63 0.74 0.11 18 0.22
Cocos (Keeling) Island (Q) 42 7.0 0.51 0.63 0.18 6 0.14
W Australia - mainland Kimberley (KIM)a 5 - - - - - -
Cape Arid National Park (CA) 23 12.1 0.79 0.88 0.10 14 0.60
Mount Keith (MK)a 8 - - - - - -
Fitzgerald National Park (FG) 10 7.4 0.77 0.82 0.06 3 0.30
Peron (PE) 13 6.9 0.75 0.78 0.03 0 0
Tips South West (TSW) 25 9.8 0.74 0.82 0.10 6 0.24
W Australia - island Dirk Hartog Island (DHI) 40 9.6 0.72 0.75 0.03 11 0.27
SE Australia - islands Flinders Island (FL)a 3 - - - - - -
French Island (FI)a 3 - - - - - -
Tasmania (TAS) 10 4.8 0.70 0.72 0.04 3 0.30
Tasman Island (TASM)a 5 - - - - - -
Asia Malaysia (M)a 3 - - - - - -
Total 269
Statistics for microsatellite typing of cat populations in the Australian mainland, Australian islands and Southeast Asia (based on 11 loci), including populationsample size (N), mean number of alleles per locus (NA), observed (HO) and expected (HE) heterozygosity, inbreeding coefficient (FIS) and number of private allelesper population over all loci (PA)aSample size lower than 10 are not considered for population genetic parameters
Koch et al. BMC Evolutionary Biology (2015) 15:262 Page 3 of 10

DiscussionOverall, our analyses are in line with the hypothesis ofan introduction and establishment of cats in Australiafrom Britain and other Western and Central Europeanlocations as documented by Abbott [23, 24]. Abbottinferred multiple coastal introductions between 1804 -1886, rather than a spread from the earliest point ofcolonization (Sydney, 1788) [23, 24]. There was no evi-dence of a separate and stable feral cat population origin-ating solely from Asian locations (e.g. cats that might havebeen brought in by Malaysian trepangers [23, 26]). Weassume a secondary introduction of Asian cats follow-ing European colonization indicated by a grouping ofAsian locations with Australian samples (phylogenetictree, Fig. 3) and a low genetic differentiation to WesternAustralian locations (CA, FG, KIM and TSW; Table 2).There is an indication of bidirectional movement of catsbetween Australia and Asia additional to the Europeancolonization in the highest supported model (Model 10;Additional file 4: Figure S3). However, caution is neededin inferring the involvement of Asian cats in the history ofcat colonization in Australia due to the small number of
Asian samples. The second most likely introduction sce-nario (Model 5; Additional file 4: Figure S3) includesdirect introduction of European cats to Asia, while Model10 does not show this direct introduction. Thus, what wecall ‘Asian cats’ here plausibly derive from Europe as well.The likelihood of survival of a few introduced founder
individuals in a foreign environment may be low due tothe presence of native or previously introduced preda-tors (e.g. dingos, various snake species in an Australiancontext) [18] and increased genetic drift and inbreeding[29, 33]. These genetic effects have been documented ina survey of cats of the Kerguelen archipelago [29, 33–35].In contrast, moderate or even increased levels of geneticvariation of founder populations indicate invasion frommultiple sources, predisposing successful introduction andlong lasting establishment of invasive species [29, 33, 36].Multiple introductions leading to inter-mixing amongindividuals from genetically divergent populations mayresult in higher genetic variation in founder populationsthan in original populations [29]. Overall genetic diversitylevels in Australian cats was found to be similar to that ofEuropean domestic cats (H0 = 0.7, NA = 14.2 [37]).
Fig. 1 Principal Coordinates Analysis (PCoA). Principal Coordinates Analysis (PCoA) plot using microsatellite data from 13 populations of cats fromAustralia and surrounding islands
Koch et al. BMC Evolutionary Biology (2015) 15:262 Page 4 of 10

We observed that genetic differentiation among main-land Australian populations is low, in contrast to islandpopulations that were substantially differentiated amongeach other and from mainland populations. This popula-tion structure is most likely explained by relative isolationof islands compared to mainland populations. Exceptionsfrom this general pattern are explained by human activ-ities and their main pathways of trading and exploitation.Our results showed that the DHI population exhibits arelatively high genetic diversity (N = 39, haplotype diver-sity = 0.59, nucleotide diversity = 0.0018) and is geneticallydistinct except for some of the nearest mainland popula-tions (PE, FG and MK, Table 2). Between 1850 and 1920pearling was at its peak in the Shark Bay area, resulting inhousing of workers on Dirk Hartog Island and the PeronPeninsula [23, 38]. Archeological remains indicate a largeimpact of Malaysian workers operating on pearling vesselsand historical records state exchange between their homesin Malaysia and Shark Bay, Western Australia [38, 39].The first report of a cat on a pearling lugger (to preventseabirds roosting) was recorded on Dirk Hartog Island in1920 [24, 40]. Later, cats were assumed to have been
brought over during the time that the island was usedas a pastoral sheep and goat station [41]. A recentstudy showed regular gene flow between the WesternAustralian mainland and DHI during the last decade,which has now ceased [42]. Since the introduction ofcats to the island, 10 of the 13 native terrestrial mammalsonce present are now locally extinct, most probably dueto the predation by cats [16, 43, 44].The scenario selected in the model selection approach
showed dispersal of cats from Europe to Australia andsecondary introductions leading to gene flow betweenCocos and Christmas Island, Asia and Australia (Fig. 2).Cocos Island was inhabited around 1820 by Europeanmerchants accompanied by Malaysian workers [30, 45].One of the merchants built a settlement on ChristmasIsland supplying the growing industry on Cocos Island(i.e. with timber and provisions) while travelling regu-larly between Singapore and the two islands [31, 46, 47].Extensive travel between Australia, Cocos and ChristmasIsland as well as Southeast Asia [31, 46, 47] is consistentwith the results of the model selection approach for catintroductions over the past 200 years.
Fig. 2 Map of Australia, Southeast Asia and Europe with possible invasion routes. Possible invasion routes of cats shown on a map of Australiaand Southeast Asia with Europe (EU) in the top left-hand corner. Arrows indicate invasion routes with highest support from the phylogeographicmodel selection approach (model 10 grey arrows; further details in Additional file 4: Figure S3). STRUCTURE plots showing ancestry (K = 4) inferredfrom microsatellite data for mainland Australia, Australian islands and Southeast Asia. Each individual cat is represented by a single vertical line inplots for each location. Abbreviations for populations follow Table 1
Koch et al. BMC Evolutionary Biology (2015) 15:262 Page 5 of 10

Cats from Dirk Hartog Island are found in severalsubgroups of the mitochondrial phylogenetic tree, to-gether with West Australian localities (Fig. 3). Thus,these Dirk Hartog Island cats were likely of Europeanor mixed European-Asian origin deriving from popula-tions in Western Australian settlements which themselvesoriginated possibly from shipwrecks around 1600 anddefinitely with substantial European visitation since 1850[23–25, 44]. The main introduction of cats onto DirkHartog Island happened, at latest, during its main use as apearling site around 1850 and 1920. Therefore, we cansuggest multiple invasions of cats in Western Australiafrom Europe and Southeast Asia in the 19th century, pro-viding a timeframe for the impact of feral cats on nativespecies. Our greater understanding about the history ofAustralian feral cats may help to assess the relative impactof other non-native predators (namely the dingo, Canislupus dingo and European fox) on native species prior andpost European settlement [48, 49].The patterns of human colonization are mirrored in cat
genetic data from Tasmanian populations (TAS) and itsneighbouring islands, Tasman Island (TASM) and FlindersIsland (FL). Although these islands lie closely together,feral cats of TAS cluster (microsatellite and mitochondrialDNA analyses) into completely different groups fromthe cats of TASM and FL (Figs. 2 and 3). At the beginningof the 19th century cats were introduced to Tasmaniaduring European settlement together with various workers(including Asians) of numerous industries [50–54]. Thesettlement and these industries would have resulted inregular visits to Tasmania, Tasman and Flinders Islands,by ships and traders on their way to the Australian main-land, European or Asian locations. Feral cats were presenton Tasman Island following the construction of the light-house and eradicated in 2010 [55–57]. Cats on FL mighthave been present since the early 19th century with asmall settlement established by sealers, later used to exilethe remnants of the Tasmanian aboriginal human popula-tion. TASM and FL did not experience a major humaninflux from Europe or Asia (TASM now unpopulated, FLpopulation approx. 776; Census, Australian Bureau ofStatistics, 2011). Feral cats on the islands have thereforebeen more or less isolated from interbreeding with do-mestic fancy cat breeds being introduced as house pets. Incontrast, TAS has been populated by up to 495,000 people(Census, Australian Bureau of Statistics, 2011) since the
Fig. 3 Phylogenetic tree of mtDNA haplotypes. Bayesian phylogenetictree of mtDNA haplotypes of cats from Australia and Southeast Asia inthe context of previously published data (further details in Additionalfile 3: Figure S2). The nomenclature of clades and subclades followsDriscoll et al. [19]. The numbers of individuals per location are givenand the highest posterior density (HPD) represented at the node
Koch et al. BMC Evolutionary Biology (2015) 15:262 Page 6 of 10

first settlement. In 1995 the Australian Bureau of Statisticsestimated that 26.7 % of pet owners had cats as householdpets and 17.5 % of the households in TAS reported prob-lems with stray and feral cats (Australian Social Trends,1995, Australian Bureau of Statistics). Previous studieshave documented the extensive predatory impact of strayand feral cats on native fauna in suburban, rural andpastoral areas of Australia and indicated the possibilityof intermixing between stray/domestic and feral cats[13, 58]. Clearly, Tasmania must be affected in both ways.Therefore, we should take into account that large num-bers of fancy breed and domestic cats from the Australianmainland were brought onto the island intermixing withthe original feral cats. This is also supported by the lowgenetic differentiation between Tasmania and Tips SouthWest (TSW) (Table 2), since TSW represents a mixture ofstray, feral, domestic and fancy breed cats. Although allthree islands (TAS, TASM and FL) were among the firstislands on which cats were known to be introduced [24],only Flinders Island and Tasman Island are geneticallydifferentiated from all other Australian populations. Wehypothesize that these populations consist of the descen-dants of the original invading lineages during the 19thcentury. In contrast to many other Australian populations,they remained largely isolated from subsequent mixing.Thus these island populations provide valuable informa-tion to trace back the global invasion routes of cats. Inter-estingly, cats from Flinders and Tasman Islands have closeaffinity, in terms of microsatellites, with the Cocos Islands.These microsatellite characteristics may thus be represen-tative of the early colonizing cats according to best sup-ported migration model (Fig. 2).
ConclusionOur results indicate a mainly European origin of feralcats in Australia with possible secondary introductionsfrom Asia following the initial establishment of cats inAustralia. Although this reflects the best-supported modelby the model selection approach, models tested werelimited to those from a series thought reasonably likely torepresent regional history.With regards to colonization history, it should be
emphasised that cats on the islands surrounding Australiaare of particular interest and may represent foundingpopulations. Taken together with historical record, thegenetic data suggest introduction of cats to Australiamainly following European settlements, providing an im-portant timeframe for the impact of feral cats on nativespecies in Australia. Further precision may be possiblewith more detailed (genomic scale) genetic data and asearch for archaeological specimens, which themselvesmay be subject to genetic analysis.
MethodsCats were sampled across Australia, Southeast Asiaand surrounding islands (Additional file 1: Table S3);these were feral except for Tips South West (TSW) andMalaysia. TSW individuals represent house or stray catsincluding descendants of fancy breeds; they were caughtat rubbish tips. Malaysian samples were collected from amixture of feral and stray cats with only hair samplestaken. No formal ethical approvals of Malaysian author-ities were required, since sampling was fully non-invasive(gentle tugging of fur). Trapping and collection of tissuesamples from cats was conducted as described in [42].
Table 2 Genetic differentiation among populations
CA DHI FG FL KIM MK PE TAS TASM TSW CIF Q EU AS
Cape Arid (CA) * - * - * * - * * * - * -
Dirk Hartog Island (DHI) 0.37 * - * - - * * * * * * *
Fitzgerald National Park (FG) 0.12 0.09 * - - - - * - * * * -
Flinders Island (FL) 0.56 0.34 0.36 * * * - - * * * * *
Kimberley (KIM) 0 0.30 0.05 0.53 * * - * - * - * -
Mount Keith (MK) 0.47 0.06 0.07 0.71 0.39 - * * * * * * *
Peron (PE) 0.50 0.02 0.07 0.78 0.43 0 * * * * * * *
Tasmania (TAS) 0.39 0.56 0.25 0.51 0.36 0.65 0.63 * - - * - -
Tasman Island (TASM) 0.64 0.38 0.43 0 0.62 0.74 0.82 0.60 * * * * *
Tips South West (TSW) 0.24 0.26 0 0.24 0.18 0.30 0.26 0.03 0.39 * * * -
Christmas Island (CIF) 0.66 0.65 0.49 0.67 0.65 0.72 0.71 0.07 0.69 0.25 * * *
Cocos (Keeling) Island (Q) 0.17 0.63 0.51 0.88 0.27 0.79 0.84 0.63 0.89 0.53 0.76 * *
Europe (EU) 0.17 0.28 0.13 0.16 0.15 0.25 0.22 0.09 0.22 0.09 0.23 0.28 *
Malaysia/Sulawesi (AS) 0.07 0.18 0 0.27 0.03 0.19 0.18 0.13 0.32 0 0.37 0.31 0.16
Genetic differentiation among cat populations based on mtDNA data. In lower matrix pairwise FST values are given. In upper matrix asterisks (*) and dashes (-)indicate significant (P < 0.05) and non-significant differences, respectively
Koch et al. BMC Evolutionary Biology (2015) 15:262 Page 7 of 10

This research had full ethical approvals for all techniquesused by the Department of Parks and Wildlife (DPaw)Wildlife Animal Ethics Committee (AEC numbers: DECAEC 2006-06, DEC AEC 2009-35 and DPaW AEC 2012–41). All samples collected were of ownerless cats. Blood orhair samples were taken as appropriate using NucleoSaveCards (Macherey-Nagel).
DNA extraction, genotyping and sequencingDNA was isolated using the NucleoSpin Tissue Kit(Macherey-Nagel) for tissue and blood samples and theChargeSwitch Forensic DNA Purification Kit (Invitrogen)for hair samples.The molecular work followed closely our previous pro-
tocols [42]. We genotyped most samples at the same 12microsatellite loci, including a gender-identifying sequencetagged site from the Y-chromosome SRY gene [42, 59, 60].We also obtained DNA sequences of the mitochondrialND5 and ND6 gene regions for comparison with apreviously published dataset by Driscoll et al. [19]. Themitochondrial segment was sequenced using a BioradC1000 Thermocycler following the protocol of [42]. DNAsequences were determined using an ABI 3730 sequen-cer and analysed using Geneious 5.6.6 (Biomatters) soft-ware and Genemarker V1.95 (Softgenetics) software formicrosatellites.
Genetic variation and structureA total of 269 feral cat mtDNA sequences representing theAustralian mainland and island populations as well asAsian populations (hereafter referred to as the Australasiandataset) were analysed together with a subset of 42sequences from European locations published by Driscollet al. [19] (Additional file 1: GenBank: [EF587077.1-EF587153.1], Table S3B). European samples were selectedto cover a broad geographic range and match quality cri-teria. Mitochondrial genetic diversity of the Australasiandataset and European populations was based on the num-ber of haplotypes, haplotype diversity (h) and nucleotidediversity (π) using DNASP V5.1 [61]. Pairwise FST valueswere calculated using ARLEQUIN 3.5 [62].A Bayesian phylogenetic tree was reconstructed using
Beast v1.7.5 [63]. The analysis was run 5 × 10⁷ MCMCgenerations, sampling every 1000th generation. Log fileswere analysed using Tracer v1.5, to assess convergenceand to confirm combined effective sample size (ESS)>200 for each parameter. A maximum credibility treewas subsequently produced using TreeAnnotator v1.6.1.FigTree v1.4.0 was used to graphically display the tree.Microsatellite data were examined for null alleles using
Microchecker [32]. GENEPOP 4.0 software [64] was usedfor the Australasian dataset to calculate basic populationgenetic parameters: mean number of alleles per locus(NA); expected (HE) and observed (HO) heterozygosity as
well as significance values for deviations from Hardy-Weinberg equilibrium (HWE). Allele frequencies and FIScoefficients as a measure of the level of inbreeding werecalculated using FSTAT 2.9.3 [65]. Populations belowsample size 10 were excluded from population geneticanalysis (Table 1). To conduct analysis of molecular vari-ance (AMOVA) in ARLEQUIN 3.5 [62] samples weregrouped according to four main geographic regions: 1)Australian mainland, Dirk Hartog Island, Tasmania (OZ);2) Cocos Island and Christmas Island (CIQ); 3) Europe(EU); 4) Asia (AS).Fine-scale population structure was examined by deter-
mining the number of private alleles in each population. Aprincipal coordinate analysis (PCoA) was conducted on apairwise distance matrix for individuals GENALEX 6.5;[66]. Ancestry structure among the Australasian popula-tions was studied with STRUCTURE 2.3.4 [67]. Individ-uals were assigned to clusters using an unbiased Bayesianapproach under an admixture model. Burn-in and MCMCiteration settings were 50,000 and 100,000, respectively.Runs for each K were repeated 10 times. The best sup-ported number of clusters based on the ΔK statistic wasestimated using STRUCTURE Harvester v 0.6.93 [68].The software CLUMPP [69] was used to align multiplereplicates for K and the DISTRUCT application [70] wasused to display the results graphically.
Phylogeographic Model Selection (PMS)We used MIGRATE-N 3.4 [71] to choose among compet-ing dispersal hypotheses [72]. Two hundred and nine mito-chondrial sequences of 24 sampling sites were pooled intofour geographic groups (Europe, EU; Malaysia/Sulawesi,AS; Christmas/Cocos Island, CIQ; Australia, OZ). Consid-ering EU, AS and CIQ as possible sources of colonizationof OZ, we developed eleven phylogeographic hypotheses,based on historical possibilities, each of which had a cor-responding maximum likelihood migration rate matrix(Additional file 1: Table S2, Additional 4: Figure S3). Thestarting parameters were adapted from Jesse et al. [73].We ran a burn-in phase of 10,000 generations and tenshort chains with 50,000 generations each, of which every5,000th tree was recorded. Three long chains of 500,000generations followed, from which 1,000 trees were sam-pled after burn-in of 50,000 generations. The transition/transversion ratio was set to 12.8 after estimation usingDNASP V5.1. [61]. A final analysis with an unconstrainedmigration model using a likelihood-ratio-test was per-formed and Akaike Information Criterion (AIC) scoreswere obtained for each model.
Availability of supporting dataThe microsatellite data sets supporting the results ofthis article are available in the Dryad repository [Dryaddoi:10.5061/dryad.6t066 (http://dx.doi.org/10.5061/dryad.
Koch et al. BMC Evolutionary Biology (2015) 15:262 Page 8 of 10

6t066)]. All sequence data is available on GenBank, [Gen-Bank accessions: KP279467 - KP279629, http://www.ncbi.nlm.nih.gov/genbank].
Additional files
Additional file 1: Table S1. Results of the Bayesian assignmentapproach using STRUCTURE based on the cat microsatellite data.Shown are the mean posterior probabilities of K as well as the standarddeviation, log likelihood of K, second order rate of change of loglikelihood and Delta K. Preferred K value (highest Delta K) is shown inbold. Reps means number of repetitions for each K. Table S2. Resultsof the phylogeographic hypothesis model selection as applied to themitochondrial ND5 + ND6 data for movements between Europe (EU),Australia (OZ), Christmas and Cocos (Keeling) Island (CIQ) and Malaysia/Sulawesi (AS) (detailed information of phylogeographic models,Additional file 4: Figure S3). AIC values measure the fit of the model tothe data, taking different parameterisation into account. Smaller valuesindicate a better fit. The model with the best fit is shown in bold.Table S3. A. List of sample locations with abbreviations for samplelocation and region as well as number of specimens and correspondinggeographical coordinates. B. List of European mitochondrial datasetpublished by Driscoll et al. (2007) [19] with accession numbers andabbreviation for sample region. (PDF 216 kb)
Additional file 2: Figure S1. STRUCTURE bar plots showing K values(K = 2 and K = 3) below the optimal one, inferred from microsatellite datafor mainland Australia, Australian islands and Southeast Asia. In each plot,each cluster is represented by a different colour, and each individual catis represented by a vertical line divided into K coloured segments withheights proportional to genotype memberships in the clusters. Thin blacklines separate individuals from different populations. Abbreviations forpopulations follow Table 1. (PDF 552 kb)
Additional file 3: Figure S2. Phylogenetic tree of cats based onmtDNA haplotypes obtained in this paper together with those of Driscollet al. 2007, reconstructed by Bayesian inference with 95 % highestposterior density (HPD) represented at nodes. (PDF 2542 kb)
Additional file 4: Figure S3. Figures illustrating the phylogeographicmodel selection as applied to the mitochondrial ND5 + ND6 betweenEurope (EU), Australia (OZ), Christmas and Cocos (Keeling) Island (CIQ)and Malaysia/Sulawesi (AS). (PDF 1909 kb)
Competing interestsAll authors declare that they have no competing interests.
Authors’ contributionsKK, DA, KS designed the research. KK and DA carried out the samplecollection. KK performed the research. KK, KS, JBS and MP performed thestatistical analysis of the data. KK, DA, KS, MP and JBS drafted the manuscript.JBS revised the manuscript critically for important intellectual content. Allauthors read and approved the final manuscript.
AcknowledgementsWe would like to especially thank N. Hamilton, M. Onus for field assistance inAustralia as well as numerous staff of WA Department of Parks and Wildlife.We are grateful to Sue Robinson for collection of samples from Tasmania,Tasman Island and Flinders Island and Yvonne Bohr, Stefan Merker,Alexander and Lisa Engl for collection of samples from Southeast Asia. Weare grateful for the very helpful comments of the anonymous reviewers. Weacknowledge financial support by the Biodiversity and Climate ResearchCentre Frankfurt am Main (BiK-F; ‘LOEWE–Landes-Offensive zur EntwicklungWissenschaftlich-ökonomischer Exzellenz’ of Hesse’s Ministry of HigherEducation, Research and the Arts).
Author details1Biodiversity and Climate Research Centre (BiK-F) by SenckenbergNaturforschende Gesellschaft and Goethe-University, Senckenberganlage 25,60325 Frankfurt am Main, Germany. 2Department of Parks and Wildlife,Science and Conservation Division, P.O. Box 51, Wanneroo 6065, WA,
Australia. 3Department of Ecology and Evolutionary Biology, CornellUniversity, Corson Hall, Cornell University, Ithaca, NY 14853-2701, USA.4Molecular Ecology, Institute for Environmental Sciences, UniversitätKoblenz-Landau, 76829 Landau in der Pfalz, Germany.
Received: 8 September 2015 Accepted: 12 November 2015
References1. Elton C. The ecology and invasions by animals and plants. London, UK:
Methuen; 1958.2. Vitousek PM, Loope LL, Andersen H. Island: biological diversity and
ecosystem function. Berlin, Germany: Springer; 1995.3. Williamson M. Biological Invasions. London: Chapman & Hall; 1996.4. Mack RN, Simberloff D, Lonsdale WM, Evans H, Clout M, Bazzaz FA. Biotic
invasions: causes, epidemiology, global consequences, and control. EcolAppl. 2000;10(3):689–710. doi:10.2307/2641039.
5. Vitousek PM, D’Antonio CM, Loope LL, Westbrooks R. Biological invasions asglobal environmental change. Am Sci. 1996;84(5):468–78.
6. Wilcove DS, Rothstein D, Dubow J, Phillips A, Losos E. Quantifying threatsto imperiled species in the United States. Bioscience. 1998;48(8):607–15.doi:10.2307/1313420.
7. Pimentel D, Zuniga R, Morrison D. Update on the environmental andeconomic costs associated with alien-invasive species in the United States.Ecol Econ. 2005;52(3):273–88. doi:10.1016/j.ecolecon.2004.10.002.
8. The Senate Environment Report. Turning back the tide: the invasive specieschallenge: report on the regulation, control and management of invasivespecies and the Environment Protection and Biodiversity ConservationAmendment (Invasive Species) Bill 2004. In: Senate T, editor. Canberra,Australia 2004.
9. Short J, Smith A. Mammal Decline and Recovery in Australia. J Mammal.1994;75(2):288–97. doi:10.2307/1382547.
10. McKenzie NL, Burbidge AA, Baynes A, Brereton RN, Dickman CR,Gordon G, et al. Analysis of factors implicated in the recent declineof Australia’s mammal fauna. J Biogeogr. 2007;34(4):597–611.doi:10.1111/j.1365-2699.2006.01639.x.
11. di Castri F. History of biological invasions with emphasis on the Old World.In: Drake J, di Castri F, Groves R, Kruger F, Mooney HA, Rejmanek M, editors.Biological invasions: a global perspective. New York, USA: Wiley; 1989. p. 1–30.
12. Wheeler R, Priddel D. The impact of introduced predators on twothreatened prey species: A case study from western New South Wales. EcolManage Restoration. 2009;10(1):117–23.
13. Dickman C. Overview of the impacts of feral cats on Australian native fauna.University of Sydney, Australia: Australian Nature Conservation Agency; 1996.
14. Medina FM, Bonnaud E, Vidal E, Tershy BR, Zavaleta ES, Donlan CJ, et al. Aglobal review of the impacts of invasive cats on island endangered vertebrates.Glob Chang Biol. 2011;17(11):3503–10. doi:10.1111/j.1365-2486.2011.02464.x.
15. Frank ASK, Johnson CN, Potts JM, Fisher A, Lawes MJ, Woinarski JCZ et al.Experimental evidence that feral cats cause local extirpation of smallmammals in Australia’s tropical savannas. J Appl Ecol. 2014:n/a-n/a.doi:10.1111/1365-2664.12323.
16. Burbidge AA, Manly BFJ. Mammal extinctions on Australian islands:causes and conservation implications. J Biogeogr. 2002;29(4):465–73.doi:10.1046/j.1365-2699.2002.00699.x.
17. Christensen PES, Burrows ND. Project desert dreaming: the reintroduction ofmammals to the Gibson Desert. In: Serena M, editor. Reintroduction Biologyof Australian and New Zealand Fauna. Chipping Norton, Australia: SurreyBeatty & Sons; 1995. p. 199–208.
18. Jones EP, Eager HM, Gabriel SI, Jóhannesdóttir F, Searle JB. Genetictracking of mice and other bioproxies to infer human history. TrendsGenet. 2013;29(5):298–308. doi:10.1016/j.tig.2012.11.011.
19. Driscoll CA, Menotti-Raymond M, Roca AL, Hupe K, Johnson WE, Geffen E, et al.The Near Eastern origin of cat domestication. Science. 2007;317(5837):519–23.doi:10.1126/science.1139518.
20. Driscoll CA, Macdonald DW, O’Brien SJ. From wild animals to domesticpets, an evolutionary view of domestication. Proc Natl Acad Sci U S A.2009;106:9971–8. doi:10.1073/pnas.0901586106.
21. Courchamp F, Chapuis JL, Pascal M. Mammal invaders on islands:impact, control and control impact. Biol Rev. 2003;78(3):347–83.doi:10.1017/s1464793102006061.
Koch et al. BMC Evolutionary Biology (2015) 15:262 Page 9 of 10
22. Bonnaud E, Medina FM, Vidal E, Nogales M, Tershy B, Zavaleta E, et al. Thediet of feral cats on islands: a review and a call for more studies. BiolInvasions. 2011;13(3):581–603. doi:10.1007/s10530-010-9851-3.
23. Abbott I. Origin and spread of the cat, Felis catus, on mainland Australia,with a discussion of the magnitude of its early impact on native fauna.Wildl Res. 2002;29(1):51–74.
24. Abbott I. The spread of the cat, Felis catus, in Australia: re-examination ofthe current conceptual model with additional information. Conserv SciWestern Aust. 2008;7(1):1–17.
25. Burbidge AA, Johnson KA, Fuller PJ, Southgate RI. Aboriginal knowledge of themammals of the central deserts of Australia. Aust Wildlife Res. 1988;15:9–39.
26. Macknight CC. The Voyage to Marege: Macassan Trepangers in NorthernAustralia. Melbourne, Australia: Melbourne University Press; 1976.
27. Oskarsson MCR, Klutsch CFC, Boonyaprakob U, Wilton A, Tanabe Y, SavolainenP. Mitochondrial DNA data indicate an introduction through mainlandsoutheast Asia for Australian dingoes and Polynesian domestic dogs. P RoySoc B-Biol Sci. 2012;279(1730):967–74. doi:10.1098/rspb.2011.1395.
28. Robert WCH. The explorations, 1669–1697, of Australia by Willem deVlamingh. Amsterdam, The Netherlands: Phyilo Press; 1972.
29. Allendorf FW, Lundquist LL. Introduction: population biology, evolution, andcontrol of invasive species. Conserv Biol. 2003;17(1):24–30.
30. Molloy G. Some account of the Keeling Isles Gleanings in Science. Calcutta,India: Baptist Mission Press; 1830. p. 293–301.
31. Dampier W. A new voyage round the world. London, UK: Argonaut Press;1927.
32. Van Oosterhout C, Hutchinson WF, Wills DPM, Shipley P. MICRO-CHECKER:software for identifying and correcting genotyping errors in microsatellitedata. Mol Ecol Notes. 2004;4(3):535–8. doi:10.1111/j.1471-8286.2004.00684.x.
33. Dlugosch KM, Parker IM. Founding events in species invasions: geneticvariation, adaptive evolution, and the role of multiple introductions. MolEcol. 2008;17(1):431–49. doi:10.1111/j.1365-294X.2007.03538.x.
34. Barrett SCH, Kohn JR. Genetic and evolutionary consequences of smallpopulation-size in plants - implications for conservation. In: Falk DA,Holsinger KE, editors. Genetics and Conservation of Rare Plants: Biologyand Genetics. Oxford University Press; 1991. p. 3-30.
35. Pontier D, Say L, Devillard S, Bonhomme F. Genetic structure of the feral cat(Felis catus L.) introduced 50 years ago to a sub-Antarctic Island. Polar Biol.2005;28(4):268–75.
36. Frankham R. Invasion biology - resolving the genetic paradox in invasivespecies. Heredity. 2005;94(4):385. doi:10.1038/sj.hdy.6800634.
37. Pierpaoli M, Biro ZS, Herrmann M, Hupe K, Fernandes M, Ragni B, et al.Genetic distinction of wildcat (Felis silvestris) populations in Europe, andhybridization with domestic cats in Hungary. Mol Ecol. 2003;12(10):2585–98.
38. Green J. Cape Inscription National Heritage Listing Archaeological Survey.Department of Maritime Archaeology, Western Australian Museum:Australian National Centre of Excellence for Maritime Archaeology 2007.Report No.: 10876465360.
39. Edwards H. Shark Bay through four centuries 1616 to 2000: A WorldHeritage area. Shark Bay, Australia: Shark Bay Shire; 1999.
40. Whitlock F. Notes on Dirk Hartog Island and Peron Peninsula, Shark Bay.Western Aus Emu. 1921;20:168–86.
41. Burbidge AA, George AS. The flora and fauna of Dirk Hartog Island, WesternAustralia. J Royal Soc Western Aus. 1977;60(3):71–90.
42. Koch K, Algar D, Schwenk K. Population structure and management ofinvasive cats on an Australian island. J Wildlife Manage. 2014;78(6):968–75.doi:10.1002/jwmg.739.
43. Baynes A. The mammals of Shark Bay, Western Australia. In: Berry PF,Bradshaw SD, Wilson BR, editors. Research in Shark Bay - Report of theFrance-Australe Bicentenary Expedition Commitee. Perth, Australia: WesternAustralian Museum; 1990. p. 313–25.
44. Burbidge AA. Our largest island. In: Department of Environment andConservation, editor. Perth, Western Australia: Landscope; 2001. p. 16–22.
45. Slocum CJ. Chapter 16. Sailing alone around the world. New York: TheCentury Co; 1901. p. 210–5.
46. Keynes RD. Charles Darwin’s Beagle Diary. In: Darwin C, editor. CharlesDarwin’s Beagle Diary. Cambridge, UK: Cambridge University Press; 2001.p. 413–8.
47. Burstyn HL. Science pays off: Sir John Murray and the Christmas Islandphosphate industry 1886-1914. Soc Stud Sci. 1975;5(34):5–34.
48. Corbett LK. The dingo in Australia and Asia. Marleston, South Australia: J.B.Books; 2001.
49. Saunders GR, Gentle MN, Dickman CR. The impacts and managementof foxes Vulpes vulpes in Australia. Mammal Rev. 2010;40(3):181–211.doi:10.1111/j.1365-2907.2010.00159.x.
50. Nash M. The Bay Whalers: Tasmania’s shore-based whaling industry.Canberra: Navarine Publishing; 2003.
51. Murray L. An account of the whaling and sealing industries of Van Diemen’sLand to 1850. Hobart, Australia: University of Tasmania; 1927.
52. Plomley N, Henley K. The sealers of Bass Strait and the Cape Barren Islandcommunity. Hobart; Australia: Tasmanian Historical Research Association;1990.
53. Lawrence S. Whalers and free man: Life on Tasmania’s colonial whalingstations. North Melbourne, Australia: Australia Scholarly Publishing; 2006.
54. Vivian H. Tasmania’s Chinese heritage: an historical record of Chinese sitesin north east Tasmania. Tasmania: Australian Heritage Commission, QueenVictoria Museum and Art Gallery; 1985.
55. Ibbotson J. Lighthouses of Australia - images from the end of an era.Victoria, Australia: Australian Lighthouse Traders; 2000.
56. Bryant SS, Shaw J. Tasman island: 2005 flora and fauna survey. HamishSaunders Memorial Trust, New Zealand and Biodiversity ConservationBranch, DPIW. Hobart: Nature Conservation; 2006.
57. Campbell KJ, Harper G, Algar D, Hanson CC, Keitt BS, Robinson S. Review offeral cat eradications on islands. In: Veitch CR, Clout MN, Towns DR, editors.Island invasives: eradication and management. Gland, Switzerland: IUCN;2011. p. 37–46.
58. Martin GR, Twigg LE, Robinson DJ. Comparison of the diet of feral cats fromrural and pastoral Western Australia. Wildl Res. 1996;23(4):475–84.
59. Menotti-Raymond MA, David VA, Wachter LL, Butler JM, O’Brien SJ. AnSTIR forensic typing system for genetic individualization of domestic cat(Felis catus) samples. J Forensic Sci. 2005;50(5):1061–70.
60. Butler JM, David VA, O’Brien SJ, Menotti-Raymond M. The MeowPlex: a newDNA test using tetranucleotide STR markers for the domestic cat. Profiles inDNA, Promega Corporation. 2002;5(2):7–10.
61. Librado P, Rozas J. DnaSP v5: a software for comprehensive analysisof DNA polymorphism data. Bioinformatics. 2009;25(11):1451–2.doi:10.1093/bioinformatics/btp187.
62. Excoffier L, Lischer HEL. Arlequin suite ver 3.5: a new series of programs toperform population genetics analyses under Linux and Windows. Mol EcolResour. 2010;10(3):564–7. doi:10.1111/j.1755-0998.2010.02847.x.
63. Drummond AJ, Suchard MA, Xie D, Rambaut A. Bayesian phylogeneticswith BEAUti and the BEAST 1.7. Mol Biol Evol. 2012;29(8):1969–73.doi:10.1093/molbev/mss075.
64. Rousset F. GENEPOP ' 007: a complete re-implementation of the GENEPOPsoftware for Windows and Linux. Mol Ecol Resour. 2008;8(1):103–6.doi:10.1111/j.1471-8286.2007.01931.x.
65. Goudet J. FSTAT (Version 1.2): A computer program to calculate F-statistics.J Heredity. 1995;86(6):485–6.
66. Peakall R, Smouse PE. GenAlEx 6.5: Genetic Analysis in Excel. Populationgenetic software for teaching and research-an update. Bioinformatics.2012;28(19):2537–9. doi:10.1093/bioinformatics/bts460.
67. Pritchard JK, Stephens M, Donnelly P. Inference of population structureusing multilocus genotype data. Genetics. 2000;155(2):945–59.
68. Earl DA. vonHoldt BM. STRUCTURE HARVESTER: a website and program forvisualizing STRUCTURE output and implementing the Evanno method.Conserv Gen Res. 2012;4(2):359–61. doi:10.1007/s12686-011-9548-7.
69. Jakobsson M, Rosenberg NA. CLUMPP: a cluster matching andpermutation program for dealing with label switching and multimodalityin analysis of population structure. Bioinformatics. 2007;23(14):1801–6.doi:10.1093/bioinformatics/btm233.
70. Rosenberg NA. DISTRUCT: a program for the graphical display of populationstructure. Mol Ecol Notes. 2004;4(1):137–8. doi:10.1046/j.1471-8286.2003.00566.x.
71. Beerli P, Palczewski M. Unified Framework to Evaluate Panmixia and MigrationDirection Among Multiple Sampling Locations. Genet. 2010;185(1):313–U463.
72. Pfenninger M, Posada D. Phylogeographic history of the land snailCandidula unifasciata (Helicellinae, Stylommatophora): Fragmentation,corridor migration, and secondary contact. Evolution. 2002;56(9):1776–88.doi:10.1554/0014-3820(2002)056[1776:Photls]2.0.Co;2.
73. Jesse R, Vela E, Pfenninger M. Phylogeography of a land snail suggeststrans-mediterranean Neolithic transport. PLoS One. 2011;6:e20734.doi:10.1371/journal.pone.0020734.
Koch et al. BMC Evolutionary Biology (2015) 15:262 Page 10 of 10